contents · deep historic roots are the foundation for a banyan tree’s ... factors, particularly...
TRANSCRIPT


CONTENTS
“We secured AED 5.935 billion worth of new projects in MENA, Asia and Europe and our Project backlog reached an all-time high of AED 14.5 billion, which is a growth of nearly 20% compared to FY 2013 and the highest we have achieved as a group in our history.”
Deep historic roots are the foundation for a Banyan tree’s existence, and its strength its future. DSI’s rich history of delivering complex projects globally since 1881 nurtures its growth and sustains its performance.

COMPANY PROFILE
Chairman Message .............................................................................................................002CEO Message ........................................................................................................................004Board of Directors ...............................................................................................................006Facts and Figures .................................................................................................................008Risk Management and Corporate Governance ......................................................010Corporate Social Responsibility ......................................................................................014Our People .............................................................................................................................016Financial Review ...................................................................................................................018
FINANCIALS
Director’s Report ..................................................................................................................022Auditor’s Report ...................................................................................................................023Financial Statements ..........................................................................................................024

002 Annual Report
Dear Shareholders,
2014 was a year of considerable achievements and significant challenges for both our business and our region. We maintained our unwavering focus on key strategic priorities, and continued to build on nearly 50 years’ of engineering legacy in our region. Our proven experience, the trust reposed by our clients and partners, and our seamless track record of project delivery sustained our leadership position in our key businesses across MENA, Europe and South Asia.
Despite some significant challenges we remained profitable and gained market share, and our fiscal results, when viewed in the context of the rapid economic volatility in our region, affirms the sustainability of our business model.
The global economy continued its sluggish recovery from the global recession of the mid 2000s and an IMF report estimates worldwide economic growth to touch 3.5% in 2015. The emerging BRICS (Brazil, Russia, India, China, South Africa) outperformed the developed markets in terms of GDP growth, particularly China. However, the recent oil price crash has triggered a slowdown in the Russian and Chinese economies, which will lower the growth of the emerging markets to around 4.3% this year.
Closer to home, the regional economies in 2014 achieved steady progress and particularly the GCC which achieved a 4.5% GDP growth overall. However, during the second half of the year the region experienced an unforeseen setback as oil prices plunged to a historic low, creating pressure on markets that derive a large income from oil related businesses. The GCC governments are expected to continue their current fiscal
stimulus programs and accelerate the adoption of crucial economic reforms.
The volatility in oil prices in turn reflected on the performance of the regional industry, which impacted some of our key operating segments. We maintain our optimism and faith in the ability of our key markets in the GCC to achieve sustainable growth this year. From a macro perspective, economic growth within the GCC is expected to hover around the 3 to 3.5% mark in 2015, as per an EFG Hermes GCC Economic report. On a promising note, a MEED Projects study has shown that since 2006, GCC contract awards have hovered in the range of AED 367 billion to AED 551 billion irrespective of the trends in oil prices.
In 2014, AED 248.3 billion worth of projects were completed in the gulf region, according to a Venture ME study. The value of awarded contracts across the GCC stood at AED 312 billion mainly due to a steep decline in markets like KSA which registered a fall of 25% in total project awards, when compared to 2013. Currently, development schemes worth AED 265 billion remain to be completed while AED 378 billion worth of projects are expected to be awarded this year which represents a growth of 21% when compared to 2014.
Taking a holistic view of the region’s long term potential, we are positive about the prospects of our industry, as the big regional economies like KSA, Qatar and the UAE pursue their strategy of economic diversification and non-oil infrastructure development, especially with the Expo 2020 and FIFA World cup looming on the horizon.
In the short term, the prognosis for our markets remains challenging until the oil prices undergo a revision and the fiscal climate improves. The reality of this economic
CHAIRMAN’S MESSAGE
“ We maintained our unwavering focus on key strategic priorities, and continued to build on nearly 50 years’ of engineering legacy in our region.”
01
Annual Report002

003Annual Report
backdrop has encouraged us to improve our core efficiencies and focus on overall cost reduction. We have improved the utilization of modern technologies in our processes, and increased the leverage of our regional footprint through the centralization of our back offices.
From a corporate perspective, 2015 will remain a challenging year. We remain optimistic about sustaining our historic profitability, but do expect to face hurdles in liquidity. We will be prudent in the management of the increase in our projects’ backlog and ensure that it allows for a sustainable growth that is manageable and fruitful.
As a company, we will continue to offer unmatched value to our clients on the strength of our sound fundamentals in core businesses. We will continue on our path of pursuing growth in high margin oriented sectors, particularly in the MEP, water and power sectors where a supply capacity crunch looms on the horizon with the pressures brought on by the rise in regional population.
Majid Al Ghurair, ChairmanDrake & Scull International (DSI) PJSC
The Oil and Gas business too is poised to experience a substantial boom as a result of the anticipated large investments in the hydrocarbon sector, especially in downstream projects, with around AED 477 billion worth of oil and gas projects in the pipeline. Looking at the rail sector, the recent announcement of the two year delay in the launch of the GCC rail has tempered industry expectations. However, there are major projects on the anvil, like the Riyadh and Makkah metros, Saudi Railway Company project, Haramain high speed rail, the Saudi Landbridge project, Etihad Rail, GCC Rail and Doha Metro, which present a tremendous opportunity for our Rail business to achieve substantial growth in 2015.
We have earmarked a strong focus on improving our client service and relations, as well as increasing our investment and empowering our high margin businesses to drive sustainable and long term growth.
The fundamental pillars of our success remain our skilled, experienced, talented, motivated and dedicated workforce who continue to harness their diverse synergies and today proudly span over 30,700 number of employees, hailing from over 50 nationalities.
I also take this opportunity to thank our shareholders for their continued support of Drake & Scull and our businesses. Since our historic listing on the Dubai Financial Market, we have worked on your behalf to build and lead a company that capitalizes on opportunities to grow. A company that exhibits the financial strength to weather both good and challenging market conditions and a business that operates with only the highest standards of integrity and excellence. That was the vision of our founders back in 1881 and that is the vision that we continue to pursue 134 years later across the world.
003

004 Annual Report
02Dear Shareholders,
2014 was an eventful year in DSI’s 134 years’ history. It was a year in which we continued to build on our century old legacy of achieving engineering excellence while ensuring our continued growth as a business. We faced major operational challenges but the strength of our solid corporate foundation and business model, the unique vertical Integration of our core business streams, and valuable projects experience across MENA, Europe and Asia, helped us emerge from one of the most volatile market environment in decades.
Despite an unpredictable and challenging market environment and the increasing pressure on our profitability margins, DSI delivered a profitable year, increasing our market share and significantly expanding our project backlog.
We reported Flat revenues compared to 2013. Our operating margins across the General Contracting segment were under pressure and affected the overall performance of the group.
We have noticed the emergence of a cautious approach in the real estate sector with an increasing emphasis on cost efficiency, which has resulted in an increase in the duration of the project development cycle in all our key markets. This increase in turn has led to delays in handover of some project as well as our collections which impacted our revenue generation across our main markets in the GCC.
CHIEF EXECUTIVE’S MESSAGE
We registered a strong start in the first half of the year, securing multiple project awards in our region. In the second half of the year, we experienced significant deferments in our operations due to external economic factors, particularly in bigger markets like KSA, which impacted our overall operating margins and profitability for the fiscal year.
Managing our exposure due to the large size of our order book in our key markets required a lot of resources and efforts to minimize the impact of challenges in our receivables, which affected working capital base and reserves. We also had to take in to account certain provisions in our major markets - the UAE and KSA, which too contributed to our bottom line metric in 2014. On a more positive note, we secured AED 5.935 billion worth of new projects in MENA, Asia and Europe and our Project backlog reached an all-time high of AED 14.5 billion, which is a growth of nearly 20% compared to FY 2013 and the highest we have achieved as a group in our history.
The Engineering business continued to enjoy strong growth in key markets, winning nearly AED 2 billion worth of projects, spread evenly across our core markets in MENA and Asia. Drake & Scull Engineering is well equipped and poised to take advantage of the rapid development expected in the GCC, as the preparations for the Expo 2020, Qatar World Cup continue to gather momentum. Our General contracting business continued to be a significant contributor to our overall performance and was a considerable factor in our projects backlog growth, particularly in our biggest market KSA. The general
Annual Report
“ Despite an unpredictable and challenging market environment, DSI delivered a profitable year, increasing our market share and significantly expanding our project backlog.”

005Annual Report
Looking ahead at our direction for 2015, we are pleased to have achieved a market leader position in our regional industry. We are confident that the strength of our historical performance globally will sustain our future growth and allow us to be more selective in our project bidding, focusing on key projects which have a potential to help us realize higher margins. We will also concentrate on complete integration of our project delivery operations and focus on reducing our overall costs, improving our Return on Capital and our current liquidity levels.
We will be judicious in overseeing the development of our projects’ backlog to manageable levels.
DSI’s biggest growth drivers in 2014 were the growing markets of KSA and the UAE, which we anticipate to remain our priority markets in 2015. We also hope to see an upswing in Qatar’s real estate as the World Cup preparations gather momentum, while we anticipate Kuwait to continue its current levels of investment and development of infrastructure.
Taking a broader perspective of the greater MENA region, we also foresee growth from our Rail and Engineering businesses, particularly within the GCC. The Oil and Gas business will be empowered to expand its services portfolio to gain a foothold in the vital GCC market. Drake & Scull Rail has entered into strategic partnerships with leading Rail engineering experts from around the world and we are optimistic about our prospects of securing rail projects in the GCC market in 2015.
We retain our sense of assurance and entrepreneurial spirit and are confident about delivering improved profitability in 2015.
We have an ambitious but achievable plan that I believe will position us to return to our historic role as an above-market performer that creates long-term stakeholder value.
I thank every member of the global DSI family for their efforts and sincerity which has been the foundation of Drake & Scull’s success story across countless generations. I thank our valued investors and shareholders for the faith and support you’ve invested in our company and we hope to continue to exceed your expectations and affirm your trust in Drake & Scull.
contracting business experienced a period of fundamental consolidation and will remain a key component of our regional growth strategy this year.
Drake & Scull Rail picked up its first project win at the Dubai Airport, and delivered MEP works on the Airport Passenger Movement Rail successfully. Our Oil & Gas business continued to grow from strength to strength, handing over their first projects in Egypt and Iraq while also picking up the prestigious AED 2 billion Tahrir Petrochemicals complex project win.
Our European subsidiary Passavant Energy and Environment successfully implemented an evolution of its business, with a greater focus on its unique, environment friendly technologies. The company also shifted its headquarters to the strategically advantageous Frankfurt which gives it the capability to cover Europe, MENA and Asia effectively.
Khaldoun Tabari, Vice Chairman and CEODrake & Scull International (DSI) PJSC
005

006 Annual Report
BOARD OF DIRECTORS03
MAJID SAIFAL GHURAIRCHAIRMAN
Mr. Majid Saif Al Ghurair is the Chairman of Drake & Scull International PJSC. Mr. Al Ghurair holds the title of CEO of Al Ghurair Private Company as well as Managing Director of Gulf Extrusions Co. and Arabian Can Industry and is the President of Burjuman Centre LLC and Reef Mall. He was also a key member in the formation of the Middle East Council of Shopping Centres and currently holds the position of Chairman of the Council, as well as of the Dubai Shopping Malls Group.
KHALDOUNTABARI
VICE CHAIRMAN AND CEO
Mr. Khaldoun Rashid Tabari is the Vice Chairman and CEO of Drake & Scull International ( DSI ) PJSC. Mr. Tabari also serves as a board member for DEPA, EMCOR Facilities Services Group (ME), Walltech; Cedar Mills, Jordan Fleet Leasing Company; First Qatar Real Estate and Energy Central in Bahrain.
TALAL JASSIM AL BAHARBOARD MEMBER
Mr. Talal Al-Bahar is an independent board member and a member of the Remunerations Committee of DSI PJSC. Mr. Al-Bahar has served in various positions, starting off as Chairman and Managing Director of Kuwait Invest Holding Company, Chairman of International Financial Advisors, Vice Chairman and CEO of IFA Hotels and Resorts, and is affiliated with Raimon Land PLC, United Investments Portugal Commercial Real Estate Co., Kuwait Invest Holding Company.
007Annual Report
BOARD OF DIRECTORSYUSUFAL-NOWAISBOARD MEMBER
Mr. Yusuf Al Nowais is an independent Board Member of DSI PJSC, and the Chairman of the Audit committee. He is currently the Chairman and Managing Director of Arab Development as well as the Chairman, Vice Chairman and Member of the Board of several other government and private institutions including Abu Dhabi Holding, Al Rayan Real Estate, Technical Metal Industries (TMI), Al Maabar, Rotana Hotels & Real Estate Investment Company. He is also an Honourary Member of the Al Ain Sports Club.
JAMAL SAEED SALEH AL-NUAIMIBOARD MEMBER
Mr. Jamal Saeed Saleh Al-Nuaimi is an independent board member and a member of the Audit Committee and the Chairman of the Remuneration Committee of DSI PJSC. Mr. Al-Nuaimi also serves as a board member for several other companies including the Abu Dhabi Tawteen Council, Al Jazeera Capital Sports Club and Siraj Islamic Financing.
IVOR MARKGOLDSMITH
BOARD MEMBER
Mr. Ivor Mark Goldsmith is an Independent Board Member and a member of the Audit Committee of DSI PJSC. For over 40 years, he has been an engineering construction industry professional in the UK and overseas –including in consultancy as prime contractor; in major project design and build; technology solutions; and long-term facilities management and outsourcing.
KHALAF SULTANAL-DAHERIBOARD MEMBER
Mr. Khalaf Sultan Al-Daheri is an independent board member and a member of both the Audit and Remuneration Committees of DSI PJSC. He is also Chairman of a number of financial institutions including Al Wathba Company for Central Services (AWCCS), Abu Dhabi National Islamic Finance (ADNIF), and Masraf Al Rayan.
SALEHMURADWEIJ
BOARD MEMBER
Mr. Saleh Muradweij is an Executive Board Member of DSI PJSC. With over 20 years of professional experience throughout the GCC and the Levant, Mr. Muradweij has worked in a number of managerial positions in consulting, project management, operations and contracting.

008 Annual Report
2014 20142013 2013PROFIT COMPARISON
as on 31st December 2014BACKLOG COMPARISON
as on 31st December 2014
100.7MILLION
14.5BILLION
12.04BILLION
166MILLION
04FACTS AND FIGURES
2014 2013REVENUE COMPARISON
as on 31st December 2014
4.762BILLION
4.879BILLION

009Annual Report
5,93514.5
4,762412
NOTE: Please not that all facts and figures are in UAE AED
MILLION REVENUE
MILLION PROJECT AWARDS
BILLION BACKLOG
BACKLOG COMPARISON BY BUSINESS STREAM as on 31st December 2014
BACKLOG COMPARISON BY GEOGRAPHYas on 31st December 2014
ENGINEERING GENERAL CONTRACTING OIL AND GAS WATER TREATMENT
KSA EGYPT ALGERIA DUBAI JORDAN ABU DHABI QATAR KUWAIT IRAQ OTHERS
2014
38%
35%
41%
18%5%9%6%
10%6%
8%
7%
8%11%
5%9%
3%2%2%1% 6%8%
42%
15%2%
5%5%
2013
42%
51%
2014 2013
MILLION GROSS PROFIT

010 Annual Report
RISK MANAGEMENT AND CORPORATE GOVERNANCE
RISK MANAGEMENT AND THE CONSTRUCTION INDUSTRYDSI is cognizant of the fact that construction projects can be extremely complex and fraught with uncertainty. Risk and uncertainty can potentially have damaging consequences for construction projects.
In recognition of the critical role played by adept risk analysis in the industry, our management continues to refine our risk management mechanisms as a major feature of the project management of construction projects. This helps us to deal effectively with uncertainty and unexpected events and to achieve project scheduled progress on projects.
DSI executes a pre-tender analysis process at the outset of the tendering and prequalification stage of any project. The pre-tender analysis document includes an exhaustive project information section, identifying the key challenges for each project. The document also stipulates the terms of payment as specified by the client. The client’s profile is an essential part of this document, which covers their project development history and payment track record in the industry. The pre-tender analysis also includes the profiles of the key management for each client, associated with the project. Lastly, additional information regarding each project is collated from industry sources like trade magazines and websites is included in the pre-tender analysis document. We then proceed with the tenders for project of clients deemed reputable, and pass on the documents to the Contracts division who analyze the terms and conditions thoroughly to flag any potentially problematic areas.
We create internal policies for reviewing tenders, identify legal issues that could generate risk at pre-tender stages,
identify general procurement constraints, and customize project delivery models for each project according to the schedule, quality and cost risks for each project.
According to the contract conditions of each project, we establish the procurement methodology to be pursued on each project, and undertake an exhaustive review of the technical specifications of each project, be it general drawings, bill of quantities and their descriptions.The risk management committee periodically identifies, establishes the context and classifies the risks associated with each stage of project progress, and achieves common understanding of Risk perception throughout the project management hierarchy. The risk management committee updates the Risk register for each project and communicates the findings of each analysis to the management.
Proper Risk management helps all key project participants – be it the clients, contractors or developers, consultants, and suppliers - to meet their commitments and minimize negative impacts on construction project performance in relation to cost, time and quality outcomes, which have traditionally been identified as parameters to assess the progress of projects.
Drake & Scull’s use of risk management in the early stages of a project, where major decisions such as choice of alignment and selection of construction methods can be influenced, is essential. The benefits of the risk management process include identifying and analyzing risks, and improvement of construction project management processes and effective use of resources.
We deliver a wide variety of projects across our key markets in a wide variety of sectors, spanning housing,
010
05
Annual Report

011Annual Report 011Annual Report
“ Proper Risk management helps all key project participants – be it the clients, contractors or developers, consultants, and suppliers - to meet their commitments and minimize negative impacts on construction project performance in relation to cost, time and quality outcomes.”
non-residential building, heavy, infrastructure and utilities, industrial, aviation, public transport, healthcare, education, energy, petrochemical, hospitality, offices to name a few. The varied nature of our projects and their locations present us with new facets of risk identification and management. The varying scales of our projects also add to the complexity of identifying critical risks in our projects
Professional project risk management at DSI is an iterative process. The process proves to be beneficial for us when implemented in a systematic manner throughout the lifecycle of our construction projects, right from the planning stage to post completion.
In order to effectively manage the many risks present in the contracting and construction industries, we have established well-developed vertically integrated management systems which operate on a series of timely checks throughout all stages of construction progress. These consist of a clear and transparent system of corporate governance along with a set of structures that measure and manage risk. The risks that we face are very diverse in nature and may include project risks through to area and regional risks which may manifest themselves at the business stream and corporate levels.
RISK MANAGEMENT PROCESSESRisk is inherent in all businesses. We determine if a risk is worth taking by continuous assessing and updating the risks both at the Business level and for each Project. The key is to successfully navigate these risks which come from our ability to manage risk. DSI use software applications which survey senior executive attitudes, to consolidate the results and provide us with a continuously updated snapshot of our risk management
profile. This informed measurement of our capabilities allows management to quickly assess capabilities and stress areas.
Prior to entering any market, acquiring new businesses or undertaking any new ventures, rigorous due diligence is undertaken. Risks are graded under a ‘traffic light’ system and compiled in a risk register, which allows active monitoring and management of all risks. Although we cannot eliminate all risks associated with our work, we can indeed effectively manage it and take the right measures to reduce it thus creating more opportunities for growth and successful ventures.
We utilize rigorous due diligence on any major course of action that has implications for our corporate and fiscal structure. Some of these include entry into fresh markets, organic or inorganic growth through acquisitions and founding of new companies, or exploring any new ventures as a new line of business. The associated risks are graded according to a traffic light system which makes it easy to identify risks which are then duly compiled in a risk register. The benefit of this approach is that it enables us to actively monitor and manage our risks.
The overall aim of our risk management approach is to reduce the impact of risks on our operations and record books. This empowers us to create more growth opportunities and pursue new successful ventures.
RISK MANAGEMENT COMMITTEETo enhance our risk assessment and management capabilities, we have setup a dedicated Risk Management Committee as part of the overall management structure for DSI PJSC. The Risk Management committee consists

012 Annual Report
of the Chief Commercial Officer, Chief Financial Officer, Corporate Finance Director and the Area General Manager and or Business Stream Director from each Business Stream. This committee is mandated to identify exposures, manage a Risk Control Programme and the Risk Financing Strategy. It also oversees credit, market liquidity, operational, legal and other risks, within a framework of prudent and effective business controls and processes. All business units and projects must apply risk management techniques and their compliance is monitored by the Risk Management Committee.
The metrics are based upon a standard format which shows risk exposure before application of control measures and the measurable benefits of control and mitigation measures. The measures are based upon a “five by five” matrix whereby the vertical axis measures impact and severity of risk “graded and rated 1- 5. Also the horizontal axis measures “likelihood and probability” also rated 1 – 5.
The resultant aggregate risk value generates a value which is tracked and shown on a “heat – map” as a green, yellow or red rated risk. All risks are then reviewed again after mitigation. The results are presented to our risk registrar and tested against a specially designed traffic light system for a go or no go decision on projects.
MANAGING RECEIVABLES RISKOur projects driven business model requires us to run our operations on a monthly billing cycle. Each project is governed by the standard terms and conditions of the contract signed between DSI and its clients. The contracts set the terms for the payment procedures certification
and payment cycle (subject to the normal payment days in the project’s country of location), and the specific requirements of the project.
The Financial controllers/Managers of each business closely monitor the monthly billing and certification and ensure invoices are collected as per agreed terms. Upon the identification of a delay, the business head is alerted to undertake the necessary action along with the Area General Manager to follow up with the clients on the processing of payments.
In 2014, our receivable days increased from 125 days (at the end of 2013) to 141 days at the end of 2014. This increase is mainly attributable to size of the order book in areas such as KSA which have a longer certification and collection cycle as compared to the rest of our markets. The management continues to enhance its client relationships and is upbeat about improving its receivable days performance in 2015.
Risk management is an essential practice in our business and DSI’s professional and strict corporate governance empowers the businesses to align their practices and goals to realize the overall vision of the management. DSI’s corporate governance lays emphasis on accountability and constant monitoring of its corporate actions and progress.
Primary risk management is overseen by our board, which has independent directors and three specialist committees: Executive, Remuneration and Audit.
Annual ReportAnnual ReportAnnual ReportAnnual ReportAnnual ReportAnnual ReportAnnual ReportAnnual ReportAnnual ReportAnnual ReportAnnual ReportAnnual ReportAnnual ReportAnnual ReportAnnual ReportAnnual ReportAnnual ReportAnnual Report012

013Annual Report 013Annual ReportAnnual ReportAnnual ReportAnnual ReportAnnual ReportAnnual ReportAnnual ReportAnnual ReportAnnual ReportAnnual ReportAnnual ReportAnnual ReportAnnual ReportAnnual ReportAnnual ReportAnnual ReportAnnual ReportAnnual Report
“ The committee recommends risk philosophy and tolerance for board approval, defines the company’s risk appetite and reviews risk management processes.”
CORPORATE GOVERNANCERisk management is an essential practice in our business. Having the right corporate governance enables DSI to align its interests and procedures with the vision of its executive management, enforce accountability and monitor corporate actions and progress. Primary risk management is overseen by our board consisting of independent directors and two standing committees: Audit Committee & Nomination & remuneration Committee.
The Audit Committee, comprising of independent non-executive board members, makes recommendation for the appointment of External Auditors to the board. It oversees the performance of the internal control, compliance & risk Management function The Audit Committee reviews the Internal Control system, Financial Statements & Financial reporting System and monitors the compliance with the Company’s Code of Conduct.
The Nomination & Remuneration Committee comprises of independent non-executive board members who review matters relating to executive management reward, including policy for executive directors and senior managers remuneration and their annual remuneration awards. Nomination & Remuneration Committee approves changes to incentive and benefits plans for senior managers and reviews strategic HR issues including employee retention, motivation and commitment, and succession planning for senior managers.
CONTINUOUS AUDITINGDSI has an internal control department headed by a
Director and supported by 5 staff members. Its primary role is to audit all business units based on an annual plan approved by the Board on the recommendation of the Audit Committee. The internal audit policies and standards are applied through a clearly documented internal audit system that ensures that all departments and projects are regularly audited to ensure that operations conform to company policies and procedures local laws & regulations.
DSI has established a separate Compliance function that is responsible for ensuring Company`s adherence to laws and requirements prescribed by the Emirates Securities and Commodities Authority (ESCA) and Ministerial Resolution No 518 “Governance Rules and Corporate Discipline Standards” in specific. The compliance function is responsible for preparation and submission of the Annual Corporate Governance Report to ESCA.
Compliance department is also responsible for carrying out investigations on serious breaches including but not limited to financial fraud and manages compliance with conflict of interest issues.
For the purpose of identifying any Non-Compliance to any regulations and Company policies a confidential controls mechanism has been developed that enables the employees to report any potential violations, financial & non-financial in nature, via a dedicated anonymous reporting mechanism.
Storms make the Banyan tree grow deeper roots, giving it the strength to withstand
strong winds. DSI thrives on innovative processes and devising breakthrough
solutions to help it emerge from challenging market conditions.

014 Annual Report
We are aware and conscious of the fact that a sizeable portion of our key markets lie in delicate and fragile ecosystems that are struggling to cope with the demands of the rapid growth in population, accompanied by the widespread urbanization.
We endeavor as a responsible, environmentally-friendly company to take care in our operations and activities to promote the cause of environment awareness and responsible consumption of our world’s limited resources. Our practices aim to introduce the concept of Eco construction through the adoption of modern technologies like Building Information Modeling, which allows our engineers to study the heat patterns and recommend energy efficient cooling techniques on large scale projects. Our experience with LEED Platinum projects has also given us valuable insights and an advantage in delivering projects that are ecofriendly and consume minimal electricity as well. We also encourage energy saving behavior and recycle unused electronic equipment as part of our ecological responsibility.
As part of our community outreach initiatives, we also promote the infusion of young talent into the growing engineering and construction sector. Our relationships and tie-ups by with leading universities and colleges across the region create opportunities for aspiring engineers and non-technical student to get field training in our projects and offices, via our internship and Graduate Trainee Programs. These programs encourage fresh graduates to gain valuable insights into the
construction industry by interacting with our experienced and trained workforce.
Drake & Scull PJSC also actively engages the communities in its markets through various corporate social responsibility (CSR) activities. The Drake & Scull Foundation which was established in 2011 is an imperative part of our commitment to improving the conditions of society and empowering people to achieve their dreams. The foundation supports several causes from around the world and offers both financial and moral assistance to various charities and societies in the region.
The Drake & Scull Foundation during the last several years has partnered with several institutions which include the Welfare Association to support the Mustqabali Foundation. The Mustaqbali Foundation aims to empower the children of war through education so that they have an opportunity to live a positive and fulfilling life.
This ongoing program has been supported for over three years and DSI strives to secure the future of 20 children every year by supporting their educational, psychosocial, health and career development needs until they reach adulthood. Ten school students aged between 11 to 19 years, including six girls and four boys, will complete their higher secondary education and pursue collegial education with the Foundation’s help within the next five years. The Foundation has enabled university students
CORPORATE SOCIAL RESPONSIBILITY
06
Annual Report014

015Annual Report
to fund their graduate education in diverse programmes like School education, History, Law, Arabic language, Psychological counseling, Social sciences, English, Media and Political Sciences, Media and Communication, which will allow these bright young minds, gain a strong foothold in the regional job market.
Other noteworthy charitable causes supported by the Drake & Scull Foundation in the past year include the Rashid Pediatric Centre, Emirates Association of the Blind, Kuwait Red crescent society, American University of Sharjah, and Al Noor Charity.
A key area of focus for our CSR initiatives is the safety and wellbeing of our employees, who are our most valuable asset. Over the years, we have honed and redefined our award-winning QHSE policy which is completely employee wellness oriented. Our QHSE systems have been independently certified to be compliant with ISO 9001:2008, ISO 14001:2005 and OHSAS 18001:2007. The QHSE team monitors and identifies safety and quality risks across all projects and office sites and is empowered to introduce safe and healthy work practices in our workplace.
As of December 2014 our commitment to maintaining the highest levels of quality, health, safety, environment and welfare standards enabled us to complete more than 255 million safe man – hours on our projects, which is an increase of nearly 20% compared to the 213 million safe man hours registered in 2013.
“ DSI did not register any fatality or major accidents on its sites. Our Lost Time Injury Frequency Rate (LTIFR) was also reduced sizably in 2014 finishing the year at 0.05.”
015Annual Report
Another considerable QHSE achievement in 2014 was the fact that DSI did not register any fatality or major accidents on its sites. Our Lost Time Injury Frequency Rate (LTIFR) was also reduced sizably in 2014 finishing the year at 0.05.
DSI won a series of prestigious awards for our performance, health and safety measures, sustainability and our distinctive and inspirational corporate management team. These accolades proudly stand as a testament to our unwavering commitment and focus on corporate excellence. Some of our awards are listed below:
• Drake & Scull Engineering (DSE) were conferred with the Sheikh Khalifa Excellence Award in the Silver category.
• Drake & Scull International (DSI) Abu Dhabi received an Accreditation for Health, Safety, and Environmental Management System (HSEMS) 2014 by the Abu Dhabi Municipality
• Drake & Scull International (DSI) PJSC won the Enterprise Agility Achiever Award at the 2014 Enterprise Agility Awards in the UAE.
• Drake & Scull International Qatar (DSQ) won the Qatar Enterprise Agility Award for 2014, under the category of Construction companies, for demonstrating innovation and outstanding business conduct.
The creation of a thousand Banyan trees begins with the dedication and struggle of an acorn. The pioneering
spirit and firm commitment to engineering excellence embedded in DSI’s DNA by its founders continues to
flourish 134 years later.

016 Annual Report
Since 1881, Drake & Scull’s proudest legacy has been the countless generations of DSI employees who have left an indelible mark on the engineering and construction industry across Europe, Asia, Africa, and the Middle East, with their pioneering spirit and performance driven work attitude. Today, the DSI family has grown to over 30,700 members from over 50 countries, working on projects from West Europe to South Asia.
The three values that have inspired and driven us for more 134 years have remained a permanent part of DSI’s DNA, inculcated in every employee from top to bottom in the management chain.
PEOPLEOur people are the chief driving force behind our business. We recognize the importance of investing in our people, as it means to invest in the future success of our company. We are committed to providing a highly stimulating, safe and dynamic working environment that encourages individual growth and overall development. Our carefully devised succession plan outlines corporate expectations and fosters employee improvement and advancement across all segments. The progression of our people is directly aligned with the enhancement and expansion of our company and is always a key area of focus.
INNOVATIONThrough our innovation, we continue to pursue original ideas, new technologies, superior methods and a unique approach to business. Our cutting-edge techniques and sharp attention to detail enable us to work quickly, efficiently and safely. We are always improving our standards in order to ensure maximum benefits for our
stakeholders. It is our innovative and forward-thinking tactics that keep us at the forefront of the industry.
PASSIONWe have a real passion for what we do. We firmly believe that true success is not attainable without the right heart and dedication. We embrace and ignite passion in every segment of our business. We remain passionate about improving our standards, enhancing our skills, customer satisfaction and every aspect of our management process. We are a success because the people of Drake & Scull are passionate about driving this organization forward and getting the job done right.
MAJOR HUMAN RESOURCE ACHIEVEMENTSSince 2014, we have made a concerted effort to strengthen our performance driven work culture across all our offices. We launched several initiatives at a corporate level to improve our performance efficiencies in key areas.
To ensure the onboarding process for new employees became seamless with DSI’s history, culture and corporate structure, we launched an online multimedia induction system that introduced newcomers to our rich legacy spanning three centuries and three continents.
We also centralized blue collar recruitment for all our markets which are now handled by the recruitment division in the UAE headquarters. This has helped us to adjudge and ensure the skill sets of blue collar workers before they are assigned to key projects and ensure they are hired correctly.
Development of our blue collar workers’ skill sets has
Annual Report
07OUR PEOPLE
016

017Annual Report
been a key area for the company and we established a training centre for our blue collar workers in the UAE, which assesses the skill and knowledge of our incoming workers in key operational areas and our experienced blue collar veterans and charge hands provide them with vocational training to help them familiarize with the industry practices and industry standards of our region.
We value our results oriented culture which rewards high performers and provides our employees with the right incentives to deliver results constantly. We overhauled our performance appraisal process in 2014, which introduced competencies to all corporate and holding staff. The performance appraisal system was also powered by DSI’s ERP system which has truly made the process objective, quantifiable and improved process accountability.
Any employee shortcomings and deficiencies identified during the performance appraisal process were addressed by our Learning and Development department, which encourages management and employees to undergo focused training, both academic and non-academic, to update their key skills as per industry standards as well as business needs.
We launched a major overhaul of the organization structures of Drake & Scull Engineering and Drake & Scull Construction, with significant changes to the composition of key management and the introduction and definition of new operation roles in the management hierarchy.
In 2015, we will introduce a structured plan to monitor the human talent in DSI & provide a structured career path to our employees that gives them a clear idea of
Annual Report
“ Today, the DSI family has grown to over 30,700 members from over 50 countries, working on projects from West Europe to South Asia.”
07OUR PEOPLE
their role in the company’s overall strategy.
We will further enhance our performance based culture by introducing a new Key Performance Indicator model that converts each individual employee’s department and company objectives into measurable parameters which will reduce the qualitative aspect of performance measurement and make the process quantifiable through performance based numbers.
We will also launch an E-recruitment tool that will allow us to hire the best available talent globally with the right mix of skills, experience, knowledge and attitude to succeed in our industry.
In 2014, we strengthened our Information Technology Systems and Business Applications. We laid an emphasis on the implementation of the Oracle JD Edwards ERP that spanned over 10,000 users and is currently one of the largest JD Edwards Implementations in the regional construction Industry.
The ERP implementation allowed us to re-engineer our business process to be agile, efficient and competitive. We also successfully deployed two Tier 3 Data centers for business continuity and disaster recovery that hosts all our systems on a “Private Cloud”, fulfilling our Service Level Agreement commitment to our employees to achieve 99.995% IT services availability on our systems. We ensured our IT Policies and Procedures were established as per “Information Security Management Systems” as part of our efforts to secure an ISO 27001:2013 Information Security certification from UKAS.
017
As it spreads its reach, the Banyan Tree remains connected to the thousands of leaves it nurtures. Every member of the DSI global family, spanning
30,700 motivated employees, is connected to DSI’s core mission, vision and values.

018 Annual Report
08FINANCIAL REVIEW
Drake & Scull sustained its project winning performance in 2014, by winning projects worth AED 5.935 billion across it key markets of UAE, KSA, Qatar, Kuwait, Oman, Jordan, Egypt, Algeria, India and Europe. The project wins also helped raise the projects backlog to an all-time high of AED 14.5 billion, which is a growth of 20% compared to 2013.
Our revenues for the year touched AED 4.762 billion and we recorded AED 100.7 million in net profits, while we achieved AED 320 million in EBITDA (Earnings before Interest Taxes Depreciation and Amortization). DSI’s Earnings per share (EPS) for FY 2014 stood at AED 0.044.
Our Water and Wastewater business, Passavant Energy & Environment (formerly Passavant-Roediger) effectively completed the evolution of its core business and rebranded itself as part of its 2015 strategy. The company also shifted its headquarters to the strategically vital city of Frankfurt giving it a strong foothold into the wider Europe and MENA markets.
Drake & Scull Engineering underwent a restructuring of its management and was able to register nearly AED 2.3
billion in Project Awards in 2014, consolidating its position as one of the premier engineering solutions provider in the MENA and South Asia regions.
The Oil & Gas business continued to grow from strength to strength, handing over its maiden project in Egypt (the Low Density Ammonium Nitrate Plant in Ain Sokhna) while simultaneously picking up the AED 2 billion Tahrir Petrochemical Complex.
QUARTERLY BREAKDOWNDrake & Scull Engineering started off the year on a positive note with two prominent project wins in the form of The Mall of Emirates Redevelopment for AED 110 million in the UAE, and the King Saud University Endowment for AED 328 million in KSA. Passavant kicked off 2014 with a head start with a slew of project wins across Europe and India, including the AED 65 million Reconstruction of the Sarajevo Wastewater Treatment plant in Bosnia, the Rehabilitation and extension of twin Wastewater treatment plants in Romania for AED 63 million, the construction of Adiyaman Wastewater treatment plant in Turkey for AED 39 million, and the construction of twin wastewater treatment plants in Rajasthan and Gujarat in India for a combined valued of AED 50 million.
Annual Report018018

019Annual Report
Drake & Scull Construction sealed a highly successful quarter by picking up the AED 375 million “The Pointe” development by Nakheel in UAE.
Drake & Scull Engineering continued its streak of major project wins into Q2, by winning the contracts for a Cultural center, two markets and a healthcare facility in Kuwait for a combined value of AED 128 million. DSE also picked up the coveted contracts to undertake MEP works on the prestigious Plaza View complex in the UAE for AED 110 million, as well as offer its engineering services for the District cooling plant in the iconic Saraya Aqaba region in Jordan for a total value of AED 259 million.
Drake & Scull Construction continued to consolidate its position in Algeria with another project win for a Social housing project in Algiers for a project value of AED 148 million.
Drake & Scull Oil & Gas achieved its biggest project win to date by picking up the coveted Tahrir Petrochemicals complex for Carbon Holdings in Egypt for a massive AED 2.2 billion, which helped DSI achieve nearly AED 2.85 billion in project awards in Q2.
“ Drake & Scull sustained its project winning performance in 2014, by winning projects worth AED 5.935 billion across it key markets of UAE, KSA, Qatar, Kuwait, Oman, Jordan, Egypt, Algeria, India and Europe.”
Annual Report
Heading into the third quarter, Drake & Scull Engineering sustained its fine form by picking up projects in India, Kuwait, KSA, Qatar and Oman. Notable projects awarded include the AED 304 million Power Transmission Line in India, the AED 189 million Al Dara Hospital in KSA, an AED 110 million District Cooling plant in Qatar and three projects spanning government facilities, a tourism complex and an oil refinery in Oman for a combined value of AED 168 million.
Drake & Scull Construction was awarded a prestigious AED 490 million contract to develop a prominent Expatriate residential compound in KSA which helped the company retain its position as a prime general contractor in MENA’s biggest real estate market.
Passavant picked up an AED 103 million wastewater treatment plant award in India to bring a successful quarter to a close.
DSI closed 2014 on a bright note as Drake & Scull Engineering picked up an AED 172 million District Cooling project on a housing complex and an AED 82.5 million healthcare project in the UAE, to help DSI secure AED 5.935 billion worth of projects in fiscal 2014.
019
Strong wood does not grow with ease. Stronger the wind stronger the tree. DSI’s unmatched experience of delivering
projects across a complex variety of sectors and regions empowers its operational expertise.

FINANCIALS09
The Banyan Tree is more than first a seed, then a stem, then a living Trunk. It is a Force of Nature. DSI’s diversification strategy gives it the unique advantage of being an end to end integrated engineering and construction services provider to assume responsibility of the complete project cycle.

DIRECTORS’ REPORT AND CONSOLIDATED FINANCIAL STATEMENTSFOR THE YEAR ENDED 31 DECEMBER 2014
Directors’ report .....................................................................................................................022Independent auditor’s report ...........................................................................................023Consolidated balance sheet .............................................................................................024Consolidated income statement ....................................................................................026Consolidated statement of comprehensive income ..............................................027Consolidated statement of changes in equity ..........................................................028Consolidated statement of cash flows .........................................................................030 Notes to the consolidated financial statements .......................................................032

022 Annual Report
DIRECTORS’ REPORT
Dear Shareholders
The Board of Directors of Drake & Scull International PJSC (“DSI”) or (the “Company”) and its Subsidiaries (the “Group”) have the pleasure in presenting their consolidated financial statements for the year ended 31 December 2014.
PRINCIPAL ACTIVITIESDuring the year ended 31 December 2014 DSI was preliminary engaged in engineering, integrated design and construction disciplines of Mechanical, Electrical and Plumbing (MEP), Civil Contracting, Water and Power Infrastructure and Oil and Gas Infrastructure.
FINANCIAL RESULTSFor the year ended 31 December 2014, DSI recorded revenues amounting to AED 4,762 million. The net profit for the year was AED 100.7 million.
Despite challenging market conditions and operational challenges, DSI managed to deliver a profitable year, increasing its market share and expanding its backlog to a record high of AED 14.5 billion. Our performance for the full year across all our operating segments was challenging and particularly in our key market KSA. Our EBITDA
Majid Al Ghurair, ChairmanDrake & Scull International PJSC (DSI)
margins were affected in 2014 due to the provisions of doubtful debt in our key markets UAE and KSA. Delays in collections affected our working capital and led to an increase in our debt level which in turn resulted in higher finance cost affecting our profitability margins for the year ended 31 December 2014.
Looking ahead at our direction for the year ended 31 December 2015, we are confident that the strength of our business model and the integration of our projects operations will allow us to overcome the challenging market conditions and to deliver our backlog.
Our main focus will be strengthening our capital structure and reducing our leverage level .We remain committed to achieving cost reduction and improving of our return on capital to deliver sustainable growth and improved profitability in 2015.
AUDITORSPricewaterhouseCoopers were appointed as external auditors of the Group for the year ended 31 December 2014. PricewaterhouseCoopers are eligible for reappointment as auditors for 2015 and have expressed their willingness to continue in office.
023Annual Report
INDEPENDENT AUDITOR’S REPORT TO THE SHAREHOLDERS OF DRAKE AND SCULL INTERNATIONAL PJSC
EMPHASIS OF MATTERSWe draw attention to Note 4.1(b) to these consolidated financial statements, which describes critical accounting estimate and judgement on revenue recognition relating to unapproved change orders and claims.
We also draw attention to Note 8 to these consolidated financial statements, which describes the uncertainty related to the outcome of arbitrations and litigation with certain customers.
Our opinion is not qualified in respect of these matters.
REPORT ON OTHER LEGAL AND REGULATORY REQUIREMENTS Further, as required by the UAE Federal Law No. (8) of 1984, as amended, in respect of the Company, we report that:
i. we have obtained all the information we considered necessary for the purposes of our audit;
ii. the financial statements comply, in all material respects, with the applicable provisions of the UAE Federal Law No. (8) of 1984, as amended, and the Articles of Association of the Company;
iii. the Company has maintained proper books of account and has carried out physical verification of inventories in accordance with properly established procedures;
iv. the financial information included in the Directors’ report is consistent with the books of account of the Company; and
v. nothing has come to our attention which causes us to believe that the Company has breached any of the applicable provisions of the UAE Federal Law No. (8) of 1984, as amended, or of its Articles of Association which would materially affect its activities or its financial position as at 31 December 2014.
PricewaterhouseCoopers30 March 2015
Paul Suddaby Registered Auditor Number 309 Dubai, United Arab Emirates
PricewaterhouseCoopers Emaar Square, Building 4, Level 8 PO Box 11987, Dubai, United Arab Emirates T: +971 (0)4 304 3100 F: +971 (0)4 330 4100 www.pwc.com/middle-east
AH Nasser, P Suddaby, JE Fakhoury and DO’ Mahony are registered as practising auditors with the UAE Ministry of Economy
REPORT ON THE CONSOLIDATED FINANCIAL STATEMENTSWe have audited the accompanying consolidated financial statements of Drake & Scull International PJSC (the “Company”) and its subsidiaries (together, the “Group”), which comprise the consolidated balance sheet as at 31 December 2014 and the consolidated statements of income, comprehensive income, changes in equity and cash flows for the year then ended, and a summary of significant accounting policies and other explanatory notes.
MANAGEMENT’S RESPONSIBILITY FOR THE CONSOLIDATED FINANCIAL STATEMENTSManagement is responsible for the preparation and fair presentation of these consolidated financial statements in accordance with International Financial Reporting Standards, and for such internal control as management determines is necessary to enable the preparation of consolidated financial statements that are free from material misstatement, whether due to fraud or error.
AUDITOR’S RESPONSIBILITYOur responsibility is to express an opinion on these consolidated financial statements based on our audit. We conducted our audit in accordance with International Standards on Auditing. Those standards require that we comply with ethical requirements and plan and perform the audit to obtain reasonable assurance about whether the consolidated financial statements are free from material misstatement.
An audit involves performing procedures to obtain audit evidence about the amounts and disclosures in the consolidated financial statements. The procedures selected depend on the auditor’s judgement, including the assessment of the risks of material misstatement of the consolidated financial statements, whether due to fraud or error. In making those risk assessments, the auditor considers internal control relevant to the entity’s preparation and fair presentation of the consolidated financial statements in order to design audit procedures that are appropriate in the circumstances, but not for the purpose of expressing an opinion on the effectiveness of the entity’s internal control. An audit also includes evaluating the appropriateness of accounting policies used and the reasonableness of accounting estimates made by management, as well as evaluating the overall presentation of the consolidated financial statements.
We believe that the audit evidence we have obtained is sufficient and appropriate to provide a basis for our audit opinion.
OPINIONIn our opinion, the accompanying consolidated financial statements present fairly, in all material respects, the financial position of the Group as at 31 December 2014, and its financial performance and its cash flows for the year then ended in accordance with International Financial Reporting Standards.

024 Annual Report024 Annual Report
CONSOLIDATED BALANCE SHEET AS AT 31 DECEMBER
Note2014
AED’0002013
AED’000
ASSETSNON-CURRENT ASSETSProperty and equipment 6 534,538 510,680
Intangible assets 7 1,060,719 1,098,469
Investment property 10 29,376 29,376
Investments 29 264,812 93,249
Deferred income tax assets 9 5,811 5,646
Available-for-sale financial assets 11 40,753 75,159
Trade and other receivables 8 227,650 212,503
2,163,659 2,025,082
CURRENT ASSETSInventories 13 44,817 30,259
Development properties 19,111 19,111
Trade and other receivables 8 5,474,175 4,256,323
Due from related parties 21 91,479 268,628
Financial assets at fair value through profit or loss 12 5,368 4,678
Cash and bank balances 14 758,120 558,217
6,393,070 5,137,216
TOTAL ASSETS 8,556,729 7,162,298
EQUITY AND LIABILITIESEQUITY ATTRIBUTABLE TO OWNERS OF THE PARENTShare capital 15 2,285,047 2,285,047
Share premium 15 3,026 3,026
Statutory reserve 16 116,677 93,722
Other reserve 17 24,543 24,543
Retained earnings 593,554 515,801
Foreign currency translation reserve (15,286) (15,685)
3,007,561 2,906,454
Non-controlling interests 68,425 68,372
TOTAL EQUITY 3,075,986 2,974,826
The notes on pages 32 to 65 are an integral part of these consolidated financial statements.

025Annual Report 025Annual Report
CONSOLIDATED BALANCE SHEET AS AT 31 DECEMBER
Note2014
AED’0002013
AED’000
LIABILITIESNON-CURRENT LIABILITIESBank borrowings 18 534,084 48,878
Deferred income tax liabilities 9 2,153 2,414
Employees’ end of service benefits 20 150,962 110,234
687,199 161,526
CURRENT LIABILITIESTrade and other payables 19 2,988,595 2,938,909
Bank borrowings 18 1,676,599 1,067,592
Due to related parties 21 128,350 19,445
4,793,544 4,025,946
TOTAL LIABILITIES 5,480,743 4,187,472
TOTAL EQUITY AND LIABILITIES 8,556,729 7,162,298
The notes on pages 32 to 65 are an integral part of these consolidated financial statements.
The consolidated financial statements were approved for issue by the Board of Directors on 30
March 2015 and signed on its behalf by;Chairman Chief Executive Officer

026 Annual Report
Note2014
AED’0002013
AED’000
Contract revenue 5 4,762,264 4,879,189
Contract costs 24 (4,350,655) (4,382,296)
GROSS PROFIT 411,609 496,893
Other income 23 31,003 20,658
General and administrative expenses 25 (373,668) (328,581)
Other gain/(losses) - net 27 690 (3,070)
OPERATING PROFIT 69,634 185,900
Finance income 22 11,658 23,147
Finance costs 22 (21,456) (36,032)
FINANCE COSTS – NET 22 (9,798) (12,885)
Share of profit from investment in joint venture 29.1 65,995 64,043
Share of loss from investment in associate 29.2 (1,506) -
PROFIT FOR THE YEAR BEFORE TAX 124,325 237,058
Income tax expense 28 (23,653) (55,323)
PROFIT FOR THE YEAR 100,672 181,735
ATTRIBUTABLE TO:
Owners of the Parent 100,708 166,469
Non-controlling interests (36) 15,266
100,672 181,735
EARNINGS PER SHARE
- Basic and diluted (AED) 30 0.044 0.073
CONSOLIDATED INCOME STATEMENT YEAR ENDED 31 DECEMBER
The notes on pages 32 to 65 are an integral part of these consolidated financial statements.

027Annual Report
2014AED’000
2013AED’000
PROFIT FOR THE YEAR 100,672 181,735
OTHER COMPREHENSIVE INCOMEITEMS THAT MAY BE SUBSEQUENTLY RECLASSIFIED TO PROFIT OR LOSS
Foreign currency translation 399 (7,339)
OTHER COMPREHENSIVE INCOME FOR THE YEAR 399 (7,339)
Total comprehensive income for the year 101,071 174,396
ATTRIBUTABLE TO:
- Owners of the Parent 101,107 159,130
- Non-controlling interests (36) 15,266
101,071 174,396
CONSOLIDATED STATEMENT OF COMPREHENSIVE INCOME YEAR ENDED 31 DECEMBER
The notes on pages 32 to 65 are an integral part of these consolidated financial statements.

028 Annual Report
Share capitalAED’000
Treasury sharesAED’000
Share PremiumAED’000
Statutory reserveAED’000
Other reserve AED’000
Retained earningsAED’000
Foreign currency translation
reserveAED’000
TotalAED’000
Non-controlling interestsAED’000
TotalAED’000
BALANCE AT 1 JANUARY 2014 2,285,047 - 3,026 93,722 24,543 515,801 (15,685) 2,906,454 68,372 2,974,826
PROFIT FOR THE YEAR - - - - - 100,708 - 100,708 (36) 100,672
Other comprehensive income for the year - - - - - - 399 399 - 399
Total comprehensive income for the year - - - - - 100,708 399 101,107 (36) 101,071
Transfer from retained earnings to statutory reserve - - - 22,955 - (22,955) - - - -
Amount contributed by non-controlling interests - - - - - - - - 89 89
BALANCE AT 31 DECEMBER 2014 2,285,047 - 3,026 116,677 24,543 593,554 (15,286) 3,007,561 68,425 3,075,986
Share capitalAED’000
Treasury sharesAED’000
Share PremiumAED’000
Statutory reserveAED’000
Other reserve AED’000
Retained earningsAED’000
Foreign currency translation
reserveAED’000
TotalAED’000
Non-controlling interestsAED’000
TotalAED’000
BALANCE AT 1 JANUARY 2013 2,285,047 (28,622) - 79,219 24,543 363,835 (8,346) 2,715,676 53,106 2,768,782
PROFIT FOR THE YEAR - - - - - 166,469 - 166,469 15,266 181,735
Other comprehensive income for the year - - - - - - (7,339) (7,339) - (7,339)
Total comprehensive income for the year - - - - - 166,469 (7,339) 159,130 15,266 174,396
Transaction with owners
Re-issue of treasury shares (Note 17) - 28,622 3,026 - - - - 31,648 - 31,648
Total transaction with owners - 28,622 3,026 - - - - 31,648 - 31,648
Transfer from retained earnings to statutory reserve - - - 14,503 - (14,503) - - - -
BALANCE AT 31 DECEMBER 2013 2,285,047 - 3,026 93,722 24,543 515,801 (15,685) 2,906,454 68,372 2,974,826
CONSOLIDATED STATEMENT OF CHANGES IN EQUITY
The notes on pages 32 to 65 are an integral part of these consolidated financial statements.

029Annual Report
Share capitalAED’000
Treasury sharesAED’000
Share PremiumAED’000
Statutory reserveAED’000
Other reserve AED’000
Retained earningsAED’000
Foreign currency translation
reserveAED’000
TotalAED’000
Non-controlling interestsAED’000
TotalAED’000
BALANCE AT 1 JANUARY 2014 2,285,047 - 3,026 93,722 24,543 515,801 (15,685) 2,906,454 68,372 2,974,826
PROFIT FOR THE YEAR - - - - - 100,708 - 100,708 (36) 100,672
Other comprehensive income for the year - - - - - - 399 399 - 399
Total comprehensive income for the year - - - - - 100,708 399 101,107 (36) 101,071
Transfer from retained earnings to statutory reserve - - - 22,955 - (22,955) - - - -
Amount contributed by non-controlling interests - - - - - - - - 89 89
BALANCE AT 31 DECEMBER 2014 2,285,047 - 3,026 116,677 24,543 593,554 (15,286) 3,007,561 68,425 3,075,986
Share capitalAED’000
Treasury sharesAED’000
Share PremiumAED’000
Statutory reserveAED’000
Other reserve AED’000
Retained earningsAED’000
Foreign currency translation
reserveAED’000
TotalAED’000
Non-controlling interestsAED’000
TotalAED’000
BALANCE AT 1 JANUARY 2013 2,285,047 (28,622) - 79,219 24,543 363,835 (8,346) 2,715,676 53,106 2,768,782
PROFIT FOR THE YEAR - - - - - 166,469 - 166,469 15,266 181,735
Other comprehensive income for the year - - - - - - (7,339) (7,339) - (7,339)
Total comprehensive income for the year - - - - - 166,469 (7,339) 159,130 15,266 174,396
Transaction with owners
Re-issue of treasury shares (Note 17) - 28,622 3,026 - - - - 31,648 - 31,648
Total transaction with owners - 28,622 3,026 - - - - 31,648 - 31,648
Transfer from retained earnings to statutory reserve - - - 14,503 - (14,503) - - - -
BALANCE AT 31 DECEMBER 2013 2,285,047 - 3,026 93,722 24,543 515,801 (15,685) 2,906,454 68,372 2,974,826
CONSOLIDATED STATEMENT OF CHANGES IN EQUITY
The notes on pages 32 to 65 are an integral part of these consolidated financial statements.

030 Annual Report
CONSOLIDATED STATEMENT OF CASH FLOWSYEAR ENDED 31 DECEMBER
Note2014
AED’0002013
AED’000
OPERATING ACTIVITIESProfit for the year before tax 124,325 237,058
Adjustments for:
Share of profit from investment in joint venture 29.1 (65,995) (64,043)
Share of loss from investment in associate 29.2 1,506 -
Depreciation 6 70,615 47,388
Amortisation of intangible assets 7 37,750 37,750
Provision for employees’ end of service benefits 20 49,076 41,665
Fair value (gain) / loss on financial assets at fair value through profit or loss 27 (690) 143
Fair value gain on settlement of share swaps 27 - (5,583)
Fair value loss on interest rate swaps 27 - 4,050
Loss on settlement of equity warrants 27 - 27
Impairment reversal on available-for-sale financial assets 11 - (727)
Loss on sale of development properties 27 - 5,160
Finance income 22 (11,658) (23,147)
Finance costs 22 98,958 36,032
Gain on disposal of property and equipment 23 (160) (982)
Provision for impairment on trade receivables and retentions - net 25 54,416 22,509
Operating cash flows before payment of employees’ end of service benefits, income tax and changes in working capital
358,143 337,300
Employees’ end of service benefits paid 20 (8,348) (16,100)
Income tax paid (17,301) (49,760)
Changes in working capital
Inventories (14,558) (3,749)
Development properties - (1,306)
Trade and other receivables before provisions and excluding interest receivable and loans and advances
(1,327,240) (578,182)
Due from related parties 177,149 (242,638)
Trade and other payables excluding income tax and interest payable 30,930 732,064
Due to related parties 108,905 7,746
Derivative financial instruments - (20,153)
Net cash (used in) / generated from operating activities (692,320) 165,222
BALANCE CARRIED FORWARD (692,320) 165,222
The notes on pages 32 to 65 are an integral part of these consolidated financial statements.

031Annual Report
CONSOLIDATED STATEMENT OF CASH FLOWSYEAR ENDED 31 DECEMBER
Note2014
AED’0002013
AED’000
BALANCE BROUGHT FORWARD (692,320) 165,222
INVESTING ACTIVITIESPurchase of property and equipment 6 (95,939) (86,733)
Proceeds from disposal of property and equipment 1,057 32,229
Investment in associate 29.2 (53,766) (29,206)
Investment in available-for-sale financial assets 11 (18,902) (72,048)
Loans and advances 8 46,550 9,683
Interest received 4,933 15,083
NET CASH USED IN INVESTING ACTIVITIES (116,067) (130,992)
FINANCING ACTIVITIESTerm deposits under lien 14 (88,128) (68,608)
Proceeds from re-issue of treasury shares 15 - 31,648
Net proceeds from trust receipts and other borrowings 153,877 277,477
Proceeds from term loans 18 933,833 24,350
Payment of term loans 18 (231,093) (577,659)
Non-controlling interest’s contribution to subsidiary’s share capital 89 -
Interest paid (86,980) (21,856)
NET CASH GENERATED FROM / (USED IN) FINANCING ACTIVITIES 681,598 (334,648)
Net decrease in cash and cash equivalents (126,789) (300,418)
Net foreign currency translation difference 968 (4,217)
Movement in restricted cash - 444,867
Cash and cash equivalents, at the beginning of the year 322,266 182,034
Cash and cash equivalents, at the end of the year 14 196,445 322,266
The notes on pages 32 to 65 are an integral part of these consolidated financial statements.

032
NOTES TO THE CONSOLIDATED FINANCIAL STATEMENTSFOR THE YEAR ENDED 31 DECEMBER 2014
Annual Report
1 GENERAL INFORMATIONDrake & Scull International PJSC (“the Company” or “the Parent Company”) was incorporated on 16 November 2008 and was registered on 21 January 2009 as a Public Joint Stock Company in accordance with the UAE Federal Law No. 8 of 1984, (as amended). The Company is listed on Dubai Financial Market.
The address of the Company’s registered office is PO Box 65794, Dubai, United Arab Emirates.
The principal activities of the Company and its subsidiaries (together, “the Group”) are carrying out contracting work relating to the construction industry, such as electrical, plumbing, oil and gas, air conditioning and sanitation work in the Middle East, Europe, Asia and North Africa region.
The Company has either directly or indirectly the following major subsidiaries:
Major Subsidiaries Principal activities Shareholding %Country of
incorporation
2014 2013
Drake & Scull International LLC (Abu Dhabi)Contracting work related to mechanical, electrical and sanitary engineering
100 100 UAE
Gulf Technical Construction Company LLC Mechanical, electrical and civil construction work 100 100 UAE
Drake & Scull Engineering formerly Drake & Scull Water and Power LLC
Engineering, procurement and construction of Water and Power Infrastructure projects
100 100 UAE
Drake & Scull International for Electrical Contracting WLL
Mechanical, Electrical contracting and repairing work relating to the construction industry
75 75 Kuwait
Drake & Scull International (Qatar) WLL Mechanical, electrical and plumbing activities 100 100 Qatar
Passavant Energy & Environment and its subsidiaries (a subsidiary of Passavant Engineering Limited)
Developing waste water, water and sludge treatment plants
100 100 Germany
Drake & Scull International WLLImplementation of construction contracts, operation and maintenance of electrical and mechanical installations and related activities
65 65 Saudi Arabia
International Center for Contracting Co. Ltd Contracting work relating to the construction industry
100 100 Saudi Arabia
Drake & Scull Construction Company LLCContracting work relating to the construction industry
94 94 Saudi Arabia
Drake & Scull International for Contracting SAEContracting work related to mechanical, electrical and sanitary engineering
100 100 Egypt
Drake & Scull International LLC (Oman)Contracting work related to mechanical, electrical and sanitary engineering
51 51 Oman

033
NOTES TO THE CONSOLIDATED FINANCIAL STATEMENTSFOR THE YEAR ENDED 31 DECEMBER 2014
Annual Report
The Group, through Gulf Technical Construction Company LLC, also has a 50% interest in Ranya Test Joint Venture, a joint arrangement with Ranya General Contracting Company LLC under a joint arrangement agreement dated 12 August 2005. This is classified as joint operation in these consolidated financial statements.
The Group, through Drake & Scull International for Contracting SAE, also has a 50% interest in a joint venture with Hassan Allam Sons (Misr Sons Development S.A.E) under a joint arrangement agreement dated 21 July 2011. This is classified as joint operation in these consolidated financial statements.
The Group, through Drake & Scull International Saudi Co. LLC, also has a 50% interest in a joint venture with Specon Saudi LLC under a joint arrangement agreement dated 14 February 2013. This is classified as joint operation in these consolidated financial statements.
The Group, through Drake & Scull Construction Company LLC, also has a 50% interest in a joint venture with Consolidated Contractors Group S.A.L (Offshore) (CCC) under a joint arrangement agreement dated 27 September 2011. This is classified as joint operation in these consolidated financial statements.
The Group, through Drake & Scull Construction Company LLC – Saudi Arabia, also has a 50% interest in a joint venture with Saudi Arabia Construction Co (SACC – DSC JV) under a joint arrangement agreement dated 15 October 2012. This is classified as joint operation in these consolidated financial statements.
The Group, through Drake & Scull Construction LLC, also has a 50% interest in a joint venture with John Sisk and Sons Construction LLC, (SISK-DSC-SMH-Joint Venture) under a joint arrangement agreement dated 25 November 2012. This is classified as joint operation in these consolidated financial statements.
Drake & Scull International PJSC, has a 50% interest in a joint venture with SICIM S.p.A under joint arrangement agreement dated 11 January 2013. This is classified as joint operation in these consolidated financial statements.
Drake & Scull International PJSC, also has a 51% interest in a joint venture with Al Habtoor Specon LLC (DSI-HLS Joint Venture) under a joint arrangement agreement dated 17 April 2013. This is classified as joint operation in these consolidated financial statements.
Drake & Scull Engineering LLC, also has a 49% interest in a joint venture with Al Habtoor Specon LLC (HLS-DSE Joint Venture) under a joint arrangement agreement dated 1 May 2013. This is classified as joint operation in these consolidated financial statements.
The Group, through Drake & Scull (Cayman Islands) No. 3 Limited, also has a 50% interest in a joint venture with Omniyat Properties Twenty Seven Limited (DSO Development Limited) under a joint arrangement agreement dated 6 November 2012. This is classified as joint venture in these consolidated financial statements.

034
NOTES TO THE CONSOLIDATED FINANCIAL STATEMENTSFOR THE YEAR ENDED 31 DECEMBER 2014
Annual Report
• IAS 19 (amendment), ‘Employee benefits’, (effective from 1 July 2014);
• IAS 27 (amendment), ‘Separate financial statements’, (effective from 1 January 2016);
• IFRS 7, ‘Financial instruments: Disclosures’ (effective from 1 July 2016);
• IFRS 9 (amendment), ‘Financial instrument’, (effective from 1 January 2018);
• IFRS 11 (amendment), ‘Joint arrangements’, (effective from 1 January 2016); and
• IFRS 15, ‘Revenue from contracts with customers’, (effective from 1 January 2017).
There are no other IFRSs or IFRIC interpretations that are not yet effective that would be expected to have a material impact on the Group.
The Group is assessing the impact of the above amendments and new standards, none of which are expected to have a material impact on the Group’s consolidated financial statements.
2.2CONSOLIDATION(a) SubsidiariesSubsidiaries are all entities (including structured entities) over which the Group has control. The Group controls an entity when the Group is exposed to, or has rights to, variable returns from its involvement with the entity and has the ability to affect those returns through its power over the entity. Subsidiaries are fully consolidated from the date on which control is transferred to the Group. They are deconsolidated from the date that control ceases.
The Group applies the acquisition method of accounting to account for business combinations. The consideration transferred for the acquisition of a subsidiary is the fair value of the assets transferred, the liabilities incurred to the former owners of the acquiree and the equity interests issued by the Group. The consideration transferred includes the fair value of any asset or liability resulting from a contingent consideration arrangement. Identifiable assets acquired and liabilities and contingent liabilities assum ed in a business combination are measured initially at their fair values at the acquisition date. The Group recognises any non-controlling interest in the acquiree on an acquisition-by-acquisition basis, either at fair value or at the non-controlling interest’s proportionate share of the recognised amounts of acquiree’s identifiable net assets. Acquisition-related costs are expensed as incurred.
The excess of the consideration transferred, the amount of any non-controlling interest in the acquiree and the acquisition-date fair value of any previous equity interest in the acquiree over the fair value of the identifiable net assets acquired is recorded as goodwill. If the total of consideration transferred, non-controlling interest recognised and previously held interest measured is less than the fair value of the net
2 SUMMARY OF SIGNIFICANT ACCOUNTING POLICIESThe principal accounting policies applied in the preparation of these consolidated financial statements are set out below. These policies have been consistently applied to all the years presented, unless otherwise stated.
2.1.1 BASIS OF PREPARATIONThe consolidated financial statements of the Group have been prepared in accordance with International Financial Reporting Standards (“IFRS”) and IFRS Interpretations Committee (IFRS IC) applicable to companies reporting under IFRS. The consolidated financial statements have been prepared under the historical cost convention, except as disclosed in the accounting policies below.
The preparation of consolidated financial statements in conformity with IFRS requires the use of certain critical accounting estimates. It also requires management to exercise its judgement in the process of applying the Group’s accounting policies. The areas involving a higher degree of judgement or complexity, or areas where assumptions and estimates are significant to the consolidated financial statements are disclosed in Note 4.
2.1.2CHANGES IN ACCOUNTING POLICY AND DISCLOSURES(a) New standards, amendments, and interpretations adopted by the GroupThe following standards have been adopted by the Group for the first time for the financial year beginning on or after 1 January 2014 and does not have a material impact on the Group:
• IAS 32 (amendment), ‘Financial instruments: Presentation’, (effective from 1 January 2014);
• IAS 36 (amendment), ‘Impairment of assets’, (effective from 1 January 2014);
• IAS 39 (amendment), ‘Financial Instruments: Recognition and Measurement’, (effective from 1 January 2014); and
• Amendments to IFRS 10, 12 and IAS 27 on consolidation for investment entities (effective from 1 January 2014).
(b) New standards, amendments, and interpretations not yet adoptedA number of new standards and amendments to standards and interpretations are effective for annual periods beginning on or after 1 January 2014, and have not been applied in preparing these consolidated financial statements, are set out below:

035
NOTES TO THE CONSOLIDATED FINANCIAL STATEMENTSFOR THE YEAR ENDED 31 DECEMBER 2014
Annual Report
assets of the subsidiary acquired in the case of a bargain purchase, the difference is recognised directly in the consolidated income statement (Note 2.6).
If the business combination is achieved in stages, the acquisition date carrying value of the acquirer’s previously held equity interest in the acquiree is re-measured to fair value at the acquisition date; any gains or losses arising from such re-measurement are recognised in profit or loss.
Any contingent consideration to be transferred by the group is recognised at fair value at the acquisition date. Subsequent changes to the fair value of the contingent consideration that is deemed to be an asset or liability is recognised in accordance with IAS 39 either in profit or loss or as a change to other comprehensive income. Contingent consideration that is classified as equity is not re-measured, and its subsequent settlement is accounted for within equity.
Inter-company transactions, balances and unrealised gains on transactions between Group companies are eliminated. Unrealised losses are also eliminated. When necessary amounts reported by subsidiaries have been adjusted to conform with the Group’s accounting policies.
Transactions with non-controlling interests that do not result in loss of control are accounted for as equity transactions – that is, as transactions with the owners in their capacity as owners. The difference between fair value of any consideration paid and the relevant share acquired of the carrying value of net assets of the subsidiary is recorded in equity. Gains or losses on disposals to non-controlling interests are also recorded in equity.
(b) Joint venturesThe Group applies IFRS 11 to all joint arrangements. Under IFRS 11 investments in joint arrangements are classified as either joint operations or joint ventures depending on the contractual rights and obligations each investor. The Group has assessed the nature of its joint arrangements and determined them to be both joint ventures and joint operations. Joint ventures are accounted for using the equity method whereas joint operations are consolidated on a proportional line by line basis.
Under the equity method of accounting, interests in joint ventures are initially recognised at cost and adjusted thereafter to recognise the Group’s share of the post-acquisition profits or losses and movements in other comprehensive income. When the Group’s share of losses in a joint venture equals or exceeds its interests in the joint ventures (which includes any long-term interests that, in substance, form part of the Group’s net investment in the joint ventures), the Group does not recognise further losses, unless it has incurred obligations or made payments on behalf of the joint ventures.
(c) Associates Associates are all entities over which the Group has significant influence but not control, generally accompanying a shareholding of between 20% and 50% of the voting rights. Investments in associates are accounted for using the equity method of accounting.
Under the equity method, the investment is initially recognised at cost, and the carrying amount is increased or decreased to recognise the investor’s share of the profit or loss of the investee after the date of acquisition. The Group’s investment in associates includes goodwill identified on acquisition.
If the ownership interest in an associate is reduced but significant influence is retained, only a proportionate share of the amounts previously recognised in other comprehensive income is reclassified to profit or loss where appropriate.
The Group’s share of post-acquisition profit or loss is recognised in the consolidated income statement, and its share of post-acquisition movements in other comprehensive income is recognised in other comprehensive income with a corresponding adjustment to the carrying amount of the investment. When the Group’s share of losses in an associate equals or exceeds its interest in the associate, including any other unsecured receivables, the Group does not recognise further losses, unless it has incurred legal or constructive obligations or made payments on behalf of the associate.
The Group determines at each reporting date whether there is any objective evidence that the investment in the associate is impaired. If this is the case, the Group calculates the amount of impairment as the difference between the recoverable amount of the associate and its carrying value and recognises the amount adjacent to ‘share of profit/(loss) of associates in the consolidated income statement.
Profits and losses resulting from upstream and downstream transactions between the Group and its associate are recognised in the Group’s financial statements only to the extent of unrelated investor’s interests in the associates. Unrealised losses are eliminated unless the transaction provides evidence of an impairment of the asset transferred. Accounting policies of associates have been changed where necessary to ensure consistency with the policies adopted by the Group.
Dilution gains and losses arising in investments in associates are recognised in the consolidated income statement.
2.3 SEGMENT REPORTINGOperating segments are reported in a manner consistent with the internal reporting provided to the Chief Operating decision-maker. The Chief Operating decision-maker, who is responsible for allocating resources and assessing performance of the operating segments, has been identified as the executive management that makes strategic decisions. The Chief Operating decision-maker of the Group is the “Executive Management”.
2.4 FOREIGN CURRENCY TRANSLATION(a) Functional and presentation currencyItems included in the financial statements of each of the Group’s entities are measured using the currency of the primary economic environment in which the respective entity operates (‘the functional currency’). The consolidated financial statements are presented in United Arab Emirates Dirhams (“AED”), which is the Group’s presentation currency.

036
NOTES TO THE CONSOLIDATED FINANCIAL STATEMENTSFOR THE YEAR ENDED 31 DECEMBER 2014
Annual Report
(b) Transactions and balances Foreign currency transactions are translated into the functional currency using the exchange rates prevailing at the dates of the transactions or valuation where items are re-measured. Foreign exchange gains and losses resulting from the settlement of such transactions and from the translation at year-end exchange rates of monetary assets and liabilities denominated in foreign currencies are recognised in the consolidated income statement.
Foreign exchange gains and losses that relate to borrowings and cash and cash equivalents are presented in the consolidated income statement within ‘finance income or costs’. All other foreign exchange gains and losses are presented in the consolidated income statement.
Translation differences on non-monetary financial assets and liabilities such as equities held at fair value through profit or loss are recognised in profit or loss as part of the fair value gain or loss. Translation differences on non-monetary financial assets, such as equities classified as available for sale, are included in other comprehensive income.
(c) Group entitiesThe results and financial position of all the Group entities (none of which has the currency of a hyper-inflationary economy) that have a functional currency different from the presentation currency are translated into the presentation currency as follows:
i. assets and liabilities for each balance sheet presented are translated at the closing rate at the date of that balance sheet;
ii. income and expenses for each income statement are translated at average exchange rates (unless this average is not a reasonable approximation of the cumulative effect of the rates prevailing on the transaction dates, in which case income and expenses are translated at the rate on the dates of the transactions); and
iii. all resulting exchange differences are recognised in other comprehensive income.
Goodwill and fair value adjustments arising on the acquisition of a foreign entity are treated as assets and liabilities of the foreign entity and translated at the closing rate. Exchange differences arising are recognised in other comprehensive income.
2.5PROPERTY AND EQUIPMENTProperty and equipment are stated at historical cost less depreciation. Historical cost includes expenditure that is directly attributable to the acquisition of the items. Cost may also include transfers from equity of any gains/losses on qualifying cash flow hedges of foreign currency purchases of property and equipment.
Subsequent costs are included in the asset’s carrying amount or recognised as a separate asset, as appropriate, only when it is probable that future economic benefits associated with the item will flow to the Group and the cost of the item can be measured reliably. The carrying amount of the replaced part is derecognised. All
other repairs and maintenance costs are charged to the consolidated income statement during the financial period in which they are incurred.
Land is not depreciated. Depreciation on other assets is calculated on the straight-line method, at rates calculated to allocate the cost of assets less their estimated residual value over their expected useful lives as follows:
Type of assets Years
Buildings 5 to 10 years
Machinery 2 to 5 years
Furniture, fixtures and office equipment 2 to 5 years
Motor vehicles 3 to 5 years
The assets’ residual values and useful lives are reviewed, and adjusted if appropriate, at the end of each reporting period.
Capital work-in-progress is stated at cost. When commissioned, capital work-in-progress is transferred to property and equipment or intangible assets and depreciated or amortised in accordance with Group policies.
An asset’s carrying amount is written down immediately to its recoverable amount if the asset’s carrying amount is greater than its estimated recoverable amount (Note 2.7).
Gains and losses on disposals are determined by comparing the proceeds with the carrying amount and are recognised within the consolidated income statement.
Specific borrowing costs directly attributable to the construction of qualifying assets, which are assets that necessarily take a substantial period of time to get ready for their intended use or sale, are added to the cost of those assets, until such time as the assets are substantially ready for their intended use or sale. All other borrowing costs are recognised in the consolidated income statement in the period in which they are incurred.
2.6INTANGIBLE ASSETS(a) GoodwillGoodwill arises on the acquisition of subsidiaries and represents the excess of the consideration transferred over the Parent Company’s interest in net fair value of the net identifiable assets, liabilities and contingent liabilities of the acquiree and the fair value of the non-controlling interest in the acquiree.
For the purpose of impairment testing, goodwill acquired in a business combination is allocated to each of the Cash Generating Units (“CGUs”), or Groups of CGUs, that is expected to benefit from the synergies of the combination. Each unit or Group of units to which the goodwill is allocated represents the lowest level within the entity at which the goodwill is monitored for internal management purposes. Goodwill is monitored at the operating segment level.

037
NOTES TO THE CONSOLIDATED FINANCIAL STATEMENTSFOR THE YEAR ENDED 31 DECEMBER 2014
Annual Report
Goodwill impairment reviews are undertaken annually or more frequently if events or changes in circumstances indicate a potential impairment. The carrying value of goodwill is compared to the recoverable amount, which is the higher of value in use and the fair value less costs of disposal. Any impairment is recognised immediately as an expense and is not subsequently reversed.
(b) Trade names Trade names are shown at historical cost. Trade names acquired in a business combination are recognised at fair value at the acquisition date. Trade names have infinite lives and are not amortised due to the minimal cost of renewal.
(c) Customer relationshipsAcquired contractual customer relationships are initially recognised at fair value at the time of acquisition and subsequently carried at cost less accumulated amortisation. The contractual customer relationships have a finite useful life. Amortisation is calculated using the straight-line method to allocate the cost of customer relationships over its estimated useful life of 10 years, which is the estimated period of benefit.
(d) Orders backlogAcquired orders backlog is arrived at by calculating the present value of the expected future economic benefits to arise from those orders after deducting the contributory asset charge. Subsequently, orders backlog is carried at cost less accumulated amortisation. Amortisation is calculated using the straight-line method to allocate the cost of orders backlog over its estimated useful life of 4 years, which is the estimated period of benefit.
2.7IMPAIRMENT OF NON-FINANCIAL ASSETSAssets that have an indefinite useful life – for example, goodwill or intangible assets not ready to use – are not subject to amortisation and are tested annually for impairment. Assets that are subject to amortisation/depreciation are reviewed for impairment whenever events or changes in circumstances indicate that the carrying amount may not be recoverable. An impairment loss is recognised for the amount by which the asset’s carrying amount exceeds its recoverable amount. The recoverable amount is the higher of an asset’s fair value less costs to sell and value in use. For the purposes of assessing impairment, assets are grouped at the lowest levels for which there are largely independent cash inflows (cash-generating units). Prior impairments of non-financial assets (other than goodwill) are reviewed for possible reversal at each reporting date.
2.8FINANCIAL ASSETS
2.8.1CLASSIFICATIONThe Group classifies its financial assets in the following categories: at fair value through profit or loss, loans and receivables, available-for-sale and held-to-maturity. The classification depends on the purpose for which the financial assets were acquired. Management determines the classification of its financial assets at initial recognition.
(a) Financial assets at fair value through profit or lossFinancial assets at fair value through profit or loss are financial assets held for trading. A financial asset is classified in this category if acquired principally for the purpose of selling in the short term. Assets in this category are classified as current assets if expected to be settled within 12 months, otherwise they are classified as non-current.
(b) Loans and receivablesLoans and receivables are non-derivative financial assets with fixed or determinable payments that are not quoted in an active market. They are included in current assets, except for maturities greater than 12 months after the end of the reporting period. These are classified as non-current assets. The Group’s loans and receivables comprise ‘trade and other receivables’, ‘due from related parties’, and ‘cash and cash equivalents’ in the balance sheet (Notes 8, 21 and 14 respectively).
(c) Available-for-sale financial assetsAvailable-for-sale financial assets are non-derivatives that are either designated in this category or not classified in any of the other categories. They are included in non-current assets unless the investment matures or management intends to dispose of it within 12 months of the end of the reporting period.
2.8.2 RECOGNITION AND MEASUREMENTRegular purchases and sales of financial assets are recognised on the trade-date – the date on which the Group commits to purchase or sell the asset. Investments are initially recognised at fair value plus transaction costs for all financial assets not carried at fair value through profit or loss. Financial assets carried at fair value through profit or loss are initially recognised at fair value, and transaction costs are expensed in the consolidated income statement. Financial assets are derecognised when the rights to receive cash flows from the investments have expired or have been transferred and the Group has transferred substantially all risks and rewards of ownership. Available-for- sale financial assets and financial assets at fair value through profit or loss are subsequently carried at fair value. Loans and receivables are subsequently carried at amortised cost using the effective interest method.
Gains or losses arising from changes in the fair value of the ‘financial assets at fair value through profit or loss’ category are presented in the consolidated income statement within ‘other gain/(losses)’ in the period in which they arise. Dividend income from financial assets at fair value through profit or loss is recognised in the consolidated income statement as part of other income when the Group’s right to receive payments is established.
When securities classified as available for sale are sold or impaired, the accumulated fair value adjustments recognised in equity are included in the consolidated income statement as ‘Gains and losses from investment securities’.
Interest on available-for-sale securities calculated using the effective interest method is recognised in the consolidated income statement as part of other income. Dividend on available-for-sale equity instruments are recognised in the consolidated income statement as part of other income when the Group’s right to receive payments is established.

038
NOTES TO THE CONSOLIDATED FINANCIAL STATEMENTSFOR THE YEAR ENDED 31 DECEMBER 2014
Annual Report
2.9IMPAIRMENT OF FINANCIAL ASSETS(a) Assets carried at amortised costThe Group assesses at the end of each reporting period whether there is objective evidence that a financial asset or Group of financial assets is impaired. A financial asset or a group of financial assets is impaired and impairment losses are incurred only if there is objective evidence of impairment as a result of one or more events that occurred after the initial recognition of the asset (a ‘loss event’) and that loss event (or events) has an impact on the estimated future cash flows of the financial asset or group of financial assets that can be reliably estimated.
Evidence of impairment may include indications that the debtors or a group of debtors is experiencing significant financial difficulty, default or delinquency in interest or principal payments, the probability that they will enter bankruptcy or other financial reorganisation, and where observable data indicate that there is a measurable decrease in the estimated future cash flows, such as changes in arrears or economic conditions that correlate with defaults.
For loans and receivables category, the amount of the loss is measured as the difference between the asset’s carrying amount and the present value of estimated future cash flows (excluding future credit losses that have not been incurred) discounted at the financial asset’s original effective interest rate. The carrying amount of the asset is reduced and the amount of the loss is recognised in the consolidated income statement. If a loan or held-to-maturity investment has a variable interest rate, the discount rate for measuring any impairment loss is the current effective interest rate determined under the contract. As a practical expedient, the Group may measure impairment on the basis of an instrument’s fair value using an observable market price.
If, in a subsequent period, the amount of the impairment loss decreases and the decrease can be related objectively to an event occurring after the impairment was recognised (such as an improvement in the debtor’s credit rating), the reversal of the previously recognised impairment loss is recognised in the consolidated income statement.
(b) Assets classified as available-for-saleThe Group assesses at the end of each reporting period whether there is objective evidence that a financial asset or a Group of financial assets is impaired.
For debt securities, if any such evidence exists the cumulative loss – measured as the difference between the acquisition cost and the current fair value, less any impairment loss on that financial asset previously recognised in profit or loss – is removed from equity and recognised in profit or loss. If, in a subsequent period, the fair value of a debt instrument classified as available for sale increases and the increase can be objectively related to an event occurring after the impairment loss was recognised in profit or loss, the impairment loss is reversed through the consolidated income statement.
For equity investments, a significant or prolonged decline in the fair
value of the security below its cost is also evidence that the assets are impaired. If any such evidence exists the cumulative loss – measured as the difference between the acquisition cost and the current fair value, less any impairment loss on that financial asset previously recognised in profit or loss – is removed from equity and recognised in profit or loss. Impairment losses recognised in the consolidated income statement on equity instruments are not reversed through the consolidated income statement.
2.10 OFFSETTING FINANCIAL INSTRUMENTS Financial assets and liabilities are offset and the net amount reported in the balance sheet when there is a legally enforceable right to offset the recognised amounts and there is an intention to settle on a net basis or realise the asset and settle the liability simultaneously. The legally enforceable right must not be contingent on future events and must be enforceable in the normal course of business and in the event of default, insolvency or bankruptcy of the company or the counterparty.
2.11DERIVATIVE FINANCIAL INSTRUMENTS AND HEDGING ACTIVITIESDerivatives are initially recognised at fair value on the date the derivative contract is entered into and are subsequently re-measured at their fair value. The method of recognising the resulting gain or loss depends on whether the derivative is designated as a hedging instrument, and if so, the nature of the item being hedged. The Group designates certain derivatives as hedges of a particular risk associated with a recognised asset or liability (cash flow hedge).
The Group does not document at the inception of the transaction the relationship between hedging instruments and hedged items, as well as its risk management objectives and strategy for undertaking various hedging transactions. The Group does not also document its assessment, both at hedge inception and on an ongoing basis, of whether the derivatives that are used in hedging transactions are highly effective in offsetting changes in fair values or cash flows of hedged items. Accordingly, the derivative is not designated as a hedging instrument
The full fair value of a derivative is classified as a non-current asset or liability when the remaining maturity of the hedged item is more than 12 months and as current asset or liability when the remaining maturity of the hedged item is less than 12 months. Trading derivatives are classified as a current asset or liability.
The gain or loss relating to the change in fair value is recognised immediately in the consolidated income statement within “Other gain/(losses)”.
2.12 INVESTMENT PROPERTYProperty that is held for long-term rental yields or for capital appreciation or both, and that is not occupied by the companies in the Group, is classified as investment property. Investment property also includes property that is being constructed or developed for future use as investment property.

039
NOTES TO THE CONSOLIDATED FINANCIAL STATEMENTSFOR THE YEAR ENDED 31 DECEMBER 2014
Annual Report
Investment property is measured initially at its cost, including related transaction costs and where applicable borrowing costs. After initial recognition, investment property is carried at fair value. The fair value of investment property reflects, among other things, rental income from current leases and other assumptions market participants would make when pricing the property under current market conditions.
Subsequent expenditure is capitalised to the asset’s carrying amount only when it is probable that future economic benefits associated with the expenditure will flow to the Group and the cost of the item can be measured reliably. All other repairs and maintenance costs are expensed when incurred. When part of an investment property is replaced, the carrying amount of the replaced part is derecognised.
Changes in fair values are recognised in the consolidated income statement. Investment properties are derecognised when they have been disposed.
Where the Group disposes of a property at fair value in an arm’s length transaction, the carrying value immediately prior to the sale is adjusted to the transaction price, and the adjustment is recorded in the consolidated income statement within net gain from fair value adjustment on investment property.
If an investment property becomes owner-occupied, it is reclassified as property and equipment. Its fair value at the date of reclassification becomes its cost for subsequent accounting purposes.
Where an investment property undergoes a change in use, evidenced by commencement of development with a view to sale, the property is transferred to development properties. A property’s deemed cost for subsequent accounting as development properties is its fair value at the date of change in use.
2.13 DEVELOPMENT PROPERTIESProperties acquired, constructed or in the course of construction for sale are classified as development properties. Such properties are stated at the lower of cost and net realisable value. The cost of development properties includes the cost of land and other related expenditure which are recognised as and when activities that are necessary to get the properties ready for sale are in progress. Net realisable value represents the estimated selling price less costs to be incurred in completing and selling the property. Any gains or losses on sale of development properties are included in other gain/(losses).
2.14 INVENTORIESInventories are stated at the lower of cost and net realisable value. Cost is determined using the weighted average method. Net realisable value is the estimated selling price in the ordinary course of business, less applicable variable selling expenses.
2.15 TRADE RECEIVABLESTrade receivables are amounts due from customers for billing in the ordinary course of business for construction contracts. If collection is expected in one year or less (or in the normal operating cycle of the business if longer), they are classified as current assets. If not, they are presented as non-current assets.
Trade and other receivables are recognised initially at fair value and subsequently measured at amortised cost using the effective interest method, less provision for impairment.
A provision for impairment of trade receivables is established when there is objective evidence that the Group will not be able to collect all amounts due according to the original terms of receivables. The amount of the provision is the difference between the asset’s carrying amount and the present value of estimated future cash flows, discounted at the original effective interest rate.
The carrying amount of the asset is reduced through the use of an allowance account, and the amount of the loss is recognised in the consolidated income statement within “General and administrative expenses”. When a trade receivable is uncollectible, it is written off against the allowance account for trade receivables. Subsequent recoveries of amounts previously written off are credited to the consolidated income statement.
2.16CASH AND CASH EQUIVALENTSIn the consolidated statement of cash flows, cash and cash equivalents include cash in hand, deposits held at call with banks, other short-term highly liquid investments with original maturities of three months or less and bank overdrafts. In the consolidated balance sheet, bank overdrafts are shown within bank borrowings in current liabilities.
2.17SHARE CAPITALOrdinary shares are classified as equity.
Incremental costs directly attributable to the issue of new ordinary shares or options are shown in equity as a deduction, net of tax, from the proceeds.
Where any Group company purchases the Company’s equity share capital (treasury shares), the consideration paid, including any directly attributable incremental costs (net of income taxes) is deducted from equity attributable to the Company’s equity holders until the shares are cancelled or reissued.
Where such ordinary shares are subsequently reissued, any consideration received, net of any directly attributable incremental transaction costs and the related income tax effects, is included in equity attributable to the Company’s equity holders.
2.18 TRADE PAYABLESTrade payables are obligations to pay for goods or services that have been acquired in the ordinary course of business from suppliers. Trade payables are classified as current liabilities if payment is due within one year or less (or in the normal operating cycle of the business if longer). If not, they are presented as non-current liabilities.
Trade payables are recognised initially at fair value and subsequently measured at amortised cost using the effective interest method.

040
NOTES TO THE CONSOLIDATED FINANCIAL STATEMENTSFOR THE YEAR ENDED 31 DECEMBER 2014
Annual Report
2.19 PROVISIONSProvisions are recognised when the Group has a present legal or constructive obligation as a result of past events, it is probable that an outflow of resources embodying economic benefits will be required to settle the obligation, and a reliable estimate of the amount can be made. Provisions are not recognised for future operating losses.
Provisions are measured at the present value of the expenditures expected to be required to settle the obligation using a pre-tax rate that reflects current market assessments of the time value of money and risks specific to the obligation. The increase in provisions due to the passage of time are recognised as interest expense. Where there are a number of similar obligations, the likelihood that an outflow will be required in settlement is determined by considering the class of obligations as a whole. A provision is recognised even if the likelihood of an outflow with respect to any one item included in the same class of obligation may be small.
2.20 BANK BORROWINGSBorrowings are recognised initially at fair value, net of transaction costs incurred. Borrowings are subsequently carried at amortised cost; any difference between the proceeds (net of transaction costs) and the redemption value is recognised in the consolidated income statement over the period of the borrowings using the effective interest method.
Fees paid on the establishment of loan facilities are recognised as transaction costs of the loan to the extent that it is probable that some or all of the facility will be drawn down. In this case, the fee is deferred until the draw-down occurs. To the extent there is no evidence that it is probable that some or all of the facility will be drawn down, the fee is capitalised as a pre-payment for liquidity services and amortised over the period of the facility to which it relates.
2.21 CURRENT AND DEFERRED INCOME TAX The tax expense for the period comprises current and deferred tax. Tax is recognised in the consolidated income statement, except to the extent that it relates to items recognised in other comprehensive income or directly in equity. In this case, the tax is also recognised in other comprehensive income or directly in equity, respectively.
The current income tax charge is calculated on the basis of the tax laws enacted or substantively enacted at the balance sheet date in the countries where the company and its subsidiaries operate and generate taxable income. Management periodically evaluates positions taken in tax returns with respect to situations in which applicable tax regulation is subject to interpretation. It establishes provisions where appropriate on the basis of amounts expected to be paid to the tax authorities.
Deferred income tax is recognised, using the liability method, on temporary differences arising between the tax bases of assets and
liabilities and their carrying amounts in the consolidated financial statements.
However, deferred tax liabilities are not recognised if they arise from the initial recognition of goodwill; deferred income tax is not accounted for if it arises from initial recognition of an asset or liability in a transaction other than a business combination that at the time of the transaction affects neither accounting nor taxable profit or loss. Deferred income tax is determined using tax rates (and laws) that have been enacted or substantially enacted by the balance sheet date and are expected to apply when the related deferred income tax asset is realised or the deferred income tax liability is settled.
Deferred income tax assets are recognised only to the extent that it is probable that future taxable profit will be available against which the temporary differences can be utilised.
Deferred income tax liabilities are provided on taxable temporary differences arising from investments in subsidiaries, associates and joint arrangements, except for deferred income tax liability where the timing of the reversal of the temporary difference is controlled by the Group and it is probable that the temporary difference will not reverse in the foreseeable future. Generally the Group is unable to control the reversal of the temporary difference for associates. Only where there is an agreement in place that gives the group the ability to control the reversal of the temporary difference not recognised.
Deferred income tax assets are recognised on deductible temporary differences arising from investments in subsidiaries, associates and joint arrangements only to the extent that it is probable the temporary difference will reverse in the future and there is sufficient taxable profit available against which the temporary difference can be utilised.
Deferred income tax assets and liabilities are offset when there is a legally enforceable right to offset current tax assets against current tax liabilities and when the deferred income taxes assets and liabilities relate to income taxes levied by the same taxation authority on either the same taxable entity or different taxable entities where there is an intention to settle the balances on a net basis.
2.22 BORROWING COSTSGeneral and specific borrowing costs directly attributable to the acquisition, construction or production of qualifying assets, which are assets that necessarily take a substantial period of time to get ready for their intended use or sale, are added to the cost of those assets, until such time as the assets are substantially ready for their intended use or sale.
Investment income earned on the temporary investment of specific borrowings pending their expenditure on qualifying assets is deducted from the borrowing costs eligible for capitalisation.
All other borrowing costs are recognised in profit or loss in the period in which they are incurred.

041
NOTES TO THE CONSOLIDATED FINANCIAL STATEMENTSFOR THE YEAR ENDED 31 DECEMBER 2014
Annual Report
2.23 EMPLOYEE BENEFITSA provision is made for the estimated liability for employees’ entitlements to annual leave and related benefits as a result of services rendered by the employees up to the balance sheet date. Provision is also made, using actuarial techniques, for the end of service benefits due to employees in accordance with the Labour Laws applicable in the countries in which the Group operates, for their periods of service up to the balance sheet date.
The provision relating to annual leave and leave passage is disclosed as a current liability and included in trade and other payables, while that relating to end of service benefits is disclosed as a non-current liability.
Actuarial gains and losses arising from experience adjustments and changes in assumptions are charged or credited to equity in the other comprehensive income in the period in which they arise. Past-service costs are recognised immediately in consolidated income statement.
2.24 CONTRACT REVENUEContract revenue is recognised under the percentage-of-completion method. When the outcome of the contract can be reliably estimated, revenue is recognised by reference to the proportion that accumulated costs up to the year end bear to the estimated total costs of the contract. When the contract is at an early stage and its outcome cannot be reliably estimated, revenue is recognised to the extent of costs incurred up to the year end which are considered recoverable.
Revenue related to variation orders is recognised when it is probable that the customer will approve the variation and the amount of revenue arising from the variation can be reliably measured.
A claim is recognised as contract revenue when settled or when negotiations have reached an advanced stage such that it is probable that the customer will accept the claim and the amount can be measured reliably.
Losses on contracts are assessed on an individual contract basis and provision is made for the full amount of the anticipated losses, including any losses relating to future work on a contract, in the period in which the loss is first foreseen.
The aggregate of the costs incurred and the profit/loss recognised on each contract is compared against progress billings at the year end. Where the sum of the costs incurred and recognised profit or recognised loss exceeds the progress billings, the balance is shown under trade and other receivables as amounts due from customers on contracts. Where the progress billings exceed the sum of costs incurred and recognised profit or recognised loss, the balance is shown under trade and other payables as amounts due to customers on contracts.
In determining contract costs incurred up to the year end, any
amounts incurred including advances paid to suppliers and advance billings received from subcontractors relating to future activity on a contract are excluded and are presented as amounts due from customers on contracts.
2.25 INTEREST INCOMEInterest income is recognised in the consolidated income statement on a time proportion basis using the effective interest method.
2.26 DIVIDEND INCOMEDividend income is recognised when the right to receive payment is established.
2.27 LEASESLeases in which a significant portion of the risks and rewards of ownership are retained by the lessor are classified as operating leases. Payments made under operating leases (net of any incentives received from the lessor) are charged to the income statement on a straight-line basis over the period of the lease.
2.28 DIVIDEND DISTRIBUTIONDividend distribution to the Group’s shareholders is recognised as a liability in the Group’s financial statements in the period in which the dividends are approved by the Group’s shareholders.

042
NOTES TO THE CONSOLIDATED FINANCIAL STATEMENTSFOR THE YEAR ENDED 31 DECEMBER 2014
Annual Report
3FINANCIAL RISK MANAGEMENT
3.1 FINANCIAL RISK FACTORS The Group’s activities expose it to a variety of financial risks: market risk (including currency risk, fair value interest rate risk, cash flow interest rate risk and price risk), credit risk and liquidity risk. These risks are evaluated by management on an ongoing basis to assess and manage critical exposure. The Group’s liquidity and market risks are managed as part of the Group’s treasury activities. Treasury operations are conducted within a framework of established policies and procedures.
(a) Market risk(i) Foreign exchange riskThe Group’s foreign currency monetary assets and liabilities are denominated mainly in Saudi Arabian Riyals, Qatari Riyals, Euro, Kuwaiti Dinars, Omani Riyal, Indian Rupee, Jordanian Dinar, and Algerian Dinar.
As Saudi Arabian Riyals, Qatari Riyals, Omani Riyals and United Arab Emirates Dirhams (AED) are pegged to US Dollars, the sensitivity considers the effect of a reasonably possible movement of the AED currency rate against the Euro, Kuwaiti Dinars, Indian Rupee, Algerian Dinars, Jordanian Dinars, and Thailand Baht with all other variables held constant, on the consolidated statement of income (due to the fair value of currency sensitive monetary assets and liabilities).
At 31 December 2014, if these six currencies had weakened/strengthened by 5% against the AED, the profit for the year would have been higher/lower by AED 903 thousand (2013: AED 1,478 thousand).
(ii) Price riskThe Group is not exposed to equity security price risk. Its investments classified on balance sheet as available-for-sale are carried at cost and investments classified as fair value through profit or loss are not material.
(iii) Cash flow and fair value interest rate riskThe Group holds its surplus funds in short term bank deposits. During the year ended
31 December 2014, if interest rates on deposits had been 0.5% higher/lower, the interest income would have been higher/lower by AED 2,092 (2013: AED 1,350 thousand).
The Group also earns interest on loans and advances, which are generally at higher than market rates. A 0.5% shift in these interest rates would have resulted in a higher/lower interest income by AED 369 thousand (2013: AED 566 thousand).
The Group’s interest rate risk arises from long-term borrowings. Borrowings issued at variable rates expose the group to cash flow interest rate risk which is partially offset by cash held at variable rates. During the year ended 31 December 2014, if interest rates on borrowings had been 0.5% higher/lower, the interest expense would have been higher/lower by AED 8,318 thousand (2013: AED 6,113 thousand).
(b) Credit riskThe Group has a policy for dealing with customers with an appropriate credit history. The Group has policies that limit the amount of credit exposure to any financial institution and this is regularly monitored.
Credit risk is managed on group basis. Credit risk arises from cash and bank balances, available-for-sale financial assets, financial assets carried at fair value through profit or loss, trade and other receivables and amounts due from related parties.
The table below shows the rating and balance of the major counterparties at the balance sheet date:
2014 2013
Counterparty External rating*
AED’000 External rating*
AED’000
Bank A A1 214,852 A1 497,919
Bank B Ba1 16,301 A1 37,129
Bank C Baa1 363,474 Baa1 12,667
Bank D Baa2 8,093 A1 154
Bank E Baa3 22,633 BB+ 6,188
Bank F Aa3 26,221 A1 -
Bank G A2 58,692 - -
Bank H A3 19,103 - -
Bank I B2 24,625 - -
Bank J Caa2 10 - -
754,004 554,057
*Based on Moody’s ratings
The Group has a formal procedure of monitoring and follow-up of customers for outstanding trade receivables. The Group assesses internally the credit quality of each customer, taking into account its financial position, past experience and other factors.
At 31 December 2014, the Group had a significant concentration of credit risk with ten customers accounting for 45% of the trade receivables (2013: 55%). Management believes that this concentration of credit risk is mitigated as the Group has long-standing relationships with these customers.
The other categories of financial assets do not result in significant credit risk.

043
NOTES TO THE CONSOLIDATED FINANCIAL STATEMENTSFOR THE YEAR ENDED 31 DECEMBER 2014
Annual Report
(c) Liquidity riskPrudent liquidity risk management implies maintaining sufficient cash and the availability of funding through an adequate amount of committed credit facilities. Due to the nature of the underlying business through progress billings, the Group maintains adequate bank balances and credit facilities to fund its operations.
Management monitors the forecast of the Group’s liquidity position on the basis of expected cash flow.
The Group is currently financed from shareholders’ equity and bank borrowings. The table below analyses the Group’s non-derivative financial liabilities into relevant maturity groupings based on the remaining period at the balance sheet date to the contractual maturity date. The amounts disclosed in the table are the contractual undiscounted cash flows:
Less than 1 yearAED’000
Between 1 year and 2 years
AED’000
Between 2 years and 5 years
AED’000
TotalAED’000
At 31 December 2014
Bank borrowings 1,698,100 88,966 533,115 2,320,181
Trade payables and accruals 2,013,146 - - 2,013,146
Due to related parties 128,350 - - 128,350
At 31 December 2013
Bank borrowings 1,071,174 22,367 30,161 1,123,702
Trade payables and accruals 2,035,469 - - 2,035,469
Due to related parties 19,445 - - 19,445
3.2CAPITAL MANAGEMENTThe Group’s objectives when managing capital are to safeguard the Group’s ability to continue as a going concern in order to provide returns for shareholders and benefits for other stakeholders and to maintain an optimal capital structure to reduce the cost of capital.
In order to maintain or adjust the capital structure, the Group may adjust the dividend paid to shareholders or manage its working capital requirements. Consistent with others in the industry, the Group monitors capital on the basis of the gearing ratio. This ratio is calculated as net debt divided by total capital.
Net debt is calculated as total borrowings (including current and non-current borrowings as shown in the consolidated balance sheet) less cash and bank balances (including short term deposits). Total capital is calculated as ‘Total equity’ as shown in the consolidated balance sheet plus net debt.
The gearing ratios at 31 December 2014 and 2013 were as follows:
2014AED’000
2013AED’000
Total borrowings (Note 18) 2,210,683 1,116,470
Less: Cash and bank balances (Note 14) (758,120) (558,217)
Net debt 1,452,563 558,253
Total equity 3,075,986 2,974,826
Total capital 4,528,549 3,533,079
Gearing ratio 32% 16%
The gearing ratio has increased by 16% compared to last year due to the increase in net debt.
3.3FAIR VALUE ESTIMATIONThe table below analyses financial instruments carried at fair value, by valuation method. The different levels have been defined as follows:
• Quoted prices (unadjusted) in active markets for identical assets or liabilities (Level 1);
• Inputs other than quoted prices included within level 1 that are observable for the asset or liability, either directly (that is, as prices) or indirectly (that is, derived from prices) (Level 2); and
• Inputs for the asset or liability that are not based on observable market data (that is, unobservable inputs) (Level 3).
The Group’s financial assets at fair value through profit or loss are based on net asset values provided by the fund managers. The fair market value of these investments, as indicated by the fund managers are based on:
a. For listed investments, current bid prices in an active market; and
b. For unlisted investments, valuations based on fundamentals and rationale of the portfolio performed by independent valuers.

044
NOTES TO THE CONSOLIDATED FINANCIAL STATEMENTSFOR THE YEAR ENDED 31 DECEMBER 2014
Annual Report
The following table presents the Group’s assets that are measured at fair value at 31 December 2014. See Note 10 for disclosures of the investment property that is measured at fair value.
Level 1AED’000
Level 2AED’000
Level 3AED’000
TotalAED’000
31 December 2014
ASSETSFinancial assets at fair value through profit or loss
Investment in Real Estate fund
- 5,368 - 5,368
Available-for-sale financial assets
Equity securities 2,358 - 753 3,111
Total assets 2,358 5,368 753 8,479
The following table presents the Group’s assets that are measured at fair value at 31 December 2013.
Level 1AED’000
Level 2AED’000
Level 3AED’000
TotalAED’000
31 December 2013
ASSETSFinancial assets at fair value through profit or loss
Investment in Real Estate fund
- 4,678 - 4,678
Available-for-sale financial assets
Equity securities 2,358 - 753 3,111
Total assets 2,358 4,678 753 7,789
The Group has no liabilities measured at fair value at 31 December 2014 and 2013.
There were no transfers between Levels 1, 2 and 3 during the period.
(a) Financial instruments in Level 2The fair value of financial instruments that are not traded in an active market is determined by using valuation techniques. These valuation techniques maximise the use of observable market data where it is available and rely as little as possible on entity specific estimates. If all significant inputs required to fair value an instrument are observable, the instrument is included in level 2.
If one or more of the significant inputs is not based on observable market data, the instrument is included in Level 3.
Specific valuation techniques used to value level 2 and level 3 financial instruments include:
• Quoted market prices or dealer quotes for similar instruments;
• The fair value of interest rate swaps is calculated as the present value of the estimated future cash flows based on observable yield curves;
• Other techniques, such as discounted cash flow analysis, are used to determine fair value for the remaining financial instruments.
4CRITICAL ACCOUNTING ESTIMATES AND JUDGEMENTSEstimates and judgements are continually evaluated and are based on historical experience and other factors, including expectations of future events that are believed to be reasonable under the circumstances.
4.1CRITICAL ACCOUNTING ESTIMATES AND ASSUMPTIONS The Group makes estimates and assumptions concerning the future. The resulting accounting estimates will, by definition, seldom equal the related actual results. The estimates and assumptions that have a significant risk of causing a material adjustment to the carrying amounts of assets and liabilities within the next financial year are addressed below.
(a) Estimated impairment of goodwillAsset recoverability is an area involving management judgement, requiring assessment as to whether the carrying value of assets can be supported by the net present value of future cash flows derived from such assets using cash flow projections which have been discounted at an appropriate rate.
In calculating the net present value of the future cash flows, certain assumptions are required to be made in respect of the impairment reviews. The key assumptions on which management has based its cash flow projections when determining the recoverable amount of the assets are as follows:
• Management’s projections have been prepared on the basis of strategic plans, knowledge of the market, and management’s views on achievable growth in market share over the long term period of four years;
• The discount rates applied to cash flows are based on the Group’s weighted average cost of capital with a risk premium reflecting the relative risks in the markets in which the businesses operate; and
• Growth rate estimates are based on a conservative view of the long-term rate of growth.

045
NOTES TO THE CONSOLIDATED FINANCIAL STATEMENTSFOR THE YEAR ENDED 31 DECEMBER 2014
Annual Report
The key assumptions used for value-in-use calculations in 2014 are as follows:
• Growth rate: 5% to 10%,
• Discount rate: 11.4%,
• Terminal growth rate: 4%
The value-in-use of goodwill is higher than its carrying value and therefore no impairment loss exists at the year-end. Any sensitivity applied to the key assumptions above will have no significant impact on the value-in-use.
(b) Revenue recognitionThe percentage-of-completion method is used to account for construction contracts. This method requires estimates of the final revenue and costs of the contract, as well as measurement of progress achieved to date as a proportion of the total work to be performed in accordance with the accounting policy set out in Note 2.20. As a result, the Group is required to estimate the total cost to completion of all outstanding projects at each period end. The application of a 5% sensitivity to management estimates of the total costs to completion of all outstanding projects at 31 December 2014 would result in the revenue and profit increasing/decreasing by AED 352 million (31 December 2013: increasing/decreasing by AED 377 million).
The main uncertainty when assessing contract revenue is related to recoverable amounts from variation orders, claims and incentive payments which are recognised when, in the group’s judgement, it is probable that they will result in revenue and are measurable. This assessment is adjusted upon management’s evaluation of liquidated damages to be imposed by customers typically relating to contractual delivery terms. In many projects there are frequent changes in scope of work resulting in a number of variation orders. Normally contracts with customers include procedures for presentation of and agreement of variation orders. At any point in time, there will be unapproved variation orders and claims included in the project revenue where recovery is assessed as probable and other criteria are met. Even though management has extensive experience in assessing the outcome of such negotiations, uncertainties exist.
Cost to complete depends on productivity factors and the cost of inputs. The performance of subcontractors and others with an impact on schedules, commodity prices and currency rates can all affect cost estimates. Experience, systematic use of the project execution model and focus on core competencies reduces but does not eliminate the risk that estimates may change significantly. A risk contingency is included in project cost based on the risk register that is prepared for every project.
Progress measurement based on costs has an inherent risk related to the cost estimate as described above. In situations where cost is not seen to properly reflect actual progress, alternative measures such as hours or plan progress are used to achieve more precise revenue recognition.
The estimation uncertainty during the early stages of a contract is mitigated by a policy of normally not recognising revenue in excess of costs on large projects before the contract reaches 20% completion. However, management can on a project-by-project basis give approval of earlier recognition if cost estimates are considered reliable. Cost estimates can be considered reliable in situations of repeat projects, proven technology, proven execution model or when committed costs are high so there is low risk of material changes to the cost estimates.
The application of these policies requires management to apply judgement in estimating the total revenue and total costs expected on each project. Such estimates are revised as a project progresses to reflect the current status of the project and the latest information available to management. Project management teams perform regular reviews to ensure the latest estimates are appropriate. In the management’s view, one of the projects awarded to a subsidiary of the Group is subject to estimation uncertainty, the outcome of which could have a material impact on the consolidated financial statements. The completion of the project is currently scheduled to occur during the third quarter of 2015. The project is delayed and costs have increased due to, among other factors, changes to the project, and third party actions in furnishing design, equipment and materials, all of which have directly and adversely impacted the cost and timing of work on the project.
If the change orders and claims’ final approved amount was 32% below their actual cost incurred up to 31 December 2014, an amount of AED 176 million would be decreased from gross profit, contract revenue and amount due from customers on contracts and accordingly the Group would achieve a break even on this project. Further reductions in approved change orders and claims’ value would result in an onerous contract where management would be required to recognise losses including the cost to complete that will be incurred subsequent to the year end.
(c) Impairment of trade and other receivablesThe impairment charge reflects estimates of losses arising from the failure or inability of the parties concerned to make the required payments. Management’s judgement is required in evaluating customers’ debts to determine if they will be collected. The charge is based on the ageing of the customer accounts, the customer’s credit worthiness and the historic write-off experience. Changes to the estimated impairment charge may be required if the financial condition of the customers were to improve or deteriorate. Management considers that the current level of impairment charge is appropriate and consistent with the loss estimated at year end.

046
NOTES TO THE CONSOLIDATED FINANCIAL STATEMENTSFOR THE YEAR ENDED 31 DECEMBER 2014
Annual Report
5SEGMENT REPORTINGInformation regarding the Group’s operating segments is set out below in accordance with IFRS 8 “Operating Segments”. IFRS 8 requires operating segments to be identified on the basis of internal reports about components of the Group that are regularly reviewed by the “Executive management” who are the Chief Operating decision-makers in order to allocate resources to the segment and to assess its performance. Executive management assesses the performance of the operating segments based on revenue.
BUSINESS SEGMENTSFor management purpose, the Group is organised into business units based on their services and has three reportable business segments; Mechanical, Electrical and Plumbing (“Engineering”), Civil, Oil and Gas and others (corporate office).
The Engineering segment carries out contracting work relating to the construction industry, such as mechanical, electrical, plumbing and sanitation work and contracting work relating to the construction industry, such as infrastructure, water treatment plants, district cooling plants and power plants.
The Civil works segment carries out contracting work relating to the construction industry, such as property construction, sanitation work and real estate activities.
Engineering Civil Oil and Gas Other Inter segment elimination
Total
For the year ended 31 December 2014
REVENUE
External customers 2,506,484 1,829,058 269,433 157,289 - 4,762,264
Inter- segment 447,375 18,510 - 21,837 (487,722) -
2,953,859 1,847,568 269,433 179,126 (487,722) 4,762,264
Segment profit / (loss) 72,225 (84,733) 52,092 61,088 - 100,672
Depreciation and amortisation 29,496 22,054 16,095 40,720 - 108,365
Capital expenditure 42,314 32,193 14,615 6,817 - 95,939
At 31 December 2014
Segment total assets 3,927,012 3,120,308 201,942 3,621,297 (2,313,830) 8,556,729
The Oil & Gas segment carries out contracting services relating to design and engineering, procurement of material, fabrication and construction of complete plant and facilities.
Others segment represents corporate office which carries out strategic planning, management of all subsidiaries, treasury management, mergers and acquisition, corporate branding and investor relations. For segment information disclosure, goodwill and other intangible assets and their amortisation are disclosed under the relevant segment.
Sales between segments are carried out at agreed terms. The revenue from external parties reported to the Executive management is measured in a manner consistent with that in the consolidated income statement.
The amounts provided to the Executive management with respect to the total assets are measured in a manner consistent with that of the consolidated financial statements. These assets are allocated based on the operations of the segment.
GEOGRAPHICAL SEGMENTSExecutive management considers the geographical distribution of the Group’s operations into three main segments; UAE, Saudi Arabia, Iraq and Others. The Group is presently engaged in carrying out contracting work relating to the construction industry mainly in the United Arab Emirates, Saudi Arabia, Kuwait, Qatar, Egypt, Oman, Germany, Algeria, India, Iraq, and Jordan.
INFORMATION ABOUT BUSINESS SEGMENTS All figures in AED’000

047
NOTES TO THE CONSOLIDATED FINANCIAL STATEMENTSFOR THE YEAR ENDED 31 DECEMBER 2014
Annual Report
Engineering Civil Oil and Gas Other Inter segment elimination
Total
For the year ended 31 December 2013
REVENUE
External customers 2,320,896 2,010,900 430,245 117,148 - 4,879,189
Inter- segment 334,088 5,740 - 254 (340,082) -
2,654,984 2,016,640 430,245 117,402 (340,082) 4,879,189
Segment profit / (loss) 94,167 33,571 54,504 (507) - 181,735
Depreciation and amortisation 23,116 18,692 1,478 41,852 - 85,138
Capital expenditure 29,735 46,600 5,975 4,423 - 86,733
At 31 December 2013
Segment total assets 3,185,972 2,647,117 261,917 2,665,938 (1,598,646) 7,162,298
During the year, revenue from one customer amounted to AED 872,258 thousand which exceeded 10% of the Group revenue, was earned through the Civil works segment (year ended 31 December 2013: AED 1,174,361 thousand related to Civil works segment).
INFORMATION ABOUT GEOGRAPHICAL SEGMENTSAll figures in AED’000
UAE Saudi Arabia Iraq OthersIntersegment
eliminationTotal
For the year ended 31 December 2014
Revenue from external customers 1,288,163 1,975,379 243,975 1,254,747 - 4,762,264
For the year ended 31 December 2013
Revenue from external customers 942,915 2,515,880 397,316 1,023,078 - 4,879,189
At 31 December 2014
Non-current assets 2,324,168 313,445 8,260 109,991 (592,205) 2,163,659
At 31 December 2013
Non-current assets 2,223,251 233,424 16,118 81,756 (529,467) 2,025,082

048
NOTES TO THE CONSOLIDATED FINANCIAL STATEMENTSFOR THE YEAR ENDED 31 DECEMBER 2014
Annual Report
6 PROPERTY AND EQUIPMENT
Land and buildingsAED’000
MachineryAED’000
Furniture,fixtures and office
equipmentAED’000
Motor vehiclesAED’000
Capital work-in
progressAED’000
TotalAED’000
COST
At 1 January 2013 426,289 120,445 39,004 11,435 16,143 613,316
Additions 8,626 49,214 17,740 9,051 2,102 86,733
Disposals (27,856) (3,979) (926) (659) (670) (34,090)
Currency translation differences (1,482) 787 750 350 (769) (364)
At 31 December 2013 405,577 166,467 56,568 20,177 16,806 665,595
Additions 6,825 32,013 36,131 9,389 11,581 95,939
Disposals (394) (3,416) (2,787) (1,239) - (7,836)
Currency translation differences 120 (1,421) 15 (93) (386) (1,765)
At 31 December 2014 412,128 193,643 89,927 28,234 28,001 751,933

049
NOTES TO THE CONSOLIDATED FINANCIAL STATEMENTSFOR THE YEAR ENDED 31 DECEMBER 2014
Annual Report
Land and buildingsAED’000
MachineryAED’000
Furniture,fixtures and office
equipmentAED’000
Motor vehiclesAED’000
Capital work-in
progressAED’000
TotalAED’000
ACCUMULATED DEPRECIATIONAt 1 January 2013 32,313 61,249 17,975 (2,421) - 109,116
Charge for the year 8,872 23,768 10,252 4,496 - 47,388
Disposals (276) (2,072) (225) (270) - (2,843)
Currency translation differences (432) 700 686 300 - 1,254
At 31 December 2013 40,477 83,645 28,688 2,105 - 154,915
Charge for the year 9,984 25,224 29,709 5,698 - 70,615
Disposals (280) (3,343) (2,148) (1,168) - (6,939)
Currency translation differences 90 (1,247) 7 (46) - (1,196)
At 31 December 2014 50,271 104,279 56,256 6,589 - 217,395
NET BOOK VALUEAt 31 December 2014 361,857 89,364 33,671 21,645 28,001 534,538
At 31 December 2013 365,100 82,822 27,880 18,072 16,806 510,680
The depreciation charge has been allocated in the consolidated income statement as follows:
2014AED’000
2013AED’000
Contract costs (Note 24) 53,586 29,269
General and administrative expenses (Note 25) 17,029 18,119
70,615 47,388
Capital work-in-progress represents ERP license and implementation costs and other assets under construction.

050
NOTES TO THE CONSOLIDATED FINANCIAL STATEMENTSFOR THE YEAR ENDED 31 DECEMBER 2014
Annual Report
7 INTANGIBLE ASSETS
Goodwill AED’000
Trade name
AED’000
Customer relationships
AED’000
Orders backlog AED’000
Total AED’000
AED’000 AED’000 AED’000 AED’000 AED’000
COST
At 31 December 2013 and 2014 844,447 86,246 335,552 16,779 1,283,024
AMORTISATION
At 1 January 2013 - - 138,415 8,390 146,805
Charge for the year - - 33,555 4,195 37,750
At 31 December 2013 171,970 12,585 184,555
Charge for the year - - 33,556 4,194 37,750
At 31 December 2014 - - 205,526 16,779 222,305
NET BOOK VALUE
At 31 December 2014 844,447 86,246 130,026 - 1,060,719
At 31 December 2013 844,447 86,246 163,582 4,194 1,098,469
The business units considered as Cash Generating Units (“CGUs”) of the Group, for the purposes of assessment of impairment in the value of goodwill, are Mechanical, Electrical and Plumbing (“MEP”), Infrastructure, Water and Power (“IWP”) and Civil.
The key assumptions used for value-in-use calculations in 2014 are as follows:
The recoverable amounts of CGUs have been determined based on their value-in-use, calculated using cash flows projections based on the financial budgets approved by management covering a period of
5 years. The discount rate applied is 11.4% (2013: 11.4%).
The other key assumptions used in the value-in-use calculations are as follows:
Budgeted gross margins: The basis used to determine the value assigned to the budgeted gross margin is the average gross margin achieved in the year immediately before the budgeted year, adjusted for expected efficiency improvements, price fluctuations and manpower costs.
Discount rate: These represent the weighted average cost of capital for the cash generating units adjusted for the respective geographical risk factors.
Cost inflation: The basis used to determine cost inflation is the forecast general price
index during the budget year for the cash generating units.
Terminal growth rate: The terminal growth rate has been assumed to be 4% (2013: 3.55%). In management’s view, the terminal growth rate is the minimum growth rate expected to be achieved beyond the five year period.

051
NOTES TO THE CONSOLIDATED FINANCIAL STATEMENTSFOR THE YEAR ENDED 31 DECEMBER 2014
Annual Report
8 TRADE AND OTHER RECEIVABLES
2014 AED’000
2013AED’000
NON-CURRENTTrade receivables and retentions 239,766 224,257
Less: fair value adjustment (12,116) (11,754)
At 31 December 227,650 212,503
CURRENTTrade receivables and retentions 1,751,067 1,632,912
Prepayments and other receivables 453,622 339,302
Amount due from customers on contracts
3,287,582 2,218,370
Loans and advances 85,549 132,099
5,577,820 4,322,683
Less: provision for impairment (103,645) (66,360)
5,474,175 4,256,323
Amounts due from customers on contracts comprise:
Costs incurred to date 15,024,630 10,592,643
Recognised profits 1,434,435 1,217,354
16,459,065 11,809,997
Less: Progress billings (13,171,483) (9,591,627)
3,287,582 2,218,370
An analysis of trade receivables and retentions is as follows:
Fully performing 1,499,052 1,479,653
Past due but not impaired 388,136 311,156
Impaired 103,645 66,360
1,990,833 1,857,169
Trade receivables that are less than six months past due are generally not considered impaired. As of 31 December 2014, trade receivables and retentions of AED 388,136 thousand (2013: AED 311,156 thousand) were past due but not impaired. These relate to a number of independent customers for whom there is no recent history of default.
The ageing analysis of these trade receivables and retentions is as follows:
2014AED’000
2013 AED’000
Six months to one year past due 203,750 186,553
Over one year past due 184,386 124,603
388,136 311,156
As of 31 December 2014, trade receivables and retentions of AED 103,645 thousand (2013: AED 66,360 thousand) were impaired and provided for. The individually impaired receivables are over one year old and mainly relate to customers who are in a difficult financial situation.
Movement in the provision for impairment of trade receivables and retentions is as follows:
2014AED’000
2013 AED’000
At 1 January 66,360 52,413
Provision for impairment (Note 25) 54,416 25,999
Written off during the year as uncollectible
(17,131) (8,562)
Reversals (Note 25) - (3,490)
At 31 December 103,645 66,360
The creation and release of provision for impaired receivables have been included in ‘General and administrative expenses’ in the consolidated income statement. Amounts charged to the allowance account are generally written off, when there is no expectation of recovering additional cash.

052
NOTES TO THE CONSOLIDATED FINANCIAL STATEMENTSFOR THE YEAR ENDED 31 DECEMBER 2014
Annual Report
The gross carrying amount of the Group’s trade receivables and retentions are denominated in the following currencies:
2014AED’000
2013 AED’000
UAE Dirham 816,144 845,056
Saudi Riyal 705,397 686,088
Euro 64,821 50,577
Kuwaiti Dinar 81,467 54,264
US Dollar 91,057 31,641
Others 231,947 189,543
1,990,833 1,857,169
The other classes within trade and other receivables do not contain impaired assets.
Loans and advances carry interest rates at 7.5% per annum.
The maximum exposure to credit risk at the reporting date is the carrying amount of each class of receivable mentioned above which approximates the fair value at the balance sheet date.
ARBITRATIONSDuring the year ended 31 December 2012, the Group had filed arbitrations with certain customers for settlement of the receivables, retentions and due from customers on contracts’ balances of AED 58 million, AED 36 million and AED 41.3 million respectively, which related to projects that were completed and handed over to those customers. At that time, the outcome of the arbitrations was uncertain. Management was of the opinion that the balances were fully recoverable. As at 31 December 2012, no provision for impairment was made against these balances of AED 135.3 million.
During the year ended 31 December 2013, the Group reached an amicable resolution with one of the customers for settlement of the receivables, retentions and due from customers on contracts’ balances amounting to AED 48.3 million with appropriate provision being made for potential irrecoverable balance.
During the current year, one of the arbitrations for settlement of the receivables, retentions and due from customers on contracts’ balances amounting to 61 million was not concluded fully in favour of the Group. As a result management has decided to continue pursuing its claims, either in Dubai courts or through a new arbitration. An estimated amount has been provided for against these balances.
At 31 December 2014, the retentions and due from customers on contracts’ balances of AED 8 million and AED 18 million respectively are still under arbitration. As at the year end, no provision for impairment is made against these balances of AED 26 million as management believes these are fully recoverable.
LITIGATION
During the year ended 31 December 2013, the Group entered into a final settlement agreement of AED 105 million with one customer for a project that was completed and handed over. A payment plan was agreed according to the settlement agreement. During the year ended 31 December 2014, the customer has not fulfilled his obligations as per the agreement.
The Group has filed a lawsuit against the customer. The final outcome of the lawsuit is uncertain since it is at an initial stage. As at 31 December 2014, no provision for impairment is made against this balance of AED 105 million.
CHANGE ORDERS AND CLAIMSDue from customers on contracts include an amount of AED 543 million relating to unapproved change orders and claims recorded in the consolidated statement of income as contract revenue and contract cost in respect of one contract. The amount of the unapproved change orders and the claims represents 15% of the total contract cost incurred to date. The Group has recognised both these costs at no profit margin as Management believes that the unapproved change orders are fully recoverable and that the amount of the claims element included in the aforesaid amount will be at least recoverable at cost. Previous change orders and variations were approved to the extent of 80% of the change orders submitted. In determining the revenue recognised management has considered a conservative estimate of change orders will be approved. The cost to complete has been reasonably estimated by management at the original price of contract taking into account previously agreed contractual rates.

053
NOTES TO THE CONSOLIDATED FINANCIAL STATEMENTSFOR THE YEAR ENDED 31 DECEMBER 2014
Annual Report
9 DEFERRED TAX The gross movement on the deferred income tax assets is as follows:
2014AED’000
2013AED’000
DEFERRED INCOME TAX ASSETS
At 1 January 5,646 17,630
Exchange differences (662) 546
Deferred income tax assets considered not recoverable
- (12,530)
Income statement charge (Note 28) 827 -
At 31 December 5,811 5,646
2014AED’000
2013AED’000
DEFERRED INCOME TAX LIABILITIES
At 1 January 2,414 8,835
Exchange differences - (323)
Income statement charge (Note 28) (261) (6,098)
At 31 December 2,153 2,414
10INVESTMENT PROPERTYThe fair value of investment property was equivalent to the carrying value at balance sheet date.
The following table analyses the non-financial assets carried at fair value, by valuation method.
The different levels have been defined as follows:
• Quoted prices (unadjusted) in active markets for identical assets or liabilities (Level 1).
• Inputs other than quoted prices included within level 1 that are observable for the asset or liability, either directly (that is, as prices) or indirectly (that is, derived from prices) (Level 2).
• Inputs for the asset or liability that are not based on observable market data (that is, unobservable inputs) (Level 3).
Fair value measurements at 31 December 2014 using
Level 1AED’000
Level 2AED’000
Level 3AED’000
Total AED’000
Recurring fair value measurements
Investment property - 29,376 - 29,376
TOTAL ASSETS - 29,376 - 29,376
Fair value measurements at 31 December 2013 using
Level 1AED’000
Level 2AED’000
Level 3AED’000
Total AED’000
Recurring fair value measurements
Investment property - 29,376 - 29,376
TOTAL ASSETS - 29,376 - 29,376 There were no transfers between Levels 1, 2 and 3 during the period.
Level 2 fair values have been derived using the sales comparison approach. Sales prices of comparable units in close proximity are adjusted for differences in key attributes such as property size. The most significant input into this valuation approach is price per square foot.
The rental income net of expenses, earned from investment property is AED 1,231 thousand (2013: 1,020 thousand) included in other income.

054
NOTES TO THE CONSOLIDATED FINANCIAL STATEMENTSFOR THE YEAR ENDED 31 DECEMBER 2014
Annual Report
12FINANCIAL ASSETS AT FAIR VALUE THROUGH PROFIT OR LOSS
2014 AED’000
2013 AED’000
Investment in a real estate fund 5,368 4,678
The movement in financial assets at fair value through profit or loss is as follows:
2014 AED’000
2013 AED’000
At 1 January 4,678 4,821
Fair value gain/(loss) (Note 27) 690 (143)
At 31 December 5,368 4,678
Financial assets at fair value through profit or loss are presented within ‘operating activities’ as part of changes in working capital in the statement of cash flows.
Changes in fair values of financial assets at fair value through profit or loss are recorded in the consolidated income statement within “Other gain/(losses) - net” (Note 27).
13INVENTORIES
2014 AED’000
2013 AED’000
Materials and consumables 44,817 30,259
11AVAILABLE-FOR-SALE FINANCIAL ASSETS
2014AED’000
2013AED’000
At 1 January 75,159 2,384
Additions 18,902 72,048
Classified as investment in associate (Note 29.2)
(53,308) -
Impairment reversal on available-for-sale financial assets (Note 27)
- 727
At 31 December 40,753 75,159
Available-for-sale financial assets are classified as non-current assets in the consolidated financial statements. These investments except those carried at fair value as disclosed in Note 3.3, are carried at cost as their fair value cannot be reliably determined. Available-for-sale financial assets comprise shares in unlisted companies.
Additions comprise of following investment:
Name of investee company
CountryPercentage
heldAED’000
Tahrir Petrochemicals
Egypt 0.4% 18,902
18,902
The Group classified the above investment as available-for-sale financial assets at the date of investment.
Available-for-sale financial assets include an amount of AED 37,642 thousand carried at cost as at the year end.
Available-for-sale financial assets are denominated in the following currencies:
2014AED’000
2013AED’000
US Dollar 37,642 18,740
Saudi Riyal - 53,308
Jordanian Dinar 3,111 3,111
40,753 75,159

055
NOTES TO THE CONSOLIDATED FINANCIAL STATEMENTSFOR THE YEAR ENDED 31 DECEMBER 2014
Annual Report
14CASH AND BANK BALANCES
2014AED’000
2013AED’000
Cash on hand 4,116 4,160
Cash at bank 335,592 281,543
Term deposits 418,412 272,514
Cash and bank balances 758,120 558,217
Term deposits carry an average interest rate of 1% to 3.5% (2013: 1% to 4%).
For the purpose of statement of cash flows, cash and cash equivalents comprise the following:
2014AED’000
2013AED’000
Cash and bank balances 758,120 558,217
Less: Term deposits under lien (200,893) (112,765)
Bank overdrafts (Note 18) (360,782) (123,186)
Cash and cash equivalents 196,445 322,266
15SHARE CAPITAL
Authorised, issued and fully paid2014
AED’0002013
AED’000
1,197,777,778 shares of AED 1 each paid in cash
1,197,778 1,197,778
980,000,000 shares of AED 1 each paid in kind (See i below)
980,000 980,000
Bonus shares (See ii below) 107,269 107,269
2,285,047 2,285,047
i. Assets and liabilities of Drake & Scull International (LLC) and its subsidiaries, were transferred to Drake & Scull International PJSC as in-kind contribution for a 45% shareholding in the Company.
ii. During the Annual General Meeting held on 26 April 2012, the shareholders approved the cash dividend of 3% of the face value of the issued shares and 5% bonus shares. The increase in share capital was formally approved by the Ministry of Economy on 25 June 2012. These dividends had been reflected in the consolidated statement of changes in equity, accordingly.
iii. During the year ended 31 December 2009, the Company obtained necessary regulatory approval to undertake a share buy-back program. A total of 32,400 thousand shares were purchased from the market at an average price of AED 0.8834 per share amounting to AED 28,622 thousand. During the year ended 31 December 2013, these shares were re-issued at an average price of AED 0.977 per share amounting to AED 31,648 thousand, recognising a share premium of AED 3,026 thousand.
16STATUTORY RESERVEIn accordance with the applicable laws of the relevant jurisdictions and the Company’s Articles of Association, 10% of the profit for the year in each limited liability registered Company is required to be transferred to a statutory reserve. This reserve is not available for distribution except as stipulated by the law. Transfers to this reserve are required to be made until such times as it equals at least 50% of the paid up share capital of the respective companies. A transfer of AED 22,955 thousand (2013: 14,503 thousand) was made from retained earnings to this reserve at balance sheet date.
17OTHER RESERVEDuring the third quarter of the year ended 31 December 2011, the Group acquired the remaining 20% of the shares relating to the non-controlling interest in one of its subsidiaries, Gulf Technical Construction Company LLC (“GTCC”). The fair value of the total net identifiable assets of GTCC was AED 160,000 thousand. The 20% shares were owned equally by two individuals. The Group paid one of the shareholders fully in cash and paid the other shareholder partially in cash and settled the remaining balance for 6% shares in another subsidiary, Drake & Scull Construction LLC (a wholly owned subsidiary of the Parent Company).
The difference of AED 24,543 thousand between the total consideration paid/equity transferred and contingent liability assumed of AED 26,862 thousand and the carrying amount of non-controlling interest of AED 51,405 thousand had been credited to other reserves under the consolidated statement of changes in equity.

056
NOTES TO THE CONSOLIDATED FINANCIAL STATEMENTSFOR THE YEAR ENDED 31 DECEMBER 2014
Annual Report
19TRADE AND OTHER PAYABLES
2014AED’000
2013AED’000
Trade payables and accruals 1,933,026 2,035,469
Amount due to customers on contracts
80,120 104,253
Advances from customers 975,449 799,187
2,988,595 2,938,909
Amounts due to customers on contracts comprise:
2014AED’000
2013AED’000
Progress billings 856,167 1,624,293
Less: Cost incurred to date (679,240)
(1,278,104)
Less: Recognised profits (96,807) (241,936)
80,120 104,253
Interest rates on the term loans were at variable rates and ranging between 2% to 6.5% (2013: 2% to 6.5%) per annum. Contractual re-pricing dates are set on the basis of 3 months LIBOR/EIBOR.
The nature of securities provided in respect of certain bank borrowings by the Group, are set out below:
• Lien on motor vehicles and equipment purchased and on certain receivables;
• Mortgage over certain property and equipment; and
• Pledge of all assets acquired through utilisation of credit facilities.
The fair value of current borrowings equals their carrying amount, as the impact of discounting is not significant. The fair values are based on cash flows discounted using a rate based on the borrowing rate of 5.5% and are within level 2 of the fair value hierarchy. Long-term borrowings are at market linked variable interest rates and therefore the carrying amounts of non-current borrowings approximate their fair value at the balance sheet date.
18BANK BORROWINGSThe Group has obtained bank borrowings (including bank overdrafts) from several commercial banks, mainly to fund the acquisition of new businesses and to meet other working capital and investment requirements.
2014AED’000
2013AED’000
NON-CURRENTTerm loans 534,084 48,878
CURRENTTerm loans 345,934 128,400
Trust receipts and other borrowings 969,883 816,006
Bank overdrafts (Note 14) 360,782 123,186
31 December 1,676,599 1,067,592
The movement in carrying value of term loans including Sukuk bonds is as follows:
2014AED’000
2013AED’000
At 1 January 177,278 730,587
New term loans during the year 933,833 24,350
Repayment of term loans during the year
(231,093) (577,659)
31 December 880,018 177,278
The carrying amount of the Group’s borrowings is primarily denominated in AED, USD or currencies pegged to USD. The maturity profile of borrowings based on the remaining period at the balance sheet date is included in Note 3.1.
During the year, the Group has obtained four new term loans amounting to USD 20 million and AED 275 million from international and local banks respectively. Term loans payable within twelve months at the date of consolidated balance sheet are classified within current liabilities.
During the year, the Group issued Sukuk bonds amounting to USD 120 million which were subscribed by 4 commercial banks, incorporated in the United Arab Emirates. The maturity of these Sukuk bonds is five years from the issue date. The Sukuk bonds carry profit margin of 4.5% per annum.

057
NOTES TO THE CONSOLIDATED FINANCIAL STATEMENTSFOR THE YEAR ENDED 31 DECEMBER 2014
Annual Report
20PROVISION FOR EMPLOYEES’ END OF SERVICE BENEFITS
2014AED’000
2013AED’000
At 1 January 110,234 84,669
Charge for the year 49,076 41,665
Payments during the year (8,348) (16,100)
150,962 110,234
End of service benefits’ charge has been allocated in the consolidated income statement as follows:
Contract costs (Note 24) 41,092 36,542
General and administrative expenses (Note 25)
7,984 5,123
49,076 41,665
In accordance with the provisions of IAS 19, management has carried out an exercise to assess the present value of its obligations as at 31 December 2014 and 2013, using actuarial techniques, in respect of employees’ end of service benefits payable under the UAE labour Law and the Laws applicable in the countries in which the Group operates, for their periods of service up to the balance sheet date.
Under this method an assessment has been made of the employees’ expected service life with the Group and the expected basic salary at the date of leaving the service. Future salary increases have been estimated on a basis consistent with the natural progression of an employees’ salary in line with the Group’s salary scales, past experience and market conditions. Management has assumed average increment/promotion cost of 5% (2013: 3.5%). The expected liability at the date of leaving the service has been discounted to its net present value using a discount rate of 3.15% per annum (2013: 4.5% per annum).
21RELATED PARTY TRANSACTIONS AND BALANCESRelated parties comprise the majority shareholders, key management personnel, joint arrangements, directors and businesses which are controlled directly or indirectly by the shareholders or directors or over which they exercise significant management influence (hereinafter referred as “affiliates”). In the normal course of business, the Group has various transactions with its related parties. Transactions are entered into with the related parties on terms and conditions approved by either the Group management, or its Board of Directors.
SIGNIFICANT RELATED PARTY TRANSACTIONSSignificant related party transactions with affiliates amounted to AED 35,775 thousand (2013: 59,817 thousand) and mainly represent sub-contracting charges on contracts.
RELATED PARTY BALANCESThe outstanding balances with related parties are given below:
Due from related parties:
2014AED’000
2013AED’000
Drake & Scull Group 743 -
Joint arrangements 90,610 216,548
Affiliates 126 52,080
91,479 268,628
Due to related parties:
Drake & Scull Group - 818
Joint arrangements 28,560 4,314
Affiliates 99790 14,313
128,350 19,445
COMPENSATION OF KEY MANAGEMENT PERSONNELThe remuneration of directors and other members of key management are as follows:
Year ended 31 December
2014AED’000
2013AED’000
Salaries and short term benefits 39,592 44,008
Employees’ end of service benefits 3,360 3,018
42,952 47,026
The fee paid to Board of Directors during the year was AED 1,250 thousand (2013: AED 1,250 thousand).
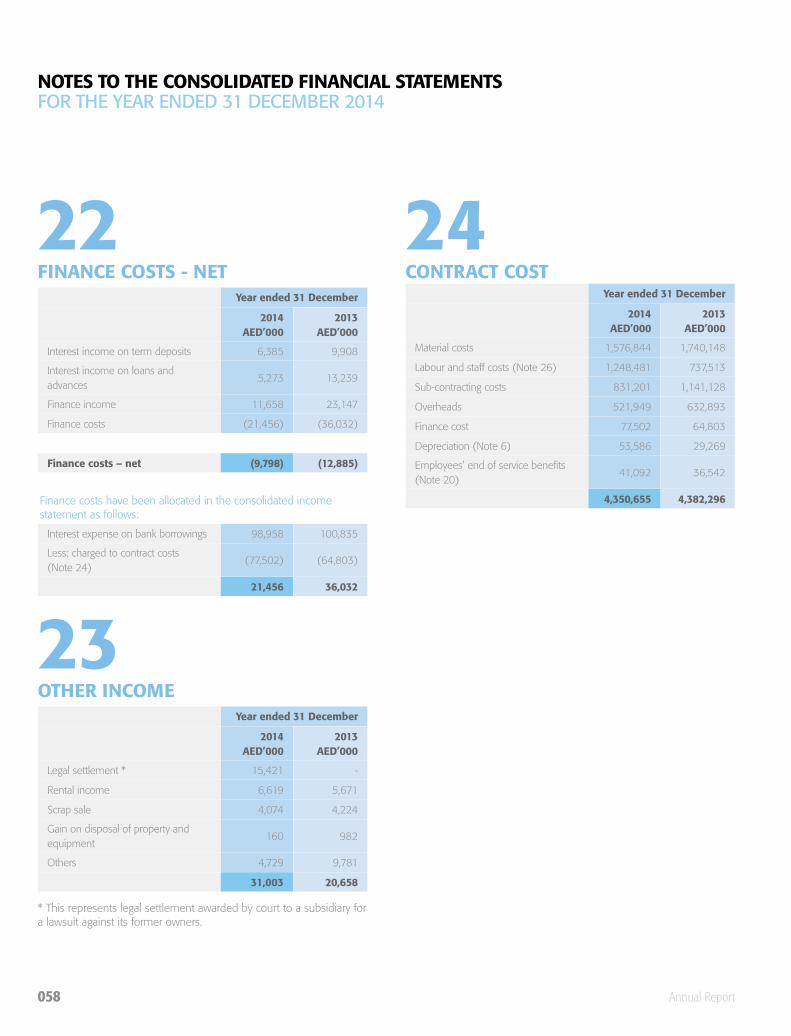
058
NOTES TO THE CONSOLIDATED FINANCIAL STATEMENTSFOR THE YEAR ENDED 31 DECEMBER 2014
Annual Report
22FINANCE COSTS - NET
Year ended 31 December
2014AED’000
2013AED’000
Interest income on term deposits 6,385 9,908
Interest income on loans and advances
5,273 13,239
Finance income 11,658 23,147
Finance costs (21,456) (36,032)
Finance costs – net (9,798) (12,885)
Finance costs have been allocated in the consolidated income statement as follows:
Interest expense on bank borrowings 98,958 100,835
Less: charged to contract costs (Note 24)
(77,502) (64,803)
21,456 36,032
24CONTRACT COST
Year ended 31 December
2014AED’000
2013AED’000
Material costs 1,576,844 1,740,148
Labour and staff costs (Note 26) 1,248,481 737,513
Sub-contracting costs 831,201 1,141,128
Overheads 521,949 632,893
Finance cost 77,502 64,803
Depreciation (Note 6) 53,586 29,269
Employees’ end of service benefits (Note 20)
41,092 36,542
4,350,655 4,382,296
23OTHER INCOME
Year ended 31 December
2014AED’000
2013AED’000
Legal settlement * 15,421 -
Rental income 6,619 5,671
Scrap sale 4,074 4,224
Gain on disposal of property and equipment
160 982
Others 4,729 9,781
31,003 20,658
* This represents legal settlement awarded by court to a subsidiary for a lawsuit against its former owners.

059
NOTES TO THE CONSOLIDATED FINANCIAL STATEMENTSFOR THE YEAR ENDED 31 DECEMBER 2014
Annual Report
25GENERAL AND ADMINISTRATIVE EXPENSES
Year ended 31 December
2014AED’000
2013AED’000
Staff costs (Note 26) 152,265 155,494
Business development, legal and professional fee
55,092 48,385
Provision for impairment of trade receivables and retentions – net of reversals (Note 8)
54,416 22,509
Amortisation (Note 7) 37,750 37,750
Depreciation (Note 6) 17,029 18,119
Rent 12,472 11,562
Bank charges 9,726 7,978
Employees’ end of service benefits (Note 20)
7,984 5,123
Repair and maintenance 6,195 6,974
Utilities 3,726 3,335
Withholding tax 3,139 -
Other expenses 13,874 11,352
373,668 328,581
27OTHER GAIN/(LOSSES) – NET
Year ended 31 December
2014AED’000
2013AED’000
Fair value gain/(loss) on financial assets at fair value through profit or loss (Note 12)
690 (143)
Fair value gain on settlement of share swaps
- 5,583
Loss on sale of development properties
- (5,160)
Impairment reversal on available-for-sale financial assets (Note 11)
- 727
Fair value loss on interest rate swaps - (4,050)
Loss on settlement of equity warrants - (27)
690 (3,070)
28INCOME TAX EXPENSEThe major components of income tax expense are as follows:
Year ended 31 December
2014AED’000
2013AED’000
Current income tax expense:
Current income tax charge 24,741 48,891
Deferred income tax (credit)/expense:
Relating to origination and reversal of temporary differences
(1,088) 6,432
23,653 55,323
26STAFF COST
2014AED’000
2013AED’000
Contract costs (Note 24) 1,289,573 774,055
General and administrative expenses (Note 25)
160,249 160,617
1,449,822 934,672

060
NOTES TO THE CONSOLIDATED FINANCIAL STATEMENTSFOR THE YEAR ENDED 31 DECEMBER 2014
Annual Report
29INVESTMENTSThe amounts recognized in the balance sheet are as follows:
Year ended 31 December
2014AED’000
2013AED’000
Joint ventures (Note 29.1) 159,244 93,249
Associates (Note 29.2) 105,568 -
At 31 December 264,812 93,249
29.1INVESTMENT IN JOINT VENTUREThe Group’s share in the joint venture’s assets and liabilities included in the consolidated financial statements is as follows:
2014AED’000
2013AED’000
At 1 January 93,249 29,206
Share of profit from investment in joint venture
65,995 64,043
At 31 December 159,244 93,249
The joint venture listed below has share capital consisting solely of ordinary shares, which is held directly by the Group.
NATURE OF INVESTMENT IN JOINT VENTURES
Name of entityCountry of
incorporation% of ownership
interestNature of
relationshipMeasurement
method
DSO Developments Limited Cayman Islands 50% Note 1 Equity
Note 1: The principal activity of DSO Development Limited is real estate investment and development.
DSO Developments Limited is a private company and there is no quoted market price available for its shares.
Commitments and contingent liabilities in respect of joint ventureThe Group has no commitments and contingent liabilities relating to its joint venture.
Summarised financial information for joint ventureThe summarised financial information for DSO Developments Limited which is accounted for using the equity method is shown overleaf.

061
NOTES TO THE CONSOLIDATED FINANCIAL STATEMENTSFOR THE YEAR ENDED 31 DECEMBER 2014
Annual Report
SUMMARISED BALANCE SHEET
2014AED’000
2013AED’000
CURRENT ASSETSDue from related parties - 26,436
Development property 503,463 -
Cash and cash equivalents 2,211 54
Total current assets 505,674 26,490
CURRENT LIABILITIESTrade and other payables 139,612 40,661
Due to related parties 47,574 -
Total current liabilities 187,186 40,661
NON-CURRENT ASSETSInvestment property - 329,354
NON-CURRENT LIABILITYLong term payable - 128,685
Net assets 318,488 186,498
SUMMARISED STATEMENT OF COMPREHENSIVE INCOME
Year ended 31 December
2014AED’000
2013AED’000
General and administrative expenses (30,934) (7,802)
OPERATING LOSS FOR THE PERIOD
(30,934) (7,802)
Gain on revaluation of investment property
172,205 122,878
(Loss)/gain on fair valuation of long term payables
(9,281) 13,010
Profit and total comprehensive income for the period
131,990 128,086
RECONCILIATION OF SUMMARISED FINANCIAL INFORMATIONReconciliation of the summarised financial information presented to the carrying amount of its interest in the joint venture
2014AED’000
2013AED’000
Share capital introduced - 58,412
Net assets at 1 January 186,498 -
Profit for the year 131,990 128,086
Net assets at 31 December 318,488 186,498
Interest in joint venture at 50% 159,244 93,249
Carrying value 159,244 93,249
29.2INVESTMENT IN ASSOCIATE The Group’s share in the associate’s assets and liabilities included in the consolidated financial statements is as follows:
2014AED’000
2013AED’000
At 1 January - -
Classified from available-for-sale financial assets (Note 11)
53,308 -
Investment during the year 53,766 -
Share of loss from investment in associate
(1,506) -
At 31 December 105,568 -
During the year, the Group increased its share of investment in Lamar investments and real estate development LLC from 10% to 20% which resulted in the classification of investment from available-for-sale financial assets to investment in associate in the consolidated financial statements.
The associate as listed below has share capital consisting solely of ordinary shares, which are held directly by the group; the country of incorporation/registration is also its principal place of business.

062
NOTES TO THE CONSOLIDATED FINANCIAL STATEMENTSFOR THE YEAR ENDED 31 DECEMBER 2014
Annual Report
NATURE OF INVESTMENT IN JOINT VENTURES
Name of entityCountry of
incorporation% of ownership
interestNature of
relationshipMeasurement
method
Lamar investments and real estate development LLC
Saudi Arabia 20% Note 1 Equity
Note 1: The principal activity of Lamar is real estate investment and development.
Lamar investments and real estate development LLC is a private company and there is no quoted market price available for its shares.
There are no contingent liabilities relating to the Group’s interest in the associates.
Summarised financial information for associateSet out below are the summarised financial information for Lamar investments and real estate development LLC which are accounted for using the equity method.
SUMMARISED BALANCE SHEET AS AT 31 DECEMBER 2014
AED’000
CURRENT ASSETSCash and cash equivalents 79,315
Prepayments and other receivables 335
Total current assets 79,650
CURRENT LIABILITIESTrade and other payables 17,337
Zakat payable 2,931
Total current liabilities 20,268
NON-CURRENT ASSETSInvestment properties 1,290,427
Advances to contractors 178,781
Deferred charges 80,005
Property and equipment 75
Total non-current assets 1,549,288
NON-CURRENT LIABILITIESAdvances from customers 609,706
Amounts due to partners 470,890
End of service benefits 234
Total non-current liabilities 1,080,830
Net assets 527,840
SUMMARISED STATEMENT OF COMPREHENSIVE INCOME FOR THE YEAR ENDED 31 DECEMBER 2014
AED’000
General and administrative expenses (4,795)
Other income 81
Net loss before Zakat (4,714)
Zakat (2,833)
Total comprehensive loss for the period (7,547)
RECONCILIATION OF SUMMARISED FINANCIAL INFORMATION
2014AED’000
Opening net assets at 1 January 535,387
Loss for the year (7,547)
Net assets at 31 December 527,840
Interest in joint venture at 20% 105,568
Carrying value 105,568

063
NOTES TO THE CONSOLIDATED FINANCIAL STATEMENTSFOR THE YEAR ENDED 31 DECEMBER 2014
Annual Report
30EARNINGS PER SHAREBASICBasic earnings per share is calculated by dividing the profit attributable to the equity holders of the Company by the weighted average number of ordinary shares in issue during the year excluding ordinary shares purchased and held as treasury shares.
Year ended 31 December
31 December 2014
31 December 2013
EARNINGS (AED’000)
Earnings for the purposes of basic earnings per share being profit attributable to owners of the parent
100,708 166,469
NUMBER OF SHARES
Weighted average number of ordinary shares for the purposes of basic earnings per share
2,285,046,667 2,295,432,420
Basic earnings per share (AED)
0.044 0.073
DILUTEDThe Company has not issued any instruments which would have a dilutive impact on earnings per share when exercised.
31GUARANTEES
2014AED’000
2013AED’000
Performance bonds 1,438,543 1,004,345
Letter of guarantees 1,503,315 1,266,331
2,941,858 2,270,676
The various bank guarantees above were issued by the Group’s bankers in the ordinary course of business. In the opinion of the Directors, the above bank guarantees are unlikely to result in any liability to the Group.
32EXPENDITURE COMMITMENTS(a)Operating lease commitmentsThe Group has various operating lease agreements. The future minimum lease payments payable under operating leases are as follows:
2014AED’000
2013AED’000
Future minimum lease payments:
No later than one year 15,976 10,457
Later than one year but no later than five years
24,103 26,551
Later than five years 1,753 1,742
41,832 38,750
(b) Other commitments
2014AED’000
2013AED’000
Letters of credit for purchase of materials and operating equipment
1,115,223 687,121

064
NOTES TO THE CONSOLIDATED FINANCIAL STATEMENTSFOR THE YEAR ENDED 31 DECEMBER 2014
Annual Report
33 FINANCIAL INSTRUMENTS BY CATEGORYThe accounting policies for the financial instruments have been applied to the line items below:
Loans and receivables
AED’000
Financial assets at fair value through
profit or loss AED’000
Available for sale financial
assets AED’000
TotalAED’000
Assets as per balance sheet
31 December 2014
Trade and other receivables (excluding advances and prepayments)
5,528,474 - - 5,528,474
Financial assets at fair value through profit or loss (Note 12)
- 5,368 - 5,368
Available-for-sale financial assets (Note 11)
- - 40,753 40,753
Due from related parties (Note 21)
91,479 - - 91,479
Cash and bank balances (Note 14)
758,120 - - 758,120
Total 6,378,073 5,368 40,753 6,424,194
31 December 2013
Trade and other receivables (excluding advances and prepayments)
4,278,202 - - 4,278,202
Financial assets at fair value through profit or loss (Note 12)
- 4,678 - 4,678
Available-for-sale financial assets (Note 11)
- - 75,159 75,159
Due from related parties (Note 21)
268,628 - - 268,628
Cash and bank balances (Note 14)
558,217 - - 558,217
Total 5,105,047 4,678 75,159 5,184,884

065
NOTES TO THE CONSOLIDATED FINANCIAL STATEMENTSFOR THE YEAR ENDED 31 DECEMBER 2014
Annual Report
Other financial liabilities at amortised cost AED’000
At 31 December 2014
Bank borrowings (Note 18) 2,210,683
Due to related parties (Note 21) 128,350
Trade payables and accruals excluding advances from customers (Note 19) 2,013,146
Total 4,352,179
At 31 December 2013
Bank borrowings (Note 18) 1,116,470
Due to related parties (Note 21) 19,445
Trade payables and accruals excluding advances from customers (Note 19) 2,139,722
Total 3,275,637
34 SUMMARISED FINANCIAL INFORMATION ON SUBSIDIARY WITH MATERIAL NON-CONTROLLING INTERESTS Set out below are the summarised financial information for subsidiary that has non-controlling interests that are material to the Group.
SUMMARISED BALANCE SHEET
Drake & Scull International KSA
2014AED’000
2013 AED’000
CURRENT Assets 1,263,182 1,025,619
Liabilities 1,081,820 850,645
Total net current assets 181,362 174,974
NON-CURRENTAssets 68,230 47,440
Liabilities 28,989 19,706
Total net non-current assets 39,241 27,734
Net assets 220,603 202,708
SUMMARISED INCOME STATEMENT
2014AED’000
2013 AED’000
Revenue 979,185 1,065,273
Net profit 16,173 57,531
SUMMARISED CASH FLOWS
2014AED’000
Cash flows from operating activities
Cash generated from operations 30,279
Interest paid (103)
Net cash generated from operating activities 30,176
Net cash used in investing activities (6,888)
Net cash used in financing activities (90,314)
Net decrease in cash and cash equivalents (67,026)
Cash and cash equivalents at beginning of year 7,480
Exchange gains on cash and cash equivalents 1,722
Cash and cash equivalents at end of year (57,824)
The information above is the amount before inter-company eliminations.

050Annual Report
إيضاحات حول البيانات المالية الموحدةللسنة المنتهية في 31 ديسمبر 2014

066
NOTES TO THE CONSOLIDATED FINANCIAL STATEMENTSFOR THE YEAR ENDED 31 DECEMBER 2014
Annual Report

“ فازت دريك آند سكل إنترناشيونال بمشاريع جديدة بقيمة 5.935 مليار درهم في منطقة الشرق األوسط وشمال أفريقيا وآسيا وأوروبا، أما محفظة المشاريع
قيد التنفيذ فقد شهدت نموا هو األعلى في تاريخ المجموعة بواقع 14.5 مليار درهم، بما يمثل نموا بنسبة ٪20 مقارنة مع السنة المالية 2013.”


002Annual Report
“نجحنا خالل العام الفائت في الحفاظ
على تركيزنا المطلق على أولوياتنا اإلستراتيجية
الرئيسية وسعينا الحثيث لمواصلة
مسيرة التميز إستنادا إلى 50 عاما من الريادة
الهندسية.”
المساهمون الكرام،
شكل العام 2014 محطة هامة جمعت بين اإلنجازات النوعية والتحديات المتزايدة على صعيد نطاق األعمال واألسواق
اإلقليمية. ونجحنا خالل العام الفائت في الحفاظ على تركيزنا المطلق على أولوياتنا اإلستراتيجية الرئيسية وسعينا
الحثيث لمواصلة مسيرة التميز إستنادا إلى 50 عاما من الريادة الهندسية. وشكلت خبرتنا الواسعة والثقة العالية التي يوليها عمالؤنا وشركاؤنا، إلى جانب سجلنا الحافل
بالنجاح في تسليم أبرز المشاريع، دعائم متينة لترسيخ ريادتنا ضمن أسواق الشرق األوسط وشمال أفريقيا وأوروبا
وجنوب آسيا.
وعلى الرغم من بعض التحديات الرئيسية، إال أننا تمكنا من تحقيق مستويات جيدة من الربحية وحصة سوقية كبيرة.
وتأتي نتائجنا المالية، عند النظر إليها في سياق التقلبات اإلقتصادية المتسارعة ضمن أسواقنا اإلقليمية، لتؤكد تميز
ونجاح وإستدامة نموذج أعمالنا.
وواصل اإلقتصاد العالمي مسيرة إنتعاشه البطيء من تداعيات الركود المالي الذي ضرب العالم في منتصف
العقد األول من القرن الحالي. إذ تشير التقديرات الواردة في تقرير “آي.أم.أف” )IMF( إلى أن اإلقتصاد العالمي
سيشهد نموا بمعدل يصل إلى %3.5 بحلول نهاية العام الجاري. وتفوقت اإلقتصادات الناشئة لدول “البريكس”
)BRICS(، التي تشمل البرازيل وروسيا والهند والصين وجنوب أفريقيا، على اإلقتصادات المتقدمة من حيث نمو
الناتج المحلي اإلجمالي، مع إستحواذ الصين على موقع الصدارة. وبالمقابل، تسبب الهبوط األخير في أسعار
النفط في تراجع االقتصادين الروسي والصيني، وهو ما سينعكس على تخفيض مستويات نمو األسواق الناشئة
لتصل إلى نحو %4.3 خالل العام الجاري.
ونجحت اإلقتصادات اإلقليمية خالل العام الماضي في تحقيق تقدم مطرد، ال سيما االقتصاديات الخليجية التي
سجلت نموا الفتا في الناتج المحلي اإلجمالي، وصل إلى %4.5. وواجهت المنطقة تراجعا غير متوقع خالل منتصف
رسالة رئيسمجلس اإلدارة
Annual Report
العام، وذلك بالتزامن مع تراجع أسعار النفط العالمية إلى مستويات تاريخية، محدثة بذلك ضغوطا متزايدة على
األسواق المعتمدة على النفط والصناعات ذات الصلة كمصدر رئيسي للدخل القومي. واليوم، من المتوقع أن
تواصل الحكومات الخليجية تنفيذ برامج التحفيز المالي وتسريع وتيرة تطبيق إصالحات إقتصادية جذرية.
وإنعكست التقلبات في أسعار النفط على أداء القطاعات الحيوية ضمن األسواق اإلقليمية، ما أثر بدوره على بعض من عملياتنا التشغيلية الرئيسية. ونحن ال نزال ننظر بعين
التفاؤل الى قدرة أسواقنا الرئيسية في منطقة الخليج العربي على تحقيق نمو مستدام خالل العام الجاري. ومن منظار االقتصاد الكلي، يتوقع أن تشهد األسواق الخليجية
نموا اقتصاديا بمعدل يتراوح بين 3 و%3.5 خالل العام الجاري، وفقا للتقرير االقتصادي الصادر عن “إي.أف.جي
هيرميس” )EFG HERMES(. وأظهرت دراسة متخصصة أعدتها “ميد بروجكتس” )MEED PROJECTS( آفاق إيجابية
مبشرة، مشيرة إلى أن العقود الجديدة ضمن أسواق الخليج العربي تراوحت بين 367 و 551 مليار درهم منذ العام
2006، بغض النظر عن اتجاهات أسعار النفط.
ووصل إجمالي قيمة المشاريع التي تم إستكمالها في منطقة الخليج العربي خالل العام 2014 إلى 248.3
مليار درهم، وفقا لنتائج دراسة “فينتشر ميدل إيست” )VENTURE ME(. وبالمقابل، بلغت قيمة العقود الممنوحة
ضمن األسواق الخليجية 312 مليار درهم، وهو ما يعود بشكل رئيسي إلى التراجع الحاد ضمن أسواق رئيسية، مثل
المملكة العربية السعودية التي سجلت إنخفاضا بنسبة %25 في إجمال المشاريع الممنوحة، مقارنة بالعام 2013.
ويتواصل العمل في الوقت الراهن على تنفيذ خطط تنموية بقيمة 265 مليار درهم، في حين يتوقع أن تشهد السنة الحالية منح مشاريع بقيمة إجمالية تصل إلى 378 مليار درهم، ما يعكس نموا بمعدل %21 مقارنة بالسنة
الماضية.
وبالنظر إلى اإلمكانات المتاحة على المدى الطويل في
01
002

003 Annual Report
ماجد الغريررئيس مجلس اإلدارة
شركة دريك أند سكل انترناشيونال ش.م.ع.
منطقة الخليج العربي، يمكننا القول بأننا متفاؤلون حيال النمو ضمن قطاعاتنا الرئيسية. ويأتي تفاؤلنا مدفوعا
بالجهود الحكومية المتواصلة ضمن االقتصادات الكبرى، مثل السعودية وقطر واإلمارات، لتطبيق سياسة التنوع
االقتصادي وتطوير البنية التحتية للقطاعات غير النفطية، وباألخص مع االستعدادات الجارية الستضافة “معرض
إكسبو دبي 2020” و”بطولة كأس العالم لكرة القدم- قطر .”2022
وال يزال التكهن بمستقبل أسواقنا على المدى القصير تحديا حقيقيا إلى حين إستقرار أسعار النفط وتحسن المناخ
االقتصادي والمالي. ودفعتنا المعطيات االقتصادية الراهنة إلى التركيز على االرتقاء بكفاءاتنا األساسية وإمكاناتنا
الجوهرية والحد من التكاليف اإلجمالية. وبالفعل، حققنا تقدما ملحوظا على صعيد توظيف التكنولوجيا المتقدمة بالشكل األمثل ضمن عملياتنا التشغيلية وتوسيع نطاق
حضورنا اإلقليمي من خالل تعزيز مركزية مكاتب العمليات المساندة.
ومن منظور مؤسسي، يمكن القول بأن العام الجاري سيشكل مرحلة مليئة بالتحديات. ولكننا ال نزال نتطلع
بتفاؤل حيال الحفاظ على مستويات الربحية التاريخية، إال أننا في الوقت ذاته نتوقع أن نواجه معوقات على صعيد السيولة. ونسعى من جانبنا إلى التعامل بحكمة مع إدارة
عمليات توسيع محفظتنا من المشاريع قيد التنفيذ وضمان مساهمتها في تحقيق نمو مستدام ومرن ومثمر في اآلن
ذاته.
وسنواصل في “دريك آند سكل إنترناشيونال” العمل على تقديم قيمة مضافة لعمالئنا، باإلعتماد على األسس
السليمة والقوية ألعمالنا. كما سنواصل بال شك السير قدما لتحقيق المزيد من النمو ضمن القطاعات الحيوية ذات إمكانات النمو والهوامش الربحية العالية، وباألخص قطاعات
الهندسة الكهربائية والميكانيكية والصحية والمياه والطاقة في الوقت الذي تلوح فيه في األفق بوادر أزمة في التوريد
بالتزامن مع الضغوط الناجمة عن الزيادة السكانية المطردة في المنطقة ككل.
وتستعد أعمالنا المتعلقة بالنفط والغاز أيضا للنمو نتيجة االستثمارات المتوقعة ضمن القطاع، وخاصة على صعيد
المشاريع البتروكيمائية، مع وجود مشاريع في طور اإلعداد حاليا بقيمة 477 مليار درهم. وعلى صعيد قطاع السكك الحديدية، تسبب اإلعالن األخير عن تأجيل إفتتاح الشبكة
الحديدية الخليجية لمدة عامين في تخفيض التوقعات المتعلقة بصناعة الخطوط الحديدية. ولكن ال يزال هناك
العديد من المشاريع الضخمة التي يجري التخطيط لها في الوقت الراهن، مثل “مترو الرياض” و”مترو مكة المكرمة”
ومشروع “الشركة السعودية للخطوط الحديدية” و”قطار الحرمين السريع” ومشروع “الجسر البري السعودي”
و”شبكة االتحاد للقطارات” و”الشبكة الحديدية الخليجية” و”مترو الدوحة”، والتي توفر بمجملها فرص هائلة لنا لتحقيق نمو الفت على صعيد عملياتنا التشغيلية ذات
الصلة بالسكك الحديدية خالل العام الجاري.
وبدأنا نوجه تركيزنا الرئيسي على االرتقاء بخدمة العمالء وتعزيز العالقات المتينة معهم، فضال عن توسيع نطاق استثماراتنا وتعزيز أعمالنا ذات الهوامش الربحية العالية،
في سبيل دفع عجلة النمو المستدام.
وشكلت القوى العاملة لدينا إحدى أبرز الركائز األساسية لنجاحاتنا المتالحقة، بما تتمتع به من خبرات عالية وإمكانات واعدة وتفان والتزام تام باألخالقيات المهنية. ونفخر اليوم بإحتضان أكثر من 30,700 ألف موظف على درجة عالية من
الكفاءة واالحترافية من أكثر من 50 جنسية.
وأود أن أتوجه بالشكر إلى مساهمينا الكرام على دعمهم المتواصل الذي نفخر به في “دريك آند سكل
إنترناشيونال”. ومنذ إنجازنا التاريخي المتمثل في الدخول إلى “سوق دبي المالي”، حظينا بشرف العمل بالنيابة
عنكم لبناء وقيادة شركة مؤهلة لتوظيف الفرص المتاحة بالشكل األمثل لتحقيق النمو والتطور والريادة. ونجحنا
بالفعل في تأسيس شركة قادرة على إظهار قوة مالية عالية خالل الظروف المواتية أو الصعبة ضمن األسواق المستهدفة، فضال عن تنفيذ أعمال متوائمة مع أعلى
المعايير الدولية في النزاهة والتميز. ويأتي ذلك تماشيا مع رؤية المؤسسين في العام 1881، والتي نسير عليها اليوم
لقيادة 134 سنة أخرى من الريادة العالمية.
003

004Annual Report
المساهمون الكرام،
يعتبر العام 2014 عام حافل باألحداث في تاريخ شركة “دريك آند سكل إنترناشيونال” الممتد على مدى 134 عاما، مواصلة
مسيرة التميز والريادة في مجال األعمال الهندسية ومحققة مستويات نمو الفتة في مختلف أقسام الشركة. وعلى
الرغم من التحديات التشغيلية التي واجهتها، تمكنت “دريك آند سكل إنترناشيونال” من ترسيخ مكانتها الريادية ضمن أحد أكثر األسواق تقلبا في العالم، معولة في ذلك على الهيكلية
المؤسسية المتينة للشركة وآليات العمل القوية والتكامل العمودي بين مختلف أقسام الشركة وخبرتها الواسعة في
تطوير المشاريع عالية المستوى في منطقة الشرق األوسط وشمال أفريقيا وأوروبا وآسيا.
ولم تقف األسواق التنافسية والتحديات الناشئة غير المتوقعة والضغوط المتزايدة على هوامش الربحية للشركة، عائقا أمام
“دريك آند سكل إنترناشيونال” التي استطاعت تحقيق عاما ناجحا آخر من خالل زيادة حصتها في السوق وتوسيع محفظة
مشاريعها قيد التنفيذ.
وقد سجلت الشركة إيرادات ثابتة خالل العام 2014 بالمقارنة مع العام السابق له، كما تعرضت هوامش التشغيل للضغوط في
قسم المقاوالت العامة في الشركة والتي أدت بدورها إلى التأثير على األداء العام للمجموعة.
كما شهد القطاع العقاري بروز نهج جديد أكثر حذرا وتركيزا على رفع الكفاءة من حيث التكلفة، األمر الذي أدى إلى تمديد المدة
الزمنية لتطوير المشاريع في جميع األسواق الرئيسية، بما أدى إلى تأخر تسليم بعض المشاريع في موعدها المحدد وبالتالي
تأخر استالم المستحقات المالية بما أدى إلى تباطؤ في تحقيق اإليرادات في األسواق الرئيسية التي نعمل بها في منطقة
الخليج العربي.
وحققت الشركة بداية قوية في النصف األول من العام حيث فازت بالعديد من المشاريع الجديدة في المنطقة. أما
في النصف الثاني، شهدت الشركة تأخر في بعض عملياتها
التشغيلية وذلك بسبب تحديات إقتصادية خارجية واجهت العديد من األسواق الكبرى مثل المملكة العربية السعودية، بما كان
لها تأثير كبير على هوامش التشغيل واألرباح في الشركة خالل العام.
وتطلب التوسع الكبير لمحفظة المشاريع قيد التنفيذ لدينا العمل على تأمين موارد أخرى وبذل الجهود للحد من اآلثار
المترتبة على التحديات الناشئة إزاء مستحقاتنا المالية والتي أثرت بشكل واضح على رأس المال العامل واإلحتياطي. كما
حرصنا على األخذ بعين اإلعتبار عدد من التدابير اإلحتياطية في إدارة مشاريعنا. كما تعاملنا مع بعض المخصصات المتعلقة بمستحقات لعقود في السوق اإلماراتي والمملكة العربية
السعودية، بما كان له تأثير كبير على صافي الدخل في الشركة خالل العام.
ومن الناحية اإليجابية، فازت “دريك آند سكل إنترناشيونال” بعدد من المشاريع الجديدة المقدرة قيمتها 5.935 مليار درهم
إماراتي في منطقة الشرق األوسط وشمال أفريقيا وآسيا وأوروبا، فيما وصل إجمالي قيمة المشاريع قيد التنفيذ
خالل العام إلى 14.5 مليار درهم، بما يعد األعلى في تاريخ المجموعة ويمثل زيادة بنسبة %20 بالمقارنة مع العام المالي
.2013
وتفصيال، شهدت ذراع األعمال الهندسية في المجموعة والمتمثلة بشركة “دريك آند سكل لألعمال الهندسية”،
مستويات نمو قوية في األسواق الرئيسية حيث فازت الشركة بمشاريع جديدة تصل قيمتها اإلجمالية إلى نحو 2 مليار درهم وموزعة بالتساوي في أسواقنا الرئيسية في منطقة الشرق األوسط وشمال أفريقيا وآسيا. وتحظى الشركة بالمقومات
واإلمكانات الالزمة لمواكبة التطورات المتوقعة ضمن أسواق دول الخليج العربي في ظل مواصلة اإلستعدادات المكثفة الستضافة فعاليات عالمية المستوى مثل “معرض إكسبو
الدولي 2020” بدبي و”بطولة كأس العالم لكرة القدم 2022” بقطر. وبدورها، حافظت ذراع المقاوالت العامة على دورها
الهام في تحسين األداء العام للمجموعة ودفع عجلة نمو
02رسالة الرئيس
التنفيذي
Annual Report
“لم تقف األسواق والتحديات التنافسية
الناشئة غير المتوقعة والضغوط
المتزايدة على هوامش الربحية
للشركة، عائقا أمام “دريك آند سكل
إنترناشيونال” التي استطاعت تحقيق عاما ناجحا آخر من
خالل زيادة حصتها في السوق وتوسيع
محفظة مشاريعها قيد التنفيذ.”

005 Annual Report
وفيما يتعلق بتطلعاتنا للعام 2015، نحن سعداء بالمكانة الريادية التي حققتها المجموعة في السوق اإلقليمية،
وستتيح مكانتنا الريادية وخبراتنا في السوق إختيار مناقصات المشاريع، مع التركيز بشكل خاص على المشاريع الكبرى التي من شأنها المساهمة الفاعلة في دفع عجلة النمو
المستدام للشركة. كما نتطلع إلى تحقيق أعلى درجات التكامل والتنسيق والمواءمة في إدارة عمليات تسليم
المشاريع في موعدها المحدد، باإلضافة إلى توجيه الجهود نحو خفض التكاليف وتحسين العائد على رأس المال وزيادة
مستويات السيولة.
كما سنحرص على أن نكون أكثر حذرا وحكمة في إدارة نمو محفظة مشاريعنا قيد التنفيذ بما يتماشى مع المعايير
المتبعة. والممارسات
ونتوقع أن تبقى كل من المملكة العربية السعودية ودولة اإلمارات المحركين األساسيين للنمو في العام 2015
كما في العام السابق له. كما نتوقع أن تشهد دولة قطر طفرة عقارية ملحوظة بالنظر إلى الزخم الكبير الذي تتمتع به الدولة إستعدادا إلستضافة “بطولة كأس العالم لكرة القدم 2022”، في حين نرى أن دولة الكويت ستواصل مستويات
اإلستثمار والتطوير الحالية في مشاريع البنية التحتية.
وعلى صعيد منطقة الشرق األوسط وشمال أفريقيا، نتوقع تحقيق مزيد من النمو على مستوى األعمال
المتعلقة بالمجال الهندسي والسكك الحديدية في منطقة الخليج العربي على غرار شركة “دريك آند سكل للنفط
والغاز” التي تتمتع بالمقومات الالزمة لتوسيع محفظة خدماتها وترسيخ مكانتها الحيوية في السوق الخليجية. ونحن
ننظر بتفاؤل إلى أداء “دريك آند سكل للسكك الحديدية” خالل العام 2015 والتي نتوقع أن تفوز بالعديد من
المشاريع في دول الخليج العربي، معولة في ذلك على شراكاتها اإلستراتيجية مع كبار الخبراء والجهات العاملة في
مجال هندسة السكك الحديدية من مختلف أنحاء العالم.
وبالنظر إلى المعطيات الراهنة، نحن على ثقة تامة بأننا سنتمكن من تحسين هامش أرباحنا في العام 2015، وذلك
باإلستناد إلى خطة طموحة من شأنها اإلرتقاء بمكانتنا التاريخية كأحد كبار الالعبين في السوق العالمية وشركة رائدة في توفير أفضل قيمة للمساهمين على المدى
الطويل.
وختاما، يطيب لي أن أتقدم ببالغ الشكر والتقدير لجميع أفراد أسرة “دريك آن سكل إنترناشيونال” وأن أثمن جهودكم الوطيدة التي تشكل األساس لنجاح “دريك
آند سكل” عبر السنوات. وأخصص بالشكر أيضا جميع المستثمرين والمساهمين الذين يبدون ثقة عالية ودعما
كبيرا للمجموعة، آملين أن نواصل مسيرة التميز والريادة وأن نحقق أفضل النتائج بما يفوق توقعاتكم وتطلعاتكم.
مجموعة مشاريعنا قيد التنفيذ في المنطقة وخاصة في المملكة العربية السعودية بإعتبارها السوق األكبر بالنسبة لنا. وشهد هذا القسم تراجع طفيف ولكنه سيبقى عنصرا رئيسيا في إستراتيجية النمو اإلقليمي للشركة هذا العام.
وقامت شركة “دريك آند سكل للسكك الحديدية” بإستكمال تنفيذ كافة أعمال الهندسة الميكانيكية والكهربائية والصحية
في مشروع “النظام اآللي لنقل المسافرين” في مطار دبي الدولي، والذي يعد المشروع األول للشركة في
المنطقة. أما شركة “دريك آند سكل للنفط والغاز”، فقد شهدت مرحلة نمو مطردة حيث سلمت أولى مشاريعها في
مصر والعراق وتم اختيارها للمشاركة في تطوير مشروع مجمع التحرير للبتروكيماويات وذلك بموجب عقد بلغت
قيمته نحو 2 مليار درهم.
ودأبت شركة “باسافانت للطاقة والبيئة”، الذراع األوروبية التابعة للمجموعة، على إحداث نقلة نوعية في عملياتها من
خالل التوجه نحو إعتماد التكنولوجيا المتطورة والصديقة للبيئة. كما نقلت الشركة مقرها الرئيس إلى مدينة
فرانكفورت األلمانية التي تتسم بموقع إستراتيجي يتيح لها الوصول السهل والفعال إلى مختلف أسواق أوروبا
ومنطقة الشرق األوسط وشمال أفريقيا وآسيا.
خلدون الطبريالرئيس التنفيذي
شركة دريك أند سكل انترناشيونال ش.م.ع.
005

006Annual Report
البينا ت المالية03

007 Annual Report
تقرير مجلس اإلدارة والبيانات المالية الموحدة للسنة المنتهية في 31 ديسمبر 2014
008 ................................................................. تقرير مجلس األدارة009 ................................................. تقرير مدقق الحسابات المستقل 010 ........................................................ الميزانية العمومية الموحدة012 ................................................................... بيان الدخل الموحدبيان الدخل الشامل الموحد......................................................... 013014 ......................................... بيان التغيرات في حقوق الملكية الموحد016 ..................................................... بيان التدفقات النقدية الموحد018 ........................................... إيضاحات حول البيانات المالية الموحدة

008Annual Report 08
تقرير مجلس اإلدارة
السادة/ المساھمین المحترمین،
یطیب لمجلس إدارة شركة دریك أند سكل انترناشیونال ش.م.ع)”دریك أند سكل انترناشیونال“( أو )”الشركة“( وشركاتھا التابعة )“المجموعة“( تقدیم البیانات
المالیة الموحدة للسنة المنتھیة في 31 دیسمبر 2014.
األنشطة الرئیسیةتركزت أعمال شركة دریك أند سكل انترناشیونال خالل السنة المنتھیة في 31
دیسمبر 2014 بشكل رئیسي على القطاع الھندسي وقطاع التصمیم المتكامل وقطاع اإلنشاءات فیما یتعلق بالمقاوالت المیكانیكیة والكھربائیة والصحیة ومقاوالت األعمال المدنیة والبنیة التحتیة لقطاعات المیاه والطاقة والنفط
والغاز.
النتائج الماليةحققت شركة دریك أند سكل انترناشیونال إیرادات للسنة المنتھیة في 31 دیسمبر 2014 بقیمة 4٫762 ملیون درھم، في حین بلغت األرباح الصافیة
للسنة ما قیمته 100.7 ملیون درھم.
وعلى الرغم من ظروف السوق الصعبة و التحديات التشغيلية ، فقد تمكنت الشركة من تحقیق األرباح خالل السنة وزیادة حصتھا في السوق وتوسيع
محفظة مشاريعها القيد التنفيذ لتصل إلى مستوى قیاسي بلغ 14.5 ملیار درھم.
لقد واجهنا تحديات في أداؤنا التشغيلي طوال العام ضمن قطاعاتنا الرئیسیة و خاصة في المملكة العربیة السعودیة.و قد تأثرت هوامش الربح قبل خصم الفوائد والضرائب واالستھالك في عام 2014 بسبب المخصصات المتعلقة
بمستحقات في قطاعاتنا الرئیسیة في كل من اإلمارات العربیة المتحدة والمملكة العربیة السعودیة.
ماجد الغريررئيس مجلس اإلدارة
شركة دريك أند سكل انترناشيونال ش.م.ع.
كما كان لتأخر تحصیل المستحقات أثر عل رأس المال العامل مما أدى إلى الزیادة في مستوى الدين العام وھو ما أدى بدوره إلى ارتفاع تكالیف التمویل مؤثر ا
بذلك على ھوامش الربحية لعام 2014.
ونحن إذ نتطلع للمستقبل من خالل توجھاتنا للسنة المقبلة ، فإننا واثقون من أن صالبة نموذجنا التشغیلي وتكامل أنشطة مشاریعنا سوف یسمحان لنا
بالتغلب على ظروف السوق الصعبة وإنجاز مشاریعنا وسوف نولي جل تركیزنا لتعزیز ھیكل رأس المال وتخفیض مستوى المديونية ، فضال عن مواصلة
التزامنا بتخفیض التكالیف وتحسین العائد على رأس المال من أجل تحقیق النمو المستدام وزیادة األرباح في عام 2015.
مدققو الحساباتتم تعیین برایس ووترھاوس كوبرز في منصب مدقق الحسابات الخارجي
للمجموعة للسنة المنتھیة في 31 دیسمبر 2014، ونظرا ألھلیتھم إلعادة التعیین في منصب مدقق الحسابات لعام 2015 فقد عبروا عن نیتھم
االستمرار في موقعھم .

009 Annual Report
التقرير حول البيانات المالية الموحدةلقد قمنا بتدقيق البيانات المالية الموحدة المرفقة لشركة دريك أند سكل
انترناشيونال ش.م.ع )“الشركة”( وشركاتها التابعة )معا “المجموعة”(، والتي تتكون من الميزانية العمومية الموحدة كما في 31 ديسمبر 2014 وبيان الدخل الموحد وبيان الدخل الشامل الموحد وبيان التغيرات في حقوق الملكية الموحد
وبيان التدفقات النقدية الموحد للسنة المنتهية في ذلك التاريخ، وملخص السياسات المحاسبية الهامة واإليضاحات التفسيرية األخرى.
مسؤولية اإلدارة عن البيانات الماليةإن اإلدارة مسؤولة عن إعداد هذه البيانات المالية الموحدة وعرضها بصورة
عادلة وفقا للمعايير الدولية للتقارير المالية، وعن تلك الرقابة الداخلية التي ترى اإلدارة أنها ضرورية لكي تتمكن من إعداد بيانات مالية موحدة خالية من أي أخطاء
جوهرية، سواء كانت ناشئة عن احتيال أو خطأ.
مسؤولية مدقق الحسابات تنحصر مسؤوليتنا في إبداء رأينا حول هذه البيانات المالية الموحدة بناء على
عملية التدقيق التي قمنا بها. لقد أجرينا تدقيقنا وفقا لمعايير التدقيق الدولية. تستدعي هذه المعايير التزامنا بالمتطلبات األخالقية وتخطيط وتنفيذ عملية
التدقيق للتوصل إلى تأكيد معقول حول ما إذا كانت البيانات المالية الموحدة خالية من أي أخطاء جوهرية.
تتضمن عملية التدقيق القيام بإجراءات للحصول على إثباتات تدقيق حول المبالغ واإلفصاحات الواردة في البيانات المالية الموحدة. تستند اإلجراءات المختارة
إلى تقدير مدقق الحسابات، بما في ذلك تقييم مخاطر األخطاء الجوهرية للبيانات المالية الموحدة، سواء كان ذلك بسبب االحتيال أو الخطأ. وعند القيام
بتقييم تلك المخاطر، يأخذ مدقق الحسابات في االعتبار الرقابة الداخلية المتصلة بإعداد المنشأة وعرضها العادل للبيانات المالية الموحدة بهدف تصميم إجراءات التدقيق المناسبة حسب الظروف، وليس لغرض إبداء الرأي حول فعالية الرقابة
الداخلية للمنشأة. تتضمن عملية التدقيق كذلك تقييما لمدى مالءمة السياسات المحاسبية المستخدمة ومعقولية التقديرات المحاسبية المعدة من قبل اإلدارة،
وكذلك تقييما ألسلوب عرض البيانات المالية الموحدة بشكل عام.
نعتقد أن إثباتات التدقيق التي حصلنا عليها كافية ومالئمة لتوفير أساس مناسب للرأي الذي نبديه بناء على عملية التدقيق.
الرأيبرأينا، تعبر البيانات المالية الموحدة المرفقة بشكل عادل ومن كافة النواحي
الجوهرية عن المركز المالي للمجموعة كما في 31 ديسمبر 2014 وأدائها المالي وتدفقاتها النقدية للسنة المنتهية بذلك التاريخ وفقا للمعايير الدولية للتقارير
المالية.
تأكيد على أمور نود أن نلفت االنتباه إلى اإليضاح رقم 1-4 )ب( من هذه البيانات المالية الموحدة الذي يوضح التقديرات واألحكام المحاسبية الهامة حول تسجيل
اإليرادات المتعلقة بأوامر التعديل والمطالبات غير المعتمدة.
كما نود أن نلفت االنتباه إلى اإليضاح رقم 8 من هذه البيانات المالية الموحدة الذي يوضح حالة عدم اليقين المتعلقة بنتيجة إجراءات التحكيم والتقاضي مع
بعض العمالء.
إن الرأي الذي نبديه في هذه األمور ال يعتبر رأيا متحفظا.
التقرير حول المتطلبات القانونية والتنظيمية األخرىإضافة إلى ذلك ووفقا لمتطلبات القانون االتحادي لدولة اإلمارات العربية
المتحدة رقم )8( لسنة 1984 وتعديالته، وفيما يتعلق بالشركة، نفيدكم بما يلي:
أننا قد حصلنا على كافة المعلومات التي اعتبرناها ضرورية ألغراض . 1تدقيقنا.
أن البيانات المالية تتوافق من كافة النواحي الجوهرية مع األحكام السارية . 2للقانون االتحادي لدولة اإلمارات العربية المتحدة رقم )8( لسنة 1984
وتعديالته والنظام األساسي للشركة.أن الشركة قد احتفظت بدفاتر محاسبية سليمة ونفذت الجرد الفعلي . 3
للمخزون وفق اإلجراءات السليمة المتعارف عليها. أن المعلومات المالية التي يتضمنها تقرير مجلس اإلدارة تتوافق مع الدفاتر . 4
المحاسبية للشركة.لم يلفت انتباهنا ما يجعلنا نعتقد بأن الشركة قد أخلت بأي من األحكام . 5
السارية للقانون االتحادي لدولة اإلمارات العربية المتحدة رقم )8( لسنة 1984، وتعديالته، أو نظامها األساسي بشكل يمكن أن يكون له تأثير
جوهري على أنشطة الشركة أو مركزها المالي كما في 31 ديسمبر 2014.
برايس ووترهاوس كوبرز30 مارس 2015
بول سودابي سجل مدققي الحسابات المشتغلين رقم 309
دبي، اإلمارات العربية المتحدة
تقرير مدقق الحسابات المستقل إلى السادة المساهمين في شركة / دريك أند سكل انترناشيونال ش.م.ع
برايس وترهاوس كوبرز، إعمار اسكوير، المبنى رقم 4، الطابق الثامن، ص.ب. 11987، دبي اإلمارات العربية المتحدة
هاتف: 3043100 4 )0( 971 +، فاكس: 3469150 4 )0( 971 +، WWW.PWC.COM/MIDDLE-EAST
أمين حسن ناصر، بول سودابي، جاك فاخوري, دوجالس أومهوني مسجلون لدى وزارة االقتصاد بدولة اإلمارات العربية المتحدة كمدققي حسابات مشتغلين

010Annual Report
2013ألف درهم
2014ألف درهم إيضاح
الموجوداتالموجودات غير المتداولة
510,680 534,538 6 ممتلكات ومعدات
1,098,469 1,060,719 7 موجودات غير ملموسة
29,376 29,376 10 استثمارات عقارية
93,249 264,812 29 استثمارات
5,646 5,811 9 موجودات ضريبة دخل مؤجلة
75,159 40,753 11 موجودات مالية متوفرة للبيع
212,503 227,650 8 ذمم مدينة تجارية وأخرى
2,025,082 2,163,659
موجودات متداولة
30,259 44,817 13 مخزون
19,111 19,111 عقارات بغرض التطوير
4,256,323 5,474,175 8 ذمم مدينة تجارية وأخرى
268,628 91,479 21 مبالغ مستحقة من أطراف ذات عالقة
4,678 5,368 12 موجودات مالية بالقيمة العادلة من خالل الربح أو الخسارة
558,217 758,120 14 أرصدة نقدية ومصرفية
5,137,216 6,393,070
7,162,298 8,556,729 مجموع الموجودات
حقوق الملكية والمطلوباتك الشركة األم حقوق الملكية العائدة لمـال
2,285,047 2,285,047 15 رأس المال
3,026 3,026 15 عالوة إصدار
93,722 116,677 16 احتياطي قانوني
24,543 24,543 17 احتياطي آخر
515,801 593,554 أرباح محتجزة
(15,685) (15,286) احتياطي تحويل عمالت أجنبية
2,906,454 3,007,561
68,372 68,425 الحصص غير المسيطرة
2,974,826 3,075,986 مجموع حقوق الملكية
الميزانية العمومية الموحدة كما في 31 ديسمبر
اإليضاحات المدرجة في الصفحات من 18 إلى 49 تعتبر جزءا ال يتجزأ من هذه البيانات المالية الموحدة.

011 Annual Report
2013ألف درهم
2014ألف درهم إيضاح
المطلوباتمطلوبات غير متداولة
48,878 534,084 18 قروض مصرفية
2,414 2,153 9 مطلوبات ضريبة دخل مؤجلة
110,234 150,962 20 مكافآت نهاية الخدمة للموظفين
161,526 687,199
مطلوبات متداولة2,938,909 2,988,595 19 ذمم دائنة تجارية وأخرى
1,067,592 1,676,599 18 قروض مصرفية
19,445 128,350 21 مبالغ مستحقة ألطراف ذات عالقة
4,025,946 4,793,544
4,187,472 5,480,743 مجموع المطلوبات
7,162,298 8,556,729 مجموع حقوق الملكية والمطلوبات
الميزانية العمومية الموحدة كما في 31 ديسمبر
تمت الموافقة على إصدار هذه البيانات المالية الموحدة من قبل مجلس اإلدارة بتاريخ 30 مارس 2015، ووقعها بالنيابة عن المجلس:
الرئيس التنفيذيرئيس مجلس اإلدارة
اإليضاحات المدرجة في الصفحات من 18 إلى 49 تعتبر جزءا ال يتجزأ من هذه البيانات المالية الموحدة.

012Annual Report
2013ألف درهم
2014ألف درهم إيضاح
4,879,189 4,762,264 5 إيرادات عقود
(4,382,296) (4,350,655) 24 تكاليف عقود
496,893 411,609 إجمالي الربح
20,658 31,003 23 إيرادات أخرى
(328,581) (373,668) 25 مصاريف عمومية وإدارية
(3,070) 690 27 أرباح / )خسائر( أخرى - بالصافي
185,900 69,634 ربح العمليات
23,147 11,658 22 إيرادات تمويل
(36,032) (21,456) 22 تكاليف تمويل
(12,885) (9,798) 22 تكاليف التمويل - بالصافي
64,043 65,995 1-29 حصة في ربح استثمار في مشروع مشترك
- (1,506) 2-29 حصة في خسارة استثمار في شركة زميلة
237,058 124,325 ربح السنة قبل الضريبة(55,323) (23,653) 28 مصروف ضريبة الدخل
181,735 100,672 ربح السنة
الربح العائد إلى: 166,469 100,708 مالك الشركة األم
15,266 (36) الحصص غير المسيطرة
181,735 100,672
ربح السهم 0.073 0.044 30 األساسي والمخفض )بالدرهم(
بيان الدخل الموحدالسنة المنتهيةفي 31 ديسمبر
اإليضاحات المدرجة في الصفحات من 18 إلى 49 تعتبر جزءا ال يتجزأ من هذه البيانات المالية الموحدة.

013 Annual Report
2013ألف درهم
2014ألف درهم
181,735 100,672 ربح السنة
الدخل الشامل اآلخربنود يحتمل إعادة تصنيفها الحقا في الربح أو الخسارة
(7,339) 399 تحويل العمالت األجنبية
(7,339) 399 الدخل الشامل األخر للسنة
174,396 101,071 مجموع الدخل الشامل للسنة
العائد إلى:159,130 101,107 مالك الشركة األم
15,266 (36) الحصص غير المسيطرة
174,396 101,071
بيان الدخل الشامل الموحدالسنة المنتهية في 31 ديسمبر
اإليضاحات المدرجة في الصفحات من 18 إلى 49 تعتبر جزءا ال يتجزأ من هذه البيانات المالية الموحدة.

014Annual Report
المجموعألف درهم
الحصص غير المسيطرةألف درهم
المجموعألف درهم
احتياطي تحويل عمالت أجنبية
ألف درهم
أرباح محتجزة
ألف درهم
احتياطيآخر
ألف درهم
احتياطي قانوني
ألف درهم
عالوةإصدار
ألف درهم
أسهمخزينة
ألف درهم
رأس المال
ألف درهم
2,974,826 68,372 2,906,454 (15,685) 515,801 24,543 93,722 3,026 - 2,285,047 الرصيد في 1 يناير 2014
100,672 (36) 100,708 - 100,708 - - - - - ربح السنة
399 - 399 399 - - - - - - الدخل الشامل اآلخر للسنة
101,071 (36) 101,107 399 100,708 - - - - - مجموع الدخل الشامل للسنة
- - - - (22,955) - 22,955 - - -تحويل من األرباح المحتجزة
إلى االحتياطي القانوني
89 89 - - - - - - - -مساهمات من الحصص
غير المسيطرة
3,075,986 68,425 3,007,561 (15,286) 593,554 24,543 116,677 3,026 - 2,285,047 الرصيد في 31 ديسمبر 2014
المجموعألف درهم
الحصص غير المسيطرةألف درهم
المجموعألف درهم
احتياطي تحويل عمالت أجنبية
ألف درهم
أرباح محتجزة
ألف درهم
احتياطيآخر
ألف درهم
احتياطيقانوني
ألف درهم
عالوةإصدار
ألف درهم
أسهم الخزينة
ألف درهم
رأس المال
ألف درهم
2,768,782 53,106 2,715,676 (8,346) 363,835 24,543 79,219 - (28,622) 2,285,047الرصيد في 1 يناير 2013
181,735 15,266 166,469 - 166,469 - - - - - ربح السنة
(7,339) - (7,339) (7,339) - - - - - - الدخل الشامل اآلخر للسنة
174,396 15,266 159,130 (7,339) 166,469 - - - - - مجموع الدخل الشامل للسنة
31,648 - 31,648 - - - - 3,026 28,622 -معامالت مع المالك
إعادة إصدار أسهم خزينة )إيضاح 17(
31,648 - 31,648 - - - - 3,026 28,622 - مجموع المعامالت مع المالك
- - - - (14,503) - 14,503 - - - تحويل من األرباح المحتجزة إلى االحتياطي القانوني
2,974,826 68,372 2,906,454 (15,685) 515,801 24,543 93,722 3,026 - 2,285,047 الرصيد في 31 ديسمبر 2013
بيان التغيرات في حقوق الملكية الموحد
اإليضاحات المدرجة في الصفحات من 18 إلى 49 تعتبر جزءا ال يتجزأ من هذه البيانات المالية الموحدة.

015 Annual Report
المجموعألف درهم
الحصص غير المسيطرةألف درهم
المجموعألف درهم
احتياطي تحويل عمالت أجنبية
ألف درهم
أرباح محتجزة
ألف درهم
احتياطيآخر
ألف درهم
احتياطي قانوني
ألف درهم
عالوةإصدار
ألف درهم
أسهمخزينة
ألف درهم
رأس المال
ألف درهم
2,974,826 68,372 2,906,454 (15,685) 515,801 24,543 93,722 3,026 - 2,285,047 الرصيد في 1 يناير 2014
100,672 (36) 100,708 - 100,708 - - - - - ربح السنة
399 - 399 399 - - - - - - الدخل الشامل اآلخر للسنة
101,071 (36) 101,107 399 100,708 - - - - - مجموع الدخل الشامل للسنة
- - - - (22,955) - 22,955 - - -تحويل من األرباح المحتجزة
إلى االحتياطي القانوني
89 89 - - - - - - - -مساهمات من الحصص
غير المسيطرة
3,075,986 68,425 3,007,561 (15,286) 593,554 24,543 116,677 3,026 - 2,285,047 الرصيد في 31 ديسمبر 2014
المجموعألف درهم
الحصص غير المسيطرةألف درهم
المجموعألف درهم
احتياطي تحويل عمالت أجنبية
ألف درهم
أرباح محتجزة
ألف درهم
احتياطيآخر
ألف درهم
احتياطيقانوني
ألف درهم
عالوةإصدار
ألف درهم
أسهم الخزينة
ألف درهم
رأس المال
ألف درهم
2,768,782 53,106 2,715,676 (8,346) 363,835 24,543 79,219 - (28,622) 2,285,047الرصيد في 1 يناير 2013
181,735 15,266 166,469 - 166,469 - - - - - ربح السنة
(7,339) - (7,339) (7,339) - - - - - - الدخل الشامل اآلخر للسنة
174,396 15,266 159,130 (7,339) 166,469 - - - - - مجموع الدخل الشامل للسنة
31,648 - 31,648 - - - - 3,026 28,622 -معامالت مع المالك
إعادة إصدار أسهم خزينة )إيضاح 17(
31,648 - 31,648 - - - - 3,026 28,622 - مجموع المعامالت مع المالك
- - - - (14,503) - 14,503 - - - تحويل من األرباح المحتجزة إلى االحتياطي القانوني
2,974,826 68,372 2,906,454 (15,685) 515,801 24,543 93,722 3,026 - 2,285,047 الرصيد في 31 ديسمبر 2013
بيان التغيرات في حقوق الملكية الموحد
اإليضاحات المدرجة في الصفحات من 18 إلى 49 تعتبر جزءا ال يتجزأ من هذه البيانات المالية الموحدة.

016Annual Report
2013ألف درهم
2014ألف درهم إيضاح
أنشطة العمليات237,058 124,325 ربح السنة قبل الضريبة
تعديالت بسبب:
(64,043) (65,995) 1-29 حصة في ربح استثمار في مشروع مشترك
- 1,506 2-29 حصة في خسارة استثمار في شركة زميلة
47,388 70,615 6 استهالك
37,750 37,750 7 إطفاء موجودات غير ملموسة
41,665 49,076 20 مخصص مكافآت نهاية الخدمة للموظفين
)ربح( / خسارة القيمة العادلة لموجودات مالية بالقيمة العادلة
143 (690) 27 من خالل الربح أو الخسارة
(5,583) - 27 ربح القيمة العادلة من تسوية مقايضات األسهم
4,050 - 27 خسارة القيمة العادلة من مقايضات أسعار الفائدة
27 - 27 خسارة من تسوية خيارات األسهم
(727) - 11 عكس االنخفاض في قيمة موجودات مالية متوفرة للبيع
5,160 - 27 خسارة من بيع عقارات بغرض التطوير
(23,147) (11,658) 22 إيرادات تمويل
36,032 98,958 22 تكاليف تمويل
(982) (160) 23 ربح من استبعاد ممتلكات ومعدات
22,509 54,416 25 مخصص االنخفاض في قيمة ذمم مدينة تجارية ومحتجزات - بالصافي
337,300 358,143التدفقات النقدية للعمليات قبل دفع مكافآت نهاية الخدمة للموظفين
وضريبة الدخل والتغيرات في رأس المال العامل
(16,100) (8,348) 20 مكافآت نهاية الخدمة المدفوعة للموظفين
(49,760) (17,301) ضريبة دخل مدفوعة
التغيرات في رأس المال العامل (3,749) (14,558) مخزون
(1,306) - عقارات بغرض التطوير
(578,182) (1,327,240) ذمم مدينة تجارية وأخرى قبل المخصصات وباستثناء الفائدة المدينة
والقروض والدفعات المقدمة
(242,638) مبالغ مستحقة من أطراف ذات عالقة 177,149
732,064 30,930 ذمم دائنة تجارية وأخرى باستثناء ضريبة الدخل والفوائد الدائنة
7,746 108,905 مبالغ مستحقة ألطراف ذات عالقة
(20,153) - أدوات مالية مشتقة
165,222 (692,320) صافي النقد )المستخدم في ( / الناتج من أنشطة العمليات165,222 (692,320) الرصيد المرحل
بيان التدفقات النقدية الموحدالسنة المنتهية في 31 ديسمبر
اإليضاحات المدرجة في الصفحات من 18 إلى 49 تعتبر جزءا ال يتجزأ من هذه البيانات المالية الموحدة.

017 Annual Report
2013ألف درهم
2014ألف درهم
إيضاح
165,222 (692,320) الرصيد المرحل
أنشطة االستثمار(86,733) (95,939) 6 شراء ممتلكات ومعدات
32,229 1,057 عوائد من استبعاد ممتلكات ومعدات
(29,206) (53,766) 29-2 استثمار في شركة زميلة
(72,048) (18,902) 11 استثمار في موجودات مالية متوفرة للبيع
9,683 46,550 8 قروض وسلفيات
15,083 4,933 فوائد مقبوضة
(130,992) (116,067) صافي النقد المستخدم في أنشطة االستثمار
أنشطة التمويل(68,608) (88,128) 14 ودائع ألجل مرهونة
31,648 - 15 عوائد من إعادة إصدار أسهم خزينة
277,477 صافي العوائد من إيصاالت األمانة والقروض األخرى 153,877
24,350 933,833 18 عوائد من قروض ألجل
(577,659) (231,093) 18 سداد قروض ألجل
- 89 مساهمة حصة غير مسيطرة في رأس مال شركة تابعة
(21,856) (86,980) فوائد مدفوعة
(334,648) 681,598 صافي النقد الناتج من / )المستخدم في( أنشطة التمويل
(300,418) (126,789) صافي النقص في النقد وما في حكمه(4,217) 968 صافي الفروق من تحويل العمالت األجنبية
444,867 - حركة في نقد مقيد
182,034 322,266 النقد وما في حكمه في بداية السنة
322,266 196,445 14 النقد وما في حكمه في نهاية السنة
بيان التدفقات النقدية الموحد السنة المنتهية في 31 ديسمبر
اإليضاحات المدرجة في الصفحات من 18 إلى 49 تعتبر جزءا ال يتجزأ من هذه البيانات المالية الموحدة.

018Annual Report
إيضاحات حول البيانات المالية الموحدةللسنة المنتهية في 31 ديسمبر 2014
1
معلومات عامةتأسست شركة دريك أند سكل انترناشيونال ش.م.ع )“الشركة” أو “الشركة األم”( في 16 نوفمبر 2008، وسجلت في 21 يناير 2009 كشركة مساهمة عامة وفقا
للقانون االتحادي لدولة اإلمارات العربية المتحدة رقم )8( لسنة 1984 )وتعديالته(. إن أسهم الشركة مدرجة في سوق دبي المالي.
عنوان المقر المسجل للشركة هو ص.ب 65794 دبي، اإلمارات العربية المتحدة.
تتمثل األنشطة الرئيسية للشركة وشركاتها التابعة )معا “المجموعة”( في تنفيذ أعمال المقاوالت المتعلقة بقطاع اإلنشاءات وتشمل المقاوالت الكهربائية والصحية والنفط والغاز والتكييف والتبريد والصرف الصحي في منطقة الشرق األوسط وأوروبا وآسيا وشمال أفريقيا.
فيما يلي الشركات الرئيسية التابعة بصورة مباشرة أو غير مباشرة للشركة:
تمتلك المجموعة، من خالل شركة جلف تكنيكال كونستركشن ش.ذ.م.م، حصة بنسبة ٪50 في رانيا تست مشروع مشترك، وهو مشروع مشترك مع شركة رانيا للمقاوالت العامة ذ.م.م بموجب اتفاقية مشروع مشترك مبرمة بتاريخ 12 أغسطس 2005. وهذا المشروع مصنف ضمن العمليات المشتركة في هذه البيانات المالية
الموحدة.
تمتلك المجموعة أيضا، من خالل شركة دريك أند سكل انترناشيونال للمقاوالت ش.م.م، حصة بنسبة ٪50 في مشروع مشترك مع شركة أبناء حسن عالم )أبناء مصر للتعمير ش.م.م( بموجب اتفاقية مشروع مشترك مبرمة بتاريخ 21 يوليو 2011. وهذا المشروع مصنف ضمن العمليات المشتركة في هذه البيانات المالية الموحدة.
تمتلك المجموعة أيضا، من خالل شركة دريك أند سكل انترناشيونال السعودية ذ.م.م، حصة بنسبة ٪50 في مشروع مشترك مع شركة سبيكون السعودية ذ.م.م بموجب اتفاقية مشروع مشترك مبرمة بتاريخ 14 فبراير 2013. وهذا المشروع مصنف ضمن العمليات المشتركة في هذه البيانات المالية الموحدة.
بلد التأسيس نسبة الملكية ٪ األنشطة الرئيسية الشركات التابعة الرئيسية
2013 2014
اإلمارات العربية المتحدة 100 100 أعمال المقاوالت المتعلقة بالهندسة الميكانيكية والكهربائية والصحية دريك أند سكل انترناشيونال ذ.م.م )أبوظبي(
اإلمارات العربية المتحدة 100 100 األعمال الميكانيكية والكهربائية واإلنشاءات المدنية شركة جلف تكنيكال كونستركشن ش.ذ.م.م
اإلمارات العربية المتحدة 100 100 هندسة وشراء وإنشاء مشاريع البنية التحتية للمياه والطاقة
دريك أند سكل للهندسة، سابقا دريك أند سكل للمياه والطاقة ذ.م.م
الكويت 75 75 المقاوالت الميكانيكية والكهربائية وأعمال التصليح المتعلقة بقطاع اإلنشاءات
دريك أند سكل انترناشيونال للمقاوالت الكهربائية ذ.م.م
قطر 100 100 األنشطة الميكانيكية والكهربائية والصحية دريك أند سكل انترناشيونال )قطر( ذ.م.م
ألمانيا 100 100 إنشاء محطات معالجة مياه الصرف والمياه والرواسب
باسافانت للطاقة والبيئة وشركاتها التابعة )شركة تابعة لشركة باسفانت إنجينيرينغ ليمتد(
المملكة العربية السعودية 65 65 تنفيذ عقود اإلنشاءات وتشغيل وصيانة التركيبات
الكهربائية والميكانيكية وما يتعلق بها من أنشطة دريك أند سكل انترناشيونال ذ.م.م
المملكة العربية السعودية 100 100 أعمال المقاوالت المتعلقة بقطاع اإلنشاءات شركة المركز العالمي للمقاوالت المحدودة
المملكة العربية السعودية 94 94 أعمال المقاوالت المتعلقة بقطاع اإلنشاءات شركة دريك أند سكل لإلنشاءات ذ.م.م
جمهورية مصر العربية 100 100 أعمال المقاوالت المتعلقة بالهندسة الميكانيكية والكهربائية والصحية دريك أند سكل انترناشيونال للمقاوالت ش.م.م
سلطنة عمان 51 51 أعمال المقاوالت المتعلقة بالهندسة الميكانيكية والكهربائية والصحية دريك أند سكل انترناشيونال ذ.م.م )عمان(

019 Annual Report
إيضاحات حول البيانات المالية الموحدةللسنة المنتهية في 31 ديسمبر 2014
تمتلك المجموعة أيضا، من خالل شركة دريك أند سكل لإلنشاءات ذ.م.م، حصة بنسبة ٪50 في مشروع مشترك مع مجموعة المقاولون المتحدون ذ.م.م
)أوفشور( )سي سي سي( بموجب اتفاقية مشروع مشترك مبرمة بتاريخ 27 سبتمبر 2011. وهذا المشروع مصنف ضمن العمليات المشتركة في هذه
البيانات المالية الموحدة.
تمتلك المجموعة أيضا، من خالل شركة دريك أند سكل لإلنشاءات ذ.م.م - المملكة العربية السعودية، حصة بنسبة ٪50 في مشروع مشترك مع
الشركة السعودية لإلنشاءات )الشركة السعودية لإلنشاءات - دريك أند سكل لإلنشاءات مشروع مشترك( بموجب اتفاقية مشروع مشترك مبرمة بتاريخ
15 أكتوبر 2012. وهذا المشروع مصنف ضمن العمليات المشتركة في هذه البيانات المالية الموحدة.
تمتلك المجموعة أيضا، من خالل شركة دريك أند سكل لإلنشاءات ذ.م.م، حصة بنسبة ٪50 في مشروع مشترك مع شركة جون سيسك أند صنز لإلنشاءات ذ.م.م )SISK-DSC-SMH-JOINT VENTURE( بموجب اتفاقية مشروع مشترك
مبرمة بتاريخ 25 نوفمبر 2012. وهذا المشروع مصنف ضمن العمليات المشتركة في هذه البيانات المالية الموحدة.
تمتلك شركة دريك أند سكل انترناشيونال ش.م.ع أيضا حصة بنسبة ٪50 في مشروع مشترك مع شركة )اس آي سي آي إم( اس. بي. أيه. بموجب اتفاقية
مشروع مشترك مبرمة بتاريخ 11 يناير 2013. وهذا المشروع مصنف ضمن العمليات المشتركة في هذه البيانات المالية الموحدة.
تمتلك شركة دريك أند سكل انترناشيونال ش.م.ع أيضا حصة بنسبة ٪51 في مشروع مشترك مع شركة الحبتور سبيكون ذ.م.م )دريك أند سكل انترناشيونال
- الحبتور ليتون سبيكون مشروع مشترك( بموجب اتفاقية مشروع مشترك مبرمة بتاريخ 17 أبريل 2013. وهذا المشروع مصنف ضمن العمليات المشتركة
في هذه البيانات المالية الموحدة.
تمتلك شركة دريك أند سكل للهندسة ذ.م.م أيضا حصة بنسبة ٪49 في مشروع مشترك مع شركة الحبتور سبيكون ذ.م.م )دريك أند سكل انترناشيونال
- الحبتور ليتون سبيكون مشروع مشترك( بموجب اتفاقية مشروع مشترك مبرمة بتاريخ 1 مايو 2013. وهذا المشروع مصنف ضمن العمليات المشتركة
في هذه البيانات المالية الموحدة.
تمتلك المجموعة أيضا، من خالل شركة دريك أند سكل )جزر الكايمان( رقم 3 ليمتد، حصة بنسبة ٪50 في مشروع مشترك مع شركة أمنيات للعقارات 27
المحدودة )دي اس أو للتطوير المحدودة( بموجب اتفاقية مشروع مشترك مبرمة بتاريخ 6 نوفمبر 2012. وهذا المشروع مصنف ضمن العمليات المشتركة في
هذه البيانات المالية الموحدة.
2
ملخص السياسات المحاسبية الهامة إن السياسات المحاسبية الرئيسية المطبقة في إعداد هذه البيانات المالية الموحدة مبينة أدناه. لقد تم تطبيق هذه السياسات بشكل ثابت على كافة
السنوات المعروضة ما لم يذكر خالفا لذلك.
2-1-1أساس اإلعداد
لقد تم إعداد البيانات المالية الموحدة للمجموعة وفقا للمعايير الدولية للتقارير المالية والتفسيرات الصادرة عن لجنة تفسيرات المعايير الدولية للتقارير المالية السارية على الشركات التي تقوم بإعداد تقاريرها المالية وفقا للمعايير الدولية للتقارير المالية. لقد تم إعداد هذه البيانات المالية الموحدة طبقا لمبدأ التكلفة
التاريخية، باستثناء ما يتم بيانه في السياسات المحاسبية الموضحة أدناه.
إن إعداد البيانات المالية الموحدة بالتوافق مع المعايير الدولية للتقارير المالية يقتضي استخدام تقديرات محاسبية أساسية محددة، كما يقتضي من اإلدارة
إبداء رأيها في عملية تطبيق السياسات المحاسبية للمجموعة. يتم اإلفصاح عن المجاالت التي تنطوي على درجة عالية من إبداء الرأي أو التعقيد أو المجاالت التي تعد فيها االفتراضات والتقديرات أساسية للبيانات المالية الموحدة في
اإليضاح رقم 4.
2-1-2التغيرات في السياسة المحاسبية واإلفصاحات
)أ( المعايير والتعديالت والتفسيرات الجديدة المطبقة من قبل المجموعة
فيما يلي المعايير المطبقة من قبل المجموعة للمرة األولى على السنة المالية التي تبدأ في أو بعد 1 يناير 2014 وليس لها تأثير جوهري على المجموعة:
المعيار المحاسبي الدولي رقم 32 )تعديل(، “األدوات المالية: العرض”، )ساري المفعول اعتبارا من 1 يناير 2014(.
المعيار المحاسبي الدولي رقم 36 )تعديل(، “االنخفاض في قيمة الموجودات”، )ساري المفعول اعتبارا من 1 يناير 2014(.
المعيار المحاسبي الدولي رقم 39 )تعديل(، “األدوات المالية: االعتراف والقياس”، )ساري المفعول اعتبارا من 1 يناير 2014(.
التعديالت على المعيار الدولي للتقارير المالية رقم 10 ورقم 12 والمعيار المحاسبي الدولي رقم 27 حول توحيد المنشآت االستثمارية )سارية
المفعول اعتبارا من 1 يناير 2014(.

020Annual Report
إيضاحات حول البيانات المالية الموحدةللسنة المنتهية في 31 ديسمبر 2014
المملوكة سابقا أقل من القيمة العادلة لصافي موجودات الشركة التابعة المستحوذ عليها من خالل اتفاقية شراء بالمقايضة، يتم احتساب الفرق مباشرة
في بيان الدخل الموحد )إيضاح 6-2(.
في حال تم إجراء اندماج األعمال على مراحل، فإن القيمة الدفترية بتاريخ االستحواذ للحصص المملوكة سابقا للشركة المستحوذة في الشركة
المستحوذ عليها تتم إعادة قياسها بالقيمة العادلة في تاريخ االستحواذ. ويتم االعتراف بأي أرباح أو خسائر ناتجة عن عملية إعادة القياس في حساب الربح أو
الخسارة.
إن أي مقابل مالي يحتمل تحويله من قبل المجموعة يتم تسجيله بالقيمة العادلة في تاريخ االستحواذ. ويتم احتساب التغيرات الالحقة على القيمة
العادلة للمقابل المحتمل المزمع تصنيفه ضمن الموجودات أو المطلوبات وفقا لمتطلبات المعيار المحاسبي الدولي رقم 39 إما في حساب األرباح والخسائر أو ضمن التغيرات في الدخل الشامل اآلخر. ال يعاد قياس المقابل المحتمل المصنف ضمن حقوق الملكية ويتم االعتراف بتسويته الالحقة ضمن حقوق
الملكية.
تحذف كافة المعامالت الداخلية واألرصدة واألرباح غير المحققة عن المعامالت التي تتم بين شركات المجموعة. كما يتم حذف الخسائر غير المحققة. لقد تم تعديل المبالغ المدرجة من قبل الشركات التابعة، عند االقتضاء، حتى تتوافق
مع السياسات المحاسبية لدى المجموعة.
إن المعامالت المبرمة مع حملة الحصص غير المسيطرة التي ال تؤدي إلى فقدان السيطرة يتم احتسابها كمعامالت أسهم - وهي كالمعامالت التي تتم ك بوصفهم مالكا. إن الفروقات بين القيمة العادلة للمقابل المدفوع مع المـالوالحصة ذات الصلة المستحوذ عليها من القيمة الدفترية للموجودات الصافية
للشركة التابعة يتم إدراجها في حقوق الملكية. ويتم أيضا إدراج األرباح أو الخسائر الناتجة عن بيع الحصص غير المسيطرة ضمن حقوق الملكية.
)ب( المشاريع المشتركةتطبق المجموعة المعيار الدولي للتقارير المالية رقم 11 على كافة ترتيباتها المشتركة. وبموجب هذا المعيار، يتم تصنيف االستثمارات في الترتيبات المشتركة إما كعمليات مشتركة أو كمشاريع مشتركة على أساس الحقوق
وااللتزامات التعاقدية لكل مستثمر. قامت المجموعة بتقييم طبيعة ترتيباتها المشتركة وقررت أنها تضم كال النوعين، المشاريع المشتركة والعمليات
المشتركة. تحتسب المشاريع المشتركة باستخدام طريقة حقوق الملكية، بينما يتم توحيد العمليات المشتركة على أساس تناسبي لكل حالة على حدة.
وفقا لطريقة حقوق الملكية المحاسبية، يتم احتساب الحصص في المشاريع المشتركة مبدئيا بالتكلفة ثم يتم تعديلها بعد ذلك الحتساب حصة المجموعة
في األرباح والخسائر الناتجة بعد االستحواذ والحركات في الدخل الشامل اآلخر. عندما تكون حصة المجموعة في خسائر مشروع مشترك مساوية أو زائدة عن حصصها في المشاريع المشتركة )التي تشمل حصصا طويلة األجل تشكل،
في جوهرها، جزءا من صافي استثمارات المجموعة في المشاريع المشتركة(، ال تحتسب المجموعة خسائر إضافية إال إذا تكبدت التزامات أو أجرت دفعات
بالنيابة عن المشروع المشترك.
)ج( الشركات الزميلة الشركات الزميلة هي كافة المنشآت التي تمارس عليها المجموعة تأثيرا جوهريا
دون السيطرة عليها، ويرافق ذلك بشكل عام استحواذ المجموعة على نسبة من ٪20 إلى ٪50 من حقوق التصويت. تحتسب االستثمارات في الشركات الزميلة باستخدام طريقة حقوق الملكية المحاسبية. وبموجب هذه الطريقة يتم تسجيل االستثمار مبدئيا بسعر التكلفة، وتتم زيادة أو تخفيض القيمة الدفترية من أجل
تسجيل حصة المستثمر في ربح أو خسارة الشركة المستثمر فيها بعد تاريخ
)ب( المعايير والتعديالت والتفسيرات الجديدة غير المطبقة حتى تاريخههناك بعض المعايير الجديدة وتعديالت المعايير والتفسيرات سارية المفعول
على الفترات السنوية التي تبدأ في أو بعد 1 يناير 2014 ولكن لم يتم تطبيقها عند إعداد هذه البيانات المالية الموحدة وهي كالتالي:
المعيار المحاسبي الدولي رقم 19 )تعديل(، “منافع الموظفين”، )ساري المفعول اعتبارا من 1 يوليو 2014(.
المعيار المحاسبي الدولي رقم 27 )تعديل(، “البيانات المالية المنفصلة”، )يسري اعتبارا من 1 يناير 2016(.
المعيار الدولي للتقارير المالية رقم 7، “األدوات المالية: اإلفصاحات” )يسري اعتبارا من 1 يناير 2016(.
المعيار الدولي للتقارير المالية رقم 9 )تعديل(، “األدوات المالية”، )يسري اعتبارا من 1 يناير 2018(.
المعيار الدولي للتقارير المالية رقم 11 )تعديل(، “الترتيبات المشتركة”، )يسري اعتبارا من 1 يناير 2016(.
المعيار الدولي للتقارير المالية رقم 15، “اإليرادات من العقود مع العمالء”، )يسري اعتبارا من 1 يناير 2017(.
ال توجد معايير أخرى من المعايير الدولية للتقارير المالية أو تفسيرات صادرة عن لجنة تفسيرات المعايير الدولية للتقارير المالية غير سارية حتى تاريخه ويتوقع أن
يكون لها تأثير جوهري على المجموعة.
تقوم المجموعة حاليا بتقييم مدى تأثير التعديالت والمعايير الجديدة المذكورة أعاله، وال تتوقع أن يكون ألي منها أي تأثير جوهري على البيانات المالية
الموحدة للمجموعة.
2-2التوحيد
)أ( الشركات التابعة الشركات التابعة هي كافة المنشآت )بما في ذلك المنشآت ذات األغراض
الخاصة( الخاضعة لسيطرة المجموعة. تسيطر المجموعة على منشأة ما عندما يكون للمجموعة حقوق أو عوائد متغيرة نتيجة مشاركتها في المنشأة إضافة
إلى قدرتها على التأثير على تلك العوائد من خالل سيطرتها على المنشأة. يتم توحيد الشركات التابعة بالكامل اعتبارا من تاريخ تحول السيطرة إلى المجموعة
ويتم إيقاف التوحيد اعتبارا من تاريخ انتفاء السيطرة.
تستخدم المجموعة طريقة االستحواذ المحاسبية الحتساب اندماجات األعمال. إن المقابل المحول نظير االستحواذ على شركة تابعة يمثل القيمة العادلة للموجودات المحولة والمطلوبات المتكبدة للمـالك السابقين في الشركة
المستحوذ عليها وحصص حقوق الملكية الصادرة عن المجموعة. يشمل المقابل المحول القيمة العادلة ألي أصل أو مطلوب ناتج عن أي ترتيبات طارئة. يتم
مبدئيا قياس الموجودات القابلة للتحديد المستحوذ عليها وكذلك المطلوبات وااللتزامات الطارئة المحملة عن اندماجات األعمال، بقيمها العادلة بتاريخ
االستحواذ. تعترف المجموعة بأي حصص غير مسيطرة في الشركة المستحوذ عليها على أساس كل عملية استحواذ على حدة، ويكون ذلك إما بالقيمة العادلة
أو بنسبة الحصة غير المسيطرة من المبالغ المعترف بها لصافي الموجودات الممكن تحديدها في الشركة المستحوذ عليها. تحتسب التكاليف المتعلقة
بعملية االستحواذ كمصروف عند تكبدها.
إن الزيادة في المقابل المحول عن قيمة الحصة غير المسيطرة في الشركة المستحوذ عليها والقيمة العادلة بتاريخ االستحواذ ألي حصص ملكية سابقة
في الشركة المستحوذ عليها، عن القيمة العادلة لحصة المجموعة في صافي الموجودات المحددة المستحوذ عليها يتم إدراجها تحت بند الشهرة. وفي حال
كان مجموع المقابل المحول والحصة غير المسيطرة المحتسبة والحصة المقاسة

021 Annual Report
إيضاحات حول البيانات المالية الموحدةللسنة المنتهية في 31 ديسمبر 2014
االستحواذ. يشمل استثمار المجموعة في الشركات الزميلة الشهرة المحددة عند االستحواذ.
إذا تم تخفيض حصة الملكية في شركة زميلة مع االحتفاظ بالتأثير الجوهري، فال يعاد تصنيف إال الحصة المتناسبة من المبالغ التي سبق االعتراف بها في
الدخل الشامل اآلخر إلى الربح أو الخسارة عند االقتضاء.
يتم إثبات حصة المجموعة في أرباح أو خسائر ما بعد االستحواذ ضمن بيان الدخل الموحد، أما حصتها في حركات ما بعد االستحواذ في الدخل الشامل
اآلخر يتم تسجيلها ضمن الدخل الشامل اآلخر مع إجراء التعديل المكافئ لذلك على القيمة الدفترية لالستثمار. عندما تكون حصة المجموعة في خسائر الشركة الزميلة مساوية لحصتها في نفس الشركة أو زائدة عنها، بما في ذلك أي ذمم
مدينة أخرى غير مضمونة، فإن المجموعة ال تسجل أي خسائر إضافية إال إذا ترتب عليها التزامات قانونية أو ضمنية أو أجرت دفعات نيابة عن الشركة الزميلة.
تحدد المجموعة بتاريخ كل تقرير مدى توفر أي دليل موضوعي على تعرض االستثمار في الشركة الزميلة لالنخفاض في القيمة. فإذا وجد مثل هذا الدليل،
تحتسب المجموعة مبلغ االنخفاض في القيمة على أساس الفرق بين القيمة القابلة لالسترداد للشركة الزميلة وقيمتها الدفترية ثم تسجل قيمة الحصة في
ربح / )خسارة( الشركات الزميلة في بيان الدخل الموحد.
ال يتم تسجيل األرباح والخسائر الناتجة عن المعامالت التصاعدية والتنازلية بين المجموعة وشركتها الزميلة في البيانات المالية للمجموعة إال بقدر حصة المستثمر غير المتصلة بذلك في الشركة الزميلة. كما يتم حذف الخسائر غير
المحققة إال إذا كانت المعاملة تدل على وجود انخفاض في قيمة األصل المحول. لقد تم تعديل السياسات المحاسبية للشركات الزميلة عند الضرورة بما
يضمن اتساقها مع السياسات المطبقة من قبل المجموعة.
يتم تسجيل األرباح والخسائر المخفضة الناشئة عن االستثمارات في الشركات الزميلة ضمن بيان الدخل الموحد.
2-3تقارير القطاعات
يتم إعداد التقارير عن القطاعات التشغيلية بطريقة تتفق مع طريقة رفع التقارير الداخلية إلى المسؤول الرئيسي عن اتخاذ القرارات بشأن العمليات
التشغيلية. إن المسؤول الرئيسي عن اتخاذ القرارات بشأن العمليات التشغيلية الذي يقع على عاتقه تخصيص الموارد وتقييم أداء القطاعات التشغيلية هي
اإلدارة التنفيذية التي تضطلع باتخاذ القرارات االستراتيجية. وبذلك تكون “اإلدارة التنفيذية” هي المسؤول الرئيسي عن اتخاذ القرارات بشأن العمليات
التشغيلية.
2-4تحويل العمالت األجنبية
)أ( العملة الوظيفية وعملة العرضيتم قياس البنود المدرجة في البيانات المالية لكل شركة من شركات المجموعة
باستخدام عملة البيئة االقتصادية الرئيسية التي تعمل هذه الشركة ضمنها )‘العملة الوظيفية’(. إن البيانات المالية الموحدة معروضة بدرهم اإلمارات
العربية المتحدة )“الدرهم اإلماراتي”(، وهو عملة العرض للمجموعة.
)ب( المعامالت واألرصدةيتم تحويل المعامالت الناشئة بالعمالت األجنبية إلى العملة الوظيفية
باستخدام أسعار الصرف السائدة بتواريخ المعامالت أو التقييم عند إعادة قياس البنود. كما يتم احتساب أرباح وخسائر صرف العمالت األجنبية، الناتجة عن
تسوية هذه المعامالت وعن تحويل الموجودات والمطلوبات النقدية المقومة
بالعمالت األجنبية بأسعار الصرف السائدة في نهاية السنة، في بيان الدخل الموحد.
يتم عرض األرباح والخسائر من صرف العمالت األجنبية فيما يتعلق بالقروض والنقد وما في حكمه في بيان الدخل الموحد ضمن بند “إيرادات أو تكاليف
تمويل”. كما يتم عرض كافة األرباح والخسائر األخرى من صرف العمالت األجنبية في بيان الدخل الموحد.
إن الفروقات الناشئة عن تحويل الموجودات والمطلوبات المالية غير النقدية مثل حقوق الملكية المحتفظ بها بالقيمة العادلة من خالل الربح أو الخسارة يتم احتسابها ضمن الربح أو الخسارة كجزء من أرباح أو خسائر القيمة العادلة، بينما يتم إدراج الفروقات من تحويل الموجودات المالية غير النقدية، مثل األسهم
المصنفة كمتوفرة للبيع، في الدخل الشامل اآلخر.
)ج( شركات المجموعةإن النتائج والمركز المالي لكافة شركات المجموعة )التي ال تعاني عملتها من
اقتصاد متضخم( والتي لها عملة وظيفية تختلف عن عملة العرض يتم تحويل كل منهما إلى عملة العرض على النحو التالي:
يتم تحويل الموجودات والمطلوبات، لكل ميزانية عمومية معروضة، بسعر . 1اإلقفال بتاريخ تلك الميزانية العمومية.
يتم تحويل اإليرادات والمصاريف لكل بيان دخل بمتوسط أسعار الصرف . 2)إال إذا كان متوسط السعر ال يمثل تقريبا معقوال للتأثير المتراكم ألسعار
الصرف السائدة في تواريخ المعامالت، وفي هذه الحالة يتم تحويل اإليرادات والمصاريف بأسعار الصرف في تواريخ المعامالت(.
يتم االعتراف بفروق الصرف الناتجة في الدخل الشامل اآلخر.. 3
إن الشهرة وتعديالت القيمة العادلة الناشئة عن االستحواذ على منشأة أجنبية تتم معاملتهما كموجودات وكمطلوبات منشأة أجنبية ويتم تحويلهما بسعر
اإلقفال. ويتم احتساب فروق الصرف الناشئة ضمن الدخل الشامل اآلخر.
2-5ممتلكات ومعدات
يتم إظهار الممتلكات والمعدات بالتكلفة التاريخية ناقصا االستهالك. تشمل التكلفة التاريخية النفقات المنسوبة مباشرة إلى اقتناء البنود. قد تشمل التكلفة أيضا التحويالت من حقوق الملكية بالنسبة لألرباح / الخسائر من
تحوطات التدفقات النقدية المؤهلة لمشتريات الممتلكات والمعدات التي تتم بالعمالت األجنبية.
ال يتم إدراج التكاليف الالحقة في القيمة الدفترية لألصل أو احتسابها كأصل منفصل، حسبما يكون مالئما، إال عندما يكون من المرجح أن تتدفق إلى
المجموعة فوائد اقتصادية مستقبلية مرتبطة بالبند ويكون باإلمكان قياس تكلفة البند بشكل موثوق به. يتم إيقاف احتساب القيمة الدفترية للجزء
المستبدل. ويتم تحميل كافة تكاليف أعمال التصليح والصيانة األخرى في بيان الدخل الموحد خالل الفترة المالية التي يتم خاللها تكبد هذه التكاليف.
األرض ال تستهلك. ويحتسب االستهالك على الموجودات األخرى باستخدام طريقة القسط الثابت بمعدالت تحتسب لتوزيع تكلفة الموجودات ناقصا قيمتها
التقديرية المتبقية على مدى أعمارها اإلنتاجية المتوقعة، وذلك على النحو التالي:

022Annual Report
إيضاحات حول البيانات المالية الموحدةللسنة المنتهية في 31 ديسمبر 2014
السنواتمبان 5 إلى 10 سنوات
آالت سنتان إلى 5 سنوات
أثاث وتجهيزات ومعدات مكتبية سنتان إلى 5 سنوات
مركبات 3 إلى 5 سنوات
تتم مراجعة القيم المتبقية للموجودات وأعمارها اإلنتاجية، وتعديلها عند الضرورة، بتاريخ كل فترة تقرير.
يتم إظهار األعمال الرأسمالية قيد اإلنجاز بالتكلفة، وعندما تصبح جاهزة لالستخدام يتم تحويلها إلى فئة الممتلكات والمعدات أو الموجودات غير
الملموسة ويتم استهالكها أو إطفاؤها وفقا لسياسات المجموعة.عندما تكون القيمة الدفترية لألصل أكبر من قيمته التقديرية القابلة لالسترداد،
يتم خفضها مباشرة إلى القيمة القابلة لالسترداد )إيضاح 2-7(.
يتم تحديد األرباح والخسائر من عمليات االستبعاد بمقارنة العوائد مع القيمة الدفترية، ويتم احتسابها ضمن بيان الدخل الموحد.
إن تكاليف االقتراض المحددة المنسوبة مباشرة إلى تشييد الموجودات المؤهلة التي تتطلب فترة زمنية طويلة لكي تصبح جاهزة لالستخدام المخصص
لها أو للبيع، يتم إضافتها إلى تكلفة تلك الموجودات حتى يأتي الوقت الذي تصبح فيه تلك الموجودات جاهزة تماما لالستخدام أو البيع. يتم االعتراف
بتكاليف االقتراض األخرى ضمن بيان الدخل الموحد خالل الفترة التي يتم تكبدها فيها.
2-6موجودات غير ملموسة
)أ( الشهرة تنشأ الشهرة نتيجة االستحواذ على الشركات التابعة وتمثل الزيادة في المقابل المحول عن حصة الشركة األم في صافي القيمة العادلة للموجودات الصافية
المحددة والمطلوبات وااللتزامات المحتملة للشركة المستحوذ عليها والقيمة العادلة للحصص غير المسيطرة في الشركة المستحوذ عليها.
وألغراض فحص االنخفاض في القيمة، يتم توزيع الشهرة المستحوذ عليها من اندماج األعمال على كل وحدة من الوحدات المولدة للنقد أو مجموعات الوحدات المولدة للنقد، التي يتوقع أن تستفيد من التفاعل المتبادل الناتج عن االندماج.
إن كل وحدة أو مجموعة من الوحدات المولدة للنقد التي يتم توزيع الشهرة عليها تمثل أقل مستوى داخل المنشأة يتم من خالله مراقبة الشهرة لألغراض
اإلدارية الداخلية. تتم مراقبة الشهرة على مستوى القطاعات التشغيلية.
يتم إجراء عمليات المراجعة لتحري االنخفاض في قيمة الشهرة بشكل سنوي أو على فترات أقصر إذا أشارت األحداث أو التغيرات في الظروف إلى وجود انخفاض محتمل في القيمة. تتم مقارنة القيمة الدفترية للشهرة مع القيمة القابلة لالسترداد التي تمثل القيمة قيد االستخدام أو القيمة العادلة ناقصا
تكاليف البيع، أيهما أعلى. ويتم احتساب أي انخفاض في القيمة مباشرة كمصروف وال يتم عكسه الحقا.
)ب( األسماء التجارية يتم إظهار األسماء التجارية بالتكلفة التاريخية، ويتم احتساب األسماء التجارية
المستحوذ عليها من اندماج األعمال بالقيمة العادلة بتاريخ االستحواذ. إن األسماء التجارية ليس لها أعمار محددة وال يتم إطفاؤها نظرا النخفاض تكلفة
تجديدها إلى أدنى حد.
)ج( عالقات العمالءيتم إظهار عالقات العمالء المكتسبة من العقود مبدئيا بالقيمة العادلة في تاريخ االستحواذ ويتم إدراجها الحقا بالتكلفة ناقصا اإلطفاء المتراكم. تتمتع
عالقات العمالء بأعمار محددة. ويتم احتساب اإلطفاء باستخدام طريقة القسط الثابت لتوزيع تكلفة عالقات العمالء على مدى عمرها اإلنتاجي المقدر بفترة
عشر سنوات، وهي الفترة المقدرة لالستفادة منها.
)د( الطلبات التراكميةيتم احتساب الطلبات التراكمية المكتسبة على أساس القيمة الحالية للفوائد االقتصادية المستقبلية المتوقع الحصول عليها من هذه الطلبات بعد خصم تكلفة الموجودات المتعلقة بها، ويتم إدراجها الحقا بالتكلفة ناقصا اإلطفاء
المتراكم. يتم احتساب اإلطفاء باستخدام طريقة القسط الثابت لتوزيع تكلفة الطلبات المتراكمة على مدى عمرها اإلنتاجي المقدر بفترة أربع سنوات، وهي
الفترة المقدرة لالستفادة منها.
2-7االنخفاض في قيمة الموجودات غير المالية
إن الموجودات التي ليس لها عمر إنتاجي محدد - مثل الشهرة أو الموجودات غير الملموسة غير المهيأة لالستخدام - ال تخضع لإلطفاء ويتم فحصها سنويا لتحري االنخفاض في قيمتها. تتم مراجعة الموجودات التي تخضع لإلطفاء /
االستهالك لتحري االنخفاض في قيمتها عندما تشير األحداث أو التغيرات في الظروف إلى أن القيمة الدفترية قد ال تكون قابلة لالسترداد. يتم احتساب خسارة االنخفاض في القيمة وفقا للمبلغ الذي تتجاوز به القيمة الدفترية لألصل قيمته القابلة لالسترداد. إن القيمة القابلة لالسترداد هي القيمة
العادلة لألصل ناقصا تكاليف البيع أو القيمة قيد االستخدام، أيهما أعلى. وألغراض تقييم االنخفاض في القيمة، يتم تجميع الموجودات لدى أدنى المستويات التي تتوفر لها تدفقات نقدية يمكن تحديدها بشكل منفصل
)وحدات توليد النقد(. تتم مراجعة االنخفاض السابق في قيمة الموجودات غير المالية )بخالف الشهرة( التي تعرضت النخفاض في قيمتها لتحري احتمال
عكس االنخفاض في القيمة بتاريخ كل تقرير.
2-8الموجودات المالية
2-8-1التصنيف
تصنف المجموعة موجوداتها المالية في الفئات التالية: موجودات مالية بالقيمة العادلة من خالل الربح أو الخسارة وقروض وذمم مدينة وموجودات مالية
متوفرة للبيع وموجودات مالية محتفظ بها لحين استحقاقها. يستند التصنيف إلى الغرض الذي تم اقتناء الموجودات المالية من أجله. تحدد اإلدارة التصنيف
لموجوداتها المالية عند االعتراف المبدئي.
)أ( موجودات مالية بالقيمة العادلة من خالل الربح أو الخسارةإن الموجودات المالية بالقيمة العادلة من خالل الربح أو الخسارة هي موجودات
مالية محتفظ بها للمتاجرة. يتم تصنيف األصل المالي في هذه الفئة إذا تم اقتناؤه أساسا بغرض بيعه خالل فترة قصيرة األجل. يتم تصنيف الموجودات في هذه الفئة كموجودات متداولة إذا كان من المتوقع تسويتها في غضون
12 شهرا، ما لم تكن مصنفة كموجودات غير متداولة.
)ب( قروض وذمم مدينة القروض والذمم المدينة هي موجودات مالية غير مشتقة ذات دفعات ثابتة أو
قابلة للتحديد وغير مدرجة في سوق نشطة. يتم إدراج القروض والذمم المدينة في الموجودات المتداولة، باستثناء تلك التي لها فترات استحقاق تزيد عن 12
شهرا بعد نهاية الفترة المشمولة بالتقرير حيث يتم تصنيفها كموجودات غير متداولة. تتألف القروض والذمم المدينة لدى المجموعة من “ذمم مدينة تجارية

023 Annual Report
إيضاحات حول البيانات المالية الموحدةللسنة المنتهية في 31 ديسمبر 2014
وأخرى” و”مبالغ مستحقة من أطراف ذات عالقة” و”نقد وما في حكمه” كما في الميزانية العمومية )اإليضاحات 8 و21 و14 على التوالي(.
)ج( موجودات مالية متوفرة للبيعالموجودات المالية المتوفرة للبيع هي موجودات غير مشتقة وتكون مصنفة
ضمن هذه الفئة أو غير مصنفة ضمن أي من الفئات األخرى. يتم إدراج الموجودات المالية المتوفرة للبيع ضمن الموجودات غير المتداولة ما لم يحن
أجل االستثمار أو تعتزم اإلدارة بيعه في غضون 12 شهرا من نهاية الفترة المشمولة بالتقرير.
2-8-2االعتراف والقياس
تحتسب المشتريات والمبيعات االعتيادية للموجودات المالية بتاريخ المعاملة - وهو التاريخ الذي تلتزم فيه المجموعة بشراء أو بيع األصل. تحتسب
االستثمارات مبدئيا بالقيمة العادلة زائدا تكاليف المعاملة لكافة الموجودات المالية غير المدرجة بالقيمة العادلة من خالل الربح أو الخسارة. أما الموجودات
المالية المدرجة بالقيمة العادلة من خالل الربح أو الخسارة، فتحتسب مبدئيا بالقيمة العادلة ويتم إدراج تكاليف المعاملة كمصروف في بيان الدخل الموحد.
يتم إيقاف احتساب الموجودات المالية عند انقضاء الحقوق في استالم التدفقات النقدية من االستثمارات أو عندما يتم تحويلها مع قيام المجموعة بتحويل كافة مخاطر وعوائد الملكية بشكل كامل. تـقاس الموجودات المالية
المتوفرة للبيع والموجودات المالية بالقيمة العادلة من خالل الربح أو الخسارة الحقا بالقيمة العادلة. كما يتم الحقا إدراج القروض والذمم المدينة بالتكلفة
المطفأة باستخدام طريقة الفائدة الفعلية.
يتم عرض األرباح أو الخسائر الناشئة عن التغيرات في القيمة العادلة لفئة “الموجودات المالية بالقيمة العادلة من خالل الربح أو الخسارة” في بيان الدخل الموحد ضمن بند “أرباح / )خسائر( أخرى” في الفترة التي تنشأ فيها. يتم أيضا
احتساب إيرادات توزيعات األرباح من الموجودات المالية بالقيمة العادلة من خالل الربح أو الخسارة في بيان الدخل الموحد كجزء من اإليرادات األخرى عندما
يتقرر حق المجموعة في قبض دفعات األرباح.
عندما يتم بيع األوراق المالية المصنفة كمتوفرة للبيع أو تتعرض النخفاض في قيمتها، فإن التعديالت المتراكمة للقيمة العادلة المحتسبة ضمن حقوق الملكية يتم إدراجها في بيان الدخل الموحد ضمن بند “أرباح وخسائر من استثمارات في
أوراق مالية”.
يتم االعتراف بالفوائد على األوراق المالية المتوفرة للبيع باستخدام طريقة الفائدة الفعلية في بيان الدخل الموحد كجزء من اإليرادات األخرى. كما يتم
االعتراف بتوزيعات األرباح من أدوات حقوق الملكية المتوفرة للبيع في بيان الدخل الموحد كجزء من اإليرادات األخرى عندما يتقرر حق المجموعة في قبض
الدفعات.
2-9االنخفاض في قيمة الموجودات المالية
)أ( الموجودات المدرجة بالتكلفة المطفأة تقوم المجموعة في نهاية كل فترة تقرير بتقييم ما إذا كان هناك دليل
موضوعي على تعرض األصل المالي أو مجموعة من الموجودات المالية لالنخفاض في القيمة. ال يعتبر أن األصل المالي أو مجموعة الموجودات
المالية قد تعرض أو تعرضت لالنخفاض في القيمة وتم تكبد خسائر االنخفاض في القيمة إال إذا توفر دليل موضوعي على وقوع االنخفاض في القيمة
نتيجة لحدث واحد أو أكثر يحصل بعد االعتراف المبدئي باألصل )“حدث خسارة”( ويكون لذلك الحدث )أو تلك األحداث( أثر على التدفقات النقدية المستقبلية
المقدرة لألصل المالي أو مجموعة الموجودات المالية بشكل يمكن تقديره على
نحو موثوق به.
قد يشمل الدليل على االنخفاض في القيمة مؤشرات تدل على مواجهة المدين أو مجموعة من المدينين لصعوبات مالية كبيرة أو عجز عن السداد أو تأخر في سداد الفوائد أو الدفعات األصلية أو احتمالية دخول المدينين في
إجراءات إشهار إفالس أو إعادة هيكلة مالية أخرى أو عندما تشير البيانات الجديرة بالمالحظة إلى وجود انخفاض يمكن قياسه في التدفقات النقدية المستقبلية المقدرة، مثل التغيرات في المتأخرات أو الظروف االقتصادية المقترنة بحاالت
التخلف عن السداد.
بالنسبة لفئة القروض والذمم المدينة، يتم قياس مقدار الخسارة على أساس الفرق بين القيمة الدفترية لألصل والقيمة الحالية للتدفقات النقدية
المستقبلية المقدرة )باستثناء خسائر االئتمان المستقبلية التي لم يتم تكبدها( مخصومة بمعدل الفائدة األصلي الفعلي لألصل المالي. يتم خفض القيمة الدفترية لألصل واالعتراف بمقدار الخسارة في بيان الدخل الموحد. وفي حال كان للقرض أو االستثمار المحتفظ به لحين استحقاقه معدل فائدة متغير، فإن
معدل الخصم المستخدم في قياس أي خسارة انخفاض في القيمة يكون معدل الفائدة الفعلي الحالي المحدد بموجب العقد. وكإجراء عملي، قد تقوم
المجموعة بقياس االنخفاض في القيمة على أساس القيمة العادلة لألداة باستخدام سعر سوق جدير بالمالحظة.
إذا نقص مبلغ خسارة االنخفاض في القيمة في أي فترة الحقة، وكان باإلمكان ربط هذا النقص موضوعيا بحدث يحصل بعد أن تم احتساب خسارة االنخفاض
في القيمة )مثل تحسن التقييم االئتماني للمدين(، فإن عكس خسارة االنخفاض في القيمة المحتسبة سابقا يتم إدراجه في بيان الدخل الموحد.
)ب( الموجودات المصنفة كمتوفرة للبيعتقوم المجموعة في نهاية كل فترة تقرير بتقييم ما إذا كان هناك دليل
موضوعي على تعرض األصل المالي أو مجموعة من الموجودات المالية لالنخفاض في القيمة.
فإذا وجد مثل هذا الدليل بالنسبة لسندات الدين، فإن الخسارة المتراكمة - التي يتم قياسها بوصفها الفرق بين تكلفة االستحواذ والقيمة العادلة الحالية، ناقصا
أي خسارة انخفاض في قيمة ذلك األصل المالي التي سبق تسجيلها ضمن حساب الربح أو الخسارة - يتم حذفها من حقوق الملكية واحتسابها ضمن حساب
الربح أو الخسارة. وإذا زادت في فترة الحقة القيمة العادلة لسندات الدين المصنفة كمتوفرة للبيع، وكان باإلمكان ربط هذه الزيادة موضوعيا بحدث يقع
بعد أن تم االعتراف بخسارة االنخفاض في القيمة ضمن الربح أو الخسارة، فإنه يتم عكس خسارة االنخفاض في القيمة من خالل بيان الدخل الموحد.
بالنسبة الستثمارات األسهم، فإن التراجع الكبير أو طويل األجل في القيمة العادلة للورقة المالية لما دون تكلفتها يعتبر أيضا مؤشرا على تعرض
الموجودات لالنخفاض في القيمة. فإذا وجد مثل هذا الدليل، فإن الخسارة المتراكمة – التي يتم قياسها بوصفها الفرق بين تكلفة االستحواذ والقيمة
العادلة الحالية، ناقصا أي خسارة عن االنخفاض في قيمة ذلك األصل المالي التي سبق تسجيلها في حساب الربح أو الخسارة – يتم حذفها من حقوق
الملكية وتسجيلها في حساب الربح أو الخسارة. إن خسائر انخفاض القيمة المحتسبة في بيان الدخل الموحد بخصوص أدوات حقوق الملكية ال يتم عكسها
من خالل بيان الدخل الموحد.
2-10مقاصة األدوات المالية
تتم مقاصة الموجودات والمطلوبات المالية وبيان صافي القيمة في الميزانية العمومية عند وجود حق قانوني واجب النفاذ بمقاصة المبالغ المحتسبة ويكون
هناك نية للتسوية على أساس الصافي أو بيع األصل وتسوية االلتزام في

024Annual Report
إيضاحات حول البيانات المالية الموحدةللسنة المنتهية في 31 ديسمبر 2014
نفس الوقت. ويجب أال يكون الحق القانوني الواجب النفاذ مشروطا بأحداث مستقبلية، كما يجب أن يكون قابال للتنفيذ في سياق العمل االعتيادي وعند
تعثر أو إعسار أو إفالس الشركة أو الطرف المقابل.
2-11أدوات مالية مشتقة وأنشطة تحوط
تحتسب المشتقات مبدئيا بالقيمة العادلة بتاريخ إبرام عقد األداة المالية المشتقة ويعاد قياسها الحقا بقيمتها العادلة. تستند الطريقة المستخدمة في احتساب األرباح أو الخسائر الناتجة إلى ما إذا كانت األداة المشتقة مصنفة كأداة
تحوط، فإذا كان األمر كذلك، يؤخذ في االعتبار طبيعة البند الذي يجري تحوطه. تصنف المجموعة مشتقات محددة كتحوطات لخطر معين يرتبط باألصل أو
المطلوب المعترف به )تحوط التدفقات النقدية(.
تقوم المجموعة عند إبرام المعاملة بتوثيق العالقة بين أدوات التحوط والبنود المتحوطة، وكذلك أهداف المجموعة إلدارة المخاطر واستراتيجيتها إلبرام
معامالت التحوط المختلفة. تقوم المجموعة أيضا بتوثيق تقييمها، عند نشوء التحوط وعلى أساس مستمر، حول ما إذا كانت المشتقات المستخدمة في معامالت التحوط ذات تأثير كبير على مقاصة التغيرات في القيم العادلة أو
التدفقات النقدية للبنود المتحوطة. وبالتالي، ال يتم تصنيف األداة المشتقة كأداة تحوط.
يتم تصنيف مجمل القيمة العادلة لمشتقات التحوط كموجودات أو كمطلوبات غير متداولة عندما تكون الفترة المتبقية من أجل استحقاق البند المتحوط أكثر من
12 شهرا، وكموجودات أو كمطلوبات متداولة إذا كانت تلك الفترة أقل من 12 شهرا. يتم تصنيف المشتقات المحتفظ بها لغرض المتاجرة ضمن الموجودات
أو المطلوبات المتداولة.
يتم احتساب األرباح والخسائر المتعلقة بالتغير في القيمة العادلة مباشرة في بيان الدخل الموحد ضمن بند “أرباح / )خسائر( أخرى”.
2-12
استثمارات عقاريةإن العقار المحتفظ بها لجني عائدات من تأجيره على المدى الطويل أو إلضافته إلى رأس المال أو لكليهما والذي يكون غير مأهول من قبل شركات المجموعة يتم تصنيفه كاستثمار عقاري. يشمل االستثمار العقاري أيضا العقارات التي
يجري تشييدها أو تطويرها الستخدامها مستقبال كاستثمارات عقارية.
يتم قياس االستثمار العقاري مبدئيا بسعر التكلفة بما في ذلك تكاليف المعاملة ذات الصلة، وإن أمكن، تكاليف االقتراض. وبعد االعتراف المبدئي، يدرج االستثمار العقاري بالقيمة العادلة. إن القيمة العادلة لالستثمار العقاري تمثل، من بين أشياء أخرى، اإليرادات من عقود اإليجار السارية واالفتراضات األخرى التي قد يضعها المشاركون في السوق عند تسعير العقار في ظل
الظروف الحالية في السوق.
ال ترسمل النفقات الالحقة وتضاف إلى القيمة الدفترية لألصل إال عندما يكون من المرجح أن تتدفق إلى المجموعة فوائد اقتصادية مستقبلية مرتبطة بالبند ويكون باإلمكان قياس تكلفة البند بشكل موثوق به. تدرج كافة تكاليف عمليات التصليح والصيانة األخرى كمصروف عند تكبدها. عندما يتم استبدال أي جزء من
االستثمار العقاري، يتم إيقاف االعتراف بالقيمة الدفترية للجزء المستبدل.
تحتسب التغيرات في القيمة العادلة في بيان الدخل الموحد. ويتم إيقاف االعتراف باالستثمارات العقارية عندما يتم استبعادها.
عندما تقوم المجموعة باستبعاد عقار ما بقيمته العادلة في معاملة تتم على أساس تجاري بحت، يتم تعديل القيمة الدفترية مباشرة قبل عملية البيع إلى
سعر المعاملة ويتم تسجيل التعديل في بيان الدخل الموحد ضمن صافي الربح من تعديل القيمة العادلة الستثمار عقاري.
في حال قيام مالك االستثمار العقاري بشغل العقار، يعاد تصنيف هذا العقار ويدرج ضمن فئة الممتلكات والمعدات وتصبح قيمته العادلة بتاريخ إعادة
التصنيف هي تكلفته وذلك لألغراض المحاسبية الالحقة.
عندما يطرأ أي تغير على طريقة استخدام االستثمار العقاري، ويكون الدليل على هذا التغير البدء في تطوير العقار بغرض بيعه، يتم تحويل العقار
إلى فئة العقارات بغرض التطوير. وتكون تكلفة العقار لغرض المحاسبة الالحقة للعقارات بغرض التطوير هي قيمته العادلة بتاريخ التغير في طريقة
االستخدام.
2-13عقارات بغرض التطوير
تصنف العقارات المشتراة أو المشيدة أو قيد التشييد بغرض بيعها كعقارات بغرض التطوير. يتم إظهار تلك العقارات بالتكلفة أو بصافي القيمة البيعية،
أيهما أقل. تشمل تكلفة العقارات بغرض التطوير تكلفة األرض والنفقات األخرى ذات العالقة التي يتم االعتراف بها عندما تكون األنشطة الالزمة لتجهيز
العقارات للبيع قيد اإلنجاز. تمثل القيمة البيعية سعر البيع التقديري ناقصا التكاليف المتوقع تكبدها على استكمال وبيع العقار. يتم إدراج أي أرباح أو خسائر
من بيع العقارات بغرض التطوير ضمن بند أرباح / )خسائر( أخرى.
2-14مخزون
يتم بيان المخزون بالتكلفة أو بصافي القيمة البيعية، أيهما أقل. يتم تحديد التكلفة باستخدام طريقة المتوسط المرجح. إن صافي القيمة البيعية هو عبارة
عن سعر البيع التقديري خالل سياق العمل االعتيادي، ناقصا مصاريف البيع المتغيرة المعمول بها.
2-15ذمم مدينة تجارية
الذمم المدينة التجارية هي المبالغ المستحقة من العمالء نظير الفواتير الصادرة في سياق العمل االعتيادي بالنسبة لعقود اإلنشاءات. فإذا كان من المتوقع
تحصيل هذه الذمم في غضون سنة واحدة أو أقل )أو خالل دورة التشغيل االعتيادية للمنشأة إذا كانت أطول(، يتم تصنيفها كموجودات متداولة. وإذا لم
يكن كذلك، يتم عرضها كموجودات غير متداولة.
تحتسب الذمم المدينة التجارية واألخرى مبدئيا بالقيمة العادلة وتقاس الحقا بالتكلفة المطفأة باستخدام طريقة الفائدة الفعلية، ناقصا مخصص االنخفاض
في القيمة.
يتم رصد مخصص لالنخفاض في قيمة الذمم المدينة التجارية عندما يتوفر دليل موضوعي على أن المجموعة لن تكون قادرة على تحصيل كافة المبالغ
المستحقة لها وفقا للشروط األصلية للذمم المدينة. إن قيمة المخصص تمثل الفرق بين القيمة الدفترية لألصل والقيمة الحالية للتدفقات النقدية المستقبلية
المقدرة مخصومة بمعدل الفائدة األصلي الفعلي.
يتم خفض القيمة الدفترية لألصل من خالل استخدام حساب المخصص مع بيان مبلغ الخسارة في بيان الدخل الموحد ضمن بند “مصاريف عمومية
وإدارية”. عندما تكون الذمة المدينة التجارية غير قابلة للتحصيل، يتم حذفها في مقابل حساب المخصص المرصود للذمم المدينة التجارية. يتم إدراج المبالغ
المستردة الحقا من المبالغ المحذوفة سابقا في بيان الدخل الموحد.

025 Annual Report
إيضاحات حول البيانات المالية الموحدةللسنة المنتهية في 31 ديسمبر 2014
2-16نقد وما في حكمه
في بيان التدفقات النقدية الموحد، يتضمن النقد وما في حكمه النقد في الصندوق والودائع المحتفظ بها تحت الطلب لدى المصارف وغيرها
من االستثمارات قصيرة األجل عالية السيولة التي تتمتع بفترات استحقاق أصلية تبلغ ثالثة أشهر أو أقل والسحوبات المصرفية على المكشوف. تظهر
السحوبات المصرفية على المكشوف في الميزانية العمومية الموحدة ضمن القروض المصرفية في المطلوبات المتداولة.
2-17رأس المال
تصنف األسهم العادية كحقوق ملكية.
يتم بيان التكاليف اإلضافية التي تعزى مباشرة إلى إصدار أسهم عادية أو خيارات أسهم جديدة ضمن حقوق الملكية كخصم من عوائد اإلصدار، صاف من
الضريبة.
عندما تقوم إحدى شركات المجموعة بشراء أي أسهم في رأس مال الشركة )أسهم الخزينة(، فإن المقابل المدفوع بما في ذلك أي تكاليف إضافية عائدة
مباشرة لعملية الشراء )صافية من ضريبة الدخل( يتم خصمها من حقوق الملكية العائدة إلى حملة األسهم في الشركة حتى يتم إلغاء األسهم أو يعاد إصدارها.
وعند إعادة إصدار األسهم الحقا، فإن أي مقابل مقبوض، صافيا من أي تكاليف إضافية عائدة مباشرة للمعاملة وتأثيرات ضريبة الدخل ذات العالقة، يتم إدراجه
ضمن حقوق الملكية العائدة إلى حملة األسهم في الشركة.
2-18ذمم دائنة تجارية
الذمم الدائنة التجارية هي عبارة عن التزامات بسداد قيمة البضائع أو الخدمات التي يتم الحصول عليها من الموردين في سياق العمل االعتيادي. يتم تصنيف الذمم الدائنة التجارية كمطلوبات متداولة إذا كانت هذه الذمم مستحقة السداد
خالل سنة واحدة أو أقل )أو خالل دورة التشغيل االعتيادية للمنشأة إذا كانت أطول(، وإال يتم عرضها كمطلوبات غير متداولة.
تحتسب الذمم الدائنة التجارية مبدئيا بالقيمة العادلة وتقاس الحقا بالتكلفة المطفأة باستخدام طريقة الفائدة الفعلية.
2-19مخصصات
تحتسب المخصصات عندما يترتب على المجموعة التزام قانوني أو ضمني حالي نتيجة ألحداث سابقة، ويكون من المحتمل أن يستدعي األمر إجراء تدفق خارجي لموارد تمثل منافع اقتصادية من أجل تسوية االلتزام، ويكون باإلمكان
وضع تقدير موثوق لمبلغ االلتزام. ال تحتسب مخصصات لخسائر العمليات المستقبلية.
يتم قياس المخصصات بالقيمة الحالية للنفقات المتوقع طلبها لتسوية االلتزام باستخدام معدل قبل خصم الضريبة يعكس تقييمات السوق الحالية للقيمة الزمنية للمال والمخاطر المصاحبة لاللتزام. تحتسب الزيادة في المخصصات
نتيجة لمرور الوقت كمصروف فائدة. وفي حال وجود عدد من االلتزامات المماثلة، يتم تحديد احتمالية تكبد موارد لتسوية االلتزام باألخذ بعين االعتبار فئة االلتزامات ككل. ويتم احتساب المخصص حتى مع وجود احتمال ضعيف
بتكبد موارد تتعلق بأي بند مدرج في نفس فئة االلتزام.
2-20قروض مصرفية
تحتسب القروض مبدئيا بالقيمة العادلة صافية من تكاليف المعاملة المتكبدة. يتم إدراج القروض الحقا بالتكلفة المطفأة مع احتساب أي فرق بين العوائد
)صافية من تكاليف المعاملة( والقيمة المستردة في بيان الدخل الموحد على مدى فترة القروض باستخدام طريقة الفائدة الفعلية.
تحتسب الرسوم المدفوعة إلبرام تسهيالت القروض كتكاليف معاملة للقرض شريطة وجود احتمال بسحب بعض التسهيالت أو جميعها. وفي هذه الحالة،
يتم تأجيل احتساب الرسوم حتى وقوع عملية السحب. وفي حال عدم توفر دليل على احتمال سحب بعض التسهيالت أو جميعها، تتم رسملة الرسوم
وإدراجها ضمن المبالغ المدفوعة مقدما عن خدمات السيولة، ويتم إطفاؤها على مدى فترة التسهيالت المتعلقة بها.
2-21
ضريبة الدخل الحالية والمؤجلةيشمل مصروف الضريبة للفترة الضريبة الحالية والضريبة المؤجلة. يتم إدراج الضريبة في بيان الدخل الموحد، باستثناء الحاالت التي ترتبط فيها الضريبة
ببنود معترف بها في الدخل الشامل اآلخر أو محتسبة مباشرة في حقوق الملكية. وفي هذه الحالة، فإنه يتم أيضا االعتراف بالضريبة في الدخل الشامل
اآلخر أو مباشرة في حقوق الملكية، على التوالي.
يتم حساب مصروف ضريبة الدخل الحالية على أساس القوانين الضريبية المطبقة أو التي ستطبق بشكل فعلي في تاريخ الميزانية العمومية في البلدان التي تعمل فيها الشركة وشركاتها التابعة وتحقق فيها دخال خاضعا
للضريبة. تقوم اإلدارة بإجراء تقييم دوري للمواقف المتخذة بخصوص اإلقرارات الضريبية بالنسبة للحاالت التي تكون فيها لوائح الضرائب السارية خاضعة
للتأويل. وتقوم برصد مخصصات، عند االقتضاء، على أساس المبالغ المتوقع دفعها إلى سلطات تحصيل الضرائب.
يتم االعتراف بضريبة الدخل المؤجلة، باستخدام طريقة المطلوبات، على الفروق المؤقتة الناشئة فيما بين األسس الضريبية للموجودات والمطلوبات
وقيمها الدفترية في البيانات المالية الموحدة.
ومع ذلك، ال يتم االعتراف بمطلوبات الضريبة المؤجلة إذا كانت ناشئة عن االعتراف المبدئي بأصل أو مطلوب في معاملة غير معامالت اندماج األعمال
والتي ال تؤثر، خالل وقت المعاملة، على األرباح أو الخسائر لألغراض المحاسبية أو الخاضعة للضريبة. يتم تحديد ضريبة الدخل المؤجلة باستخدام معدالت
الضرائب )والقوانين( التي تم سنها أو التي ستطبق فعليا في تاريخ الميزانية العمومية والتي يتوقع سريانها في حالة بيع األصل ذي الصلة بضريبة الدخل
المؤجلة أو تسوية مطلوب ضريبة الدخل المؤجلة.
ال يتم االعتراف بموجودات ضريبة الدخل المؤجلة إال إذا كان من المحتمل أن يتوفر في المستقبل ربح خاضع للضريبة بحيث يمكن على أساسه االستفادة
من الفروق المؤقتة.
تحتسب مطلوبات ضريبة الدخل المؤجلة على الفروق المؤقتة الناشئة عن االستثمارات في الشركات التابعة والشركات الزميلة والترتيبات المشتركة،
باستثناء أن تكون المجموعة هي المتحكمة في توقيت عكس الفرق المؤقت بالنسبة لمطلوب ضريبة الدخل المؤجلة ويكون من المحتمل أال يتم عكس
الفرق المؤقت في المستقبل المنظور. وعموما، ال تستطيع المجموعة التحكم في عملية عكس الفروق المؤقتة بالنسبة للشركات الزميلة إال إذا كانت هناك
اتفاقية سارية تستطيع من خاللها المجموعة التحكم في عملية عكس الفرق المؤقت غير المحتسب.

026Annual Report
إيضاحات حول البيانات المالية الموحدةللسنة المنتهية في 31 ديسمبر 2014
ال تحتسب موجودات ضريبة الدخل المؤجلة على الفروق المؤقتة المخصومة الناشئة عن االستثمارات في الشركات التابعة والزميلة والترتيبات المشتركة إال عندما يكون من المرجح أن يتم عكس الفرق في المستقبل وتتوفر أرباح
كافية خاضعة للضريبة تستطيع المجموعة على أساسها االستفادة من الفرق المؤقت.
تتم مقاصة موجودات ومطلوبات ضريبة الدخل المؤجلة عند وجود حق قانوني واجب النفاذ بمقاصة موجودات الضريبة الحالية مقابل مطلوبات الضريبة
الحالية، وعندما تتعلق موجودات ومطلوبات ضريبة الدخل المؤجلة بضرائب الدخل التي تفرضها نفس سلطات الضرائب على نفس المنشأة الخاضعة
للضريبة أو غيرها من المنشآت الخاضعة للضريبة، وتكون هناك نية لتسوية األرصدة على أساس الصافي.
2-22تكاليف اقتراض
إن تكاليف االقتراض المرتبطة مباشرة بحيازة أو إنشاء أو إنتاج موجودات مؤهلة، وهي الموجودات التي تستغرق بالضرورة فترة زمنية كبيرة لكي
تصبح جاهزة لالستخدام المرجو منها أو بيعها، تتم إضافتها إلى تكلفة تلك الموجودات حتى تصبح الموجودات جاهزة تماما لالستخدام المرجو منها أو
بيعها.
إن إيرادات االستثمار المحققة من االستثمار المؤقت للقروض المحددة والتي لم تدفع على تأهيل الموجودات يتم خصمها من خالل تكاليف االقتراض
المستحقة للرسملة.
يتم تسجيل جميع تكاليف االقتراض األخرى ضمن الربح أو الخسارة في الفترة التي يتم تكبدها فيها.
2-23منافع الموظفين
يتم رصد مخصص لاللتزام المقدر لمستحقات الموظفين من اإلجازات السنوية والمنافع ذات الصلة نتيجة للخدمات المقدمة من قبل الموظفين حتى تاريخ
الميزانية العمومية. يتم كذلك رصد مخصص، باستخدام األساليب االكتوارية، لمكافآت نهاية الخدمة المستحقة للموظفين وفقا لقوانين العمل في البلدان
التي تزاول فيها المجموعة عملياتها، وذلك عن فترات خدمتهم حتى تاريخ الميزانية العمومية.
يتم بيان المخصص المتعلق باإلجازات السنوية وتذاكر السفر كمطلوب متداول ويدرج ضمن الذمم الدائنة التجارية واألخرى، بينما يتم عرض المخصص المتعلق
بمكافآت نهاية الخدمة كمطلوب غير متداول.
إن األرباح والخسائر االكتوارية الناشئة عن التعديالت السابقة والتغيرات في االفتراضات يتم تحميلها أو إدراجها في الدخل الشامل اآلخر في الفترة التي
تنشأ فيها. كما تحتسب تكاليف الخدمة السابقة مباشرة في بيان الدخل الموحد.
2-24إيرادات عقود
تحتسب إيرادات العقود بموجب طريقة نسبة اإلنجاز. وعندما يكون باإلمكان تقدير محصلة العقد بشكل موثوق، يتم احتساب اإليرادات بالرجوع إلى نسبة
التكاليف المتراكمة حتى نهاية السنة إلى إجمالي التكاليف المقدرة للعقد. أما عندما يكون العقد في مراحله األولى بحيث يتعذر تقدير محصلته بشكل
موثوق، تحتسب اإليرادات على أساس حجم التكاليف المتكبدة حتى نهاية السنة التي تعتبر قابلة لالسترداد.
يتم احتساب اإليرادات المتعلقة بأوامر التعديل عندما يكون من المرجح أن يوافق العميل على التعديل ويكون باإلمكان قياس قيمة اإليرادات الناشئة عن
التعديل بشكل موثوق.
تحتسب المطالبات كإيرادات عقود عند تسويتها أو عندما تصل المفاوضات إلى مرحلة متقدمة بحيث يكون من المرجح أن يقبل العميل بالمطالبة ويكون
باإلمكان قياس قيمة المطالبة بشكل موثوق.
يتم تقدير خسائر العقد على أساس كل عقد على حدة، ويتم رصد مخصص لمجمل قيمة الخسائر المتوقعة بما في ذلك أي خسائر تتعلق بأعمال مستقبلية
ألي عقد في الفترة التي يتم فيها توقع الخسارة ألول مرة.
تتم مقارنة إجمالي التكاليف المتكبدة واألرباح / الخسائر المحتسبة لكل عقد مقابل الدفعات المرحلية في نهاية السنة. عندما يتجاوز مجموع التكاليف
المتكبدة واألرباح أو الخسائر المحتسبة قيمة الدفعات المرحلية، يتم بيان الفرق ضمن الذمم المدينة التجارية واألخرى تحت بند مبالغ مستحقة من عمالء عن
عقود. أما عندما تتجاوز الدفعات المرحلية إجمالي التكاليف المتكبدة واألرباح أو الخسائر المحتسبة، يتم بيان الفرق ضمن الذمم الدائنة التجارية واألخرى تحت بند
مبالغ مستحقة لعمالء عن عقود.
وفي سبيل تحديد تكاليف العقد المتكبدة حتى نهاية السنة، فإن أي مبالغ متكبدة بما في ذلك الدفعات المقدمة المسددة إلى الموردين والدفعات
المرحلية المدفوعة مقدما من مقاولي الباطن فيما يتعلق بالنشاط المستقبلي لعقد ما يتم استبعادها وعرضها كمبالغ مستحقة من عمالء عن عقود.
2-25إيرادات فوائد
تحتسب إيرادات الفوائد في بيان الدخل الموحد على أساس متناسب زمنيا باستخدام طريقة الفائدة الفعلية.
2-26إيرادات توزيعات األرباح
تحتسب اإليرادات من توزيعات األرباح عندما يتقرر الحق في قبض الدفعات.
2-27إيجارات
يتم تصنيف عقود اإليجار التي يحتفظ بموجبها المؤجر بجزء كبير من مخاطر ومزايا الملكية كعقود إيجار تشغيلي. يتم تحميل الدفعات التي تتم بموجب
عقود اإليجار التشغيلي )صافية من أي حوافز مقبوضة من المؤجر( إلى بيان الدخل بطريقة الثابت على مدى فترة اإليجار.
2-28توزيعات أرباح
تحتسب األرباح الموزعة على مساهمي المجموعة كمطلوب في البيانات المالية الموحدة للمجموعة في الفترة التي يتم فيها اعتماد توزيعات األرباح من
قبل مساهمي المجموعة.

027 Annual Report
إيضاحات حول البيانات المالية الموحدةللسنة المنتهية في 31 ديسمبر 2014
تنشأ مخاطر أسعار الفائدة الخاصة بالمجموعة من القروض طويلة األجل. إن القروض الصادرة بأسعار فائدة متغيرة تعرض المجموعة لمخاطر أسعار الفائدة
للتدفقات النقدية، وتتم مقاصتها جزئيا من خالل النقد المحتفظ به بأسعار متغيرة. خالل السنة المنتهية في 31 ديسمبر 2014، فيما لو كانت أسعار الفائدة على القروض قد ارتفعت / انخفضت بنسبة ٪0.5، لكان مصروف
الفائدة قد ارتفع / انخفض بواقع 8,318 ألف درهم )2013: 6,113 ألف درهم(.
)ب( مخاطر االئتمانتتوفر لدى المجموعة سياسة للتعامل مع العمالء من ذوي التاريخ االئتماني المناسب. تمتلك المجموعة سياسات تعمل على الحد من قيمة التعرضات
االئتمانية تجاه أي مؤسسة مالية، وتتم مراقبة ذلك بشكل متواصل.
تتم إدارة مخاطر االئتمان على مستوى المجموعة، وتنشأ من األرصدة النقدية والمصرفية والموجودات المالية المتوفرة للبيع والموجودات المالية المدرجة
بالقيمة العادلة من خالل الربح أو الخسارة والذمم المدينة التجارية واألخرى والمبالغ المستحقة من األطراف ذات العالقة.
يعرض الجدول أدناه تصنيف ورصيد األطراف المقابلة الرئيسية كما في تاريخ الميزانية العمومية:
2013 2014
ألف درهم تصنيف خارجي * ألف درهم تصنيف
خارجي * الطرف المقابل
497,919 A1 214,852 A1 المصرف أ
37,129 A1 16,301 Ba1 المصرف ب
12,667 Baa1 363,474 Baa1 المصرف ج
154 A1 8,093 Baa2 المصرف د
6,188 BB+ 22,633 Baa3 المصرف هـ
- A1 26,221 Aa3 المصرف و
- - 58,692 A2 المصرف ز
- - 19,103 A3 المصرف ح
- - 24,625 B2 المصرف ط
- - 10 Caa2 المصرف ي
554,057 754,004
* على أساس تصنيف موديز
لدى المجموعة إجراءات معتمدة لمراقبة ومتابعة العمالء فيما يتعلق بالذمم المدينة التجارية القائمة حيث تقوم المجموعة بإجراء تقييم داخلي لجودة
االئتمان لكل عميل، مع األخذ بعين االعتبار مركزه المالي وتجربته السابقة وعوامل أخرى.
في 31 ديسمبر 2014، كان لدى المجموعة تركيز هام في مخاطر االئتمان من خالل عشرة عمالء يمثلون ما نسبته ٪45 من الذمم المدينة التجارية )2013: ٪55(. ترى اإلدارة أن هذا التركيز في مخاطر االئتمان يعتبر تركيزا مخففا نظرا
للعالقات الراسخة التي تربط المجموعة بهؤالء العمالء.
إن الفئات األخرى من الموجودات المالية ال ينتج عنها مخاطر ائتمان جوهرية.
3إدارة المخاطر المالية
3-1عوامل المخاطر المالية
تتعرض المجموعة من خالل أنشطتها لمجموعة متنوعة من المخاطر المالية وهي: مخاطر السوق )تشمل مخاطر صرف العمالت األجنبية ومخاطر أسعار
الفائدة للقيمة العادلة ومخاطر أسعار الفائدة للتدفقات النقدية ومخاطر األسعار( ومخاطر االئتمان ومخاطر السيولة. تعمل اإلدارة على تحديد هذه
المخاطر بشكل متواصل من أجل تقييمها وإدارة آثارها الهامة على المجموعة. تتم إدارة مخاطر السيولة ومخاطر السوق الخاصة بالمجموعة كجزء من أنشطة
قسم الخزينة لدى المجموعة. ويتم تنفيذ عمليات الخزينة ضمن إطار من السياسات واإلجراءات المعتمدة.
)أ( مخاطر السوق
)1( مخاطر صرف العمالت األجنبيةإن الموجودات والمطلوبات النقدية الناشئة بالعمالت األجنبية لدى المجموعة مقومة باألساس بالريال السعودي والريال القطري واليورو والدينار الكويتي
والريال العماني والروبية الهندية والدينار األردني والدينار الجزائري.
ونظرا الرتباط سعر صرف الريال السعودي والريال القطري والريال العماني والدرهم اإلماراتي بالدوالر األمريكي، فإن تأثير سعر الصرف يتمثل في الحركة
المحتملة المعقولة في سعر صرف الدرهم اإلماراتي مقابل سعر صرف اليورو والدينار الكويتي والروبية الهندية والدينار الجزائري والدينار األردني والبات
التايلندي، مع بقاء كافة المتغيرات األخرى ثابتة، في بيان الدخل الموحد )بسبب القيمة العادلة للموجودات والمطلوبات النقدية الحساسة للتغير في أسعار
صرف العمالت األجنبية(.
في 31 ديسمبر 2014، فيما لو كانت أسعار صرف العمالت الست قد انخفضت / ارتفعت بنسبة ٪5 مقابل سعر صرف الدرهم اإلماراتي، لكان ربح السنة قد ارتفع / انخفض بواقع 903 ألف درهم )2013: 1,478 ألف درهم(.
)2( مخاطر األسعار
المجموعة غير معرضة لمخاطر أسعار األسهم نظرا ألن استثمارات المجموعة في الموجودات المالية المتوفرة للبيع مدرجة بالتكلفة، كما أن االستثمارات
المصنفة بالقيمة العادلة من خالل الربح أو الخسارة ليست بقيمة كبيرة.
)3(مخاطر أسعار الفائدة للتدفقات النقدية والقيمة العادلةتحتفظ المجموعة بفائض النقد لديها في ودائع مصرفية قصيرة األجل. خالل
السنة المنتهية في 31 ديسمبر 2014، فيما لو كانت أسعار الفائدة على الودائع قد ارتفعت / انخفضت بنسبة ٪0.5، لكانت إيرادات الفائدة قد ارتفعت /
انخفضت بواقع 2,092 ألف درهم )2013: 1,350 ألف درهم(.
تحصل المجموعة أيضا على فوائد على القروض والسلفيات، وتكون هذه الفوائد أعلى من معدالت السوق بشكل عام. إن أي تغير في أسعار الفائدة بنسبة ٪0.5 كان ليؤدي إلى ارتفاع / انخفاض إيرادات الفائدة بواقع 369 ألف
درهم )2013: 566 ألف درهم(.

028Annual Report
إيضاحات حول البيانات المالية الموحدةللسنة المنتهية في 31 ديسمبر 2014
المجموع ألف درهم
بين سنتين وخمس سنوات ألف درهم
بين سنة واحدة وسنتين ألف درهم
أقل من سنة واحدةألف درهم
في 31 ديسمبر 2014 2,320,181 533,115 88,966 1,698,100 قروض مصرفية
2,013,146 - - 2,013,146 ذمم دائنة تجارية ومستحقات
128,350 - - 128,350 مبالغ مستحقة ألطراف ذات عالقة
في 31 ديسمبر 2013 1,123,702 30,161 22,367 1,071,174 قروض مصرفية
2,035,469 - - 2,035,469 ذمم دائنة تجارية أخرى ومستحقات
19,445 - - مبالغ مستحقة ألطراف ذات عالقة 19,445
)ج( مخاطر السيولةتقتضي اإلدارة الحكيمة لمخاطر السيولة االحتفاظ بنقد كاف وتوفر التمويل من خالل حجم مالئم من التسهيالت االئتمانية الملتزم بها. ونظرا لطبيعة نشاط المجموعة
الذي تستخدم فيه الدفعات المرحلية، فإنها تحتفظ باألرصدة المصرفية والتسهيالت االئتمانية التي تكفي لتمويل عملياتها.
تراقب المجموعة توقعات مركز السيولة الخاص بها على أساس التدفقات النقدية المتوقعة.
تحصل المجموعة في الوقت الراهن على التمويل الالزم لها من أموال المساهمين والقروض المصرفية. يستعرض الجدول أدناه تحليال للمطلوبات المالية غير المشتقة للمجموعة مصنفة إلى مجموعات استحقاق ذات صلة على أساس الفترة المتبقية من تاريخ الميزانية العمومية حتى تاريخ االستحقاق التعاقدي. إن المبالغ التي يتم
اإلفصاح عنها في الجدول تمثل التدفقات النقدية التعاقدية غير المخصومة:
3-2إدارة رأس المال
تتمثل أهداف المجموعة عند إدارة رأس المال في حماية قدرتها على االستمرار كمنشأة عاملة بهدف توفير العوائد للمساهمين والمنافع ألصحاب المصلحة
اآلخرين والمحافظة على هيكل رأسمالي قوي لخفض تكلفة رأس المال.
وبهدف المحافظة على هيكل رأس المال أو تعديله، فقد تقوم المجموعة بتعديل قيمة توزيعات األرباح المدفوعة للمساهمين أو إدارة متطلبات
رأس مالها العامل. وبالتوافق مع الشركات األخرى في قطاع العمل، تراقب المجموعة رأس المال على أساس نسبة المديونية. ويتم احتساب هذه النسبة
بقسمة صافي الدين على مجموع رأس المال.
يتم حساب صافي الدين على أساس مجموع القروض )وتشمل القروض المتداولة وغير المتداولة على النحو الوارد في الميزانية العمومية الموحدة(
ناقصا األرصدة النقدية والمصرفية )بما في ذلك الودائع قصيرة األجل(. يتم حساب مجموع رأس المال على أساس “حقوق الملكية” كما هو وارد بالميزانية
العمومية الموحدة زائدا صافي الدين.
كانت نسبتي المديونية بتاريخ 31 ديسمبر 2014 و2013 كالتالي:
2013ألف درهم
2014ألف درهم
1,116,470 2,210,683 مجموع القروض )إيضاح 18(
(558,217) (758,120)ناقصا: األرصدة النقدية والمصرفية
)إيضاح 14(
558,253 1,452,563 صافي الدين
2,974,826 3,075,986 مجموع حقوق الملكية
3,533,079 4,528,549 مجموع رأس المال
16% 32% نسبة المديونية
ارتفعت نسبة المديونية بواقع ٪16 عن السنة السابقة بسبب الزيادة في صافي الدين.

029 Annual Report
إيضاحات حول البيانات المالية الموحدةللسنة المنتهية في 31 ديسمبر 2014
3-3تقدير القيمة العادلة
يستعرض الجدول أدناه تحليال لألدوات المالية المدرجة بالقيمة العادلة باستخدام طريقة التقييم. وفيما يلي مستويات التقييم المختلفة:
األسعار المعلنة )غير المعدلة( في األسواق النشطة للموجودات أو المطلوبات المتطابقة )المستوى األول(. المعطيات األخرى بخالف األسعار المعلنة المدرجة ضمن المستوى األول، الجديرة بالمالحظة بالنسبة لألصل أو المطلوب، سواء كانت مباشرة )وهي األسعار( أو غير
مباشرة )وهي المستمدة من األسعار( )المستوى الثاني(.المعطيات الخاصة باألصل أو المطلوب التي ال تستند إلى بيانات سوق جديرة بالمالحظة )وهي المعطيات غير الجديرة بالمالحظة( )المستوى الثالث(.
تستند الموجودات المالية المدرجة بالقيمة العادلة من خالل الربح أو الخسارة لدى المجموعة إلى صافي قيم الموجودات المعلنة من قبل مدراء الصناديق االستثمارية. إن القيمة السوقية العادلة لهذه االستثمارات، بحسب مدراء الصناديق، تستند إلى ما يلي:
بالنسبة لالستثمارات المدرجة، أسعار الشراء الحالية في سوق نشطة. )أ( )ب( بالنسبة لالستثمارات غير المدرجة، عمليات التقييم المستندة إلى المبادئ واألسس المنطقية للمحفظة االستثمارية والمنفذة من قبل خبراء التقييم المستقلين.
يستعرض الجدول التالي موجودات المجموعة المقاسة بالقيمة العادلة بتاريخ 31 ديسمبر 2014. انظر اإليضاح رقم 10 لالطالع على اإلفصاحات المتعلقة
باالستثمارات العقارية المقاسة بالقيمة العادلة.
المجموع ألف
درهم
المستوى الثالث
ألفدرهم
المستوى الثاني
ألف درهم
المستوى األولألف
درهم في 31 ديسمبر
2014الموجودات
موجودات مالية بالقيمة العادلة
من خالل الربح أو الخسارة
5,368 - 5,368 - - استثمار في صندوق عقاري
موجودات مالية متوفرة للبيع
3,111 753 - 2,358 - أوراق مالية تمثل
حقوق ملكية
8,479 753 5,368 2,358 مجموع الموجودات
يعرض الجدول التالي موجودات المجموعة المقاسة بالقيمة العادلة بتاريخ 31 ديسمبر 2013.
المجموع ألف
درهم
المستوى الثالث
ألف درهم
المستوى الثاني
ألف درهم
المستوى األول
ألف درهم
في 31 ديسمبر 2013
الموجوداتموجودات مالية بالقيمة العادلة
من خالل الربح أو الخسارة
4,678 - 4,678 - - استثمار في صندوق عقاري
موجودات مالية متوفرة للبيع
3,111 753 - 2,358 - أوراق مالية تمثل
حقوق ملكية
7,789 753 4,678 2,358 مجموع الموجودات
ليس لدى المجموعة أي مطلوبات مقاسة بالقيمة العادلة بتاريخ 31 ديسمبر 2014 و2013.لم تكن هناك أي تحويالت بين المستوى األول والمستوى الثاني والمستوى الثالث خالل الفترة.

030Annual Report
إيضاحات حول البيانات المالية الموحدةللسنة المنتهية في 31 ديسمبر 2014
لقد تم إعداد التوقعات المستقبلية من قبل اإلدارة على أساس الخطط االستراتيجية وفهم طبيعة السوق وآراء اإلدارة بشأن النمو المتوقع تحقيقه
في حصة السوق على مدى فترة طويلة األجل تبلغ أربع سنوات. استندت معدالت الخصم المطبقة على التدفقات النقدية إلى المتوسط
المرجح لتكلفة رأس المال مع عالوة المخاطرة التي تعكس المخاطر النسبية في األسواق التي تزاول فيها المجموعة عملياتها.
استندت تقديرات معدل النمو إلى رأي متحفظ لمعدل النمو طويل األجل.
إن االفتراضات الرئيسية المستخدمة في عمليات احتساب القيمة قيد االستخدام في عام 2014، هي كالتالي:
معدل النمو: %5 إلى 10% معدل الخصم: 11.4% النمو النهائي: 4%
إن القيمة قيد االستخدام للشهرة أعلى من قيمتها الدفترية، وبالتالي ال توجد خسارة انخفاض في القيمة بنهاية السنة. لن يكون هناك أي تأثير جوهري
على القيمة قيد االستخدام في حال إجراء أي تغيير على االفتراضات الرئيسية المبينة أعاله.
)ب( االعتراف باإليراداتتستخدم طريقة نسبة اإلنجاز في احتساب عقود اإلنشاءات. تتطلب هذه
الطريقة تقديرات عن اإليرادات والتكاليف النهائية للعقود، وكذلك سير العمل المحقق حتى تاريخه من حيث نسبته من إجمالي أعمال العقد المزمع إنجازها وفقا للسياسة المحاسبية الواردة في اإليضاح 20-2. ونتيجة لذلك، ينبغي
على المجموعة تقدير إجمالي التكلفة حتى اإلنجاز لكافة المشاريع القائمة بنهاية كل فترة. إن تأثير بنسبة ٪5 على تقديرات اإلدارة إلجمالي التكاليف حتى إنجاز كافة المشاريع القائمة كما في 31 ديسمبر 2014 كان سيؤدي إلى زيادة / نقصان في اإليرادات واألرباح بواقع 352 مليون درهم )2013: زيادة / نقصان
بواقع 377 مليون درهم(.
يرتبط الشك الرئيسي عند تقييم إيرادات العقود بالمبالغ التي يمكن استردادها من أوامر التعديل والمطالبات ومدفوعات الحوافز التي يتم تسجيلها، بحسب
رأي المجموعة، عندما يكون من المحتمل أن ينتج عنها إيرادات وتكون قابلة للقياس. يتم تعديل هذا التقييم بناء على تقدير اإلدارة للتعويضات النقدية
عن األضرار التي سيطالب بها العمالء والتي تتعلق عادة بشروط التسليم التعاقدية. وفي العديد من المشاريع تطرأ تغييرات متكررة على نطاق العمل
مما يؤدي إلى عدد من أوامر التعديل. تتضمن العقود المبرمة مع العمالء عادة إجراءات لطلب أوامر التعديل والموافقة عليها. ولن تكون هناك في أي فترة
زمنية أوامر تعديل ومطالبات غير معتمدة ومدرجة في إيرادات المشروع عندما يتم تقييم استردادها على أنه محتمل ويتم الوفاء بالمعايير األخرى. وعلى الرغم من أن اإلدارة لديها خبرة واسعة في تقييم نتائج هذه المفاوضات، لكن ما تزال
هناك بعض الشكوك.
تعتمد تكلفة إنجاز العقود على عوامل اإلنتاجية وتكلفة المدخالت حيث إن أداء المقاولين من الباطن وغيرهم ممن لهم تأثير على الجداول الزمنية وكذلك
أسعار السلع وأسعار العمالت يمكن أن تؤثر جميعها على تقديرات التكلفة. فالخبرة واالستخدام المنتظم لنموذج تنفيذ المشروع والتركيز على الكفاءات األساسية تقلل لكن ال تمنع خطر تغير التقديرات بشكل كبير. يتم إدراج عامل الخطر ضمن تكلفة المشروع استنادا إلى سجل المخاطر المعد لكل مشروع.
4التقديرات و األحكام المحاسبية الهامة
يتم تقييم التقديرات واألحكام بصورة منتظمة وتستند إلى التجربة السابقة وعوامل أخرى، تشمل توقعات األحداث المستقبلية التي يعتقد أنها معقولة
في ظل الظروف المتوفرة.
4-1التقديرات واالفتراضات المحاسبية الهامة
تقوم المجموعة بإعداد تقديرات وافتراضات تتعلق بالمستقبل. ومن النادر أن تتوافق التقديرات المحاسبية الناتجة، بحكم طبيعتها، مع النتائج الفعلية ذات
الصلة. إن التقديرات واالفتراضات التي لها مخاطر كبيرة في التسبب بإحداث تعديل جوهري على القيم الدفترية للموجودات والمطلوبات في غضون السنة
المالية القادمة يتم تناولها أدناه:
)أ( تقدير االنخفاض في قيمة الشهرة تنطوي قابلية استرداد األصل على رأي اإلدارة مما يقتضي إجراء تقييم لتحديد إذا ما كان باإلمكان دعم القيمة الدفترية للموجودات بالقيمة الحالية للتدفقات
النقدية المستقبلية المستمدة من تلك الموجودات باستخدام توقعات التدفقات النقدية التي قد تم خصمها بمعدل مناسب.
وفي سبيل احتساب صافي القيمة الحالية للتدفقات النقدية المستقبلية، يقتضي األمر وضع افتراضات محددة فيما يتعلق بمراجعات االنخفاض في القيمة. إن االفتراضات األساسية التي استندت إليها اإلدارة في توقعاتها
للتدفقات النقدية عند تحديد القيمة القابلة لالسترداد هي على النحو التالي:
)أ( األدوات المالية المدرجة في المستوى الثانييتم تحديد القيمة العادلة لألدوات المالية غير المتداولة في األسواق النشطة
باستخدام أساليب التقييم. تعمل هذه األساليب على تحقيق االستفادة القصوى من معطيات السوق المتاحة الجديرة بالمالحظة وتعتمد على أقل قدر
ممكن من التقديرات الموضوعة من قبل المنشأة. إذا كانت جميع المعطيات الهامة المطلوبة لقياس القيمة العادلة لألداة معطيات جديرة بالمالحظة، فإنه
يتم إدراج هذه األدوات ضمن المستوى الثاني.
في حال لم تستند واحدة أو أكثر من المعطيات الهامة على بيانات سوقية جديرة بالمالحظة، تدرج األداة ضمن المستوى الثالث.
تشمل أساليب التقييم المستخدمة في تقييم األدوات المالية في المستوى الثاني والمستوى الثالث ما يلي:
أسعار السوق المدرجة أو أسعار التجار لألدوات المماثلة. تحتسب القيمة العادلة لمقايضات أسعار الفائدة على أساس القيمة الحالية
للتدفقات النقدية المستقبلية المقدرة بناء على منحنيات العائد الجديرة بالمالحظة.
هناك أساليب أخرى مثل تحليل التدفقات النقدية المخصومة تستخدم في تحديد القيمة العادلة لألدوات المالية المتبقية.

031 Annual Report
إيضاحات حول البيانات المالية الموحدةللسنة المنتهية في 31 ديسمبر 2014
إن قياس العمل المنجز على أساس التكاليف ينطوي على مخاطر متأصلة تتعلق بالتكلفة المقدرة كما هو موضح أعاله. ففي الحاالت التي ال ينظر فيها للتكلفة
على أنها تعكس بشكل صحيح سير العمل الفعلي، تستخدم تدابير بديلة مثل ساعات أو مراحل تنفيذ خطة المشروع تحقيقا ألكبر قدر من الدقة في تسجيل
اإليرادات.
يتم تخفيف الشكوك المحيطة بالتقديرات خالل المراحل األولى من العقد عن طريق سياسة تنص عادة على عدم تسجيل اإليرادات التي تجاوز التكاليف في
المشاريع الكبيرة قبل أن تصل نسبة التنفيذ إلى ٪20. ومع ذلك، يمكن لإلدارة على أساس كل مشروع على حدة الموافقة على التسجيل السابق إذا كانت
تقديرات التكلفة موثوقة. يمكن أن تكون تقديرات التكلفة موثوقة في حاالت المشاريع المتكررة والتكنولوجيا المجربة ونماذج التنفيذ المؤكدة أو عندما تكون
التكاليف المتلزم بها مرتفعة بحيث ينخفض معها خطر وجود أي تغييرات جوهرية في تقديرات التكلفة.
يتطلب تطبيق هذه السياسات من اإلدارة وضع أحكام عند تقدير إجمالي اإليرادات وإجمالي التكاليف المتوقعة لكل مشروع. تتم مراجعة هذه التقديرات
مع تقدم المشروع بما يعكس وضعه الحالي وأحدث المعلومات المتاحة لإلدارة. يجري موظفو إدارة المشروع مراجعات منتظمة لضمان صحة أحدث التقديرات.
من وجهة نظر اإلدارة، فإن أحد المشاريع الممنوحة إلحدى الشركات التابعة للمجموعة ينطوي على تقديرات غير مؤكدة يمكن أن ينتج عنها تأثير جوهري على البيانات المالية الموحدة. من المقرر حاليا االنتهاء من المشروع خالل الربع الثالث
من عام 2015. عانى المشروع من التأخير وارتفعت تكاليفه ألسباب تشمل من بين عوامل أخرى تعديالت على المشروع وإجراءات طرف آخر لالنتهاء من التصميم والمعدات والمواد حيث أثرت جميعها بشكل مباشر وبالسلب على
التكاليف وتوقيت العمل في المشروع.
إذا كانت القيمة النهائية المعتمدة ألوامر التعديل والمطالبات أقل بنسبة ٪32 عن التكلفة الفعلية المتكبدة حتى تاريخ 31 ديسمبر 2014، لكان هناك
انخفاض بقيمة 176 مليون درهم في إجمالي األرباح وإيرادات العقود والمبالغ المستحقة من عمالء عن عقود، وبالتالي تصل المجموعة إلى نقطة التعادل
في هذا المشروع. كما كان ستؤدي أي انخفاضات أخرى في قيمة أوامر التعديل والمطالبات المعتمدة إلى عقد مثقل بااللتزامات يقتضي من اإلدارة تسجيل
خسائر فضال عن التكلفة حتى اإلنجاز التي سيتم تكبدها بعد نهاية السنة.
)ج( االنخفاض في قيمة الذمم المدينة التجارية واألخرىيعكس مخصص االنخفاض في القيمة تقديرات الخسائر الناشئة عن إخفاق
األطراف المعنية أو عجزهم عن سداد الدفعات المطلوبة. يقتضي األمر من اإلدارة إبداء الرأي بشأن تقييم ديون العمالء من حيث إمكانية تحصيلها. يستند
المخصص إلى عمر حسابات العميل وجدارته االئتمانية وخبرته السابقة في إعدام الديون. ومن الممكن أن يستدعي األمر إحداث تغييرات على المخصص
المقدر لالنخفاض في القيمة في حال تحسن الوضع المالي للعمالء أو تراجعه. تأخذ اإلدارة بعين االعتبار المستوى الحالي لمخصص االنخفاض في
القيمة وتتأكد من مالءمته وتوافقه مع الخسائر المقدرة في نهاية السنة.
5تقارير القطاعات
يتم بيان المعلومات المتعلقة بالقطاعات التشغيلية للمجموعة أدناه وفقا للمعيار الدولي للتقارير المالية رقم 8 “القطاعات التشغيلية”. يقتضي هذا المعيار تحديد القطاعات التشغيلية على أساس التقارير الداخلية المعدة حول
مكونات المجموعة، وتتم مراجعة هذه التقارير بشكل منتظم من قبل “اإلدارة التنفيذية” التي تعتبر المسؤول الرئيسي عن اتخاذ القرارات بشأن العمليات التشغيلية وذلك بهدف تخصيص الموارد الالزمة لكل قطاع وتقييم أدائه. إن
اإلدارة التنفيذية تقوم بتقييم أداء القطاعات التشغيلية على أساس اإليرادات.
قطاعات األعماليتم تقسيم المجموعة لألغراض اإلدارية إلى وحدات تنظيمية بناء على الخدمات
المقدمة من كل وحدة. تضم المجموعة ثالثة قطاعات تشغيلية رئيسية هي: األعمال الميكانيكية والكهربائية والصحية )األعمال الهندسية(، األعمال المدنية،
النفط والغاز وأعمال أخرى )المكتب اإلداري(.
يتولى قطاع األعمال الهندسية تنفيذ أعمال المقاوالت المتعلقة بقطاع اإلنشاءات كاألعمال الميكانيكية والكهربائية والصحية وأعمال الصرف الصحي
والبنية التحتية ومحطات معالجة المياه وتبريد المناطق وإنتاج الطاقة.
يتولى قطاع األعمال المدنية تنفيذ أعمال المقاوالت المتعلقة بقطاع اإلنشاءات مثل تشييد العقارات واألعمال الصحية واألنشطة العقارية.
يتولى قطاع النفط والغاز تنفيذ األنشطة المتعاقد عليها فيما يتعلق بالتصميم والهندسة وشراء المواد والتصنيع وتشييد المنشآت والمرافق المتكاملة.
أما القطاع األخير فيمثل المكتب اإلداري للمجموعة الذي يقوم بأعمال التخطيط االستراتيجي وإدارة كافة الشركات التابعة وإدارة الخزينة ودمج الشركات
واالستحواذ عليها والهوية المؤسسية وعالقات المستثمرين. وألغراض اإلفصاح عن المعلومات القطاعية، يتم اإلفصاح عن الشهرة والموجودات غير
الملموسة األخرى واإلطفاء المتعلق بهما ضمن القطاع ذي الصلة.
يتم تنفيذ المبيعات بين القطاعات بشروط متفق عليها. ويتم قياس اإليرادات من األطراف الخارجية المعلنة إلى اإلدارة التنفيذية بطريقة تتفق مع تلك
المستخدمة في بيان الدخل الموحد.
يتم قياس المبالغ المعلنة لإلدارة التنفيذية فيما يتعلق بإجمالي الموجودات بطريقة تتسق مع تلك المستخدمة في البيانات المالية الموحدة. ويتم توزيع
هذه الموجودات على أساس عمليات كل قطاع.
القطاعات الجغرافيةتقوم اإلدارة التنفيذية بتوزيع عمليات المجموعة جغرافيا إلى ثالثة قطاعات
رئيسية هي: اإلمارات العربية المتحدة، المملكة العربية السعودية، العراق ودول أخرى. تقوم المجموعة حاليا بتنفيذ أعمال المقاوالت المتعلقة بقطاع اإلنشاءات
في دول أبرزها اإلمارات العربية المتحدة والمملكة العربية السعودية والكويت وقطر ومصر وعمان وألمانيا والجزائر والهند والعراق واألردن.

032Annual Report
إيضاحات حول البيانات المالية الموحدةللسنة المنتهية في 31 ديسمبر 2014
معلومات عن القطاعات الجغرافيةكافة األرقام بآالف الدراهم اإلماراتية
المجموع حذف ضمن القطاعات أخرى العراق المملكة
العربية السعودية اإلمارات العربية
المتحدة
للسنة المنتهية في 31 ديسمبر 2014
4,762,264 - 1,254,747 243,975 1,975,379 1,288,163 إيرادات من عمالء خارجيين
للسنة المنتهية في 31 ديسمبر 2013
4,879,189 - 1,023,078 397,316 2,515,880 942,915 إيرادات من عمالء خارجيين
في 31 ديسمبر 2014
2,163,659 (592,205) 109,991 8,260 313,445 2,324,168 موجودات غير متداولة
في 31 ديسمبر 2013
2,025,082 (529,467) 81,756 16,118 233,424 موجودات غير متداولة 2,223,251
معلومات عن قطاعات األعمالكافة المبالغ بآالف الدراهم اإلماراتية
المجموع حذف ضمن القطاعات أخرى النفط
والغازاألعمال المدنية
األعمال الهندسية
للسنة المنتهية في 31 ديسمبر 2014
اإليرادات4,762,264 - 157,289 269,433 1,829,058 2,506,484 عمالء خارجيون
- (487,722) 21,837 - 18,510 447,375 ما بين القطاعات
4,762,264 (487,722) 179,126 269,433 1,847,568 2,953,859
100,672 - 61,088 52,092 (84,733) 72,225 ربح / )خسارة( القطاع
108,365 - 40,720 16,095 22,054 29,496 استهالك وإطفاء
95,939 - 6,817 14,615 32,193 42,314 نفقات رأسمالية
في 31 ديسمبر 2014
8,556,729 (2,313,830) 3,621,297 201,942 3,120,308 3,927,012 مجموع موجودات القطاع
المجموع حذف ضمن القطاعات أخرى النفط
والغازاألعمال المدنية
األعمال الهندسية
للسنة المنتهية في 31 ديسمبر 2014
اإليرادات 4,879,189 - 117,148 430,245 2,010,900 2,320,896 عمالء خارجيون
- (340,082) 254 - 5,740 334,088 ما بين القطاعات
4,879,189 (340,082) 117,402 430,245 2,016,640 2,654,984
181,735 - (507) 54,504 33,571 94,167 ربح / )خسارة( القطاع
85,138 - 41,852 1,478 18,692 23,116 استهالك وإطفاء
86,733 - 4,423 5,975 46,600 29,735 نفقات رأسمالية
في 31 ديسمبر 2014
7,162,298 (1,598,646) 2,665,938 261,917 2,647,117 3,185,972 مجموع موجودات القطاع
تتضمن اإليرادات مبلغا بقيمة 872,258 ألف درهم من أحد العمالء في قطاع األعمال المدنية بما يجاوز ٪10 من إيرادات المجموعة خالل السنة )السنة المنتهية في 31 ديسمبر 2013: 1,174,361 ألف درهم تتعلق بقطاع األعمال المدنية(.

033 Annual Report
إيضاحات حول البيانات المالية الموحدةللسنة المنتهية في 31 ديسمبر 2014
6ممتلكات ومعدات
المجموع ألف درهم
أعمال رأسمالية
قيد اإلنجاز ألف درهم
مركبات ألف درهم
أثاثوتجهيزاتومعدات
مكتبيةألف درهم
آالتألف درهم
أرضومبان
ألف درهم
التكلفة
613,316 16,143 11,435 39,004 120,445 426,289 في 1 يناير 2013
86,733 2,102 9,051 17,740 49,214 8,626 إضافات
(34,090) (670) (659) (926) (3,979) (27,856) استبعادات
(364) (769) 350 750 787 (1,482) فروق تحويل العمالت
665,595 16,806 20,177 56,568 166,467 405,577 في 31 ديسمبر 2013
95,939 11,581 9,389 36,131 32,013 6,825 إضافات
(7,836) - (1,239) (2,787) (3,416) (394) استبعادات
(1,765) (386) (93) 15 (1,421) 120 فروق تحويل العمالت
751,933 28,001 28,234 89,927 193,643 في 31 ديسمبر 2014 412,128

034Annual Report
إيضاحات حول البيانات المالية الموحدةللسنة المنتهية في 31 ديسمبر 2014
المجموع ألف درهم
أعمال رأسمالية
قيد اإلنجاز ألف درهم
مركبات ألف درهم
أثاثوتجهيزاتومعدات
مكتبيةألف درهم
آالتألف درهم
أرضومبان
ألف درهم
االستهالك المتراكم 109,116 - (2,421) 17,975 61,249 32,313 في 1 يناير 2013
47,388 - 4,496 10,252 23,768 المحمل للسنة 8,872
(2,843) - (270) (225) (2,072) (276) استبعادات
1,254 - 300 686 700 (432) فروق تحويل العمالت
154,915 - 2,105 28,688 83,645 40,477 في 31 ديسمبر 2013
70,615 - 5,698 29,709 25,224 9,984 المحمل للسنة
(6,939) - (1,168) (2,148) (3,343) (280) استبعادات
(1,196) - (46) 7 (1,247) 90 فروق تحويل العمالت
217,395 - 6,589 56,256 104,279 50,271 في 31 ديسمبر 2014
صافي القيمة الدفترية 534,538 28,001 21,645 33,671 89,364 361,857 في 31 ديسمبر 2014510,680 16,806 18,072 27,880 82,822 365,100 في 31 ديسمبر 2013
لقد تم توزيع مخصص االستهالك في بيان الدخل الموحد على النحو التالي:
2013 ألف درهم
2014ألف درهم
29,269 53,586 تكاليف عقود )إيضاح 24(
18,119 17,029 مصاريف عمومية وإدارية )إيضاح 25(
47,388 70,615
يمثل الرصيد المتبقي تكلفة ترخيص وتنفيذ برنامج تخطيط موارد المنشأة والموجودات األخرى قيد اإلنشاء.

035 Annual Report
إيضاحات حول البيانات المالية الموحدةللسنة المنتهية في 31 ديسمبر 2014
7موجودات غير ملموسة
المجموعألف درهم
الطلبات التراكمية
ألف درهم
عالقات العمالء ألف درهم
االسم التجاريألف درهم
الشهرةألف درهم
التكلفة 1,283,024 16,779 335,552 86,246 844,447 في 31 ديسمبر 2013 و2014
اإلطفاء 146,805 8,390 138,415 - - في 1 يناير 2013
37,750 4,195 33,555 - - المحمل للسنة
184,555 12,585 171,970 - - في 31 ديسمبر 2013
37,750 4,194 33,556 - - المحمل للسنة
222,305 16,779 205,526 - - في 31 ديسمبر 2014
صافي القيمة الدفترية
1,060,719 - 130,026 86,246 844,447 في 31 ديسمبر 2014
1,098,469 4,194 163,582 86,246 844,447 في 31 ديسمبر 2013
ألغراض تقييم االنخفاض في قيمة الشهرة، تشمل الوحدات التنظيمية المصنفة كوحدات مولدة للنقد لدى المجموعة قطاع األعمال الميكانيكية والكهربائية والصحية وقطاع أعمال البنية التحتية والمياه والطاقة وقطاع األعمال المدنية.
إن االفتراضات الرئيسية المستخدمة في عمليات احتساب القيمة قيد االستخدام في عام 2014، هي كالتالي:
لقد تم تحديد المبالغ القابلة لالسترداد للوحدات المولدة للنقد على أساس قيمتها قيد االستخدام وذلك باالعتماد على توقعات التدفقات النقدية المستندة إلى الميزانيات المالية التقديرية المعتمدة من قبل اإلدارة لفترة خمس سنوات. لقد تم تطبيق معدل خصم بنسبة 11.4٪ )2013: 11.4٪(.
إن االفتراضات الرئيسية األخرى المستخدمة في حسابات القيمة قيد االستخدام هي كالتالي:
إجمالي هامش الربح المدرج في الميزانية التقديرية: إن األساس المستخدم في تحديد قيمة هامش الربح المدرج في الميزانية التقديرية يمثل إجمالي متوسط الهامش المحقق خالل السنة التي تسبق سنة الميزانية
التقديرية، المعدل بالتحسن المتوقع في كفاءة العمل وتقلبات األسعار وتكاليف القوى العاملة.
معدل الخصم: تمثل المتوسط المرجح لتكلفة رأس المال للوحدات المولدة للنقد المعدلة بعوامل المخاطر ذات الصلة بالمنطقة الجغرافية.
تضخم التكلفة: إن األساس المستخدم في تحديد معدل التضخم في التكلفة هو مؤشر التوقعات العام لألسعار خالل سنة الميزانية التقديرية للوحدات المولدة للنقد.
معدل النمو النهائي: تم افتراض المعدل النهائي للنمو بنسبة ٪4 )2013: ٪3.55(. ترى اإلدارة أن المعدل النهائي للنمو هو أقل معدل نمو يتوقع تحقيقه بعد فترة خمس سنوات.

036Annual Report
إيضاحات حول البيانات المالية الموحدةللسنة المنتهية في 31 ديسمبر 2014
8 ذمم مدينة تجارية وأخرى
2013 ألف درهم
2014ألف درهم
غير متداولة 224,257 239,766 ذمم مدينة تجارية ومحتجزات
(11,754) (12,116) ناقصا: تعديل القيمة العادلة
212,503 227,650 في 31 ديسمبر
متداولة 1,632,912 1,751,067 ذمم مدينة تجارية ومحتجزات
339,302 453,622مبالغ مدفوعة مقدما وذمم
مدينة أخرى
2,218,370 3,287,582مبالغ مستحقة من عمالء عن
عقود
132,099 85,549 قروض وسلفيات
4,322,683 5,577,820
(66,360) (103,645)ناقصا: مخصص االنخفاض في
القيمة
4,256,323 5,474,175
المبالغ المستحقة من عمالء عن عقود تشمل:
10,592,643 15,024,630 تكاليف متكبدة حتى تاريخه
1,217,354 1,434,435 أرباح محتسبة
11,809,997 16,459,065
(9,591,627) (13,171,483) ناقصا: الدفعات المرحلية
2,218,370 3,287,582
فيما يلي تحليل للذمم المدينة التجارية والمحتجزات:
2013ألف درهم
2014ألف درهم
1,479,653 1,499,052 عاملة بالكامل
311,156 388,136تأخر سدادها لكنها لم تتعرض
لالنخفاض في القيمة
66,360 103,645 تعرضت لالنخفاض في القيمة
1,857,169 1,990,833
إن الذمم المدينة التجارية التي يتأخر سدادها ألقل من ستة أشهر ال تعتبر بشكل عام أنها قد تعرضت لالنخفاض في القيمة. كما في 31 ديسمبر
2014، كانت هناك ذمم مدينة تجارية ومحتجزات بقيمة 388,136 ألف درهم )2013: 311,156 ألف درهم( قد تأخر سدادها لكنها لم تتعرض لالنخفاض في
القيمة. تتعلق هذه الذمم بعدد من العمالء المستقلين الذين ال يوجد لديهم تاريخ حديث في العجز عن السداد. إن تحليل أعمار هذه الذمم المدينة التجارية
والمحتجزات هو على النحو التالي:
2013 ألف درهم
2014ألف درهم
186,553 203,750تأخر سدادها من ستة أشهر إلى
سنة واحدة
124,603 184,386 تأخر سدادها ألكثر من سنة واحدة
311,156 388,136
كما في 31 ديسمبر 2014، كانت هناك ذمم مدينة تجارية ومحتجزات بقيمة 103,645 ألف درهم )2013: 66,360 ألف درهم( تعرضت لالنخفاض في
القيمة وتم رصد مخصص لها. إن الذمم المدينة التي تعرضت النخفاض فردي في قيمتها قد تأخر سدادها لما يزيد عن سنة واحدة، وتتعلق هذه الذمم بشكل
رئيسي بعمالء يعانون من ظروف اقتصادية صعبة.
الحركة في مخصص االنخفاض في قيمة الذمم المدينة التجارية والمحتجزات هي على النحو التالي:
2013 ألف درهم
2014ألف درهم
52,413 66,360 في 1 يناير
25,999 54,416مخصص االنخفاض في القيمة
)إيضاح 25(
(8,562) (17,131)محذوف خالل السنة لعدم قابلية
تحصيله
(3,490) - عكوسات )إيضاح 25(
66,360 103,645 في 31 ديسمبر
لقد تم إدراج ما تم رصده وتحريره من مخصص الذمم المدينة التي تعرضت لالنخفاض في القيمة ضمن بند “مصاريف عمومية وإدارية” في بيان الدخل
الموحد. إن المبالغ المحملة إلى حساب المخصص يتم حذفها عموما إذا لم يكن من المتوقع أن يتم استرداد مبالغ نقدية إضافية.

037 Annual Report
إيضاحات حول البيانات المالية الموحدةللسنة المنتهية في 31 ديسمبر 2014
إن إجمالي القيمة الدفترية للذمم المدينة التجارية الخاصة بالمجموعة مقومة بالعمالت التالية:
2013ألف درهم
2014ألف درهم
845,056 816,144 الدرهم اإلماراتي
686,088 705,397 الريال السعودي
50,577 64,821 اليورو
الدينار الكويتي 81,467 54,264
31,641 91,057 الدوالر األمريكي
189,543 231,947 أخرى
1,857,169 1,990,833
ال تشتمل الفئات األخرى ضمن الذمم المدينة التجارية واألخرى على موجودات تعرضت النخفاض في قيمتها.
تحمل القروض والسلفيات معدالت فائدة بنسبة ٪7.5 سنويا.
إن حد التعرض األقصى لمخاطر االئتمان بتاريخ التقرير يتمثل في القيمة الدفترية لكل فئة من فئات الذمم المدينة المذكورة أعاله التي تقارب القيمة
العادلة بتاريخ الميزانية العمومية.
دعاوى التحكيم
كانت المجموعة قد قامت خالل السنة المنتهية في 31 ديسمبر 2012 برفع دعاوى تحكيم بحق عدد من العمالء لتسوية أرصدة الذمم المدينة والمحتجزات والمبالغ المستحقة من عمالء عن عقود البالغة قيمتها 58 مليون درهم و36
مليون درهم و41.3 مليون درهم، على التوالي، حيث كانت هذه األرصدة تتعلق بمشروعات تم االنتهاء منها وتسليمها إلى العمالء. وفي ذلك الوقت،
كانت نتائج دعاوى التحكيم غير مؤكدة غير أن اإلدارة كانت ترى أن تلك األرصدة قابلة لالسترداد بالكامل. كما في 31 ديسمبر 2012، لم يتم رصد أي مخصص لالنخفاض في قيمة تلك األرصدة التي بلغت قيمتها اإلجمالية 135.3 مليون
درهم.
توصلت المجموعة خالل السنة المنتهية في 31 ديسمبر 2013 إلى حل ودي مع أحد العمالء لتسوية أرصدة الذمم المدينة والمحتجزات والمبالغ المستحقة
من عمالء عن عقود البالغة قيمتها 48.3 مليون درهم مع رصد المخصص المالئم للرصيد غير المحتمل استرداده.
وخالل السنة الحالية لم تصدر إحدى قرارات التحكيم المتعلقة بتسوية أرصدة الذمم المدينة والمحتجزات والمبالغ المستحقة من عمالء عن عقود بقيمة 61
مليون درهم لصالح المجموعة بالكامل. وعليه، قررت اإلدارة االستمرار في متابعة مطالباتها، إما في محاكم دبي أو من خالل إجراءات تحكيم جديدة. وتم
رصد مخصص تقديري مقابل هذه األرصدة.
ال تزال أرصدة المحتجزات والمبالغ المستحقة من العمالء عن العقود بقيمة 8 مليون درهم و18 مليون درهم، على التوالي، منظورة أمام جهات التحكيم كما في 31 ديسمبر 2014. لم يتم بنهاية السنة رصد أي مخصص عن االنخفاض في قيمة هذه األرصدة التي تبلغ قيمتها اإلجمالية 26 مليون درهم حيث ترى
اإلدارة أن هذه األرصدة قابلة لالسترداد بالكامل.
دعوى قضائية
أبرمت المجموعة خالل السنة المنتهية في 31 ديسمبر 2013 اتفاقية تسوية نهائية بقيمة 105 مليون درهم مع أحد العمالء فيما يتعلق بمشروع تم االنتهاء
منه وتسليمه. تم االتفاق على خطة سداد بموجب اتفاقية التسوية، ولكن العميل لم يفي بالتزاماته المنصوص عليها في االتفاقية خالل السنة المنتهية
في 31 ديسمبر 2014.
رفعت المجموعة دعوى قضائية بحق العميل، ولكن الحكم النهائي في الدعوى غير مؤكد ألنها ال تزال في مراحلها األولى. لم يتم رصد أي مخصص عن
االنخفاض في قيمة هذا الرصيد البالغ 105 مليون درهم كما في 31 ديسمبر .2014
أوامر التعديل والمطالبات
تشمل المبالغ المستحقة من عمالء عن عقود مبلغا بقيمة 543 مليون درهم يتعلق بأوامر تعديل ومطالبات غير معتمدة مسجلة في بيان الدخل الموحد ضمن اإليرادات والتكاليف المتعلقة بأحد العقود. تمثل مبالغ أوامر التعديل
والمطالبات غير المعتمدة نسبة ٪15 من إجمالي تكاليف العقد المتكبدة حتى تاريخه. سجلت المجموعة جميع هذه التكاليف دون هامش ربح حيث ترى اإلدارة
أن قيمة أوامر التعديل غير المعتمدة تعد قابلة لالسترداد بالكامل وأن قيمة عنصر المطالبات المدرجة ضمن المبلغ المذكور سوف تكون قابلة لالسترداد
على األقل بسعر التكلفة. تمت الموافقة على أوامر التعديل والتغييرات السابقة بنسبة ٪80 من أوامر التعديل المقدمة. وفي سبيل تقدير اإليرادات
المسجلة، فقد رأت اإلدارة أن التقدير المتحفظ ألوامر التعديل سيتم الموافقة عليه. كما وضعت اإلدارة تقديرا معقوال للتكلفة حتى اإلنجاز بناء على السعر
األصلي للعقد بعد مراعاة أسعار التعاقد السابقة المتفق عليها.

038Annual Report
إيضاحات حول البيانات المالية الموحدةللسنة المنتهية في 31 ديسمبر 2014
10 استثمارات عقارية
إن القيمة العادلة لالستثمارات العقارية كانت مساوية لقيمتها الدفترية بتاريخ الميزانية العمومية.
يحلل الجدول أدناه الموجودات غير المالية المدرجة بالقيمة العادلة بحسب طريقة التقييم.
لقد تم تحديد مستويات التقييم المختلفة على النحو التالي:
األسعار المعلنة )غير المعدلة( في األسواق النشطة للموجودات أو المطلوبات المتطابقة )المستوى األول(.
المعطيات األخرى بخالف األسعار المعلنة المدرجة ضمن المستوى األول، الجديرة بالمالحظة بالنسبة لألصل أو المطلوب، سواء كانت مباشرة )وهي األسعار( أو غير مباشرة )وهي المستمدة من األسعار( )المستوى الثاني(.
المعطيات الخاصة باألصل أو المطلوب التي ال تستند إلى بيانات سوق جديرة بالمالحظة )وهي المعطيات غير الجديرة بالمالحظة( )المستوى
الثالث(.
قياسات القيمة العادلة في 31 ديسمبر 2014 باستخدام
المجموعألف درهم
المستوى الثالث
ألف درهم
المستوى الثاني ألف
درهم
المستوى األول
ألف درهم
قياسات القيمة العادلة
المتكررة29,376 - 29,376 - استثمارات عقارية
29,376 - 29,376 -مجموع
الموجودات
قياسات القيمة العادلة في 31 ديسمبر 2013 باستخدام
المجموعألف درهم
المستوى الثالث
ألف درهم
المستوى الثاني
ألف درهم
المستوى األول
ألف درهم
قياسات القيمة العادلة
المتكررة29,376 - 29,376 - استثمارات عقارية
29,376 - 29,376 -مجموع
الموجودات
لم تكن هناك أي تحويالت بين المستوى األول والمستوى الثاني والمستوى الثالث خالل الفترة.
لقد تم الحصول على القيم العادلة وفقا للمستوى الثاني باستخدام طريقة مقارنة المبيعات. يتم تعديل أسعار البيع للوحدات المماثلة التي تتمتع بسمات شديدة التقارب بالفروق في المواصفات الرئيسية التي تميز كل عقار عن اآلخر
مثل مساحة العقار. إن العامل األهم المستخدم في هذه الطريقة هو سعر القدم المربع.
تبلغ إيرادات اإليجار، صافية من المصاريف، المحققة من االستثمارات العقارية ما قيمته 1,231 ألف درهم )2013: 1,020 ألف درهم( وهي مدرجة ضمن
اإليرادات األخرى.
9 ضريبة مؤجلة
فيما يلي إجمالي الحركة في موجودات ومطلوبات ضريبة الدخل المؤجلة::
2013 ألف درهم
2014ألف درهم
موجودات ضريبة دخل مؤجلة
17,630 5,646 في 1 يناير
546 (662) فروق صرف العمالت
(12,530) -موجودات ضريبة دخل مؤجلة غير
قابلة لالسترداد
- 827 مخصص بيان الدخل )إيضاح 28(
5,646 5,811 في 31 ديسمبر
2013 ألف درهم
2014ألف درهم
مطلوبات ضريبة دخل مؤجلة
8,835 2,414 في 1 يناير
(323) - فروق صرف العمالت
(6,098) (261) مخصص بيان الدخل )إيضاح 28(
2,414 في 31 ديسمبر 2,153

039 Annual Report
إيضاحات حول البيانات المالية الموحدةللسنة المنتهية في 31 ديسمبر 2014
11 موجودات مالية متوفرة للبيع
2013 ألف درهم
2014ألف درهم
2,384 75,159 في 1 يناير
72,048 18,902 إضافات
- (53,308)المصنف كاستثمار في شركة
زميلة )ايضاح 29-2(
727 -عكس انخفاض في قيمة
موجودات مالية متوفرة للبيع )إيضاح 27(
75,159 40,753 في 31 ديسمبر
يتم تصنيف الموجودات المالية المتوفرة للبيع كموجودات غير متداولة في البيانات المالية الموحدة. إن هذه االستثمارات، باستثناء المدرج منها بالقيمة العادلة وفقا لما هو مبين في اإليضاح 3-3، يتم إدراجها بسعر التكلفة نظرا
لعدم إمكانية تحديد قيمتها العادلة بشكل موثوق به. تشمل الموجودات المالية المتوفرة للبيع الحصص في الشركات غير المدرجة.
اإلضافات تشمل االستثمار التالي:
درهم )ألف(
نسبة الملكية البلد
اسم الشركة المستثمر فيها
18,902 0.4% جمهورية مصر
العربيةالتحرير
للبتروكيماويات
18,902 -
صنفت المجموعة االستثمار المذكور كأصل مالي متوفر للبيع بتاريخ االستثمار.
تشمل الموجودات المالية المتوفرة للبيع مبلغا بقيمة 37,642 ألف درهم مدرج بالتكلفة بنهاية السنة.
الموجودات المالية المتوفرة للبيع مقومة بالعمالت التالية:
2013 ألف درهم
2014ألف درهم
18,740 37,642 الدوالر األمريكي
53,308 - الريال السعودي
3,111 3,111 الدينار األردني
75,159 40,753
12موجودات مالية بالقيمة العادلة من
خالل الربح أو الخسارة
2013 ألف درهم
2014ألف درهم
4,678 5,368استثمار في صندوق استثمار
عقاري
الحركة في الموجودات المالية بالقيمة العادلة من خالل الربح أو الخسارة كالتالي:
2013 ألف درهم
2014ألف درهم
4,821 4,678 في 1 يناير
(143) 690ربح / )خسارة( القيمة العادلة
)إيضاح 27(
4,678 5,368 في 31 ديسمبر
الموجودات المالية بالقيمة العادلة من خالل الربح أو الخسارة معروضة ضمن “أنشطة العمليات” كجزء من التغيرات في رأس المال العامل في بيان
التدفقات النقدية.
يتم إدراج التغيرات في القيم العادلة للموجودات المالية بالقيمة العادلة من خالل الربح أو الخسارة في بيان الدخل الموحد ضمن بند “أرباح / )خسائر( أخرى -
بالصافي” )إيضاح 27(.
13مخزون
2013 ألف درهم
2014ألف درهم
30,259 44,817 مواد وقطع استهالكية

040Annual Report
إيضاحات حول البيانات المالية الموحدةللسنة المنتهية في 31 ديسمبر 2014
14أرصدة نقدية ومصرفية
2013 ألف درهم
2014ألف درهم
4,160 4,116 نقد في الصندوق
281,543 335,592 نقد لدى المصرف
272,514 418,412 ودائع ألجل
558,217 758,120 األرصدة النقدية والمصرفية
تحمل الودائع ألجل متوسط سعر فائدة بنسبة ٪1 إلى ٪3.5 )2013: ٪1 إلى .)4٪
لغرض بيان التدفقات النقدية، يتكون النقد وما في حكمه مما يلي:
2013 ألف درهم
2014ألف درهم
558,217 758,120 أرصدة نقدية ومصرفية
)112,765( )200,893( ناقصا: ودائع ألجل مرهونة
)123,186( )360,782( سحوبات مصرفية على المكشوف )إيضاح 18(
322,266 196,445 النقد وما في حكمه
15رأس المال
المصرح به والمصدر والمدفوع بالكامل
2013 ألف درهم
2014ألف درهم
1,197,778 1,197,778 1,197,777,778 سهما بقيمة درهم واحد للسهم مدفوعة نقدا
980,000 980,000980,000,000 سهم بقيمة درهم
واحد للسهم مدفوعة عينا )انظر 1 أدناه(
107,269 107,269 أسهم منحة )انظر 2 أدناه(
2,285,047 2,285,047
تم تحويل موجودات ومطلوبات شركة دريك أند سكل انترناشيونال )ذ.م.م( . 1وشركاتها التابعة إلى شركة دريك أند سكل انترناشيونال ش.م.ع كمساهمة
عينية تمثل نسبة ٪45 من أسهم الشركة. وافق المساهمون خالل اجتماع الجمعية العمومية السنوي المنعقد في 26 . 2
أبريل 2012 على دفع توزيعات أرباح نقدية بنسبة ٪3 من القيمة االسمية لألسهم المصدرة وبنسبة ٪5 ألسهم المنحة. تم اعتماد الزيادة في رأس
المال رسميا من قبل وزارة االقتصاد في 25 يونيو 2012. وعليه، فقد تم إدراج هذه األرباح في بيان التغيرات في حقوق الملكية الموحد.
خالل السنة المنتهية في 31 ديسمبر 2009، حصلت الشركة على الموافقة . 3الالزمة من الجهات الرقابية لتنفيذ برنامج إعادة شراء األسهم. تم شراء
32,400 ألف سهم من السوق بمتوسط سعر بلغ 0.8834 درهم للسهم بقيمة إجمالية 28,622 ألف درهم. خالل السنة المنتهية في 31 ديسمبر
2013، أعيد إصدار هذه األسهم بمتوسط سعر 0.977 درهم للسهم بقيمة إجمالية 31,648 ألف درهم بعالوة إصدار قدرها 3,026 ألف درهم.
16احتياطي قانوني
وفقا للقوانين المعمول بها في البلدان ذات العالقة والنظام األساسي للشركة، يتعين على الشركة تحويل ما نسبته ٪10 من ربح السنة لكل شركة
ذات مسؤولية محدودة مسجلة إلى احتياطي قانوني. إن هذا االحتياطي غير متوفر للتوزيع باستثناء ما ينص عليه القانون. يستمر هذا التحويل حتى يبلغ
رصيد االحتياطي ما ال يقل عن ٪50 من رأس المال المدفوع لدى الشركات ذات العالقة. تم تحويل ما قيمته 22,955 ألف درهم )2013: 14,503 ألف درهم(
من األرباح المحتجزة إلى هذا االحتياطي بتاريخ الميزانية العمومية.
17احتياطي آخر
خالل الربع الثالث للسنة المنتهية في 31 ديسمبر 2011، استحوذت المجموعة على النسبة المتبقية البالغة ٪20 من األسهم المتعلقة بالحصة غير المسيطرة في إحدى شركاتها التابعة، وهي شركة جلف تكنيكال كونستركشن ش.ذ.م.م.
بلغت القيمة العادلة إلجمالي الموجودات الصافية المحددة لشركة جلف تكنيكال كونستركشن ش.ذ.م.م ما قيمته 160,000 ألف درهم. كانت نسبة 20٪ مملوكة الثنين من المساهمين بالتساوي فيما بينهما. قامت المجموعة بسداد
كامل قيمة حصة أحد المساهمين نقدا، أما المساهم اآلخر فقامت المجموعة بسداد جزء من قيمة حصته نقدا وسددت الرصيد المتبقي له مقابل نسبة 6٪
من أسهم شركة تابعة أخرى هي شركة دريك أند سكل لإلنشاءات ذ.م.م )شركة تابعة مملوكة بالكامل للشركة األم(.
هناك مبلغ بقيمة 24,543 ألف درهم يمثل الفرق بين إجمالي المقابل المدفوع / األسهم المحولة وااللتزام الطارئ المحمل بقيمة 26,862 ألف درهم والقيمة الدفترية للحصة غير المسيطرة البالغة 51,405 ألف درهم، قد تم إدراجه ضمن
احتياطيات أخرى في بيان التغيرات في حقوق الملكية الموحد.
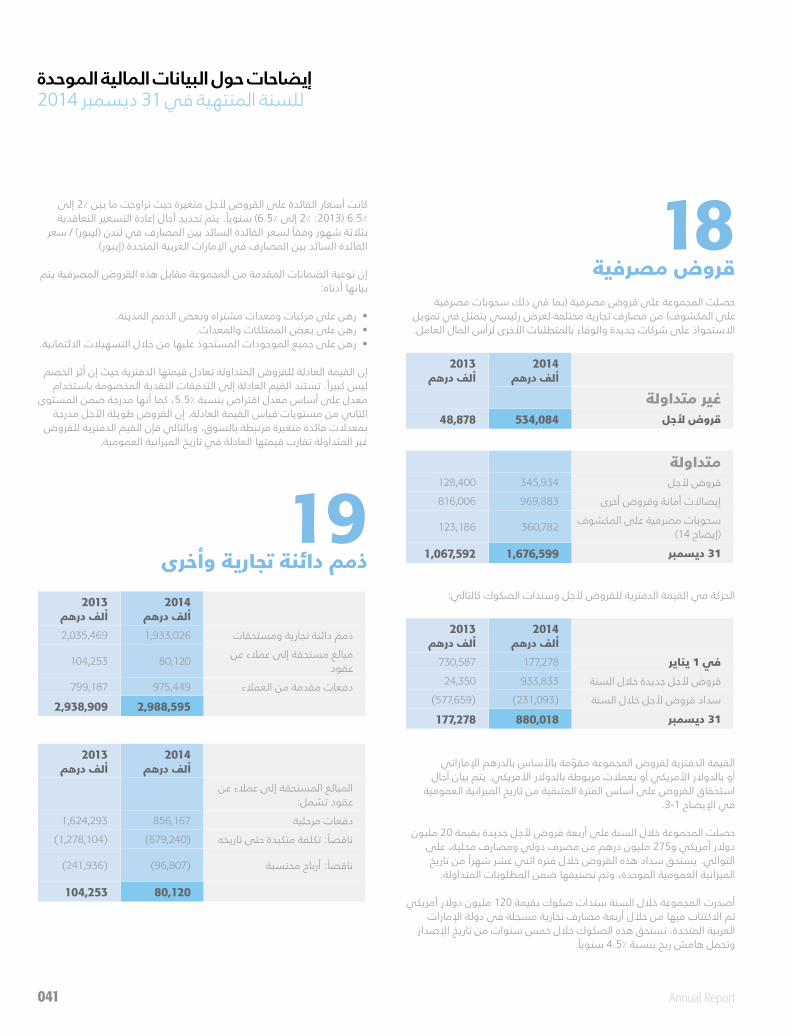
041 Annual Report
إيضاحات حول البيانات المالية الموحدةللسنة المنتهية في 31 ديسمبر 2014
18قروض مصرفية
حصلت المجموعة على قروض مصرفية )بما في ذلك سحوبات مصرفية على المكشوف( من مصارف تجارية مختلفة لغرض رئيسي يتمثل في تمويل االستحواذ على شركات جديدة والوفاء بالمتطلبات األخرى لرأس المال العامل.
2013 ألف درهم
2014ألف درهم
غير متداولة 48,878 534,084 قروض ألجل
متداولة 128,400 345,934 قروض ألجل
816,006 969,883 إيصاالت أمانة وقروض أخرى
123,186 360,782سحوبات مصرفية على المكشوف
)إيضاح 14(
1,067,592 1,676,599 31 ديسمبر
الحركة في القيمة الدفترية للقروض ألجل وسندات الصكوك كالتالي:
2013 ألف درهم
2014ألف درهم
730,587 177,278 في 1 يناير
24,350 933,833 قروض ألجل جديدة خالل السنة
(577,659) (231,093) سداد قروض ألجل خالل السنة
177,278 880,018 31 ديسمبر
القيمة الدفترية لقروض المجموعة مقومة باألساس بالدرهم اإلماراتي أو بالدوالر األمريكي أو بعمالت مربوطة بالدوالر األمريكي. يتم بيان آجال
استحقاق القروض على أساس الفترة المتبقية من تاريخ الميزانية العمومية في اإليضاح 3-1.
حصلت المجموعة خالل السنة على أربعة قروض ألجل جديدة بقيمة 20 مليون
دوالر أمريكي و275 مليون درهم من مصرف دولي ومصارف محلية، على التوالي. يستحق سداد هذه القروض خالل فترة اثني عشر شهرا من تاريخ
الميزانية العمومية الموحدة، وتم تصنيفها ضمن المطلوبات المتداولة.
أصدرت المجموعة خالل السنة سندات صكوك بقيمة 120 مليون دوالر أمريكي تم االكتتاب فيها من خالل أربعة مصارف تجارية مسجلة في دولة اإلمارات
العربية المتحدة. تستحق هذه الصكوك خالل خمس سنوات من تاريخ اإلصدار وتحمل هامش ربح بنسبة ٪4.5 سنويا.
19 ذمم دائنة تجارية وأخرى
2013 ألف درهم
2014ألف درهم
2,035,469 1,933,026 ذمم دائنة تجارية ومستحقات
104,253 80,120 مبالغ مستحقة إلى عمالء عن
عقود
799,187 975,449 دفعات مقدمة من العمالء
2,938,909 2,988,595
2013 ألف درهم
2014ألف درهم
المبالغ المستحقة إلى عمالء عن عقود تشمل:
1,624,293 856,167 دفعات مرحلية
(1,278,104) (679,240) ناقصا: تكلفة متكبدة حتى تاريخه
(241,936) (96,807) ناقصا: أرباح محتسبة
104,253 80,120
كانت أسعار الفائدة على القروض ألجل متغيرة حيث تراوحت ما بين ٪2 إلى ٪6.5 )2013: ٪2 إلى ٪6.5( سنويا. يتم تحديد آجال إعادة التسعير التعاقدية
بثالثة شهور وفقا لسعر الفائدة السائد بين المصارف في لندن )ليبور( / سعر الفائدة السائد بين المصارف في اإلمارات العربية المتحدة )إيبور(.
إن نوعية الضمانات المقدمة من المجموعة مقابل هذه القروض المصرفية يتم بيانها أدناه:
• رهن على مركبات ومعدات مشتراه وبعض الذمم المدينة.• رهن على بعض الممتلكات والمعدات.
• رهن على جميع الموجودات المستحوذ عليها من خالل التسهيالت االئتمانية.
إن القيمة العادلة للقروض المتداولة تعادل قيمتها الدفترية حيث إن أثر الخصم ليس كبيرا. تستند القيم العادلة إلى التدفقات النقدية المخصومة باستخدام
معدل على أساس معدل اقتراض بنسبة ٪5.5، كما أنها مدرجة ضمن المستوى الثاني من مستويات قياس القيمة العادلة. إن القروض طويلة األجل مدرجة
بمعدالت فائدة متغيرة مرتبطة بالسوق، وبالتالي فإن القيم الدفترية للقروض غير المتداولة تقارب قيمتها العادلة في تاريخ الميزانية العمومية.

042Annual Report
إيضاحات حول البيانات المالية الموحدةللسنة المنتهية في 31 ديسمبر 2014
20 مخصص مكافآت نهاية
الخدمة للموظفين
2013 ألف درهم
2014ألف درهم
84,669 110,234 في 1 يناير
41,665 49,076 المحمل للسنة
(16,100) (8,348) مدفوعات خالل السنة
110,234 150,962
مخصص مكافآت نهاية الخدمة للموظفين موزع في بيان الدخل الموحد على النحو التالي:
2013 ألف درهم
2014ألف درهم
36,542 41,092 تكاليف عقود )إيضاح 24(
5,123 7,984مصاريف عمومية وإدارية
)إيضاح 25(
41,665 49,076
وفقا ألحكام المعيار المحاسبي الدولي رقم 19، فقد قامت اإلدارة بتقدير القيمة الحالية اللتزاماتها كما في 31 ديسمبر 2014 و2013، باستخدام
األساليب االكتوارية، فيما يتعلق بمكافآت نهاية الخدمة المستحقة للموظفين بموجب قانون العمل لدولة اإلمارات العربية المتحدة والقوانين السارية في البلدان التي تزاول فيها المجموعة عملياتها، وذلك عن فترات خدمتهم حتى
تاريخ الميزانية العمومية.
وبموجب هذه الطريقة، فقد تم إجراء تقييم لفترة الخدمة المتوقعة للموظفين لدى المجموعة وللراتب األساسي المتوقع بتاريخ ترك الخدمة. كما تم تقدير
الزيادات المستقبلية للرواتب بما يتناسب مع التطور الطبيعي لراتب الموظف وبما يتوافق مع سلم الرواتب لدى المجموعة والخبرة السابقة وظروف السوق.
وقد افترضت اإلدارة متوسط تكاليف زيادة / ترقية بنسبة 5٪ )2013: 3.5٪(. لقد تم خصم االلتزام المتوقع بتاريخ ترك الخدمة إلى صافي قيمته الحالية
باستخدام معدل خصم يبلغ ٪3.15 سنويا )2013: ٪4.5 سنويا(.
21معامالت وأرصدة األطراف
ذات العالقة تتكون األطراف ذات العالقة من المساهمين الرئيسيين وكبار أعضاء اإلدارة
العليا والترتيبات المشتركة وأعضاء مجلس اإلدارة والشركات التي يسيطر عليها المساهمون أو أعضاء مجلس اإلدارة بشكل مباشر أو غير مباشر أو التي يمارسون عليها نفوذا إداريا فعاال )يشار إليها فيما يلي بـ “الشركات الزميلة”(. قامت المجموعة خالل سياق العمل االعتيادي بإبرام العديد من المعامالت مع
األطراف ذات العالقة. لقد تم إبرام تلك المعامالت وفقا لألحكام والشروط المتفق عليها من قبل إدارة المجموعة أو مجلس إدارتها.
المعامالت الهامة مع األطراف ذات العالقةبلغت قيمة المعامالت الهامة المبرمة مع الشركات الزميلة 35,775 ألف درهم
)2013: 59,817 ألف درهم( وتمثل باألساس تكاليف التعاقد من الباطن للعقود الرئيسية.
أرصدة األطراف ذات العالقةإن األرصدة القائمة مع األطراف ذات العالقة بيانها كالتالي:
2013 ألف درهم
2014ألف درهم
- 743 دريك أند سكل جروب
216,548 90,610 ترتيبات مشتركة
52,080 126 شركات زميلة
268,628 91,479
مبالغ مستحقة ألطراف ذات عالقة:
818 - دريك أند سكل جروب
4,314 28,560 ترتيبات مشتركة
14,313 99,790 شركات زميلة
19,445 128,350
مكافآت كبار أفراد اإلدارة العليافيما يلي مكافآت أعضاء مجلس اإلدارة وكبار أفراد اإلدارة العليا:
2013 ألف درهم
2014ألف درهم
44,008 39,592 رواتب ومنافع قصيرة األجل
3,018 3,360 مكافآت نهاية الخدمة للموظفين
47,026 42,952
بلغت قيمة األتعاب المدفوعة لمجلس اإلدارة خالل السنة 1,250 ألف درهم )2013: 1,250 ألف درهم(.

043 Annual Report
إيضاحات حول البيانات المالية الموحدةللسنة المنتهية في 31 ديسمبر 2014
22 تكاليف تمويل - بالصافي
السنة المنتهية في 31 ديسمبر
2013 ألف درهم
2014ألف درهم
9,908 6,385 إيرادات فائدة من ودائع ألجل
13,239 5,273 إيرادات فائدة من قروض ودفعات
مقدمة
23,147 11,658 إيرادات تمويل
(36,032) (21,456) تكاليف تمويل
(12,885) (9,798) تكاليف التمويل - بالصافي
تكاليف التمويل موزعة في بيان الدخل الموحد على النحو التالي:
100,835 98,958مصروف فائدة على قروض
مصرفية
(64,803) (77,502)ناقصا: المحمل على تكاليف
العقود )إيضاح 24(
36,032 21,456 تكاليف التمويل - بالصافي
23إيرادات أخرى
السنة المنتهية في 31 ديسمبر
2013 ألف درهم
2014ألف درهم
- 15,421 تسوية قانونية*
5,671 6,619 إيرادات إيجار
4,224 4,074 بيع خردة
982 160 ربح من استبعاد ممتلكات ومعدات
9,781 4,729 أخرى
20,658 31,003
* تمثل تسوية قانونية بحكم من المحكمة عن دعوى مرفوعة من إحدى الشركات التابعة بحق مالكها السابقين.
24 تكاليف عقود
السنة المنتهية في 31 ديسمبر
2013 ألف درهم
2014ألف درهم
1,740,148 1,576,844 تكاليف مواد
737,513 1,248,481تكاليف عمالة وموظفين
)إيضاح 26(
1,141,128 831,201 تكاليف مقاوالت من الباطن
632,893 521,949 مصاريف عامة
64,803 77,502 تكاليف تمويل
29,269 53,586 استهالك )إيضاح 6(
36,542 41,092مكافآت نهاية الخدمة للموظفين
)إيضاح 20(
4,382,296 4,350,655
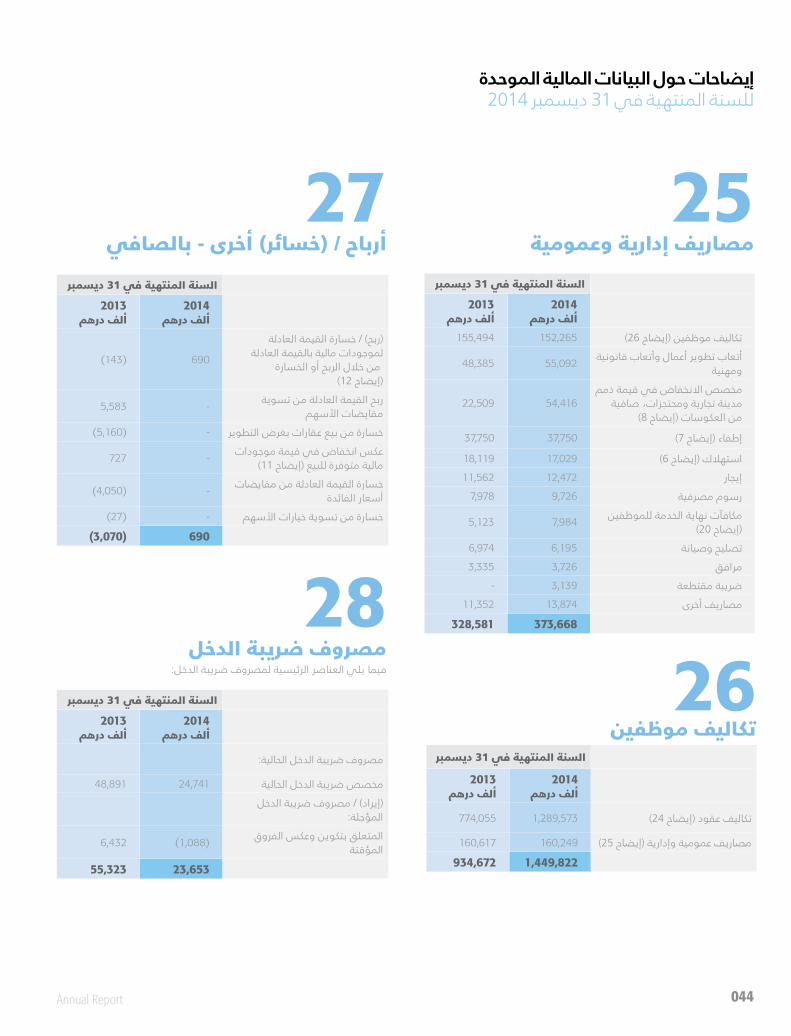
044Annual Report
إيضاحات حول البيانات المالية الموحدةللسنة المنتهية في 31 ديسمبر 2014
25 مصاريف إدارية وعمومية
السنة المنتهية في 31 ديسمبر
2013 ألف درهم
2014ألف درهم
155,494 152,265 تكاليف موظفين )إيضاح 26(
48,385 55,092أتعاب تطوير أعمال وأتعاب قانونية
ومهنية
22,509 54,416مخصص االنخفاض في قيمة ذمم
مدينة تجارية ومحتجزات، صافية من العكوسات )إيضاح 8(
37,750 37,750 إطفاء )إيضاح 7(
18,119 17,029 استهالك )إيضاح 6(
11,562 12,472 إيجار
7,978 9,726 رسوم مصرفية
5,123 7,984مكافآت نهاية الخدمة للموظفين
)إيضاح 20(
6,974 6,195 تصليح وصيانة
3,335 3,726 مرافق
- 3,139 ضريبة مقتطعة
11,352 13,874 مصاريف أخرى
328,581 373,668
27أرباح / )خسائر( أخرى - بالصافي
السنة المنتهية في 31 ديسمبر
2013 ألف درهم
2014ألف درهم
(143) 690
)ربح( / خسارة القيمة العادلة لموجودات مالية بالقيمة العادلة
من خالل الربح أو الخسارة)إيضاح 12(
5,583 -ربح القيمة العادلة من تسوية
مقايضات األسهم
(5,160) - خسارة من بيع عقارات بغرض التطوير
727 -عكس انخفاض في قيمة موجودات
مالية متوفرة للبيع )إيضاح 11(
(4,050) -خسارة القيمة العادلة من مقايضات
أسعار الفائدة
(27) - خسارة من تسوية خيارات األسهم
(3,070) 690
28مصروف ضريبة الدخل
فيما يلي العناصر الرئيسية لمصروف ضريبة الدخل:
السنة المنتهية في 31 ديسمبر
2013 ألف درهم
2014ألف درهم
مصروف ضريبة الدخل الحالية:
48,891 24,741 مخصص ضريبة الدخل الحالية
)إيراد( / مصروف ضريبة الدخل المؤجلة:
6,432 (1,088)المتعلق بتكوين وعكس الفروق
المؤقتة
55,323 23,653
26تكاليف موظفين
السنة المنتهية في 31 ديسمبر
2013 ألف درهم
2014ألف درهم
774,055 1,289,573 تكاليف عقود )إيضاح 24(
160,617 160,249 مصاريف عمومية وإدارية )إيضاح 25(
934,672 1,449,822

045 Annual Report
إيضاحات حول البيانات المالية الموحدةللسنة المنتهية في 31 ديسمبر 2014
29استثمارات
المبالغ المسجلة في الميزانية العمومية كالتالي::
السنة المنتهية في 31 ديسمبر
2013 ألف درهم
2014ألف درهم
93,249 159,244 مشاريع مشتركة )إايضاح 29-1(
- 105,568 شركات زميلة )إايضاح 29-2(
93,249 264,812 في 31 ديسمبر
29-1استثمار في مشروع مشترك
حصة المجموعة في موجودات ومطلوبات المشروع المشترك المدرجة في البيانات المالية الموحدة على النحو التالي:
السنة المنتهية في 31 ديسمبر
2013 ألف درهم
2014ألف درهم
29,206 93,249 في 1 يناير
64,043 65,995حصة في ربح استثمار في مشروع
مشترك
93,249 159,244 في 31 ديسمبر
المشروع المشترك المبين أدناه له رأس مال يتكون فقط من أسهم عادية، وهو مملوك مباشرة للمجموعة.
طبيعة االستثمار في المشروع المشترك
طريقة القياس
طبيعةالعالقة
نسبة الملكية
)٪(
بلد التأسيس اسم الشركة
حقوق الملكية إيضاح 1 50٪ جزر الكايمان
دي اس أو للتطوير
المحدودة
إيضاح 1: يتمثل النشاط الرئيسي لشركة دي اس أو للتطوير المحدودة في االستثمار والتطوير العقاري.
شركة دي اس أو للتطوير المحدودة هي شركة خاصة وال يتوفر ألسهمها أي سعر مدرج في السوق.
االلتزامات والمطلوبات المحتملة المتعلقة بالمشروع المشترك
ليس لدى المجموعة أي التزامات أو مطلوبات محتملة فيما يتعلق بمشروعها المشترك.
المعلومات المالية الموجزة للمشروع المشتركالمعلومات المالية الموجزة لشركة دي اس أو للتطوير المحدودة المحتسبة
باستخدام طريقة حقوق الملكية مبينة في الصفحة التالية.
الميزانية العمومية الموجزة
2013 ألف درهم
2014ألف درهم
موجودات متداولة
26,436 -مبالغ مستحقة من أطراف ذات
عالقة
- 503,463 عقار بغرض التطوير
54 2,211 نقد وما في حكمه
26,490 505,674 مجموع الموجودات المتداولة
مطلوبات متداولة
40,661 139,612 ذمم دائنة تجارية وأخرى
- 47,574 مبالغ مستحقة ألطراف ذات عالقة
40,661 187,186 مجموع المطلوبات المتداولة
موجودات غير متداولة
329,354 - استثمار عقاري
مطلوبات غير متداولة
128,685 - ذمم دائنة طويلة األجل
186,498 318,488 صافي الموجودات
بيان الدخل الشامل الموجز
السنة المنتهية في 31 ديسمبر
2013 ألف درهم
2014ألف درهم
(7,802) مصاريف عمومية وإدارية (30,934)
(7,802) - الخسارة التشغيلية للفترة
122,878 172,205 ربح من إعادة تقييم استثمار عقاري
13,010 (9,281) )خسارة( / ربح من التقييم العادل
لذمم دائنة طويلة األجل
128,086 131,990الربح ومجموع الدخل الشامل
للفترة
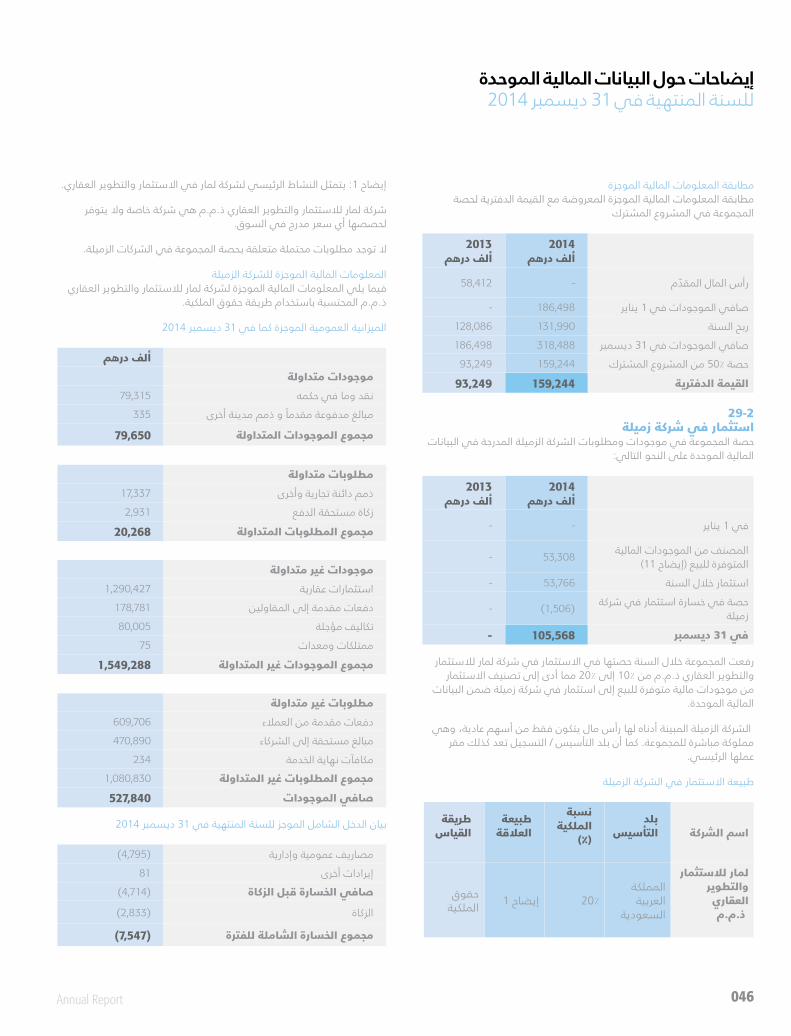
046Annual Report
إيضاحات حول البيانات المالية الموحدةللسنة المنتهية في 31 ديسمبر 2014
مطابقة المعلومات المالية الموجزةمطابقة المعلومات المالية الموجزة المعروضة مع القيمة الدفترية لحصة
المجموعة في المشروع المشترك
2013 ألف درهم
2014ألف درهم
58,412 - رأس المال المقدم
- 186,498 صافي الموجودات في 1 يناير
128,086 131,990 ربح السنة
186,498 صافي الموجودات في 31 ديسمبر 318,488
93,249 159,244 حصة ٪50 من المشروع المشترك
93,249 159,244 القيمة الدفترية
29-2استثمار في شركة زميلة
حصة المجموعة في موجودات ومطلوبات الشركة الزميلة المدرجة في البيانات المالية الموحدة على النحو التالي:
2013 ألف درهم
2014ألف درهم
- - في 1 يناير
- 53,308المصنف من الموجودات المالية
المتوفرة للبيع )إيضاح 11(
- 53,766 استثمار خالل السنة
- (1,506)حصة في خسارة استثمار في شركة
زميلة
- 105,568 في 31 ديسمبر
رفعت المجموعة خالل السنة حصتها في االستثمار في شركة لمار لالستثمار والتطوير العقاري ذ.م.م من ٪10 إلى ٪20 مما أدى إلى تصنيف االستثمار
من موجودات مالية متوفرة للبيع إلى استثمار في شركة زميلة ضمن البيانات المالية الموحدة.
الشركة الزميلة المبينة أدناه لها رأس مال يتكون فقط من أسهم عادية، وهي مملوكة مباشرة للمجموعة. كما أن بلد التأسيس / التسجيل تعد كذلك مقر
عملها الرئيسي.
طبيعة االستثمار في الشركة الزميلة
طريقة القياس
طبيعةالعالقة
نسبة الملكية
)٪(
بلد التأسيس اسم الشركة
حقوق الملكية إيضاح 1 20٪
المملكة العربية
السعودية
لمار لالستثمار والتطوير
العقاري ذ.م.م
إيضاح 1: يتمثل النشاط الرئيسي لشركة لمار في االستثمار والتطوير العقاري.
شركة لمار لالستثمار والتطوير العقاري ذ.م.م هي شركة خاصة وال يتوفر لحصصها أي سعر مدرج في السوق.
ال توجد مطلوبات محتملة متعلقة بحصة المجموعة في الشركات الزميلة.
المعلومات المالية الموجزة للشركة الزميلةفيما يلي المعلومات المالية الموجزة لشركة لمار لالستثمار والتطوير العقاري
ذ.م.م المحتسبة باستخدام طريقة حقوق الملكية.
الميزانية العمومية الموجزة كما في 31 ديسمبر 2014
ألف درهم
موجودات متداولة
79,315 نقد وما في حكمه
335 مبالغ مدفوعة مقدما و ذمم مدينة أخرى
79,650 مجموع الموجودات المتداولة
مطلوبات متداولة
17,337 ذمم دائنة تجارية وأخرى
2,931 زكاة مستحقة الدفع
20,268 مجموع المطلوبات المتداولة
موجودات غير متداولة
1,290,427 استثمارات عقارية
178,781 دفعات مقدمة إلى المقاولين
80,005 تكاليف مؤجلة
75 ممتلكات ومعدات
1,549,288 مجموع الموجودات غير المتداولة
مطلوبات غير متداولة
609,706 دفعات مقدمة من العمالء
470,890 مبالغ مستحقة إلى الشركاء
234 مكافآت نهاية الخدمة
1,080,830 مجموع المطلوبات غير المتداولة
527,840 صافي الموجودات
بيان الدخل الشامل الموجز للسنة المنتهية في 31 ديسمبر 2014
(4,795) مصاريف عمومية وإدارية
81 إيرادات أخرى
(4,714) صافي الخسارة قبل الزكاة
(2,833) الزكاة
(7,547) مجموع الخسارة الشاملة للفترة

047 Annual Report
إيضاحات حول البيانات المالية الموحدةللسنة المنتهية في 31 ديسمبر 2014
مطابقة المعلومات المالية الموجزةالمطابقة بين المعلومات المالية الموجزة والقيمة الدفترية لحصة المجموعة
في الشركة الزميلة.
2014 ألف درهم
535,387 الرصيد االفتتاحي لصافي الموجودات في 1 يناير
(7,547) خسارة السنة
527,840 صافي الموجودات في 31 ديسمبر
105,568 حصة ٪20 من المشروع المشترك
105,568 القيمة الدفترية
30ربح السهم
األساسييحتسب الربح األساسي لكل سهم بقسمة الربح العائد إلى حملة أسهم الشركة
على المتوسط المرجح لعدد األسهم العادية المصدرة خالل السنة باستثناء األسهم العادية المشتراة والمحتفظ بها كأسهم خزينة.
السنة المنتهية في
31 ديسمبر 2013
31 ديسمبر 2014
األرباح )ألف درهم(
166,469 100,708
األرباح ألغراض احتساب الربح األساسي لكل سهم باعتباره
الربح العائد لمالك الشركة األم
عدد األسهم
2,295,432,420 2,285,046,667المتوسط المرجح لعدد
األسهم العادية ألغراض احتساب الربح األساسي
0.073 0.044العائد األساسي للسهم
الواحد )بالدرهم(
المخفضلم تقم الشركة بإصدار أي أدوات يمكن أن يكون لها تأثير مخفض على ربح
السهم عند الممارسة.
31ضمانات
2013 ألف درهم
2014ألف درهم
1,004,345 1,438,543 ضمانات حسن األداء
1,266,331 1,503,315 خطابات ضمان
2,270,676 2,941,858
إن مختلف الضمانات المصرفية المذكورة أعاله تم إصدارها من قبل المصارف التي تتعامل معها المجموعة في سياق العمل االعتيادي. يرى أعضاء مجلس
اإلدارة أن هذه الضمانات لن ينتج عنها على األرجح أي التزامات على المجموعة.
32التزامات نفقات
)أ( التزامات إيجار تشغيلي لدى المجموعة العديد من اتفاقيات اإليجار التشغيلي. إن الحد األدنى لدفعات
اإليجار المستقبلية مستحقة الدفع بموجب عقود اإليجار التشغيلي هو على النحو التالي:
2013 ألف درهم
2014ألف درهم
الحد األدنى لدفعات اإليجار المستقبلية:
10,457 15,976 سنة واحدة فأقل
26,551 أكثر من سنة حتى خمس سنوات 24,103
1,742 أكثر من خمس سنوات 1,753
38,750 41,832
)ب( التزامات أخرى
687,121 1,115,223خطابات اعتماد لشراء مواد
ومعدات تشغيل
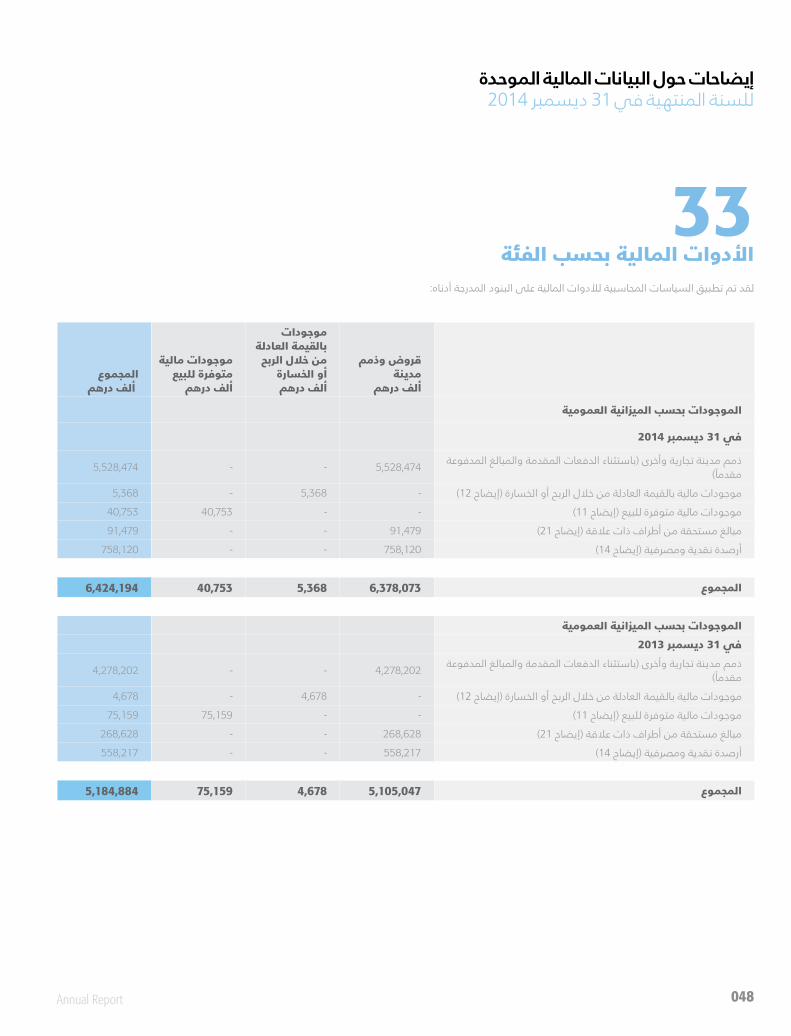
048Annual Report
إيضاحات حول البيانات المالية الموحدةللسنة المنتهية في 31 ديسمبر 2014
33األدوات المالية بحسب الفئة
لقد تم تطبيق السياسات المحاسبية لألدوات المالية على البنود المدرجة أدناه:
المجموع ألف درهم
موجودات مالية متوفرة للبيع
ألف درهم
موجودات بالقيمة العادلة من خالل الربح
أو الخسارةألف درهم
قروض وذمم مدينة
ألف درهم
الموجودات بحسب الميزانية العمومية
في 31 ديسمبر 2014
5,528,474 - - 5,528,474ذمم مدينة تجارية وأخرى )باستثناء الدفعات المقدمة والمبالغ المدفوعة
مقدما(
5,368 - 5,368 - موجودات مالية بالقيمة العادلة من خالل الربح أو الخسارة )إيضاح 12(
40,753 40,753 - - موجودات مالية متوفرة للبيع )إيضاح 11(
91,479 - - 91,479 مبالغ مستحقة من أطراف ذات عالقة )إيضاح 21(
758,120 - - 758,120 أرصدة نقدية ومصرفية )إيضاح 14(
6,424,194 40,753 5,368 6,378,073 المجموع
الموجودات بحسب الميزانية العمومية
في 31 ديسمبر 2013
4,278,202 - - 4,278,202ذمم مدينة تجارية وأخرى )باستثناء الدفعات المقدمة والمبالغ المدفوعة
مقدما(
4,678 - 4,678 - موجودات مالية بالقيمة العادلة من خالل الربح أو الخسارة )إيضاح 12(
75,159 75,159 - - موجودات مالية متوفرة للبيع )إيضاح 11(
268,628 - - 268,628 مبالغ مستحقة من أطراف ذات عالقة )إيضاح 21(
558,217 - - 558,217 أرصدة نقدية ومصرفية )إيضاح 14(
5,184,884 75,159 4,678 5,105,047 المجموع

049 Annual Report
إيضاحات حول البيانات المالية الموحدةللسنة المنتهية في 31 ديسمبر 2014
34 المعلومات المالية الموجزة عن
الشركة التابعة ذات الحصص غير المسيطرة الجوهرية
مبين أدناه المعلومات المالية الموجزة للشركة التابعة التي تمتلك حصصا غير مسيطرة جوهرية للمجموعة.
الميزانية العمومية الموجزة
دريك اند سكل انترناشيونال السعودية
2013 ألف درهم
2014ألف درهم
متداولة
1,025,619 1,263,182 موجودات
850,645 1,081,820 مطلوبات
174,974 181,362مجموع صافي الموجودات
المتداولة
غير متداولة
47,440 68,230 موجودات
19,706 28,989 مطلوبات
27,734 39,241مجموع صافي الموجودات غير
المتداولة
202,708 220,603 صافي الموجودات
2013 ألف درهم
2014ألف درهم
1,065,273 979,185 إيرادات
57,531 16,173 صافي الربح
التدفقات النقدية الموجزة
2014 ألف درهم
التدفقات النقدية من أنشطة العمليات
30,279 النقد الناتج من العمليات
(103) فوائد مدفوعة
30,176 صافي النقد الناتج من أنشطة العمليات
(6,888) صافي النقد المستخدم في أنشطة االستثمار
(90,314) صافي النقد المستخدم في أنشطة التمويل
(67,026) صافي النقص في النقد وما في حكمه
7,480 النقد وما في حكمه في بداية السنة
1,722 أرباح صرف العمالت من النقد وما في حكمه
(57,824) النقد وما في حكمه في نهاية السنة
المعلومات الواردة أعاله مبينة قبل المحذوفات بين الشركات.
ألف درهم مطلوبات مالية أخرى بالتكلفة المطفأة
في 31 ديسمبر 2014
2,210,683 قروض مصرفية )إيضاح 18(
128,350مبالغ مستحقة ألطراف ذات عالقة )إيضاح
)21
2,013,146ذمم دائنة تجارية ومستحقات باستثناء
الدفعات المقدمة من العمالء )إيضاح 19(
4,352,179 المجموع
31 ديسمبر 2013
1,116,470 قروض مصرفية )إيضاح 18(
19,445مبالغ مستحقة ألطراف ذات عالقة )إيضاح
)21
2,139,722ذمم دائنة تجارية ومستحقات باستثناء
الدفعات المقدمة من العمالء )إيضاح 19(
3,275,637 المجموع
