© copyright 2014 marc j. dupuis
TRANSCRIPT

© Copyright 2014
Marc J. Dupuis

The Role of Trait Affect in the Information Security Behavior of Home Users
Marc J. Dupuis
A dissertation
submitted in partial fulfillment of the
requirements for the degree of
Doctor of Philosophy
University of Washington
2014
Reading Committee:
Barbara E. Endicott, Chair
Hazel A. Taylor, Chair
Robert M. Mason
Crystal C. Hall
Program Authorized to Offer Degree:
Information Science

University of Washington
Graduate School
This is to certify that I have examined this copy of a doctoral dissertation by
Marc J. Dupuis
and have found that it is complete and satisfactory in all respects,
and that any and all revisions required by the final
examining committee have been made.
Chairs of the Supervisory Committee:
_______________________________________ Barbara Endicott-Popovsky, PhD
_______________________________________ Hazel Taylor, PhD
Reading Committee:
________________________________________ Robert Crossler, PhD
_______________________________________ Crystal Hall, PhD
_______________________________________ Robert Mason, PhD
Date: ______________________________

University of Washington
Abstract
The Role of Trait Affect in the Information Security Behavior of Home Users
Marc J. Dupuis
Chairs of the Supervisory Committee:
Research Associate Professor Barbara Endicott-Popovsky
Associate Professor Hazel Taylor
The Information School
Computers provide people with the means to perform a wide range of tasks, from
running complex applications to storing photographs. The Internet adds an additional
dimension; it enables people to shop for gifts, pay bills, perform research, read the news, and
communicate with old friends and new. In addition to all of the benefits computers provide to
people, there are inherent risks. These risks exist in many different forms, including malware,
phishing scams, loss of data, and the privacy of individuals being compromised.
Home users represent the largest segment of Internet users and pose the most
significant threat. However, research has traditionally focused on users within an organizational

setting. While research examining home users has increased significantly over the last several
years, there is still a lot that we do not know.
This research examined the role trait affect, a lifelong and generally stable type of
affect, has on the information security behavior of home users in response to three threats:
computer performance compromise, personal information compromise, and loss of data and
files. In this study, the role of trait affect in the information security behavior of home users
was examined by using the two higher order dimensions of affect, positive affect and negative
affect, which represent the valence of mood descriptors (e.g., afraid, scared, nervous, guilty,
active, alert, enthusiastic, excited). It was hypothesized that the effect trait positive affect and
trait negative affect have on the information security behavior of home users is indirect
through their effect on threat perception (i.e., perceived threat severity and perceived threat
vulnerability) and self-efficacy. Likewise, it was hypothesized that higher levels of trait positive
affect are associated with lower levels of threat perception and higher levels of self-efficacy,
with trait negative affect having the opposite effect.
Three surveys were used to explore these issues, including a previously validated survey
instrument for trait positive affect and trait negative affect, previously validated constructs
adapted from other research, and measures for the dependent variables developed through
use of the Delphi technique.
The results of the three surveys supported 10 of the 33 hypotheses. Out of the nine
hypotheses for trait positive affect, three were supported. This included an association
between higher levels of trait positive affect with higher levels of information security response

self-efficacy in two of the three studies. In one of the surveys, higher levels of trait positive
affect was also associated with lower levels of perceived threat vulnerability. In contrast, none
of the nine hypotheses for trait negative affect were supported. Beyond the 18 hypotheses for
trait affect, the hypothesized relationship between self-efficacy and information security
behavior was supported in all three surveys. Five additional hypotheses based on Protection
Motivation Theory (PMT) were also supported.
This research makes five primary contributions. First, trait positive affect may play an
indirect role in understanding how individuals respond to and cope with a threat. Furthermore,
it suggests that trait positive affect is worth exploring further, perhaps with greater granularity
than what was done here. Second, this research extended the application of Protection
Motivation Theory (PMT), which has been the primary underlying theory used by researchers in
understanding the information security behavior of home users. In part, this was done by
including constructs from PMT and measurements of trait affect to form a more complete
understanding of the information security behavior of home users. Third, in addition to
extending PMT, this research examined three different threats using the same methods and
data analysis procedures. I did this by conducting three different surveys at the same time—
one for each of the three threats. This allowed me to determine if the efficacy of PMT
depended at least in part on the threat under examination. The data analysis suggests that the
specific threat that is examined using PMT does impact the efficacy of PMT as a theoretical
framework for understanding human behavior. Fourth, an additional contribution this research
makes is its support for the continued role of self-efficacy as a predictor of behavior. In fact, the
positive association between self-efficacy and behavior was the one general hypothesis that

was supported in all three surveys. Fifth, this dissertation contributes to research on the
information security behavior of home users by having developed and validated three survey
instruments. These three survey instruments were designed to measure specific information
security responses required to mitigate one of three different threats: computer performance
compromise, personal information compromise, and loss of data and files.
Finally, I explored future research avenues in light of these results, including
experimental research, as well as exploring trait positive affect with a higher level of granularity
than what was done here. Implications for theory, policy, and practice are discussed.

i
Table of Contents
Abstract ............................................................................................................................................ii
List of tables ................................................................................................................................... vii
List of figures .................................................................................................................................... x
Abbreviations .................................................................................................................................. xi
Dedication ..................................................................................................................................... xiii
Nicole Dupuis ............................................................................................................................ xiii
Astoria Dupuis ........................................................................................................................... xiii
Teri Dupuis-Tilden ..................................................................................................................... xiii
Beverly Bryan ............................................................................................................................ xiii
Acknowledgments......................................................................................................................... xiv
Chapter 1: Introduction .................................................................................................................. 1
Background to the Research ....................................................................................................... 1
Propositions, Research Issues, and Research Problem ............................................................... 5
Contributions ............................................................................................................................... 8
Trait Affect ............................................................................................................................... 9
PMT Extended .......................................................................................................................... 9
Efficacy of PMT Constructs may be Threat-Dependent ........................................................ 10
Self-Efficacy ............................................................................................................................ 10
Development and Validation of Three New Survey Instruments ......................................... 11
Justification for the Research .................................................................................................... 11
The Home User Problem ....................................................................................................... 14
Methodology ............................................................................................................................. 16

ii
Survey with Quantitative Analysis ......................................................................................... 16
Delimitations of Scope and Key Assumptions, and their Justifications .................................... 16
Causation ............................................................................................................................... 16
Population.............................................................................................................................. 17
Behavioral Intention and Self-Reports of Behavior ............................................................... 17
Other Possible Constructs ..................................................................................................... 19
Definitions ................................................................................................................................. 20
Conclusion and Outline of the Report ....................................................................................... 23
Chapter 2: Research issues ........................................................................................................... 25
Introduction............................................................................................................................... 25
Parent Theories and Classification Models ............................................................................... 26
Protection Motivation Theory ............................................................................................... 27
Self-Efficacy ............................................................................................................................ 36
Affect ..................................................................................................................................... 41
Research Model ......................................................................................................................... 53
Information Security Behavior .............................................................................................. 55
Determinants of Information Security Behavior ................................................................... 56
Affect as an Antecedent to Risk Perceptions ........................................................................ 61
Affect as an Antecedent to Self-Efficacy ............................................................................... 64
Conclusion ................................................................................................................................. 67
Chapter 3: Methodology ............................................................................................................... 69
Introduction............................................................................................................................... 69
Justification for the paradigm and methodology ...................................................................... 71
Research procedures ................................................................................................................. 75

iii
Data Analysis Procedures .......................................................................................................... 80
Construct Types ..................................................................................................................... 80
Statistical Analyses ................................................................................................................ 84
Ethical considerations ............................................................................................................... 86
Conclusion ................................................................................................................................. 87
Chapter 4: Survey Instrument Development ................................................................................ 88
Introduction............................................................................................................................... 88
Construct Domain Specification ................................................................................................ 89
Samples of Items Generation .................................................................................................... 92
Literature Search ................................................................................................................... 92
Subject Matter Expert Panel Review via the Delphi Technique ............................................ 94
Pretest, Part 1: Initial Technical Review ................................................................................ 97
Pretest, Part 2: Potential Participant Review via Cognitive Interviews................................. 98
Pretest, Part 3: Final Technical Review ................................................................................. 99
Data Collection – Part 1: Pilot Study ......................................................................................... 99
Measure Purification ............................................................................................................... 100
Data Collection – Part 2: Main Study ...................................................................................... 102
Statistical Assessment and Analysis of Instruments ............................................................... 103
Computer Performance Compromise ................................................................................. 106
Personal Information Compromise ..................................................................................... 107
Loss of Data and Files .......................................................................................................... 112
Conclusion ............................................................................................................................... 115
Chapter 5: Analysis of data ......................................................................................................... 116
Introduction............................................................................................................................. 116

iv
Participants .............................................................................................................................. 117
General Data Analysis Discussion ............................................................................................ 120
Reliability ............................................................................................................................. 120
Validity ................................................................................................................................. 121
Common Method Bias ......................................................................................................... 122
Mediation ............................................................................................................................ 123
Moderation .......................................................................................................................... 124
Patterns of Data for Each Research Issue or Hypothesis ........................................................ 125
Computer Performance Compromise ................................................................................. 126
Personal Information Compromise ..................................................................................... 130
Loss of Data and Files .......................................................................................................... 135
Conclusions about Each Research Issue or Proposition .......................................................... 139
Conclusion ............................................................................................................................... 145
Chapter 6: Conclusions and Implications .................................................................................... 147
Introduction............................................................................................................................. 147
Conclusions about the Research Problem and Hypotheses ................................................... 148
Computer Performance Compromise ................................................................................. 150
Personal Information Compromise ..................................................................................... 155
Loss of Data and Files .......................................................................................................... 157
Other Observations ............................................................................................................. 158
Implications for Theory ........................................................................................................... 159
Protection Motivation Theory ............................................................................................. 159
Trait Affect ........................................................................................................................... 162
Implications for Policy and Practice ........................................................................................ 164

v
Private Sector ...................................................................................................................... 164
Public Sector Policy .............................................................................................................. 166
Limitations ............................................................................................................................... 167
Common Method Bias ......................................................................................................... 168
Social Desirability Bias ......................................................................................................... 168
Survey Length ...................................................................................................................... 169
Sample Source and Composition ......................................................................................... 170
Other Constructs ................................................................................................................. 171
Surveys and Causation ......................................................................................................... 171
Further Research ..................................................................................................................... 172
Incorporating Trait Affect into Other Validated Instruments ............................................. 172
Other Types of Affect .......................................................................................................... 172
Dimensions of Personality ................................................................................................... 173
Experiments ......................................................................................................................... 173
Conclusion ............................................................................................................................... 174
Bibliography ................................................................................................................................ 176
Appendix A – Computer Performance Compromise, Final Instrument ...................................... 206
Appendix B – Personal Information Compromise, Final Instrument .......................................... 208
Appendix C – Loss of Data and Files, Final Instrument ............................................................... 211
Appendix D – Consent Form for Surveys .................................................................................... 213
Appendix E – Final Survey Instrument for Computer Performance Compromise ..................... 214
Appendix F – Final Survey Instrument for Personal Information Compromise ......................... 223
Appendix G – Final Survey Instrument for Loss of Data and Files .............................................. 239
Appendix H – Statistical Test Results for Moderation ................................................................ 250

vi
Appendix I - Multiplicative Interaction Results for Direct Effect Constructs .............................. 251
Appendix J – Data for AVE of the Constructs Greater than the Square Test for Discriminant
Validity: Computer Performance Compromise .......................................................................... 252
Appendix K – Data for Cross-Loading Test for Discriminant Validity: Computer Performance
Compromise ................................................................................................................................ 253
Appendix L – Data for AVE of the Constructs Greater than the Square Test for Discriminant
Validity: Personal Information Compromise .............................................................................. 257
Appendix M – Data for Cross-Loading Test for Discriminant Validity: Personal Information
Compromise ................................................................................................................................ 261
Appendix N – Data for AVE of the Constructs Greater than the Square Test for Discriminant
Validity: Loss of Data and Files.................................................................................................... 271
Appendix O – Data for Cross-Loading Test for Discriminant Validity: Loss of Data and Files .... 274
CURRICULUM VITAE .................................................................................................................... 282
Education ................................................................................................................................. 282
Relevant Experience ................................................................................................................ 283
Other Experience ..................................................................................................................... 285
Research Activities and Professional Engagements ................................................................ 285
Certifications ........................................................................................................................... 288
Professional Affiliations and Activities .................................................................................... 288

vii
List of tables
Table 1: Trait Affect and its Association with Personality Traits and Observable Physical and
Physiological Signs ........................................................................................................................ 50
Table 2: Survey-Based Research Examining the Information Security Behavior of Home Users . 75
Table 3: Construct-Indicator Framework ...................................................................................... 83
Table 4: Results of Literature Search ............................................................................................ 93
Table 5: Threat-Response Pairs .................................................................................................... 97
Table 6: Pilot Study Completion Statistics .................................................................................. 100
Table 7: Threat-Response Pairs Revised ..................................................................................... 101
Table 8: Main Study Completion Statistics ................................................................................. 103
Table 9: Varimax Rotated Principal Component Matrix for Computer Performance Compromise
..................................................................................................................................................... 106
Table 10: PLS Analysis for Computer Performance Compromise ............................................... 107
Table 11: Varimax Rotated Principal Component Matrix for Personal Information Compromise
..................................................................................................................................................... 108
Table 12: Varimax Rotated Principal Component Matrix for Personal Information Compromise,
Revised ........................................................................................................................................ 110
Table 13: PLS Analysis for Personal Information Compromise ................................................... 111
Table 14: Varimax Rotated Principal Component Matrix for Loss of Data and Files ................. 112
Table 15: Varimax Rotated Principal Component Matrix for Loss of Data and Files, Revised ... 113
Table 16: PLS Analysis for Loss of Data and Files ........................................................................ 114
Table 17: Pilot Study Completion Statistics ................................................................................ 117
Table 18: Main Study Completion Statistics ............................................................................... 117
Table 19: Main Study Demographics .......................................................................................... 119
Table 20: Reliability & Validity Assessment for Reflective Constructs and Dimensions of
Computer Performance Compromise ......................................................................................... 126
Table 21: Hypotheses Related to Computer Performance Compromise ................................... 129

viii
Table 22: Reliability & Validity Assessment for Reflective Constructs and Dimensions of Personal
Information Compromise ........................................................................................................... 131
Table 23: Hypotheses Related to Personal Information Compromise ....................................... 134
Table 24: Reliability & Validity Assessment for Reflective Constructs and Dimensions of Loss of
Data and Files .............................................................................................................................. 135
Table 25: Hypotheses Related to Loss of Data and Files ............................................................ 138
Table 26: Hypotheses Results with Statistics .............................................................................. 144
Table 27: Ownership of Computing Devices by Survey Participants .......................................... 153
Table 28: Statistical Analysis for Moderation for Computer Performance Compromise ........... 250
Table 29: Statistical Analysis for Moderation for Personal Information Compromise............... 250
Table 30: Statistical Analysis for Moderation for Loss of Data and Files .................................... 250
Table 31: Multiplicative Interaction Results for Direct Effect Constructs .................................. 251
Table 32: AVE of the Constructs Greater than the Square Test for Computer Performance
Compromise, Part 1 of 2 ............................................................................................................. 252
Table 33: AVE of the Constructs Greater than the Square Test for Computer Performance
Compromise, Part 2 of 2 ............................................................................................................. 252
Table 34: Cross-Loading Results for Computer Performance Compromise, Part 1 of 4 ............ 253
Table 35: Cross-Loading Results for Computer Performance Compromise, Part 2 of 4 ............ 254
Table 36: Cross-Loading Results for Computer Performance Compromise, Part 3 of 4 ............ 255
Table 37: Cross-Loading Results for Computer Performance Compromise, Part 4 of 4 ............ 256
Table 38: AVE of the Constructs Greater than the Square Test for Personal Information
Compromise, Part 1 of 4 ............................................................................................................. 257
Table 39: AVE of the Constructs Greater than the Square Test for Personal Information
Compromise, Part 2 of 4 ............................................................................................................. 258
Table 40: AVE of the Constructs Greater than the Square Test for Personal Information
Compromise, Part 3 of 4 ............................................................................................................. 259
Table 41: AVE of the Constructs Greater than the Square Test for Personal Information
Compromise, Part 4 of 4 ............................................................................................................. 260
Table 42: Cross-Loading Results for Personal Information Compromise, Part 1 of 12 .............. 261

ix
Table 43: Cross-Loading Results for Personal Information Compromise, Part 2 of 12 .............. 262
Table 44: Cross-Loading Results for Personal Information Compromise, Part 3 of 12 .............. 263
Table 45: Cross-Loading Results for Personal Information Compromise, Part 4 of 12 .............. 264
Table 46: Cross-Loading Results for Personal Information Compromise, Part 5 of 12 .............. 265
Table 47: Cross-Loading Results for Personal Information Compromise, Part 6 of 12 .............. 266
Table 48: Cross-Loading Results for Personal Information Compromise, Part 7 of 12 .............. 267
Table 49: Cross-Loading Results for Personal Information Compromise, Part 8 of 12 .............. 268
Table 50: Cross-Loading Results for Personal Information Compromise, Part 9 of 12 .............. 269
Table 51: Cross-Loading Results for Personal Information Compromise, Part 10 of 12 ............ 269
Table 52: Cross-Loading Results for Personal Information Compromise, Part 11 of 12 ............ 270
Table 53: Cross-Loading Results for Personal Information Compromise, Part 12 of 12 ............ 270
Table 54: AVE of the Constructs Greater than the Square Test for Loss of Data and Files, Part 1
of 4 .............................................................................................................................................. 271
Table 55: AVE of the Constructs Greater than the Square Test for Loss of Data and Files, Part 2
of 4 .............................................................................................................................................. 272
Table 56: AVE of the Constructs Greater than the Square Test for Loss of Data and Files, Part 3
of 4 .............................................................................................................................................. 272
Table 57: AVE of the Constructs Greater than the Square Test for Loss of Data and Files, Part 4
of 4 .............................................................................................................................................. 273
Table 58: Cross-Loading Results for Loss of Data and Files, Part 1 of 8 ..................................... 274
Table 59: Cross-Loading Results for Loss of Data and Files, Part 2 of 8 ..................................... 275
Table 60: Cross-Loading Results for Loss of Data and Files, Part 3 of 8 ..................................... 276
Table 61: Cross-Loading Results for Loss of Data and Files, Part 4 of 8 ..................................... 277
Table 62: Cross-Loading Results for Loss of Data and Files, Part 5 of 8 ..................................... 278
Table 63: Cross-Loading Results for Loss of Data and Files, Part 6 of 8 ..................................... 279
Table 64: Cross-Loading Results for Loss of Data and Files, Part 7 of 8 ..................................... 280
Table 65: Cross-Loading Results for Loss of Data and Files, Part 8 of 8 ..................................... 281

x
List of figures
Figure 1: The Three Information Security Threats and their Relation to the CIA Triad of
Information Security ....................................................................................................................... 4
Figure 2: Affect, Its Dimensions, and Associated Descriptors ........................................................ 7
Figure 3: Protection Motivation Theory Schema .......................................................................... 29
Figure 4: Difference between Self-Efficacy and Outcome Expectations ...................................... 37
Figure 5: Research Model – Trait Positive and Negative Affect and Information Security Behavior
....................................................................................................................................................... 66
Figure 6: Research Model – Trait Positive and Negative Affect and Information Security Behavior
....................................................................................................................................................... 79
Figure 7: Research Results – Computer Performance Compromise .......................................... 128
Figure 8: Research Results – Personal Information Compromise .............................................. 133
Figure 9: Research Results – Loss of Data and Files ................................................................... 137

xi
Abbreviations
AVE: Average Variance Extracted
CPC: Computer Performance Compromise
CIA: Confidentiality, Integrity, and Availability
IS: Information Systems
LDF: Loss of Data and Files
PIC: Personal Information Compromise
PLS: Partial Least Squares
PMT: Protection Motivation Theory
RC: (Perceived) Response Costs
RE: (Perceived) Response Efficacy
SCT: Social Cognitive Theory
SE: Self-efficacy
SEM: Structural Equation Modeling
SPSS: Statistical Package for the Social Sciences
t-statistic: Test Statistic (aka, Student’s t-test)
TPA: Trait Positive Affect
TPB: Theory of Planned Behavior
TNA: Trait Negative Affect

xii
TRA: Theory of Reasoned Action
TS: (Perceived) Threat Severity
TV: (Perceived) Threat Vulnerability
VIF: Variance Inflation Factor

xiii
Dedication
This dissertation is dedicated to the following people…
Nicole Dupuis
My beautiful and loving wife has supported me throughout this entire process. Her
patience, love, kindness, and support have meant the world to me and have truly kept me going
from the first page to the last.
Astoria Dupuis
During these past eight months my baby daughter has brought so much joy to my life.
Her smiles, laughter, and giggles remind me that no matter how difficult things may become at
times, there is always room for love, laughter, and patience.
Teri Dupuis-Tilden
My mother is the hardest working person I have ever known and sacrificed so much for
us growing up. She has always been one of the biggest inspirations in my life with her love,
compassion, and big heart. She would do anything for her four boys and it shows every day.
Beverly Bryan
My grandma was the most kind, caring, loving, and giving person I have ever known. I
am so thankful every single day that I had the opportunity to have known and been loved by
such an amazing woman.

xiv
Acknowledgments
Several years ago I began my PhD studies thinking I knew what I was getting myself into,
but really having no idea. While the result of this dissertation is that of a single author
presenting his original research, there were many people that have contributed to this
endeavor and without whom this research would not have been possible.
I would like to acknowledge my wife Nicole. She has been understanding, patient, loving
and supportive throughout this journey. I am so incredibly proud to have her as my wife and
the mother of our beautiful child, Astoria.
I would like to acknowledge my daughter Astoria. Her birth gave me all the motivation
in the world to finish this research so that I may begin the next chapter of my life.
I would like to acknowledge the chairs of my committee, Drs. Barbara Endicott-Popovsky
and Hazel Taylor. Barbara has been supportive and offered encouragement throughout the
process. Her expertise in information security has been invaluable. Likewise, Hazel has been
beyond helpful in her attention to detail and high quality standards, which have helped make
my dissertation much better. She helped me understand and appreciate the importance of
managing the progression of the dissertation. Together, they were a perfect team to help guide
the entire process. They each had their husband offer assistance as well, which I found very
helpful.

xv
I would like to acknowledge Dr. Rob Crossler. His expertise on methods and data
analysis is much appreciated. Likewise, his patience in answering my numerous questions
cannot be overstated. Finally, his experience with research on the home user problem has been
helpful throughout.
I would like to acknowledge Dr. Bob Mason. His support, guidance, mentorship, and
expertise have contributed greatly to the success of my dissertation. Furthermore, I greatly
appreciate his advice to always remember what is important—family.
I would like to acknowledge the graduate school representative (GSR), Dr. Crystal Hall.
Her time, energy, and encouragement have been much appreciated. Additionally, her expertise
in the decision making sciences has been particularly helpful.
I would like to acknowledge my family, including my mom Teri and her husband Bill; my
dad DeLoy and his wife Shelley; my brother Joel, his wife Heather, and their two daughters
Olive and Paisley; my brother Ken, his wife Michelle, and their daughter Emily; my brother
Ryan; my stepsister Heather; my aunt Peni and cousin Jimmy; my mother-in-law Joann and
sister-in-law Kelly, and my father-in-law Doug and his wife Rose and his daughter Kaitlyn. Their
support and belief in me over these past several years has meant so much to me. As proud as
they may be of me for completing this research, I am a thousand times as proud to have them
as my family.
I would like to acknowledge a few members of my family that are no longer with me,
but have nonetheless helped shape the person I am today. This was done by being good role
models in general and examples of what true love is in particular. Thank you Uncle Gene,

xvi
Grandma Bryan, Great-Grandma Chapman, and Great-Grandpa Chapman. If I become even half
the person that any of you were, then I will know that I have contributed to making the world
better for my generation and all future generations.
I would like to acknowledge my friend and editor Jessica Walser. I appreciate the
suggestions you made as I progressed through this dissertation. Thank you.
I would like to acknowledge my friends and former colleagues of the DDS, including
Randy, Joe, Leslie, Mary, Dr. Haney, Dr. Peterson, Dr. Reade, and Dr. Fisher, among others.
Their support and flexibility with my schedule while I worked there was a tremendous help, as
was their frequent words of encouragement. Thank you so much.
Finally, I would like to acknowledge some of my dearest friends, including Melissa,
Wilson, Carmen, Becca, Shane, Elke, Diana, Susan, Meggen, Shannon, Tracy, and Biz. Your
friendship and support have meant so much to me over the years, including throughout the
duration of this latest adventure.

1
Chapter 1: Introduction
Background to the Research
Computers provide people with the means to perform a wide range of tasks, from
running complex applications to storing photographs. The Internet adds an additional
dimension; it enables people to shop for gifts, pay bills, perform research, read the news, and
communicate with old friends and new. In addition to all of the benefits computers provide to
people, there are inherent risks. These risks exist in many different forms, but perhaps most
notably as malware (i.e., malicious software).
Malware is a type of software that is inserted into a computer with the purpose of
causing harm to it or other computers (Garuba, Liu, & Washington, 2008, p. 628). It consists of
viruses, worms, botnets, Trojan horses, spyware, etc., and may exist in some form on 25
percent of all home computers (Creeger, 2010, p. 43). Infected computers can be used as part
of a botnet to serve malicious goals (e.g., password sniffing, spam proxy, click-fraud
perpetuation) (“Malware Threat Rises Despite Drop in Direct Cost Damages.,” 2007, p. 19). A
computer can be infected through opening a malicious email attachment, visiting an infected
website (i.e., drive-by-download), installing infected software, or through other propagation
methods (Narvaez, Endicott-Popovsky, Seifert, Aval, & Frincke, 2010).
At the cybercriminal’s whim, he can activate the botnets under his control to perform
targeted attacks against organizations, institutions, networks (e.g., Department of Defense),
and the Internet itself. Fifteen percent or more of all online computers worldwide are part of

2
these botnets (Young, 2008). Given the number of Internet users (79 percent of all U.S. citizens
and over 1.3 billion worldwide), this is particularly troublesome (Anderson & Agarwal, 2010, p.
2; A. Smith, 2010, p. 10).
In an organizational setting, compliance with security policies is mandatory.
Organizations have paid a considerable amount of time, money, and attention to information
security with positive outcomes. This includes investment in security education, training, and
awareness programs (Crossler & Bélanger, 2009; Deloitte, 2007). A significant body of research
exists on understanding the security behavior of individuals in an organizational setting (e.g.,
Herath & Rao, 2009; Workman, Bommer, & Straub, 2008), but the same cannot be said for
home users.
Home users are not a homogeneous group and most do not have any organized means
of receiving security education, training, or awareness. Policies do not exist for home users, nor
are they required to engage in safe security behavior. Furthermore, little is known about what
effective security education, training, and awareness would consist of for the home user. Until
more concrete information is known about the characteristics associated with their behavior, it
will be difficult and likely futile to spend significant resources on information security
education, training, and awareness programs for home users.
An increasing number of studies have been done in recent years examining the factors
that influence the behavior of home users. While the short history of research in this area has
become increasingly rich, it is still in its infancy and much is still unknown. Some studies that
have been done have only been descriptive in nature without any theoretical underpinning

3
(e.g., Furnell et al., 2007). These studies are useful in understanding “what”, but have less value
in understanding “why.” Those that have been grounded in theory have provided some
important insight, but have also had inconsistent results (Anderson & Agarwal, 2010; Crossler &
Bélanger, 2010; Crossler, 2010; LaRose, Rifon, & Enbody, 2008; Y. Lee & Kozar, 2005; Liang &
Xue, 2010; Woon, Tan, & Low, 2005). For example, Woon et al. (2005) found a positive
correlation between perceived threat severity and a particular information security response:
enabling security features on a home wireless network. This response is designed to protect an
individual from the dangers associated with unprotected wireless access. In contrast, Crossler
(2010) found a negative relationship for perceived security threat and perceived security
vulnerability with performing the responses necessary to mitigate a different information
security threat: losing one’s data and files.
This lack of consistency in the research may indicate that the factors that contribute to
responding to an information security threat may depend on the specific information security
threat one is performing responses to mitigate. Backing up data is not the same as preventing
the performance of a computer from being compromised or having one’s personal information
compromised. Thus, in the current research three different types of information security
threats are explored, which helps determine whether different attitudes and behaviors related
to a threat response are in part a result of the specific behavior being performed. These three
threats are: computer performance compromise, personal information compromise, and loss of
data and files. In organizational information assurance, the goal is generally to protect the
confidentiality, integrity, and availability of information (Bishop, 2003, 2005; Gibson, 2011;
Harris, 2013; R. Johnson, 2011). This is often referred to as the CIA triad. Each of the three

4
threats that are explored in this research pose a risk to different components of the CIA triad,
as illustrated in Figure 1.
Confidentiality
Integrity Availability
Loss of Data and Files
Computer Performance Compromise
Personal Information Compromise
Figure 1: The Three Information Security Threats and their Relation to the CIA Triad of Information Security
While the information security behaviors required to effectively respond to and mitigate
these three information security threats are considered important, individuals may perform
such behaviors in varying amounts. For example, one individual may have all of her data backed
up, while at the same time engage in behavior that compromises her privacy.

5
Further research in understanding why home users behave in a certain manner with
respect to information security is important. As long as home users fail to engage in safe and
secure computer behavior, organizations, financial markets, governments, and national security
will all be at an increased risk. Given the importance of home users in maintaining the integrity
of the Internet as well as their own computer, it is imperative that research continues to be
done in this area.
Propositions, Research Issues, and Research Problem
Several factors have already been empirically associated with the security behaviors of
home users, including perceived threat severity, perceived threat vulnerability, self-efficacy,
response efficacy, response costs, and social influences. Many of these factors have been
incorporated from other empirically supported theories, namely the Theory of Reasoned Action
(TRA), Theory of Planned Behavior (TPB), and Protection Motivation Theory (PMT) (Ajzen, 1985,
1991; Fishbein & Ajzen, 1975; Rogers, 1975, 1983). Another factor from Social Cognitive Theory
(SCT), locus of control, has also been shown to be an effective indicator of behavioral intentions
to engage in safe information security behaviors (Workman et al., 2008). However, there is one
factor that has been included sparingly in research on home users’ information security
behaviors—affect. Research in the decision-making domain has shown that affect influences
individuals’ risk perceptions (Curry & Youngblade, 2006; Isen, 1984; E. J. Johnson & Tversky,
1983; C. A. Smith & Kirby, 2001; Waters, 2008) and their self-efficacy (R. Baron, 1990; Bryan &
Bryan, 1991; Grindley, Zizzi, & Nasypany, 2008; Treasure, Monson, & Lox, 1996). Risk

6
perceptions and self-efficacy have both been associated with home users’ information security
behaviors, suggesting that affect may provide some additional and important insights in this
area.
Affect is a general term that encompasses mood, emotion, and trait affect (a generally
stable and life-long type of affect). It is composed of the higher order dimensions positive affect
(PA) and negative affect (NA), which represent the valence of mood descriptors (e.g., afraid,
scared, nervous, guilty, active, alert, enthusiastic, excited), as well as the lower level dimensions
that reflect the specific qualities of the individual affects (e.g., fear, sadness, guilt, hostility)
(Watson, Clark, & Tellegen, 1988; Watson & Walker, 1996). Other lower level dimensions that
are not part of either positive affect or negative affect include shyness, fatigue, serenity, and
surprise. Affect, the higher order dimensions of positive affect and negative affect, the lower
level dimensions that are found in these higher order dimensions, and the descriptors
associated with them are shown in Figure 2.

7
Affect(mood, emotion, trait affect)
Positive Affect Negative Affect
Joviality Self-Assurance Attentiveness Fear Hostility Guilt Sadness
happy,joyful,
delighted, cheerful,excited,
enthusiastic, lively,
energetic
proud,strong,
confident,bold,
daring,fearless
alert,attentive,
concentrating,determined
afraid,scared,
frightened, nervous,jittery,shaky
angry,hostile,
irritable, scornful,
disgusted, loathing
guilty, ashamed,
blameworthy, angry at self,
disgusted with self,
dissatisfied with self
sad,blue,
downhearted, alone,lonely
High
er O
rde
r D
imen
sions
Low
er Ord
er D
imen
sionsD
escrip
tors
Based on concepts found in Watson and Clark, 1994.
Figure 2: Affect, Its Dimensions, and Associated Descriptors
Affect may provide valuable information that cannot be obtained in whole or part
through the more commonly used cognitive processes, such as how someone feels about a
particular decision (Forgas, 2001). This explains in part why affect influences the risk
perceptions and self-efficacy of individuals. For example, one school of thought posits that
affect acts as information in which an individual asks, ‘how do I feel about this’ (Schwarz &
Clore, 2003). An interesting component of this is that the individual attributes her preexisting
affect to the scenario for which she must make a decision (i.e., target); the scenario is not
8
making her feel a particular way—she already felt that way (Clore, Gasper, & Garvin, 2001).
Decisions related to the target are subsequently made in an affect congruent manner. In other
words, if she has a greater degree of positive affect then her judgments related to the target
will be more optimistic, which results in lower perceptions of risk (i.e., perceived threat severity
and perceived threat vulnerability) and a higher degree of self-efficacy.
This relationship between affect and both risk perceptions and self-efficacy is important
and warrants further investigation with respect to decisions made on information security
matters by individuals. Thus, the problem addressed in this research is:
RQ: What is the role of trait affect in the information security behavior of home users?
Trait affect, the specific type of affect examined in this research, represents a generally
stable and life-long type of affect closely associated with certain personality traits and
observable physical and physiological signs.
A survey research design was used to explore the role of trait affect in the information
security behavior of home users. Next, I will discuss some of the contributions of this research.
Contributions
The aim of this study was to contribute to our understanding of home users’
information security behavior. In particular, I argue that, in addition to the factors commonly
employed (i.e., perceived threat severity, perceived threat vulnerability, self-efficacy, response
efficacy, response costs, and social influences), trait affect also plays an important role in
understanding the information security behavior of home users.

9
Trait Affect
In this research, 33 hypotheses were tested. There was support for 10 of them. This
included 3 hypotheses related to trait positive affect as an antecedent to two different
constructs traditionally a part of PMT (self-efficacy and perceived threat vulnerability). In
contrast, the same was not true for trait negative affect. The contribution these results provide
researchers is that trait positive affect may play an indirect role in understanding how
individuals respond to and cope with a threat. Furthermore, it suggests that trait positive affect
is worth exploring further, perhaps with greater granularity than what was done here. For
example, instead of looking at the higher order dimensions of positive affect and negative
affect, it may be worthwhile to examine the role of lower order dimensions of positive affect,
such as joviality, self-assurance, and attentiveness. The more we understand the role of affect
in how individuals cope with and respond to a threat, the easier it will be to design effective
interventions.
PMT Extended
This study extended the application of Protection Motivation Theory (PMT), which has
been the primary underlying theory used by researchers in understanding the information
security behavior of home users. In part, this was done by including constructs from PMT and
measurements of trait affect to form a more complete understanding of the information
security behavior of home users.
PMT presupposes that a fear appeal elicits strictly cognitive processes that in turn
arouse protection motivation (Maddux & Rogers, 1983; Rogers, 1975, 1983). While PMT does
incorporate affect indirectly as information input into the cognitive processes, it maintains that

10
the decision making process itself is strictly cognitive. However, this supposition ignores the
role that affect has been shown to play in risk perceptions and decision making (Finucane,
Alhakami, Slovic, & Johnson, 2000; Finucane, 2008; Slovic, Finucane, Peters, & MacGregor,
2007; Slovic, Peters, Finucane, & MacGregor, 2005; C. A. Smith & Kirby, 2001). This discrepancy
as it relates to the information security behavior of home users was further explored,
particularly, the role trait affect has on how individuals perceive and cope with a risk related to
information security.
Efficacy of PMT Constructs may be Threat-Dependent
In addition to extending PMT, this research examined three different threats using the
same methods and data analysis procedures. I did this by conducting three different surveys at
the same time—one for each of the three threats. This allowed me to determine if the efficacy
of PMT depended at least in part on the threat under examination. The data analysis suggests
that the specific threat that is examined using PMT does impact the efficacy of PMT as a
theoretical framework for understanding human behavior. Although inconsistent results
between PMT studies suggested the possibility of the theory being in part threat-dependent,
these studies have primarily concerned themselves with a single threat. This has limited their
ability to draw such conclusions.
Self-Efficacy
An additional contribution this research makes is its support for the continued role of
self-efficacy as a predictor of behavior. In fact, the positive association between self-efficacy
and behavior was the one general hypothesis that was supported in all three surveys. Given the
11
importance of self-efficacy in this context, it is imperative that researchers and practitioners
alike take the next step by developing tools and techniques to increase levels of self-efficacy
within the information security domain. While this may be more challenging than providing
instruction to overcome these deficits (Crossler & Bélanger, 2006), it is important that we
explore how this may be done most effectively.
Development and Validation of Three New Survey Instruments
Finally, this dissertation contributes to research on the information security behavior of
home users by having developed and validated three survey instruments. These three survey
instruments were designed to measure specific information security responses required to
mitigate one of three different threats: computer performance compromise, personal
information compromise, and loss of data and files. These instruments may be used by
researchers in a manner similar to what was done here by incorporating PMT constructs, or
perhaps other theoretical approaches could be employed.
Next, the scope of the problem and the resulting consequences will be discussed
further.
Justification for the Research
Home users are the weak link in the information security chain of defense. The impact
of home users’ security practices has the potential to spread far beyond individual users and
their own personal confidential information, and presents a serious risk both to organizations

12
and the national communication infrastructure. The threat is substantial in terms of its scope
and its consequences.
Malware continues to grow at an alarming rate. In 2007, Kapersky Lab identified over
2.2 million new malware variants, which was a four-fold increase from the prior year (“Storm
Calms but Malware Threat Grows Ten-Fold,” 2008). At the same time, home users, in particular,
continue to be under-protected. A 2006 survey of home users in the UK showed that only 20
percent of respondents were very confident in the security of their system (Lacohée, Crane, &
Phippen, 2006, p. 98). This is quite disconcerting in light of research that has shown 93 percent
of targeted attacks are aimed at home users (Symantec, 2007, p. 24) with malware identified
as the main culprit (Richardson, 2009, p. 7).
Criminals often seek personal information through malware or another commonly used
technique called phishing. Phishing involves a fake email being sent to a person purporting to
be from a legitimate source, such as a bank. Users are encouraged to click on a link to a fake but
legitimate-appearing website to verify their information (Miller & Wu, 2005, p. 275). These
phishing emails will often promulgate as a result of malware. Information obtained through
malware and phishing include Social Security numbers, passwords, names, dates of birth,
addresses, and credit card numbers.
The financial and emotional toll on home users has been significant. Over 90 percent of
consumer fraud is the result of either malware or phishing at a cost of $1,120 per person
(Pritchard, 2011, p. 27). The worldwide financial impact due to malware was over $13 billion in
2006 (“Malware Threat Rises Despite Drop in Direct Cost Damages.,” 2007, p. 16). Given the

13
prevalence of online fraud through malware and phishing, stolen credit card numbers can be
purchased for between one and 10 dollars (Pritchard, 2011, p. 26; Sood & Enbody, 2013).
In addition to the consequences for home users, security incidents on average are also
quite costly for organizations. In a survey of 443 information security and information
technology professionals, the average per respondent cost to organizations, between July 2008
and June 2009, was found to be $234,244 (Richardson, 2009, p. 2). According to Furnell et al,
“…organisations can only fully protect themselves if home users do” (p. 411).
Governments too are at risk, since a significant portion of the national communication
infrastructure occurs through the Internet, which remains vulnerable to malware. A
cybercriminal may decide to launch an extensive attack by using botnets on home computers
that are under his control; millions of unsuspecting computers can be used simultaneously by a
cybercriminal. This makes financial markets, governments, and national security particularly
vulnerable.
The Internet is used extensively by financial markets, including the rapid rise of
Electronic Communications Networks (ECNs) (Fan, Stallaert, & Whinston, 2000). In 2000, cyber
warfare between pro-Israeli and pro-Palestinian groups resulted in a server crash, causing the
Israeli stock market to decline by 8 percent (Gandhi et al., 2011, p. 30).
Similarly, governments in general, and national security in particular, are also
vulnerable. This was illustrated in a recent report from the Department of Defense (DoD):

14
DoD currently operates more than 15,000 different computer networks across 4,000
military installations around the world. On any given day, there are as many as seven
million DoD computers and telecommunications tools in use in 88 countries using
thousands of warfighting and support applications. The number of potential
vulnerabilities, therefore, is staggering. Moreover, the speed of cyber attacks and the
anonymity of cyberspace greatly favor the offense. This advantage is growing as hacker
tools become cheaper and easier to employ by adversaries whose skills are growing in
sophistication. (Gates, 2010, p. 37)
The motives behind attacks include policy disagreements, international conflict, and
disputes between countries. Thus, the proliferation of malware can have devastating
consequences to organizations, financial markets, governments, and national security.
The Home User Problem
Despite the availability of technical solutions, information security continues to be a
significant problem for home users. There are three primary reasons for this. First, even when
anti-malware solutions are implemented correctly, the criminals that develop malware are
often creative and almost always one step ahead of the anti-malware solutions (Young, 2008).
Second, anti-malware software is often not used correctly: While a significant amount of
research has been performed to try and make security solutions more usable (see, for example,
Adams & Sasse, 1999; Edwards, Poole, & Stoll, 2008; Mannan & van Oorschot, 2008; Tognazzini,
2005), usability continues to present a great challenge for many home users. Finally, even if the
technical solution is well designed and up-to-date, the active engagement of the user is still

15
required. The user must choose to perform security measures and must learn how to be a
conscientious Internet user in order for security to be effective.
Unfortunately, most home users do not actively engage in appropriate security
measures (Besnard & Arief, 2004; Nov & Wattal, 2009). Security is not the primary task of home
users; they want to look at photos, communicate with family and friends, and engage in any
number of other primary tasks. Backing up data may be difficult to remember for some, while
preventing a malware infection may be too difficult for others. Likewise, sharing personal
information via social media may provide a certain level of pleasure and sense of community
that takes precedence over the risk. Generally, home users are not interested in security until it
is an issue (Birge, 2009; Egelman, King, Miller, Ragouzis, & Shehan, 2007).
Home users’ failure to attend to their information security has serious consequences,
not only for them individually, but also the Internet community as a whole (Furnell et al., 2007,
p. 410). As organizations have continued to take steps towards protecting their computers, it
has made them less attractive targets, while simultaneously making home users more favorable
targets of cybercriminals (Furnell et al., 2007, p. 410). This does not necessarily bode well for
organizations. One study showed that 71 percent of respondents reported using their home
system to perform work activities, over half of whom transferred files between their work and
home computers (p. 412). Therefore, while the organization may be less directly susceptible to
security incidents, the organization becomes increasingly vulnerable through the less well-
protected home computer.

16
Methodology
Survey with Quantitative Analysis
This study employed a survey research design to examine the relationship between key
factors of trait affect with those for risk perception and self-efficacy. A comprehensive survey
was administered to participants, incorporating a previously validated survey instrument to
measure the two constructs that represent trait affect (positive affect and negative affect),
along with previously validated measurement items for the constructs from PMT. Three
information security threats were examined: computer performance compromise, personal
information compromise, and loss of data and files. The responses (i.e., behavior) necessary to
mitigate these threats were measured by conducting an expert panel review to adapt and
validate a previously developed survey instrument. Demographic, behavioral, and personal
belief data were collected during this phase.
Participants were recruited to complete the survey by using a service that enables
recruitment from a national audience. The survey results were analyzed with SPSS (Statistical
Package for the Social Sciences) version 19 and SmartPLS version 2.0 (Beta) (C. Ringle, Wende,
& Will, 2005), a partial least squares structural equation modeling software.
Delimitations of Scope and Key Assumptions, and their Justifications
Causation
This research does not test for causation, but does hypothesize causation based on
theoretical grounds and prior research. Correlations may indicate that further research is

17
warranted to more fully examine issues of causation. This would likely involve experiments with
appropriate manipulations.
Population
This study is limited to examining the information security behavior of home users. The
population the sample was drawn from was limited to adults in the United States that choose
to participate in the survey. Any generalizations that can be made based on the data were
limited to the population from which it is drawn, unless otherwise noted. Demographic data
was used to assist in determining whether reasonable generalizations should be made beyond
said population.
Behavioral Intention and Self-Reports of Behavior
This study used information on an individual’s reported behavior rather than behavioral
intentions. Although most of the theories that have been used to understand behavior within
the information systems domain include a behavioral intention construct that acts as the main
determinant of behavior (Ajzen, 1985; Fishbein & Ajzen, 1975; Rogers, 1975; Triandis, 1977), it
may not be the most appropriate way to measure the information security behavior of home
users (Crossler & Bélanger, 2010). According to Crossler and Bélanger (2010), “intentions to
protect one’s computer may not be enough, particularly with the rapid spread of computer
threats” (p. 85).
Additionally, most of the research that has reviewed the literature on the intention-
behavior relationship has examined primarily correlational studies, which make inferences
regarding causation problematic (Webb & Sheeran, 2006). In a meta-analysis of research that
employed experimental manipulations, Webb and Sheeran (2006) found the strength of the

18
hypothesized relationship to be much lower. In fact, a medium-to-large change in intention
only led to a small-to-medium change in behavior (p. 260).
Finally, there are two others factors that weaken the argument for measuring
behavioral intention in the current research. First, the information security behaviors of interest
in the current research designed to mitigate the three threats (i.e., computer performance
compromise, personal information compromise, and loss of data and files) may have become
largely habitual for a great number of users. There is a weaker relationship between intention
and behavior for behaviors that are more routine and stable over time (i.e., habits) (Ouellette &
Wood, 1998; Wood, Quinn, & Kashy, 2002). Second, the current research does not include an
experimental manipulation. While it is possible that the survey instrument itself may increase a
participant’s intention of performing a certain information security behavior, that is not the
purpose of the survey instrument. Instead, the focus is on understanding the relationship
between certain constructs and an individual’s current behavior.
Therefore, self-reports of behavior were measured in the current study, which is
considered an important step towards measuring actual behavior. However, self-reports of
behavior are not perfect. For example, some participants may provide answers they deem more
socially desirable than others (Fowler, 1995, pp. 28–29; Tourangeau, Rips, & Rasinski, 2000, p.
257). These questions that are deemed sensitive by participants have a higher likelihood of
nonresponse as well (Tourangeau et al., 2000, p. 263). Additionally, respondents may not be
able to recall information required by the question (Fowler, 1995, pp. 20–21; Tourangeau et al.,
2000, pp. 62–99).

19
Actual observations of an individual’s behavior would be able to mitigate these
deficiencies to some extent. The problem is that observations are not only timely and costly,
but they introduce other pitfalls. Internal validity may increase with direct observations, but
external validity will likely decrease given a smaller sample size generally inherent in field work.
Ultimately, tools should be developed to help automate the process of direct
observations of behavior. With respect to personal information security behavior, this might
involve computer monitoring software installed on the participant’s computer.
Finally, while self-reports are not perfect, there is a strong correlation between self-
reports of the primary constructs under investigation in the current research—trait positive
affect and trait negative affect—and evaluations using the same measurement tool by their
peers (Watson & Clark, 1991, 1994). Similar findings have been found when examining self-
reports of personality traits with those by their spouses (South, 2011).
Next, I will briefly discuss other possible constructs that may be explored in future
research.
Other Possible Constructs
The purpose of this study was to explore the role of trait affect in the information
security behavior of home users. While measurements will be done for some of the constructs
previously examined, the goal was to enhance our understanding by exploring constructs for
affect. There are additional constructs that are worth exploring, but given the lack of prior
research on constructs related to affect, this researcher favors learning a lot about a little,
rather than a little about a lot. Thus, while this research did not explore other possible

20
constructs that may be important in understanding the information security behavior of home
users, it does provide a solid foundation for exploring such constructs in the future.
Definitions
One challenge in research is the use of definitions that may not be universal among
researchers. This section provides the working definitions of key words and phrases for this
research.
Affect: Affect is a general term that encompasses mood, emotion, and trait affect. It is
composed of the higher order dimensions positive affect (PA) and negative affect (NA), which
represent the valence of mood descriptors (e.g., afraid, scared, nervous, guilty, active, alert,
enthusiastic, excited), as well as the lower level dimensions that reflect the specific qualities of
the individual affects (e.g., fear, sadness, guilt, hostility) (Watson et al., 1988; Watson & Walker,
1996). Definitions for PA and NA are provided in this section.
Affective State: Affective state is the lower level dimension of affect that reflects the specific
content of mood descriptors (e.g., afraid, scared, nervous, guilty, active, alert, enthusiastic,
excited). Affective states include: fear, sadness, guilt, hostility, shyness, fatigue, surprise,
joviality, self-assurance, attentiveness, and serenity (Watson & Clark, 1994).
Emotion: Emotion can be characterized as a generally short-lived and intense affective reaction
to an event or stimulus (Isen, 1984). It may consist of one or more affective states (e.g., fear,

21
sadness, guilt, hostility, shyness, fatigue, surprise, joviality, self-assurance, attentiveness,
serenity) (Watson & Clark, 1994).
Home Users: Home users are all computer users that are using the computer outside of an
organizational setting (e.g., workplace).
Malware: Malware is malicious software. It is a type of software that is inserted into a
computer with the purpose of causing harm to it or other computers (Garuba et al., 2008, p.
628). It consists of viruses, worms, botnets, Trojan horses, spyware, etc., (Creeger, 2010, p. 43).
Mood: Mood is a long-lasting and generally mild in degree affective state (Isen, 1984).
Negative Affect (NA): Negative affect is “a general dimension of subjective distress and
unpleasurable engagement that subsumes a variety of aversive mood states, including anger,
contempt, disgust, guilt, fear, and nervousness, with low NA being a state of calmness and
serenity” (Watson et al., 1988, p. 1063). Trait NA is strongly correlated with the personality trait
neuroticism (Watson & Walker, 1996).
Phishing: Phishing involves a fake email being sent to a person purporting to be from a
legitimate source, such as a bank. Users are encouraged to click on a link to a fake but
legitimate-appearing website to verify their information (Miller & Wu, 2005, p. 275). Phishing
emails will often promulgate as a result of malware.
Positive Affect (PA): Positive affect “reflects the extent to which a person feels enthusiastic,
active, and alert. High PA is a state of high energy, full concentration, and pleasurable
engagement, where low PA is characterized by sadness and lethargy” (Watson et al., 1988, p.

22
1063). Trait PA is strongly correlated with the personality trait of extraversion (Watson &
Walker, 1996).
Risk: Risk is “A state of uncertainty where some of the possibilities involve a loss, catastrophe,
or other undesirable outcome” (Hubbard, 2010, p. 50).
Self-efficacy: Self-efficacy is defined as “The strength of people’s convictions in their own
effectiveness…” (Bandura, 1977, p. 193).
Social engineering: Social engineering is the manipulation of people in order to have them
divulge confidential information (Gross & Rosson, 2007).
Threat: “A threat is a danger or harm that exists in the environment whether we know it or not.
Perceived threat is cognitions or thought about that danger or harm” (Witte, Cameron,
McKeon, & Berkowitz, 1996, p. 320).
Threat severity: Threat severity is defined as “The degree of physical harm, psychological harm,
social threats, economic harm, dangers to others rather than oneself, and even threats to other
species” (Y. Lee & Larsen, 2009, p. 179).
Threat vulnerability: Threat vulnerability is described as “…the conditional probability that the
event will occur provided that no adaptive behavior is performed or there is no modification of
an existing behavioral disposition” (Rogers, 1975, p. 97).
Trait Affect: Trait affect represents a generally stable and life-long type of affect. It is composed
of the higher order dimensions positive affect (PA) and negative affect (NA), which represent
the valence of mood descriptors (e.g., afraid, scared, nervous, guilty, active, alert, enthusiastic,

23
excited), as well as the lower level dimensions that reflect the specific qualities of the individual
affects (e.g., fear, sadness, guilt, hostility) (Grös, Antony, Simms, & McCabe, 2007; Watson et
al., 1988; Watson & Walker, 1996). Definitions for PA and NA are provided in this section.
Conclusion and Outline of the Report
The personal information security behavior of home users has important implications,
not only for home users themselves, but for the Internet community as a whole. Home users
are the weakest link in maintaining the security of the Internet, yet there is scant information
on the nature of the behavior of this group. Most research examining individuals has focused
on users in an organizational setting. Further, research that has been done on the home user
has either been simply descriptive in nature or at times contradictory with other findings. This
may be due in part to the nature of the constructs being measured; these constructs may be
highly sensitive to the specific behavior under investigation.
Additionally, most of the research that has been done and grounded in theory has been
based in large part on Protection Motivation Theory (PMT). While PMT is an important and
powerful theory, the lack of knowledge that persists in this area indicates further exploration of
additional constructs and theory development is warranted. The additional concept that was
explored in this research—trait affect—may help close some of this knowledge gap. It may also
show us that fear appeals elicit more than just cognitive appraisal processes, but rather
processes related to affect as well.

24
The remainder of this report is structured as follows. In chapter 2, the theoretical
approaches relevant to the current research are discussed. This includes an examination of
perceived threat severity, perceived threat vulnerability, response costs, response efficacy, and
self-efficacy, as developed in PMT. Next, trait affect and its relationship to these constructs are
discussed. Finally, the research model is presented.
In the third chapter, the research methodology for further exploring the relationship
between these factors is discussed. In particular, the use of a comprehensive survey instrument
to collect data from a national audience is explored in depth.
The fourth chapter discusses the adaptation, development, and refinement of a survey
instrument that is used to measure the information security behavior of home users. This
survey instrument was incorporated into the final survey that will be administered to
participants to examine the role of trait affect with respect to information security behavior.
The fifth chapter discusses the data collected and provides an analysis of the results.
Data collected employs SPSS for quantitative statistical analysis. Information on participant
recruitment and composition is also discussed.
The implications of the results are discussed in the sixth and final chapter. This includes
a discussion of the limitations of the study. Some concluding remarks are made with
suggestions for future research.

25
Chapter 2: Research issues
Introduction
Several theories, models, and frameworks have been used to help researchers
understand individuals’ information security behavior. The fact that they are largely drawn from
other disciplines has limited their applicability in some respects, as they often lack the specific
context required of information security behavior (Cannoy, Palvia, & Schilhavy, 2006, p. 13).
Nonetheless, research based on these theories has led to a better understanding of the
determinants of an individual’s information security behavior.
While we have continued to move towards a more complete understanding, the
models, frameworks, and theories that have most often been employed have viewed the
information security behavior of home users from a cognitive standpoint. Although both
Protection Motivation Theory and self-efficacy include affect as a possible source of
information, there is little research that has systematically examined this relationship (e.g.,
Thatcher & Perrewe, 2002). Information security research that has included non-cognitive
components (e.g., affect), has been lacking in the use of validated survey instruments,
consistency, clear operational definitions of affect and related terms, and has not received
enough attention to warrant replication and subsequent validation of results (Sun & Zhang,
2006).
In the ensuing paragraphs, I first discuss Protection Motivation Theory (PMT) and its
constructs: perceived threat severity, perceived threat vulnerability, perceived response

26
efficacy, perceived response costs, and self-efficacy. I then review the concept of affect and its
role in the current research. The research model that guided this study is presented at the end.
Parent Theories and Classification Models
Protection Motivation Theory (PMT) has been an important tool for researchers in a
significant number of disciplines, studies and subject matters. This has included research
examining an array of health behavior issues (Floyd, Prentice-Dunn, & Rogers, 2000), as well as
information security behavior (Anderson & Agarwal, 2010; Crossler, 2010; Herath & Rao,
2009b; Johnston & Warkentin, 2010; Y. Lee & Larsen, 2009; Liang & Xue, 2010; Woon et al.,
2005; Workman et al., 2008). Its use in understanding the information security practices of
individuals has included several different adaptations. Given the unique dynamics of
information security behavior, the use of several different adaptations is understandable and
largely warranted.
Likewise, self-efficacy has been used extensively in information systems (IS) research (D.
R. Compeau & Higgins, 1995; Crossler & Bélanger, 2006; Durndell & Haag, 2002; Fagan, Neill, &
Wooldridge, 2003; R. D. Johnson & Marakas, 2000), including research on computer adoption
and information security behavior. Additionally, information security behavior has been
examined extensively with PMT as the primary theory and self-efficacy as a construct of that
theory.
In the following paragraphs PMT is discussed with particular emphasis on the two
constructs that represent risk perception—perceived threat severity and perceived threat
vulnerability—and the three constructs that represent coping appraisal—response efficacy,

27
response costs, and self-efficacy. This is followed by a more in-depth discussion of self-efficacy
and the highly context-specific nature of the construct.
Protection Motivation Theory
Fear Appeals
Protection Motivation Theory (PMT) was developed in 1975 by Rogers as an extension
of expectancy-value theory to provide a more complete understanding of the effects of fear
appeals on attitude change (Rogers, 1975). A fear appeal is a communication regarding a threat
to an individual that provides information regarding one’s well-being (Milne, Sheeran, & Orbell,
2000, p. 107). It is used “in persuasive messages to scare people in the hopes that the aroused
fear will result in the performance of adaptive behaviors” (Roskos-Ewoldsen & Yu, 2004, p. 49).
Rogers’s work was based in part on earlier research by Lazarus, Leventhal, and Bandura
examining threat appraisal (Bandura, 1977; Lazarus, 1963; Leventhal & Singer, 1966; Leventhal,
Watts, & Pagano, 1967). According to Lazarus (1963), “threat, or at least stress reactions
mediated psychologically, depend upon the cognitive appraisal of a stimulus” (p. 210). In other
words, how someone reacts to a threat is a cognitive process as opposed to an emotional one.
Leventhal and Singer (1966) noted, “Intentions to act and the expectation that action will be
effective would, in fact, seem to be necessary antecedents for the reduction of fear” (p. 144).
This implies that the only way to reduce fear is through a decision to take an action that the
person believes will mitigate the threat.
In Rogers’s (1983) revision of PMT, he added the self-efficacy construct based on work
done by Bandura (1977), who noted, “The strength of people’s convictions in their own
effectiveness is likely to affect whether they will even try to cope with given situations” (p.

28
193). Thus, even if an individual believes a given action would produce the desired result (e.g.,
avoidance of a damaging event such as identity theft through malware), if he does not feel
confident of his ability to carry out that action, then he is unlikely to attempt it.
Threat Appraisal
In PMT, two independent appraisal processes occur as a result of a fear appeal: threat
appraisal and coping appraisal. A fear appeal stems from environmental and intrapersonal
information. Rogers (1975, 1983) articulated six components of a fear appeal, three for each of
the appraisal processes. Threat appraisal consists of: 1) the severity of the perceived threat,
based on prior research showing that the manipulation of fear will affect the perceived severity
of the threat; 2) the vulnerability to the perceived threat, noted in prior research to increase as
fear-appeals go from low-fear to high-fear; and 3) rewards, both intrinsic and extrinsic, such as
personal satisfaction or fulfillment and social acceptance by peers.
Fear arousal is an intervening variable with both perceived threat severity and perceived
threat vulnerability. Threat appraisal is believed to inhibit maladaptive responses (e.g., denial,
avoidance) (Norman, Boer, & Seydel, 2005, p. 83). However, both intrinsic and extrinsic rewards
increase the probability of a maladaptive response.
It is worth noting an important distinction with regard to how PMT views a threat: “The
protection motivation theory makes it clear that one is coping with and avoiding a noxious
event rather than escaping from an unpleasant emotional state of fear” (Rogers, 1975, p. 101).
The reason for this distinction is twofold. First, it focuses researchers back on environmental
stimulus, which is the basis of a fear appeal. Second, it allows for its use in situations in which
an emotional state of fear is not aroused, despite an individual engaging in a protective

29
behavior (e.g., crossing the street) (p. 101). A schema of Protection Motivation Theory is
presented in Figure 1 below.
Intrinsic Rewards
Extrinsic Rewards
Response Efficacy
Self-EfficacyCoping Appraisal
Threat Appraisal
Response Costs
Severity
Vulnerability
Protection Motivation
MaladaptiveResponse
AdaptiveResponse
Increasing Decreasing
Fear Arrousal
=
=
-
-
Cognitive Mediating ProcessSources of Information Coping Modes
Environmental
Verbal Persuasion
Observational Learning
Intrapersonal
Personality Variables
Prior Experience
Action or Inhibition of Action
Single Act
Repeated Acts
Multiple Acts
Repeated Multiple Acts
Factors Affecting Response Probability
Adaptive and Maladaptive Coping
Based on: Rippetoe and Rogers (1987)
Figure 3: Protection Motivation Theory Schema
Perceived threat severity is discussed next.
Perceived Threat Severity
Perceived threat severity is the level of severity elicited from a fear appeal. It is based on
prior research that showed when a fear appeal is increased through manipulation, it resulted in
increased perceptions of threat severity.
In one study, Leventhal and Singer (1966) exposed participants to varying magnitudes of
fear stimuli associated with dental hygiene and provided recommendations that were designed
to reduce this fear. They found that higher magnitudes of fear stimuli resulted in greater
message acceptance than lower levels. However, the recommendations were not associated
with greater message acceptance.
In a meta-analysis of 13 PMT studies (N=2,096) that contained the perceived severity
variable, Floyd, Prentice-Dunn, and Rogers (2000) found that perceived severity had a medium
effect size (d+=0.48) (p. 415). Several studies examining the information security behavior of

30
individuals have also shown the relationship between perceived threat severity and the
dependent variable representing different information security behaviors (e.g., backing up data,
individual actions to mitigate threats, adoption of anti-malware software, and securing wireless
access) to be significant (Crossler & Bélanger, 2010; Johnston & Warkentin, 2010; Y. Lee &
Larsen, 2009; Woon et al., 2005). At times this variable has been moderated with either self-
efficacy or response efficacy. Other times it has been combined with perceived threat
vulnerability for a perceived threat construct. Next, I discuss the perceived threat vulnerability
construct.
Perceived Threat Vulnerability
Perceived threat vulnerability is the level of susceptibility elicited from a fear appeal.
This variable was included in PMT based on prior research that indicated an individual’s
perceived threat vulnerability increased as fear-appeals went from low-fear to high-fear (Dabbs
& Leventhal, 1966; Leventhal & Watts, 1966).
For example, Leventhal, Watts, and Pagano (1967) performed a study examining the
effects of fear appeals on smoking behavior. They found that participants in the high-fear
treatment group reported feeling more vulnerable than those in the moderate-fear group.
Additionally, participants who were not given instructions on how they could stop smoking
conveyed a greater level of vulnerability than those who were given instructions (pp. 316-317).
A small but significant effect size was found (d+=0.21) between perceived threat
vulnerability and adaptive behavioral intentions or behaviors, depending on the study, in a
meta-analysis of 15 studies (N=2,434) that employed the perceived vulnerability variable (Floyd
et al., 2000, p. 415). Research in the information security domain that has included a perceived

31
threat vulnerability variable has generally shown a significant relationship with the dependent
variable (e.g., having auto-update enabled, up-to-date virus definitions, strong passwords,
backing up data, wireless encryption enabled) (Crossler & Bélanger, 2010; Y. Lee & Kozar, 2005).
Coping Appraisal
In contrast to threat appraisal that is believed to inhibit maladaptive responses, coping
appraisal is concerned with the factors that determine whether an individual will cope with and
avert a specific threat (Rogers, 1983, p. 169). Coping appraisal consists of: 1) the perceived
effectiveness of a counter-response (perceived response efficacy), reported to increase
compliance with recommendations, as the perceived effectiveness of the recommendations
increased (Rogers, 1975, pp. 102–103); 2) perceived response costs, considering the cost (time,
effort, financial, etc.) of the adaptive response; and 3) belief that the individual can effectively
perform the counter-response (self-efficacy), with prior research showing a positive correlation
between self-efficacy expectancy and changes in behavior (assumed causal relationship)
(Maddux & Rogers, 1983, p. 470).
Coping appraisal is believed to increase the likelihood of an adaptive response (e.g.,
action to prevent a negative outcome). The greater the response efficacy and self-efficacy, and
the lower the response costs, the more likely it is that an individual will engender an adaptive
response (Norman et al., 2005, p. 83).
Perceived response efficacy and perceived response costs are discussed next, followed
by a discussion on interactions between constructs in PMT and how PMT has been used in
research. Given the important role self-efficacy has had in several different theoretical

32
approaches (including PMT), it is discussed in significantly more detail after the primary
discussion of PMT has concluded.
Perceived Response Efficacy
Perceived response efficacy is the belief that a counter-response will be effective in
mitigating a threat (Rogers, 1975, pp. 102–103). This variable was included in PMT based on
prior research that indicated an individual’s belief that a response would be effective in
mitigating a threat is associated with increased compliance with recommended responses (Chu,
1966; Rogers & Deckner, 1975; Rogers & Thistlethwaite, 1970).
For example, Chu (1966) found that higher levels of purported efficacy for a drug to
treat roundworm resulted in a great number of participants indicating they would take the
drug. In another study, Rogers and Deckner (1975) provided information on the dangers of
smoking (i.e., fear appeal). They found that the effectiveness of quitting smoking in lessening
the negative consequences resulted in lower cigarette consumption.
In a meta-analysis of 22 studies (N=2,652) that employed the response efficacy variable,
a medium and significant effect size was found (d+=0.55) between response efficacy and
adaptive behavioral intentions or behaviors, depending on the study (Floyd et al., 2000, p. 415).
Research that has examined various information security behaviors (e.g., backing up data,
wireless encryption enabled) have also found a strong relationship between the perceived
effectiveness of the response and the associated information security behavior (Crossler, 2010;
Herath & Rao, 2009a, 2009b; Ifinedo, 2012; Johnston & Warkentin, 2010; LaRose et al., 2008; D.
Lee, Larose, & Rifon, 2008; Y. Lee & Larsen, 2009; Woon et al., 2005; Workman et al., 2008).

33
Perceived Response Costs
Perceived response costs include all costs (e.g., monetary, time, effort, personal)
associated with performing the response necessary to mitigate the threat (Floyd et al., 2000;
Maddux & Rogers, 1983; Rogers, 1975). Although this factor initially received very little
attention in the original formulation of PMT, it has proven itself to be a valuable predictor of
behavior (Maddux & Rogers, 1983; Rippetoe & Rogers, 1987; Rogers, 1975, 1983).
If the costs associated with performing an adaptive response are too high then the
individual will choose instead to accept the risk that the threat poses. For example, in a study
that examined adolescents with insulin-dependent diabetes, Palardy et al. (1998) found that
individuals that perceived high response costs were less likely to adhere to treatment. In
another study, Rippetoe and Rogers (1987) found that withdrawal symptoms and other costs
associated with smoking cessation made it less likely for smokers to quit.
In a meta-analysis of 9 studies (N=1,457) that employed the response costs variable, a
large and significant effect size was found (d+=1.05) between response efficacy and adaptive
behavioral intentions or behaviors, depending on the study (Floyd et al., 2000, p. 415).
Research that has examined various information security behaviors (e.g., security policy
compliance, anti-malware adoption, wireless encryption enabled) have also found a strong
relationship between the perceived costs of the response and the associated information
security behavior (Herath & Rao, 2009b; LaRose et al., 2008; Y. Lee & Larsen, 2009; Vance,
Siponen, & Pahnila, 2012; Woon et al., 2005; Workman et al., 2008).

34
Interactions
The original PMT argued that there would be a multiplicative effect between
vulnerability, severity, and response efficacy on intention (Rogers, 1975). The reasoning was
that if any of these components were zero then an adaptive response would not be chosen.
This appears reasonable. If a fear appeal indicates that a severe threat exists, but has no
probability of occurring, a countermeasure would not be needed regardless of how confident
the individual is that it would be effective. Likewise, if a severe threat exists and has a high
probability of occurring, but the individual does not believe the countermeasure will be
effective, then employing it would be purposeless. While this interaction seems reasonable, it
has not been supported empirically.
In the revised PMT, it was argued that there would be an additive relationship between
severity and vulnerability, as well as response efficacy and self-efficacy (Rogers, 1983).
Additionally, it was contended that there would be second-order interaction effects between
the two appraisal processes. Again, these interactions have not been supported empirically
(Cismaru & Lavack, 2007, p. 260). Some research has supported these propositions, but these
findings have been highly inconsistent through a number of studies.
Finally, many studies have found interactions (multiplicative or additive) not noted
above. This includes self-efficacy and vulnerability, severity and response efficacy, response
costs and response efficacy, and response efficacy and vulnerability (Cismaru & Lavack, 2007,
pp. 254–257). This suggests the interactions that may exist within PMT implementations will
depend on the context of the study. For example, sample size, threat topic, baseline self-

35
efficacy, baseline perceived threat, and the population the sample is drawn from may all
influence the effects found in any given study.
Application of PMT in Research
A significant number of studies have been undertaken using PMT. However, it is worth
mentioning that very few have employed all of the components that are noted to determine
protection motivation. These exclusions have largely involved omitting the intrinsic and
extrinsic rewards, and less often the response costs (Floyd et al., 2000). This has been largely
for conceptual reasons (Abraham, Sheeran, Abrams, & Spears, 1994; Milne et al., 2000).
According to Abraham, Sheeran, Abrams, and Spears (1994), “the conceptual distinction
between the reward value of a risk behaviour and cost of a preventative measure may not be
clear” (p. 271). Thus, there is a chance that these variables would be measuring the same thing.
If this is the case, then it precludes one’s ability to distinguish between the effects of
presumably different indicators on the dependent variable. According to Farrar and Glauber
(1967), “the large variances on regression coefficients produced by multicollinear independent
variables indicate, quite properly, the low information content of observed data, and
accordingly, the low quality of resulting parameter estimates” (p. 93).
In the first study conducted after the original theory was modified, Maddux and Rogers
(1983) found that self-efficacy had a significant influence on intentions to adopt a coping
behavior (p. 476). Furthermore, it proved to be the most powerful component in predicting
behavioral intentions. Finally, self-efficacy had an effect on two other components: probability
and effectiveness of response.

36
A meta-analysis of PMT research showed that self-efficacy (d+=0.88) had the largest
single impact on protection motivation, followed by response efficacy (d+=0.54), combined
vulnerability and severity (d+=0.54), and response costs (d+=0.52) (Floyd et al., 2000, p. 416). 1
Another observation they made was that the relationship between self-efficacy and adaptive
intentions or behaviors became stronger as the quality of the study increased. This would
suggest that great care should be taken in the design of studies to avoid inadvertently
minimizing the role of the component that has been shown to have the strongest relationship
with adaptive intentions and behaviors. Finally, they noted that all of the hypothesized
relationships from PMT were supported.
Self-Efficacy
Perceived threat severity and perceived threat vulnerability are important constructs in
understanding how individuals perceive a risk. However, it is also important for an individual
when faced with a threatening situation to believe that she can successfully take action to
mitigate the threat. Self-efficacy is the belief an individual can perform a behavior that is
necessary to produce a given outcome (Bandura, 1977). It plays a central role in Social Cognitive
Theory and is noted to be the most pervasive mechanism of personal agency (Bandura, 1991, p.
257). Self-efficacy is conceptually different from outcome expectations, which consist of the
1 Pre-homogeneity correction. Post-homogeneity correction showed response costs (d+=1.05), response efficacy (d+=0.55), and rewards
(d+=0.52) as having the largest mean effect size.

37
belief that a specific action or behavior will result in a certain outcome. The difference is
represented in the diagram that follows.
Outcome Expectations
Self-Efficacy
Person Behavior Outcome
Based on: Bandura (1977)
Figure 4: Difference between Self-Efficacy and Outcome Expectations
According to Bandura (1977), “The strength of people’s convictions in their own
effectiveness is likely to affect whether they will even try to cope with given situations” (p.
193). Thus, even if an individual believes a given action would produce the desired result (e.g.,
avoidance of a noxious event such as identity theft through malware), if he does not feel
confident in being able to carry out that action then it is unlikely to be attempted. Likewise,
those that have a stronger perceived self-efficacy are more likely to persist in activities deemed
threatening, and they will be more active in their efforts (Bandura, 1977).
Self-Efficacy vs. Self-Esteem
Although self-efficacy may sound similar to self-esteem, they are conceptually different.
Self-esteem is concerned with judgments of self-worth, while self-efficacy is concerned with an
individual’s belief in his/her ability to perform a certain task (Bandura, 1997, p. 11). For
example, an individual may have no belief in her capacity to install anti-malware software, but

38
it does not mean she has a low self-esteem. Likewise, a criminal may not feel self-worth related
to using stolen credit card numbers, but he may have strong beliefs related to his capability in
performing the task.
Dimensions of Self-Efficacy
Beyond this distinction with self-esteem, self-efficacy expectations also vary from one
another on three specific dimensions: magnitude, generality, and strength (Bandura, 1977, p.
194). Magnitude consists of the difficulty level of tasks; when ordered by level of difficulty,
some individuals will be capable of only the simplest tasks, while others will be capable of both
the simple and more difficult tasks. Generality refers to the degree to which self-efficacy in one
situation extends to other situations that may be quite dissimilar. Some experiences will have
significant generality that leads to increased self-efficacy primarily in related situations, but also
to a certain extent in dissimilar ones. Finally, strength is the degree to which individuals possess
expectations of mastery. Those with strong expectations will persevere longer in the face of
disconfirming experiences than those with weaker expectations.
The different ways in which self-efficacy can vary based on the context is important
given the variety of information security tasks users must perform to protect themselves. Thus,
it is possible that self-efficacy gained through successful completion of installing software and
updating it could extend to maintaining anti-malware software and backing up data, but less so
to maintaining one’s privacy. This makes it problematic to assume that self-efficacy in one
information security task will translate to self-efficacy in other types of information security
tasks. While transferability of self-efficacy may be the case in some instances and with some

39
tasks, it will be highly dependent on the specific tasks under evaluation (Bandura, 1977, p. 194).
There is no real way to know except through empirical examination.
Sources of Information in Self-Efficacy Expectations
In addition to self-efficacy varying based on context, it may also vary based on the
information that forms the self-efficacy expectation. According to Bandura (1977), there are
four specific types of information that act to form self-efficacy expectations (p. 195). First,
performance accomplishments are noted to be particularly influential in forming self-efficacy
expectations because they stem from past experiences in either mastering or failing a specific
task. If an individual has had several past failures related to implementing information security
safeguards, then he is less likely to even attempt implementing such safeguards in the future.
Second, vicarious experiences are less influential than performance accomplishments,
but still serve as a source of information in the formation of self-efficacy expectations. Vicarious
experiences include seeing other individuals perform a task without adverse consequences
(Bandura, 1977, p. 197). For example, observing a friend’s Facebook page that is completely
open to the public with no apparent adverse consequences may lead to the individual engaging
in similar behavior as his friend. This does not mean that there will not be adverse
consequences or that there have not been already; rather, the individual observing his friend’s
page is not aware of any such consequences. Vicarious experiences may also include observing
an individual successfully performing an information security behavior, such as backing up her
data. The observation that someone else can perform this behavior may have some impact on
one’s own self-efficacy expectations.

40
Third, verbal persuasion is the suggestion by one individual to another individual that he
can perform a specific task (Bandura, 1977, p. 198). For example, I could try and persuade my
brother that he is capable of taking appropriate measures to protect his privacy online. While
this may have some effect on his self-efficacy expectations, it is generally most effective when
used in combination with other approaches and is considered a weak source of information by
itself.
Finally, emotional arousal is another source of information that forms self-efficacy
expectations (Bandura, 1977, p. 198). A situation may be stressful to some, but not others. For
those in which stress is induced, certain emotions may be triggered as a result. These emotions
may act as information by the individual in determining whether or not he is capable of
performing the task. This is important with respect to the current research since trait affect
often serves as the baseline from which specific emotions may be elicited. For example, an
individual with high trait negative affect is more likely to become anxious under the same
situation than an individual with low trait negative affect. The concept of affect in general, and
trait affect in particular, will be discussed in more detail later in this chapter.
Self-Efficacy in Research
Self-efficacy has been an important construct within IS research. This includes extensive
use of the construct to understand technology adoption. For example, a specific measure was
developed to assess computer self-efficacy (CSE) (D. R. Compeau & Higgins, 1995). CSE has been
used in several studies and generally shown to be a good predictor of behavior (Crossler &
Bélanger, 2006; Durndell & Haag, 2002; Fagan et al., 2003; R. D. Johnson & Marakas, 2000).
However, at times the measure has shown only limited success due primarily to its use outside

41
of the specific context for which it was designed (Marakas, Johnson, & Clay, 2007). As noted in
the preceding sections, self-efficacy is a highly context-specific construct and thus a single
measure will not necessarily transfer from one setting to another. Within the information
security domain of IS research, self-efficacy has had its largest influence through its inclusion in
PMT.
In Rogers’ (1983) revision of PMT, he added the self-efficacy construct based on work
done by Bandura (1977). Subsequent empirical results showed a positive correlation between
self-efficacy expectancy and changes in behavior; Maddux and Rogers (1983) found that self-
efficacy had a significant influence on intentions to adopt the coping behavior (p. 476).
Furthermore, it proved to be the most powerful component in predicting behavioral intentions.
A meta-analysis of 18 PMT studies (N=2,568) with self-efficacy as a variable showed that
it had a medium effect size (d+=0.45) on behavioral intentions or behaviors, depending on the
study (Floyd et al., 2000, p. 416). Another observation they made was that the relationship
between self-efficacy and adaptive intentions or behaviors became stronger as the quality of
the study increased. Finally, self-efficacy has been shown to be a consistent and reliable
variable in research examining the information security behavior of individuals (Crossler &
Bélanger, 2010; Y. Lee & Larsen, 2009; Woon et al., 2005).
Affect
Information comes in various forms. The most commonly studied form in information
systems and security research has been cognitive. However, affect has been shown to be a
valuable form of information in many contexts. Trait affect is the type of affect that will be

42
examined in the current research. However, on a more fundamental level, why study affect in
the first place? Affect influences or alters how individuals perceive things.
These altered perceptions have an effect on the decisions people make (Curry &
Youngblade, 2006; Isen, 1984; E. J. Johnson & Tversky, 1983; C. A. Smith & Kirby, 2001; Waters,
2008). This may occur through affect’s influence on how people perceive risk, as well as how
people formulate their self-efficacy expectations related to a specific situation (Bryan & Bryan,
1991; DeSteno, Petty, Wegener, & Rucker, 2000; Gibbons, Gerrard, Blanton, & Russell, 1998;
Isen & Geva, 1987; Isen, Nygren, & Ashby, 1988; Isen & Patrick, 1983; Tiedens & Linton, 2001).
Earlier, I discussed the important role that constructs related to threat appraisal and coping
appraisal have had in understanding the information security behavior of home users.
Understanding the antecedents of these constructs is an important step in developing a more
complete understanding of the behavior of home users in the information security domain.
In the ensuing paragraphs I will discuss how affect has been approached in IS research,
the concept of affect and its relationship with the terms mood and emotion, the specific type of
affect under investigation in the current research, the constructs of interest in the current
research, and affect’s relationship with risk perception and self-efficacy constructs.
Affect in Information Systems Research
The information systems domain is complex and multifaceted. Several different
approaches have been taken to understanding everything from computer adoption to network
infrastructure. Although rationally based theoretical approaches have reigned supreme, there
has long been recognition within IS research that there are other possible explanations for use,
adoption, and behavior, as evidenced by more than 50 papers (as of 2006) exploring affect in

43
this domain (Sun & Zhang, 2006). Intuitively, this makes sense. It is easy to think of someone
who is scared of technology in general and computers in particular. Early research confirmed
this technophobia (Hellman, 1976), while later studies sought to examine more closely the
relationship between attitudes and computer use.
Although research with affect has been done in IS research, there has been a significant
lack of consistency in what is meant by affect and how it should be measured. A few of the
ways it has been conceptualized within this research includes microcomputer playfulness
(Webster & Martocchio, 1992), perceived enjoyment (Davis, Bagozzi, & Warshaw, 1992), flow
(Trevino & Webster, 1992), computer anxiety (Coffin & MacIntyre, 1999), and attitude toward
using IT (Davis, 1989).
There have been several different theoretical approaches used within IS research that
have employed an affect type construct. For example, the Theory of Reasoned Action (TRA), the
Theory of Planned Behavior (TPB), and the Technology Acceptance Model (TAM) all include a
construct that assesses an individual’s attitude towards a behavior (Fishbein & Ajzen, 1975, p.
381). Attitudes consist of the beliefs about a specific behavior and are weighted by evaluations
of these beliefs. These attitudes may consist of some affective descriptors (e.g., happy), but
generally speaking they are far removed from what would be typically termed affect.
While some research has examined the role of affect on behavior in the IS domain in
general, less has focused on information security behavior in particular. An exception to this is a
study that examined social networking sites and the role affect has on the implementation of
security safeguards. Drawing on Social Capital Theory, Wu, Ryan, and Windsor (2009) employed
three social capital constructs – structural capital, relational capital, and cognitive capital – as

44
antecedents of affect towards social networking sites. Affect in their study was operationalized
in the same manner as by Compeau and Higgins (1995) – as a positive attitude toward a
technology. This study provides support for the underlying argument of the current study,
namely, that affect may help to explain the information security behavior of individuals.
As noted, affect has been used in IS research, but how the concept has been
operationalized has varied significantly. This is in part due to the highly context-specific use of
affect. Although this is important, there is still little we know about an individual’s affect in a
more general sense and what effect it has on decisions. The aim of this research is to be specific
in what is meant by affect and explore the role it has in decisions related to information
security behavior. This must start with a clear understanding of what affect is and how it will be
used in the current study, which will be discussed next.
Affect, Mood, and Emotion
Prior to exploring the various roles affect has in decision making, I will first examine
what is meant by the term affect. Within the literature, affect has come to mean several
different things and has often been used interchangeably with mood and emotion (Ekman &
Davidson, 1994; Isen, 1984; N Schwarz & Clore, 1996; Waters, 2008). While this is
understandable in one respect since they are all interrelated concepts, it also poses significant
difficulties for the study of affect as it makes it inherently difficult to compare studies, let alone
validate existing ones.
For purposes of this research, emotion can be characterized as a generally short-lived
and intense reaction to an event or stimulus, whereas mood is longer-lasting and milder in
degree (Isen, 1984). Both of the terms represent a type of affect and can be classified as

45
affective states (Waters, 2008; Watson & Tellegen, 1985). Affective states include: fear,
sadness, guilt, hostility, shyness, fatigue, surprise, joviality, self-assurance, attentiveness, and
serenity (Watson & Clark, 1994). However, they only represent a portion of the broader
concept of affect.
A couple of distinctions will make this clearer, including a discussion on trait and state
affect, as well as incidental and integral affect.
State vs. Trait Affect
Both emotion and mood are considered state affects. State affect fluctuates over time
and varies in intensity (Grös et al., 2007; Watson et al., 1988). Emotion, a short-lived type of
affect, will generally vary considerably over relatively short time periods. Emotion(s) may
ultimately become mood depending on the intensity, frequency, and overall context of the
experienced emotion(s).
On the other hand, trait affect represents a more stable and generally life-long type of
affect (Grös et al., 2007; Watson et al., 1988). In many respects, it can be considered part of
one’s personality. In fact, research has supported the close relationship between trait affect
and personality traits (Watson et al., 1988; Watson & Tellegen, 1985). Similar to personality,
trait affect changes very little over time. One way to further conceptualize the difference
between them is to think of trait affect as the baseline for state affect. An individual with a
generally positive trait affect is more likely to have a positive mood and experience emotions
that are also more positive.

46
Incidental vs. Integral Affect
In addition to the difference in persistence of affect noted above, affect also varies in
the degree to which it is related to the decision at hand. Incidental affect is a type of affect that
is not related to the current judgment or choice, but can influence it nonetheless (Lerner &
Keltner, 2000; N Schwarz & Clore, 1996). For example, an individual in a generally positive
mood (i.e., state affect) due to nice weather may make a decision congruent with this positive
mood (e.g., choosing a movie). Likewise, this positive mood will generally lead to more
favorable judgments with respect to risk and thus result in the underestimation of a negative
event occurring (E. J. Johnson & Tversky, 1983).
In contrast, integral affect is a type of affect that is relevant to the current judgment
(Lerner & Keltner, 2000; Waters, 2008). For example, the anticipation of regretting a decision,
such as a bet, has led to changes in how much one decides to bet (Larrick & Boles, 1995;
Loomes & Sugden, 1982). This has been termed anticipated emotions by Loewenstein et al
(2001), while anticipatory emotions include those immediate visceral reactions (e.g., fear). Both
anticipated and anticipatory emotions in this context are considered types of integral affect as
they are directly related and triggered by the current judgment or experience.
Affect in the Current Study
In the preceding paragraphs, distinctions were made between the different types of
affect. This included a discussion of where the concepts emotion and mood are situated within
the broader concept of affect. While both emotion and mood may be either incidental or
integral types of affect, both are considered types of state affect.

47
Exploring the role of trait affect on the risk perceptions of individuals in the information
security domain has several advantages over that of state affect. First, it is a broader
perspective that can help inform research on state affect. In fact, trait affect is correlated with
state affect (Watson et al., 1988; Watson & Clark, 1994); understanding the unique dynamics of
trait affect can lead to more focused research on state affect.
Second, trait affect is generally stable over time and context free (Watson & Clark, 1994;
Watson & Walker, 1996). Thus, measurements of affect would not have to occur on a frequent
basis in studies that include trait affect, which may particularly helpful in longitudinal studies.
This is especially important if the goal is to develop effective information security interventions
and/or training programs to help reduce adverse information security behavior.
Third, trait affect is not dependent on single affect-eliciting events (e.g., having ice
cream may make someone happy in the moment). That is not meant to imply that the impact a
single event may have on someone’s state affect is not valuable and informative; rather, given
the little that affect has been explored within the information security domain, simpler and
more consistent measures of affect are needed.
Thus, trait affect is a logical starting point for work examining the role of affect on the
information security behavior of home users. However, it is also important to specify the
specific constructs that will be used to encapsulate trait affect—this will be discussed next.
The Constructs of Affect: Positive Affect and Negative Affect
The predominant approaches taken in conceptualizing affect have been valence-based.
This includes affect as either positive or negative on a bipolar continuum (E. J. Johnson &
Tversky, 1983), and positive affect and negative affect as two distinct dimensions (George,

48
1989; Watson et al., 1988; Watson & Tellegen, 1985). The former approach has largely been
replaced by the latter in recent years due to its higher degree of convergent and discriminant
validity (Watson & Clark, 1997).
Positive affect is related to the frequency of pleasant events and satisfaction, whereas
negative affect is related to stress and poor coping (Watson et al., 1988). An individual with
high positive affect does not necessarily have low negative affect and vice versa as they are
largely independent dimensions. Thus, it is possible for an individual to have high positive affect
and high negative affect, simultaneously.
Likewise, it is important to note that I am not positing that affect can only be
conceptualized as varying amounts of positive or negative. Instead, the positive and negative
affect constructs represent the two higher order dimensions of affect, their valence; whereas,
specific types of affective states (e.g., angry) represent lower level components of affect
(Watson & Clark, 1994). Thus, it is possible (and has been shown) that these lower level
components of affect, even those with the same valence, will lead to different effects on
judgment (Lerner & Keltner, 2000, 2001).
Therefore, trait affect was approached in the current study as two distinct constructs—
trait positive affect and trait negative affect—while also acknowledging that there are other
intricacies of trait affect that cannot be fully captured by these two constructs. Given the early
stages of research in this context and domain, it is prudent to first establish the nature of the
relationships between trait affect and the other constructs. Once this has been done, the
further dissection of the particular components of either positive or negative affect that
contribute the most to these other constructs should be pursued. Trait affect, the higher order

49
dimensions positive affect and negative affect, the lower level dimensions, their descriptors,
and other factors associated with affect are represented in the table that follows.

50
Table 1: Trait Affect and its Association with Personality Traits and Observable Physical and Physiological Signs
Trait Affect High Order Dimensions (valence of mood descriptors) Positive Affect Negative Affect
Not Applicable
Lower Order Dimensions (content of mood descriptors) (Watson & Clark, 1994)
Joviality, Self-Assurance, Attentiveness
Fear, Hostility, Guilt, Sadness
Shyness, Fatigue, Serenity, Surprise
Descriptors (Watson & Clark, 1994) happy, joyful, delighted, cheerful,
excited, enthusiastic, lively, energetic, proud, strong,
confident, bold, daring, fearless, alert, attentive, concentrating,
determined
afraid, scared, frightened, nervous, jittery, shaky, angry, hostile, irritable,
scornful, disgusted, loathing, guilty, ashamed,
blameworthy, angry at self, disgusted with self,
dissatisfied with self, sad, blue, downhearted, alone,
lonely
shy, bashful, sheepish, timid,
sleepy, tired, sluggish, drowsy, calm, relaxed, at
ease, amazed, surprised, astonished
Observable Physical Signs (Buck, 1975; Frois-Wittman, 1930; Jenness, 1932; Schlosberg, 1941, 1952)
Facial expressions, gestures
Physiological Signs (Heponiemi, Elovainio, Näätänen, & Keltikangas-Järvinen, 2006; Polk, Cohen, Doyle, Skoner, & Kirschbaum, 2005)
Lower Levels of Cortisol
More pronounced parasympathetic, heart rate, and orbicularis oculi reactivity
Higher Levels of Cortisol
Higher corrugator supercilii responses
How World is Experienced (Watson, Clark, McIntyre, & Hamaker, 1992)
embrace life with energy
confidence
enthusiasm
enjoy company of others and will seek it out
confident in social interactions
seek out intense and exciting experiences
prone to experience negative moods
tend to be introspective
ruminative
prone to psychosomatic complaints
focus on undesirable and negative aspects of themselves, others, and the world
highly dissatisfied
high levels of stress with poor coping
Relationship to Personality Traits (Watson et al., 1992; Watson & Clark, 1994, 1997)
Extraversion Positive Temperament
Neuroticism Negative Temperament
Affect’s role on risk judgments will be discussed next.

51
Affect in Risk Judgments
While there is a lack of consensus on the specific mechanisms by which affect influences
risk decisions, there is nonetheless general agreement that this influence does exist (Bower,
1981; Clore et al., 2001; Finucane et al., 2000; Forgas, 1995, 2008; E. J. Johnson & Tversky,
1983; Kahneman, Slovic, & Tversky, 1982; Norbert Schwarz & Clore, 2003; Slovic et al., 2007).
One of the primary manners in which affect influences risk decisions is by the effect it has on
how individuals perceive risk. This is important given the significant body of research that
shows how people perceive risk, generally operationalized as perceived threat severity and
perceived threat vulnerability, has been one of the major determinants of risk behavior in
general (Floyd et al., 2000; Milne et al., 2000; Norman et al., 2005), and in information security
behavior in particular (Anderson & Agarwal, 2010; Crossler, 2010; Johnston & Warkentin, 2010;
Y. Lee & Larsen, 2009; Liang & Xue, 2010; Workman et al., 2008).
The primary mechanism through which affect influences risk perceptions is the
optimistic bias (Borkenau & Mauer, 2006; Helweg-Larsen & Shepperd, 2001; Lerner & Keltner,
2001; Rhee, Ryu, & Kim, 2005; Waters, 2008). Basically, those with a greater positive affect
(and/or lower negative affect) will make more optimistic judgments related to risk than those
with a higher negative affect (and/or lower positive affect). This is explained in part by the
priming mechanism of affect discussed in the preceding section. A few studies serve to further
illustrate this bias.
In an experiment involving a real risk-taking task using betting chips, Isen and Patrick
(1983) found that participants in the group with positive affect were more likely to engage in
low-risk behavior by betting more than those in the neutral affect group. Once the level of risk

52
increased, however, participants in the positive affect group were less likely to engage in the
risk task compared to the other group (p. 199). The authors noted that these findings are
consistent with earlier research suggesting that those who feel good will behave in a manner
that preserves that feeling (see Isen & Simmonds, 1978). Their second experiment had findings
contrary to this one, but this may have been due to the hypothetical nature of the risk scenario
in the second experiment compared to the first experiment that involved real betting (p. 200).
Other research using valence-based approaches have generally been consistent with the
findings of the first experiment (Isen & Geva, 1987; Isen et al., 1988). Additionally, research that
has gone beyond valence-based approaches has found that specific emotions and dimensions
of emotions (i.e., certainty) impact likelihood estimates as well (DeSteno et al., 2000; Druckman
& McDermott, 2008). Thus, affect has the potential to influence risk perceptions in several
different ways. The formation of risk perceptions are important given their role in decision
making. Likewise, self-efficacy has had a significant role in decision making in many different
contexts.
Affect and Self-Efficacy
The impact that affect has on self-efficacy is important given the role self-efficacy has
had as a construct in a majority of studies examining information security behavior. The
underlying principle is that the greater belief an individual has in being able to perform a task,
then the greater the likelihood the task will be performed. Within the information security
domain, this has been an important construct as it provides important insight on why certain
tasks are performed more than others. The additional role affect has on self-efficacy can

53
provide a greater understanding on why they have either high or low self-efficacy in the first
place.
In addition to affect having an effect on how decisions are evaluated, it has also been
shown to influence an individual’s self-efficacy. Bryan and Bryan (1991) induced positive mood
as part of an experimental manipulation and found that this resulted in higher self-efficacy for
older children (junior to high school students), but not for those younger.
Research employing PMT in understanding outpatient rehabilitation found that positive
affect was associated with higher levels of self-efficacy, whereas negative affect was associated
with lower levels of self-efficacy (Grindley et al., 2008). In a study examining wrestling
performance, Treasure, Monson, and Lox (1996) found similar results. Finally, research that
used pleasant scents to induce positive mood found that males had increased levels of self-
efficacy compared to a control group, while females did not (R. Baron, 1990).
Research Model
The research model that follows includes five constructs that act as determinants of the
information security behavior of home users. Two of these constructs account for an
individual’s risk perception—perceived threat severity and perceived threat vulnerability. These
two constructs have been used extensively in research that has used Protection Motivation
Theory (PMT) to examine behavioral intentions in situations that involve risk (Anderson &
Agarwal, 2010; Crossler, 2010; Floyd et al., 2000; Herath & Rao, 2009b; Johnston & Warkentin,
2010; Y. Lee & Larsen, 2009; Liang & Xue, 2010; Woon et al., 2005; Workman et al., 2008).
Additionally, similar constructs (deterrent severity and deterrent certainty) are found in

54
General Deterrence Theory (GDT) and have been used in research that has examined the
information security behavior of users in an organizational setting (Freeman & Watson, 2006;
Klepper & Nagin, 1989; Straub Jr, 1990). Thus, these constructs have been well-supported in
research that examines the information security behavior of individuals.
Additionally, the three constructs that account for coping appraisal in PMT—perceived
response efficacy, perceived response costs, and self-efficacy—have all been used extensively
and with great efficacy in research that has employed PMT as a theoretical model to
understand behavior in the wake of a threat (Floyd et al., 2000; Milne et al., 2000). Self-efficacy,
which considers an individual’s belief in being able to take measures to protect himself from an
information security threat, is a central component of the revised PMT (Maddux & Rogers,
1983; Rogers, 1983). Furthermore, it has played a pivotal role in explaining behavior as a
standalone theory and in several other models and theories (Bandura, 1977).
While the model itself is based on PMT with the additional components of trait positive
affect and trait negative affect, I did not measure behavioral intentions, which is a central
component of PMT (Rogers, 1975).
In the sections that follow, I first discuss the three types of information security threats
that were examined in the current research, the mediating constructs that influence one’s
information security behavior, and the role trait affect is hypothesized to have on these
constructs.

55
Information Security Behavior
The influence affect has on individuals may be highly context-specific and depend on
several factors (E. J. Johnson & Tversky, 1983; Larrick & Boles, 1995; Lerner & Keltner, 2000; N
Schwarz & Clore, 1996). Additionally, self-efficacy has also been shown to vary based on the
task under investigation (Bandura, 1977, 2006). This may explain in part why there have been
inconsistent findings with several of the constructs that have been used to understand
information security behavior (Floyd et al., 2000). Information security research has focused on
several different behaviors that are important in mitigating information security threats
(Anderson & Agarwal, 2010; Crossler, 2010; Johnston & Warkentin, 2010). The specific types of
threats under investigation have varied. However, in this research I examined three information
security threats that together threaten the confidentiality, integrity, and availability of
information for home users. These three threats include the loss of data and files, the
compromise of one’s personal information, and the performance compromise of one’s
computer. These three threats were explored in three separate models since the efficacy of the
model may vary based on the specific information security threats under examination.
The loss of data and files has long been recognized as an important information security
threat that home users should mitigate against (Aytes & Connolly, 2004; Crossler, 2010; Ng &
Rahim, 2005). Having data backed up can largely mitigate the loss of data through hardware
failure, file corruption, as well as malware infection. In addition to physical security, it is one of
the oldest types of information security threats that individuals and organizations try to
mitigate.

56
Likewise, the threat of one’s personal information being compromised has become
increasingly important, especially in light of the growth of social media (Fogel & Nehmad, 2009;
Nov & Wattal, 2009; D. Shin, 2010; Wu et al., 2009; Youn, 2005). Despite increasing concerns
related to how much personal information individuals share, a large percentage of people
continue to share a significant amount of personal information, including date of birth, location,
and relationship information. Combining this information with information from other sources
(e.g., public databases), it has become relatively easy for criminals to steal an individual’s
identity and cause significant financial and emotional harm. Thus, it is a significant information
security threat that warrants particular attention.
Finally, preventing the performance of one’s computer from being compromised by
malware and other sources has been examined in several studies on home users (Hu & Dinev,
2005; D. Lee et al., 2008; Y. Lee & Kozar, 2005; Liang & Xue, 2010). The challenge for many
individuals is that some of the solutions designed in part to mitigate the threat of computer
performance compromise may cause issues themselves with respect to computer performance
(Besnard & Arief, 2004; Menascé, 2003).
Next, I discuss the specific determinants of one’s information security behavior in the
wake of these three threats.
Determinants of Information Security Behavior
In PMT, threat appraisal occurs as a result of a fear appeal, which stems from
environmental and intrapersonal information. Threat appraisal consists of perceived threat
severity, perceived threat vulnerability, and rewards, both intrinsic and extrinsic (Maddux &

57
Rogers, 1983; Rogers, 1975). Perceived threat severity is the level of noxiousness elicited from a
fear appeal. There is a long line of research that has shown it to be a valuable determinant of
behavior (Floyd et al., 2000; Johnston & Warkentin, 2010; Y. Lee & Larsen, 2009; Leventhal &
Singer, 1966; Woon et al., 2005). Likewise, perceived threat vulnerability, the level of
susceptibility elicited from a fear appeal, has also been shown to be an important determinant
of behavior (Floyd et al., 2000; Leventhal et al., 1967).
Threat appraisal is believed to inhibit maladaptive responses, such as avoiding backing
up one’s data (i.e., avoidance) or convincing one’s self that there is no risk associated with
running a computer that does not have current anti-malware software installed (i.e., denial)
(Norman et al., 2005, p. 83). Therefore, it is expected that higher levels of perceived threat
severity and higher levels of perceived threat vulnerability are associated with higher levels of
information security behavior.
H1: Higher levels of perceived threat severity are associated with higher levels of
information security behavior.
H1a: Higher levels of perceived threat severity related to loss of data and files
are associated with higher levels of performing the tasks necessary to respond
effectively against this threat.
H1b: Higher levels of perceived threat severity related to personal information
compromise are associated with higher levels of performing the tasks necessary
to respond effectively against this threat.

58
H1c: Higher levels of perceived threat severity related to computer performance
compromise are associated with higher levels of performing the tasks necessary
to respond effectively against this threat.
H2: Higher levels of perceived threat vulnerability are associated with higher levels of
information security behavior.
H2a: Higher levels of perceived threat vulnerability related to loss of data and
files are associated with higher levels of performing the tasks necessary to
respond effectively against this threat.
H2b: Higher levels of perceived threat vulnerability related to personal
information compromise are associated with higher levels of performing the
tasks necessary to respond effectively against this threat.
H2c: Higher levels of perceived threat vulnerability related to computer
performance compromise are associated with higher levels of performing the
tasks necessary to respond effectively against this threat.
Coping appraisal is believed to increase the likelihood of an individual engaging in an
adaptive response (e.g., running back-ups of data) in order to mitigate a threat. It consists of
perceived response efficacy, perceived response costs, and self-efficacy. Higher levels of
perceived response efficacy and self-efficacy are believed to lead to greater levels of choosing
an adaptive rather than a maladaptive response (Maddux & Rogers, 1983; Rippetoe & Rogers,
1987; Rogers, 1983). However, if the perceived costs associated with an adaptive response are
high, then the individual is less likely to choose an adaptive response.

59
Therefore, it is expected that higher levels of perceived effectiveness in the responses
necessary to mitigate a threat are associated with a greater degree of performing these
responses.
H3: Higher levels of perceived efficacy related to the responses necessary to mitigate an
information security threat are associated with higher levels of performing these
responses.
H3a: Higher levels of perceived efficacy related to the responses necessary to
mitigate the loss of data and files are associated with higher levels of performing
these responses.
H3b: Higher levels of perceived efficacy related to the responses necessary to
mitigate one’s personal information from being compromised are associated
with higher levels of performing these responses.
H3c: Higher levels of perceived efficacy related to the responses necessary to
mitigate the performance of one’s computer from being compromised are
associated with higher levels of performing these responses.
Likewise, it is expected that higher levels of perceived costs related to the responses
necessary to mitigate an information security threat are associated with lower levels of
performing these responses.
H4: Higher levels of perceived costs related to the responses necessary to mitigate an
information security threat are associated with lower levels of performing these
responses.

60
H4a: Higher levels of perceived costs related to the responses necessary to
mitigate the loss of data and files are associated with lower levels of performing
these responses.
H4b: Higher levels of perceived costs related to the responses necessary to
mitigate one’s personal information from being compromised are associated
with lower levels of performing these responses.
H4c: Higher levels of perceived costs related to the responses necessary to
mitigate the performance of one’s computer from being compromised are
associated with lower levels of performing these responses.
An individual may go through the process of threat appraisal and determine that there is
a great likelihood (perceived threat vulnerability) that she will lose files critical to the work she
does (perceived threat severity). However, if she does not believe that she is capable of
preventing it through specific actions then she is unlikely to even attempt such actions. Self-
efficacy is the belief an individual can perform a behavior that is necessary to produce a given
outcome (Bandura, 1977). According to Bandura, “The strength of people’s convictions in their
own effectiveness is likely to affect whether they will even try to cope with given situations” (p.
193).
Self-efficacy has been used extensively in research examining behavior (Bandura, 1977,
1982, 1986; D. R. Compeau & Higgins, 1995; Maddux & Rogers, 1983). It has been shown to be
an effective construct in helping researchers understand why individuals engage in some

61
behaviors, but not others. Therefore, it is expected that higher levels of information security
self-efficacy are associated with higher levels of information security behavior.
H5: Higher levels of self-efficacy related to the responses necessary to mitigate an
information security threat are associated with higher levels of performing these
responses.
H5a: Higher levels of self-efficacy related to the responses necessary to mitigate
the loss of data and files are associated with higher levels of performing these
responses.
H5b: Higher levels of self-efficacy related to the responses necessary to mitigate
one’s personal information from being compromised are associated with higher
levels of performing these responses.
H5c: Higher levels of self-efficacy related to the responses necessary to mitigate
the performance of one’s computer from being compromised are associated
with higher levels of performing these responses.
Affect as an Antecedent to Risk Perceptions
Research has shown that affect acts as a source of information (Bower, 1981; Clore et
al., 2001; Forgas, 1995, 2008; Norbert Schwarz & Clore, 2003) that leads to individuals
evaluating risk in a mood congruent manner (Borkenau & Mauer, 2006; Helweg-Larsen &
Shepperd, 2001; Lerner & Keltner, 2001; Rhee et al., 2005; Waters, 2008). Thus, individuals with
higher levels of positive affect are more likely to see risky situations in an optimistic manner. As
a result, they perceive something negative happening as less likely than those with lower levels
62
of positive affect. This results in decreased risk perceptions with respect to both perceived
threat severity and perceived threat vulnerability. Therefore, it is expected that higher levels of
trait positive affect are associated with lower levels of perceived threat severity and perceived
threat vulnerability.
H6: Higher levels of trait positive affect are associated with lower levels of perceived
threat severity.
H6a: Higher levels of trait positive affect are associated with lower levels of
perceived threat severity related to loss of data and files.
H6b: Higher levels of trait positive affect are associated with lower levels of
perceived threat severity related to one’s personal information being
compromised.
H6c: Higher levels of trait positive affect are associated with lower levels of
perceived threat severity related to one’s computer performance being
compromised.
H7: Higher levels of trait positive affect are associated with lower levels of perceived
threat vulnerability.
H7a: Higher levels of trait positive affect are associated with lower levels of
perceived threat vulnerability related to loss of data and files.
H7b: Higher levels of trait positive affect are associated with lower levels of
perceived threat vulnerability related to one’s personal information being
compromised.

63
H7c: Higher levels of trait positive affect are associated with lower levels of
perceived threat vulnerability related to one’s computer performance being
compromised.
Likewise, individuals with higher levels of negative affect are more likely to view the
world and situations in a pessimistic manner. As a result, these individuals view risky situations
in a negative manner and believe that their risks are higher than what they may actually be
based on objective evidence (Borkenau & Mauer, 2006; Helweg-Larsen & Shepperd, 2001;
Lerner & Keltner, 2001; Rhee et al., 2005; Waters, 2008). Therefore, it is expected that higher
levels of trait negative affect are associated with higher levels of perceived threat severity and
perceived threat vulnerability.
H8: Higher levels of trait negative affect are associated with higher levels of perceived
threat severity.
H8a: Higher levels of trait negative affect are associated with higher levels of
perceived threat severity related to loss of data and files.
H8b: Higher levels of trait negative affect are associated with higher levels of
perceived threat severity related to one’s personal information being
compromised.
H8c: Higher levels of trait negative affect are associated with higher levels of
perceived threat severity related to one’s computer performance being
compromised.

64
H9: Higher levels of trait negative affect are associated with higher levels of perceived
threat vulnerability.
H9a: Higher levels of trait negative affect are associated with higher levels of
perceived threat vulnerability related to loss of data and files.
H9b: Higher levels of trait negative affect are associated with higher levels of
perceived threat vulnerability related to one’s personal information being
compromised.
H9c: Higher levels of trait negative affect are associated with higher levels of
perceived threat vulnerability related to one’s computer performance being
compromised.
Affect as an Antecedent to Self-Efficacy
Additionally, individuals with higher levels of positive affect are more likely to think
optimistically with respect to their ability to perform a specific task and be successful in a given
situation (R. Baron, 1990; Bryan & Bryan, 1991; Grindley et al., 2008; Treasure et al., 1996). This
optimistic thinking leads to increased levels of self-efficacy compared to those with lower levels
of positive affect. Therefore, it is expected that higher levels of trait positive affect are
associated with higher levels of information security self-efficacy.
H10: Higher levels of trait positive affect are associated with higher levels of information
security self-efficacy.

65
H10a: Higher levels of trait positive affect are associated with higher levels of
self-efficacy related to the responses necessary to mitigate the loss of data and
files.
H10b: Higher levels of trait positive affect are associated with higher levels of
self-efficacy related to the responses necessary to mitigate one’s personal
information from being compromised.
H10c: Higher levels of trait positive affect are associated with higher levels of
self-efficacy related to the responses necessary to mitigate one’s computer
performance from being compromised.
Likewise, those with higher levels of negative affect are more likely to make pessimistic
evaluations in their ability to perform a task successfully. Therefore, it is expected that higher
levels of trait negative affect are associated with lower levels of information security self-
efficacy.
H11: Higher levels of trait negative affect are associated with lower levels of information
security self-efficacy.
H11a: Higher levels of trait negative affect are associated with lower levels of
self-efficacy related to the responses necessary to mitigate the loss of data and
files.
H11b: Higher levels of trait negative affect are associated with lower levels of
self-efficacy related to the responses necessary to mitigate one’s personal
information from being compromised.
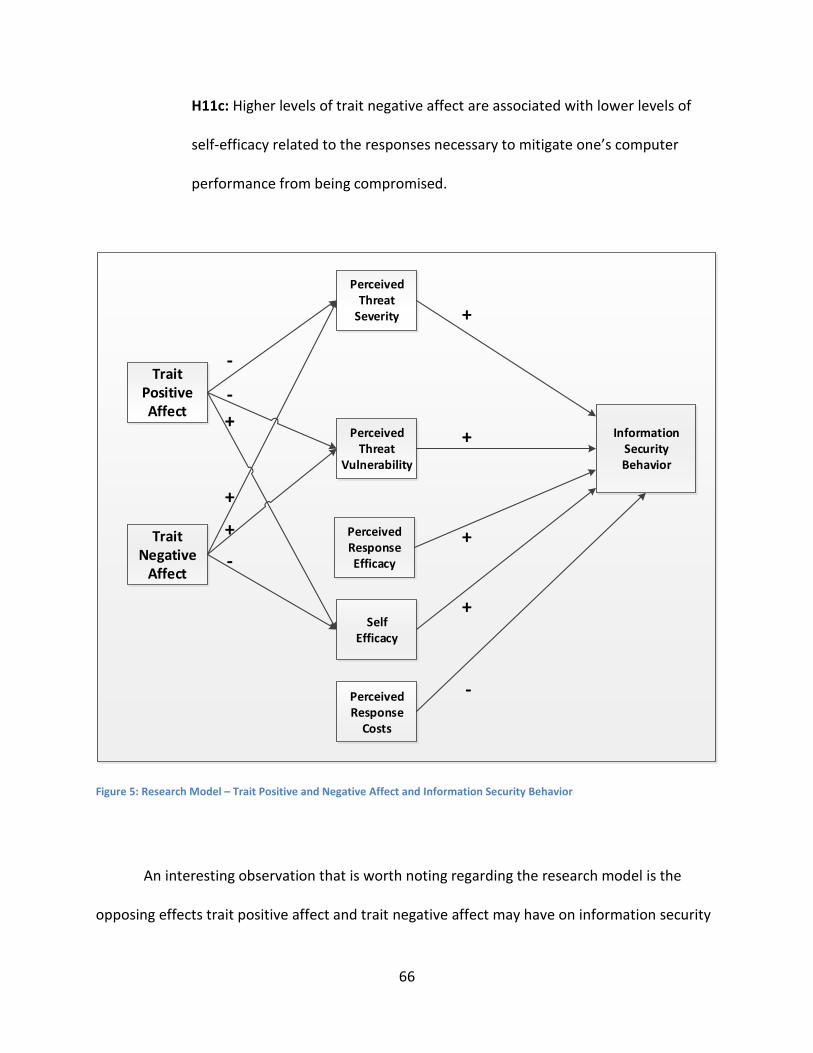
66
H11c: Higher levels of trait negative affect are associated with lower levels of
self-efficacy related to the responses necessary to mitigate one’s computer
performance from being compromised.
Information SecurityBehavior
Perceived Threat
Severity
Perceived Threat
Vulnerability
Trait PositiveAffect
-
-
-
+
Trait Negative
Affect
SelfEfficacy
+
++
+
+
Perceived Response
Costs
Perceived Response Efficacy
-
+
Figure 5: Research Model – Trait Positive and Negative Affect and Information Security Behavior
An interesting observation that is worth noting regarding the research model is the
opposing effects trait positive affect and trait negative affect may have on information security
67
behavior due to the effect they are hypothesized to have on the mediating variables. For
example, trait positive affect is hypothesized to lead to more optimistic risk perceptions. As a
result of the lower levels of perceived threat severity and perceived threat vulnerability, the
information security behavior of the individual will decrease. However, trait positive affect is
hypothesized to increase the level of self-efficacy, which in turn increases the information
security behavior of the individual.
Although this seems counterintuitive, it is not necessarily the case that the impact of
trait positive affect will be equal for all three of the mediating variables. The degree to which
each of the mediating variables is impacted by trait affect may very well depend on the specific
information security threats under examination. Thus, three separate models representing the
three different information security threats may inevitably have very different results.
Conclusion
In this chapter, I discussed Protection Motivation Theory (PMT) and its role in helping
explain the information security behavior of home users. In particular, two constructs that
represent an individual’s risk perception were closely examined—perceived threat severity and
perceived threat vulnerability. This was followed by a discussion on the three components of
coping appraisal: perceived response efficacy, perceived response costs, and self-efficacy. Next,
I discussed the concept of affect, the extent to which studies employing affect as a concept
have been lacking, and the specific type of affect that was investigated in the current research.

68
Finally, I presented the research model that was used for this research, including a justification
for examining three specific information security threats.
In the next chapter, I discuss the methodology that was used to explore this research
model.

69
Chapter 3: Methodology
Introduction
This study explored the role trait affect has with the information security behavior of
home users. I accomplished this through the development of three new survey instruments
designed to measure the information security behavior of home users. These three new
instruments were administered with other previously validated instruments in three separate
surveys. Information security behavior in the current study consists of the responses necessary
to combat three specific threats: computer performance compromise, personal information
compromise, and loss of data and files.
The model that was tested included two constructs—trait positive affect and trait
negative affect—hypothesized to act as antecedents to three independent variables—
perceived threat severity, perceived threat vulnerability, and self-efficacy. These three
constructs, along with perceived response efficacy and perceived response costs, are
hypothesized to have a direct causal relationship with the information security behavior of
home users. Whereas trait positive affect and trait negative affect are hypothesized to have
only an indirect effect on the dependent variable for each of the three models.
This chapter describes how the previously developed hypotheses from Chapter Two
were tested. The general research model represents the three specific research models for
each of the information security threats. The general hypotheses follow:

70
H1: Higher levels of perceived threat severity are associated with higher levels of
performing the responses necessary to mitigate the threat.
H2: Higher levels of perceived threat vulnerability are associated with higher levels of
performing the responses necessary to mitigate the threat.
H3: Higher levels of perceived efficacy related to the responses necessary to mitigate an
information security threat are associated with higher levels of performing these
responses.
H4: Higher levels of perceived costs related to the responses necessary to mitigate an
information security threat are associated with lower levels of performing these
responses.
H5: Higher levels of self-efficacy related to the responses necessary to mitigate an
information security threat are associated with higher levels of performing these
responses.
H6: Higher levels of trait positive affect are associated with lower levels of perceived
threat severity.
H7: Higher levels of trait positive affect are associated with lower levels of perceived
threat vulnerability.
H8: Higher levels of trait negative affect are associated with higher levels of perceived
threat severity.
H9: Higher levels of trait negative affect are associated with higher levels of perceived
threat vulnerability.

71
H10: Higher levels of trait positive affect are associated with higher levels of information
security self-efficacy.
H11: Higher levels of trait negative affect are associated with lower levels of information
security self-efficacy.
The organization of this chapter follows. The first section discusses the use of a survey
to test these hypotheses. Next, I discuss the specific procedures that were used in this research.
Then, I examine the different data analysis procedures that were used. Finally, I discuss any
ethical considerations that were taken into account.
Justification for the paradigm and methodology
There are two sets of variables that were measured in this research: 1) dependent
variables, and 2) independent variables. The dependent variables consist of the information
security responses necessary to mitigate three threats identified in the literature and through
expert panel review: loss of data and files, personal information compromise, and computer
performance compromise. The independent variables consist of trait positive affect, trait
negative affect, perceived response costs, perceived response efficacy, perceived threat
severity, perceived threat vulnerability, and self-efficacy.
An important consideration in measuring these variables is determining the most
effective method to employ. One approach may involve the use of qualitative methods to
further explore these issues. Qualitative methods are particularly useful when there is little
72
known about a group or population regarding a certain topic of interest (Creswell, 2007, p. 40).
This allows the researcher to draw fine distinctions between different types of behavior rather
than being limited to a predetermined number of classifications. Additionally, outliers, that may
be important in big picture terms, receive attention that they generally will not get in strictly
quantitative approaches. Methods such as case study, ethnography, grounded theory, narrative
research, and phenomenology are used in qualitative research (Creswell, 2007). While there are
inherent advantages to these methods, there are also important disadvantages. For example,
the lack of specific classifications and generally smaller sample sizes makes it difficult for the
researcher to generalize findings from a strictly qualitative study to the larger population of
interest (Babbie, 1998). Additionally, the collection and subsequent analysis of data can be time
prohibitive, depending on the particular questions that are being explored.
Although this research has an exploratory component to it, the hypotheses developed in
Chapter Two are based on established theories, empirical data, and inferred relationships
between the constructs based on the literature. Thus, while six of the hypotheses have not
been tested within the current context, the relationships hypothesized are reasonable. Thus,
the main advantages that qualitative modes of inquiry provide the researcher are less
advantageous for the current study, while the disadvantages remain. Depending on the results
of the current study, it may be advantageous to use qualitative methods in a future study so
that more detailed information may be garnered about any key findings found here. A more
focused study involving qualitative methods would mitigate some of the disadvantages of
performing a qualitative study in the current context.

73
There are various quantitative methods that may provide rich data for the variables
included in this study. For example, an experiment generally provides a great level of internal
validity and causal control (Babbie, 1998). However, not all relevant data for the current study
can be collected through an experiment alone. Additionally, while there is generally high
internal validity, external validity is often lacking due to the contrived nature of most
experiments (Easterby-Smith, Thorpe, & Jackson, 2008). Social desirability effects must also be
considered in experiments. This is particularly true for the current study in which an individual’s
security behaviors, trait positive affect, and trait negative affect are all examined closely. The
issue of how data on these variables can effectively be collected through an experiment is also
a significant concern. One approach that could possibly mitigate this issue would be to combine
an experiment with one or more survey instruments. However, given the complexity of the
hypotheses being tested and the amount of data necessary to test the relationships between
the constructs, an experiment may not provide enough data to conclusively demonstrate
certain relationships exist or do not exist. Thus, the threat for both Type I and Type II errors
increases significantly.
Based on the above, the most effective approach is to employ one or more surveys. The
advantage of using surveys is that it is relatively simple to collect a significant amount of data
about several variables at once (Rea & Parker, 1997; Sills & Song, 2002). This allows for greater
representation of the population of interest, which generally improves external validity (Babbie,
1998). Furthermore, once relationships between variables have been established, experiments
and various qualitative methods may be used to further understand the nature of these
relationships and test for causality. If these other methods were to be done either first or
74
concurrently with the use of surveys, it would dilute their power as data would be collected
about relationships that perhaps do not exist. The use of surveys in the current context will
allow the researcher to determine what relationships should be examined more closely using
other methods in subsequent research and which ones should not.
Similar to experiments and other methods, in surveys there is a risk of social desirability
effects due to respondents feeling compelled to answer questions in a manner consistent with
their perception of societal norms (Tourangeau et al., 2000, p. 257). While it is generally not
possible to fully eliminate such effects, there are approaches that can be used to help mitigate
said effects. For the current study, survey responses were anonymous and respondents had no
prior relationship with the researcher. This was achieved by using Amazon’s Mechanical Turk
rather than email lists, word of mouth, postings on social networking sites, etc.
Finally, surveys have been used effectively in several studies in the short but rich history
of research examining the information security behavior of home users. Table 2 identifies some
of these studies.

75
Table 2: Survey-Based Research Examining the Information Security Behavior of Home Users
Author(s) and Year Sample Size Population Anderson & Agarwal, 2010 594 Home Users
Aytes & Connolly, 2004 167 Undergraduate Students
Crossler, 2010 112 Students and Home Users
Crossler & Bélanger, 2010 81 Graduate Students
Downs, Holbrook, & Cranor, 2007 232 Home Users
Furnell, 2008 32 16-17 year old Participants of a Security Workshop
Furnell, Bryant, & Phippen, 2007 415 Home Users
Furnell, Jusoh, & Katsabas, 2006 340 Home Users
Hu & Dinev, 2005 222 College Students and IS Professionals
LaRose, Rifon, Liu, & Lee, 2005 576 College Students
Y. Lee & Kozar, 2005 212 Internet Users
D. Lee, Larose, & Rifon, 2008 273 College Students
Liang & Xue, 2010 152 Business Students
Mannan & Van Oorschot, 2008 123 Advanced Users from a University Environment
Nov & Wattal, 2009 192 Flickr Users
Rhee, Ryu, & Kim, 2005 248 Working Master’s Students
Salisbury, Pearson, Pearson, & Miller, 2001 168 Undergraduate Students
Woon, Tan, & Low, 2005 189 Home Users
Wu, Sherry Ryan, & John Windsor, 2009 271 Business Students
Youn, 2005 326 High School Students
Research procedures
Participants were recruited to complete the survey by using Amazon’s Mechanical Turk.
The use of Amazon’s Mechanical Turk offers several advantages over other recruitment
methods (e.g., students, word of mouth, flyers, and electronic postings) and can be as valid as
these other approaches (Horton, Rand, & Zeckhauser, 2011). For example, turnaround time
can be quick and the cost per participant low when compared to other methods (Dupuis,
Crossler, & Endicott-Popovsky, 2012; Dupuis, Endicott-Popovsky, & Crossler, 2013; Horton et
al., 2011). Additionally, better representation of the United States population can be achieved
through such crowdsourcing techniques, especially when compared to recruitment from

76
undergraduate student populations and Internet message boards (Paolacci, Chandler, &
Ipeirotis, 2010). Finally, the quality of responses obtained from participants using Amazon’s
Mechanical Turk is generally high with only 4.17 percent of respondents failing a quality control
question in one study, compared to 6.47 percent and 5.26 percent for participants from a
university and Internet message board, respectively (Paolacci et al., 2010). The use of
crowdsourcing has increased in popularity and acceptance for these reasons and others (J.
Howe, 2006; Kittur, Chi, & Suh, 2008; Mahmoud, Baltrusaitis, & Robinson, 2012).
However, these crowdsourcing approaches do have some drawbacks. For example,
since the users are anonymous, quality control can be quite difficult. Some participants may be
“malicious workers” who are simply trying to finish the task to receive payment (Ipeirotis,
Provost, & Wang, 2010). While quality of responses is a concern using this method, it is far
from unique to this recruitment method. Nonetheless, two quality control questions with only
one possible correct answer—strongly disagree for one of the quality control questions and
strongly agree for the other—that were simple and obvious were added to the survey to check
for attention, quality, and engagement in the study. Participants that failed the quality control
questions had their data removed from further analysis. Additionally, Amazon’s Mechanical
Turk workers have an incentive to perform work accurately as inaccurate work can disqualify
them from future opportunities (Paolacci et al., 2010). Ultimately, as with most recruitment
methods, different motives and biases may enter the picture due to the use of this method of
recruitment.

77
The research itself consisted of three surveys, one for each of the information security
threats under examination. The goal was to obtain at least 310 usable responses per survey.
This was done to help mitigate the chance of Type II errors, as well as ensure a large enough
sample size for the number of paths in the model. As a rule of thumb, the sample size should be
at least ten times the largest number of structural paths or formative indicators to measure one
construct, whichever is largest (Joe F. Hair, Ringle, & Sarstedt, 2011). Since there are 11 paths in
the research model and no more than six formative indicators for any single construct, the
sample size should be at least 110. However, a power analysis should also be conducted to
make sure a large enough sample size is used. A meta-analysis of PMT indicates that the lowest
effect size out of the five independent variables used in the current study to measure PMT is
0.21 for perceived threat vulnerability (Floyd et al., 2000), which represents a low effect size
(Cohen, 1988). Perceived threat severity, self-efficacy, perceived response efficacy, and
perceived response costs had effect sizes of 0.48, 0.45, 0.55, and 1.05, respectively. Thus, using
conservative estimates that include a one-tailed significance level of 0.05 (all hypotheses are
directional), an effect size of 0.20, and a power of 0.80, the minimum sample size is 310 per
survey (Cohen, 1988; Ellis, 2010). Therefore, the sample obtained meets the minimum
threshold of 310.
The primary measurement tool used to examine positive and negative affect has been
the Positive and Negative Affect Schedule (PANAS) (Watson et al., 1988). PANAS has been the
primary measurement tool in large part due to the extensive reliability testing and validation of
this instrument (Waters, 2008). It has been used in a large number of studies to measure
positive affect and negative affect and the relationship between these constructs and other

78
constructs (Borkenau & Mauer, 2006; Curry & Youngblade, 2006; Fedorikhin & Cole, 2004;
Grindley et al., 2008; Lu, Xie, & Zhang, 2013; Ntoumanis & Biddle, 1998; Treasure et al., 1996;
Vasey, Harbaugh, Mikolich, Firestone, & Bijttebier, 2013; Watson & Walker, 1996).
The PANAS consists of 20 items with 2 scales: positive affect (10 items) and negative
affect (10 items) (Watson et al., 1988). Positive Affect consists of the descriptors active, alert,
attentive, determined, enthusiastic, excited, inspired, interested, proud, and strong. Negative
Affect consists of the descriptors afraid, scared, nervous, jittery, irritable, hostile, guilty,
ashamed, upset, and distressed. The instrument itself has been validated with several different
time instructions, including an instruction for participants to indicate how “you generally feel
this way, that is, how you feel on the average” (Watson et al., 1988, p. 1070). This time
instruction is designed to measure trait affect. In particular, trait positive affect and trait
negative affect, which is what the current research was concerned with measuring.
The measurement of trait positive affect and trait negative affect does not depend on
the specific threat under investigation nor the model being employed. However, the three
information security threats—loss of data and files, personal information compromise, and
computer performance compromise—had not been previously examined in the current
research model. Therefore, a systematic process was followed to ensure that the items were
measuring what they were meant to measure (i.e., construct validity) and that the questions
were clear and understood by participants. The process of developing the survey instrument to
measure the information security behavior of home users followed the recommendations from
Straub (1989) and Churchill (1979) and is discussed in the next chapter.

79
There were three separate research models for this study, one for each of the specific
information security threats previously identified (i.e., loss of data and files, personal
information compromise, and computer performance compromise). Figure 6 depicts the
general research model for this study.
Information SecurityBehavior
Perceived Threat
Severity
Perceived Threat
Vulnerability
Trait PositiveAffect
-
-
-
+
Trait Negative
Affect
SelfEfficacy
+
++
+
+
Perceived Response
Costs
Perceived Response Efficacy
-
+
Figure 6: Research Model – Trait Positive and Negative Affect and Information Security Behavior

80
Data Analysis Procedures
Data analysis is discussed in Chapter Five, but the procedures are worth noting here.
This begins with a discussion of construct types, which determines appropriate statistical
analysis techniques. I will follow this discussion with an examination of the statistical analyses
that were performed in this study.
Construct Types
In addition to testing the structural model connecting various latent variables, it is also
important to identify the measurement model, which links the indicators that can be measured
to the unobservable latent variables (Chin, 1998a). Measurement models may contain
reflective, formative, and multidimensional constructs, as well as any combination thereof
(Petter, Straub, & Rai, 2007). A measurement model consisting of solely reflective constructs is
a reflective model, whereas a model consisting of solely formative constructs is a formative
model. However, if a model contains even one formative construct then it is considered a
formative model (p. 625).
The indicators for reflective constructs are a reflection of the latent construct and thus a
change in the underlying construct will cause a change in the indicators (Jarvis, Mackenzie,
Podsakoff, Mick, & Bearden, 2003, p. 200; Petter et al., 2007, p. 625). The indicators for a
reflective construct should be highly correlated and interchangeable. Thus, while reliability
measures (e.g., Cronbach’s alpha) may decrease if an indicator is removed, construct validity
itself remains unchanged (Jarvis et al., 2003, p. 200) or may even improve (Petter et al., 2007, p.
626). Error terms for reflective constructs are found in the indicators, not the constructs
themselves.

81
In contrast, formative constructs are caused by the indicators and removing any single
one of the indicators may change the meaning of the construct (Jarvis et al., 2003, p. 201).
Additionally, internal consistency is not implied for the indicators in formative constructs and
may in fact be problematic (Petter et al., 2007, p. 626). Finally, measurement error is
considered at the construct level rather than within the indicators themselves.
Similar to formative constructs, multidimensional constructs contain more than one
dimension that can be measured using either reflective or formative indicators (Petter et al.,
2007, p. 627). From a conceptual standpoint, these various dimensions are grouped within a
single multidimensional construct because they each represent an important component of the
underlying latent construct. This is very similar to a regular formative construct except that
each dimension may contain indicators that are either reflective or formative as noted above.
Thus, the multidimensional construct may be caused by the various dimensions, but the
dimensions themselves either cause the indicators (reflect upon them) or are formed by them.
These distinctions are important since measurement model misidentification can lead to
both Type I and Type II errors (Petter et al., 2007, p. 625). Therefore, careful evaluation must
take place in determining the construct types being employed in a study, even previously
validated and classified constructs. For example, SEM (structural equation modeling) is a very
powerful tool used by researchers, but is not considered the most appropriate or efficient tool
for measurement models that contain constructs that are other than reflective in nature. In the
current study, careful analysis based on suggestions found in the literature was done regarding
the constructs being used in the measurement models (Chin, 1998a; Jarvis et al., 2003; Petter et

82
al., 2007). In particular, analyses contained in the research from which the current constructs
were adapted, showed the indicators to be highly correlated and interchangeable with
sufficient reliability, and loadings strongest for their own construct, rather than another
construct (Ng & Rahim, 2005; Watson et al., 1988; Witte et al., 1996). It has been determined
that all indicators for the independent variables are reflective, but each measurement model
also includes multidimensional aggregate constructs that are reflective first-order and
formative second-order. Additionally, the dependent variable for each of the three models is
formative first-order and formative second-order. Therefore, the measurement models are
considered formative.

83
Table 3: Construct-Indicator Framework
Construct Indicator Type Source
Trait Positive Affect
Indicate to what extent you have felt this way in general, that is, on the average.
Reflective Watson et al., 1988
Trait Negative Affect
Indicate to what extent you have felt this way in general, that is, on the average.
Reflective Watson et al., 1988
Threat Severity (3 threats)
I believe that [threat] is severe.
Reflective Witte et al., 1996 I believe that [threat] is serious.
I believe that [threat] is significant.
Threat Vulnerability (3 threats)
I am at risk for [threat].
Reflective Witte et al., 1996 It is likely that I will [threat].
It is possible that I will [threat].
Self-Efficacy
I feel comfortable [threat response] on my own.
Multidimensional aggregate;
reflective first-order, formative
second-order
Ng & Rahim, 2005 I am able to [threat response] reasonably well on my own.
I am able to [threat response] even if there was no one around to help me.
Response Costs
The costs of [threat response] outweigh the benefits. Multidimensional
aggregate; reflective first-
order, formative second-order
Milne, Orbell, & Sheeran, 2002
[Threat response] would cause me too many problems.
I would be discouraged from [threat response] as it would take too much time.
Response Efficacy
[Threat response] works in preventing [threat].
Multidimensional aggregate;
reflective first-order, formative
second-order
Witte et al., 1996 [Threat response] is effective in preventing [threat].
If I [threat response] I am less likely to [threat].
Information Security Behavior
Varies.
Multidimensional aggregate;
formative first-order, formative
second-order
New Instrument

84
Statistical Analyses
The measurement models used for this study included a combination of reflective and
formative multidimensional constructs. Therefore, we first examined the accuracy of the
models by first assessing the reliability or internal consistency of the reflective constructs. This
was done using Cronbach’s alpha. Based on multiple sources and operating under the premise
that the current research is considered basic research, the threshold for an acceptable
Cronbach’s alpha is 0.70 (Churchill, 1979; Churchill Jr. & Peter, 1984; Peterson, 1994). Thus, any
reflective constructs that do not demonstrate this level of reliability were not included in
further analyses.
Next, convergent and discriminant validity were assessed. It is important to evaluate
whether the indicators for one construct are more highly correlated with one another or with
another construct. If the indicators load the strongest on their own construct then they were
considered to have convergent validity. This was further tested by assessing the average
variance extracted (AVE) for each construct. According to Fornell and Larcker (1981), AVE
“measures the amount of variance that is captured by the construct in relation to the amount
of variance due to measurement error” (p. 45). If the AVE for a construct is below the 0.50
threshold, then the variance captured by the construct is less than what is due to measurement
error. As a result, such constructs would not be included in further analyses since the
convergent validity is placed into question; however, no such constructs were found in the
current study (p. 46).
If convergent validity is found for a construct, we must then determine whether there is
discriminant validity. This is accomplished first by using the AVE previously calculated.

85
According to Chin (1998), “the AVEs of the LVs should be greater than the square of the
correlations among the LVs, which indicates that more variance is shared between the LV
component and its block of indicators than with another component representing a different
block of indicators” (p. 321). If the construct passes this initial test for discriminant validity, then
it was further assessed by using the cross-loading method (p. 321). Discriminant validity was
accepted if the indicators and blocks of indicators do not load higher with other constructs than
the one they are intended to measure.
The multidimensional aggregate (reflective first-order, formative second-order)
constructs must be assessed using appropriate tools for this type of construct. In particular, this
meant examining the formative second-order component of the construct using tools
appropriate for formative constructs. This included using principal component analysis so that
the weightings for the measures can be examined (Petter et al., 2007). If an item is
nonsignificant, it may either be eliminated or kept to preserve content validity
(Diamantopoulos, 2006). Next, multicollinearity was assessed. For formative constructs, the
variance inflation factor (VIF) must be below 3.3 (Petter et al., 2007). If this condition is not
met, then there are several options available, including modeling the construct as one with
both formative and reflective indicators, removing items so long as content validity is
maintained, creating a composite index with correlated items, or converting the construct into
a multidimensional one. Finally, the formative constructs should be analyzed using appropriate
statistical techniques.

86
The constructs that yield acceptable results in the measurement models were further
assessed in structural models using SmartPLS version 2.0 (Beta) (C. Ringle, Wende, & Will,
2005), a partial least squares (PLS) structural equation modeling software package. PLS was
used in the current research since it is exploratory in nature given that the goal of this research
was to extend existing theories and identify key driver constructs (Joe F. Hair et al., 2011). This
allowed path coefficients to be estimated, which identify the strength of the relationships
between the independent and dependent variables. The model loadings and model weights
were examined for reflective and formative constructs, respectively (Petter et al., 2007).
Additionally, R-squared values were estimated, which identified the variance explained by the
independent variables. Finally, the hypotheses noted earlier were tested by calculating the t-
statistic (i.e., test statistic) for the path coefficients of the structural models.
Ethical considerations
Any research that involves human participants must carefully weigh the possible
benefits of the research against the possible harm that could be caused to the participants.
Survey research is generally considered low risk and usually qualifies for exemption unless
information is recorded in such a manner that the participants can later be identified and such
identification could place the participant at risk (Fowler, 1995, p. 163). In the current study, the
participants did not have any prior relationship or affiliation with the researcher. Additionally,
information was not recorded such that participants could later be identified. Each participant
was compensated $1.15, which was directly transferred to the participant’s account on

87
Amazon’s Mechanical Turk through an automated process that does not reveal any personal
information related to the participants. This compensation amount was chosen based on a pilot
study that yielded an average per survey response time of 11 minutes, 18 seconds. Therefore, a
per hour rate of over six dollars per hour helps ensure that responses are received in a timely
manner and that participants are compensated fairly for this type of work.
Furthermore, participants were informed of the purpose of the study, that they could
stop at any time in the process, and that they may skip questions they did not wish to answer.
Only adults in the United States were asked to participate. Finally, all of the data collected has
been password protected and kept on the researcher’s computer.
The current survey instruments and research procedures outlined herein have been
approved for exempt status by the University of Washington Human Subjects Division. This
exempt status is valid until 9/06/2017. The study number is: 43632.
Conclusion
This chapter outlined the methods that were employed for the current study. In
particular, three surveys were used to examine the indirect role of trait positive affect and trait
negative affect on the information security behavior of home users through their effect on
three independent variables—perceived threat severity, perceived threat vulnerability, and
self-efficacy.
88
Chapter 4: Survey Instrument Development
Introduction
Understanding the information security behavior of home users is a complex task that
requires careful planning and a thoughtful approach. One could simply develop a list of best
practices related to information security behavior and assume that those who engage in more
of these practices have superior information security behavior compared to those who do not.
However, this approach ultimately does not take into account the context of the behavior. This
may not be critical in all research that examines the information security behavior of home
users (e.g., Anderson & Agarwal, 2010), but in the current research it is considered important
given the different motivations that may come into play in response to varying threats.
Therefore, the approach employed here examines three significant information security threats
to home users and the responses necessary to mitigate these threats.
The use of threat response pairs is an effective way to account for varying contexts and
the approach employed here is similar to the one used by Crossler and Bélanger (2012) in their
examination of the responses necessary to protect one from the threat of losing data and files.
This involves first identifying a threat and then determining the response(s) necessary to
mitigate the threat. For example, one of the responses necessary to mitigate the threat of
losing one’s data and files may be keeping current backups of data.
Following the general guidelines from Churchill (1979) and Straub (1989), three new
survey instruments were developed to assess the responses necessary to protect individuals

89
from three different information security threats: loss of data and files, personal information
compromise, and computer performance compromise. These three threats were chosen based
on their potential to negatively impact the three primary areas of concern for information
security: confidentiality, integrity, and availability (Bishop, 2003, 2005; Gibson, 2011; Harris,
2013; R. Johnson, 2011).
The development of these three new survey instruments included an extensive
literature review, convening an expert panel review, pre-testing the resulting instruments, pilot
testing the revised instruments, and finally administration of the main study with slight
revisions made from the pilot study.
The remainder of this chapter describes the process employed, outcomes, and
associated statistical analyses. This begins with construct domain specification.
Construct Domain Specification
The first step in survey instrument development is specifying the domain of the
construct. For purposes of this research, an examination of the information security behavior of
home users, I begin by delineating the scope of the home user and their behavior. In particular,
the home user domain in this research is limited to an examination of the user behavior that
occurs outside of the traditional work environment (A. E. Howe, Ray, Roberts, Urbanska, &
Byrne, 2012).
90
Additionally, I am only concerned with home users’ behavior on their primary computer,
which can be defined as the computing device they use a majority of the time and that is not
owned or issued by their employer. It was important to specify a primary computer given the
number of individuals today who have more than one computing device they use on a regular
basis (Kobus, Rietveld, & van Ommeren, 2013). Admittedly, their use of secondary and tertiary
computing devices could make them vulnerable to certain threats; however, the significant
variability in the number and types of devices individuals own make it impractical to examine
this other behavior through the same survey instrument.
From a conceptual standpoint the instruments developed herein are concerned with the
responses necessary for a home user to effectively mitigate three different information security
threats: loss of data and files, personal information compromise, and computer performance
compromise. In other words, the three instruments are concerned with specifying the types of
information security responses that are required to ensure that these threats are minimized.
Thus, each of the instruments includes different dimensions of information security behavior
with each dimension representing a specific type of response (e.g., updating software) and with
each response consisting of one or more specific tasks (e.g., updating the OS, updating other
software). For example, one response that may be necessary to mitigate the threat of one’s
personal information from being compromised may be to use antimalware software. However,
this response may include several different tasks, such as keeping virus definitions current,
having scans performed automatically, etc.

91
The more tasks and thus responses performed by the individual then the lower the
associated risk from a given threat. While some of the tasks are related to one another, as are
the responses, they are all considered necessary in order to effectively mitigate a specific
threat. Therefore, the model employed here is considered formative first-order, formative
second-order (Becker, Klein, & Wetzels, 2012; Diamantopoulos, Riefler, & Roth, 2008; Jarvis et
al., 2003; Petter et al., 2007; Wetzels, Odekerken-Schröder, & Van Oppen, 2009).
Finally, some responses to information security threats are dichotomous—users either
perform the response or they do not. Other responses may be more convoluted than this, such
as password usage. For example, in one sense a password is either used or not; however, in
many instances this may not be an option. What may be more important is how a password is
used: changed frequently, complex, difficult to guess, etc. Regardless of whether the potential
responses are simple or perhaps more intricate, home users often do not know what
information security tasks they perform versus those they do not (Adams & Sasse, 1999;
Dhamija, Tygar, & Hearst, 2006; Furnell et al., 2007, 2006; Liang & Xue, 2010; Woon et al., 2005;
Youn, 2005). For example, a firewall is an incredibly important tool that can help mitigate many
different types of threats. However, many of these types of tools are too complex for the
average user to understand, let alone know whether or not they are using it. In some instances,
a firewall may be included as part of the operating system, while in other instances this may not
be true. Users may not know for sure, but may have an idea that can be expressed as a certain
level of confidence.

92
Therefore, the current study examines the degree they believe they perform certain
tasks by using a 5-point Likert scale. This allows for participants to indicate a certain level of
certainty and uncertainty in their responses in accordance with their actual knowledge of their
behavior. Research that has used Likert scales to represent an individual’s uncertainty have
largely involved general information security questions (e.g., Anderson & Agarwal, 2010) or had
only a narrow focus (e.g., Liang & Xue, 2010; Shin, 2010), while those that have developed
comprehensive survey instruments with greater granularity have employed questions that did
not provide as much opportunity for this lack of certainty (e.g., Crossler & Bélanger, 2012).
Therefore, the goal of these instruments is to capture both the uncertainty and granularity
related to the information security behavior of home users.
Next, I discuss the generation of items for the survey.
Samples of Items Generation
Literature Search
The next step in developing a survey instrument is the generation of items to be
measured. This involved two distinct components: literature search and the convening of a
subject matter expert panel. The goal of the literature search was to identify existing
instruments and measures specific to home users and related to information security responses
necessary to mitigate the three threats previously identified. Fourteen information security
responses were identified through this search with one of them being removed (i.e., use of

93
pop-up blocking software) after the expert panel review. The final versions of the thirteen
remaining responses are noted in Table 4.
Table 4: Results of Literature Search
Information Security Response Source(s)
Backup Data and Files (Aytes & Connolly, 2004; Crossler & Bélanger, 2010; Ng & Rahim, 2005)
Computer Maintenance (Crossler & Bélanger, 2010)
Educate Others in Home (Crossler & Bélanger, 2010)
Information Sharing Selectivity (Fogel & Nehmad, 2009; D. Shin, 2010; Youn, 2005)
Network of Friends/ Connections Selectivity (Fogel & Nehmad, 2009; D. Shin, 2010; Youn, 2005)
Password and Username Usage (Crossler & Bélanger, 2010; Yan, Blackwell, Anderson, & Grant, 2005)
Scan Computer for Malware (Crossler & Bélanger, 2010; Furnell et al., 2006; Johnston & Warkentin, 2010; Ng & Rahim, 2005)
Setup Computer Permissions (Crossler & Bélanger, 2010)
Setup Wireless Network Securely (Crossler & Bélanger, 2010; Klasnja et al., 2009; Woon et al., 2005)
Software Updates (Crossler & Bélanger, 2010; Furnell et al., 2006)
Use Caution When Following Links in Email (Crossler & Bélanger, 2010; Dhamija et al., 2006; Downs et al., 2007)
Use Caution When Providing Personal Financial Information
(Cazier & Medlin, 2006; Crossler & Bélanger, 2010; Mannan & van Oorschot, 2008)
Use Firewall (Crossler & Bélanger, 2010; Furnell et al., 2006)
The above information security responses each consist of one or more indicators that
are measured on a 5-point Likert agreement scale (e.g., “I am confident that I have a firewall
enabled for my primary computer.”). After an exhaustive search on the various information
security responses necessary to mitigate the numerous threats, a subject matter expert panel
was convened.

94
Subject Matter Expert Panel Review via the Delphi Technique
Individuals were considered subject matter experts if they engaged in information
security work more than 50% of their day, whether it was work in industry, government,
military, teaching, private consulting, or research. Participants were recruited from the Anti-
Phishing Working Group (APWG) listserv (N=10) and through qualifying questions using
Amazon’s Mechanical Turk (N=9); they had an average of 15.1 and 7.6 years of experience
within information security, respectively. A majority of the respondents were from the United
States with each major geographic region represented. Other respondents were from Asia,
South America, and Europe. Approximately two-thirds of the respondents were male. Several
different sectors were represented, including the military, academia, private industry, and
public industry.
The Delphi technique was used for the subject matter expert portion of survey
development (Boulkedid, Abdoul, Loustau, Sibony, & Alberti, 2011; Dalkey & Helmer, 1963;
Duffield, 1988; Hasson, Keeney, & McKenna, 2000; Powell, 2003), which has been used in the
past for expert panel review in instrument development within information systems research
(Aladwani & Palvia, 2002). This included a slight modification in that participants were not
provided with individualized surveys that contained their prior responses during the second and
third rounds of review. Due to both privacy concerns and practical considerations, this
modification was considered necessary. Nonetheless, participants were encouraged to print out
their responses after each round in order to mitigate this modification.
The goal of the Delphi technique is consensus; however, what is meant by consensus
varies significantly from one study to the next (Powell, 2003). Therefore, it is important for

95
researchers to specify what is meant by consensus in each study that employs the technique. In
the current study, consensus was considered met if 75% or more of the participants were in
agreement. This level of agreement was chosen based on the desire to balance other consensus
thresholds, such as 51% and 100%. Additionally, the 75% level is of historical significance in
consensus decision making by the Iroquois Confederacy Grand Council and may date back to
possibly the 12th century AD (Keesler & Keesler, 2008).
While consensus is the goal, it does not happen immediately. Several rounds are
employed in which the survey instrument is transformed from one with very open-ended
questions to a final instrument (Hasson et al., 2000). The number of rounds necessary for this to
take place may vary significantly, but generally speaking three rounds is considered a good
balance between participant fatigue and additional movement toward consensus. In the
current study, three rounds were utilized.
The first round consisted of a survey instrument that had open-ended questions for
each response and threat-response pairing. Initial measurement items (i.e., indicators) for each
of the responses were provided based on the literature search, but participants were asked to
validate the adequacy of indicators for each response and suggest new and/or modified ones, if
necessary. Additionally, participants were asked to determine which responses were necessary
for each of the three threats. Since this was the first round, they were given three options:
necessary responses, not sure if these responses are necessary, and unnecessary responses.
Using the Qualtrics survey platform, participants moved each of the responses into one of those
three categories for each of the three threats.

96
Several changes were made based on the results from the first round. This included
wording changes to make the items clearer, modifications to some of the items, and additional
measurement items added. One such change involved rewording an item designed to gauge the
level of caution in providing credit card information online to one that measured personal
financial information more broadly. No items were deleted after this round as it is generally
considered important to limit the removal of items when it is still early in the process (Duffield,
1988; Hasson et al., 2000; Powell, 2003).
Additional refinements were made after the second round, including consolidation of
some items and the separating of others that were considered confusing. The third and final
round was concerned primarily with quantitative ratings of the items, although there was still
some room for comments at the end of each of the two major sections (i.e., responses and
their indicators, threat-response pairs) of the instrument. Also, participants were limited to
choosing either necessary responses or unnecessary responses for the section that contained
the threat-response pairs. Only those items that met the 75% consensus threshold were
included in the survey instrument. While the response related to home users employing pop-up
blocking software on their computers was considered a good response, it did not meet the 75%
threshold for any of the threats. The threat-response pairs are provided in Table 5, as well as
the number of indicators for each response.

97
Table 5: Threat-Response Pairs
Threats and their Associated Responses Number of Indicators
1. Computer Performance Compromise 10 indicators
Computer Maintenance 2 indicators
Scan Computer for Malware 3 indicators
Software Updates 4 indicators
Use Firewall 1 indicator
2. Personal Information Compromise 26 indicators
Educate Others in Home 1 indicator
Information Sharing Selectivity 5 indicators
Network of Friends/ Connections Selectivity 2 indicators
Password and Username Usage 6 indicators
Scan Computer for Malware 3 indicators
Setup Wireless Network Securely 2 indicators
Use Caution When Following Links in Email 3 indicators
Use Caution When Providing Personal Financial Information 3 indicators
Use Firewall 1 indicator
3. Loss of Data and Files 11 indicators
Backup Data 4 indicators
Educate Others in Home 1 indicator
Scan Computer for Malware 3 indicators
Setup Computer Permissions 2 indicators
Use Firewall 1 indicator
Pretest, Part 1: Initial Technical Review
The first part of pretesting involved a review by 10 academics that engage in survey
research, including both PhD students and faculty at various professorial ranks. The primary
concern during this step of pretesting was survey item construction. In other words, were the
items written in a clear and unambiguous manner, while adhering to general principles related
to the structure of survey question items (Krathwohl, 2004)?
Several changes were made, including limiting the length and complexity of some of the
items. A few of the items were made more general, while a few others were broken into two or

98
three separate questions. Finally, it was pointed out that a few of the responses appeared more
Windows operating system specific and thus did not make sense for Mac owners or those that
ran Linux-based operating systems (e.g., Ubuntu). These responses were modified such that
they would only be included if the participant indicated in a filter question that her primary
computer used the Windows operating system.
Changes were made to several questions, but these changes involved structure rather
than substance. Thus, the results of the subject matter expert panel review were not altered in
any meaningful way.
Pretest, Part 2: Potential Participant Review via Cognitive Interviews
Next, I interviewed several individuals who were representative of potential
participants. Although it is important for the items to be worded in a clear manner, the
previous review was limited to structure and syntax. In order to assess the viability and clarity
of the questions to potential participants, cognitive interviews were conducted with 15
individuals. These individuals were not graduate students, did not have advanced degrees, and
did not work in or have more than average knowledge of information security matters. In other
words, they represented the average survey participant.
The general process employed for this part of pretesting was based on the cognitive
interviewing process commonly used in research (Housen, 2008; Rosal, Carbone, & Goins,
2003). The participants were provided with a copy of the survey instrument and asked to
describe their interpretation of each of the questions. When it became apparent a question was
unclear or confusing to a participant, notes were taken so that they could be compared with

99
the other cognitive interviews. Ultimately, some minor changes were made to a few of the
items. Additionally, one of the participants mentioned that she was unsure what was meant by
encryption. In the next iteration of the survey instruments a simple definition of encryption was
included.
Pretest, Part 3: Final Technical Review
The final part of pretesting involved another technical review. The composition of the
participants for this review consisted of a similar number of academics as the first part of
pretesting, including an equal split between PhD students and faculty members in the
professorial ranks. This was an opportunity for other academics to identify issues that perhaps
were not noticed previously. Likewise, since some minor changes were made during the second
part of pretesting, this final technical validation provided a review of the items that might have
been reworded slightly.
As would be expected in a third round of pretesting, only a couple of very minor
changes were made.
Data Collection – Part 1: Pilot Study
After the extensive development and review stages outlined above, I conducted a pilot
study to ascertain the viability of the measurement items. Participants were recruited from
Amazon’s Mechanical Turk and provided with 50 cents compensation that was automatically
deposited into their account. They clicked on a URL that took them to the survey. Within the
survey instrument itself, they were randomly assigned to complete one of the three survey

100
instruments developed herein. Included in each of the three surveys was a quality control
question: “I am able to fly a car to the moon right now if I wanted to.” Only those that passed
the quality control question by indicating “strongly disagree” were included in the data analysis
portion. The completion statistics for each of the three survey instruments are noted in Table 6,
including the number of rejections (those that failed the quality control question):
Table 6: Pilot Study Completion Statistics
Instrument Number Rejections Rejection Rate Final Number
Computer Performance Compromise 109 12 11% 97
Personal Information Compromise 91 14 15.4% 77
Loss of Data and Files 104 12 11.5% 92
Total 304 38 12.5% 266
The main issue that surfaced during the pilot study outside of the items themselves was
that the compensation rate may have been too low based on the amount of time that was
required to obtain the responses in comparison to prior studies (Dupuis et al., 2012, 2013).
Possibly as a result, participants failed to submit responses to the longer survey at a
disproportionate rate compared to the other two shorter surveys. Thus, the final number for
the Personal Information Compromise survey is lower than that of the others. Therefore, I
decided to increase the compensation level for the main study to mitigate these two issues.
Measure Purification
In addition to the compensation issue discovered in the pilot study, there were a few
adjustments made to the measurement items themselves. This included an examination of
items that contained excessive verbiage, distinguished between manually performing a task

101
and the task configured to be performed automatically, and slight rewording of other reflective
indicators that showed a lower reliability than what would be expected. The number of
indicators was reduced as a result for both the Computer Performance Compromise and Loss of
Data and Files surveys; the number of indicators did not change for the Personal Information
Compromise survey. These results are illustrated in Table 7.
Table 7: Threat-Response Pairs Revised
Threats and their Associated Responses Number of Indicators
1. Computer Performance Compromise 7 indicators
Computer Maintenance 1 indicator
Scan Computer for Malware 3 indicators
Software Updates 2 indicators
Use Firewall 1 indicator
2. Personal Information Compromise 26 indicators
Educate Others in Home 1 indicator
Information Sharing Selectivity 5 indicators
Network of Friends/ Connections Selectivity 2 indicators
Password and Username Usage 6 indicators
Scan Computer for Malware 3 indicators
Setup Wireless Network Securely 2 indicators
Use Caution When Following Links in Email 3 indicators
Use Caution When Providing Personal Financial Information 3 indicators
Use Firewall 1 indicator
3. Loss of Data and Files 9 indicators
Backup Data 2 indicators
Educate Others in Home 1 indicator
Scan Computer for Malware 3 indicators
Setup Computer Permissions 2 indicators
Use Firewall 1 indicator
Based on the results from the pilot study, discussions with colleagues, and a
reexamination of the data collected during the pretests and subject matter expert review

102
stages, a few indicators were removed. This was done in order to more accurately and
efficiently capture the degree to which a task is performed. The number of indicators for the
response Computer Maintenance went from two to one. Likewise, the number of indicators for
Software Updates was reduced from four to two. Finally, the number of indicators for the
response Backup Data decreased from four to two. The purified measurement items were used
in the main study, as was a greater compensation rate for participants.
Data Collection – Part 2: Main Study
The main study was conducted in a similar manner to the pilot study, but participants
from Amazon’s Mechanical Turk were compensated $1.15 rather than 50 cents. It is difficult to
directly compare the rejection rate between the studies since the quality control questions
were slightly different; the pilot study had a single quality control question, while the main
study had two quality control questions that specifically told them how to answer (e.g., “for this
question, please select agree.”). However, the increased compensation did appear to have a
significant effect on how quickly responses were received. In the main study, all of the
responses were received within a day when it took over a week for the pilot study, which had
only one third of the total number of participants. Additionally, there did not appear to be a
significant number of survey non-completions due to the length of the instruments. Thus,
anecdotally the increased compensation helped in a meaningful way with respect to both data
collection time and participant dropout rates. The completion statistics for the main study are
noted in Table 8.

103
Table 8: Main Study Completion Statistics
Instrument Number Rejections Rejection Rate Final Number
Computer Performance Compromise 377 24 6.37% 353
Personal Information Compromise 369 40 10.84% 329
Loss of Data and Files 374 48 12.83% 326
Total 1120 112 10% 1008
The number of participants sought for each survey was 310, which is based on an a
priori power analysis conducted for the research models tested in this research. These research
models employ both the instruments developed in this chapter for the dependent variable, as
well as theoretically derived independent variables. There were at least 326 responses for each
of the three survey instruments.
Next, I will discuss the validity assessment performed on the survey instruments.
Statistical Assessment and Analysis of Instruments
The measurement model is considered first-order formative, second-order formative;
therefore, the statistical assessment contained herein does not include traditional reliability
assessment techniques used for reflective items. The validity assessment of the instruments
consisted of several steps.
First, the measurement models of the instruments were assessed. This began with the
assessment of construct validity using principal component analysis in SPSS, version 19. The
number of components was determined a priori to represent the number of dimensions for
each of the three instruments. While traditionally components with Eigen values below 1.0 or

104
that do not meet the Scree plot criterion are not retained (J. Hair, Black, Babin, & Anderson,
2010), this criterion did not adequately apply to the current instrument given that some of the
dimensions consisted of single indicators. Varimax rotation was employed since high
multicollinearity among the indicators is not presumed. During this step all items were retained
to preserve content validity, which is considered especially important for formative models
(Bollen & Lennox, 1991; Petter et al., 2007).
Second, I tested for multicollinearity. High multicollinearity may suggest that some
indicators are reflective rather than formative or consideration should be given to removing
one or more indicators. This was tested by calculating the VIF using SPSS, version 19. The
general rule of thumb for formative indicators is to have VIFs below 3.3 (Diamantopoulos, 2006;
Petter et al., 2007).
Finally, the structural models of the instruments were analyzed using components-
based structural equation modeling. The software used for this analysis was SmartPLS version
2.0 (Beta) (C. Ringle, Wende, & Will, 2005). SmartPLS is a components-based (partial least
squares) structural equation modeling tool that is both easy to use and free for academic use.
The partial least squares approach to structural equation modeling is considered particularly
appropriate for this research given the inclusion of multiple dimensions, formative constructs,
and overall theory building that is taking place (Joe F. Hair et al., 2011; Joseph F. Hair, Ringle, &
Sarstedt, 2012; Lowry, Lowry, & Gaskin, 2014). This analysis consisted of examining the model
weights and assessing the R2 values for the latent constructs (Petter et al., 2007).

105
Given that the instruments are modeled as having formative first-order and formative
second-order constructs, it is important to analyze them using appropriate techniques since
there is not a direct approach to analyzing dimensions in partial least squares applications. The
approach used here follows the guidance provided by Becker et al. (2012) and Ringle et al.
(2012). In particular, I first model the dependent variable with the appropriate number of
distinct dimensions that are causal to the specific information security responses under
examination. Next, each of the dimensions has one or more formative indicators representing
the content domain for each of the instruments. Then, I include these same formative
indicators on the main (second-order) formative construct that represents the dependent
variable. This technique allows for latent variable scores to be calculated for each of the
dimensions.
Once the latent variable scores have been calculated, a new model is created that uses
these latent variable scores as formative indicators for the dependent variable. This new model
must include at least one or more paths with another construct. For the three instruments
developed here, I use models developed and data collected for the other component of this
research, which will be discussed in the next chapter. However, incorporating these other
components here allows for analysis of each of these instruments to take place, including path
coefficients, R2 score, and tests for significance (i.e., t-statistic) information.
All PLS analyses that were conducted included the following settings: use of mean
replacement for missing values, path weighting scheme as the weighting scheme, and initial
weights of 1.0. Likewise, calculations for significance testing utilized the bootstrapping

106
technique with mean replacement for missing values and 500 samples performed. Since this is
largely exploratory research with hypothesized relationships, significance levels are provided at
the α=0.10, α=0.05, and α=0.01 levels, one-tailed.
The analyses for each of the three instruments follow.
Computer Performance Compromise
The responses necessary to mitigate the threat of computer performance being
compromised consists of four dimensions with two of the dimensions consisting of single
indicators. Table 9 indicates good construct validity with this instrument for those dimensions
consisting of two or more indicators—malware and updates.
Table 9: Varimax Rotated Principal Component Matrix for Computer Performance Compromise
Indicator Component
1 2
Malware 1 .902 .182
Malware 2 .882 .126
Malware 3 .767 .246
Updates 1 .288 .793
Updates 2 .095 .884
Next, I assessed whether multicollinearity was an issue for any of the dimensions in this
instrument. All VIF values were below the 3.3 threshold and thus multicollinearity does not
appear to be a significant issue for this instrument (Diamantopoulos, 2006; Petter et al., 2007).
Table 9 and associated statistical analyses were concerned with the measurement
model; however, it is also important to assess the structural model. Table 10 provides these
results.

107
Table 10: PLS Analysis for Computer Performance Compromise
Dimensions & Indicators Path
Coefficients t-statistics
Path Coefficients
t-statistics
Computer Maintenance 0.291 2.240**
Maintenance 1
Scan Computer for Malware 0.155 1.170
Malware 1 0.513 1.809**
Malware 2 0.190 0.686
Malware 3 0.434 1.907**
Software Updates 0.247 1.856**
Updates 1 0.766 4.348***
Updates 2 0.370 1.835**
Use Firewall 0.623 5.476***
Firewall 1
CPC Responses: R2 = 0.560 * α = 0.10, 1-tailed; ** α = 0.05, 1-tailed; *** α = 0.01, 1-tailed
Overall, the instrument developed to measure the responses necessary to mitigate the
threat of computer performance compromise explains 56% of the variance in this model. While
some of the indicators were not statistically significant, they were all retained in order to
maintain content validity.
Personal Information Compromise
The responses necessary to mitigate the threat of one’s personal information being
compromised consists of nine dimensions with two of the dimensions consisting of single
indicators. Table 11 indicates generally good construct validity with this instrument with a
couple of exceptions.

108
Table 11: Varimax Rotated Principal Component Matrix for Personal Information Compromise
Indicator Component
1 2 3 4 5 6 7
Malware 1 .118 .021 .866 .068 .027 .092 .163
Malware 2 .032 .076 .847 .091 -.026 .007 .065
Malware 3 .133 .045 .783 .060 .062 .080 -.119
Passwords 1 .555 .304 .133 .082 .063 -.149 .177
Passwords 2 .701 .058 -.093 -.005 .017 .170 .240
Passwords 3 .779 -.064 .114 .007 .007 -.054 .168
Passwords 4 .757 .115 .031 .133 -.069 .055 -.147
Passwords 5 .601 .085 .179 .117 .111 .019 -.171
Passwords 6 .336 -.182 .130 .221 .140 .245 -.367
Wireless 1 .161 .006 .114 .175 .150 .091 .736
Wireless 2 .246 -.241 .042 .328 .244 .311 .417
Email 1 .009 .037 .105 -.064 -.031 .795 -.023
Email 2 -.052 .408 .264 .129 .237 .465 .136
Email 3 .059 .287 -.019 .083 .017 .734 .098
Financial 1 .082 .092 .090 .853 -.023 -.021 .009
Financial 2 -.004 .226 .096 .847 .030 .045 .019
Financial 3 .189 .168 .044 .585 .138 .034 .151
Info Sharing 1 .224 .687 .056 .162 .245 .113 -.194
Info Sharing 2 .183 .734 .090 .205 .274 .091 -.138
Info Sharing 3 .074 .660 -.028 .184 .220 .081 .076
Info Sharing 4 -.095 .620 .093 .033 -.112 .278 .378
Info Sharing 5 .179 .163 -.053 .130 .488 .164 -.152
Connections 1 .106 .276 .054 -.070 .719 .003 .205
Connections 2 -.162 .115 .057 .079 .790 -.084 .093
Table 11 includes two indicators with very low values in absolute terms and also relative
to the other indicators for the same component. The indicator “Info Share 5” had a much lower
value than the other indicators for this component and also had a higher value for another
component. Additionally, “Passwords 6,” also had lower values, but did not have higher values
with any other component. Given the above, a decision must be made on how to handle these
indicators. One option includes removing these indicators (Diamantopoulos & Winklhofer,
2001), while another option may be to retain them for purposes of content validity (Bollen &

109
Lennox, 1991). The “Info Share 5” indicator does not meet the threshold for either practical
significance or statistical significance (J. Hair et al., 2010). The indicator itself is more strongly
associated with another dimension rather than the one specified a priori. Content validity was
also assessed and not believed to be negatively impacted by the removal of this indicator as the
general substance this indicator was meant to capture is adequately assessed through other
indicators. Therefore, the indicator will not be retained for future analyses.
In contrast, “Password 6” does meet the threshold for practical significance, but not
statistical significance. Since the instrument itself consists of formative dimensions with
formative indicators, it is important to consider the impact of the removal of the item on
content validity. In reviewing this specific indicator, it is clear that it is measuring more than
what was specified in the construct domain (i.e., use of other computing device not considered
the primary computer). As a result, this indicator was removed from further analyses.
After these two items were removed, a principal component analysis was performed a
second time. The results in Table 12 demonstrate significantly improved values across the
seven components with each component representing the seven dimensions for this
instrument that have two or more indicators. Construct validity is now considered quite good
for this instrument.

110
Table 12: Varimax Rotated Principal Component Matrix for Personal Information Compromise, Revised
Indicator Component
1 2 3 4 5 6 7
Malware 1 .108 .035 .870 .057 .083 .023 .181
Malware 2 .009 .113 .853 .065 -.029 -.051 .105
Malware 3 .159 .007 .779 .092 .120 .099 -.127
Passwords 1 .535 .325 .131 .058 -.161 .048 .182
Passwords 2 .683 .082 -.091 -.025 .147 -.037 .292
Passwords 3 .776 -.063 .107 .003 -.048 .023 .194
Passwords 4 .767 .104 .044 .152 .058 -.137 -.089
Passwords 5 .639 .036 .166 .159 .071 .156 -.164
Wireless 1 .083 .124 .108 .079 -.005 .100 .807
Wireless 2 .199 -.104 .042 .257 .194 .114 .601
Email 1 .024 .010 .100 -.046 .809 -.036 .018
Email 2 -.042 .415 .253 .134 .478 .229 .129
Email 3 .077 .236 -.025 .109 .779 .024 .084
Financial 1 .077 .109 .095 .847 -.040 -.072 .088
Financial 2 -.001 .225 .091 .850 .050 .019 .062
Financial 3 .210 .110 .032 .613 .097 .193 .123
Info Sharing 1 .238 .700 .051 .172 .118 .192 -.185
Info Sharing 2 .193 .756 .078 .208 .093 .239 -.136
Info Sharing 3 .049 .732 -.025 .149 .032 .123 .104
Info Sharing 4 -.136 .640 .096 -.010 .261 -.125 .316
Connections 1 .132 .285 .026 -.050 .048 .754 .160
Connections 2 -.115 .095 .030 .125 -.012 .841 .037
Next, I assessed whether multicollinearity was an issue for any of the dimensions in this
instrument. All VIF values were below the 3.3 threshold and thus multicollinearity does not
appear to be a significant issue for this instrument (Diamantopoulos, 2006; Petter et al., 2007).
Tables 11 and 12 and associated statistical analyses were concerned with the
measurement model; however, it is also important to assess the structural model. Table 13
provides these results.

111
Table 13: PLS Analysis for Personal Information Compromise
Dimensions & Indicators Path
Coefficients t-statistics
Path Coefficients
t-statistics
Educate Others in Home -0.012 0.063
Educate 1
Email Links 0.231 1.053
Email 1 0.005 0.021
Email 2 0.887 5.672***
Email 3 0.227 1.061
Financial Websites 0.124 0.898
Financial 1 0.085 0.314
Financial 2 0.338 1.212
Financial 3 0.824 5.110***
Information Sharing 0.376 1.658**
Info Sharing 1 0.349 1.333*
Info Sharing 2 0.431 1.666**
Info Sharing 3 0.243 1.339*
Info Sharing 4 0.263 1.275
Network of Connections 0.192 1.128
Connections 1 0.922 4.391***
Connections 2 0.149 0.449
Passwords & Usernames 0.133 0.900
Passwords 1 0.597 2.312**
Passwords 2 0.225 0.842
Passwords 3 -0.016 0.066
Passwords 4 0.155 0.546
Passwords 5 0.411 1.846**
Scan Computer for Malware 0.023 0.121
Malware 1 0.783 2.387***
Malware 2 0.093 0.275
Malware 3 0.227 0.757
Use Firewall 0.418 1.410*
Firewall 1
Wireless -0.006 0.033
Wireless 1 0.690 3.097***
Wireless 2 0.502 1.948**
PIC Responses: R2 = 0.538 * α = 0.10, 1-tailed; ** α = 0.05, 1-tailed; *** α = 0.01, 1-tailed
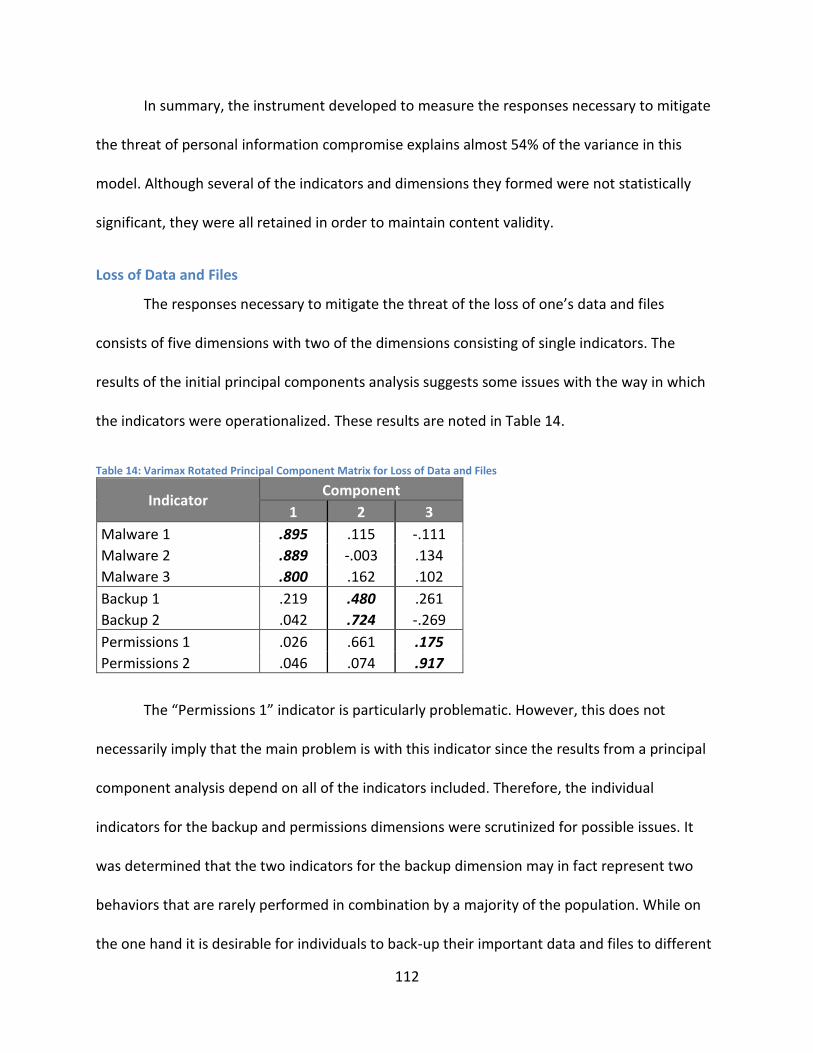
112
In summary, the instrument developed to measure the responses necessary to mitigate
the threat of personal information compromise explains almost 54% of the variance in this
model. Although several of the indicators and dimensions they formed were not statistically
significant, they were all retained in order to maintain content validity.
Loss of Data and Files
The responses necessary to mitigate the threat of the loss of one’s data and files
consists of five dimensions with two of the dimensions consisting of single indicators. The
results of the initial principal components analysis suggests some issues with the way in which
the indicators were operationalized. These results are noted in Table 14.
Table 14: Varimax Rotated Principal Component Matrix for Loss of Data and Files
Indicator Component
1 2 3
Malware 1 .895 .115 -.111
Malware 2 .889 -.003 .134
Malware 3 .800 .162 .102
Backup 1 .219 .480 .261
Backup 2 .042 .724 -.269
Permissions 1 .026 .661 .175
Permissions 2 .046 .074 .917
The “Permissions 1” indicator is particularly problematic. However, this does not
necessarily imply that the main problem is with this indicator since the results from a principal
component analysis depend on all of the indicators included. Therefore, the individual
indicators for the backup and permissions dimensions were scrutinized for possible issues. It
was determined that the two indicators for the backup dimension may in fact represent two
behaviors that are rarely performed in combination by a majority of the population. While on
the one hand it is desirable for individuals to back-up their important data and files to different

113
locations, in practice this is unlikely to occur. Individuals that simply back-up their important
data and files to any external entity (e.g., the cloud, external hard drive) are doing a significant
amount to mitigate the associated threat of losing one’s data and files. Thus, from a content
validity standpoint the minimal incremental improvement by performing both tasks as
represented by the indicators does not make practical sense. As a result, this indicator was re-
operationalized to incorporate an individual backing up one’s important data and files to an
external entity, whether it be a local (e.g., hard drive, USB thumb drive) or cloud entity (e.g.,
Carbonite, CrashPlan). This was done by creating a new indicator that consisted of the
maximum value between the two original indicators.
A second principal component analysis was performed with the indicators for
“Permissions” and “Malware” since these are the only dimensions with more than a single
indicator. The results in Table 15 indicate improved construct validity for this instrument.
Table 15: Varimax Rotated Principal Component Matrix for Loss of Data and Files, Revised
Indicator Component
1 2
Malware 1 .907 -.015
Malware 2 .879 .101
Malware 3 .810 .137
Permissions 1 .092 .642
Permissions 2 .026 .813
Next, I assessed whether multicollinearity was an issue for any of the dimensions in this
instrument. All VIF values were below the 3.3 threshold and thus multicollinearity does not
appear to be a significant issue for this instrument (Diamantopoulos, 2006; Petter et al., 2007).

114
Tables 14 and 15 and associated statistical analyses were concerned with the
measurement model; however, it is also important to assess the structural model. The results
for the assessment of the measurement model are noted in Table 16.
Table 16: PLS Analysis for Loss of Data and Files
Dimensions & Indicators Path
Coefficients t-statistics
Path Coefficients
t-statistics
Backup Data and Files 0.340 1.383*
Backup Max
Educate Others in Home 0.222 1.146
Educate 1
Scan Computer for Malware 0.263 1.442*
Malware 1 0.479 1.157
Malware 2 0.124 0.327
Malware 3 0.535 1.991**
Setup Computer Permissions 0.096 0.646
Permissions 1 0.884 2.916***
Permissions 2 0.391 0.839
Use Firewall 0.584 1.983**
Firewall 1
LDF Responses: R2 = 0.465 * α = 0.10, 1-tailed; ** α = 0.05, 1-tailed; *** α = 0.01, 1-tailed
Overall, the instrument developed to measure the responses necessary to mitigate the
threat of the loss of data and files explains over 46% of the variance in this model. Although a
few of the indicators and dimensions were not statistically significant, they were all retained in
order to maintain content validity.

115
Conclusion
In this chapter, I explained the techniques employed to develop, test, and validate three
separate instruments designed to measure the information security responses necessary to
mitigate three threats: computer performance compromise, personal information compromise,
and the loss of data and files. Although some of the dimensions used for these instruments
were not statistically significant, they were retained in order to maintain content validity given
the formative nature of the models. In summary, the three instruments demonstrate generally
good validity, both at the measurement and structural model levels. These instruments will be
used in Chapter Five, which examines and tests a larger theoretical framework.

116
Chapter 5: Analysis of data
Introduction
In this chapter, I will discuss the results of the data collected for the three research
models developed in Chapter Two. Each of these research models examines the role of trait
affect on the information security behavior of home users. This is done by looking at three
separate information security threats and the associated responses necessary to mitigate these
threats. These three threats include: computer performance compromise, personal information
compromise, and loss of data and files. In the previous chapter, I discussed the development
and validation of three separate survey instruments—each designed to measure the associated
responses. I employ these three instruments, along with other measurement items, in order to
test the hypotheses developed in Chapter Two.
The remainder of this chapter begins with a discussion of the participants that were
recruited for these three surveys. This includes a discussion on compensation, completion
statistics, and demographics. Next, I discuss the results of the three surveys. This begins by
noting the changes that were made based on data from the pilot study. Then, I discuss
reliability and validation procedures used for the three surveys. Finally, I examine the results of
the structural models and determine which hypotheses were supported and which ones were
not.

117
Participants
In Chapter Three, I discussed the participants that were recruited for these three
surveys. In particular, I discussed the recruitment of participants through Amazon’s Mechanical
Turk. The initial recruitment was done for a pilot study in which participants were compensated
50 cents each. The completion statistics for the pilot study are presented in Table 17, including
the number of rejections (those that failed one or both of the quality control questions).
Table 17: Pilot Study Completion Statistics
Instrument Number Rejections Rejection Rate Final Number
Computer Performance Compromise 109 12 11% 97
Personal Information Compromise 91 14 15.4% 77
Loss of Data and Files 104 12 11.5% 92
Total 304 38 12.5% 266
After making some minor changes based on data collected from the pilot study, I
conducted the main study with significantly larger sample sizes. Respondents were
compensated more than in the pilot study for both efficiency and ethical reasons. The
compensation they received for the main study was $1.15. The completion statistics for the
main study are presented in Table 18.
Table 18: Main Study Completion Statistics
Instrument Number Rejections Rejection Rate Final Number
Computer Performance Compromise 377 24 6.37% 353
Personal Information Compromise 369 40 10.84% 329
Loss of Data and Files 374 48 12.83% 326
Total 1120 112 10% 1008
Again, the rejection rate represents the percentage of participants that failed to answer
at least one of the two quality control questions correctly. These quality control questions told

118
participants specifically which answer to choose. One of the quality control questions told them
to choose “disagree,” while the other quality control question had them choose “agree.”
Incorporating quality control questions is an important technique that helps the researcher
remove responses from participants that may have simply answered randomly without having
read the questions (Buhrmester, Kwang, & Gosling, 2011; Ipeirotis et al., 2010; Kittur et al.,
2008; Mason & Watts, 2010). The total rejection rate was 10% for the main study. Additionally,
it is worth noting that the total number of participants for each study was over the minimum
threshold of 310 that was established through the power analysis discussed in Chapter Three.
I also collected certain demographic information from the participants. This included
gender, highest education level attained, age, state of residence, and ethnicity. The state of
residence information collected was converted into the four primary regions of the United
States so that the participants from the main study could be easily compared with the United
States population as a whole. Likewise, the age information collected was converted into fewer
ranges to allow for easier comparisons. Table 19 illustrates these results.

119
Table 19: Main Study Demographics
Demographics Computer
Performance Compromise
Personal Information Compromise
Loss of Data and
Files Average U.S.2, 3
Gender
Male 56.7% 52.9% 55.2% 54.9% 48.3%
Female 43.1% 45.6% 44.2% 44.3% 51.7%
Education
Some High School 0.3% 0.6% 0.3% 0.4% 8.18%
High School graduate (or GED)
10.8% 12.8% 9.5% 11.0% 29.54%
Some College 33.7% 36.2% 39.0% 36.3% 19.61%
College graduate 37.7% 34.7% 34.4% 35.6% 28.10%
Some graduate school 7.4% 4.0% 6.1% 5.8% N/A
Master's degree 8.5% 9.7% 9.5% 9.2% 7.42%
Doctorate 1.7% 0.6% 1.2% 1.2% 1.47%
Age
18-29 47.9% 48.9% 44.5% 47.1% 21.6%
30-39 28.6% 28.0% 27.3% 28.0% 16.8%
40-49 12.5% 12.2% 13.5% 12.7% 17.6%
50-59 6.5% 6.7% 10.4% 7.9% 18.3%
60+ 4.5% 3.0% 4.0% 3.8% 25.7%
Region
Northeast 19.8% 15.5% 22.7% 19.3% 17.7%
Midwest 19.5% 19.8% 24.5% 21.3% 21.4%
South 34.0% 35.6% 27.9% 32.5% 37.4%
West 26.1% 27.4% 23.9% 25.8% 23.5%
Ethnicity
American Indian or Alaskan Native
1.4% 0.6% -- 1.0% 1.2%
Asian or Pacific Islander 10.8% 9.4% 7.4% 9.2% 5.3%
Black, not of Hispanic origin 5.9% 6.1% 4.3% 5.4% 13.1%
Hispanic 4.8% 6.4% 5.8% 5.7% 16.9%
White, not of Hispanic origin
75.4% 74.8% 81.6% 77.3% 63.0%
Other 1.7% 1.5% 0.9% 1.4% 0.5%
2 Source for gender (18+), education (18+), age (18+), and ethnicity comparison: U.S. Census Bureau, 2012 3 Source for region comparison: U.S. Census Bureau, 2014

120
There are a few observations worth noting. First, the gender of the participants for the
main study consisted of a larger percentage of males than what is found in the U.S. population
as a whole, but not by a large margin. Second, participants were generally more educated and
younger than the average individual in the U.S. population. Finally, while the regional
distribution of participants was quite similar to the U.S. population, there were a greater
number of participants that identified themselves as white, Asian, or Pacific Islander than what
is found in the U.S. as a whole. To the extent the MTurk workers do not closely resemble the
U.S. population, they do nonetheless provide a much greater degree of diversity on key
demographic indicators than the typical college sophomore (Sears 1986).
Next, I discuss the data analysis that was conducted.
General Data Analysis Discussion
In this section, I discuss the data analysis techniques employed for each of the three
surveys and the overall results. This includes discussions on reliability, validity, common
method bias, mediation, and moderation.
Reliability
Reliability was first assessed by examining the Cronbach’s Alpha values calculated in
SPSS, version 19. Other than the constructs for trait positive affect and trait negative affect that
each have 10 indicators, all of the remaining constructs began with three indicators. One of the
three indicators was removed for a construct if it resulted in improved reliability. Reliability was

121
then assessed by examining the composite reliability values given in Smart PLS, version 2.0 M3.
The results for reliability testing are discussed later in this chapter in the specific sections for
each of the three surveys.
In addition to any changes made to the indicators for the dependent variable in Chapter
Four, the data collected from the pilot study indicated that one of the indicators for the
independent variable construct “Perceived Response Costs” needed to be reworded due to
poor reliability based on results from the analysis done in SPSS, version 19. The indicator that is
measured by the statement “The benefits of [response] outweigh the costs” was problematic. It
was believed to be due in part to the reverse scoring of the item compared to the other two
indicators. In other words, if an individual thought the response costs were too high for this
response she would indicate “agree” or “strongly agree” for the other two items, but the
opposite for this one. Therefore, in the main study the wording was reversed to: “The costs of
[response] outweigh the benefits.” This change helped quite a bit with reliability for this
construct, but it remained problematic in that the removal of this indicator in all three surveys
and for all of the dimensions helped improve the overall reliability of the construct. Therefore,
all variations of this indicator were removed from further analysis for all three surveys.
Validity
In addition to assessing reliability for the reflective constructs, it is important to assess
validity. Validity is assessed using the AVE calculated in SmartPLS version 2.0 (Beta) (C. Ringle,
Wende, & Will, 2005). It is worth noting that the composite reliability and AVE values for the
dimensions were calculated at the first stage of the two-stage approach noted in Ringle et al.

122
(2012). Convergent validity requires that the composite reliability values are greater than the
AVE and the AVE is greater than the minimum 0.500 threshold (J. Hair et al., 2010).
In addition to convergent validity, discriminant validity must also be considered. This
was assessed by comparing the AVE for each construct with the squared correlations with other
constructs (Chin, 1998b; J. Hair et al., 2010). If the AVE is higher than these squared
correlations, discriminant validity was further assessed by using the cross-loading method (p.
321). Discriminant validity was accepted if the indicators and blocks of indicators do not load
higher with other constructs than the one they are intended to measure. The results for validity
testing are discussed later in this chapter in the specific sections for each of the three surveys.
Common Method Bias
The three surveys conducted in this dissertation involved a single research method—
surveys. This can give rise to common method bias in which the method itself accounts for a
large amount of the variance. One test that screens for common method bias is the Harman’s
single-factor test. Although this specific test does have shortcomings (Malhotra, Kim, & Patil,
2006; Podsakoff, MacKenzie, Lee, & Podsakoff, 2003), it can be helpful in determining if there
are any significant issues with respect to common method bias. The procedure itself calls for
employing factor analysis with a single factor. The total variance explained by the first factor
must be below 50%. In all three surveys, the first factor accounted for less than 26% of the total
variance. While common method bias cannot be ruled out based on this test alone, it does at
least provide some support that it is not a significant issue for these three surveys.

123
In addition to testing for common method bias, it is also important to implement certain
conditions a priori to minimize the likelihood of common method bias in the first place. In this
research, the participants were anonymous to the research and they were asked to simply
answer honestly; both of these conditions help minimize the degree to which common method
bias may impact results (Podsakoff et al., 2003).
Mediation
The three research models presented in this research suggest that any effect the
independent variables trait positive affect and trait negative affect have on the dependent
variable are through their indirect effects on three other independent variables: perceived
threat severity, perceived threat vulnerability, and self-efficacy. However, in order to fully
understand the research model and results from the data collected, it is important to test for
mediation.
There are three requirements for a variable to be considered a mediator (R. M. Baron &
Kenny, 1986). First, variations in the independent variable account for a significant variation in
the mediating variable. Second, variations in the mediating variable account for significant
variations in the dependent variable. And third, when the variations noted above are controlled
for, the relationship between the independent variable and the dependent variable is no longer
significant. If it is still significant but less than what it was before controlling for the variations
noted above, then this may indicate there are multiple mediators at work. In the current
research, it is hypothesized that there are three mediating variables. Thus, it is not necessary
for the relationship between the independent and dependent variables to approach zero;
however, it is expected to lessen.

124
No direct effect was found between trait positive affect or trait negative affect and any
of the dependent variables. This indicates that any influence trait positive affect and trait
negative affect have on the dependent variables is through the effect they have on perceived
threat severity, perceived threat vulnerability, and/or self-efficacy (J. Hair et al., 2010). Thus,
the effect trait positive affect and trait negative affect have on the dependent variable is
indirect rather than mediated through perceived threat severity, perceived threat vulnerability,
or self-efficacy (R. M. Baron & Kenny, 1986).
Moderation
In addition to testing for mediation, I also tested for moderation. This included an
examination of whether there was a statistically significant difference for any of the paths in
the model between two groups of respondents. These groupings were based on responses for
gender, education, and age. Gender was separated by male and female; respondents that did
not indicate a gender were dropped from this part of the analysis. This was repeated for age
(18-29 years old and 30 years old and older) and education (some college or less and college
graduate or more). Calculations were performed in SmartPLS version 2.0 (Beta) (C. Ringle,
Wende, & Will, 2005) to determine t-statistics and significance levels (α = 0.05, 2-tailed) for all
of the paths and for each of these three demographic variables.
Out of the 33 paths tested three times each (99 tests total) there was only one instance
in which a statistically significant relationship was found between groups. There was a
statistically significant difference between those aged 18-29 with those 30 or older for trait
positive affect’s effect on threat severity for the loss of data and files threat (t-statistic: 1.974; p

125
< 0.05). For the remaining cases, there was not a statistically significant difference between any
of the groups in any of the instances tested. The complete results are provided in Appendix H.
Finally, I performed additional testing of moderation by examining if any interactions
between the constructs were statistically significant. As noted in Chapter Two, there have been
many different types of interactions hypothesized in the PMT literature, but there has been a
significant lack of consistency. I noted that this may be due to the specific context of the study,
including the type of threat examined. Given that the current research is in many respects
exploratory, I have tested for all possible multiplicative interactions between two direct effect
constructs. SmartPLS version 2.0 (Beta) (C. Ringle, Wende, & Will, 2005) was used for these
calculations with the interaction effect term generation option set to “standardize indicator
values before multiplication.” In order to perform these tests, I used the latent variable scores
in a new model for all interactions due to the inclusion of multi-dimensional formative
constructs for three of the five direct effect constructs. The t-statistic results are presented in
Appendix I. None of the interactions tested for were statistically significant.
Next, I discuss data analysis results specific to each of the three research models.
Patterns of Data for Each Research Issue or Hypothesis
In this section, I discuss the data analysis results for each of the three surveys. This
includes discussions on the conclusions that may be drawn with respect to the research models
and hypotheses developed in earlier chapters.

126
Computer Performance Compromise
The first survey is concerned with an individual’s behaviors related to mitigating the
compromise of one’s computer performance. As noted earlier, the indicator that assessed one’s
cost-benefit evaluation of a response was removed for all dimensions for all three surveys. The
reliability and validity results for the reflective constructs are presented in Table 20.
Table 20: Reliability & Validity Assessment for Reflective Constructs and Dimensions of Computer Performance Compromise
Construct / Dimension Indicators Cronbach’s Alpha Composite Reliability AVE
Threat Severity 3 0.897 0.9372 0.8328
Threat Vulnerability 2 0.815 0.9183 0.8489
Self-Efficacy
Maintenance 2 0.841 0.9271 0.8642
Malware 2 0.871 0.9379 0.8831
Updates 2 0.804 0.9087 0.8328
Firewall 3 0.878 0.9241 0.8024
Response Efficacy
Maintenance 2 0.835 0.9239 0.8585
Malware 2 0.889 0.9468 0.8989
Updates 3 0.881 0.9267 0.8083
Firewall 2 0.896 0.9478 0.9008
Response Costs
Maintenance 2 0.706 0.8772 0.7813
Malware 2 0.804 0.9112 0.8369
Updates 2 0.782 0.9034 0.8238
Firewall 2 0.821 0.9192 0.8505
Trait Positive Affect 10 0.917 0.9278 0.5632
Trait Negative Affect 10 0.900 0.9194 0.5348
The reliability is acceptable for all of the reflective constructs as demonstrated by both
Cronbach’s Alpha and composite reliability values over the 0.700 minimum threshold (J. Hair et
al., 2010). Likewise, convergent validity is also acceptable with the composite reliability greater
than the AVE for all of the constructs and the AVE greater than the 0.500 minimum threshold (J.
Hair et al., 2010). Finally, the measures demonstrated discriminant validity with the AVE of the

127
constructs greater than the square of the correlations with other constructs, as well as passing
the cross-loading method of assessing discriminant validity (Chin, 1998b). All indicators loaded
more highly on the construct they intended to measure than any other construct. The results
used to assess discriminant validity are provided in Appendices J and K.
Figure 7 includes the results for this research model on computer performance
compromise, including path coefficients, t-statistics (i.e., test statistic), and significance levels.
As noted previously, the structural model was calculated using Smart PLS, version 2.0 M3.

128
Computer Performance Compromise
(R2=0.560)
Perceived Threat
Severity(R2=0.018)
Perceived Threat
Vulnerability(R2=0.053)
Trait PositiveAffect
pc=0.284t=2.882***
Trait Negative
Affect
SelfEfficacy
(R2=0.104)
Perceived Response
Costs
Perceived Response Efficacy
pc=-0.193t=1.922**
pc=0.125t=1.109
pc=0.052t=0.305
pc=-0.148t=0.925
pc=0.121t=0.931
pc=0.090t=1.023
pc=-0.022t=0.243
pc=0.582t=4.347***
pc=-0.098t=0.859
t = t-statistic; pc = path coefficient; * α = 0.10, 1-tailed; ** α = 0.05, 1-tailed; *** α = 0.01, 1-tailed
pc=0.081t=0.596
Figure 7: Research Results – Computer Performance Compromise
The results indicate that self-efficacy is an effective predictor of behavior, as noted in
prior research (Floyd et al., 2000; Milne et al., 2000). Additionally, there is support for the
hypotheses that trait positive affect influences both perceived threat vulnerability and self-
efficacy. Therefore, three of the 11 hypotheses were supported based on this research.

129
Overall, the research model accounted for 56% of the variance, which is quite high
considering the exploratory nature of this research. The hypotheses and associated outcomes
are noted in Table 21.
Table 21: Hypotheses Related to Computer Performance Compromise
Number Hypothesis Conclusion
H1-CPC Higher levels of perceived threat severity related to computer performance compromise are associated with higher levels of performing the responses necessary to mitigate this threat.
Not Supported
H2-CPC Higher levels of perceived threat vulnerability related to computer performance compromise are associated with higher levels of performing the responses necessary to mitigate this threat.
Not Supported
H3-CPC Higher levels of perceived response efficacy related to the responses necessary to mitigate computer performance compromise are associated with higher levels of performing these responses.
Not Supported
H4-CPC Higher levels of perceived response costs related to the responses necessary to mitigate computer performance compromise are associated with lower levels of performing these responses.
Not Supported
H5-CPC Higher levels of self-efficacy related to the responses necessary to mitigate computer performance compromise are associated with higher levels of performing these responses.
Supported
H6-CPC Higher levels of trait positive affect are associated with lower levels of perceived threat severity related to computer performance compromise.
Not Supported
H7-CPC Higher levels of trait positive affect are associated with lower levels of perceived threat vulnerability related to computer performance compromise.
Supported
H8-CPC Higher levels of trait negative affect are associated with higher levels of perceived threat severity related to computer performance compromise.
Not Supported
H9-CPC Higher levels of trait negative affect are associated with higher levels of perceived threat vulnerability related to computer performance compromise.
Not Supported
H10-CPC Higher levels of trait positive affect are associated with higher levels of information security self-efficacy related to the responses necessary to mitigate the threat of computer performance compromise.
Supported
H11-CPC Higher levels of trait negative affect are associated with lower levels of information security self-efficacy related to the responses necessary to mitigate the threat of computer performance compromise.
Not Supported
Next, I will discuss the statistical analysis conducted for the survey that examines the
threat personal information compromise.

130
Personal Information Compromise
The second survey is concerned with an individual’s behaviors related to mitigating the
compromise of one’s personal information. As noted earlier, the indicator that assessed one’s
cost-benefit evaluation of a response was removed for all dimensions for all three surveys. The
reliability and validity results for this survey are presented in Table 22.

131
Table 22: Reliability & Validity Assessment for Reflective Constructs and Dimensions of Personal Information Compromise
Construct / Dimension Indicators Cronbach’s Alpha Composite Reliability AVE Threat Severity 3 0.917 0.9484 0.8596
Threat Vulnerability 3 0.770 0.8674 0.6864
Self-Efficacy
Educate 3 0.802 0.8873 0.7248
Info Sharing 2 0.803 0.9129 0.8398
Connections 3 0.766 0.8695 0.6900
Passwords 3 0.790 0.8852 0.7205
Malware 2 0.827 0.9200 0.8519
Wireless 3 0.850 0.9082 0.7677
Email 2 0.841 0.9265 0.8630
Financial 2 0.825 0.9224 0.8560
Firewall 3 0.884 0.9287 0.8130
Response Efficacy
Educate 2 0.917 0.9599 0.9230
Info Sharing 2 0.832 0.9225 0.8561
Connections 2 0.865 0.9383 0.8838
Passwords 2 0.876 0.9413 0.8891
Malware 2 0.922 0.9623 0.9274
Wireless 2 0.937 0.9672 0.9365
Email 2 0.918 0.9603 0.9236
Financial 2 0.926 0.9642 0.9308
Firewall 2 0.938 0.9687 0.9392
Response Costs
Educate 2 0.864 0.9404 0.8876
Info Sharing 2 0.910 0.9576 0.9187
Connections 2 0.889 0.9473 0.8999
Passwords 2 0.873 0.9416 0.8896
Malware 2 0.825 0.9231 0.8572
Wireless 2 0.894 0.9482 0.9015
Email 2 0.910 0.9558 0.9154
Financial 2 0.918 0.9589 0.9211
Firewall 2 0.922 0.9622 0.9271
Trait Positive Affect 10 0.915 0.9276 0.5630
Trait Negative Affect 10 0.903 0.9199 0.5365
Similar to the analysis of the measures for computer performance compromise, the
reliability is acceptable for all of the reflective constructs based on Cronbach’s Alpha and
composite reliability values exceeding the 0.700 minimum threshold (J. Hair et al., 2010).
Furthermore, the AVE is greater than the 0.500 minimum threshold and composite reliability is

132
greater than the AVE for all of the constructs; thus, convergent validity is acceptable (J. Hair et
al., 2010). Discriminant validity was also found to be acceptable. The AVE of the constructs was
greater than the square of the correlations with other constructs. Additionally, the constructs
passed the cross-loading method of assessing discriminant validity (Chin, 1998b). In particular,
all of the indicators loaded more highly on the construct they intended to measure than with
any other construct in the model. The results used to assess discriminant validity are provided
in Appendices L and M.
Figure 8 includes the results for this research model on personal information
compromise, including path coefficients, t-statistics, and significance levels. As noted
previously, the structural model was calculated using Smart PLS, version 2.0 M3.

133
Personal Information Compromise
(R2=0.538)
Perceived Threat
Severity(R2=0.026)
Perceived Threat
Vulnerability(R2=0.031)
Trait PositiveAffect
pc=0.182t=1.033
Trait Negative
Affect
SelfEfficacy
(R2=0.059)
Perceived Response
Costs
Perceived Response Efficacy
pc=-0.131t=1.029
pc=0.143t=1.374*+
pc=0.077t=0.602
pc=-0.153t=0.815
pc=0.111t=0.725
pc=0.223t=1.997**
pc=0.007t=0.083
pc=0.080t=0.555
pc=0.428t=2.508***
pc=-0.196t=1.357*
t = t-statistic; pc = path coefficient; * α = 0.10, 1-tailed; ** α = 0.05, 1-tailed; *** α = 0.01, 1-tailed + = opposite direction of what was hypothesized
Figure 8: Research Results – Personal Information Compromise
The results again demonstrate that self-efficacy is a good predictor of behavior.
Furthermore, two additional hypotheses were supported: higher levels of perceived threat
severity leading to increased protective responses and higher levels of perceived response costs
leading to lower levels of protective responses. Therefore, three of the 11 hypotheses were
supported based on this research. Interestingly, the hypothesis related to the relationship
between trait positive affect and perceived threat severity was significant, but opposite of what

134
was hypothesized. Thus, higher levels of trait positive affect was associated with higher levels of
perceived threat severity. The implications of this finding are unclear, but something worth
exploring in future studies. Overall, the research model accounted for 53.8% of the variance.
The hypotheses and associated outcomes are noted in Table 23.
Table 23: Hypotheses Related to Personal Information Compromise
Number Hypothesis Conclusion
H1-PIC Higher levels of perceived threat severity related to personal information compromise are associated with higher levels of performing the responses necessary to mitigate this threat.
Supported
H2-PIC Higher levels of perceived threat vulnerability related to personal information compromise are associated with higher levels of performing the responses necessary to mitigate this threat.
Not Supported
H3-PIC Higher levels of perceived response efficacy related to the responses necessary to mitigate personal information compromise are associated with higher levels of performing these responses.
Not Supported
H4-PIC Higher levels of perceived response costs related to the responses necessary to mitigate personal information compromise are associated with lower levels of performing these responses.
Supported
H5-PIC Higher levels of self-efficacy related to the responses necessary to mitigate personal information compromise are associated with higher levels of performing these responses.
Supported
H6-PIC Higher levels of trait positive affect are associated with lower levels of perceived threat severity related to personal information compromise.
Not Supported (opposite direction)
H7-PIC Higher levels of trait positive affect are associated with lower levels of perceived threat vulnerability related to personal information compromise.
Not Supported
H8-PIC Higher levels of trait negative affect are associated with higher levels of perceived threat severity related to personal information compromise.
Not Supported
H9-PIC Higher levels of trait negative affect are associated with higher levels of perceived threat vulnerability related to personal information compromise.
Not Supported
H10-PIC
Higher levels of trait positive affect are associated with higher levels of information security self-efficacy related to the responses necessary to mitigate the threat of personal information compromise.
Not Supported
H11-PIC
Higher levels of trait negative affect are associated with lower levels of information security self-efficacy related to the responses necessary to mitigate the threat of personal information compromise.
Not Supported

135
Next, I will discuss the statistical analysis performed for the survey that examines the
threat of losing one’s data and files.
Loss of Data and Files
The third survey is concerned with an individual’s behaviors related to mitigating the
loss of data and files. As noted earlier, the indicator that assessed one’s cost-benefit evaluation
of a response was removed for all dimensions for all three surveys. The reliability and validity
assessment for this survey are presented in Table 24.
Table 24: Reliability & Validity Assessment for Reflective Constructs and Dimensions of Loss of Data and Files
Construct / Dimension Indicators Cronbach’s Alpha Composite Reliability AVE
Threat Severity 3 0.937 0.9596 0.8879
Threat Vulnerability 2 0.782 0.9079 0.8313
Self-Efficacy
Backup 2 0.766 0.8967 0.8128
Educate 2 0.854 0.9323 0.8733
Malware 2 0.894 0.9497 0.9042
Permissions 3 0.838 0.9057 0.7624
Firewall 2 0.872 0.9399 0.8866
Response Efficacy
Backup 2 0.827 0.9199 0.8517
Educate 2 0.950 0.9747 0.9507
Malware 2 0.888 0.9466 0.8987
Permissions 2 0.923 0.9626 0.9280
Firewall 2 0.920 0.9612 0.9253
Response Costs
Backup 2 0.705 0.8738 0.7760
Educate 2 0.874 0.9418 0.8899
Malware 2 0.784 0.9097 0.8343
Permissions 2 0.867 0.9386 0.8843
Firewall 2 0.855 0.9325 0.8736
Trait Positive Affect 10 0.903 0.9181 0.5297
Trait Negative Affect 10 0.920 0.9313 0.5776

136
As in the other two surveys, reliability and validity were assessed for this survey, which
examines the loss of data and files. Both Cronbach’s Alpha and composite reliability values for
all of the reflective constructs are above the recommended minimum threshold of 0.700 and
thus reliability is acceptable (J. Hair et al., 2010). Furthermore, convergent validity was assessed
and found to be acceptable given the composite reliability values were greater than the AVE for
all of the constructs and the AVE greater than the 0.500 minimum threshold (J. Hair et al.,
2010). Next, I assessed discriminant validity for the measures. The AVE of the constructs were
greater than the square of the correlations with other constructs and the cross-loadings
method test passed with all indicators loading more highly on the construct they intended to
measure than any other construct (Chin, 1998b). The results used to assess discriminant validity
are provided in Appendices N and O.
Figure 9 includes the results for this research model on loss of data and files, including
path coefficients, t-statistics, and significance levels. As noted previously, the structural model
was calculated using Smart PLS, version 2.0 M3.

137
Loss of Data and Files
(R2=0.465)
Perceived Threat
Severity(R2=0.011)
Perceived Threat
Vulnerability(R2=0.018)
Trait PositiveAffect
pc=0.268t=2.445***
Trait Negative
Affect
SelfEfficacy
(R2=0.103)
Perceived Response
Costs
Perceived Response Efficacy
pc=-0.128t=1.040
pc=0.107t=0.872
pc=0.020t=0.151
pc=-0.155t=0.936
pc=0.035t=0.276
pc=0.147t=1.471*
pc=-0.162t=1.135
pc=0.084t=0.558
pc=0.345t=1.788**
pc=-0.228t=1.736**
t = t-statistic; pc = path coefficient; * α = 0.10, 1-tailed; ** α = 0.05, 1-tailed; *** α = 0.01, 1-tailed
Figure 9: Research Results – Loss of Data and Files
As in the two other surveys, self-efficacy continues to be a good predictor of behavior.
Furthermore, three additional hypotheses were supported. This includes the influence of
perceived threat severity and perceived response costs on the responses necessary to mitigate
the loss of data and files, as well as higher levels of trait positive affect leading to a higher
degree of self-efficacy. Therefore, four of the 11 hypotheses were supported based on this
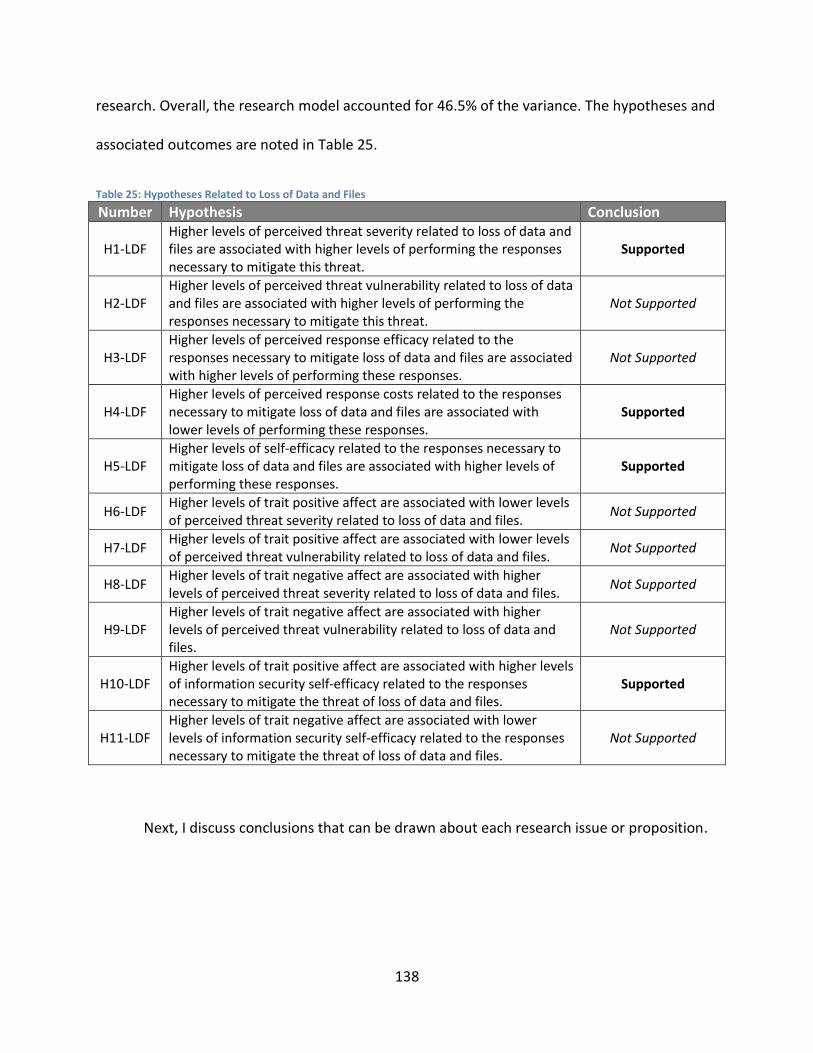
138
research. Overall, the research model accounted for 46.5% of the variance. The hypotheses and
associated outcomes are noted in Table 25.
Table 25: Hypotheses Related to Loss of Data and Files
Number Hypothesis Conclusion
H1-LDF Higher levels of perceived threat severity related to loss of data and files are associated with higher levels of performing the responses necessary to mitigate this threat.
Supported
H2-LDF Higher levels of perceived threat vulnerability related to loss of data and files are associated with higher levels of performing the responses necessary to mitigate this threat.
Not Supported
H3-LDF Higher levels of perceived response efficacy related to the responses necessary to mitigate loss of data and files are associated with higher levels of performing these responses.
Not Supported
H4-LDF Higher levels of perceived response costs related to the responses necessary to mitigate loss of data and files are associated with lower levels of performing these responses.
Supported
H5-LDF Higher levels of self-efficacy related to the responses necessary to mitigate loss of data and files are associated with higher levels of performing these responses.
Supported
H6-LDF Higher levels of trait positive affect are associated with lower levels of perceived threat severity related to loss of data and files.
Not Supported
H7-LDF Higher levels of trait positive affect are associated with lower levels of perceived threat vulnerability related to loss of data and files.
Not Supported
H8-LDF Higher levels of trait negative affect are associated with higher levels of perceived threat severity related to loss of data and files.
Not Supported
H9-LDF Higher levels of trait negative affect are associated with higher levels of perceived threat vulnerability related to loss of data and files.
Not Supported
H10-LDF Higher levels of trait positive affect are associated with higher levels of information security self-efficacy related to the responses necessary to mitigate the threat of loss of data and files.
Supported
H11-LDF Higher levels of trait negative affect are associated with lower levels of information security self-efficacy related to the responses necessary to mitigate the threat of loss of data and files.
Not Supported
Next, I discuss conclusions that can be drawn about each research issue or proposition.

139
Conclusions about Each Research Issue or Proposition
In this research, I articulated 11 different general hypotheses. Each of these hypotheses
were tailored to and tested in three different surveys with the result being 33 total hypotheses.
As discussed in Chapter One, the antecedents of the information security behavior of home
users were argued to be threat-response specific. For example, the reasons for an individual
engaging in certain behavior to mitigate the possible loss of data and files may be quite
different from the reasons why an individual would engage in different behavior required to
mitigate the compromise of one’s computer performance. Therefore, three separate
instruments were created and tested through the administration of three separate surveys. The
results of each of these 11 general hypotheses will be discussed next.
H1: Higher levels of perceived threat severity are associated with higher levels of
information security behavior.
The first hypothesis was supported in two of the three surveys. In particular, higher
levels of perceived threat severity related to the compromise of one’s personal information and
the loss of one’s data and files was associated with higher levels of performing information
security responses needed to mitigate these threats.
H2: Higher levels of perceived threat vulnerability are associated with higher levels of
information security behavior.

140
H3: Higher levels of perceived efficacy related to the responses necessary to mitigate an
information security threat are associated with higher levels of performing these
responses.
The second and third hypotheses were not supported in any of the three surveys.
Perceived threat vulnerability and perceived response efficacy were not significant factors
associated with the information security responses performed to mitigate specific threats.
H4: Higher levels of perceived costs related to the responses necessary to mitigate an
information security threat are associated with lower levels of performing these
responses.
The fourth hypothesis was supported in two of the three surveys. There was statistically
significant evidence to suggest that higher perceived costs associated with responses needed to
mitigate a threat led to lower levels of performing these responses. This was true for the
threats related to the compromise of one’s personal information and the loss of one’s data and
files.
H5: Higher levels of self-efficacy related to the responses necessary to mitigate an
information security threat are associated with higher levels of performing these
responses.

141
This is the only hypothesis that was supported in all three surveys. As has been shown in
research in information systems and other disciplines, one’s belief in being able to perform the
actions necessary to mitigate a threat is the single largest factor in whether those actions will
be performed (Crossler, 2010; Floyd et al., 2000; Marakas et al., 2007; Milne et al., 2000).
H6: Higher levels of trait positive affect are associated with lower levels of perceived
threat severity.
This hypothesis was not supported in any of the surveys, but there was a statistically
significant relationship between trait positive affect and perceived threat severity in the survey
on personal information compromise. However, in this survey higher levels of trait positive
affect was associated with higher levels of perceived threat severity, which is opposite of what
was hypothesized.
H7: Higher levels of trait positive affect are associated with lower levels of perceived
threat vulnerability.
There is statistical support for this hypothesis in the survey on computer performance
compromise, but not in either of the other surveys. This suggests that individuals with higher
levels of trait positive affect are less likely to think they are vulnerable to having the
performance of their computer compromised.

142
H8: Higher levels of trait negative affect are associated with higher levels of perceived
threat severity.
H9: Higher levels of trait negative affect are associated with higher levels of perceived
threat vulnerability.
There was not support in any of the three surveys for higher levels of trait negative
affect being associated with higher levels of perceived threat severity or perceived threat
vulnerability.
H10: Higher levels of trait positive affect are associated with higher levels of information
security self-efficacy.
Higher levels of trait positive affect was associated with higher levels of self-efficacy
related to the responses necessary to mitigate the threats of computer performance
compromise and loss of data and files. However, there was not support for this hypothesis for
the threat personal information compromise.
H11: Higher levels of trait negative affect are associated with lower levels of information
security self-efficacy.
Overall, levels of trait negative affect were not statistically associated with varying levels
of other constructs as hypothesized. This includes self-efficacy. There was not support in any of

143
the three surveys for higher levels of trait negative affect being associated with lower levels of
self-efficacy.
As noted above, there were several hypotheses that were supported. Five of the 11
general hypotheses were supported by one or more of the three surveys. The only general
hypothesis that was supported in all three instances was the relationship between an
individual’s self-efficacy in being able to perform the responses necessary to mitigate a threat
and self-reports of performing these responses. Three of the general hypotheses were
supported in two of the surveys. This includes hypotheses one, four, and 10. Only one of the
general hypotheses was supported in a single survey. Hypothesis seven was supported in the
survey on computer performance compromise, but not in the other two surveys. However, the
t-statistics for the other two surveys were both above 1.0 and in the correct direction. All of the
results are presented in Table 26.

144
Table 26: Hypotheses Results with Statistics
# Hypothesis Statement Threat t pc
1
Higher levels of perceived threat severity are associated with higher levels of performing the responses necessary to mitigate the threat.
Computer Performance Compromise 1.023 0.090
Personal Information Compromise 1.997** 0.223
Loss of Data and Files 1.471* 0.147
2
Higher levels of perceived threat vulnerability are associated with higher levels of performing the responses necessary to mitigate the threat.
Computer Performance Compromise 0.243 -0.022
Personal Information Compromise 0.083 0.007
Loss of Data and Files 1.135 -0.162
3
Higher levels of perceived efficacy related to the responses necessary to mitigate an information security threat are associated with higher levels of performing these responses.
Computer Performance Compromise 0.596 0.081
Personal Information Compromise 0.555 0.080
Loss of Data and Files 0.558 0.084
4
Higher levels of perceived costs related to the responses necessary to mitigate an information security threat are associated with lower levels of performing these responses.
Computer Performance Compromise 0.859 -0.098
Personal Information Compromise 1.357* -0.196
Loss of Data and Files 1.736** -0.228
5
Higher levels of self-efficacy related to the responses necessary to mitigate an information security threat are associated with higher levels of performing these responses.
Computer Performance Compromise 4.347*** 0.582
Personal Information Compromise 2.508*** 0.428
Loss of Data and Files 1.788** 0.345
6 Higher levels of trait positive affect are associated with lower levels of perceived threat severity.
Computer Performance Compromise 1.109 0.125
Personal Information Compromise 1.374*+ 0.143
Loss of Data and Files 0.872 0.107
7 Higher levels of trait positive affect are associated with lower levels of perceived threat vulnerability.
Computer Performance Compromise 1.922** -0.193
Personal Information Compromise 1.029 -0.131
Loss of Data and Files 1.040 -0.128
8 Higher levels of trait negative affect are associated with higher levels of perceived threat severity.
Computer Performance Compromise 0.305 0.052
Personal Information Compromise 0.602 0.077
Loss of Data and Files 0.151 0.020
9 Higher levels of trait negative affect are associated with higher levels of perceived threat vulnerability.
Computer Performance Compromise 0.931 0.121
Personal Information Compromise 0.725 0.111
Loss of Data and Files 0.276 0.035
10 Higher levels of trait positive affect are associated with higher levels of information security self-efficacy.
Computer Performance Compromise 2.882*** 0.284
Personal Information Compromise 1.033 0.182
Loss of Data and Files 2.445*** 0.268
11 Higher levels of trait negative affect are associated with lower levels of information security self-efficacy.
Computer Performance Compromise 0.925 -0.148
Personal Information Compromise 0.815 -0.153
Loss of Data and Files 0.936 -0.155
t = t-statistic; pc = path coefficient; * α = 0.10, 1-tailed; ** α = 0.05, 1-tailed; *** α = 0.01, 1-tailed; + = opposite direction of what was hypothesized

145
Conclusion
The chapter discussed the results of three surveys that examined threats to an
individual’s information security. These threats included: computer performance compromise,
personal information compromise, and loss of one’s data and files. The participants included in
these three surveys were generally representative of the U.S. population as a whole with
respect to gender and region of residence, but less so with respect to age, education, and
ethnicity. Nonetheless, representativeness of the samples used in these three surveys in
comparison with the U.S. population was better than what is often found in survey research
(Buhrmester et al., 2011; Ross, Irani, Silberman, Zaldivar, & Tomlinson, 2010).
The previously developed instruments from Chapter Four were used to measure the
dependent variable for each of the surveys, while items adapted from Protection Motivation
Theory and the PANAS (Watson et al., 1988) were used as the independent variables. Several
tests were conducted to assess reliability and validity. Some indicators were removed to
improve the reliability of some of the constructs. All tests demonstrated acceptable levels of
both reliability and validity for the three models employed. Likewise, each of the three models
explained a large amount of the variance, which ranged between 46.5% (loss of data and files)
and 56% (computer performance compromise).
Overall, 10 of the 33 hypotheses were supported. While this may seem like a small
number of hypotheses supported, given the largely exploratory nature of this research it is not
necessarily surprising. Nonetheless, what may be most significant about these findings is the
lack of consistency between different threats, both in this study and when compared with other

146
studies. The only hypothesis that received support in all three surveys was the relationship
between self-efficacy and behavior.
In the final chapter I will further discuss both the issues noted above and the results
overall, including implications, limitations, and future directions.

147
Chapter 6: Conclusions and Implications
Introduction
The purpose of this research was to explore the role trait affect has on the information
security behavior of home users. This was done by identifying three specific information
security threats faced by home users. These included: computer performance compromise,
personal information compromise, and loss of data and files. A new instrument was developed
and validated to measure the responses home users should perform to mitigate these threats.
These new instruments, in combination with previously validated indicators for both
trait positive affect and trait negative affect, as well as the adaptation of indicators for the main
constructs of Protection Motivation Theory, were used in three large-scale surveys. This was
done after some minor changes were made based on results from a pilot study. Each survey
was designed to test a specific version of the research model, one version for each of the three
threats noted above. The survey was administered online with participants recruited from
Amazon’s Mechanical Turk. Over 320 participants were utilized for each of the surveys with
participants randomly assigned to one of the three surveys. Several tests were conducted for
both reliability and validity with some changes made to improve reliability.
In this chapter, I discuss the research problem itself. Next, I discuss the implications of
this research for theory, policy, and practice. Then, I discuss the limitations of the research.
Finally, I examine possible avenues to pursue in future research.

148
Next, I discuss how the results of this research contribute to the home user problem
discussed in Chapter One.
Conclusions about the Research Problem and Hypotheses
In Chapter One, I articulated the problem with information security threats in general,
and the home user problem in particular. While research has increased substantially over the
past few years with respect to the home user, there is still a lot we do not know. The purpose of
this research was to advance our collective state of knowledge on the home user problem. This
was done by developing three survey instruments so that three different information security
threats could be analyzed. A general research model and 11 hypotheses were developed based
on theory and the literature.
The primary contribution this research makes is by incorporating trait affect into the
general research model. I did this by incorporating two constructs—one for trait positive affect
and one for trait negative affect. If individuals with higher levels of trait positive affect do not
take the severity and/or their vulnerability to a threat as seriously as they should then this is
problematic. In fact, this was shown to be the case in only one of the surveys and only for
threat vulnerability. Higher levels of trait positive affect were actually associated with higher
levels of threat severity in one of the surveys, which is contradictory to what was hypothesized.
Furthermore, higher levels of trait positive affect were associated with higher levels of self-
efficacy in two of the surveys, which is consistent with what was hypothesized.

149
Therefore, this research contributed to our understanding of the home user problem.
Trait positive affect does appear to have a role in how home users respond to information
security threats. This includes primarily through its association with self-efficacy. As noted in
Chapter Two, individuals with higher levels of positive affect are more likely to think
optimistically and thus have greater confidence with respect to their ability to perform a
specific task, which leads to increased levels of self-efficacy (R. Baron, 1990; Bryan & Bryan,
1991; Grindley et al., 2008; Treasure et al., 1996). This assertion was supported in two of the
three surveys. This is important given the prominent role self-efficacy has had in a large array of
research (Floyd et al., 2000; Maddux & Rogers, 1983; Milne et al., 2000), including research on
information security behavior (Crossler & Bélanger, 2006; Crossler, 2010; Herath & Rao, 2009b;
Ifinedo, 2012; Johnston & Warkentin, 2010; LaRose et al., 2008; D. Lee et al., 2008; Y. Lee &
Larsen, 2009; Rhee, Kim, & Ryu, 2009; Vance et al., 2012; Woon et al., 2005; Workman et al.,
2008).
Prior research in the information systems domain that has examined the role of affect
on the decisions we make has done this primarily by conceptualizing affect as how much an
individual likes something, how much fun it is, and how interesting an activity may be (D.
Compeau, Higgins, & Huff, 1999; D. R. Compeau & Higgins, 1995; Thompson & Higgins, 1991;
Wu et al., 2009). As discussed in Chapter Two, the term affect has been operationalized in
numerous ways. This has made the study of affect particularly problematic. Therefore, I spent
considerable time discussing affect, how it was being operationalized in the current research,
and why. Likewise, I used previously validated instruments from the psychology literature to
measure affect. This process has led to the conclusion that trait positive affect, one of many

150
different types of affect, appears to be related to the information security behavior of home
users.
In addition to general conclusions that may be drawn about the research problem, I will
discuss some of the issues related to the specific threats examined in this research. I will begin
this discussion by examining the threat of computer performance compromise. This will be
followed by a discussion on the threats of personal information compromise and loss of data
and files.
Computer Performance Compromise
Computer performance compromise is a significant threat encountered by home users.
The causes of this threat can vary substantially. Nonetheless, there are measures that
individuals should take to mitigate this threat. The current research suggests that those with
higher levels of self-efficacy related to the measures necessary to mitigate this threat are more
likely to engage in such measures. These measures include having computer maintenance tasks
performed on a regular basis, using a firewall, having the computer scanned for malware, and
making sure updates to both the operating system and other software that is installed on the
computer are performed on a regular basis. Thus, those with a greater belief that they will be
able to successfully perform these tasks are more likely to do so.
One of the antecedents that may lead to higher levels of self-efficacy is trait positive
affect. Therefore, the statistically significant relationship between trait positive affect and self-
efficacy in this study is important and of great practical significance. At least for the threat of
computer performance compromise, individuals with higher levels of trait positive affect are

151
more likely to have higher levels of self-efficacy, and as noted above, more likely to perform the
measures necessary to mitigate against this threat.
In addition to self-efficacy, this research suggests that individuals with higher levels of
trait positive affect believe they are less vulnerable to having the performance of their
computer compromised. This optimism bias is consistent with a significant line of research on
affect and its effect on decision making (Borkenau & Mauer, 2006; Helweg-Larsen & Shepperd,
2001; Lerner & Keltner, 2001; Rhee et al., 2005; Waters, 2008). While this finding is important,
the practical significance of it may be minimal based on the lack of statistical significance
between perceived threat vulnerability and the performance of tasks necessary to mitigate the
threat of computer performance compromise. However, it is interesting that this was the only
threat in which this relationship was supported. This may be in part related to how threat
severity was measured, which is discussed next. Or, perhaps something unique to this type of
threat is at work.
Although three hypotheses were supported, eight of them were not. This includes the
hypothesis that higher levels of perceived threat severity are associated with higher levels of
information security behavior necessary to mitigate the threat of computer performance
compromise. Interestingly, this hypothesis was supported in the other two surveys. It is
possible that the compromise of computer performance is more abstract to home users. Losing
important data or files and/or having one’s personal information compromised are real things
that can be observed and significantly impact individuals. In contrast, even when the
performance of a computer is compromised, it may still be usable to a certain extent. Thus, this

152
may explain why the perceived severity of the threat is not associated with the behavior
required to mitigate the threat. Abstract information is more difficult for individuals to use than
information that is more concrete in nature (Borgida & Nisbett, 1977). Likewise, when the
consequences are perceived as hypothetical (e.g., computer performance compromise) then
individuals are less risk-averse than when they are perceived as real (e.g., losing an important
file) (Slovic, 1969).
Alternatively, it is possible that the severity of the threat of computer performance
compromise is not statistically related to the performance of responses necessary to mitigate
this threat due to the number of other computing devices owned by individuals. Table 27
illustrates the type and number of computing devices owned by individuals that participated in
the three surveys with a total number of almost three devices owned per individual. In fact, the
average number of individuals that own two, three, or four or more computing devices is 90%,
63%, and 29%, respectively. Thus, 90% of individuals have at least one other computing device
at their disposal if something were to go wrong with their primary computer.

153
Table 27: Ownership of Computing Devices by Survey Participants
Computer
Performance Compromise
Personal Information Compromise
Loss of Data and Files
Average
Smartphones
Average number 0.79 0.84 0.89 0.84
Percent that own 75% 78% 81% 78%
Tablets
Average number 0.56 0.56 0.57 0.56
Percent that own 47% 53% 53% 51%
Laptops
Average number 0.87 0.94 0.94 0.92
Percent that own 79% 87% 85% 84%
Desktops
Average number 0.61 0.59 0.62 0.61
Percent that own 58% 55% 58% 57%
Total devices owned
Average number 2.83 2.93 3.03 2.93
Percent that own 2+ 87% 90% 94% 90%
Percent that own 3+ 58% 65% 66% 63%
Percent that own 4+ 26% 29% 33% 29%
These numbers may also explain the lack of statistical significance between perceived
threat vulnerability and information security responses necessary to mitigate the threat of
computer performance compromise. However, it is also possible that something else is at work
here. In contrast to perceived threat severity in which the general hypothesis was supported in
the other two surveys, the same is not true for perceived threat vulnerability. I speculate that
this is due to how the construct was measured. This research was interested in measuring
behavior, rather than the intention to perform a behavior. Thus, it is reasonable to assume that
if individuals already perform a large number of responses necessary to mitigate a threat that
they would not perceive themselves as vulnerable to the threat. In fact, it is possible that they
may perceive themselves as less vulnerable than those that do not take such actions. In this
survey on computer performance compromise and the survey that examined the threat of

154
losing one’s data and files, a negative relationship was found rather than the hypothesized
positive one between perceived threat vulnerability and behavior, albeit not statistically
significant.
Similar results have been found in the past (Crossler, 2010). This suggests a limitation
with respect to PMT, especially as it relates to surveys without manipulations and the
measurement of behavior rather than behavioral intention. Perhaps an approach to address
this would be to word the questions differently by adding a qualifier before the rest of the
question for each question that measures this construct. This qualifier would take into account
how vulnerable they believe they would be if they were not to perform the responses
necessary to mitigate the threat. For example, a new indicator might be: “If I were not to take
the necessary measures to protect the performance of my computer from being compromised,
then I would be at risk.”
Another hypothesis that was not supported is worth discussing further. For the other
two surveys in this research that examined the threats of personal information compromise
and the loss of data and files, higher levels of perceived response costs were associated with
lower levels of performing the responses necessary to mitigate the threats. The same was not
true in the survey that examined the threat of computer performance compromise. Thus, the
costs associated with mitigating this threat do not appear to be a significant barrier to
performing the necessary responses. It is unclear why this was the case for the computer
performance compromise threat, but not the other two threats. Perhaps for many individuals
the necessary responses are highly automated and thus require little in the way of costs. As a

155
result, performing the necessary responses may not be associated with the amount of time,
energy, and effort involved. After all, the number of responses necessary to mitigate the
computer performance compromise threat is less than the number of responses for either of
the other two threats.
Next, I will discuss issues particular to the threat of personal information compromise.
Personal Information Compromise
Having one’s personal information compromised can take many different forms,
including identity theft, harassment, embarrassment, physical harm, etc. In this survey, three of
the 11 hypotheses were supported, including higher levels of perceived threat severity being
associated with higher levels of information security behavior. Thus, those that believed the
consequences of having their personal information compromised would be severe were more
likely to engage in the responses necessary to mitigate this threat. However, if the costs of
mitigating this threat were perceived as high then they were less likely to engage in these
responses. An important component of all of this is their belief in being able to carry out these
responses in the first place. Individuals with higher levels of self-efficacy were more likely to
engage in these responses.
In addition to these three hypotheses that were supported, eight of them were not. Two
of these warrant further discussion. First, individuals with higher levels of trait positive affect
were found to also have higher levels of perceived threat severity, which is the opposite of
what was hypothesized. It is unclear why this was the case, but similar results were found in the
other two surveys (i.e., positive correlation); albeit a statistically significant relationship was

156
found in the current survey only. It is possible that this is because individuals’ desire to preserve
and protect their higher level of trait positive affect (Isen & Patrick, 1983; Isen & Simmonds,
1978) superseded any increase in “braveness,” per se. This finding has been found previously
and it has been hypothesized that this opposite effect may be due to the specific circumstance
under investigation (Isen & Patrick, 1983; Isen & Simmonds, 1978).
Another interesting finding from this survey on the threat of personal information
compromise is the lack of support for the hypothesis that higher levels of trait positive affect
are associated with higher levels of information security self-efficacy. This hypothesis was
supported in the other two surveys at the 0.01 significance level, but was not supported in this
survey at even the 0.10 significance level. Again, it is possible that the context of this type of
threat and associated responses makes it somehow different from the other two threats. Over
the past decade, there has been a tremendous rise in the availability and use of social
networking sites (Castells, 2011; Livingstone & Brake, 2010). Despite the concern by users of
these services to protect their personal information, they nonetheless find satisfaction in
sharing said information (Dwyer, Hiltz, & Passerini, 2007; Stutzman, 2006). Rather than act as
simple consumers of information on a social networking platform such as Facebook, individuals
opt to become producers as well. Thus, individuals who are concerned about their privacy also
enjoy sharing their information and as a result put themselves at an increased level of risk. In
summary, while it is unclear why there was not support for this hypothesis in this survey, it is
clear that there are significant differences between this threat and the other threats, including
the often contradictory behavior associated with this threat. These differences may explain in
part why this hypothesis was not supported here.

157
Next, I will discuss the threat of losing one’s data and files.
Loss of Data and Files
Losing important data and files can be devastating for an individual. In the past,
individuals in part held onto their precious memories with photo albums and other mementos.
This has evolved over the past decade as digital photography has become the dominant format
for pictures and photography itself has become ubiquitous with most everyone having a
smartphone with a built-in camera. While there are many advantages to this evolution, losing
important data and files may mean losing a reminder of a special day, event, or person.
Likewise, other data may include important financial documents, health records, etc. Thus, this
threat is an important threat like the others, but also different in how it can impact individuals.
In the survey that examined this threat, the largest number of hypotheses—four—were
supported when compared to the other two surveys. This included the relationships between
perceived threat severity, perceived response costs, and self-efficacy with the responses
necessary to mitigate this threat. Additionally, higher levels of trait positive affect was
associated with higher levels of self-efficacy.
In contrast to the other two surveys, there were no hypotheses that were only
supported or not supported in this survey. However, there are some additional hypotheses that
have not yet been discussed as they were not supported in any of the surveys. These will be
discussed next.

158
Other Observations
In addition to the threat-specific observations made above, there are some additional
observations that will be discussed. First, higher levels of perceived response efficacy were not
associated with higher levels of performing the responses necessary to mitigate a threat in any
of the surveys. In other words, the effectiveness of the responses in mitigating the threat did
not seem to matter to any significant degree in whether or not the responses were performed.
This is in contrast to other information security research in which perceived response efficacy
has had a statistically significant relationship with behavior (Ifinedo, 2012; Woon et al., 2005;
Workman et al., 2008). Likewise, other than research that has examined perceived response
efficacy’s association with subsequent behavior, it has been a good predictor of behavior in
several different types of PMT research (e.g., concurrent behavior) (Floyd et al., 2000; Milne et
al., 2000).
The reason for this lack of support in the current research is not known, but it is possible
that the multi-dimensional nature of the second order formative construct caused issues with
the results. In other words, the second-order formative construct perceived response efficacy
was formed by the reflective constructs that represented each of the necessary responses.
While this possible confounding issue did not prevent statistically significant relationships for
some of the other hypotheses, it does not preclude the possibility that they were impacted
nonetheless. Modeling the responses individually (i.e., examine the dimensions of the
constructs individually) for each threat may help determine if this is a factor or not.
Second, none of the three hypotheses associated with trait negative affect were
statistically significant in any of the surveys. However, all nine of the hypotheses were in the

159
hypothesized direction. It is possible that using the higher order dimensions of trait affect
confounded any possible statistical significance for the components that make up trait negative
affect. In particular, a lower level component of trait negative affect, anger, has been shown to
influence decision-making differently than the other lower level components (Lerner & Keltner,
2000, 2001). Similar to positive affect, anger is generally associated with lower perceptions of
risk. Thus, this lends support to exploring this further by examining the lower order
components of trait affect for both trait positive and negative affect rather than just the higher
order dimensions as was done here.
Next, I discuss implications for theory.
Implications for Theory
In this research, two theoretical traditions were employed to examine the role trait
affect has on the information security behavior of home users. These traditions were Protection
Motivation Theory (Maddux & Rogers, 1983; Rogers, 1975) and affect, as articulated by Watson
et al. (Watson et al., 1992, 1988; Watson & Clark, 1991, 1994, 1997; Watson & Tellegen, 1985;
Watson & Walker, 1996).
Protection Motivation Theory
With respect to Protection Motivation Theory, this research further confirms that the
only consistent component of the theory is the role self-efficacy has in explaining human
behavior. Self-efficacy was not even a part of the original formulation of the theory (Rogers,
1975), but was added shortly thereafter given the work of Bandura and others (Bandura, 1977,

160
1982; Maddux & Rogers, 1983). This is not to discount the impact that the other components of
the theory have had on our understanding of many different types of human behavior over the
past 30 years; rather, it exemplifies how these components may vary significantly depending on
the specific behavior under investigation. I noted this possibility throughout this research,
which is part of the reason why three separate threats were identified and explored further—
each threat triggers different behaviors. However, what is particularly noteworthy in the
current research is that three different threats were compared to one another with the same
methods used for development of the instruments and subsequent collection and analysis of
data. Thus, this provides perhaps some of the strongest evidence yet that the specific threat
under investigation matters with respect to the efficacy of PMT in explaining behavior. I will
explore this issue further in the next couple of paragraphs.
As noted in Chapter Five and the current chapter, the same hypotheses were not
supported in all three surveys except for the relationship between self-efficacy and behavior.
While it is easy to state that this lack of consistency with respect to which hypotheses are
supported is due to the threat and associated responses (i.e., behaviors) under investigation,
the reason why this appears to be the case is less clear and should be explored further.
Although it is difficult to determine the reason in the current research, it is nonetheless worth
contemplating a few possibilities. For example, general threats (e.g., compromise of one’s
information security) may elicit a stronger sense of both perceived threat severity and
perceived threat vulnerability given the all-encompassing nature of these more general threats
when compared to specific threats (e.g., loss of data and files). Likewise, the perceived
response cost and perceived response efficacy would also encompass much more in the way of

161
responses, their effectiveness, and the cost to execute them. This could include both implicit
(i.e., what the participant perceives they are) and explicit (i.e., what is actually noted by the
researcher in how the questions are structured). Thus, studies that take this approach may
receive more general support for the different PMT hypotheses.
Furthermore, specific threats and their associated responses may be nuanced in ways
we do not yet fully understand. For example, computer performance compromise may be more
abstract to home users than losing data and files. Conceivably, most everyone can imagine the
impact of losing an important file, whereas the compromise of computer performance may be
more of a nuisance than a specific concrete outcome. Likewise, performing the responses
necessary to mitigate these threats may take varying levels of knowledge, skills, and abilities. It
is interesting to note that self-efficacy had a stronger relationship with performing the
responses necessary to mitigate computer performance compromise than with the responses
necessary to mitigate the loss of data and files. In contrast, the costs related to performing
these responses was statistically significant for the threat of losing data and files, but not for
computer performance compromise. This implies that the time, energy, and effort required to
prevent the loss of data and files is more important for mitigating the threat of losing data and
files than it is for computer performance compromise, while at the same time believing in being
able to perform the responses is relatively less important.
Although most of the hypotheses related to Protection Motivation Theory were not
supported for each survey, the theory did help explain and account for the self-reported
behavior in each of the surveys. In fact, between 46.5% and 56% of the variance in each

162
research model was accounted for by the five primary constructs in Protection Motivation
Theory.
Trait Affect
In contrast to a single theory, such as Protection Motivation Theory, affect has been
studied, conceptualized, and operationalized in numerous ways. There is no single definition of
affect in the literature. As a result, I deconstructed affect based on the literature so that it could
be reconstructed in the most logical manner possible. I relied on the work of not only Watson
and his various collaborators as noted earlier, but on numerous other approaches that have
been taken (Ekman & Davidson, 1994; Finucane et al., 2000; Isen & Geva, 1987; Lerner &
Keltner, 2001; Peters, Västfjäll, Gärling, & Slovic, 2006; Slovic et al., 2005; C. A. Smith &
Ellsworth, 1985; C. A. Smith & Kirby, 2001; Tiedens & Linton, 2001; Tomkins, 1978; van Dijk &
Zeelenberg, 2006). Developing a narrow focus of the type of affect under investigation in this
research allowed me to demonstrate in a more definitive manner that trait affect in general,
and trait positive affect in particular, may play a role in understanding the information security
behavior of home users. The role it may play is through its function as an antecedent to three of
the five primary constructs of Protection Motivation Theory: perceived threat severity,
perceived threat vulnerability, and self-efficacy.
The impact of trait affect on these three constructs is consistent with other research (R.
Baron, 1990; Rhodes & Pivik, 2011; Treasure et al., 1996; Waters, 2008; Wu et al., 2009).
However, it is profound with respect to the current context given the lack of consistent and
methodical approaches to incorporating affect into information security research. The primary
implication for theory from this research then is the need to conceptualize and operationalize

163
affect in a very intentional and methodical manner for any study in which one wishes to
measure it. There should not be any lingering questions in a study with respect to what is
meant by affect. While affect and its many different conceptualizations can be interpreted
differently, the important point is that the interpretation is done in the first place. It will be
exceedingly difficult to compare different studies on affect if this is not done, let alone build
upon our collective state of knowledge on the subject.
In the current study this was done. The scope was narrow, but also had great focus. I did
not attempt to determine how emotions elicited from an event impact the behavior related to
that event. I also did not attempt to determine how an individual’s current affective state may
alter his decisions with respect to information security behavior. While these are related to trait
affect in different ways, each type of affect is also unique and should be measured accordingly.
Instead, I focused on the generally stable and lifelong type of affect—trait affect.
Trait negative affect was not shown to have a statistically significant relationship with
any of the three Protection Motivation Theory constructs in any of the three surveys conducted
in this research. In contrast, trait positive affect did have a statistically significant relationship in
some instances. This may suggest that further research with a higher level of granularity may be
warranted. I discuss this at the end of this chapter. It may also suggest that similar to the
constructs of PMT, the specific threat under investigation does matter. Alternatively, this lack of
consistency may possibly be due to trait affect being less important in these circumstances than
state and/or integral affect.
Next, I discuss the implications for policy and practice.

164
Implications for Policy and Practice
In addition to the theoretical implications discussed above, this research also has
implications for both policy and practice. First, I discuss what this research may mean for the
private sector. This is followed by a discussion on the implications of this research for public
sector policy.
Private Sector
Implications for the private sector consist of two primary components: 1) the private
sector as a consumer of information security behavior through its employees, and 2) the private
sector as a producer of information security products.
First, this research suggests that trait positive affect, at least, may act as an antecedent
to the information security behavior of individuals. While the focus has been on the home user,
employees of organizations are de facto home users once outside of the organizational
environment. Likewise, as I discussed in Chapter One the home user’s information security
behavior can have a significant impact on the organization in which they work. For example,
over two-thirds of individuals in one study reported using their home system to perform work
tasks (Furnell et al., 2007, p. 412). Furthermore, the information security behavior of individuals
in the home environment may very well be similar to their behavior in an organizational
environment. Thus, the importance of understanding why individuals behave a certain way with
respect to information security is critical.

165
As noted above, this research indicates that affect may play a role in information
security behavior. Consequently, individuals with lower levels of trait positive affect may need
additional encouragement and confidence building to improve their self-efficacy as it relates to
performing information security tasks. This research is also consistent with other research on
the connection between positive affect and self-efficacy (R. Baron, 1990; Bryan & Bryan, 1991;
Grindley et al., 2008; Treasure et al., 1996). Thus, organizations may view this connection in a
more generic sense, even outside of the information security arena. The hypothesized
relationship between trait positive affect and perceived threat severity and perceived threat
vulnerability received only marginal support in the current research, but is another factor that
should perhaps be taken into account.
Second, the development of products that incorporate an information security
component comes largely from the private sector. This includes products from companies such
as Symantec, Microsoft, and Facebook. While it may not always be reasonable or preferred to
survey customers to determine their trait positive affect, systems can be incorporated into
many products that make them easier to learn, understand, and control with respect to
information security and privacy. This may help compensate for those individuals with lower
levels of self-efficacy, whether it is due to lower levels of trait positive affect or perhaps some
other cause. Those with lower levels of self-efficacy related to performing an information
security response so that a threat may be mitigated are less likely to do so than those with
higher levels of self-efficacy. This must be addressed and future research can look at how this
may be done most effectively.

166
Public Sector Policy
The implications of this research from a public sector policy standpoint include three
components: education, awareness, and regulations. First, educational attainment by
individuals is associated with self-efficacy; those with higher levels of self-efficacy are more
likely to do well in academic settings, while those with lower levels of self-efficacy will not do as
well (Bandura, Barbaranelli, Caprara, & Pastorelli, 1996; Bandura, 1993). However, this is only
part of the feedback loop. Individuals that acquire new skills and abilities improve their level of
self-efficacy related to the topic. Education with respect to information security tasks should
therefore be tailored to individuals of all levels. Those with the least ability stand to gain the
most, both in terms of knowledge and self-efficacy. This improved self-efficacy will provide
them with the confidence to learn more. Information security education should be
incorporated into the curriculum at all levels of education, including elementary, secondary,
and higher education. Policy makers will need to determine the most feasible way to do this,
whether it is with existing teachers that may have limited knowledge themselves, or through
special sessions by trained outside experts.
Related to the education component is awareness. This includes awareness by health
care providers, educators, and others. They need to be made aware of the impact lower levels
of trait positive affect may have on self-efficacy and what the end result of low levels of self-
efficacy may be in a wide array of domains—including information security. As discussed in
Chapter One, the consequences of poor information security behavior can be devastating with
a significant financial impact to the individual. Imagine an individual with low levels of trait
positive affect that must now deal with identity theft or some other serious consequence

167
related to an information security threat. While more research is needed to better understand
the impact trait positive affect may have on risk perceptions and under what conditions, this
should also be part of the awareness equation.
Finally, some consideration should be given to regulating the industry. This may involve
making it much simpler to manage user credentials or increase levels of privacy on social
networking sites (e.g., Facebook), or perhaps require certain default settings. When
information security tasks are overly complex and require a high level of self-efficacy, it can be
easy to default to poor information security practices. For example, Facebook’s default setting
for profile pictures is for them to be public. There is not a setting to change this until after a
picture has been uploaded. In other words, profile pictures are public by default with no
recourse to change this default setting. Having profile pictures public may not be desirable for
some populations, including minors. Ultimately, it is preferable for industry to regulate itself,
but this often does not happen to the extent that is needed for the public good.
Next, I discuss some limitations associated with this research.
Limitations
In this section, I discuss several limitations of this research. This includes common
method bias, social desirability bias, survey length, sample source and composition, the
possibility that other constructs that were not used may be quite valuable, and the limitations
inherent with surveys insofar as causation is concerned. Common method bias is discussed first.

168
Common Method Bias
Common method bias was addressed in Chapter Five, but remains a possibility in any
type of research in which a single method is used. When common method bias does exist, a
certain amount of the variance is due to the single method used rather than due to theoretical
reasons (Malhotra et al., 2006; Podsakoff et al., 2003). In this research, surveys were used.
While certain procedures can be performed to limit and test for common method bias, it can
never be ruled out completely.
Social Desirability Bias
In addition to common method bias, there is also social desirability bias. Social
desirability bias involves participants answering questions in a manner consistent with what
they believe is the socially acceptable answer (DeVellis, 2012; Tourangeau et al., 2000). It has
been a concern for several decades in research that requires responses from individuals,
including survey research.
Furthermore, the more sensitive the questions are then the greater likelihood for social
desirability bias to enter the picture. The questions in these three surveys did involve some
questions that could be construed as sensitive, such as the questions designed to measure trait
positive affect and trait negative affect. Nonetheless, the procedures used in these surveys help
mitigate the desire to answer questions in a socially acceptable manner. For instance, the
participants did not have a former relationship with the researcher, either personally or
professionally as Amazon’s Mechanical Turk was used rather than word of mouth, listservs, etc.
Additionally, the participants did not provide any personally identifiable information and thus
their responses were anonymous to the researcher. Finally, the administration of surveys

169
without the researcher present generally allows for an individual to provide more honest
answers than in-person interviews or in-person survey administration (Nederhof, 1985).
While social desirability bias cannot be excluded and thus is a potential limitation of this
research, the techniques employed do help mitigate it. In addition to mitigating the effects of
social desirability bias, there are also ways to measure this, including through the incorporation
of specific questions (Strahan & Gerbasi, 1972). However, whenever additional questions are
added to a survey it has the potential to create other problems related to survey length.
Survey Length
The three surveys used in this research were of varying lengths. The survey that
examined the threat of personal information compromise was the longest of the three surveys.
When surveys are long they are more apt to cause survey fatigue in which participants are
more likely to discontinue the survey prior to completion or perhaps be less thoughtful in their
responses as they progress (Fowler, 1995).
However, this does not appear to be a significant factor in these three surveys. The
average completion time for all three surveys was approximately 11 minutes. The rejection rate
due to failure to answer the quality control questions correctly was actually higher for the loss
of data and files survey compared to the personal information compromise survey. Likewise,
there was no noticeable difference between those that started the longer survey but failed to
complete it and those that started a shorter survey and failed to complete it.
Therefore, while the evidence suggests that survey length was not a contributing factor
to participant drop-outs or the quality of their responses, it cannot be completely ruled out.

170
Sample Source and Composition
In addition to survey length, the population the participants are recruited from can also
impact the results. Amazon’s Mechanical Turk was used for these surveys and does not fully
represent the U.S. population.
First, they all have access to a computer. This is not particularly problematic for this
research since the purpose is to measure information security behavior with respect to
computer usage.
Second, the participants are generally younger and more educated than the U.S.
population as a whole, including those that use the Internet (Dupuis et al., 2013; Horton et al.,
2011; Ross et al., 2010). While this is useful on the one hand since younger individuals use
computers and the Internet at a higher rate than older individuals, it also means the results
may not be generalizable to older individuals.
Finally, the participants are self-selected to partake in the surveys. They are being
compensated and this is their primary motivation for participating. Other individuals may do so
to earn extra credit, help a researcher out, etc. Thus, there is generally some motivation for a
participant to complete a survey that may or may not impact the results. With respect to
Amazon’s Mechanical Turk, they are also motivated to complete the survey accurately since
failing quality control questions may impact their worker rating and ability to receive
compensation for a project (Ipeirotis et al., 2010; Mason & Watts, 2010).
Overall, Amazon’s Mechanical Turk workers are not completely representative of the
U.S. population as discussed in Chapters Three and Five and this is a limitation that must be

171
taken into account. However, they generally do provide significantly greater geographic
representation and age distribution than what is often found in survey research and the quality
of the responses are comparable to other administration techniques (Dupuis et al., 2013;
Ipeirotis et al., 2010; Sears, 1986).
Other Constructs
As noted in Chapter One, the purpose of this research was to learn a lot about a little
rather than a little about a lot. In the current context, the primary focus was on affect. This was
narrowed considerably by examining trait positive affect and trait negative affect. There are
several other types of affect that can and should be explored in future research in this area
given the results found here, as well as countless other possible constructs that may provide
additional insight into the information security behavior of home users.
Surveys and Causation
In addition to other possible constructs, there are inherent limitations involved in survey
research. The underlying goal of this research was to provide insight into the relationships
between the constructs, including the development of hypotheses related to causation based
on theoretical grounds. The actual hypotheses related to causation will ultimately be tested in
later research using experiments. However, given the largely unexplored nature of the
relationships under investigation in this study, it is important to first properly characterize said
relationships prior to testing manipulations through experiments. Therefore, while some of the
hypotheses related to causation were supported, causation itself cannot be proven through the
use of surveys alone.

172
Further Research
Finally, with the above limitations in mind I discuss future research directions. I begin
this discussion by examining the possibility of incorporating the PANAS (Watson et al., 1988)
used in this research into other validated instruments within the home user domain, including
those developed by Crossler and Bélanger (2010, 2012).
Incorporating Trait Affect into Other Validated Instruments
Trait affect in the current study was operationalized as two separate constructs—trait
positive affect and trait negative affect. Although the hypotheses associated with the two
constructs were not supported in a majority of the cases, it does not preclude their efficacy at
helping us to more completely understand the information security behavior of home users.
Therefore, one approach that will be pursued is to incorporate these two constructs with other
previously validated survey instruments. The lack of support for some of the hypotheses in the
current research may be a function of the instruments developed, threats chosen, the context
of information security, or perhaps how affect was operationalized in this research.
Other Types of Affect
Therefore, it may be prudent to consider other ways in which affect may be
operationalized. This could include an examination of trait affect with a higher level of
granularity than was done in this research. For example, in the current research I limited affect
to the higher order dimensions of positive affect and negative affect and looked specifically at
trait affect, a generally life-long type of affect. In future research, I will examine the lower
dimensions of affect, such as joviality, self-assurance, hostility, sadness, and fear. Additionally, I
will explore the role of state affect, both incidental and integral. Finally, I will consider other

173
instruments beyond the ones designed by Watson and his collaborators (Watson et al., 1988;
Watson & Clark, 1994).
Dimensions of Personality
Related to trait affect is personality. Trait positive affect is associated with the
personality traits extraversion and positive temperament, while trait negative affect is
associated with the personality traits neuroticism and negative temperament (Watson et al.,
1992; Watson & Clark, 1994, 1997). It is possible that what is being captured by the measures
for trait positive affect and trait negative affect, may more aptly be captured by measures for
various personality dimensions. An instrument such as the Big Five Inventory may serve this
purpose well (Benet-Martínez & John, 1998; John & Benet-Martinez, 2000; John & Srivastava,
1999). This will be pursued in future research to account for this possibility.
Experiments
Finally, in future research I will be incorporating experiments with appropriate
manipulations. While survey research is a powerful and useful tool for understanding human
behavior, it does have limitations. Several of the hypotheses with causative statements that
were developed based on theory and were supported empirically based on results from one or
more of the three surveys do suggest causation. However, as discussed earlier in this chapter a
survey is not able to fully assess the issue of causation. While causation cannot necessarily be
proven, per se, experiments do provide perhaps the strongest evidence for causation
(Krathwohl, 2004). The experiments themselves will include one or more survey instruments
and carefully designed manipulations. The manipulations will be designed to alter one’s state
affect or an individual’s self-efficacy as it relates to performing information security tasks.

174
Conclusion
This research contributes to our collective state of knowledge on the information
security behavior of home users. While several of the hypotheses were not supported, several
others were supported. Based on these results and as noted in Chapter One, this research
makes five primary contributions.
First, we know that trait positive affect may play a role in the information security
behavior of home users, primarily through its impact on self-efficacy. Second, this research
extended the application of Protection Motivation Theory (PMT), which has been the primary
underlying theory used by researchers in understanding the information security behavior of
home users. Third, in addition to extending PMT, this research examined three different threats
using the same methods and data analysis procedures. The data analysis suggests that the
specific threat that is examined using PMT does impact the efficacy of PMT as a theoretical
framework for understanding human behavior. Fourth, the importance of self-efficacy in
understanding why individuals engage in certain information security behavior but not others
was reaffirmed.
Finally, this research contributes to the discipline through its development and
validation of three survey instruments designed to measure the responses necessary to
mitigate three threats: computer performance compromise, personal information compromise,
and the loss of data and files. New research models that are developed and tested may use one
or more of these instruments as part of their overall survey instrument.

175
The plans for future research will help answer some of the questions raised in this
research, while also bringing to light new questions and research avenues.

176
Bibliography
Abraham, C. S., Sheeran, P., Abrams, D., & Spears, R. (1994). Exploring Teenagers’ Adaptive and
Maladaptive Thinking in relation to the Threat of HIV Infection. PSYCHOLOGY AND
HEALTH, 9(4), 253.
Adams, A., & Sasse, M. A. (1999). Users are not the Enemy. Communications of the ACM,
42(12), 41–46.
Ajzen, I. (1985). From intentions to actions: A theory of planned behavior. In J. Kuhl & J.
Beckman (Eds.), Action-control: From cognition to behavior (pp. 11–39). Heidelberg,
Germany: Springer.
Ajzen, I. (1991). The theory of planned behavior. Organizational Behavior and Human Decision
Processes, 50(2), 179–211. doi:doi: DOI: 10.1016/0749-5978(91)90020-T
Aladwani, A. M., & Palvia, P. C. (2002). Developing and validating an instrument for measuring
user-perceived web quality. Information & Management, 39(6), 467–476.
doi:10.1016/S0378-7206(01)00113-6
Anderson, C. L., & Agarwal, R. (2010). Practicing Safe Computing: A Multimethod Empirical
Examination of Home Computer User Security Behavioral Intentions. MIS Quarterly,
34(3), 613–643.
Aytes, K., & Connolly, T. (2004). Computer Security and Risky Computing Practices: A Rational
Choice Perspective. Journal of Organizational & End User Computing, 16(3).
Babbie, E. (1998). The practice of social research (8th ed.). Belmont CA: Wadsworth Pub. Co.

177
Bandura, A. (1977). Self-efficacy: Toward a unifying theory of behavioral change. Psychological
Review, 84(2), 191–215.
Bandura, A. (1982). Self-efficacy mechanism in human agency. American Psychologist, 37(2),
122–147.
Bandura, A. (1986). Social foundations of thought and action : a social cognitive theory.
Englewood Cliffs, N.J.: Prentice-Hall.
Bandura, A. (1991). Social cognitive theory of self-regulation. Theories of Cognitive Self-
Regulation, 50(2), 248–287. doi:10.1016/0749-5978(91)90022-L
Bandura, A. (1993). Perceived self-efficacy in cognitive development and functioning.
Educational Psychologist, 28(2), 117–148.
Bandura, A. (1997). Self-efficacy : the exercise of control. New York: W.H. Freeman.
Bandura, A. (2006). Guide for constructing self-efficacy scales. Self-Efficacy Beliefs of
Adolescents, 5, 307–337.
Bandura, A., Barbaranelli, C., Caprara, G. V., & Pastorelli, C. (1996). Multifaceted impact of self‐
efficacy beliefs on academic functioning. Child Development, 67(3), 1206–1222.
Baron, R. (1990). Environmentally Induced Positive Affect: Its Impact on Self-Efficacy, Task
Performance, Negotiation, and Conflict. Journal of Applied Social Psychology, 20(5),
368–384. doi:10.1111/j.1559-1816.1990.tb00417.x
Baron, R. M., & Kenny, D. A. (1986). The moderator-mediator variable distinction in social
psychological research: conceptual, strategic, and statistical considerations. Journal of
Personality and Social Psychology, 51(6), 1173–82.

178
Becker, J.-M., Klein, K., & Wetzels, M. (2012). Hierarchical latent variable models in PLS-SEM:
guidelines for using reflective-formative type models. Long Range Planning, 45(5), 359–
394.
Benet-Martínez, V., & John, O. P. (1998). Los Cinco Grandes across cultures and ethnic groups:
Multitrait-multimethod analyses of the Big Five in Spanish and English. Journal of
Personality and Social Psychology, 75(3), 729.
Besnard, D., & Arief, B. (2004). Computer security impaired by legitimate users. Computers &
Security, 23(3), 253–264.
Birge, C. (2009). Enhancing Research into Usable Privacy and Security. In Proceedings of the
27th Annual International Conference on Design of Communication, SIGDOC 2009.
Bloomington, Indiana: ACM.
Bishop, M. (2003). Computer Security: Art and Science. Boston: Addison-Wesley.
Bishop, M. (2005). Introduction to Computer Security. Boston: Addison-Wesley.
Bollen, K., & Lennox, R. (1991). Conventional wisdom on measurement: A structural equation
perspective. Psychological Bulletin, 110(2), 305.
Borgida, E., & Nisbett, R. (1977). The Differential Impact of Abstract vs. Concrete Information on
Decisions. Journal of Applied Psychology, 7(3), 259–271.
Borkenau, P., & Mauer, N. (2006). Personality, emotionality, and risk prediction. Journal of
Individual Differences, 27(3), 127–135.
Boulkedid, R., Abdoul, H., Loustau, M., Sibony, O., & Alberti, C. (2011). Using and Reporting the
Delphi Method for Selecting Healthcare Quality Indicators: A Systematic Review. PLoS
ONE, 6(6), 1–9.

179
Bower, G. H. (1981). Mood and memory. American Psychologist, 36(2), 129–148.
Bryan, T., & Bryan, J. (1991). Positive Mood and Math Performance. Journal of Learning
Disabilities, 24(8), 490–494.
Buck, R. (1975). Nonverbal communication affect in children. Journal of Personality and Social
Psychology, 31(4), 644–53.
Buhrmester, M., Kwang, T., & Gosling, S. D. (2011). Amazon’s Mechanical Turk A New Source of
Inexpensive, Yet High-Quality, Data? Perspectives on Psychological Science, 6(1), 3–5.
Cannoy, S., Palvia, P. C., & Schilhavy, R. (2006). A Research Framework for Information Systems
Security. Journal of Information Privacy & Security, 2(2), 3–30.
Castells, M. (2011). The rise of the network society: The information age: Economy, society, and
culture (Vol. 1). John Wiley & Sons.
Cazier, J. A., & Medlin, B. D. (2006). Password Security: An Empirical Investigation into E-
Commerce Passwords and Their Crack Times. Information Systems Security, 15(6), 45–
55.
Chin, W. W. (1998a). Commentary: Issues and opinion on structural equation modeling. MIS
Quarterly.
Chin, W. W. (1998b). The partial least squares approach to structural equation modeling. In G.
A. Marcoulides (Ed.), Modern methods for business research (pp. 295–336). Mahwah,
N.J.: Lawrence Erlbaum.
Chu, G. C. (1966). Fear arousal, efficacy, and imminency. Journal of Personality and Social
Psychology, 4(5), 517–524.

180
Churchill, G. A. (1979). A paradigm for developing better measures of marketing constructs.
Journal of Marketing Research, 16(1), 64–73. doi:10.2307/3150876
Churchill Jr., G. A., & Peter, J. P. (1984). Research Design Effects on the Reliability of Rating
Scales: A Meta-Analysis. Journal of Marketing Research (JMR), 21(4), 360–375.
Cismaru, M., & Lavack, A. M. (2007). Interaction effects and combinatorial rules governing
Protection Motivation Theory variables: a new model. Marketing Theory, 7(3), 249–270.
doi:10.1177/1470593107080344
Clore, G. L., Gasper, K., & Garvin, E. (2001). Affect as Information. In J. P. Forgas (Ed.), Handbook
of Affect and Social Cognition (pp. 121–144). Mahwah, N.J.: L. Erlbaum Associates.
Coffin, R. J., & MacIntyre, P. D. (1999). Motivational influences on computer-related affective
states. Computers in Human Behavior, 15(5), 549–569. doi:10.1016/S0747-
5632(99)00036-9
Cohen, J. (1988). Statistical power analysis for the behavioral sciences. Routledge Academic.
Compeau, D., Higgins, C. A., & Huff, S. (1999). Social Cognitive Theory and Individual Reactions
to Computing Technology: A Longitudinal Study. MIS Quarterly, 23(2), 145–158.
Compeau, D. R., & Higgins, C. A. (1995). Computer Self-Efficacy: Development of a Measure and
Initial Test. MIS Quarterly, 19(2), 189–211.
Creeger, M. (2010). CTO Roundtable: Malware Defense. Commun. ACM, 53(4), 43–49.
doi:http://doi.acm.org/10.1145/1721654.1721670
Creswell, J. W. (2007). Qualitative inquiry & research design: choosing among five approaches
(2nd ed.). Thousand Oaks: Sage Publications.

181
Crossler, R. (2010). Protection Motivation Theory: Understanding Determinants to Backing Up
Personal Data. In The 43rd Hawaii International Conference on System Sciences (HICSS)
(p. 10). Koloa, Kauai, Hawaii.
Crossler, R., & Bélanger, F. (2006). The effect of computer self-efficacy on security training
effectiveness. doi:http://doi.acm.org/10.1145/1231047.1231075
Crossler, R., & Bélanger, F. (2009). The Effects of Security Education Training and Awareness
Programs and Individual Characteristics on End User Security Tool Usage. Journal of
Information System Security, 5(3), 3–22.
Crossler, R., & Bélanger, F. (2010). Determinants of Individual Security Behahaviors (pp. 78–
127). Presented at the The Dewald Roode Information Security Workshop, Waltham,
Massachusetts.
Crossler, R., & Bélanger, F. (2012). The Quest for Complete Security Protection: An Empirical
Analysis of an Individual’s 360 Degree Protection from File and Data Loss.
Curry, L. A., & Youngblade, L. M. (2006). Negative affect, risk perception, and adolescent risk
behavior. Journal of Applied Developmental Psychology, 27(5), 468–485.
doi:10.1016/j.appdev.2006.06.001
Dabbs, J. M. J., & Leventhal, H. (1966). Effects of varying the recommendations in a fear-
arousing communication. Journal of Personality and Social Psychology, 4(5), 525–531.
Dalkey, N., & Helmer, O. (1963). An Experimental Application of the DELPHI Method to the Use
of Experts. Management Science, 9(3), 458–467.
Davis, F. D. (1986). A Technology Acceptance Model for Testing New End-User Information
Systems: Theory and Results. MIT.

182
Davis, F. D. (1989). Perceived Usefulness, Perceived Ease of Use, and User Acceptance of
Information Technology. MIS Quarterly, 13(3), 319–340.
Davis, F. D., Bagozzi, R. P., & Warshaw, P. R. (1989). User Acceptance of Computer Technology:
A Comparison of Two Theoretical Models. Management Science, 35(8), 982–1003.
Davis, F. D., Bagozzi, R. P., & Warshaw, P. R. (1992). Extrinsic and Intrinsic Motivation to Use
Computers in the Workplace. Journal of Applied Social Psychology., 22(14), 1111.
Deloitte. (2007). 2007 Global Security Survey: The Shifting Security Paradigm (pp. 1–45).
Deloitte. Retrieved from http://www.deloitte.com/assets/Dcom-
Serbia/Local%20Assets/Documents/rs_Deloitte_Global_Security_Survey_2007.pdf
DeSteno, D., Petty, R. E., Wegener, D. T., & Rucker, D. D. (2000). Beyond valence in the
perception of likelihood: The role of emotion specificity. Journal of Personality and
Social Psychology, 78(3), 397–416.
DeVellis, R. F. (2012). Scale development: theory and applications (3rd ed.). Thousand Oaks,
Calif: SAGE.
Dhamija, R., Tygar, J. D., & Hearst, M. (2006). Why Phishing Works. In CHI 2006 Proceedings,
Security. Montréal, Québec, Canada: ACM.
Diamantopoulos, A. (2006). Formative Versus Reflective Indicators in Organizational Measure
Development: A Comparison and Empirical Illustration. British Journal of Management,
17(4), 263–282.
Diamantopoulos, A., Riefler, P., & Roth, K. P. (2008). Advancing formative measurement
models. Journal of Business Research, 61(12), 1203–1218.

183
Diamantopoulos, A., & Winklhofer, H. M. (2001). Index Construction with Formative Indicators:
An Alternative to Scale Development. Journal of Marketing Research (JMR), 38(2), 269–
277.
Downs, J. S., Holbrook, M., & Cranor, L. F. (2007). Behavioral Response to Phishing Risk. In
Proceedings of the Anti-Phishing Working Groups 2nd Annual Ecrime Researchers
Summit (pp. 37–44). Pittsburgh, PA: ACM.
Druckman, J., & McDermott, R. (2008). Emotion and the Framing of Risky Choice. Political
Behavior, 30(3), 297–321.
Duffield, C. (1988). The Delphi Technique. The Australian Journal of Advanced Nursing : A
Quarterly Publication of the Royal Australian Nursing Federation, 6(2).
Dupuis, M., Crossler, R., & Endicott-Popovsky, B. (2012). The Information Security Behavior of
Home Users: Exploring a User’s Risk Tolerance and Past Experiences in the Context of
Backing Up Information. Presented at the The Dewald Roode Information Security
Workshop, Provo, Utah.
Dupuis, M., Endicott-Popovsky, B., & Crossler, R. (2013). An Analysis of the Use of Amazon’s
Mechanical Turk for Survey Research in the Cloud. Presented at the International
Conference on Cloud Security Management, Seattle, Washington.
Durndell, A., & Haag, Z. (2002). Computer self efficacy, computer anxiety, attitudes towards the
Internet and reported experience with the Internet, by gender, in an East European
sample. Computers in Human Behavior, 18(5), 521–535.
Dwyer, C., Hiltz, S. R., & Passerini, K. (2007). Trust and Privacy Concern Within Social
Networking Sites: A Comparison of Facebook and MySpace. In AMCIS (p. 339).

184
Easterby-Smith, M., Thorpe, R., & Jackson, P. (2008). Management research (3rd ed.). Los
Angeles ; London: SAGE.
Edwards, W. K., Poole, E. S., & Stoll, J. (2008). Security automation considered harmful?
doi:http://doi.acm.org/10.1145/1600176.1600182
Egelman, S., King, J., Miller, R. C., Ragouzis, N., & Shehan, E. (2007). Security user studies:
methodologies and best practices. doi:http://doi.acm.org/10.1145/1240866.1241089
Ekman, P., & Davidson, R. J. (1994). The nature of emotion : fundamental questions. New York:
Oxford University Press.
Ellis, P. D. (2010). The essential guide to effect sizes: statistical power, meta-analysis, and the
interpretation of research results. Cambridge; New York: Cambridge University Press.
Fagan, M. H., Neill, S., & Wooldridge, B. R. (2003). An Empirical Investigation into the
Relationship Between Computer Self-Efficacy, Anxiety, Experience, Support and Usage.
Journal of Computer Information Systems, 44(2), 95–104.
Fan, M., Stallaert, J., & Whinston, A. B. (2000). The Internet and the future of financial markets.
Commun. ACM, 43(11), 82–88.
Farrar, D. E., & Glauber, R. R. (1967). Multicollinearity in Regression Analysis: The Problem
Revisited. The Review of Economics and Statistics, 49(1), 92–107.
Fedorikhin, A., & Cole, C. A. (2004). Mood effects on attitudes, perceived risk and choice:
Moderators and mediators. Journal of Consumer Psychology, 14(1-2), 2–12.
Finucane, M. L. (2008). Emotion, affect, and risk communication with older adults: challenges
and opportunities. Journal of Risk Research, 11(8), 983–997.

185
Finucane, M. L., Alhakami, A., Slovic, P., & Johnson, S. M. (2000). The affect heuristic in
judgments of risks and benefits. Journal of Behavioral Decision Making, 13(1), 1–17.
Fishbein, M., & Ajzen, I. (1975). Belief, attitude, intention, and behavior : an introduction to
theory and research. Reading, Mass.: Addison-Wesley Pub. Co.
Floyd, D. L., Prentice-Dunn, S., & Rogers, R. W. (2000). A Meta-Analysis of Research on
Protection Motivation Theory. Journal of Applied Social Psychology, 30(2), 407.
Fogel, J., & Nehmad, E. (2009). Internet social network communities: Risk taking, trust, and
privacy concerns. Computers in Human Behavior, 25(1), 153–160.
doi:10.1016/j.chb.2008.08.006
Forgas, J. (1995). Mood and judgment: the affect infusion model (AIM). Psychological Bulletin,
117(1), 39–66.
Forgas, J. (2001). Introduction: Affect and Social Cognition. In J. Forgas (Ed.), Handbook of Affect
and Social Cognition (pp. 1–24). Mahwah, N.J.: L. Erlbaum Associates.
Forgas, J. (2008). Affect and Cognition. Perspectives on Psychological Science, 3(2), 94–101.
Fornell, C., & Larcker, D. F. (1981). Evaluating structural equation models with unobservable
variables and measurement error. Journal of Marketing Research, 18(1), 39–50.
doi:10.2307/3151312
Fowler, F. (1995). Improving survey questions : design and evaluation. Thousands Oaks Calif.:
Sage.
Freeman, J., & Watson, B. (2006). An application of Stafford and Warr’s reconceptualisation of
deterrence to a group of recidivist drink drivers. Accident Analysis & Prevention, 38(3),
462–471. doi:doi: DOI: 10.1016/j.aap.2005.11.001

186
Frois-Wittman, J. (1930). The judgment of facial expression. Journal of Experimental Psychology,
13(2), 113–151. doi:10.1037/h0070158
Furnell, S. (2008). End-user security culture: A lesson that will never be learnt? Computer Fraud
& Security, 2008(4), 6–9.
Furnell, S., Bryant, P., & Phippen, A. D. (2007). Assessing the security perceptions of personal
Internet users. Computers & Security, 26, 410–417.
Furnell, S., Jusoh, A., & Katsabas, D. (2006). The challenges of understanding and using security:
A survey of end-users. Computers & Security, 25(1), 27–35.
Gandhi, R., Sharma, A., Mahoney, W., Sousan, W., Qiuming Zhu, & Laplante, P. (2011).
Dimensions of Cyber-Attacks: Cultural, Social, Economic, and Political. Technology and
Society Magazine, IEEE, 30(1), 28–38.
Garuba, M., Liu, C., & Washington, N. (2008). A Comparative Analysis of Anti-Malware Software,
Patch Management, and Host-Based Firewalls in Preventing Malware Infections on
Client Computers. In Information Technology: New Generations, 2008. ITNG 2008. Fifth
International Conference on (pp. 628–632).
Gates, R. M. (2010). Quadrennial Defense Review Report. Washington, D.C.: Department of
Defense.
George, J. M. (1989). Mood and absence. Journal of Applied Psychology, 74(2), 317–324.
Gibbons, F. X., Gerrard, M., Blanton, H., & Russell, D. W. (1998). Reasoned action and social
reaction: Willingness and intention as independent predictors of health risk. Journal of
Personality and Social Psychology, 74(5), 1164–1180. doi:10.1037/0022-3514.74.5.1164

187
Gibson, D. (2011). Managing Risk in Information Systems. Sudbury, MA: Jones & Bartlett
Learning.
Grindley, E. J., Zizzi, S. J., & Nasypany, A. M. (2008). Use of Protection Motivation Theory, Affect,
and Barriers to Understand and Predict Adherence to Outpatient Rehabilitation. Physical
Therapy, 88(12).
Grös, D. F., Antony, M. M., Simms, L. J., & McCabe, R. E. (2007). Psychometric properties of the
State-Trait Inventory for Cognitive and Somatic Anxiety (STICSA): Comparison to the
State-Trait Anxiety Inventory (STAI). Psychological Assessment, 19(4), 369–381.
Gross, J. B., & Rosson, M. B. (2007). Looking for trouble: understanding end-user security
management. doi:http://doi.acm.org/10.1145/1234772.1234786
Hair, J., Black, W., Babin, B., & Anderson, R. (2010). Multivariate data analysis (7th ed.). Upper
Saddle River, NJ: Prentice Hall.
Hair, J. F., Ringle, C. M., & Sarstedt, M. (2011). PLS-SEM: Indeed a Silver Bullet. Journal of
Marketing Theory & Practice, 19(2), 139–152.
Hair, J. F., Ringle, C. M., & Sarstedt, M. (2012). Partial Least Squares: The Better Approach to
Structural Equation Modeling? Analytical Approaches to Strategic Management: Partial
Least Squares Modeling in Strategy Research, 45(5–6), 312–319.
doi:10.1016/j.lrp.2012.09.011
Harris, S. (2013). CISSP exam guide (Sixth edition.). New York: McGraw-Hill.
Hasson, F., Keeney, S., & McKenna, H. (2000). Research Guidelines for the Delphi Survey
Technique. Journal of Advanced Nursing, 32(4), 1008–1015. doi:10.1046/j.1365-
2648.2000.t01-1-01567.x

188
Hellman, H. (1976). Technophobia : getting out of the technology trap. New York; Philadelphia:
M. Evans ; distributed by Lippincott.
Helweg-Larsen, M., & Shepperd, J. A. (2001). Do Moderators of the Optimistic Bias Affect
Personal or Target Risk Estimates? A Review of the Literature. Personality and Social
Psychology Review, 5(1), 74–95. doi:10.1207/S15327957PSPR0501_5
Heponiemi, T., Elovainio, M., Näätänen, P., & Keltikangas-Järvinen, L. (2006). Cognition and
Neurosciences: Experiencing positive affect and negative affect during stress:
Relationships to cardiac reactivity and to facial expressions. Scandinavian Journal of
Psychology, 47(5), 327–337.
Herath, T., & Rao, H. R. (2009a). Encouraging information security behaviors in organizations:
Role of penalties, pressures and perceived effectiveness. Decision Support Systems,
47(2), 154–165. doi:doi: DOI: 10.1016/j.dss.2009.02.005
Herath, T., & Rao, H. R. (2009b). Protection motivation and deterrence: a framework for
security policy compliance in organisations. European Journal of Information Systems,
18(2), 106–125. doi:10.1057/ejis.2009.6
Horton, J. J., Rand, D. G., & Zeckhauser, R. J. (2011). The online laboratory: Conducting
experiments in a real labor market. Experimental Economics, 14(3), 399–425.
Housen, P. (2008). What the Resident Meant to Say: Use of Cognitive Interviewing Techniques
to Develop Questionnaires for Nursing Home Residents. Gerontologist, 48(2), 158–169.
Howe, A. E., Ray, I., Roberts, M., Urbanska, M., & Byrne, Z. (2012). The psychology of security
for the home computer user. In Security and Privacy (SP), 2012 IEEE Symposium on (pp.
209–223). IEEE.

189
Howe, J. (2006). The Rise of Crowdsourcing. Wired, 14(6). Retrieved from
http://www.wired.com/wired/archive/14.06/crowds.html
Hu, Q., & Dinev, T. (2005). Is Spyware an Internet Nuisance or Public Menace? Communications
of the ACM, 48(8), 61–66. doi:Article
Hubbard, D. W. (2010). How to measure anything : finding the value of “intangibles” in
business. Hoboken, N.J.: Wiley.
Ifinedo, P. (2012). Understanding information systems security policy compliance: An
integration of the theory of planned behavior and the protection motivation theory.
Computers & Security, 31(1), 83–95. doi:10.1016/j.cose.2011.10.007
Ipeirotis, P. G., Provost, F., & Wang, J. (2010). Quality management on Amazon Mechanical
Turk. In Proceedings of the ACM SIGKDD Workshop on Human Computation (pp. 64–67).
Washington DC: ACM.
Isen, A. M. (1984). Toward understanding the role of affect in cognition. In R. S. Wyer & T. K.
Srull (Eds.), Handbook of social cognition (pp. 179–236). Hillsdale, N.J.: L. Erlbaum
Associates.
Isen, A. M., & Geva, N. (1987). The Influence of Positive Affect on Acceptable Level of Risk: The
Person with a Large Canoe Has a Large Worry. Organizational Behavior & Human
Decision Processes, 39(2).
Isen, A. M., Nygren, T. E., & Ashby, F. G. (1988). Influence of positive affect on the subjective
utility of gains and losses: It is just not worth the risk. Journal of Personality and Social
Psychology, 55(5), 710–717.

190
Isen, A. M., & Patrick, R. (1983). The Effect of Positive Feelings on Risk Taking: When the Chips
Are Down. Organizational Behavior & Human Performance, 31(2).
Isen, A. M., & Simmonds, S. F. (1978). The Effect of Feeling Good on a Helping Task that is
Incompatible with Good Mood. Social Psychology, 41(4), 346–349.
Jarvis, C. B., Mackenzie, S. B., Podsakoff, P. M., Mick, D. G., & Bearden, W. O. (2003). A Critical
Review of Construct Indicators and Measurement Model Misspecification in Marketing
and Consumer Research. Journal of Consumer Research, 30(2).
Jenness, A. (1932). The recognition of facial expressions of emotion. Psychological Bulletin
Psychological Bulletin, 29(5), 324–350.
John, O. P., & Benet-Martinez, V. (2000). Measurement: Reliability, construct validation, and
scale construction. Handbook of Research Methods in Social and Personality Psychology.
John, O. P., & Srivastava, S. (1999). The Big Five trait taxonomy: History, measurement, and
theoretical perspectives. Handbook of Personality: Theory and Research, 2, 102–138.
Johnson, E. J., & Tversky, A. (1983). Affect, generalization, and the perception of risk. Journal of
Personality and Social Psychology, 45(1), 20–31. doi:10.1037/0022-3514.45.1.20
Johnson, R. (2011). Security Policies and Implementation Issues. Sudbury, Mass: Jones & Bartlett
Learning.
Johnson, R. D., & Marakas, G. M. (2000). Research Report: The Role of Behavioral Modeling in
Computer Skills Acquisition--Toward Refinement of the Model. Information Systems
Research, 11(4), 402.
Johnston, A. C., & Warkentin, M. (2010). Fear Appeals and Information Security Behaviors: An
Empirical Study. MIS Quarterly, 34(3), 548–566.

191
Kahneman, D., Slovic, P., & Tversky, A. (1982). Judgment under Uncertainty: Heuristics and
Biases. Cambridge University Press.
Keesler, M. P., & Keesler, B. (2008). Mohawk: Discovering the Valley of the Crystals. [New York];
Utica, N.Y.: The Keesler Family ; Distributed by North Country Books.
Kittur, A., Chi, E. H., & Suh, B. (2008). Crowdsourcing user studies with Mechanical Turk. In
Proceedings of the twenty-sixth annual SIGCHI conference on Human factors in
computing systems (pp. 453–456). Florence, Italy: ACM.
Klasnja, P., Consolvo, S., Jung, J., Greenstein, B. M., LeGrand, L., Powledge, P., & Wetherall, D.
(2009). “When I am on Wi-Fi, I am fearless”: privacy concerns & practices in everyday
Wi-Fi use. doi:http://doi.acm.org/10.1145/1518701.1519004
Klepper, S., & Nagin, D. (1989). The Deterrent Effect of Perceived Certainty and Severity of
Punishment. Criminology, 27(4), 721–746.
Kobus, M. B. W., Rietveld, P., & van Ommeren, J. N. (2013). Ownership versus on-campus use of
mobile IT devices by university students. Computers & Education, 68(0), 29–41.
doi:10.1016/j.compedu.2013.04.003
Krathwohl, D. (2004). Methods of educational and social science research : an integrated
approach (2nd ed.). Long Grove Ill.: Waveland Press.
Lacohée, H., Crane, S., & Phippen, A. (2006). Trustguide: Final Report (pp. 1–100). Bristol:
Trustguide. Retrieved from http://www.trustguide.org.uk/Trustguide%20-
%20Final%20Report.pdf
LaRose, R., Rifon, N. J., & Enbody, R. (2008). Promoting Personal Responsibility for Internet
Safety. Communications of the ACM, 51(3), 71–76. doi:Article

192
LaRose, R., Rifon, N., Liu, S., & Lee, D. (2005). Understanding Online Safety Behavior: A
Multivariate Model. In Communication and Technology Division International
Communication Association. New York.
Larrick, R. P., & Boles, T. L. (1995). Avoiding Regret in Decisions with Feedback: A Negotiation
Example. Organizational Behavior and Human Decision Processes, 63(1), 87–97.
doi:10.1006/obhd.1995.1064
Lazarus, R. S. (1963). A Laboratory Approach to the Dynamics of Psychological Stress.
Administrative Science Quarterly, 8(2), 192–213.
Lee, D., Larose, R., & Rifon, N. (2008). Keeping our network safe: a model of online protection
behaviour. Behaviour & Information Technology, 27(5), 445–454.
doi:10.1080/01449290600879344
Lee, Y., & Kozar, K. A. (2005). Investigating Factors Affecting the Adoption of Anti-Spyware
Systems. Communications of the ACM, 48(8), 72–77. doi:Article
Lee, Y., & Larsen, K. R. (2009). Threat or coping appraisal: determinants of SMB executives’
decision to adopt anti-malware software. EJI European Journal of Information Systems,
18(2), 177–187.
Lerner, J. S., & Keltner, D. (2000). Beyond valence: Toward a model of emotion-specific
influences on judgement and choice. Cognition & Emotion, 14(4), 473–493.
doi:10.1080/026999300402763
Lerner, J. S., & Keltner, D. (2001). Fear, anger, and risk. Journal of Personality and Social
Psychology, 81(1), 146–159. doi:10.1037/0022-3514.81.1.146

193
Leventhal, H., & Singer, R. P. (1966). Affect arousal and positioning of recommendations in
persuasive communications. Journal of Personality and Social Psychology, 4(2), 137–146.
Leventhal, H., & Watts, J. C. (1966). Sources of resistance to fear-arousing communications on
smoking and lung cancer. Journal of Personality, 34(2), 155. doi:Article
Leventhal, H., Watts, J. C., & Pagano, F. (1967). Effects of fear and instructions on how to cope
with danger. Journal of Personality and Social Psychology, 6(3), 313–321.
Liang, H., & Xue, Y. (2010). Understanding Security Behaviors in Personal Computer Usage: A
Threat Avoidance Perspective. Journal of the Association for Information Systems, 11(7),
394–413.
Livingstone, S., & Brake, D. R. (2010). On the rapid rise of social networking sites: New findings
and policy implications. Children & Society, 24(1), 75–83.
Loewenstein, G. F., Weber, E. U., Hsee, C. K., & Welch, N. (2001). Risk as feelings. Psychological
Bulletin, 127(2), 267–286.
Loomes, G., & Sugden, R. (1982). Regret Theory: An Alternative Theory of Rational Choice
Under Uncertainty. Economic Journal, 92(368), 805–824.
Lowry, P. B., Lowry, P., & Gaskin, J. (2014). Partial Least Squares (PLS) Structural Equation
Modeling (SEM) for Building and Testing Behavioral Causal Theory: When to Choose It
and How to Use It. IEEE Transactions on Professional Communication.
Lu, J., Xie, X., & Zhang, R. (2013). Focusing on appraisals: How and why anger and fear influence
driving risk perception. Journal of Safety Research, 45(0), 65–73.
doi:10.1016/j.jsr.2013.01.009

194
Maddux, J. E., & Rogers, R. W. (1983). Protection motivation and self-efficacy: A revised theory
of fear appeals and attitude change. Journal of Experimental Social Psychology, 19(5),
469–479.
Mahmoud, M. M., Baltrusaitis, T., & Robinson, P. (2012). Crowdsourcing in emotion studies
across time and culture. In Proceedings of the ACM multimedia 2012 workshop on
Crowdsourcing for multimedia (pp. 15–16). Nara, Japan: ACM.
Malhotra, N. K., Kim, S. S., & Patil, A. (2006). Common Method Variance in Is Research: A
Comparison of Alternative Approaches and a Reanalysis of past Research. Management
Science, 52(12), 1865–1883. doi:10.2307/20110660
Malware Threat Rises Despite Drop in Direct Cost Damages. (2007). Computer Economics
Report, 29(7), 12–19. doi:Article
Mannan, M., & van Oorschot, P. C. (2008). Security and usability: the gap in real-world online
banking. doi:http://doi.acm.org/10.1145/1600176.1600178
Marakas, G. M., Johnson, R. D., & Clay, P. F. (2007). The Evolving Nature of the Computer Self-
Efficacy Construct: An Empirical Investigation of Measurement Construction, Validity,
Reliability and Stability Over Time. Journal of the Association for Information Systems,
8(1), 15–46.
Mason, W., & Watts, D. J. (2010). Financial incentives and the performance of crowds. ACM
SigKDD Explorations Newsletter, 11(2), 100–108.
Menascé, D. (2003). Security performance. Internet Computing, IEEE, 7(3), 84–87.

195
Miller, R. C., & Wu, M. (2005). Fighting Phishing at the User Interface. In L. F. Cranor & S.
Garfinkel (Eds.), Security and usability : designing secure systems that people can use
(pp. 275–292). Beijing; Farnham; Sebastopol, CA: O’Reilly.
Milne, S., Orbell, S., & Sheeran, P. (2002). Combining motivational and volitional interventions
to promote exercise participation: Protection motivation theory and implementation
intentions. British Journal of Health Psychology, 7(2), 163–184.
Milne, S., Sheeran, P., & Orbell, S. (2000). Prediction and Intervention in Health-Related
Behavior: A Meta-Analytic Review of Protection Motivation Theory. Journal of Applied
Social Psychology, 30(1).
Narvaez, J., Endicott-Popovsky, B., Seifert, C., Aval, C., & Frincke, D. A. (2010). Drive-by-
Downloads. In The 43rd Hawaii Internal Conference on System Sciences (p. 10). Koloa,
Kauai, Hawaii.
Nederhof, A. J. (1985). Methods of coping with social desirability bias: A review. European
Journal of Social Psychology, 15(3), 263–280. doi:10.1002/ejsp.2420150303
Ng, B.-Y., & Rahim, M. A. (2005). A socio-behavioral study of home computer users’ intention to
practice security. In Proceedings of the Ninth Pacific Asia Conference on Information
Systems (pp. 7–10).
Norman, P., Boer, H., & Seydel, E. R. (2005). Protection motivation theory. In M. Conner & P.
Norman (Eds.), Predicting Health Behaviour: Research and Practice with Social Cognition
Models (pp. 81 – 126). Maidenhead: Open University Press. Retrieved from
http://purl.utwente.nl/publications/53445

196
Nov, O., & Wattal, S. (2009). Social computing privacy concerns: antecedents and effects.
doi:http://doi.acm.org/10.1145/1518701.1518754
Ntoumanis, N., & Biddle, S. J. H. (1998). The relationship of coping and its perceived
effectiveness to positive and negative affect in sport. Personality and Individual
Differences, 24(6), 773–788. doi:10.1016/S0191-8869(97)00240-7
Ouellette, J. A., & Wood, W. (1998). Habit and intention in everyday life: the multiple processes
by which past behavior predicts future behavior. Psychological Bulletin, 124(1), 54.
Palardy, N., Greening, L., Ott, J., Holderby, A., & Atchison, J. (1998). Adolescents’ health
attitudes and adherence to treatment for insulin-dependent diabetes mellitus. Journal
of Developmental and Behavioral Pediatrics : JDBP, 19(1), 31–7.
Paolacci, G., Chandler, J., & Ipeirotis, P. (2010). Running experiments on amazon mechanical
turk. Judgment and Decision Making, 5(5), 411–419.
Peters, E., Västfjäll, D., Gärling, T., & Slovic, P. (2006). Affect and decision making: a “Hot”•
topic. Journal of Behavioral Decision Making, 19(2), 79–85.
Peterson, R. A. (1994). A Meta-analysis of Cronbach’s Coefficient Alpha. Journal of Consumer
Research, 21(2), 381–391.
Petter, S., Straub, D., & Rai, A. (2007). Specifying formative constructs in information systems
research. MIS Q., 31(4), 623–656.
Podsakoff, P. M., MacKenzie, S. B., Lee, J.-Y., & Podsakoff, N. P. (2003). Common method biases
in behavioral research: a critical review of the literature and recommended remedies.
Journal of Applied Psychology, 88(5), 879.

197
Polk, D. E., Cohen, S., Doyle, W. J., Skoner, D. P., & Kirschbaum, C. (2005). State and trait affect
as predictors of salivary cortisol in healthy adults. Psychoneuroendocrinology, 30(3),
261–272. doi:10.1016/j.psyneuen.2004.08.004
Powell, C. (2003). The Delphi Technique: Myths and Realities. Journal of Advanced Nursing,
41(4), 376–382. doi:10.1046/j.1365-2648.2003.02537.x
Pritchard, S. (2011). The Rise and Fall of Online Credit Fraud. Infosecurity, 8(2), 24–27. doi:doi:
DOI: 10.1016/S1754-4548(11)70022-5
Rea, L. M., & Parker, R. A. (1997). Designing and Conducting Survey Research: A Comprehensive
Guide (2nd ed.). Public Productivity & Management Review., 21(2), 209.
Rhee, H.-S., Kim, C., & Ryu, Y. U. (2009). Self-efficacy in information security: Its influence on
end users’ information security practice behavior. Computers & Security, 28(8), 816–
826. doi:10.1016/j.cose.2009.05.008
Rhee, H.-S., Ryu, Y., & Kim, C.-T. (2005). I Am Fine but You Are Not: Optimistic Bias and Illusion
of Control on Information Security. In ICIS 2005 Proceedings.
Rhodes, N., & Pivik, K. (2011). Age and gender differences in risky driving: The roles of positive
affect and risk perception. Accident Analysis & Prevention, 43(3), 923–931.
doi:10.1016/j.aap.2010.11.015
Richardson, R. (2009). 2009 CSI Computer Crime and Security Survey Executive Summary.
Computer Security Institute.
Ringle, C. M., Sarstedt, M., & Straub, D. W. (2012). A critical look at the use of PLS-SEM in MIS
quarterly. MIS Q., 36(1), iii–xiv.
Ringle, C., Wende, S., & Will, A. (2005). SmartPLS 2.0 (Beta). Hamburg (www.smartpls.de).

198
Rippetoe, P. A., & Rogers, R. W. (1987). Effects of components of protection-motivation theory
on adaptive and maladaptive coping with a health threat. Journal of Personality and
Social Psychology, 52(3), 596–604.
Rogers, R. W. (1975). A Protection Motivation Theory of Fear Appeals and Attitude Change.
Journal of Psychology, 91(1), 93.
Rogers, R. W. (1983). Cognitive and physiological processes in fear appeals and attitude change:
A revised theory of protection motivation. In J. T. Cacioppo & R. E. Petty (Eds.), Social
psychophysiology : a sourcebook (pp. 153–176). New York: Guilford Press.
Rogers, R. W., & Deckner, C. W. (1975). Effects of fear appeals and physiological arousal upon
emotion, attitudes, and cigarette smoking. Journal of Personality and Social Psychology,
32(2), 222–230. doi:10.1037/0022-3514.32.2.222
Rogers, R. W., & Thistlethwaite, D. L. (1970). Effects of fear arousal and reassurance on attitude
change. Journal of Personality and Social Psychology, 15(3), 227–233.
Rosal, M., Carbone, E., & Goins, K. V. (2003). Use of cognitive interviewing to adapt
measurement instruments for low-literate Hispanics. The Diabetes Educator, 29(6).
Roskos-Ewoldsen, D. R., & Yu, H. J. R. (2004). Fear appeal messages affect accessibility of
attitudes toward the threat and adaptive behaviors. GCMM Communication
Monographs, 71(1), 49–69.
Ross, J., Irani, L., Silberman, M., Zaldivar, A., & Tomlinson, B. (2010). Who are the
crowdworkers?: shifting demographics in mechanical turk. In Proceedings of the 28th of
the international conference extended abstracts on Human factors in computing systems
(pp. 2863–2872). ACM.

199
Salisbury, W. D., Pearson, R. A., Pearson, A. W., & Miller, D. W. (2001). Perceived security and
World Wide Web purchase intention. Industrial Management & Data Systems, 101(4),
165–177. doi:10.1108/02635570110390071
Schlosberg, H. (1941). A scale for the judgment of facial expressions. Journal of Experimental
Psychology, 29(6), 497–510. doi:10.1037/h0061489
Schlosberg, H. (1952). The description of facial expressions in terms of two dimensions. Journal
of Experimental Psychology, 44(4), 229–237.
Schwarz, N., & Clore, G. L. (1996). Feelings and Phenomenal experiences. In E. T. Higgins & A.
W. Kruglanski (Eds.), Social psychology : handbook of basic principles (pp. 433–65). New
York: Guilford Press.
Schwarz, N., & Clore, G. L. (2003). Mood as Information: 20 Years Later. Psychological Inquiry,
14(3), 296–303.
Sears, D. O. (1986). College sophomores in the laboratory: Influences of a narrow data base on
social psychology’s view of human nature. Journal of Personality and Social Psychology,
51(3), 515.
Shin, D. (2010). The effects of trust, security and privacy in social networking: A security-based
approach to understand the pattern of adoption. Modelling User Experience - An
Agenda for Research and Practice, 22(5), 428–438. doi:10.1016/j.intcom.2010.05.001
Shin, D.-H. (2010). The effects of trust, security and privacy in social networking: A security-
based approach to understand the pattern of adoption. Modelling User Experience - An
Agenda for Research and Practice, 22(5), 428–438. doi:10.1016/j.intcom.2010.05.001

200
Sills, S. J., & Song, C. (2002). Innovations in Survey Research: An Application of Web-Based
Surveys. Social Science Computer Review, 20(1), 22–30.
Slovic, P. (1969). Differential effects of real versus hypothetical payoffs on choices among
gambles. Journal of Experimental Psychology, 80(3, Pt.1), 434–437.
Slovic, P., Finucane, M. L., Peters, E., & MacGregor, D. G. (2007). The affect heuristic. European
Journal of Operational Research, 177(3), 1333–1352.
Slovic, P., Peters, E., Finucane, M. L., & MacGregor, D. G. (2005). Affect, Risk, and Decision
Making. Health Psychology, 24(4), S35–S40.
Smith, A. (2010). Home Broadband 2010. Washington, D.C.: Pew Research Center. Retrieved
from http://pewinternet.org/Reports/2010/Home-Broadband-2010.aspx
Smith, C. A., & Ellsworth, P. C. (1985). Patterns of cognitive appraisal in emotion. Journal of
Personality and Social Psychology, 48(4), 813–838. doi:10.1037/0022-3514.48.4.813
Smith, C. A., & Kirby, L. D. (2001). Affect and Cognitive Appraisal Processes. In J. P. Forgas (Ed.),
Handbook of Affect and Social Cognition (pp. 75–92). Mahwah, N.J.: L. Erlbaum
Associates.
Sood, A. K., & Enbody, R. J. (2013). Crimeware-as-a-service—A survey of commoditized
crimeware in the underground market. International Journal of Critical Infrastructure
Protection, 6(1), 28–38. doi:10.1016/j.ijcip.2013.01.002
South, S. (2011). Level of Agreement Between Self and Spouse in the Assessment of Personality
Pathology. Assessment, 18(2), 217–226.
Storm Calms but Malware Threat Grows Ten-Fold. (2008). Total Telecom Magazine, 14.
doi:Article

201
Strahan, R., & Gerbasi, K. C. (1972). Short, homogeneous versions of the Marlow-Crowne Social
Desirability Scale. Journal of Clinical Psychology, 28(2), 191–193. doi:10.1002/1097-
4679(197204)28:2<191::AID-JCLP2270280220>3.0.CO;2-G
Straub, D. W. (1989). Validating Instruments in MIS Research. MIS Quarterly, 13(2).
Straub Jr, D. W. (1990). Effective IS Security: An Empirical Study. Information Systems Research,
1(3), 255–276.
Stutzman, F. (2006). An evaluation of identity-sharing behavior in social network communities.
Journal of the International Digital Media and Arts Association, 3(1), 10–18.
Sun, H., & Zhang, P. (2006). The Role of Affect in Information Systems Research: A Critical
Survey and a Research Model. In D. F. Galletta & P. Zhang (Eds.), Human-computer
interaction and management information systems applications (Vol. 6, pp. 295 – 329).
New York: M.E. Sharpe. Retrieved from http://site.ebrary.com/id/10178082
Symantec. (2007). Symantec Internet Security Threat Report: Trends for January-June 07.
Symantec Enterprise Security.
Thatcher, J. B., & Perrewe, P. L. (2002). An Empirical Examination of Individual Traits as
Antecedents to Computer Anxiety and Computer Self-Efficacy. MIS Quarterly, 26(4),
381–396.
Thompson, R. L., & Higgins, C. A. (1991). Personal Computing: Toward a Conceptual Model of
Utilization. MIS Quarterly, 15(1).
Tiedens, L. Z., & Linton, S. (2001). Judgment under emotional certainty and uncertainty: The
effects of specific emotions on information processing. Journal of Personality and Social
Psychology, 81(6), 973–988.

202
Tognazzini, B. (2005). Design for Usability. In L. F. Cranor & S. Garfinkel (Eds.), Security and
usability : designing secure systems that people can use (pp. 31–46). Beijing; Farnham;
Sebastopol, CA: O’Reilly.
Tomkins, S. (1978). Script theory: differential magnification of affects. Nebraska Symposium on
Motivation. Nebraska Symposium on Motivation, 26, 201–36.
Tourangeau, R., Rips, L. J., & Rasinski, K. A. (2000). The psychology of survey response.
Cambridge, U.K.; New York: Cambridge University Press.
Treasure, D. C., Monson, J., & Lox, C. (1996). Relationship Between Self-Efficacy, Wrestling
Performance, and Affect Prior to Competition. Sport Psychologist, 10(1).
Trevino, L. K., & Webster, J. (1992). Flow in Computer-Mediated Communication: Electronic
Mail and Voice Mail Evaluation and Impacts. Communication Research., 19(5), 539–573.
Triandis, H. C. (1977). Interpersonal behavior. Monterey, Calif.
Van Dijk, E., & Zeelenberg, M. (2006). The dampening effect of uncertainty on positive and
negative emotions. Journal of Behavioral Decision Making, 19(2), 171–176.
doi:10.1002/bdm.504
Vance, A., Siponen, M., & Pahnila, S. (2012). Motivating IS security compliance: Insights from
Habit and Protection Motivation Theory. Information & Management, 49(3–4), 190–
198. doi:10.1016/j.im.2012.04.002
Vasey, M. W., Harbaugh, C. N., Mikolich, M., Firestone, A., & Bijttebier, P. (2013). Positive
affectivity and attentional control moderate the link between negative affectivity and
depressed mood. Personality and Individual Differences, 54(7), 802–807.
doi:10.1016/j.paid.2012.12.012

203
Waters, E. A. (2008). Feeling good, feeling bad, and feeling at‐risk: a review of incidental affect’s
influence on likelihood estimates of health hazards and life events. Journal of Risk
Research, 11(5), 569–595. doi:10.1080/13669870701715576
Watson, D., & Clark, L. A. (1991). Self- versus peer ratings of specific emotional traits: Evidence
of convergent and discriminant validity. Journal of Personality and Social Psychology,
60(6), 927–940.
Watson, D., & Clark, L. A. (1994). The PANAS-X: Manual for the Positive and Negative Affect
Schedule - Expanded Form. University of Iowa. Retrieved from
http://ir.uiowa.edu/psychology_pubs/11
Watson, D., & Clark, L. A. (1997). Measurement and Mismeasurement of Mood: Recurrent and
Emergent Issues. Journal of Personality Assessment, 68(2), 267.
Watson, D., Clark, L. A., McIntyre, C. W., & Hamaker, S. (1992). Affect, personality, and social
activity. Journal of Personality and Social Psychology, 63(6), 1011–1025.
Watson, D., Clark, L. A., & Tellegen, A. (1988). Development and Validation of Brief Measures of
Positive and Negative Affect: The PANAS Scales. Journal of Personality and Social
Psychology, 54(6), 1063–1070. doi:doi:
Watson, D., & Tellegen, A. (1985). Toward a consensual structure of mood. Psychological
Bulletin, 98(2), 219–35.
Watson, D., & Walker, L. (1996). The long-term stability and predictive validity of trait measures
of affect. Journal of Personality and Social Psychology, 70(3), 567–77.

204
Webb, T. L., & Sheeran, P. (2006). Does changing behavioral intentions engender behavior
change? A meta-analysis of the experimental evidence. Psychological Bulletin, 132(2),
249–268.
Webster, J., & Martocchio, J. J. (1992). Microcomputer Playfulness: Development of a Measure
with Workplace Implications. MIS Quarterly, 16(2), 201–226.
Wetzels, M., Odekerken-Schröder, G., & Van Oppen, C. (2009). Using PLS Path Modeling for
Assessing Hierarchical Construct Models: Guidelines and Empirical Illustration. Mis
Quarterly, 33(1).
Witte, K., Cameron, K. A., McKeon, J. K., & Berkowitz, J. M. (1996). Predicting risk behaviors:
Development and validation of a diagnostic scale. Journal of Health Communication,
1(4), 317–341.
Wood, W., Quinn, J. M., & Kashy, D. A. (2002). Habits in everyday life: Thought, emotion, and
action. Journal of Personality and Social Psychology, 83(6), 1281–1297.
Woon, I., Tan, G.-W., & Low, R. (2005). A Protection Motivation Theory Approach to Home
Wireless Security.
Workman, M., Bommer, W., & Straub, D. (2008). Security lapses and the omission of
information security measures: A threat control model and empirical test. Computers in
Human Behavior, 24(6), 2799–2816.
Wu, Y. “Andy,” Sherry Ryan, & John Windsor. (2009). Influence of Social Context and Affect on
Individuals’ Implementation of Information Security Safeguards. In ICIS 2009
Proceedings (p. Paper 70). AIS Electronic Library.

205
Yan, J., Blackwell, A., Anderson, R., & Grant, A. (2005). The Memorability and Security of
Passwords. In L. F. Cranor & S. Garfinkel (Eds.), Security and usability : designing secure
systems that people can use (pp. 129–142). Beijing; Farnham; Sebastopol, CA: O’Reilly.
Youn, S. (2005). Teenagers’ Perceptions of Online Privacy and Coping Behaviors: A Risk-Benefit
Appraisal Approach. Journal of Broadcasting & Electronic Media, 49(1), 86–110.
Young, J. B. (2008). Top 10 Threats to Computer Systems Include Professors and Students. The
Chronicle of Higher Education, 55(17), A9.

206
Appendix A – Computer Performance Compromise, Final Instrument
Note: The survey instrument below was broken up into sections based on the response being measured.
The definitions were above the questions for each response grouping. This was designed to make it
easier for participants to find the definitions for questions they were currently answering. Additionally,
for sections with more than one question (e.g., malware) the text “I am confident that…” was
immediately above the set of questions with each question beginning with “…”. This was done to reduce
redundancy and improve overall flow.
Definition Primary Computer: Your primary computer is the computing device you use a majority of the time that is NOT owned or issued by your employer. The Operating System (OS) of my primary computer is...
○ Windows ○ OS X (Macintosh) ○ Unix/Linux ○ Other
Please indicate the amount you agree or disagree with each statement using the following scale: Strongly Disagree, Disagree, Not Sure, Agree, Strongly Agree
Definitions Anti-malware Software: Software that protects a computer from spyware, viruses, Trojan horses, worms, etc. Computer Maintenance Tasks: Defragmenting the hard drive, emptying the trash, removing cached files, etc. Firewall: A piece of hardware or software that restricts incoming and outgoing Internet traffic to help protect a computer from malicious activity. Malware: Spyware, viruses, Trojan horses, worms, etc. Primary Computer: Your primary computer is the computing device you use a majority of the time that is NOT owned or issued by your employer.
Indicator Conditional Question Text
Updates 1 Operating System (OS) is Windows
I am confident that important updates to the OPERATING SYSTEM are installed on my primary computer on a monthly or more frequent basis.
Updates 2 Operating System (OS) is Windows
I am confident that important updates to SOFTWARE (e.g., Word, Skype) are installed on my primary computer on a monthly or more frequent basis.
Malware 1 Operating System (OS) is Windows
I am confident that my primary computer has anti-malware software that is updated automatically on a weekly or more frequent basis.
Malware 2 Operating System (OS) is Windows
I am confident that my primary computer is automatically scanned for malware in real-time (e.g., during downloads, when I visit websites, etc.).
Malware 3 Operating System (OS) is Windows
I am confident that a full system scan for malware is performed on my primary computer on a weekly or

207
more frequent basis.
Firewall 1 None I am confident that I have a firewall enabled for my primary computer.
Maintenance 1 None I am confident that computer maintenance tasks are performed on my primary computer on a monthly or more frequent basis.

208
Appendix B – Personal Information Compromise, Final Instrument
Note: The survey instrument below was broken up into sections based on the response being measured.
The definitions were above the questions for each response grouping. This was designed to make it
easier for participants to find the definitions for questions they were currently answering. Additionally,
for sections with more than one question (e.g., malware) the text “I am confident that…” was
immediately above the set of questions with each question beginning with “…”. This was done to reduce
redundancy and improve overall flow.
Definition Primary Computer: Your primary computer is the computing device you use a majority of the time that is NOT owned or issued by your employer. The Operating System (OS) of my primary computer is... ○ Windows ○ OS X (Macintosh) ○ Unix/Linux ○ Other
Please indicate the amount you agree or disagree with each statement using the following scale: Strongly Disagree, Disagree, Not Sure, Agree, Strongly Agree
Definitions Anti-malware Software: Software that protects a computer from spyware, viruses, Trojan horses, worms, etc. Encryption: Encryption is the conversion of plain text data into a format that cannot be easily understood by unauthorized people. For example, a simple word that in plain text is "cat", instead appears as something that makes no sense (e.g., H)&*HGHas87a1) to unauthorized individuals. Firewall: A piece of hardware or software that restricts incoming and outgoing Internet traffic to help protect a computer from malicious activity. Important Logins: Computer login, banking, financial, and e-commerce websites, etc. Less Important Logins: Discussion forums, blogs, social networking sites (e.g., Facebook), etc. Long and Complex Passwords: 8 or more characters in length with special characters, numbers, and a combination of upper and lower casing Malware: Spyware, viruses, Trojan horses, worms, etc. Personal Financial Information: Credit card numbers, bank routing information, etc. Primary Computer: Your primary computer is the computing device you use a majority of the time that is NOT owned or issued by your employer.
Indicator Conditional Question Text
Educate 1 Additional option provided: N/A – I live alone.
I am confident that someone in my home (i.e., you, someone else) regularly educates others in the home about proper information security behaviors.
Malware 1 Operating System (OS) is Windows
I am confident that my primary computer has anti-malware software that is updated automatically on a weekly or more frequent basis.
Malware 2 Operating System (OS) is Windows
I am confident that my primary computer is automatically scanned for malware in real-time (e.g.,

209
during downloads, when I visit websites, etc.).
Malware 3 Operating System (OS) is Windows
I am confident that a full system scan for malware is performed on my primary computer on a weekly or more frequent basis.
Firewall 1 None I am confident that I have a firewall enabled for my primary computer.
Wireless 1 None I am confident that my wireless network is using some type of encryption.
Wireless 2 None I am confident that the default password on the device (e.g., router) I use for wireless access to the Internet has been changed.
Passwords 1 None I am confident that I use long and complex passwords for important logins.
Passwords 2 None I am confident that my passwords for less important logins are NOT the same as those for important logins.
Passwords 3 None I am confident that I use a unique password for each important login.
Passwords 4 None I am confident that my usernames for less important logins are NOT the same as those for important logins.
Passwords 5 None I am confident that I change the passwords for important logins at least once every 12 months.
Email 1 None I very rarely, if ever, click on the links in emails I receive.
Email 2 None If I were to click on a link in an email I received, I would check to make sure that the link goes to a site that appears legitimate.
Email 3 None I do not click on links in emails I receive that are reportedly from a bank or other financial institution.
Financial 1
Additional option provided: N/A – I do not store my personal financial information online.
I only store my personal financial information on websites that I do regular business with.
Financial 2
Additional option provided: N/A – I do not store my personal financial information online.
I only store my personal financial information on websites that I trust.
Financial 3
Additional option provided: N/A – I do not store my personal financial information online.
I check to make sure the website is using encryption (e.g., verifying the URL starts with https://, not just http://) prior to entering personal financial information online.
InfoShar 1 None I am careful about the information I make public on the Internet.
InfoShar 2 None I am selective with whom I share my private information with on the Internet.
InfoShar 3 None I only put information on social networking sites that can

210
be viewed by friends/connections that I trust with that information.
InfoShar 4 None I understand that once I put something on the Internet, it is basically available forever, even if I delete it.
Connections 1 None I am selective in who I choose to be a friend/connection with on social networking sites.
Connections 2 None I trust those that I choose to be a friend/connection with on social networking sites.

211
Appendix C – Loss of Data and Files, Final Instrument
Note: The survey instrument below was broken up into sections based on the response being measured.
The definitions were above the questions for each response grouping. This was designed to make it
easier for participants to find the definitions for questions they were currently answering. Additionally,
for sections with more than one question (e.g., malware) the text “I am confident that…” was
immediately above the set of questions with each question beginning with “…”. This was done to reduce
redundancy and improve overall flow.
Definition Primary Computer: Your primary computer is the computing device you use a majority of the time that is NOT owned or issued by your employer. The Operating System (OS) of my primary computer is... ○ Windows ○ OS X (Macintosh) ○ Unix/Linux ○ Other
Please indicate the amount you agree or disagree with each statement using the following scale: Strongly Disagree, Disagree, Not Sure, Agree, Strongly Agree
Definitions Anti-malware Software: Software that protects a computer from spyware, viruses, Trojan horses, worms, etc. Firewall: A piece of hardware or software that restricts incoming and outgoing Internet traffic to help protect a computer from malicious activity. Malware: Spyware, viruses, Trojan horses, worms, etc. Primary Computer: Your primary computer is the computing device you use a majority of the time that is NOT owned or issued by your employer.
Indicator Conditional Question Text
Educate 1 Additional option provided: N/A – I live alone.
I am confident that someone in my home (i.e., you, someone else) regularly educates others in the home about proper information security behaviors.
Malware 1 Operating System (OS) is Windows
I am confident that my primary computer has anti-malware software that is updated automatically on a weekly or more frequent basis.
Malware 2 Operating System (OS) is Windows
I am confident that my primary computer is automatically scanned for malware in real-time (e.g., during downloads, when I visit websites, etc.).
Malware 3 Operating System (OS) is Windows
I am confident that a full system scan for malware is performed on my primary computer on a weekly or more frequent basis.
Firewall 1 None I am confident that I have a firewall enabled for my primary computer.
Permissions 1 None I am confident that I have created (or modified) the default administrator password on my primary
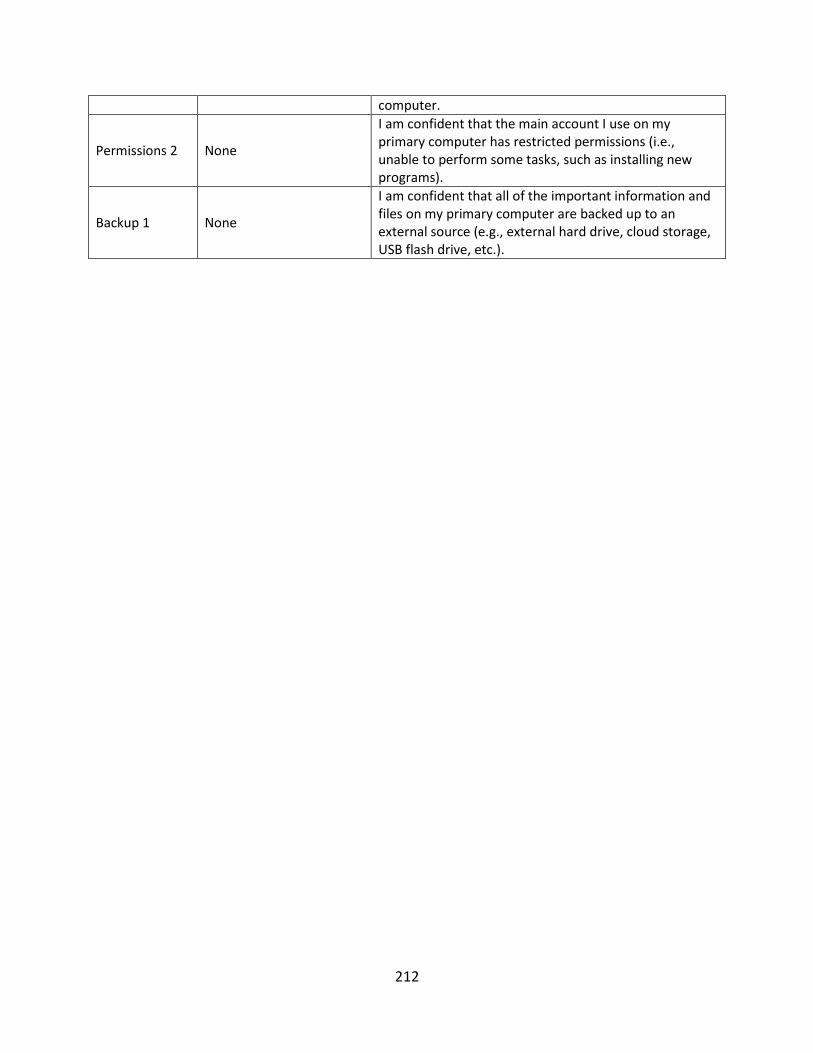
212
computer.
Permissions 2 None
I am confident that the main account I use on my primary computer has restricted permissions (i.e., unable to perform some tasks, such as installing new programs).
Backup 1 None
I am confident that all of the important information and files on my primary computer are backed up to an external source (e.g., external hard drive, cloud storage, USB flash drive, etc.).

213
Appendix D – Consent Form for Surveys
Information Security Behavior Survey
Consent
Survey on Thoughts, Beliefs, and Opinions Related to Information Security Threats and Associated
Responses
The following questionnaire is part of a research project to better understand the information security
behavior of individuals. Completing the whole survey will take about 10-20 minutes. Based on a pilot
study, the average time to complete this survey was just over 11 minutes. This survey is completely
voluntary. If you come to a question you do not want to answer, please feel free to skip to the next
question.
You may discontinue participation at any time and for any reason, including after the completion of the
survey. In the event that you choose to stop participation, you may ask me to have your answers
deleted by contacting me through email. Please take note of the date and time you worked on the
survey for this purpose. All information shared in any publications or presentations will be anonymous in
order to preserve your right to privacy.
Compensation will be received through Amazon's Mechanical Turk (MTurk) system and is limited to the
amount noted therein--$1.15. No other compensation will be provided. This research does not involve
risks beyond those encountered in daily life. If you have any questions or concerns, please contact the
researcher at the email address below, or the UW Human Subjects Division.
Investigator: Marc J. Dupuis ( [email protected] ) Project contact address: c/o Marc J. Dupuis, The
Institute of Technology, Box 358426, 1900 Commerce St, Tacoma, WA 98402-3100
CONSENT TO SURVEY PARTICIPATION
YOU MUST BE 18 YEARS OF AGE OR OLDER TO PARTICIPATE!
I certify that I am 18 years of age or older, that I can print out a copy of this consent form or otherwise
save its contents by copying and pasting into a new document, that I have read the preceding, and that I
understand its contents. By clicking on the next button ( >> ), I am freely agreeing to participate in this
study by filling out the survey.
NOTE: If you do not wish to participate in this survey then please close your browser window at this
time.

214
Appendix E – Final Survey Instrument for Computer Performance Compromise
For the following, please answer each question honestly. Be assured that your responses are
anonymous and that no attempt will be made to identify you.
Please note that while some of these questions are similar to each other, each question has a specific
purpose. Thus, please pay careful attention to each question.
Definition:
Primary Computer: Your primary computer is the computing device you use a majority of the time that
is NOT owned or issued by your employer.
The Operating System (OS) of my primary computer is...
○ Windows
○ OS X (Macintosh)
○ Unix/Linux
○ Other
Please check the devices that you own (select all that apply):
□ Smartphone (iPhone) □ Tablet (Android) □ Laptop Computer (Mac)
□ Smartphone (Android) □ Tablet (Windows) □ Desktop Computer (Mac)
□ Smartphone (Windows) □ Tablet (other) □ Laptop Computer (Linux based)
□ Smartphone (other) □ Laptop Computer (Windows) □ Desktop Computer (Linux based)
□ Tablet (iPad) □ Desktop Computer (Windows)
Which one of the following do you consider your "primary" computer?
○ Smartphone (iPhone) ○ Tablet (Android) ○ Laptop Computer (Mac)
○ Smartphone (Android) ○ Tablet (Windows) ○ Desktop Computer (Mac)
○ Smartphone (Windows) ○ Tablet (other) ○ Laptop Computer (Linux based)
○ Smartphone (other) ○ Laptop Computer (Windows) ○ Desktop Computer (Linux based)
○ Tablet (iPad) ○ Desktop Computer (Windows)

215
Please indicate the amount you agree or disagree with each statement using the following scale from
Strongly Disagree to Strongly Agree.
Display question if “Windows” is selected as the OS of the primary computer.
I am confident that… Strongly Disagree
Disagree Not Sure Agree Strongly
Agree
...important updates to the OPERATING SYSTEM are installed on my primary computer on a monthly or more frequent basis.
○ ○ ○ ○ ○
...important updates to SOFTWARE (e.g., Word, Skype) are installed on my primary computer on a monthly or more frequent basis.
○ ○ ○ ○ ○
Display question if “Windows” is selected as the OS of the primary computer.
Definitions:
Malware: Spyware, viruses, Trojan horses, worms, etc.
Anti-malware Software: Software that protects a computer from spyware, viruses, Trojan horses,
worms, etc.
I am confident that… Strongly Disagree
Disagree Not Sure Agree Strongly
Agree
...my primary computer has anti-malware software that is updated automatically on a weekly or more frequent basis.
○ ○ ○ ○ ○
...my primary computer is automatically scanned for malware in real-time (e.g., during downloads, when I visit websites, etc.).
○ ○ ○ ○ ○
...a full system scan for malware is performed on my primary computer on a weekly or more frequent basis.
○ ○ ○ ○ ○

216
Definitions:
Firewall: A piece of hardware or software that restricts incoming and outgoing Internet traffic to help
protect a computer from malicious activity.
Strongly Disagree
Disagree Not Sure Agree Strongly
Agree
I am confident that I have a firewall enabled for my primary computer.
○ ○ ○ ○ ○
Definitions:
Computer Maintenance Tasks: Defragmenting the hard drive, emptying the trash, removing cached files,
etc.
Strongly Disagree
Disagree Not Sure Agree Strongly
Agree
I am confident that computer maintenance tasks are performed on my primary computer on a monthly or more frequent basis.
○ ○ ○ ○ ○
Strongly Disagree
Disagree Not Sure Agree Strongly
Agree
I believe that having my computer performance compromised would be severe.
○ ○ ○ ○ ○
I believe that having my computer performance compromised would be serious.
○ ○ ○ ○ ○
I believe that having my computer performance compromised would be significant.
○ ○ ○ ○ ○
Strongly Disagree
Disagree Not Sure Agree Strongly
Agree
I am at risk for having the performance of my computer compromised.
○ ○ ○ ○ ○
It is likely that the performance of my computer will be compromised.
○ ○ ○ ○ ○
It is possible that the performance of my computer will be compromised.
○ ○ ○ ○ ○
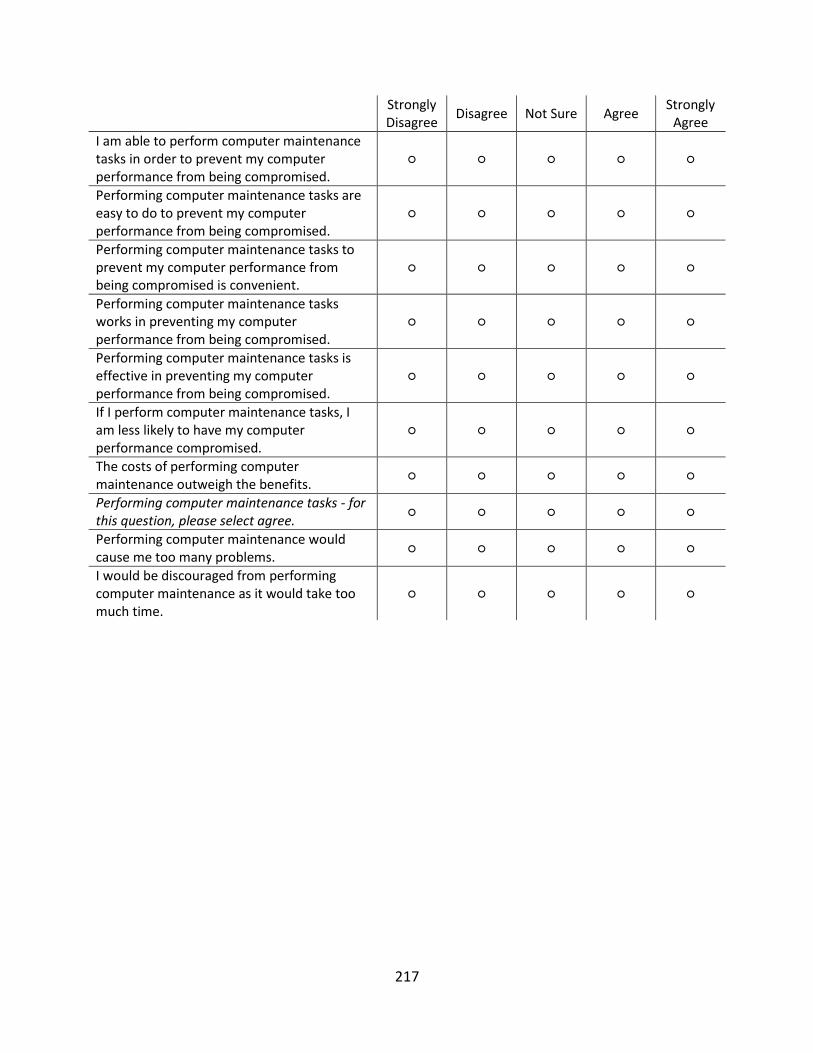
217
Strongly Disagree
Disagree Not Sure Agree Strongly
Agree
I am able to perform computer maintenance tasks in order to prevent my computer performance from being compromised.
○ ○ ○ ○ ○
Performing computer maintenance tasks are easy to do to prevent my computer performance from being compromised.
○ ○ ○ ○ ○
Performing computer maintenance tasks to prevent my computer performance from being compromised is convenient.
○ ○ ○ ○ ○
Performing computer maintenance tasks works in preventing my computer performance from being compromised.
○ ○ ○ ○ ○
Performing computer maintenance tasks is effective in preventing my computer performance from being compromised.
○ ○ ○ ○ ○
If I perform computer maintenance tasks, I am less likely to have my computer performance compromised.
○ ○ ○ ○ ○
The costs of performing computer maintenance outweigh the benefits.
○ ○ ○ ○ ○
Performing computer maintenance tasks - for this question, please select agree.
○ ○ ○ ○ ○
Performing computer maintenance would cause me too many problems.
○ ○ ○ ○ ○
I would be discouraged from performing computer maintenance as it would take too much time.
○ ○ ○ ○ ○

218
Strongly Disagree
Disagree Not Sure Agree Strongly
Agree
I am able to scan my computer for malware in order to prevent my computer performance from being compromised.
○ ○ ○ ○ ○
Scanning my computer for malware is easy to do to prevent my computer performance from being compromised.
○ ○ ○ ○ ○
Scanning my computer for malware to prevent my computer performance from being compromised is convenient.
○ ○ ○ ○ ○
Scanning my computer - please select disagree for this question.
○ ○ ○ ○ ○
Scanning my computer for malware works in preventing my computer performance from being compromised.
○ ○ ○ ○ ○
Scanning my computer for malware is effective in preventing my computer performance from being compromised.
○ ○ ○ ○ ○
If I scan my computer for malware, I am less likely to have my computer performance compromised.
○ ○ ○ ○ ○
The costs of scanning my computer for malware outweigh the benefits.
○ ○ ○ ○ ○
Scanning my computer for malware would cause me too many problems.
○ ○ ○ ○ ○
I would be discouraged from scanning my computer for malware as it would take too much time.
○ ○ ○ ○ ○
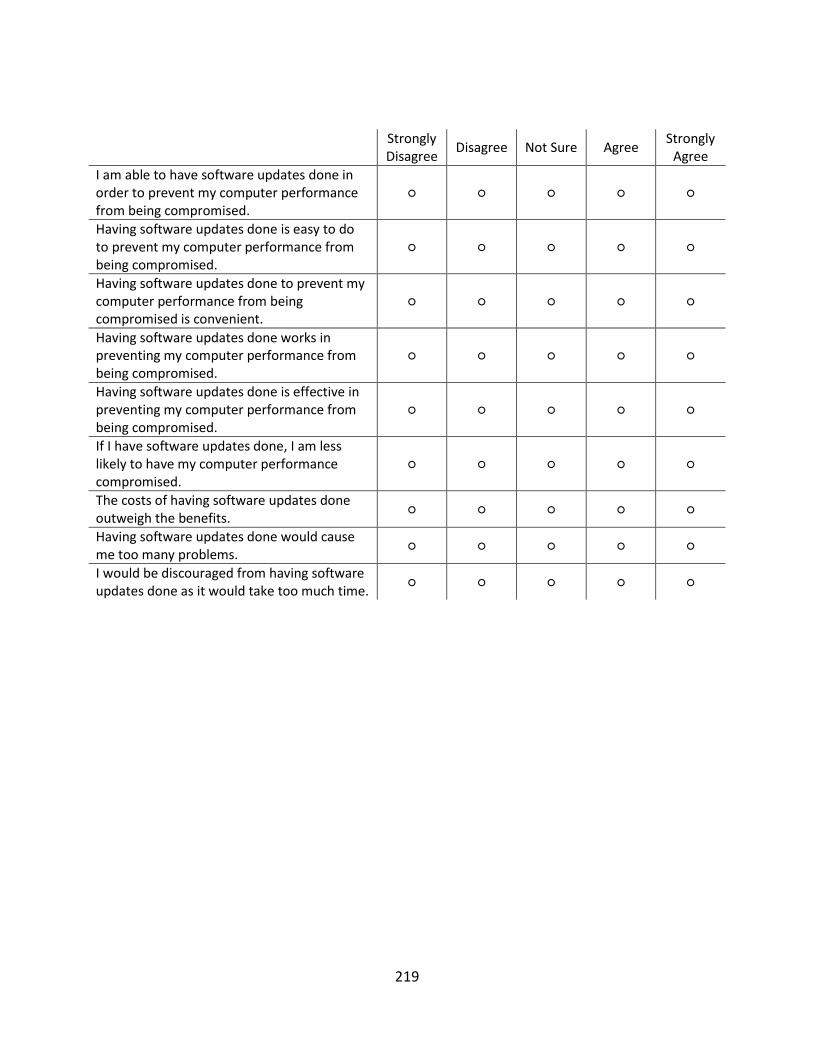
219
Strongly Disagree
Disagree Not Sure Agree Strongly
Agree
I am able to have software updates done in order to prevent my computer performance from being compromised.
○ ○ ○ ○ ○
Having software updates done is easy to do to prevent my computer performance from being compromised.
○ ○ ○ ○ ○
Having software updates done to prevent my computer performance from being compromised is convenient.
○ ○ ○ ○ ○
Having software updates done works in preventing my computer performance from being compromised.
○ ○ ○ ○ ○
Having software updates done is effective in preventing my computer performance from being compromised.
○ ○ ○ ○ ○
If I have software updates done, I am less likely to have my computer performance compromised.
○ ○ ○ ○ ○
The costs of having software updates done outweigh the benefits.
○ ○ ○ ○ ○
Having software updates done would cause me too many problems.
○ ○ ○ ○ ○
I would be discouraged from having software updates done as it would take too much time.
○ ○ ○ ○ ○

220
Strongly Disagree
Disagree Not Sure Agree Strongly
Agree
I am able to use a firewall in order to prevent my computer performance from being compromised.
○ ○ ○ ○ ○
Using a firewall is easy to do to prevent my computer performance from being compromised.
○ ○ ○ ○ ○
Using a firewall to prevent my computer performance from being compromised is convenient.
○ ○ ○ ○ ○
Using a firewall works in preventing my computer performance from being compromised.
○ ○ ○ ○ ○
Using a firewall is effective in preventing my computer performance from being compromised.
○ ○ ○ ○ ○
If I use a firewall, I am less likely to have my computer performance compromised.
○ ○ ○ ○ ○
The costs of using a firewall outweigh the benefits.
○ ○ ○ ○ ○
Using a firewall would cause me too many problems.
○ ○ ○ ○ ○
I would be discouraged from using a firewall as it would take too much time.
○ ○ ○ ○ ○

221
This scale consists of a number of words that describe different feelings and emotions. Read each item
and then mark the appropriate answer in the space next that word.
Indicate to what extent you generally feel this way, that is, how you feel on the average.
Very slightly or not at all
A little Moderately Quite a bit Extremely
Interested ○ ○ ○ ○ ○
Distressed ○ ○ ○ ○ ○
Excited ○ ○ ○ ○ ○
Upset ○ ○ ○ ○ ○
Strong ○ ○ ○ ○ ○
Guilty ○ ○ ○ ○ ○
Scared ○ ○ ○ ○ ○
Hostile ○ ○ ○ ○ ○
Enthusiastic ○ ○ ○ ○ ○
Proud ○ ○ ○ ○ ○
Irritable ○ ○ ○ ○ ○
Alert ○ ○ ○ ○ ○
Ashamed ○ ○ ○ ○ ○
Inspired ○ ○ ○ ○ ○
Nervous ○ ○ ○ ○ ○
Determined ○ ○ ○ ○ ○
Attentive ○ ○ ○ ○ ○
Jittery ○ ○ ○ ○ ○
Active ○ ○ ○ ○ ○
Afraid ○ ○ ○ ○ ○

222
Some information about yourself (for statistical purposes):
Age (drop-down list):
18-19
20-24
25-29
30-34
35-39
40-44
45-49
50-54
55-59
60-64
65-69
70-74
75-79
80-84
85-89
90 & above
Education:
○ Some High School
○ High School graduate (or GED)
○ Some College
○ College graduate
○ Some graduate school
○ Master’s degree
○ Doctorate
Ethnicity you identify with:
○ American Indian or Alaskan Native
○ Asian or Pacific Islander
○ Black, not of Hispanic origin
○ Hispanic
○ White, not of Hispanic origin
○ Other
Gender:
○ Male
○ Female
State you reside in (drop-down list):
AL
AK
AZ
AR
CA
CZ
CO
CT
DE
DC
FL
GA
HI
ID
IL
IN
IA
KS
KY
LA
ME
MH
MD
MA
MI
MN
MS
MO
MT
NE
NV
NH
NJ
NM
NY
NC
ND
OH
OK
OR
PA
RI
SC
SD
TN
TX
UT
VT
VA
WA
WV
WI
WY
If you would like your results deleted, then please EXIT your browser window at this time.
If you would like to submit your responses, then please click the next button >>
Thank you.

223
Appendix F – Final Survey Instrument for Personal Information Compromise
For the following, please answer each question honestly. Be assured that your responses are
anonymous and that no attempt will be made to identify you.
Please note that while some of these questions are similar to each other, each question has a specific
purpose. Thus, please pay careful attention to each question.
Definition:
Primary Computer: Your primary computer is the computing device you use a majority of the time that
is NOT owned or issued by your employer.
The Operating System (OS) of my primary computer is...
○ Windows
○ OS X (Macintosh)
○ Unix/Linux
○ Other
Please check the devices that you own (select all that apply):
□ Smartphone (iPhone) □ Tablet (Android) □ Laptop Computer (Mac)
□ Smartphone (Android) □ Tablet (Windows) □ Desktop Computer (Mac)
□ Smartphone (Windows) □ Tablet (other) □ Laptop Computer (Linux based)
□ Smartphone (other) □ Laptop Computer (Windows) □ Desktop Computer (Linux based)
□ Tablet (iPad) □ Desktop Computer (Windows)
Which one of the following do you consider your "primary" computer?
○ Smartphone (iPhone) ○ Tablet (Android) ○ Laptop Computer (Mac)
○ Smartphone (Android) ○ Tablet (Windows) ○ Desktop Computer (Mac)
○ Smartphone (Windows) ○ Tablet (other) ○ Laptop Computer (Linux based)
○ Smartphone (other) ○ Laptop Computer (Windows) ○ Desktop Computer (Linux based)
○ Tablet (iPad) ○ Desktop Computer (Windows)

224
Please indicate the amount you agree or disagree with each statement using the following scale from
Strongly Disagree to Strongly Agree.
Display question if “Windows” is selected as the OS of the primary computer.
Definitions:
Malware: Spyware, viruses, Trojan horses, worms, etc.
Anti-malware Software: Software that protects a computer from spyware, viruses, Trojan horses,
worms, etc.
I am confident that… Strongly Disagree
Disagree Not Sure Agree Strongly
Agree
...my primary computer has anti-malware software that is updated automatically on a weekly or more frequent basis.
○ ○ ○ ○ ○
...my primary computer is automatically scanned for malware in real-time (e.g., during downloads, when I visit websites, etc.).
○ ○ ○ ○ ○
...a full system scan for malware is performed on my primary computer on a weekly or more frequent basis.
○ ○ ○ ○ ○
Definitions:
Long and Complex Passwords: 8 or more characters in length with special characters, numbers, and a
combination of upper and lower casing
Important Logins: Computer login, banking, financial, and e-commerce websites, etc.
Less Important Logins: Discussion forums, blogs, social networking sites (e.g., Facebook), etc.
I am confident that… Strongly Disagree
Disagree Not Sure Agree Strongly
Agree
...I use long and complex passwords for important logins.
○ ○ ○ ○ ○
...my passwords for less important logins are NOT the same as those for important logins.
○ ○ ○ ○ ○
...I use a unique password for each important login.
○ ○ ○ ○ ○
...my usernames for less important logins are NOT the same as those for important logins.
○ ○ ○ ○ ○
...I change the passwords for important logins at least once every 12 months.
○ ○ ○ ○ ○

225
Strongly Disagree
Disagree Not Sure Agree Strongly
Agree
I am confident that someone in my home (i.e., you, someone else) regularly educates others in the home about proper information security behaviors.
○ ○ ○ ○ ○
Definition:
Encryption: Encryption is the conversion of plain text data into a format that cannot be easily
understood by unauthorized people. For example, a simple word that in plain text is "cat", instead
appears as something that makes no sense (e.g., H)&*HGHas87a1) to unauthorized individuals.
I am confident that... Strongly Disagree
Disagree Not Sure Agree Strongly
Agree
...my wireless network is using some type of encryption.
○ ○ ○ ○ ○
...the default password on the device (e.g., router) I use for wireless access to the Internet has been changed.
○ ○ ○ ○ ○
Strongly Disagree
Disagree Not Sure Agree Strongly
Agree
I very rarely, if ever, click on the links in emails I receive.
○ ○ ○ ○ ○
If I were to click on a link in an email I received, I would check to make sure that the link goes to a site that appears legitimate.
○ ○ ○ ○ ○
I do not click on links in emails I receive that are reportedly from a bank or other financial institution.
○ ○ ○ ○ ○

226
Definitions:
Encryption: Encryption is the conversion of plain text data into a format that cannot be easily
understood by unauthorized people. For example, a simple word that in plain text is "cat", instead
appears as something that makes no sense (e.g., H)&*HGHas87a1) to unauthorized individuals.
Personal Financial Information: Credit card numbers, bank routing information, etc.
Strongly Disagree
Disagree Not Sure Agree Strongly
Agree
I only store my personal financial information on websites that I do regular business with.
○ ○ ○ ○ ○
I only store my personal financial information on websites that I trust.
○ ○ ○ ○ ○
I check to make sure the website is using encryption (e.g., verifying the URL starts with https://, not just http://) prior to entering personal financial information online.
○ ○ ○ ○ ○
Definition:
Firewall: A piece of hardware or software that restricts incoming and outgoing Internet traffic to help
protect a computer from malicious activity.
Strongly Disagree
Disagree Not Sure Agree Strongly
Agree
I am confident that I have a firewall enabled for my primary computer.
○ ○ ○ ○ ○
Strongly Disagree
Disagree Not Sure Agree Strongly
Agree
I am careful about the information I make public on the Internet.
○ ○ ○ ○ ○
I am selective with whom I share my private information with on the Internet.
○ ○ ○ ○ ○
I only put information on social networking sites that can be viewed by friends/connections that I trust with that information.
○ ○ ○ ○ ○
I understand that once I put something on the Internet, it is basically available forever, even if I delete it.
○ ○ ○ ○ ○

227
Strongly Disagree
Disagree Not Sure Agree Strongly
Agree
I am selective in who I choose to be a friend/connection with on social networking sites.
○ ○ ○ ○ ○
I trust those that I choose to be a friend/connection with on social networking sites.
○ ○ ○ ○ ○
Strongly Disagree
Disagree Not Sure Agree Strongly
Agree
I believe that having my personal information compromised would be severe.
○ ○ ○ ○ ○
I believe that having my personal information compromised would be serious.
○ ○ ○ ○ ○
I believe that having my personal information compromised would be significant.
○ ○ ○ ○ ○
Strongly Disagree
Disagree Not Sure Agree Strongly
Agree
I am at risk for having my personal information compromised.
○ ○ ○ ○ ○
It is likely that my personal information will be compromised.
○ ○ ○ ○ ○
It is possible that my personal information will be compromised.
○ ○ ○ ○ ○

228
Strongly Disagree
Disagree Not Sure Agree Strongly
Agree
I am able to (or someone else) educate others in my home in order to prevent my personal information from being compromised.
○ ○ ○ ○ ○
Educating others in my home is easy to do to prevent my personal information from being compromised.
○ ○ ○ ○ ○
Educating others in my home to prevent my personal information from being compromised is convenient.
○ ○ ○ ○ ○
Educating others in my home works in preventing my personal information from being compromised.
○ ○ ○ ○ ○
Educating others in my home is effective in preventing my personal information from being compromised.
○ ○ ○ ○ ○
Educating others in my home - for this question, choose agree.
○ ○ ○ ○ ○
If I (or someone else) educate others in my home, I am less likely to have my personal information compromised.
○ ○ ○ ○ ○
The costs of educating others in my home outweigh the benefits.
○ ○ ○ ○ ○
Educating others in my home would cause me too many problems.
○ ○ ○ ○ ○
I would be discouraged from educating others in my home as it would take too much time.
○ ○ ○ ○ ○

229
Strongly Disagree
Disagree Not Sure Agree Strongly
Agree
I am able to be selective in the information I share in order to prevent my personal information from being compromised.
○ ○ ○ ○ ○
Being selective in the information I share is easy to do to prevent my personal information from being compromised.
○ ○ ○ ○ ○
Being selective in the information I share to prevent my personal information from being compromised is convenient.
○ ○ ○ ○ ○
Being selective in the information I share works in preventing my personal information from being compromised.
○ ○ ○ ○ ○
Being selective in the information I share is effective in preventing my personal information from being compromised.
○ ○ ○ ○ ○
If I am selective in the information I share, I am less likely to have my personal information compromised.
○ ○ ○ ○ ○
The costs of being selective in the information I share outweigh the benefits.
○ ○ ○ ○ ○
Being selective in the information I share would cause me too many problems.
○ ○ ○ ○ ○
I would be discouraged from being selective in the information I share as it would take too much time.
○ ○ ○ ○ ○

230
Strongly Disagree
Disagree Not Sure Agree Strongly
Agree
I am able to be selective with the people I choose to have in my online network of friends/connections in order to prevent my personal information from being compromised.
○ ○ ○ ○ ○
Being selective with the people I choose to have in my network of friends/connections is easy to do to prevent my personal information from being compromised.
○ ○ ○ ○ ○
Being selective with the people I choose to have in my online network of friends/connections to prevent my personal information from being compromised is convenient.
○ ○ ○ ○ ○
Being selective with the people I choose to have in my online network of friends/connections works in preventing my personal information from being compromised.
○ ○ ○ ○ ○
Being selective with the people I choose to have in my online network of friends/connections is effective in preventing my personal information from being compromised.
○ ○ ○ ○ ○
Being selective with the people I choose to have in - please choose disagree for this question.
○ ○ ○ ○ ○
If I am selective with the people I choose to have in my network of friends/connections , I am less likely to have my personal information compromised.
○ ○ ○ ○ ○
The costs of being selective with the people I choose to have in my online network of friends/connections outweigh the benefits.
○ ○ ○ ○ ○
Being selective with the people I choose to have in my online network of friends/connections would cause me too many problems.
○ ○ ○ ○ ○
I would be discouraged from being selective with the people I choose to have in my online network of friends/connections as it would take too much time.
○ ○ ○ ○ ○

231
Strongly Disagree
Disagree Not Sure Agree Strongly
Agree
I am able to choose and use passwords and usernames in such a way as to prevent my personal information from being compromised.
○ ○ ○ ○ ○
Choosing and using passwords and usernames is easy to do to prevent my personal information from being compromised.
○ ○ ○ ○ ○
Choosing and using passwords and usernames to prevent my personal information from being compromised is convenient.
○ ○ ○ ○ ○
Choosing and using usernames and passwords carefully works in preventing my personal information from being compromised.
○ ○ ○ ○ ○
Choosing and using usernames and passwords carefully is effective in preventing my personal information from being compromised.
○ ○ ○ ○ ○
If I choose usernames and passwords carefully, I am less likely to have my personal information compromised.
○ ○ ○ ○ ○
The costs of choosing usernames and passwords carefully outweigh the benefits.
○ ○ ○ ○ ○
Choosing usernames and passwords carefully would cause me too many problems.
○ ○ ○ ○ ○
I would be discouraged from choosing usernames and passwords carefully as it would take too much time.
○ ○ ○ ○ ○

232
Strongly Disagree
Disagree Not Sure Agree Strongly
Agree
I am able to scan my computer for malware in order to prevent my personal information from being compromised.
○ ○ ○ ○ ○
Scanning my computer for malware is easy to do to prevent my personal information from being compromised.
○ ○ ○ ○ ○
Scanning my computer for malware to prevent my personal information from being compromised is convenient.
○ ○ ○ ○ ○
Scanning my computer for malware works in preventing my personal information from being compromised.
○ ○ ○ ○ ○
Scanning my computer for malware is effective in preventing my personal information from being compromised.
○ ○ ○ ○ ○
If I scan my computer for malware, I am less likely to have my personal information compromised.
○ ○ ○ ○ ○
The costs of scanning my computer for malware outweigh the benefits.
○ ○ ○ ○ ○
Scanning my computer for malware would cause me too many problems.
○ ○ ○ ○ ○
I would be discouraged from scanning my computer for malware as it would take too much time.
○ ○ ○ ○ ○

233
Strongly Disagree
Disagree Not Sure Agree Strongly
Agree
I am able to setup a wireless network securely in order to prevent my personal information from being compromised.
○ ○ ○ ○ ○
Setting up a wireless network securely is easy to do to prevent my personal information from being compromised.
○ ○ ○ ○ ○
Setting up a wireless network securely to prevent my personal information from being compromised is convenient.
○ ○ ○ ○ ○
Setting up a wireless network securely works in preventing my personal information from being compromised.
○ ○ ○ ○ ○
Setting up a wireless network securely is effective in preventing my personal information from being compromised.
○ ○ ○ ○ ○
If I setup a wireless network securely, I am less likely to have my personal information compromised.
○ ○ ○ ○ ○
The costs of setting up a wireless network securely outweigh the benefits.
○ ○ ○ ○ ○
Setting up a wireless network securely would cause me too many problems.
○ ○ ○ ○ ○
I would be discouraged from setting up a wireless network securely as it would take too much time.
○ ○ ○ ○ ○

234
Strongly Disagree
Disagree Not Sure Agree Strongly
Agree
I am able to use caution when following links in email in order to prevent my personal information from being compromised.
○ ○ ○ ○ ○
Using caution when following links in email is easy to do to prevent my personal information from being compromised.
○ ○ ○ ○ ○
Using caution when following links in email to prevent my personal information from being compromised is convenient.
○ ○ ○ ○ ○
Using caution when following links in email works in preventing my personal information from being compromised.
○ ○ ○ ○ ○
Using caution when following links in email is effective in preventing my personal information from being compromised.
○ ○ ○ ○ ○
If I use caution when following links in email, I am less likely to have my personal information compromised.
○ ○ ○ ○ ○
The costs of using caution when following links in email outweigh the benefits.
○ ○ ○ ○ ○
Using caution when following links in email would cause me too many problems.
○ ○ ○ ○ ○
I would be discouraged from using caution when following links in email as it would take too much time.
○ ○ ○ ○ ○

235
Strongly Disagree
Disagree Not Sure Agree Strongly
Agree
I am able to use caution when providing personal financial information in order to prevent my personal information from being compromised.
○ ○ ○ ○ ○
Using caution when providing personal financial information is easy to do to prevent my personal information from being compromised.
○ ○ ○ ○ ○
Using caution when providing personal financial information to prevent my personal information from being compromised is convenient.
○ ○ ○ ○ ○
Using caution when providing personal financial information works in preventing my personal information from being compromised.
○ ○ ○ ○ ○
Using caution when providing personal financial information is effective in preventing my personal information from being compromised.
○ ○ ○ ○ ○
If I use caution when providing personal financial information, I am less likely to have my personal information compromised.
○ ○ ○ ○ ○
The costs of using caution when providing personal financial information outweigh the benefits.
○ ○ ○ ○ ○
Using caution when providing personal financial information would cause me too many problems.
○ ○ ○ ○ ○
I would be discouraged from using caution when providing personal financial information as it would take too much time.
○ ○ ○ ○ ○

236
Strongly Disagree
Disagree Not Sure Agree Strongly
Agree
I am able to use a firewall in order to prevent my personal information from being compromised.
○ ○ ○ ○ ○
Using a firewall is easy to do to prevent my personal information from being compromised.
○ ○ ○ ○ ○
Using a firewall to prevent my personal information from being compromised is convenient.
○ ○ ○ ○ ○
Using a firewall works in preventing my personal information from being compromised.
○ ○ ○ ○ ○
Using a firewall is effective in preventing my personal information from being compromised.
○ ○ ○ ○ ○
If I use a firewall, I am less likely to have my personal information compromised.
○ ○ ○ ○ ○
The costs of using a firewall outweigh the benefits.
○ ○ ○ ○ ○
Using a firewall would cause me too many problems.
○ ○ ○ ○ ○
I would be discouraged from using a firewall as it would take too much time.
○ ○ ○ ○ ○

237
This scale consists of a number of words that describe different feelings and emotions. Read each item
and then mark the appropriate answer in the space next that word.
Indicate to what extent you generally feel this way, that is, how you feel on the average.
Very slightly or not at all
A little Moderately Quite a bit Extremely
Interested ○ ○ ○ ○ ○
Distressed ○ ○ ○ ○ ○
Excited ○ ○ ○ ○ ○
Upset ○ ○ ○ ○ ○
Strong ○ ○ ○ ○ ○
Guilty ○ ○ ○ ○ ○
Scared ○ ○ ○ ○ ○
Hostile ○ ○ ○ ○ ○
Enthusiastic ○ ○ ○ ○ ○
Proud ○ ○ ○ ○ ○
Irritable ○ ○ ○ ○ ○
Alert ○ ○ ○ ○ ○
Ashamed ○ ○ ○ ○ ○
Inspired ○ ○ ○ ○ ○
Nervous ○ ○ ○ ○ ○
Determined ○ ○ ○ ○ ○
Attentive ○ ○ ○ ○ ○
Jittery ○ ○ ○ ○ ○
Active ○ ○ ○ ○ ○
Afraid ○ ○ ○ ○ ○

238
Some information about yourself (for statistical purposes):
Age (drop-down list):
18-19
20-24
25-29
30-34
35-39
40-44
45-49
50-54
55-59
60-64
65-69
70-74
75-79
80-84
85-89
90 & above
Education:
○ Some High School
○ High School graduate (or GED)
○ Some College
○ College graduate
○ Some graduate school
○ Master’s degree
○ Doctorate
Ethnicity you identify with:
○ American Indian or Alaskan Native
○ Asian or Pacific Islander
○ Black, not of Hispanic origin
○ Hispanic
○ White, not of Hispanic origin
○ Other
Gender:
○ Male
○ Female
State you reside in (drop-down list):
AL
AK
AZ
AR
CA
CZ
CO
CT
DE
DC
FL
GA
HI
ID
IL
IN
IA
KS
KY
LA
ME
MH
MD
MA
MI
MN
MS
MO
MT
NE
NV
NH
NJ
NM
NY
NC
ND
OH
OK
OR
PA
RI
SC
SD
TN
TX
UT
VT
VA
WA
WV
WI
WY
If you would like your results deleted, then please EXIT your browser window at this time.
If you would like to submit your responses, then please click the next button >>
Thank you.

239
Appendix G – Final Survey Instrument for Loss of Data and Files
For the following, please answer each question honestly. Be assured that your responses are
anonymous and that no attempt will be made to identify you.
Please note that while some of these questions are similar to each other, each question has a specific
purpose. Thus, please pay careful attention to each question.
Definition:
Primary Computer: Your primary computer is the computing device you use a majority of the time that
is NOT owned or issued by your employer.
The Operating System (OS) of my primary computer is...
○ Windows
○ OS X (Macintosh)
○ Unix/Linux
○ Other
Please check the devices that you own (select all that apply):
□ Smartphone (iPhone) □ Tablet (Android) □ Laptop Computer (Mac)
□ Smartphone (Android) □ Tablet (Windows) □ Desktop Computer (Mac)
□ Smartphone (Windows) □ Tablet (other) □ Laptop Computer (Linux based)
□ Smartphone (other) □ Laptop Computer (Windows) □ Desktop Computer (Linux based)
□ Tablet (iPad) □ Desktop Computer (Windows)
Which one of the following do you consider your "primary" computer?
○ Smartphone (iPhone) ○ Tablet (Android) ○ Laptop Computer (Mac)
○ Smartphone (Android) ○ Tablet (Windows) ○ Desktop Computer (Mac)
○ Smartphone (Windows) ○ Tablet (other) ○ Laptop Computer (Linux based)
○ Smartphone (other) ○ Laptop Computer (Windows) ○ Desktop Computer (Linux based)
○ Tablet (iPad) ○ Desktop Computer (Windows)

240
Please indicate the amount you agree or disagree with each statement using the following scale from
Strongly Disagree to Strongly Agree.
Display question if “Windows” is selected as the OS of the primary computer.
Definitions:
Malware: Spyware, viruses, Trojan horses, worms, etc.
Anti-malware Software: Software that protects a computer from spyware, viruses, Trojan horses,
worms, etc.
I am confident that… Strongly Disagree
Disagree Not Sure Agree Strongly
Agree
...my primary computer has anti-malware software that is updated automatically on a weekly or more frequent basis.
○ ○ ○ ○ ○
...my primary computer is automatically scanned for malware in real-time (e.g., during downloads, when I visit websites, etc.).
○ ○ ○ ○ ○
...a full system scan for malware is performed on my primary computer on a weekly or more frequent basis.
○ ○ ○ ○ ○
Strongly Disagree
Disagree Not Sure Agree Strongly
Agree
I am confident that all of the important information and files on my primary computer are backed up to an external source (e.g., external hard drive, cloud storage, USB flash drive, etc.).
○ ○ ○ ○ ○

241
Definitions:
Anti-malware Software: Software that protects a computer from spyware, viruses, Trojan horses,
worms, etc.
Firewall: A piece of hardware or software that restricts incoming and outgoing Internet traffic to help
protect a computer from malicious activity.
Strongly Disagree
Disagree Not Sure Agree Strongly
Agree
I am confident that someone in my home (i.e., you, someone else) regularly educates others in the home about proper information security behaviors.
○ ○ ○ ○ ○
I am confident that… Strongly Disagree
Disagree Not Sure Agree Strongly
Agree
...I have created (or modified) the default administrator password on my primary computer.
○ ○ ○ ○ ○
...the main account I use on my primary computer has restricted permissions (i.e., unable to perform some tasks, such as installing new programs).
○ ○ ○ ○ ○
Definitions:
Firewall: A piece of hardware or software that restricts incoming and outgoing Internet traffic to help
protect a computer from malicious activity.
Strongly Disagree
Disagree Not Sure Agree Strongly
Agree
I am confident that I have a firewall enabled for my primary computer.
○ ○ ○ ○ ○

242
Strongly Disagree
Disagree Not Sure Agree Strongly
Agree
I believe that the loss of my important data and files would be severe.
○ ○ ○ ○ ○
I believe that the loss of my important data and files would be serious.
○ ○ ○ ○ ○
I believe that the loss of my important data and files would be significant.
○ ○ ○ ○ ○
Strongly Disagree
Disagree Not Sure Agree Strongly
Agree
I am at risk for losing my important data and files.
○ ○ ○ ○ ○
It is likely that I will lose my important data and files.
○ ○ ○ ○ ○
It is possible that I will lose my important data and files.
○ ○ ○ ○ ○

243
Strongly Disagree
Disagree Not Sure Agree Strongly
Agree
I am able to backup data and files in order to prevent the loss of my important data and files.
○ ○ ○ ○ ○
Backing up data and files is easy to do to prevent the loss of my important data and files.
○ ○ ○ ○ ○
Backing up data and files to prevent the loss of my important data and files is convenient.
○ ○ ○ ○ ○
Backing up my data and files works in preventing the loss of my important data and files.
○ ○ ○ ○ ○
Backing up data and files is effective in preventing the loss of my important data and files.
○ ○ ○ ○ ○
Backing up data and files is effective - for this question choose disagree.
○ ○ ○ ○ ○
If I backup data and files, I am less likely to lose my important data and files.
○ ○ ○ ○ ○
The costs of backing up my data and files outweigh the benefits.
○ ○ ○ ○ ○
Backing up my data and files would cause me too many problems.
○ ○ ○ ○ ○
I would be discouraged from backing up my data and files as it would take too much time.
○ ○ ○ ○ ○

244
Strongly Disagree
Disagree Not Sure Agree Strongly
Agree
I am able to educate others in my home in order to prevent the loss of my important data and files.
○ ○ ○ ○ ○
Educating others in my home is easy to do to prevent the loss of my important data and files.
○ ○ ○ ○ ○
Educating others in my home to prevent the loss of my important data and files is convenient.
○ ○ ○ ○ ○
Educating others in my home works in preventing the loss of my important data and files.
○ ○ ○ ○ ○
Educating others in my home is effective in preventing the loss of my important data and files.
○ ○ ○ ○ ○
If I (or someone else) educate others in my home, I am less likely to lose my important data and files.
○ ○ ○ ○ ○
The costs of educating others in my home outweigh the benefits.
○ ○ ○ ○ ○
Educating others in my home would cause me too many problems.
○ ○ ○ ○ ○
I would be discouraged from educating others in my home as it would take too much time.
○ ○ ○ ○ ○

245
Strongly Disagree
Disagree Not Sure Agree Strongly
Agree
I am able to scan my computer for malware in order to prevent the loss of my important data and files.
○ ○ ○ ○ ○
Scanning my computer for malware is easy to do to prevent the loss of my important data and files.
○ ○ ○ ○ ○
Scanning my computer for malware to prevent the loss of my important data and files is convenient.
○ ○ ○ ○ ○
Scanning my computer for malware works in preventing the loss of my important data and files.
○ ○ ○ ○ ○
Scanning my computer for malware is effective in preventing the loss of my important data and files.
○ ○ ○ ○ ○
If I scan my computer for malware, I am less likely to lose my important data and files.
○ ○ ○ ○ ○
The costs of scanning my computer for malware outweigh the benefits.
○ ○ ○ ○ ○
Scanning my computer for malware would cause me too many problems.
○ ○ ○ ○ ○
I would be discouraged from scanning my computer for malware as it would take too much time.
○ ○ ○ ○ ○

246
Strongly Disagree
Disagree Not Sure Agree Strongly
Agree
I am able to setup computer permissions in order to prevent the loss of my important data and files.
○ ○ ○ ○ ○
Setting up computer permissions is easy to do to prevent the loss of my important data and files.
○ ○ ○ ○ ○
Setting up computer permissions to prevent the loss of my important data and files is convenient.
○ ○ ○ ○ ○
Setting up computer permissions works in preventing the loss of my important data and files.
○ ○ ○ ○ ○
Setting up computer permissions is effective in preventing the loss of my important data and files.
○ ○ ○ ○ ○
Setting up computer permissions is effective - please choose agree.
○ ○ ○ ○ ○
If I setup computer permissions, I am less likely to lose my important data and files.
○ ○ ○ ○ ○
The costs of setting up computer permissions outweigh the benefits.
○ ○ ○ ○ ○
Setting up computer permissions would cause me too many problems.
○ ○ ○ ○ ○
I would be discouraged from setting up computer permissions as it would take too much time.
○ ○ ○ ○ ○

247
Strongly Disagree
Disagree Not Sure Agree Strongly
Agree
I am able to use a firewall in order to prevent the loss of my important data and files.
○ ○ ○ ○ ○
Using a firewall is easy to do to prevent the loss of my important data and files.
○ ○ ○ ○ ○
Using a firewall to prevent the loss of my important data and files is convenient.
○ ○ ○ ○ ○
Using a firewall works in preventing the loss of my important data and files.
○ ○ ○ ○ ○
Using a firewall is effective in preventing the loss of my important data and files.
○ ○ ○ ○ ○
If I use a firewall, I am less likely to lose my important data and files.
○ ○ ○ ○ ○
The costs of using a firewall outweigh the benefits.
○ ○ ○ ○ ○
Using a firewall would cause me too many problems.
○ ○ ○ ○ ○
I would be discouraged from using a firewall as it would take too much time.
○ ○ ○ ○ ○

248
This scale consists of a number of words that describe different feelings and emotions. Read each item
and then mark the appropriate answer in the space next that word.
Indicate to what extent you generally feel this way, that is, how you feel on the average.
Very slightly or not at all
A little Moderately Quite a bit Extremely
Interested ○ ○ ○ ○ ○
Distressed ○ ○ ○ ○ ○
Excited ○ ○ ○ ○ ○
Upset ○ ○ ○ ○ ○
Strong ○ ○ ○ ○ ○
Guilty ○ ○ ○ ○ ○
Scared ○ ○ ○ ○ ○
Hostile ○ ○ ○ ○ ○
Enthusiastic ○ ○ ○ ○ ○
Proud ○ ○ ○ ○ ○
Irritable ○ ○ ○ ○ ○
Alert ○ ○ ○ ○ ○
Ashamed ○ ○ ○ ○ ○
Inspired ○ ○ ○ ○ ○
Nervous ○ ○ ○ ○ ○
Determined ○ ○ ○ ○ ○
Attentive ○ ○ ○ ○ ○
Jittery ○ ○ ○ ○ ○
Active ○ ○ ○ ○ ○
Afraid ○ ○ ○ ○ ○

249
Some information about yourself (for statistical purposes):
Age (drop-down list):
18-19
20-24
25-29
30-34
35-39
40-44
45-49
50-54
55-59
60-64
65-69
70-74
75-79
80-84
85-89
90 & above
Education:
○ Some High School
○ High School graduate (or GED)
○ Some College
○ College graduate
○ Some graduate school
○ Master’s degree
○ Doctorate
Ethnicity you identify with:
○ American Indian or Alaskan Native
○ Asian or Pacific Islander
○ Black, not of Hispanic origin
○ Hispanic
○ White, not of Hispanic origin
○ Other
Gender:
○ Male
○ Female
State you reside in (drop-down list):
AL
AK
AZ
AR
CA
CZ
CO
CT
DE
DC
FL
GA
HI
ID
IL
IN
IA
KS
KY
LA
ME
MH
MD
MA
MI
MN
MS
MO
MT
NE
NV
NH
NJ
NM
NY
NC
ND
OH
OK
OR
PA
RI
SC
SD
TN
TX
UT
VT
VA
WA
WV
WI
WY
If you would like your results deleted, then please EXIT your browser window at this time.
If you would like to submit your responses, then please click the next button >>
Thank you.

ROLE OF AFFECT IN INFORMATION SECURITY BEHAVIOR
250
Appendix H – Statistical Test Results for Moderation
Table 28: Statistical Analysis for Moderation for Computer Performance Compromise
Education Age Gender
Path t-statistic significance t-statistic significance t-statistic significance RC -> CPC 0.327 0.744 0.018 0.985 0.001 0.999
RE -> CPC 1.04 0.299 0.026 0.979 0.023 0.982
SE -> CPC 0.903 0.367 0.065 0.948 0.124 0.902
TNA -> SE 0.395 0.693 0.026 0.979 0.146 0.884
TNA -> TS 0.253 0.8 0.031 0.976 0.133 0.895
TNA -> TV 0.025 0.98 0.039 0.969 0.996 0.32
TPA -> SE 0.644 0.52 0.024 0.981 0.146 0.884
TPA -> TS 0.837 0.403 0.005 0.996 1.061 0.289
TPA -> TV 0.335 0.738 0.035 0.972 0.399 0.69
TS -> CPC 0.116 0.908 0.022 0.983 0.612 0.541
TV -> CPC 0.996 0.32 0.05 0.96 0.111 0.911
Table 29: Statistical Analysis for Moderation for Personal Information Compromise
Education Age Gender
Path t-statistic significance t-statistic significance t-statistic significance RC -> PIC 0.368 0.713 0.522 0.602 0.145 0.885
RE -> PIC 0.356 0.722 0.472 0.637 0.633 0.527
SE -> PIC 0.564 0.573 0.034 0.973 0.395 0.693
TNA -> SE 0.286 0.775 0.093 0.926 0.116 0.907
TNA -> TS 0.055 0.956 0.292 0.771 1.333 0.184
TNA -> TV 0.481 0.631 0.479 0.632 0.193 0.847
TPA -> SE 0.798 0.425 0.536 0.592 0.603 0.547
TPA -> TS 0.312 0.755 0.589 0.556 0.236 0.814
TPA -> TV 0.183 0.855 0.603 0.547 0.55 0.583
TS -> PIC 0.535 0.593 0.425 0.671 0.807 0.42
TV -> PIC 0.092 0.927 0.065 0.948 0.43 0.668
Table 30: Statistical Analysis for Moderation for Loss of Data and Files
Education Age Gender
Path t-statistic significance t-statistic significance t-statistic significance RC -> LDF 0.256 0.798 1.231 0.219 0.369 0.712
RE -> LDF 0.1 0.92 0.194 0.846 1.255 0.21
SE -> LDF 0.123 0.902 0.809 0.419 0.161 0.872
TNA -> SE 0.518 0.605 0.631 0.529 0.612 0.541
TNA -> TS 0.307 0.759 0.689 0.491 0.117 0.907
TNA -> TV 0.555 0.579 1.234 0.218 1.284 0.2
TPA -> SE 0.285 0.776 0.811 0.418 0.658 0.511
TPA -> TS 0.02 0.984 1.974 0.049 0.261 0.794
TPA -> TV 0.166 0.869 0.146 0.884 0.086 0.931
TS -> LDF 0.945 0.345 0.262 0.794 0.641 0.522
TV -> LDF 0.447 0.655 0.97 0.333 0.511 0.61

ROLE OF AFFECT IN INFORMATION SECURITY BEHAVIOR
251
Appendix I - Multiplicative Interaction Results for Direct Effect Constructs
Table 31: Multiplicative Interaction Results for Direct Effect Constructs
Interaction Computer Performance
Compromise Personal Information
Compromise Loss of Data and Files
SE x TS 1.025 0.807 0.691
SE x TV 0.313 0.046 0.372
SE x RE 1.067 0.609 0.661
SE x RC 0.582 0.593 0.518
RE x TS 0.909 0.845 0.534
RE x TV 0.106 0.274 0.341
RE x RC 0.240 0.981 0.803
RC x TS 0.051 0.646 0.757
RC x TV 0.075 0.300 0.316
TS x TV 0.109 0.848 0.101
* α = 0.10, 2-tailed; ** α = 0.05, 2-tailed; *** α = 0.01, 2-tailed

ROLE OF AFFECT IN INFORMATION SECURITY BEHAVIOR
252
Appendix J – Data for AVE of the Constructs Greater than the Square Test for
Discriminant Validity: Computer Performance Compromise
Table 32: AVE of the Constructs Greater than the Square Test for Computer Performance Compromise, Part 1 of 2
AVE
RC Firewall
RC Maint
RC Malware
RC Updates
RE Firewall
RE Maint
RE Malware
RE Updates
RC_Firewall 0.851 1.000
RC_Maint 0.781 0.334 1.000
RC_Malware 0.837 0.399 0.435 1.000
RC_Updates 0.824 0.291 0.336 0.385 1.000
RE_Firewall 0.901 0.232 0.137 0.113 0.103 1.000
RE_Maint 0.859 0.083 0.177 0.146 0.118 0.286 1.000
RE_Malware 0.899 0.113 0.167 0.251 0.130 0.270 0.285 1.000
RE_Updates 0.808 0.086 0.150 0.103 0.203 0.242 0.288 0.195 1.000
SE_Firewall 0.802 0.341 0.203 0.149 0.106 0.531 0.231 0.176 0.187
SE_Maint 0.864 0.167 0.285 0.173 0.121 0.241 0.321 0.163 0.205
SE_Malware 0.883 0.166 0.265 0.278 0.071 0.267 0.263 0.311 0.127
SE_Updates 0.833 0.107 0.154 0.154 0.225 0.237 0.226 0.113 0.433
TNA 0.535 0.020 0.027 0.020 0.009 0.004 0.003 0.009 0.001
TPA 0.563 0.039 0.053 0.040 0.050 0.043 0.054 0.039 0.049
TS 0.833 0.041 0.051 0.018 0.026 0.091 0.072 0.026 0.071
TV 0.849 0.076 0.099 0.094 0.087 0.080 0.096 0.031 0.051
Table 33: AVE of the Constructs Greater than the Square Test for Computer Performance Compromise, Part 2 of 2
AVE
SE Firewall
SE Maint
SE Malware
SE Updates
TNA TPA TS TV
RC_Firewall 0.851
RC_Maint 0.781
RC_Malware 0.837
RC_Updates 0.824
RE_Firewall 0.901
RE_Maint 0.859
RE_Malware 0.899
RE_Updates 0.808
SE_Firewall 0.802 1.000
SE_Maint 0.864 0.323 1.000
SE_Malware 0.883 0.391 0.417 1.000
SE_Updates 0.833 0.265 0.302 0.205 1.000
TNA 0.535 0.026 0.013 0.006 0.002 1.000
TPA 0.563 0.059 0.076 0.044 0.059 0.001 1.000
TS 0.833 0.041 0.042 0.036 0.039 0.002 0.015 1.000
TV 0.849 0.071 0.133 0.071 0.115 0.016 0.038 0.000 1.000

ROLE OF AFFECT IN INFORMATION SECURITY BEHAVIOR
253
Appendix K – Data for Cross-Loading Test for Discriminant Validity: Computer
Performance Compromise
Table 34: Cross-Loading Results for Computer Performance Compromise, Part 1 of 4
RC
Firewall RC
Maint RC
Malware RC
Updates RE
Firewall RE
Maint RE
Malware RE
Updates
Firewal_RC_1 0.919 0.519 0.548 0.492 -0.465 -0.263 -0.343 -0.287
Firewal_RC_2 0.926 0.545 0.616 0.504 -0.425 -0.269 -0.278 -0.254
Firewal_RE_1 -0.488 -0.360 -0.336 -0.333 0.949 0.517 0.486 0.453
Firewal_RE_2 -0.427 -0.343 -0.301 -0.278 0.950 0.498 0.500 0.481
Firewal_SE_1 -0.481 -0.422 -0.342 -0.284 0.704 0.471 0.433 0.411
Firewal_SE_2 -0.553 -0.404 -0.362 -0.305 0.681 0.427 0.373 0.395
Firewal_SE_3 -0.540 -0.384 -0.334 -0.285 0.564 0.390 0.314 0.351
Maint_RC_1 0.508 0.891 0.610 0.546 -0.280 -0.335 -0.357 -0.336
Maint_RC_2 0.513 0.877 0.554 0.477 -0.378 -0.411 -0.366 -0.350
Maint_RE_1 -0.289 -0.361 -0.360 -0.310 0.512 0.929 0.518 0.495
Maint_RE_2 -0.245 -0.420 -0.348 -0.327 0.479 0.924 0.471 0.499
Maint_SE_1 -0.372 -0.505 -0.391 -0.297 0.449 0.525 0.382 0.443
Maint_SE_2 -0.387 -0.488 -0.382 -0.349 0.463 0.528 0.369 0.399
Malware_RC_1 0.600 0.582 0.913 0.542 -0.317 -0.347 -0.452 -0.264
Malware_RC_2 0.556 0.624 0.916 0.592 -0.297 -0.351 -0.464 -0.323
Malware_RE_1 -0.342 -0.403 -0.483 -0.350 0.511 0.516 0.949 0.407
Malware_RE_2 -0.295 -0.371 -0.466 -0.334 0.474 0.497 0.948 0.431
Malware_SE_1 -0.363 -0.473 -0.473 -0.225 0.484 0.518 0.530 0.338
Malware_SE_2 -0.402 -0.495 -0.518 -0.276 0.487 0.446 0.518 0.333
TSev_1 -0.170 -0.184 -0.121 -0.104 0.276 0.230 0.171 0.253
TSev_2 -0.178 -0.243 -0.135 -0.162 0.277 0.241 0.166 0.233
TSev_3 -0.208 -0.193 -0.110 -0.182 0.274 0.266 0.101 0.244
TVul_1 0.226 0.284 0.252 0.257 -0.233 -0.298 -0.125 -0.225
TVul_2 0.279 0.296 0.311 0.285 -0.287 -0.276 -0.196 -0.195

ROLE OF AFFECT IN INFORMATION SECURITY BEHAVIOR
254
Table 35: Cross-Loading Results for Computer Performance Compromise, Part 2 of 4
SE
Firewall SE
Maint SE
Malware SE
Updates TNA TPA TS TV
Firewal_RC_1 -0.519 -0.379 -0.360 -0.329 0.140 -0.182 -0.182 0.250
Firewal_RC_2 -0.558 -0.375 -0.391 -0.276 0.120 -0.181 -0.192 0.259
Firewal_RE_1 0.725 0.472 0.493 0.471 -0.035 0.190 0.316 -0.245
Firewal_RE_2 0.658 0.460 0.488 0.454 -0.089 0.205 0.258 -0.293
Firewal_SE_1 0.885 0.569 0.606 0.486 -0.135 0.221 0.210 -0.257
Firewal_SE_2 0.929 0.509 0.581 0.470 -0.167 0.236 0.199 -0.241
Firewal_SE_3 0.872 0.440 0.487 0.425 -0.131 0.195 0.131 -0.214
Maint_RC_1 -0.361 -0.436 -0.418 -0.307 0.135 -0.235 -0.167 0.256
Maint_RC_2 -0.438 -0.511 -0.496 -0.388 0.157 -0.170 -0.234 0.303
Maint_RE_1 0.462 0.514 0.491 0.453 -0.024 0.198 0.274 -0.227
Maint_RE_2 0.429 0.536 0.459 0.427 -0.070 0.233 0.224 -0.350
Maint_SE_1 0.486 0.926 0.598 0.503 -0.089 0.246 0.184 -0.359
Maint_SE_2 0.568 0.933 0.603 0.518 -0.125 0.267 0.197 -0.321
Malware_RC_1 -0.352 -0.405 -0.488 -0.372 0.119 -0.185 -0.129 0.296
Malware_RC_2 -0.356 -0.356 -0.477 -0.345 0.140 -0.181 -0.116 0.266
Malware_RE_1 0.419 0.404 0.530 0.303 -0.077 0.186 0.160 -0.129
Malware_RE_2 0.375 0.362 0.527 0.335 -0.102 0.187 0.144 -0.206
Malware_SE_1 0.581 0.618 0.940 0.422 -0.064 0.167 0.182 -0.233
Malware_SE_2 0.595 0.596 0.940 0.428 -0.081 0.228 0.173 -0.267
TSev_1 0.187 0.196 0.188 0.178 0.079 0.094 0.908 -0.026
TSev_2 0.195 0.184 0.186 0.169 0.026 0.135 0.938 0.013
TSev_3 0.174 0.180 0.144 0.196 0.028 0.109 0.891 -0.019
TVul_1 -0.220 -0.328 -0.217 -0.322 0.090 -0.181 -0.003 0.912
TVul_2 -0.268 -0.344 -0.270 -0.303 0.142 -0.181 -0.019 0.931

ROLE OF AFFECT IN INFORMATION SECURITY BEHAVIOR
255
Table 36: Cross-Loading Results for Computer Performance Compromise, Part 3 of 4
RC
Firewall RC
Maint RC
Malware RC
Updates RE
Firewall RE
Maint RE
Malware RE
Updates
Updates_RC_1 0.471 0.504 0.550 0.903 -0.265 -0.325 -0.315 -0.407
Updates_RC_2 0.509 0.547 0.575 0.912 -0.318 -0.300 -0.340 -0.412
Updates_RE_1 -0.226 -0.337 -0.281 -0.383 0.427 0.517 0.442 0.916
Updates_RE_2 -0.268 -0.349 -0.254 -0.424 0.442 0.443 0.347 0.867
Updates_RE_3 -0.297 -0.361 -0.330 -0.412 0.458 0.484 0.400 0.913
Updates_SE_1 -0.251 -0.295 -0.326 -0.340 0.438 0.399 0.301 0.571
Updates_SE_2 -0.344 -0.417 -0.388 -0.520 0.451 0.467 0.312 0.628
PANAS_01_P -0.168 -0.225 -0.228 -0.211 0.179 0.184 0.200 0.187
PANAS_03_P -0.117 -0.073 -0.095 -0.178 0.141 0.162 0.158 0.199
PANAS_05_P -0.140 -0.231 -0.140 -0.183 0.133 0.142 0.140 0.126
PANAS_09_P -0.120 -0.187 -0.126 -0.198 0.137 0.201 0.146 0.165
PANAS_10_P -0.196 -0.237 -0.138 -0.186 0.199 0.172 0.156 0.194
PANAS_12_P -0.141 -0.210 -0.142 -0.123 0.144 0.191 0.112 0.154
PANAS_14_P -0.136 -0.100 -0.095 -0.110 0.137 0.118 0.142 0.141
PANAS_16_P -0.167 -0.125 -0.143 -0.211 0.175 0.201 0.173 0.173
PANAS_17_P -0.127 -0.161 -0.214 -0.150 0.160 0.198 0.138 0.163
PANAS_19_P -0.154 -0.120 -0.133 -0.106 0.144 0.136 0.106 0.141
PANAS_02_N 0.107 0.115 0.088 0.062 -0.102 -0.044 -0.091 -0.058
PANAS_04_N 0.092 0.137 0.105 0.022 -0.127 -0.057 -0.014 -0.047
PANAS_06_N 0.170 0.138 0.120 0.061 -0.097 -0.099 -0.121 -0.022
PANAS_07_N 0.070 0.150 0.096 0.040 -0.040 0.007 -0.050 0.014
PANAS_08_N 0.058 0.039 0.149 0.079 0.033 0.019 -0.057 -0.052
PANAS_11_N 0.163 0.123 0.160 0.147 0.001 -0.051 -0.123 -0.104
PANAS_13_N 0.144 0.131 0.139 0.050 -0.050 -0.065 -0.112 -0.013
PANAS_15_N 0.015 0.122 0.006 0.086 0.011 -0.012 -0.005 -0.005
PANAS_18_N 0.105 0.118 0.087 0.129 -0.021 0.031 -0.025 -0.020
PANAS_20_N 0.048 0.107 0.064 0.012 -0.043 -0.033 -0.042 0.067

ROLE OF AFFECT IN INFORMATION SECURITY BEHAVIOR
256
Table 37: Cross-Loading Results for Computer Performance Compromise, Part 4 of 4
SE
Firewall SE
Maint SE
Malware SE
Updates TNA TPA TS TV
Updates_RC_1 -0.280 -0.310 -0.231 -0.446 0.101 -0.186 -0.128 0.271
Updates_RC_2 -0.311 -0.321 -0.252 -0.415 0.069 -0.217 -0.166 0.264
Updates_RE_1 0.385 0.416 0.329 0.599 -0.037 0.191 0.229 -0.204
Updates_RE_2 0.374 0.364 0.298 0.560 -0.017 0.220 0.245 -0.169
Updates_RE_3 0.407 0.438 0.334 0.614 -0.042 0.185 0.248 -0.236
Updates_SE_1 0.437 0.496 0.394 0.907 -0.033 0.212 0.197 -0.265
Updates_SE_2 0.501 0.507 0.432 0.918 -0.056 0.231 0.166 -0.350
PANAS_01_P 0.214 0.234 0.213 0.204 0.068 0.789 0.064 -0.148
PANAS_03_P 0.176 0.113 0.099 0.162 0.111 0.726 0.103 -0.113
PANAS_05_P 0.151 0.239 0.161 0.177 -0.100 0.761 0.032 -0.166
PANAS_09_P 0.153 0.193 0.133 0.176 0.018 0.814 0.056 -0.215
PANAS_10_P 0.188 0.230 0.133 0.196 -0.041 0.754 0.138 -0.088
PANAS_12_P 0.215 0.205 0.168 0.195 -0.103 0.649 0.193 -0.160
PANAS_14_P 0.145 0.178 0.122 0.104 0.111 0.762 0.075 -0.106
PANAS_16_P 0.163 0.233 0.158 0.202 -0.031 0.787 0.053 -0.117
PANAS_17_P 0.213 0.232 0.181 0.227 -0.117 0.706 0.115 -0.173
PANAS_19_P 0.172 0.173 0.172 0.138 -0.035 0.744 0.058 -0.147
PANAS_02_N -0.167 -0.110 -0.062 -0.027 0.786 -0.001 0.104 0.045
PANAS_04_N -0.206 -0.160 -0.133 -0.101 0.741 -0.041 -0.072 0.048
PANAS_06_N -0.138 -0.098 -0.134 -0.019 0.751 -0.018 -0.039 0.115
PANAS_07_N -0.099 -0.076 -0.033 -0.007 0.780 -0.013 0.043 0.109
PANAS_08_N -0.022 0.060 0.033 -0.022 0.579 -0.020 0.065 0.112
PANAS_11_N -0.143 -0.076 -0.054 -0.066 0.700 -0.056 0.099 0.130
PANAS_13_N -0.095 -0.124 -0.090 -0.050 0.735 -0.036 -0.008 0.096
PANAS_15_N -0.052 -0.029 0.045 -0.030 0.755 0.044 0.106 0.100
PANAS_18_N -0.100 -0.064 -0.022 -0.046 0.659 0.031 0.024 0.045
PANAS_20_N -0.091 -0.091 -0.035 0.022 0.799 -0.038 0.054 0.116

ROLE OF AFFECT IN INFORMATION SECURITY BEHAVIOR
257
Appendix L – Data for AVE of the Constructs Greater than the Square Test for
Discriminant Validity: Personal Information Compromise
Table 38: AVE of the Constructs Greater than the Square Test for Personal Information Compromise, Part 1 of 4
AVE
RC Connect
RC Educate
RC Email
RC Finan.
RC Firewall
RC InfoSh
RC Malware
RC Passwrd
RC_Connections 0.900 1.000
RC_Educate 0.888 0.217 1.000
RC_Email 0.915 0.308 0.111 1.000
RC_Financial 0.921 0.260 0.127 0.481 1.000
RC_Firewall 0.927 0.133 0.107 0.237 0.244 1.000
RC_InfoShar 0.919 0.506 0.236 0.302 0.229 0.160 1.000
RC_Malware 0.857 0.178 0.106 0.289 0.338 0.295 0.180 1.000
RC_Passwords 0.890 0.334 0.174 0.227 0.199 0.237 0.344 0.212 1.000
RC_Wireless 0.902 0.165 0.173 0.322 0.285 0.287 0.216 0.273 0.188
RE_Connections 0.884 0.151 0.021 0.096 0.071 0.057 0.098 0.064 0.102
RE_Educate 0.923 0.060 0.104 0.045 0.041 0.061 0.097 0.076 0.093
RE_Email 0.924 0.128 0.054 0.307 0.189 0.101 0.102 0.079 0.128
RE_Financial 0.931 0.102 0.033 0.200 0.218 0.119 0.085 0.139 0.097
RE_Firewall 0.939 0.049 0.051 0.087 0.065 0.321 0.053 0.119 0.074
RE_InfoShar 0.856 0.141 0.031 0.144 0.176 0.123 0.157 0.151 0.125
RE_Malware 0.927 0.063 0.026 0.113 0.113 0.139 0.083 0.280 0.107
RE_Passwords 0.889 0.077 0.032 0.137 0.108 0.140 0.073 0.124 0.185
RE_Wireless 0.937 0.089 0.072 0.194 0.172 0.143 0.078 0.186 0.118
SE_Connections 0.690 0.247 0.016 0.169 0.170 0.088 0.163 0.117 0.104
SE_Educate 0.725 0.083 0.190 0.049 0.030 0.073 0.102 0.074 0.110
SE_Email 0.863 0.201 0.051 0.482 0.302 0.120 0.139 0.127 0.129
SE_Financial 0.856 0.159 0.046 0.239 0.334 0.160 0.120 0.134 0.118
SE_Firewall 0.813 0.055 0.062 0.095 0.096 0.535 0.089 0.178 0.104
SE_InfoShar 0.840 0.206 0.030 0.153 0.117 0.065 0.250 0.065 0.142
SE_Malware 0.852 0.086 0.080 0.132 0.118 0.148 0.095 0.332 0.120
SE_Passwords 0.721 0.064 0.021 0.086 0.070 0.123 0.049 0.106 0.267
SE_Wireless 0.768 0.047 0.056 0.100 0.096 0.179 0.054 0.117 0.057
TNA 0.537 0.005 0.008 0.007 0.006 0.006 0.008 0.014 0.007
TPA 0.563 0.005 0.027 0.016 0.026 0.015 0.010 0.003 0.006
TS 0.860 0.048 0.007 0.056 0.040 0.051 0.030 0.070 0.053
TV 0.686 0.015 0.005 0.050 0.039 0.042 0.035 0.019 0.036

ROLE OF AFFECT IN INFORMATION SECURITY BEHAVIOR
258
Table 39: AVE of the Constructs Greater than the Square Test for Personal Information Compromise, Part 2 of 4
AVE
RC Wirelss
RE Connect
RE Educate
RE Email
RE Financ.
RE Firewall
RE InfoSh
RE Malware
RC_Connections 0.900
RC_Educate 0.888
RC_Email 0.915
RC_Financial 0.921
RC_Firewall 0.927
RC_InfoShar 0.919
RC_Malware 0.857
RC_Passwords 0.890
RC_Wireless 0.902 1.000
RE_Connections 0.884 0.060 1.000
RE_Educate 0.923 0.106 0.187 1.000
RE_Email 0.924 0.107 0.272 0.081 1.000
RE_Financial 0.931 0.128 0.265 0.134 0.477 1.000
RE_Firewall 0.939 0.088 0.167 0.143 0.231 0.302 1.000
RE_InfoShar 0.856 0.112 0.420 0.212 0.288 0.350 0.230 1.000
RE_Malware 0.927 0.137 0.273 0.151 0.237 0.258 0.270 0.259 1.000
RE_Passwords 0.889 0.104 0.265 0.162 0.368 0.366 0.235 0.374 0.341
RE_Wireless 0.937 0.280 0.292 0.149 0.374 0.447 0.305 0.363 0.388
SE_Connections 0.690 0.096 0.322 0.074 0.171 0.190 0.084 0.290 0.168
SE_Educate 0.725 0.145 0.131 0.465 0.051 0.059 0.095 0.131 0.078
SE_Email 0.863 0.155 0.138 0.058 0.495 0.301 0.130 0.216 0.142
SE_Financial 0.856 0.143 0.182 0.103 0.262 0.457 0.205 0.323 0.182
SE_Firewall 0.813 0.163 0.098 0.110 0.076 0.138 0.466 0.154 0.167
SE_InfoShar 0.840 0.082 0.210 0.146 0.169 0.181 0.134 0.394 0.137
SE_Malware 0.852 0.181 0.126 0.134 0.095 0.107 0.199 0.163 0.374
SE_Passwords 0.721 0.079 0.161 0.087 0.186 0.216 0.097 0.158 0.153
SE_Wireless 0.768 0.408 0.129 0.115 0.088 0.168 0.174 0.121 0.186
TNA 0.537 0.018 0.005 0.023 0.000 0.003 0.005 0.008 0.022
TPA 0.563 0.008 0.039 0.035 0.018 0.059 0.030 0.045 0.050
TS 0.860 0.024 0.059 0.021 0.032 0.028 0.015 0.033 0.048
TV 0.686 0.024 0.088 0.016 0.070 0.084 0.068 0.108 0.060

ROLE OF AFFECT IN INFORMATION SECURITY BEHAVIOR
259
Table 40: AVE of the Constructs Greater than the Square Test for Personal Information Compromise, Part 3 of 4
AVE
RE Passwrd
RE Wirelss
SE Connect
SE Educate
SE Email
SE Financ.
SE Firewall
SE InfoSh
RC_Connections 0.900
RC_Educate 0.888
RC_Email 0.915
RC_Financial 0.921
RC_Firewall 0.927
RC_InfoShar 0.919
RC_Malware 0.857
RC_Passwords 0.890
RC_Wireless 0.902
RE_Connections 0.884
RE_Educate 0.923
RE_Email 0.924
RE_Financial 0.931
RE_Firewall 0.939
RE_InfoShar 0.856
RE_Malware 0.927
RE_Passwords 0.889 1.000
RE_Wireless 0.937 0.431 1.000
SE_Connections 0.690 0.167 0.172 1.000
SE_Educate 0.725 0.099 0.130 0.085 1.000
SE_Email 0.863 0.171 0.250 0.223 0.051 1.000
SE_Financial 0.856 0.191 0.311 0.277 0.079 0.398 1.000
SE_Firewall 0.813 0.148 0.198 0.083 0.143 0.075 0.139 1.000
SE_InfoShar 0.840 0.197 0.214 0.410 0.137 0.242 0.364 0.115 1.000
SE_Malware 0.852 0.186 0.297 0.121 0.163 0.113 0.153 0.238 0.114
SE_Passwords 0.721 0.347 0.189 0.138 0.080 0.113 0.181 0.123 0.119
SE_Wireless 0.768 0.158 0.332 0.108 0.171 0.117 0.206 0.331 0.146
TNA 0.537 0.007 0.015 0.003 0.011 0.000 0.007 0.018 0.013
TPA 0.563 0.048 0.040 0.021 0.022 0.020 0.068 0.009 0.031
TS 0.860 0.039 0.036 0.028 0.011 0.041 0.035 0.017 0.026
TV 0.686 0.090 0.067 0.090 0.040 0.057 0.067 0.043 0.109

ROLE OF AFFECT IN INFORMATION SECURITY BEHAVIOR
260
Table 41: AVE of the Constructs Greater than the Square Test for Personal Information Compromise, Part 4 of 4
AVE
SE Malware
SE Passwrd
SE Wirelss
TNA TPA TS TV
RC_Connections 0.900
RC_Educate 0.888
RC_Email 0.915
RC_Financial 0.921
RC_Firewall 0.927
RC_InfoShar 0.919
RC_Malware 0.857
RC_Passwords 0.890
RC_Wireless 0.902
RE_Connections 0.884
RE_Educate 0.923
RE_Email 0.924
RE_Financial 0.931
RE_Firewall 0.939
RE_InfoShar 0.856
RE_Malware 0.927
RE_Passwords 0.889
RE_Wireless 0.937
SE_Connections 0.690
SE_Educate 0.725
SE_Email 0.863
SE_Financial 0.856
SE_Firewall 0.813
SE_InfoShar 0.840
SE_Malware 0.852 1.000
SE_Passwords 0.721 0.106 1.000
SE_Wireless 0.768 0.250 0.138 1.000
TNA 0.537 0.032 0.015 0.035 1.000
TPA 0.563 0.007 0.016 0.017 0.001 1.000
TS 0.860 0.013 0.015 0.003 0.005 0.020 1.000
TV 0.686 0.062 0.096 0.078 0.014 0.018 0.001 1.000

ROLE OF AFFECT IN INFORMATION SECURITY BEHAVIOR
261
Appendix M – Data for Cross-Loading Test for Discriminant Validity: Personal
Information Compromise
Table 42: Cross-Loading Results for Personal Information Compromise, Part 1 of 12
RC
Connect RC
Educate RC
Email RC
Financ. RC
Firewall RC
InfoSh RC
Malware RC
Passwrd RC
Wirelss
Connect_RC_2 0.946 0.441 0.509 0.470 0.326 0.662 0.381 0.533 0.359
Connect_RC_3 0.952 0.442 0.543 0.497 0.366 0.687 0.419 0.564 0.411
Connect_RE_1 -0.416 -0.160 -0.337 -0.295 -0.268 -0.324 -0.256 -0.316 -0.238
Connect_RE_2 -0.312 -0.114 -0.244 -0.204 -0.179 -0.263 -0.217 -0.282 -0.223
Connect_SE_1 -0.476 -0.166 -0.440 -0.451 -0.308 -0.389 -0.327 -0.324 -0.291
Connect_SE_2 -0.403 -0.084 -0.309 -0.279 -0.217 -0.301 -0.313 -0.201 -0.228
Connect_SE_3 -0.343 -0.051 -0.252 -0.275 -0.200 -0.307 -0.197 -0.271 -0.247
Educate_RC_2 0.469 0.949 0.377 0.392 0.286 0.483 0.316 0.424 0.400
Educate_RC_3 0.404 0.935 0.243 0.273 0.333 0.430 0.296 0.359 0.383
Educate_RE_1 -0.238 -0.287 -0.212 -0.196 -0.217 -0.317 -0.265 -0.299 -0.299
Educate_RE_2 -0.231 -0.333 -0.195 -0.192 -0.256 -0.282 -0.266 -0.286 -0.327
Educate_SE_1 -0.294 -0.381 -0.266 -0.233 -0.269 -0.304 -0.299 -0.314 -0.348
Educate_SE_2 -0.255 -0.422 -0.196 -0.127 -0.223 -0.281 -0.220 -0.293 -0.340
Educate_SE_3 -0.186 -0.302 -0.100 -0.083 -0.197 -0.230 -0.178 -0.237 -0.282
Email_RC_2 0.545 0.344 0.959 0.691 0.477 0.537 0.550 0.449 0.539
Email_RC_3 0.517 0.293 0.955 0.635 0.454 0.515 0.477 0.463 0.547
Email_RE_1 -0.356 -0.236 -0.541 -0.442 -0.301 -0.339 -0.272 -0.352 -0.311
Email_RE_2 -0.331 -0.210 -0.525 -0.395 -0.309 -0.277 -0.269 -0.335 -0.316
Email_SE_1 -0.453 -0.239 -0.702 -0.540 -0.370 -0.374 -0.386 -0.370 -0.352
Email_SE_2 -0.380 -0.182 -0.586 -0.480 -0.273 -0.319 -0.277 -0.295 -0.379
Financi_RC_2 0.494 0.341 0.659 0.959 0.473 0.458 0.543 0.414 0.480
Financi_RC_3 0.485 0.343 0.673 0.961 0.476 0.461 0.574 0.442 0.545
Financi_RE_1 -0.308 -0.174 -0.436 -0.453 -0.347 -0.290 -0.354 -0.314 -0.361
Financi_RE_2 -0.308 -0.177 -0.428 -0.449 -0.319 -0.272 -0.365 -0.287 -0.330
Financi_SE_1 -0.415 -0.243 -0.512 -0.553 -0.387 -0.368 -0.379 -0.316 -0.373
Financi_SE_2 -0.317 -0.149 -0.386 -0.514 -0.352 -0.268 -0.293 -0.321 -0.325
Firewal_RC_2 0.366 0.334 0.467 0.496 0.964 0.435 0.527 0.455 0.498
Firewal_RC_3 0.337 0.295 0.471 0.455 0.962 0.334 0.518 0.485 0.534
Firewal_RE_1 -0.219 -0.215 -0.289 -0.257 -0.589 -0.202 -0.341 -0.288 -0.284
Firewal_RE_2 -0.211 -0.223 -0.282 -0.236 -0.509 -0.245 -0.327 -0.239 -0.290
Firewal_SE_1 -0.214 -0.252 -0.292 -0.306 -0.637 -0.261 -0.386 -0.340 -0.369
Firewal_SE_2 -0.226 -0.261 -0.303 -0.305 -0.702 -0.312 -0.408 -0.290 -0.387
Firewal_SE_3 -0.193 -0.151 -0.230 -0.218 -0.640 -0.228 -0.340 -0.232 -0.333

ROLE OF AFFECT IN INFORMATION SECURITY BEHAVIOR
262
Table 43: Cross-Loading Results for Personal Information Compromise, Part 2 of 12
RE
Connect RE
Educate RE
Email RE
Financ. RE
Firewall RE
InfoSh RE
Malware RE
Passwrd RE
Wirelss
Connect_RC_2 -0.376 -0.215 -0.320 -0.298 -0.206 -0.340 -0.228 -0.238 -0.238
Connect_RC_3 -0.361 -0.247 -0.356 -0.307 -0.215 -0.372 -0.249 -0.288 -0.325
Connect_RE_1 0.943 0.439 0.484 0.507 0.400 0.628 0.499 0.503 0.512
Connect_RE_2 0.937 0.373 0.498 0.460 0.367 0.591 0.484 0.464 0.503
Connect_SE_1 0.498 0.269 0.403 0.406 0.301 0.487 0.379 0.394 0.393
Connect_SE_2 0.476 0.194 0.319 0.343 0.237 0.449 0.358 0.300 0.354
Connect_SE_3 0.435 0.208 0.295 0.329 0.167 0.396 0.274 0.316 0.274
Educate_RC_2 -0.164 -0.312 -0.273 -0.203 -0.221 -0.183 -0.186 -0.208 -0.282
Educate_RC_3 -0.108 -0.296 -0.157 -0.137 -0.203 -0.147 -0.114 -0.124 -0.222
Educate_RE_1 0.425 0.960 0.272 0.316 0.343 0.465 0.365 0.384 0.370
Educate_RE_2 0.407 0.962 0.276 0.387 0.384 0.421 0.382 0.390 0.371
Educate_SE_1 0.258 0.526 0.200 0.191 0.236 0.289 0.245 0.266 0.357
Educate_SE_2 0.324 0.629 0.212 0.207 0.334 0.334 0.269 0.297 0.320
Educate_SE_3 0.346 0.585 0.160 0.223 0.209 0.299 0.196 0.238 0.242
Email_RC_2 -0.310 -0.211 -0.530 -0.446 -0.289 -0.362 -0.335 -0.362 -0.423
Email_RC_3 -0.283 -0.193 -0.531 -0.409 -0.274 -0.365 -0.307 -0.345 -0.420
Email_RE_1 0.497 0.270 0.960 0.666 0.449 0.529 0.443 0.561 0.557
Email_RE_2 0.506 0.278 0.962 0.662 0.475 0.503 0.492 0.604 0.618
Email_SE_1 0.339 0.228 0.662 0.534 0.348 0.415 0.354 0.396 0.458
Email_SE_2 0.351 0.219 0.646 0.485 0.321 0.450 0.347 0.371 0.470
Financi_RC_2 -0.296 -0.196 -0.449 -0.472 -0.255 -0.429 -0.343 -0.333 -0.391
Financi_RC_3 -0.217 -0.191 -0.387 -0.426 -0.234 -0.376 -0.302 -0.299 -0.405
Financi_RE_1 0.475 0.367 0.660 0.964 0.527 0.540 0.466 0.575 0.635
Financi_RE_2 0.517 0.340 0.673 0.966 0.532 0.601 0.513 0.592 0.656
Financi_SE_1 0.389 0.320 0.509 0.672 0.447 0.551 0.433 0.424 0.527
Financi_SE_2 0.401 0.271 0.435 0.574 0.388 0.498 0.353 0.382 0.505
Firewal_RC_2 -0.234 -0.224 -0.305 -0.329 -0.521 -0.338 -0.351 -0.329 -0.341
Firewal_RC_3 -0.226 -0.250 -0.307 -0.336 -0.570 -0.338 -0.366 -0.393 -0.387
Firewal_RE_1 0.378 0.368 0.455 0.522 0.969 0.474 0.502 0.479 0.540
Firewal_RE_2 0.413 0.365 0.477 0.543 0.969 0.457 0.505 0.460 0.530
Firewal_SE_1 0.350 0.345 0.289 0.318 0.609 0.392 0.449 0.376 0.436
Firewal_SE_2 0.267 0.303 0.229 0.366 0.639 0.352 0.355 0.365 0.421
Firewal_SE_3 0.219 0.239 0.224 0.320 0.598 0.310 0.284 0.291 0.336

ROLE OF AFFECT IN INFORMATION SECURITY BEHAVIOR
263
Table 44: Cross-Loading Results for Personal Information Compromise, Part 3 of 12
SE
Connect SE
Educate SE
Email SE
Financ. SE
Firewall SE
InfoSh SE
Malware SE
Passwrd SE
Wirelss
Connect_RC_2 -0.463 -0.272 -0.415 -0.377 -0.217 -0.391 -0.253 -0.254 -0.221
Connect_RC_3 -0.479 -0.276 -0.435 -0.379 -0.228 -0.468 -0.301 -0.225 -0.189
Connect_RE_1 0.568 0.324 0.362 0.458 0.302 0.472 0.339 0.379 0.348
Connect_RE_2 0.497 0.358 0.336 0.342 0.287 0.386 0.329 0.375 0.327
Connect_SE_1 0.838 0.280 0.470 0.502 0.276 0.591 0.381 0.304 0.289
Connect_SE_2 0.874 0.224 0.393 0.431 0.227 0.513 0.294 0.285 0.272
Connect_SE_3 0.777 0.216 0.290 0.361 0.207 0.478 0.164 0.342 0.256
Educate_RC_2 -0.160 -0.383 -0.288 -0.241 -0.204 -0.195 -0.249 -0.155 -0.196
Educate_RC_3 -0.074 -0.442 -0.130 -0.158 -0.272 -0.125 -0.286 -0.119 -0.255
Educate_RE_1 0.278 0.666 0.231 0.305 0.301 0.378 0.352 0.255 0.302
Educate_RE_2 0.246 0.644 0.231 0.312 0.337 0.356 0.350 0.311 0.348
Educate_SE_1 0.202 0.816 0.242 0.268 0.342 0.322 0.360 0.233 0.387
Educate_SE_2 0.250 0.915 0.218 0.267 0.318 0.320 0.401 0.243 0.354
Educate_SE_3 0.298 0.819 0.109 0.180 0.311 0.306 0.261 0.246 0.316
Email_RC_2 -0.413 -0.216 -0.660 -0.466 -0.321 -0.385 -0.358 -0.272 -0.325
Email_RC_3 -0.374 -0.208 -0.668 -0.469 -0.267 -0.363 -0.337 -0.288 -0.278
Email_RE_1 0.399 0.220 0.679 0.516 0.264 0.391 0.266 0.419 0.283
Email_RE_2 0.396 0.213 0.674 0.470 0.268 0.398 0.324 0.411 0.286
Email_SE_1 0.417 0.246 0.931 0.601 0.282 0.441 0.355 0.325 0.304
Email_SE_2 0.460 0.172 0.928 0.571 0.228 0.473 0.267 0.300 0.333
Financi_RC_2 -0.410 -0.172 -0.533 -0.533 -0.303 -0.319 -0.333 -0.266 -0.296
Financi_RC_3 -0.383 -0.160 -0.523 -0.576 -0.292 -0.339 -0.326 -0.241 -0.299
Financi_RE_1 0.426 0.242 0.542 0.667 0.365 0.401 0.307 0.456 0.411
Financi_RE_2 0.415 0.226 0.518 0.638 0.351 0.420 0.324 0.441 0.380
Financi_SE_1 0.491 0.279 0.611 0.934 0.361 0.545 0.409 0.375 0.431
Financi_SE_2 0.483 0.241 0.555 0.916 0.327 0.575 0.310 0.416 0.409
Firewal_RC_2 -0.285 -0.255 -0.335 -0.387 -0.710 -0.250 -0.364 -0.316 -0.384
Firewal_RC_3 -0.287 -0.264 -0.332 -0.383 -0.698 -0.241 -0.376 -0.360 -0.433
Firewal_RE_1 0.294 0.308 0.353 0.443 0.695 0.369 0.439 0.299 0.415
Firewal_RE_2 0.267 0.291 0.345 0.436 0.628 0.340 0.426 0.306 0.393
Firewal_SE_1 0.249 0.378 0.246 0.344 0.892 0.331 0.517 0.323 0.556
Firewal_SE_2 0.249 0.357 0.270 0.357 0.946 0.291 0.459 0.311 0.551
Firewal_SE_3 0.287 0.279 0.226 0.303 0.864 0.290 0.322 0.312 0.435

ROLE OF AFFECT IN INFORMATION SECURITY BEHAVIOR
264
Table 45: Cross-Loading Results for Personal Information Compromise, Part 4 of 12
TNA TPA TS TV
Connect_RC_2 0.091 -0.120 -0.215 0.079
Connect_RC_3 0.048 -0.021 -0.202 0.154
Connect_RE_1 -0.100 0.224 0.250 -0.292
Connect_RE_2 -0.030 0.147 0.207 -0.266
Connect_SE_1 -0.032 0.114 0.182 -0.251
Connect_SE_2 -0.050 0.115 0.120 -0.268
Connect_SE_3 -0.047 0.138 0.109 -0.227
Educate_RC_2 0.056 -0.142 -0.110 0.042
Educate_RC_3 0.114 -0.171 -0.043 0.087
Educate_RE_1 -0.156 0.206 0.152 -0.115
Educate_RE_2 -0.135 0.156 0.124 -0.130
Educate_SE_1 -0.089 0.088 0.134 -0.145
Educate_SE_2 -0.080 0.125 0.075 -0.183
Educate_SE_3 -0.100 0.174 0.065 -0.182
Email_RC_2 0.085 -0.128 -0.241 0.221
Email_RC_3 0.073 -0.117 -0.212 0.204
Email_RE_1 0.002 0.132 0.174 -0.264
Email_RE_2 0.005 0.123 0.170 -0.246
Email_SE_1 0.001 0.150 0.226 -0.229
Email_SE_2 -0.021 0.111 0.150 -0.212
Financi_RC_2 0.064 -0.171 -0.207 0.200
Financi_RC_3 0.086 -0.136 -0.180 0.181
Financi_RE_1 -0.069 0.247 0.167 -0.285
Financi_RE_2 -0.037 0.223 0.155 -0.274
Financi_SE_1 -0.078 0.281 0.213 -0.245
Financi_SE_2 -0.082 0.197 0.129 -0.234
Firewal_RC_2 0.076 -0.114 -0.221 0.202
Firewal_RC_3 0.079 -0.119 -0.214 0.193
Firewal_RE_1 -0.070 0.189 0.127 -0.247
Firewal_RE_2 -0.065 0.147 0.111 -0.256
Firewal_SE_1 -0.123 0.100 0.129 -0.265
Firewal_SE_2 -0.118 0.107 0.117 -0.167
Firewal_SE_3 -0.119 0.048 0.110 -0.113

ROLE OF AFFECT IN INFORMATION SECURITY BEHAVIOR
265
Table 46: Cross-Loading Results for Personal Information Compromise, Part 5 of 12
RC
Connect RC
Educate RC
Email RC
Financ. RC
Firewall RC
InfoSh RC
Malware RC
Passwrd RC
Wirelss
InfoShar_RC_2 0.663 0.472 0.541 0.461 0.383 0.958 0.400 0.550 0.442
InfoShar_RC_3 0.701 0.459 0.513 0.457 0.384 0.959 0.413 0.575 0.449
InfoShar_RE_1 -0.385 -0.187 -0.373 -0.395 -0.332 -0.448 -0.356 -0.346 -0.305
InfoShar_RE_2 -0.313 -0.141 -0.331 -0.381 -0.318 -0.291 -0.364 -0.310 -0.314
InfoShar_SE_1 -0.455 -0.176 -0.403 -0.341 -0.239 -0.473 -0.251 -0.351 -0.301
InfoShar_SE_2 -0.375 -0.139 -0.310 -0.285 -0.228 -0.441 -0.217 -0.338 -0.223
Malware_RC_2 0.436 0.308 0.545 0.586 0.520 0.419 0.934 0.443 0.496
Malware_RC_3 0.340 0.294 0.445 0.487 0.483 0.363 0.917 0.408 0.471
Malware_RE_1 -0.264 -0.181 -0.332 -0.331 -0.374 -0.318 -0.517 -0.341 -0.392
Malware_RE_2 -0.221 -0.130 -0.314 -0.316 -0.344 -0.236 -0.501 -0.290 -0.322
Malware_SE_1 -0.313 -0.294 -0.353 -0.341 -0.359 -0.308 -0.484 -0.328 -0.389
Malware_SE_2 -0.224 -0.226 -0.317 -0.292 -0.350 -0.261 -0.584 -0.311 -0.398
Passwor_RC_2 0.538 0.396 0.469 0.435 0.443 0.563 0.402 0.943 0.401
Passwor_RC_3 0.553 0.392 0.430 0.407 0.476 0.543 0.467 0.944 0.416
Passwor_RE_1 -0.236 -0.176 -0.372 -0.334 -0.386 -0.266 -0.347 -0.418 -0.353
Passwor_RE_2 -0.287 -0.161 -0.326 -0.286 -0.321 -0.245 -0.318 -0.392 -0.256
Passwor_SE_1 -0.258 -0.170 -0.339 -0.294 -0.361 -0.220 -0.266 -0.427 -0.263
Passwor_SE_2 -0.206 -0.135 -0.225 -0.201 -0.299 -0.197 -0.297 -0.461 -0.243
Passwor_SE_3 -0.169 -0.053 -0.161 -0.163 -0.215 -0.140 -0.267 -0.431 -0.202
TSev_1 -0.220 -0.103 -0.254 -0.216 -0.236 -0.172 -0.242 -0.239 -0.160
TSev_2 -0.175 -0.051 -0.179 -0.144 -0.178 -0.136 -0.222 -0.172 -0.110
TSev_3 -0.217 -0.079 -0.226 -0.201 -0.214 -0.178 -0.272 -0.228 -0.165
TVul_1 0.115 0.063 0.227 0.213 0.220 0.175 0.153 0.205 0.165
TVul_2 0.131 0.092 0.236 0.210 0.170 0.186 0.171 0.130 0.207
TVul_3 0.055 0.006 0.070 0.048 0.102 0.094 0.002 0.124 -0.009
Wireles_RC_2 0.372 0.357 0.547 0.514 0.494 0.398 0.468 0.400 0.947
Wireles_RC_3 0.399 0.432 0.532 0.501 0.523 0.483 0.523 0.423 0.952
Wireles_RE_1 -0.292 -0.266 -0.430 -0.383 -0.390 -0.268 -0.420 -0.350 -0.501
Wireles_RE_2 -0.284 -0.255 -0.422 -0.421 -0.340 -0.272 -0.414 -0.314 -0.524
Wireles_SE_1 -0.142 -0.204 -0.276 -0.312 -0.380 -0.219 -0.304 -0.218 -0.547
Wireles_SE_2 -0.205 -0.229 -0.318 -0.279 -0.410 -0.196 -0.346 -0.203 -0.598
Wireles_SE_3 -0.232 -0.189 -0.231 -0.211 -0.317 -0.194 -0.243 -0.206 -0.534

ROLE OF AFFECT IN INFORMATION SECURITY BEHAVIOR
266
Table 47: Cross-Loading Results for Personal Information Compromise, Part 6 of 12
RE
Connect RE
Educate RE
Email RE
Financ. RE
Firewall RE
InfoSh RE
Malware RE
Passwrd RE
Wirelss
InfoShar_RC_2 -0.313 -0.295 -0.334 -0.291 -0.225 -0.382 -0.292 -0.274 -0.277
InfoShar_RC_3 -0.287 -0.303 -0.280 -0.267 -0.218 -0.378 -0.259 -0.245 -0.258
InfoShar_RE_1 0.576 0.401 0.512 0.535 0.426 0.921 0.448 0.554 0.504
InfoShar_RE_2 0.623 0.451 0.482 0.560 0.462 0.930 0.493 0.577 0.608
InfoShar_SE_1 0.450 0.388 0.391 0.407 0.346 0.581 0.339 0.396 0.431
InfoShar_SE_2 0.388 0.309 0.360 0.373 0.324 0.569 0.339 0.418 0.417
Malware_RC_2 -0.270 -0.264 -0.313 -0.361 -0.355 -0.385 -0.572 -0.353 -0.429
Malware_RC_3 -0.193 -0.247 -0.202 -0.327 -0.279 -0.333 -0.397 -0.298 -0.365
Malware_RE_1 0.511 0.384 0.466 0.489 0.482 0.495 0.963 0.560 0.593
Malware_RE_2 0.496 0.365 0.472 0.490 0.518 0.486 0.963 0.566 0.606
Malware_SE_1 0.337 0.328 0.308 0.308 0.438 0.367 0.572 0.423 0.524
Malware_SE_2 0.319 0.348 0.259 0.296 0.383 0.379 0.557 0.372 0.481
Passwor_RC_2 -0.311 -0.271 -0.372 -0.297 -0.267 -0.332 -0.307 -0.425 -0.325
Passwor_RC_3 -0.290 -0.303 -0.302 -0.289 -0.245 -0.336 -0.311 -0.385 -0.324
Passwor_RE_1 0.457 0.394 0.558 0.556 0.449 0.584 0.560 0.942 0.618
Passwor_RE_2 0.513 0.366 0.585 0.584 0.465 0.570 0.542 0.944 0.620
Passwor_SE_1 0.365 0.243 0.451 0.459 0.306 0.356 0.350 0.534 0.418
Passwor_SE_2 0.333 0.284 0.361 0.417 0.289 0.326 0.354 0.501 0.374
Passwor_SE_3 0.320 0.223 0.267 0.286 0.184 0.330 0.286 0.461 0.302
TSev_1 0.214 0.156 0.181 0.163 0.098 0.150 0.165 0.166 0.160
TSev_2 0.201 0.117 0.153 0.152 0.128 0.168 0.193 0.187 0.153
TSev_3 0.264 0.127 0.165 0.149 0.116 0.186 0.252 0.197 0.213
TVul_1 -0.254 -0.099 -0.233 -0.247 -0.241 -0.289 -0.238 -0.283 -0.251
TVul_2 -0.253 -0.142 -0.249 -0.305 -0.227 -0.295 -0.231 -0.271 -0.267
TVul_3 -0.234 -0.077 -0.173 -0.163 -0.171 -0.231 -0.129 -0.178 -0.109
Wireles_RC_2 -0.238 -0.325 -0.354 -0.355 -0.282 -0.321 -0.367 -0.322 -0.519
Wireles_RC_3 -0.229 -0.295 -0.269 -0.326 -0.280 -0.315 -0.337 -0.291 -0.487
Wireles_RE_1 0.513 0.375 0.609 0.656 0.564 0.587 0.613 0.654 0.969
Wireles_RE_2 0.532 0.372 0.574 0.638 0.503 0.579 0.591 0.616 0.967
Wireles_SE_1 0.333 0.306 0.307 0.396 0.413 0.322 0.447 0.379 0.548
Wireles_SE_2 0.300 0.315 0.244 0.347 0.378 0.312 0.403 0.331 0.509
Wireles_SE_3 0.310 0.264 0.218 0.325 0.291 0.276 0.262 0.329 0.446

ROLE OF AFFECT IN INFORMATION SECURITY BEHAVIOR
267
Table 48: Cross-Loading Results for Personal Information Compromise, Part 7 of 12
SE
Connect SE
Educate SE
Email SE
Financ. SE
Firewall SE
InfoSh SE
Malware SE
Passwrd SE
Wirelss
InfoShar_RC_2 -0.393 -0.304 -0.388 -0.332 -0.275 -0.475 -0.302 -0.212 -0.215
InfoShar_RC_3 -0.382 -0.308 -0.328 -0.333 -0.295 -0.483 -0.291 -0.214 -0.231
InfoShar_RE_1 0.529 0.290 0.442 0.531 0.348 0.622 0.367 0.351 0.270
InfoShar_RE_2 0.469 0.376 0.419 0.522 0.378 0.542 0.381 0.384 0.371
InfoShar_SE_1 0.594 0.378 0.485 0.576 0.298 0.922 0.322 0.271 0.384
InfoShar_SE_2 0.578 0.299 0.415 0.530 0.323 0.911 0.296 0.364 0.315
Malware_RC_2 -0.342 -0.241 -0.377 -0.367 -0.387 -0.257 -0.558 -0.293 -0.312
Malware_RC_3 -0.288 -0.266 -0.279 -0.308 -0.394 -0.215 -0.507 -0.310 -0.323
Malware_RE_1 0.392 0.296 0.376 0.424 0.414 0.357 0.595 0.388 0.425
Malware_RE_2 0.398 0.243 0.351 0.398 0.373 0.355 0.583 0.366 0.405
Malware_SE_1 0.344 0.408 0.348 0.396 0.470 0.332 0.928 0.268 0.466
Malware_SE_2 0.297 0.335 0.269 0.324 0.429 0.290 0.918 0.336 0.456
Passwor_RC_2 -0.305 -0.275 -0.354 -0.310 -0.288 -0.361 -0.303 -0.449 -0.202
Passwor_RC_3 -0.303 -0.349 -0.322 -0.339 -0.321 -0.348 -0.351 -0.526 -0.248
Passwor_RE_1 0.394 0.302 0.398 0.425 0.372 0.418 0.416 0.558 0.393
Passwor_RE_2 0.377 0.292 0.381 0.399 0.354 0.419 0.398 0.553 0.357
Passwor_SE_1 0.314 0.230 0.385 0.444 0.345 0.289 0.297 0.860 0.319
Passwor_SE_2 0.284 0.230 0.295 0.344 0.291 0.279 0.286 0.892 0.317
Passwor_SE_3 0.359 0.267 0.146 0.279 0.245 0.317 0.241 0.792 0.313
TSev_1 0.131 0.131 0.231 0.187 0.151 0.157 0.093 0.139 0.073
TSev_2 0.163 0.068 0.184 0.163 0.105 0.147 0.100 0.099 0.031
TSev_3 0.176 0.098 0.147 0.171 0.111 0.143 0.124 0.106 0.046
TVul_1 -0.267 -0.159 -0.187 -0.221 -0.226 -0.303 -0.233 -0.290 -0.261
TVul_2 -0.294 -0.199 -0.269 -0.265 -0.153 -0.310 -0.247 -0.217 -0.272
TVul_3 -0.176 -0.141 -0.136 -0.154 -0.121 -0.198 -0.128 -0.262 -0.150
Wireles_RC_2 -0.308 -0.356 -0.402 -0.356 -0.352 -0.263 -0.394 -0.266 -0.569
Wireles_RC_3 -0.280 -0.367 -0.347 -0.363 -0.413 -0.282 -0.415 -0.267 -0.642
Wireles_RE_1 0.415 0.357 0.500 0.525 0.456 0.471 0.521 0.433 0.561
Wireles_RE_2 0.388 0.341 0.467 0.555 0.405 0.424 0.534 0.408 0.554
Wireles_SE_1 0.238 0.314 0.313 0.418 0.526 0.327 0.503 0.339 0.868
Wireles_SE_2 0.302 0.392 0.331 0.403 0.543 0.348 0.469 0.288 0.925
Wireles_SE_3 0.338 0.390 0.250 0.368 0.432 0.330 0.321 0.353 0.832

ROLE OF AFFECT IN INFORMATION SECURITY BEHAVIOR
268
Table 49: Cross-Loading Results for Personal Information Compromise, Part 8 of 12
TNA TPA TS TV
InfoShar_RC_2 0.096 -0.096 -0.155 0.185
InfoShar_RC_3 0.080 -0.092 -0.180 0.173
InfoShar_RE_1 -0.070 0.206 0.136 -0.287
InfoShar_RE_2 -0.090 0.187 0.197 -0.321
InfoShar_SE_1 -0.104 0.144 0.191 -0.300
InfoShar_SE_2 -0.102 0.179 0.102 -0.307
Malware_RC_2 0.106 -0.085 -0.281 0.125
Malware_RC_3 0.116 -0.014 -0.204 0.133
Malware_RE_1 -0.133 0.199 0.212 -0.223
Malware_RE_2 -0.152 0.232 0.211 -0.251
Malware_SE_1 -0.153 0.089 0.108 -0.260
Malware_SE_2 -0.176 0.061 0.102 -0.197
Passwor_RC_2 0.039 -0.080 -0.218 0.174
Passwor_RC_3 0.122 -0.064 -0.215 0.183
Passwor_RE_1 -0.076 0.252 0.200 -0.276
Passwor_RE_2 -0.078 0.161 0.173 -0.289
Passwor_SE_1 -0.074 0.115 0.105 -0.264
Passwor_SE_2 -0.116 0.095 0.092 -0.277
Passwor_SE_3 -0.137 0.115 0.121 -0.248
TSev_1 0.009 0.119 0.919 0.033
TSev_2 0.120 0.158 0.942 0.042
TSev_3 0.070 0.113 0.921 -0.004
TVul_1 0.121 -0.135 0.023 0.899
TVul_2 0.070 -0.078 0.009 0.807
TVul_3 0.096 -0.122 0.035 0.774
Wireles_RC_2 0.090 -0.078 -0.157 0.111
Wireles_RC_3 0.162 -0.087 -0.140 0.181
Wireles_RE_1 -0.112 0.194 0.172 -0.251
Wireles_RE_2 -0.122 0.194 0.194 -0.250
Wireles_SE_1 -0.167 0.085 0.030 -0.265
Wireles_SE_2 -0.179 0.095 0.037 -0.245
Wireles_SE_3 -0.147 0.176 0.080 -0.220

ROLE OF AFFECT IN INFORMATION SECURITY BEHAVIOR
269
Table 50: Cross-Loading Results for Personal Information Compromise, Part 9 of 12
RC
Connect RC
Educate RC
Email RC
Financ. RC
Firewall RC
InfoSh RC
Malware RC
Passwrd RC
Wirelss
PANAS_01_P -0.142 -0.131 -0.182 -0.152 -0.150 -0.099 -0.125 -0.087 -0.075
PANAS_03_P 0.077 -0.027 0.016 0.018 -0.038 0.063 0.023 0.023 0.001
PANAS_05_P -0.047 -0.166 -0.072 -0.121 -0.101 -0.124 -0.025 -0.067 -0.093
PANAS_09_P -0.006 -0.064 -0.079 -0.114 -0.064 -0.019 -0.024 -0.002 -0.032
PANAS_10_P -0.046 -0.175 -0.067 -0.124 -0.060 -0.104 0.004 0.003 -0.059
PANAS_12_P -0.086 -0.147 -0.129 -0.119 -0.059 -0.081 -0.057 -0.100 -0.114
PANAS_14_P 0.007 -0.071 -0.017 -0.080 -0.065 -0.057 0.038 0.011 0.023
PANAS_16_P -0.102 -0.122 -0.148 -0.166 -0.127 -0.105 -0.060 -0.090 -0.050
PANAS_17_P -0.128 -0.185 -0.178 -0.219 -0.125 -0.130 -0.156 -0.162 -0.170
PANAS_19_P 0.019 -0.052 -0.027 -0.047 -0.073 0.014 0.039 -0.036 -0.002
PANAS_02_N -0.041 0.030 0.028 0.013 0.075 0.009 0.083 0.020 0.112
PANAS_04_N 0.021 0.092 0.132 0.109 0.110 0.070 0.157 0.081 0.154
PANAS_06_N 0.082 0.030 0.034 0.093 0.006 0.007 0.008 0.089 0.042
PANAS_07_N 0.153 0.072 0.055 0.034 0.042 0.150 0.060 0.102 0.075
PANAS_08_N 0.176 0.092 0.096 0.059 0.036 0.168 0.097 0.083 0.096
PANAS_11_N -0.055 0.082 0.019 0.047 0.104 -0.018 0.098 0.012 0.121
PANAS_13_N 0.160 0.079 0.071 0.068 -0.006 0.175 0.025 0.103 0.057
PANAS_15_N 0.015 0.049 0.003 0.009 -0.004 -0.019 0.034 0.027 0.073
PANAS_18_N -0.020 0.010 -0.034 0.024 0.025 0.027 0.041 0.042 0.010
PANAS_20_N 0.056 0.050 0.076 0.072 0.076 0.071 0.125 0.082 0.115
Table 51: Cross-Loading Results for Personal Information Compromise, Part 10 of 12
RE
Connect RE
Educate RE
Email RE
Financ. RE
Firewall RE
InfoSh RE
Malware RE
Passwrd RE
Wirelss
PANAS_01_P 0.222 0.188 0.145 0.230 0.147 0.258 0.218 0.177 0.221
PANAS_03_P 0.121 0.067 0.047 0.108 0.083 0.121 0.151 0.096 0.107
PANAS_05_P 0.136 0.189 0.050 0.133 0.156 0.132 0.178 0.118 0.127
PANAS_09_P 0.103 0.090 0.099 0.177 0.107 0.167 0.172 0.156 0.144
PANAS_10_P 0.153 0.195 0.116 0.201 0.112 0.151 0.158 0.178 0.151
PANAS_12_P 0.182 0.158 0.134 0.223 0.161 0.162 0.161 0.156 0.174
PANAS_14_P 0.093 0.075 0.060 0.149 0.116 0.126 0.109 0.104 0.061
PANAS_16_P 0.121 0.163 0.052 0.214 0.125 0.137 0.122 0.174 0.128
PANAS_17_P 0.174 0.145 0.188 0.256 0.163 0.186 0.230 0.267 0.239
PANAS_19_P 0.118 0.040 0.051 0.064 0.077 0.099 0.122 0.174 0.078
PANAS_02_N -0.057 -0.147 0.018 -0.062 -0.058 -0.044 -0.117 -0.075 -0.103
PANAS_04_N -0.078 -0.161 -0.036 -0.076 -0.104 -0.102 -0.168 -0.133 -0.136
PANAS_06_N -0.024 -0.025 0.029 0.009 -0.007 -0.044 -0.008 -0.014 0.000
PANAS_07_N -0.065 -0.070 0.032 -0.014 -0.059 -0.068 -0.118 -0.044 -0.050
PANAS_08_N -0.108 -0.127 -0.043 -0.076 -0.062 -0.100 -0.109 -0.075 -0.107
PANAS_11_N -0.058 -0.134 -0.021 -0.094 -0.082 -0.052 -0.135 -0.064 -0.119
PANAS_13_N 0.019 -0.059 0.012 -0.011 -0.008 -0.068 -0.057 -0.022 -0.002
PANAS_15_N 0.065 -0.047 0.060 0.075 0.087 0.042 0.007 0.008 -0.021
PANAS_18_N 0.032 -0.060 0.126 0.094 0.084 0.029 -0.052 0.047 -0.035
PANAS_20_N -0.040 -0.129 0.029 -0.013 -0.068 -0.086 -0.153 -0.045 -0.138

ROLE OF AFFECT IN INFORMATION SECURITY BEHAVIOR
270
Table 52: Cross-Loading Results for Personal Information Compromise, Part 11 of 12
SE
Connect SE
Educate SE
Email SE
Financ. SE
Firewall SE
InfoSh SE
Malware SE
Passwrd SE
Wirelss
PANAS_01_P 0.198 0.130 0.196 0.277 0.129 0.236 0.131 0.088 0.102
PANAS_03_P 0.015 0.054 0.000 0.111 0.031 0.045 -0.011 0.084 0.079
PANAS_05_P 0.109 0.178 0.104 0.186 0.119 0.128 0.080 0.078 0.149
PANAS_09_P 0.085 0.050 0.082 0.196 0.018 0.109 0.043 0.088 0.086
PANAS_10_P 0.100 0.159 0.100 0.187 0.079 0.103 0.017 0.115 0.144
PANAS_12_P 0.130 0.151 0.156 0.229 0.048 0.123 0.091 0.105 0.093
PANAS_14_P 0.066 0.071 0.024 0.141 0.029 0.096 -0.033 0.055 0.051
PANAS_16_P 0.087 0.069 0.117 0.151 0.117 0.120 0.038 0.098 0.048
PANAS_17_P 0.185 0.101 0.144 0.282 0.049 0.200 0.161 0.125 0.108
PANAS_19_P 0.033 0.085 0.047 0.109 0.047 0.083 0.013 0.096 0.071
PANAS_02_N -0.019 -0.107 -0.004 -0.040 -0.106 -0.033 -0.159 -0.082 -0.179
PANAS_04_N -0.070 -0.103 -0.024 -0.082 -0.122 -0.076 -0.172 -0.111 -0.188
PANAS_06_N 0.025 -0.032 0.005 -0.072 -0.011 -0.063 -0.096 -0.101 -0.046
PANAS_07_N -0.045 0.008 -0.015 -0.038 -0.134 -0.143 -0.160 -0.055 -0.139
PANAS_08_N -0.128 -0.151 -0.074 -0.139 -0.084 -0.212 -0.117 -0.122 -0.124
PANAS_11_N -0.001 -0.109 0.046 -0.064 -0.168 -0.025 -0.114 -0.120 -0.197
PANAS_13_N -0.023 0.011 -0.020 -0.055 -0.015 -0.140 -0.064 -0.004 -0.049
PANAS_15_N 0.070 -0.052 0.056 0.047 -0.017 0.037 -0.044 -0.064 -0.071
PANAS_18_N 0.007 -0.018 0.109 0.068 -0.064 0.037 -0.121 -0.078 -0.068
PANAS_20_N -0.029 -0.037 -0.023 -0.071 -0.119 -0.073 -0.176 -0.084 -0.152
Table 53: Cross-Loading Results for Personal Information Compromise, Part 12 of 12
TNA TPA TS TV
PANAS_01_P -0.008 0.732 0.112 -0.047
PANAS_03_P 0.134 0.758 0.170 -0.084
PANAS_05_P -0.067 0.789 0.139 -0.111
PANAS_09_P -0.019 0.815 0.050 -0.087
PANAS_10_P -0.068 0.812 0.105 -0.138
PANAS_12_P -0.095 0.649 0.090 -0.098
PANAS_14_P 0.104 0.772 0.134 -0.103
PANAS_16_P -0.075 0.750 0.078 -0.124
PANAS_17_P -0.134 0.635 0.065 -0.118
PANAS_19_P 0.038 0.769 0.095 -0.093
PANAS_02_N 0.791 -0.052 0.031 0.099
PANAS_04_N 0.853 -0.015 0.068 0.141
PANAS_06_N 0.638 0.031 0.017 0.104
PANAS_07_N 0.729 0.025 0.055 0.016
PANAS_08_N 0.705 -0.075 0.023 0.142
PANAS_11_N 0.769 -0.086 0.081 0.102
PANAS_13_N 0.650 0.036 0.046 0.011
PANAS_15_N 0.722 0.032 0.094 0.032
PANAS_18_N 0.667 0.072 0.099 -0.008
PANAS_20_N 0.772 -0.061 0.065 0.030

ROLE OF AFFECT IN INFORMATION SECURITY BEHAVIOR
271
Appendix N – Data for AVE of the Constructs Greater than the Square Test for
Discriminant Validity: Loss of Data and Files
Table 54: AVE of the Constructs Greater than the Square Test for Loss of Data and Files, Part 1 of 4
AVE
RC Backup
RC Educate
RC Firewall
RC Malware
RC Permiss.
RC_Backup 0.776 1.000
RC_Educate 0.890 0.284 1.000
RC_Firewall 0.874 0.183 0.132 1.000
RC_Malware 0.834 0.212 0.200 0.421 1.000
RC_Permissions 0.884 0.223 0.236 0.290 0.235 1.000
RE_Backup 0.852 0.108 0.054 0.098 0.091 0.077
RE_Educate 0.951 0.071 0.211 0.063 0.071 0.058
RE_Firewall 0.925 0.046 0.070 0.271 0.132 0.115
RE_Malware 0.899 0.082 0.041 0.192 0.304 0.088
RE_Permissions 0.928 0.022 0.048 0.127 0.093 0.242
SE_Backup 0.813 0.171 0.067 0.114 0.098 0.094
SE_Educate 0.873 0.062 0.206 0.069 0.075 0.067
SE_Firewall 0.887 0.069 0.081 0.480 0.224 0.093
SE_Malware 0.904 0.065 0.028 0.180 0.275 0.060
SE_Permissions 0.762 0.059 0.086 0.153 0.087 0.346
TNA 0.578 0.025 0.043 0.073 0.049 0.060
TPA 0.530 0.014 0.044 0.042 0.026 0.032
TS 0.888 0.011 0.012 0.010 0.001 0.000
TV 0.831 0.120 0.044 0.047 0.069 0.041

ROLE OF AFFECT IN INFORMATION SECURITY BEHAVIOR
272
Table 55: AVE of the Constructs Greater than the Square Test for Loss of Data and Files, Part 2 of 4
AVE
RE Backup
RE Educate
RE Firewall
RE Malware
RE Permiss.
RC_Backup 0.776
RC_Educate 0.890
RC_Firewall 0.874
RC_Malware 0.834
RC_Permissions 0.884
RE_Backup 0.852 1.000
RE_Educate 0.951 0.045 1.000
RE_Firewall 0.925 0.104 0.114 1.000
RE_Malware 0.899 0.162 0.082 0.260 1.000
RE_Permissions 0.928 0.098 0.083 0.285 0.162 1.000
SE_Backup 0.813 0.320 0.059 0.070 0.127 0.065
SE_Educate 0.873 0.067 0.469 0.100 0.078 0.085
SE_Firewall 0.887 0.090 0.083 0.354 0.172 0.121
SE_Malware 0.904 0.118 0.066 0.190 0.374 0.096
SE_Permissions 0.762 0.126 0.066 0.198 0.129 0.420
TNA 0.578 0.009 0.028 0.034 0.002 0.007
TPA 0.530 0.068 0.049 0.037 0.022 0.044
TS 0.888 0.034 0.002 0.004 0.021 0.004
TV 0.831 0.038 0.033 0.008 0.028 0.004
Table 56: AVE of the Constructs Greater than the Square Test for Loss of Data and Files, Part 3 of 4
AVE
SE Backup
SE Educate
SE Firewall
SE Malware
SE Permiss.
RC_Backup 0.776
RC_Educate 0.890
RC_Firewall 0.874
RC_Malware 0.834
RC_Permissions 0.884
RE_Backup 0.852
RE_Educate 0.951
RE_Firewall 0.925
RE_Malware 0.899
RE_Permissions 0.928
SE_Backup 0.813 1.000
SE_Educate 0.873 0.114 1.000
SE_Firewall 0.887 0.135 0.112 1.000
SE_Malware 0.904 0.133 0.098 0.273 1.000
SE_Permissions 0.762 0.165 0.103 0.221 0.158 1.000
TNA 0.578 0.002 0.021 0.030 0.007 0.011
TPA 0.530 0.060 0.062 0.043 0.008 0.033
TS 0.888 0.005 0.006 0.009 0.005 0.004
TV 0.831 0.079 0.035 0.035 0.027 0.020

ROLE OF AFFECT IN INFORMATION SECURITY BEHAVIOR
273
Table 57: AVE of the Constructs Greater than the Square Test for Loss of Data and Files, Part 4 of 4
AVE TNA TPA TS TV
RC_Backup 0.776
RC_Educate 0.890
RC_Firewall 0.874
RC_Malware 0.834
RC_Permissions 0.884
RE_Backup 0.852
RE_Educate 0.951
RE_Firewall 0.925
RE_Malware 0.899
RE_Permissions 0.928
SE_Backup 0.813
SE_Educate 0.873
SE_Firewall 0.887
SE_Malware 0.904
SE_Permissions 0.762
TNA 0.578 1.000
TPA 0.530 0.006 1.000
TS 0.888 0.000 0.011 1.000
TV 0.831 0.002 0.017 0.015 1.000

ROLE OF AFFECT IN INFORMATION SECURITY BEHAVIOR
274
Appendix O – Data for Cross-Loading Test for Discriminant Validity: Loss of Data
and Files
Table 58: Cross-Loading Results for Loss of Data and Files, Part 1 of 8
RC
Backup RC
Educate RC
Firewall RC
Malware RC
Permiss.
Backup_RC_2 0.865 0.413 0.361 0.381 0.373
Backup_RC_3 0.896 0.520 0.392 0.428 0.455
Backup_RE_1 -0.293 -0.194 -0.262 -0.237 -0.258
Backup_RE_2 -0.311 -0.232 -0.314 -0.315 -0.253
Backup_SE_1 -0.340 -0.214 -0.290 -0.264 -0.230
Backup_SE_2 -0.403 -0.251 -0.318 -0.298 -0.319
Educate_RC_2 0.499 0.946 0.357 0.451 0.481
Educate_RC_3 0.508 0.940 0.329 0.390 0.435
Educate_RE_1 -0.240 -0.440 -0.243 -0.258 -0.237
Educate_RE_2 -0.280 -0.456 -0.245 -0.260 -0.234
Educate_SE_1 -0.250 -0.385 -0.265 -0.284 -0.246
Educate_SE_2 -0.211 -0.467 -0.225 -0.225 -0.236
Firewal_RC_2 0.386 0.351 0.933 0.600 0.483
Firewal_RC_3 0.414 0.330 0.936 0.614 0.524
Firewal_RE_1 -0.200 -0.255 -0.508 -0.352 -0.333
Firewal_RE_2 -0.212 -0.253 -0.494 -0.348 -0.320
Firewal_SE_1 -0.258 -0.277 -0.636 -0.463 -0.296
Firewal_SE_2 -0.237 -0.258 -0.671 -0.427 -0.277
Malware_RC_2 0.357 0.380 0.600 0.906 0.414
Malware_RC_3 0.480 0.434 0.587 0.921 0.470
Malware_RE_1 -0.301 -0.212 -0.408 -0.517 -0.295
Malware_RE_2 -0.242 -0.175 -0.424 -0.529 -0.268
Malware_SE_1 -0.225 -0.150 -0.373 -0.463 -0.197
Malware_SE_2 -0.259 -0.165 -0.433 -0.532 -0.267
Permiss_RC_2 0.454 0.435 0.510 0.462 0.940
Permiss_RC_3 0.435 0.480 0.503 0.451 0.941
Permiss_RE_1 -0.120 -0.183 -0.319 -0.274 -0.440
Permiss_RE_2 -0.163 -0.238 -0.368 -0.313 -0.508
Permiss_SE_1 -0.223 -0.255 -0.310 -0.279 -0.432
Permiss_SE_2 -0.221 -0.245 -0.389 -0.260 -0.559
Permiss_SE_3 -0.189 -0.270 -0.323 -0.231 -0.562

ROLE OF AFFECT IN INFORMATION SECURITY BEHAVIOR
275
Table 59: Cross-Loading Results for Loss of Data and Files, Part 2 of 8
RE
Backup RE
Educate RE
Firewall RE
Malware RE
Permiss.
Backup_RC_2 -0.330 -0.162 -0.221 -0.222 -0.096
Backup_RC_3 -0.253 -0.299 -0.160 -0.279 -0.160
Backup_RE_1 0.913 0.183 0.259 0.343 0.254
Backup_RE_2 0.933 0.207 0.332 0.396 0.320
Backup_SE_1 0.515 0.220 0.223 0.290 0.193
Backup_SE_2 0.507 0.220 0.254 0.349 0.263
Educate_RC_2 -0.251 -0.428 -0.273 -0.211 -0.219
Educate_RC_3 -0.185 -0.440 -0.225 -0.172 -0.194
Educate_RE_1 0.214 0.976 0.333 0.293 0.297
Educate_RE_2 0.200 0.974 0.326 0.265 0.264
Educate_SE_1 0.251 0.610 0.283 0.279 0.260
Educate_SE_2 0.232 0.675 0.308 0.242 0.287
Firewal_RC_2 -0.286 -0.228 -0.476 -0.412 -0.310
Firewal_RC_3 -0.299 -0.240 -0.497 -0.407 -0.357
Firewal_RE_1 0.321 0.318 0.962 0.496 0.523
Firewal_RE_2 0.299 0.333 0.961 0.485 0.505
Firewal_SE_1 0.316 0.283 0.571 0.397 0.332
Firewal_SE_2 0.244 0.259 0.550 0.383 0.325
Malware_RC_2 -0.337 -0.187 -0.362 -0.515 -0.258
Malware_RC_3 -0.219 -0.295 -0.305 -0.494 -0.297
Malware_RE_1 0.386 0.259 0.458 0.947 0.391
Malware_RE_2 0.377 0.284 0.508 0.949 0.374
Malware_SE_1 0.320 0.248 0.398 0.564 0.262
Malware_SE_2 0.333 0.242 0.430 0.598 0.326
Permiss_RC_2 -0.290 -0.232 -0.356 -0.311 -0.498
Permiss_RC_3 -0.231 -0.222 -0.282 -0.247 -0.428
Permiss_RE_1 0.305 0.272 0.505 0.387 0.963
Permiss_RE_2 0.298 0.283 0.524 0.390 0.964
Permiss_SE_1 0.362 0.221 0.367 0.329 0.531
Permiss_SE_2 0.314 0.194 0.436 0.313 0.561
Permiss_SE_3 0.245 0.268 0.360 0.297 0.619

ROLE OF AFFECT IN INFORMATION SECURITY BEHAVIOR
276
Table 60: Cross-Loading Results for Loss of Data and Files, Part 3 of 8
SE
Backup SE
Educate SE
Firewall SE
Malware SE
Permiss.
Backup_RC_2 -0.366 -0.165 -0.239 -0.221 -0.200
Backup_RC_3 -0.364 -0.266 -0.226 -0.228 -0.226
Backup_RE_1 0.557 0.222 0.252 0.302 0.315
Backup_RE_2 0.492 0.254 0.298 0.331 0.339
Backup_SE_1 0.892 0.290 0.316 0.328 0.313
Backup_SE_2 0.911 0.317 0.346 0.331 0.415
Educate_RC_2 -0.250 -0.453 -0.300 -0.201 -0.313
Educate_RC_3 -0.238 -0.403 -0.236 -0.110 -0.237
Educate_RE_1 0.251 0.691 0.286 0.258 0.269
Educate_RE_2 0.224 0.645 0.277 0.243 0.232
Educate_SE_1 0.351 0.941 0.326 0.334 0.301
Educate_SE_2 0.276 0.928 0.299 0.247 0.298
Firewal_RC_2 -0.309 -0.243 -0.639 -0.360 -0.349
Firewal_RC_3 -0.322 -0.249 -0.655 -0.433 -0.381
Firewal_RE_1 0.254 0.300 0.568 0.436 0.439
Firewal_RE_2 0.256 0.308 0.577 0.402 0.416
Firewal_SE_1 0.388 0.350 0.948 0.549 0.449
Firewal_SE_2 0.299 0.277 0.935 0.429 0.436
Malware_RC_2 -0.288 -0.204 -0.458 -0.513 -0.227
Malware_RC_3 -0.283 -0.292 -0.409 -0.448 -0.309
Malware_RE_1 0.354 0.286 0.375 0.605 0.363
Malware_RE_2 0.322 0.244 0.411 0.554 0.318
Malware_SE_1 0.319 0.286 0.490 0.947 0.339
Malware_SE_2 0.373 0.308 0.504 0.955 0.414
Permiss_RC_2 -0.275 -0.249 -0.272 -0.259 -0.564
Permiss_RC_3 -0.301 -0.236 -0.302 -0.203 -0.541
Permiss_RE_1 0.257 0.268 0.353 0.301 0.631
Permiss_RE_2 0.234 0.294 0.319 0.298 0.618
Permiss_SE_1 0.394 0.290 0.460 0.432 0.859
Permiss_SE_2 0.372 0.269 0.437 0.344 0.932
Permiss_SE_3 0.290 0.282 0.322 0.248 0.826

ROLE OF AFFECT IN INFORMATION SECURITY BEHAVIOR
277
Table 61: Cross-Loading Results for Loss of Data and Files, Part 4 of 8
TNA TPA TS TV
Backup_RC_2 0.080 -0.050 -0.083 0.273
Backup_RC_3 0.194 -0.156 -0.099 0.335
Backup_RE_1 -0.056 0.227 0.186 -0.191
Backup_RE_2 -0.111 0.254 0.156 -0.170
Backup_SE_1 -0.049 0.193 0.102 -0.231
Backup_SE_2 -0.026 0.248 0.033 -0.273
Educate_RC_2 0.200 -0.190 -0.110 0.195
Educate_RC_3 0.193 -0.207 -0.093 0.201
Educate_RE_1 -0.159 0.211 0.038 -0.174
Educate_RE_2 -0.166 0.222 0.050 -0.181
Educate_SE_1 -0.130 0.224 0.083 -0.178
Educate_SE_2 -0.143 0.241 0.066 -0.174
Firewal_RC_2 0.308 -0.174 -0.089 0.221
Firewal_RC_3 0.200 -0.209 -0.102 0.187
Firewal_RE_1 -0.199 0.174 0.066 -0.074
Firewal_RE_2 -0.155 0.196 0.056 -0.103
Firewal_SE_1 -0.165 0.217 0.074 -0.189
Firewal_SE_2 -0.159 0.173 0.103 -0.160
Malware_RC_2 0.192 -0.165 -0.020 0.233
Malware_RC_3 0.213 -0.133 -0.021 0.248
Malware_RE_1 -0.014 0.133 0.120 -0.179
Malware_RE_2 -0.076 0.151 0.157 -0.140
Malware_SE_1 -0.095 0.077 0.066 -0.165
Malware_SE_2 -0.065 0.090 0.064 -0.150
Permiss_RC_2 0.204 -0.144 -0.002 0.198
Permiss_RC_3 0.255 -0.194 -0.002 0.182
Permiss_RE_1 -0.063 0.211 0.054 -0.062
Permiss_RE_2 -0.098 0.191 0.072 -0.060
Permiss_SE_1 -0.017 0.162 0.070 -0.175
Permiss_SE_2 -0.146 0.146 0.048 -0.127
Permiss_SE_3 -0.115 0.172 0.045 -0.058

ROLE OF AFFECT IN INFORMATION SECURITY BEHAVIOR
278
Table 62: Cross-Loading Results for Loss of Data and Files, Part 5 of 8
RC
Backup RC
Educate RC
Firewall RC
Malware RC
Permiss.
TSev_1 -0.066 -0.062 -0.069 0.012 0.026
TSev_2 -0.126 -0.118 -0.120 -0.049 -0.030
TSev_3 -0.098 -0.118 -0.097 -0.022 0.001
TVul_1 0.317 0.180 0.176 0.216 0.179
TVul_2 0.316 0.205 0.224 0.267 0.190
PANAS_01_P -0.091 -0.122 -0.117 -0.115 -0.152
PANAS_03_P -0.007 -0.004 -0.087 -0.040 -0.059
PANAS_05_P -0.074 -0.123 -0.089 -0.040 -0.091
PANAS_09_P -0.119 -0.156 -0.164 -0.132 -0.156
PANAS_10_P -0.040 -0.195 -0.161 -0.098 -0.171
PANAS_12_P -0.131 -0.195 -0.228 -0.185 -0.109
PANAS_14_P -0.041 -0.121 -0.134 -0.079 -0.134
PANAS_16_P -0.075 -0.140 -0.151 -0.117 -0.120
PANAS_17_P -0.151 -0.223 -0.159 -0.204 -0.137
PANAS_19_P -0.072 -0.168 -0.139 -0.063 -0.139
PANAS_02_N 0.139 0.189 0.232 0.204 0.266
PANAS_04_N 0.123 0.146 0.205 0.178 0.187
PANAS_06_N 0.159 0.132 0.196 0.152 0.164
PANAS_07_N 0.088 0.160 0.158 0.141 0.168
PANAS_08_N 0.117 0.146 0.209 0.151 0.175
PANAS_11_N 0.168 0.186 0.265 0.211 0.175
PANAS_13_N 0.050 0.146 0.087 0.083 0.132
PANAS_15_N 0.071 0.149 0.143 0.126 0.141
PANAS_18_N 0.088 0.136 0.194 0.119 0.153
PANAS_20_N 0.103 0.170 0.238 0.202 0.223

ROLE OF AFFECT IN INFORMATION SECURITY BEHAVIOR
279
Table 63: Cross-Loading Results for Loss of Data and Files, Part 6 of 8
RE
Backup RE
Educate RE
Firewall RE
Malware RE
Permiss.
TSev_1 0.138 0.052 0.043 0.114 0.060
TSev_2 0.171 0.050 0.079 0.157 0.061
TSev_3 0.206 0.027 0.055 0.141 0.063
TVul_1 -0.160 -0.174 -0.092 -0.166 -0.087
TVul_2 -0.198 -0.158 -0.075 -0.140 -0.026
PANAS_01_P 0.178 0.192 0.114 0.098 0.146
PANAS_03_P 0.160 0.113 0.121 0.069 0.132
PANAS_05_P 0.133 0.074 0.079 0.071 0.070
PANAS_09_P 0.222 0.129 0.155 0.118 0.217
PANAS_10_P 0.149 0.170 0.119 0.111 0.151
PANAS_12_P 0.214 0.207 0.183 0.132 0.140
PANAS_14_P 0.169 0.182 0.115 0.089 0.169
PANAS_16_P 0.216 0.121 0.168 0.129 0.149
PANAS_17_P 0.226 0.218 0.126 0.137 0.128
PANAS_19_P 0.193 0.114 0.200 0.102 0.185
PANAS_02_N -0.053 -0.200 -0.146 -0.019 -0.051
PANAS_04_N -0.059 -0.151 -0.161 -0.038 -0.065
PANAS_06_N -0.029 -0.086 -0.153 -0.001 -0.058
PANAS_07_N -0.116 -0.098 -0.113 -0.081 -0.094
PANAS_08_N -0.128 -0.037 -0.174 -0.051 -0.078
PANAS_11_N -0.063 -0.198 -0.153 -0.035 -0.066
PANAS_13_N -0.067 -0.090 -0.073 0.005 -0.048
PANAS_15_N -0.076 -0.054 -0.113 -0.046 -0.018
PANAS_18_N -0.082 -0.075 -0.133 -0.028 -0.029
PANAS_20_N -0.071 -0.133 -0.132 -0.061 -0.106

ROLE OF AFFECT IN INFORMATION SECURITY BEHAVIOR
280
Table 64: Cross-Loading Results for Loss of Data and Files, Part 7 of 8
SE
Backup SE
Educate SE
Firewall SE
Malware SE
Permiss.
TSev_1 0.037 0.061 0.085 0.060 0.049
TSev_2 0.071 0.072 0.075 0.064 0.049
TSev_3 0.094 0.092 0.103 0.068 0.078
TVul_1 -0.239 -0.180 -0.145 -0.121 -0.115
TVul_2 -0.275 -0.162 -0.197 -0.183 -0.146
PANAS_01_P 0.198 0.246 0.125 0.085 0.163
PANAS_03_P 0.158 0.088 0.092 -0.002 0.112
PANAS_05_P 0.108 0.139 0.077 -0.008 0.055
PANAS_09_P 0.177 0.173 0.143 0.067 0.154
PANAS_10_P 0.151 0.191 0.153 0.011 0.141
PANAS_12_P 0.230 0.240 0.217 0.142 0.157
PANAS_14_P 0.145 0.147 0.140 0.053 0.126
PANAS_16_P 0.109 0.110 0.166 0.069 0.061
PANAS_17_P 0.230 0.229 0.194 0.108 0.147
PANAS_19_P 0.208 0.134 0.136 0.018 0.142
PANAS_02_N -0.034 -0.148 -0.156 -0.084 -0.101
PANAS_04_N -0.010 -0.145 -0.111 -0.080 -0.077
PANAS_06_N -0.046 -0.079 -0.114 -0.103 -0.062
PANAS_07_N -0.014 -0.107 -0.077 -0.027 -0.073
PANAS_08_N -0.024 -0.050 -0.125 -0.050 -0.076
PANAS_11_N -0.089 -0.154 -0.213 -0.098 -0.121
PANAS_13_N -0.022 -0.063 -0.009 0.026 0.006
PANAS_15_N 0.002 -0.103 -0.085 -0.042 -0.045
PANAS_18_N -0.032 -0.056 -0.058 -0.024 -0.025
PANAS_20_N 0.004 -0.106 -0.166 -0.034 -0.088

ROLE OF AFFECT IN INFORMATION SECURITY BEHAVIOR
281
Table 65: Cross-Loading Results for Loss of Data and Files, Part 8 of 8
TNA TPA TS TV
TSev_1 0.020 0.076 0.932 0.137
TSev_2 -0.016 0.103 0.957 0.117
TSev_3 0.028 0.118 0.938 0.094
TVul_1 0.040 -0.093 0.104 0.921
TVul_2 0.043 -0.149 0.118 0.902
PANAS_01_P -0.093 0.775 0.084 -0.152
PANAS_03_P 0.152 0.673 0.106 -0.017
PANAS_05_P 0.018 0.676 0.030 -0.104
PANAS_09_P -0.049 0.780 0.146 -0.084
PANAS_10_P -0.034 0.760 0.013 -0.125
PANAS_12_P -0.216 0.655 0.044 -0.102
PANAS_14_P 0.098 0.765 0.160 -0.056
PANAS_16_P -0.018 0.712 0.095 -0.071
PANAS_17_P -0.203 0.689 0.032 -0.141
PANAS_19_P -0.023 0.780 0.063 -0.042
PANAS_02_N 0.841 -0.028 0.046 0.073
PANAS_04_N 0.832 -0.087 0.026 0.033
PANAS_06_N 0.665 0.013 -0.018 0.012
PANAS_07_N 0.771 -0.092 -0.003 0.042
PANAS_08_N 0.720 -0.126 -0.057 0.091
PANAS_11_N 0.813 -0.075 -0.018 0.011
PANAS_13_N 0.627 -0.092 0.046 0.048
PANAS_15_N 0.772 -0.076 0.088 -0.023
PANAS_18_N 0.723 0.003 0.027 -0.017
PANAS_20_N 0.805 -0.051 0.011 0.041

ROLE OF AFFECT IN INFORMATION SECURITY BEHAVIOR
282
CURRICULUM VITAE
Marc J. Dupuis Lecturer | Institute of Technology Director of Human Factors | CIAC
(206) 931-8829 ● [email protected]
Education
Doctorate of Philosophy, Information Science
University of Washington Seattle, WA 2014 Area of study within Information Science is Information Assurance and Cyber Security
Dissertation titled: “The Role of Trait Affect in the Information Security Behavior of Home Users”
Lead author on a workshop paper exploring the role of risk tolerance in various domains on information security behavior
Lead author on a white paper exploring the need for governance, risk management, and compliance (GRC) frameworks in China
Master of Science in Information Science
University of Washington Seattle, WA 2011 Studied research methodologies, information behavior theories, models, and frameworks, and the information security practices of home users.
Certificate in Information Assurance and Cyber Security
CIAC (UW) Seattle, WA 2009 Studied organizational information assurance; risk assessment, management, and decision making; cyber defense strategies; response to system compromise, and legal and regulatory compromise.
Developed a mathematical model to predict future indirect costs associated with increased churn rates due to security breaches
Master of Public Administration
University of Washington Seattle, WA 2007 Concentrations in social and education policy as well as non-profits Conducted a large-scale employee survey using both qualitative and quantitative methodologies
Public Administration Honor Society

ROLE OF AFFECT IN INFORMATION SECURITY BEHAVIOR
283
Master of Arts, Political Science
Western Washington University Bellingham, WA 2001 Focus on Public Policy and American Government
President’s List
Political Science Honor Society
Bachelor of Arts, Political Science
Western Washington University Bellingham, WA 1999 Focus on Public Policy and American Government
President’s List
Political Science Honor Society
Relevant Experience
Lecturer
Information Technology and Systems
University of Washington Tacoma, WA September 2012 – Current Develop lesson plans, prepare lectures, and lead discussions. Feedback given both orally and in writing.
Teach a 3-course Risk Management Series (Organizational Information Assurance, Building an Information Risk Management Toolkit, and Establishing and Managing Information Assurance Strategies), HCI (human computer interaction), and Web Design and Programming.
Teach courses in the new MCL (Masters in Cybersecurity and Leadership) program
ITS/CSS Lecturer Search Committee
iTech Fellows 2013 (lead author)
MCL Course Development (501, 502, 503, 505)
ITS Course Development (461, 462, 463, 490 [HCI])
Faculty Advisor for Internships, Independent Research Projects, Directed Readings
Director of Human Factors
Center for Information Assurance and Cybersecurity
University of Washington Seattle, WA November 2012 – Current A DHS/NSA Center for Academic Excellence in Information Assurance and Center for Academic Excellence - Research (CAE-R)
Leads Research on Human Factors in Information Assurance and Cybersecurity

ROLE OF AFFECT IN INFORMATION SECURITY BEHAVIOR
284
Teaching Assistant
Professional Continuing Education
University of Washington Seattle, WA August 2012 – June 2013 Primary individual in charge of all backend development for three risk management courses delivered on the Coursera platform.
Developed all writing assessments, quizzes, discussion questions, and official announcements.
Moderated the discussion forums to answer questions and act as the primary point of contact for students.
Coordinated with UW PCE staff and Coursera staff to troubleshoot issues as they would arise.
Disability Adjudicator Trainer
Washington State Government Seattle, WA July 2010 – September 2012 Division of Disability Determination Services Planned, organized and presented introductory and ongoing training for all professional adjudicators and medical consultants. Trained new adjudicative staff. Developed training manuals and trained on program policies and procedures and systems software. Advised adjudicators on appropriate medical and vocational development and decision policy.
Special assignment to the Social Security Administration Regional Office to train disability processing unit (DPU) examiners; the only such collaboration in the country
Lecturer
Building an Information Risk Management Toolkit
University of Washington Tacoma, WA Winter 2012 Developed lesson plans, prepared lectures, and led discussions. Feedback was given both orally and in writing.
Collaborated with multiple instructors from the University of Washington Seattle to offer a hybrid course using Adobe Connect one class session each week
Teaching Assistant
University of Washington Seattle, WA 2007 — 2011 (10 quarters) Served as a teaching assistant for various courses. These courses included: Foundations of Organizational Information Assurance; Information Assurance Risk Assessment and Management; Establishing and Managing Information Assurance Strategies; Research Methods; Database Management and Information Retrieval Systems; Policy, Law, and Ethics in Information Management, and Fluency in Information Technology. Independently ran lab sections, graded papers and lab assignments, and provided assistance during office hours as well as via e-mail.

ROLE OF AFFECT IN INFORMATION SECURITY BEHAVIOR
285
Lecturer
Research Methods
University of Washington Seattle, WA Fall 2008, 2009, & 2012 Developed lesson plans, prepared lectures, created new assignments, labs, and projects for the students to work on, and led discussions. Feedback was given both orally and in writing.
Supervised a graduate teaching assistant
Created new labs for the qualitative methods sections
Designed new exercises to help further engage the students in learning the material
Served as the sponsor for individual students for both independent studies and internships
Teaching Assistant
Western Washington University Bellingham, WA 1999 — 2001 Served as a teaching assistant for various courses. These courses included: Constitutional Law I & II, American Political System, and World Politics. Independently ran discussion sections, graded papers and exams, and provided assistance during office hours as well as via e-mail.
Created an online discussion website to facilitate additional venues for class participation
Other Experience
Founder and Webmaster
U.S. Politics Online Internet December 2000 – April 2014
Founded and maintained a non-partisan political discussion forum dedicated to the free exchange of
ideas.
#1 search result on both Bing and Google for “political discussion” for 7+ years
Managed a staff of over a dozen volunteer administrators and moderators
Research Activities and Professional Engagements
Refereed Publications (journals, conferences, workshops)
Dupuis, M. and Endicott-Popovsky, B. (2014). “Managing Information Security Curriculum when Facing Course Scheduling Challenges: A Case Study.” To Be Presented at the Colloquium for Information Systems Security Education (CISSE 2014), San Diego, CA. (round table paper) Dupuis, M. and Endicott-Popovsky, B. (2014). “The Art of Cyber Warfare: An Exploration of Classic Military Strategies and the Threat Against Home Users.” Presented at the International Conference on Cyber Warfare and Security (ICCWS 2014), West Lafayette, IN. (presentation)

ROLE OF AFFECT IN INFORMATION SECURITY BEHAVIOR
286
Dupuis, M., Menking, A., & Mason, R. (2014). “Perceptions of Walls: An Exploration of Trait Affect and Personality in a Cross Cultural Study of Perception of Risks Related to the Edward Snowden Case.” Presented at the iConference, Berlin, Germany. (full paper) Mason, R., & Dupuis, M. (2014). “Cultural Values, Information Sources, and Perceptions of Security.” Presented at the iConference, Berlin, Germany. (research note) Dupuis, M., Endicott-Popovsky, B., & Crossler, R. (2013). “An Analysis of the Use of Amazon’s Mechanical Turk for Survey Research in the Cloud.” Presented at the International Conference on Cloud Security Management, Seattle, Washington. (full paper) Bang, S., Chung, S., Choh, Y., & Dupuis, M. (2013). “A Grounded Theory Analysis of Modern Web Applications - Knowledge, Skills, and Abilities for DevOps.” Presented at the Conference on Research in Information Technology, Orlando, Florida. (poster) Dupuis, M. J., Crossler, R. E., & Endicott-Popovsky, B. (2012). “The Information Security Behavior of Home Users: Exploring a User’s Risk Tolerance and Past Experiences in the Context of Backing Up Information.” Presented at The Dewald Roode Information Security Workshop, Provo, Utah. (full paper) Dupuis, M., Endicott-Popovsky, B., Wang, H., Subramaniam, I., and Du, Y. (2011). “Top-Down Mandates and the Need for Organizational Governance, Risk Management, and Compliance in China: A Discussion.” China-USA Business Review. 10:5. 319-335. (journal article) Dupuis, M., Endicott-Popovsky, B., Wang, H., Subramaniam, I., & Du, Y. (2010). “Top-Down Mandates and the Need for Organizational Governance, Risk Management, and Compliance in China: A Discussion.” Presented at the Asia Pacific Economic Association Conference, Hong Kong, China. (full paper)
Works in Progress
Warkentin, M., Dupuis, M, Crossler, R., and Bekkering, E. “Hackers and the Black Market for Security: An Examination of the ‘Bad Guy’.” Work in progress for a CFP for a Special Issue (“Dark Side”) of the Information Systems Journal. Dupuis, M. “Measuring the Information Security Behavior of Home Users: Development of an Instrument.” Work in progress. Journal targeted: MIS Quarterly. Dupuis, M. “Exploring the Role of Trait Affect on the Information Security Behavior of Home Users.” Work in progress. Journal targeted: Decision Sciences. Dupuis, M., Endicott-Popovsky, B., Crossler, R. “An Extended Analysis of Amazon’s Mechanical Turk Users.” Work in progress. Journal targeted: Communications of the AIS. Dupuis, M. “The Impact of Personality Traits on our Information Security Behavior.” Work in progress. Journal targeted: IEEE Security and Privacy.

ROLE OF AFFECT IN INFORMATION SECURITY BEHAVIOR
287
Current Research Groups
National Strategy for Trusted Identities in Cyberspace (NSTIC) User Experience Committee, Identity Ecosystem Steering Group (IDESG) NSTIC was signed by President Obama in 2011 with the purpose of collaboration between private, public, and governmental organizations so that the security and privacy of online transactions could be made safer, faster, and more private. I am on a committee that examines the user experience component. http://www.nist.gov/nstic/ Records in the Cloud (RiC) An international collaboration among multiple universities that examines the role of security in services provided in the cloud. http://recordsinthecloud.org/ InterPARES Project International research on permanent authentic records in electronic systems. http://www.interpares.org/
Leadership Positions
Director of Human Factors Center for Information Assurance and Cybersecurity (CIAC) University of Washington Vice-Chair User Experience Committee (UXC) Identity Ecosystem Steering Group (IDESG) / National Strategy for Trusted Identities in Cyberspace (NSTIC) Secretary, Board Member, and Academic Advocate Rainier Chapter of ISACA
Conference Committees
International Conference on Cloud Security Management (2013 – current)
Chair of PhD Poster Session Dewald Roode Workshop on Information Systems Security Research (2012 – current)
Acknowledgements
Greitzer, F. L. (2011). Situated Usability Testing for Security Systems. Pacific Northwest National Laboratory.

ROLE OF AFFECT IN INFORMATION SECURITY BEHAVIOR
288
Invited Speaking Engagements
Greyhat Group Tacoma, WA
2014
MSL (Math, Science, & Leadership program) Tacoma, WA
2013
Carnegie Conversation: Massive Open Online Courses (Portland State Univ.) Portland, WA
2013
Higher Education Summit: The Role of Online Education in Higher Education Seattle, WA
2012
Information Security and Risk Management on Coursera (Panelist) Seattle, WA
2012
Foundations of Informatics Seattle, WA
2011
Cybersecurity Awareness Month (Panelist) Seattle, WA
2010
Secure World Expo (Panelist) Bellevue, WA
2009
Grants
Community Engagement Grant Center for Leadership and Social Responsibility (CLSR) in the Milgard School of Business iTech Fellowship University of Washington Tacoma
Certifications
C|EH (Certified Ethical Hacker) E|CIH (EC-Council Certified Incident Handler)
Professional Affiliations and Activities
ACM (Association for Computing Machinery)
Educational and scientific computing society
Agora
Public-private partnership organization for information security professionals

ROLE OF AFFECT IN INFORMATION SECURITY BEHAVIOR
289
APWG (Anti-Phishing Working Group)
Worldwide coalition unifying the global response to cybercrime across industry, government and law-enforcement sectors
ASIS&T (The Association for Information Science & Technology)
Association for information professionals
Cyber Storm IV: Evergreen Planner
Cybersecurity exercise/challenge in a joint effort between the FBI, FEMA, Washington State Military Department, governmental, and non-governmental organizations.
Dewald Roode Workshop on Information Systems Security Research IFIP WG8.11/WG11.13
Program Committee Member: 2012, 2013
Reviewer: 2012, 2013
HTCIA (High Technology Crime Investigation Association)
Education and collaboration for the prevention and investigation of high tech crimes
ISACA (previously known as Information Systems Audit and Control Association) Academic Advocate
Board Member and Secretary of Rainier Chapter
Information systems professional organization
IEEE (Institute of Electrical and Electronics Engineers)
Professional association for the advancement of technology
InfraGard
Non-profit public-private partnership between the FBI and organizations
Pi Alpha Alpha Honor Society
Honor society for public affairs and administration
Pi Sigma Alpha Honor Society
Honor society for political science
Prometric (Consultant)
International Testing Company
University of Washington Undergraduate Research Symposium
Session Moderator: 2013, 2014
Faculty Mentor: 2012, 2013, 2014
Upsilon Pi Epsilon Honor Society
Honor society for computing and information disciplines (faculty member)