© copyright 2014, first solar,...
TRANSCRIPT
© Copyright 2014, First Solar, Inc.

2
© C
op
yrig
ht
20
14
, Fi
rst
Sola
r, I
nc.
site: San Luis Obispo, USA
size: 550MW
owners: MidAmerican Energy Holdings Company
TOPAZ SOLAR FARM
Largest investment grade renewable bond in history

© Copyright 2014, First Solar, Inc.
4
© C
op
yrig
ht
20
14
, Fi
rst
Sola
r, I
nc.
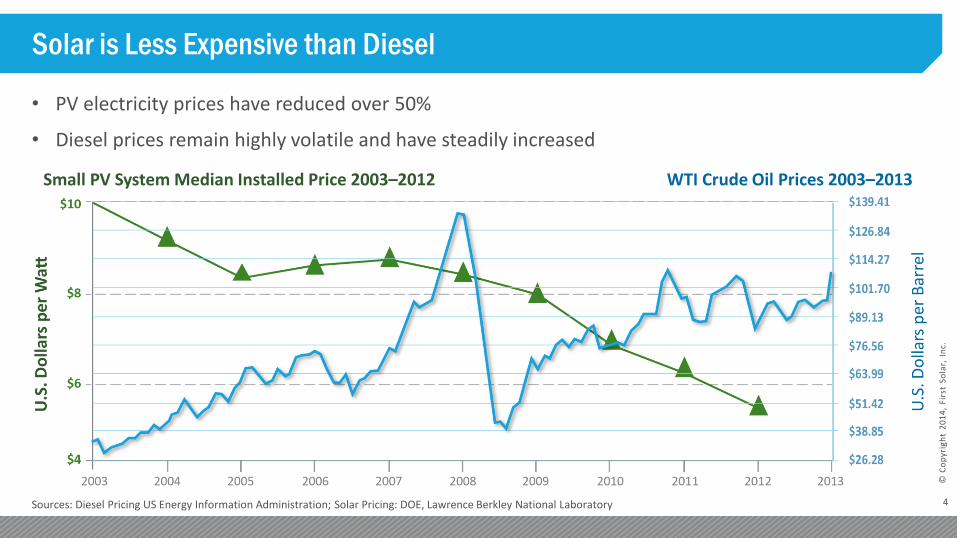
Solar is Less Expensive than Diesel
• PV electricity prices have reduced over 50%
Sources: Diesel Pricing US Energy Information Administration; Solar Pricing: DOE, Lawrence Berkley National Laboratory
• Diesel prices remain highly volatile and have steadily increased
Small PV System Median Installed Price 2003–2012 WTI Crude Oil Prices 2003–2013
5
© C
op
yrig
ht
20
14
, Fi
rst
Sola
r, I
nc.
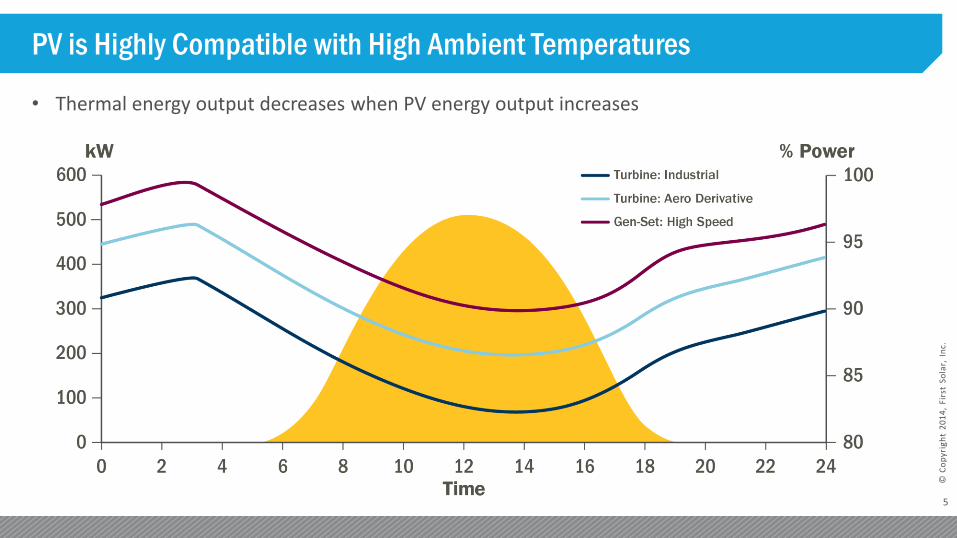
PV is Highly Compatible with High Ambient Temperatures
• Thermal energy output decreases when PV energy output increases

© Copyright 2013, First Solar, Inc.
7
© C
op
yrig
ht
20
14
, Fi
rst
Sola
r, I
nc.
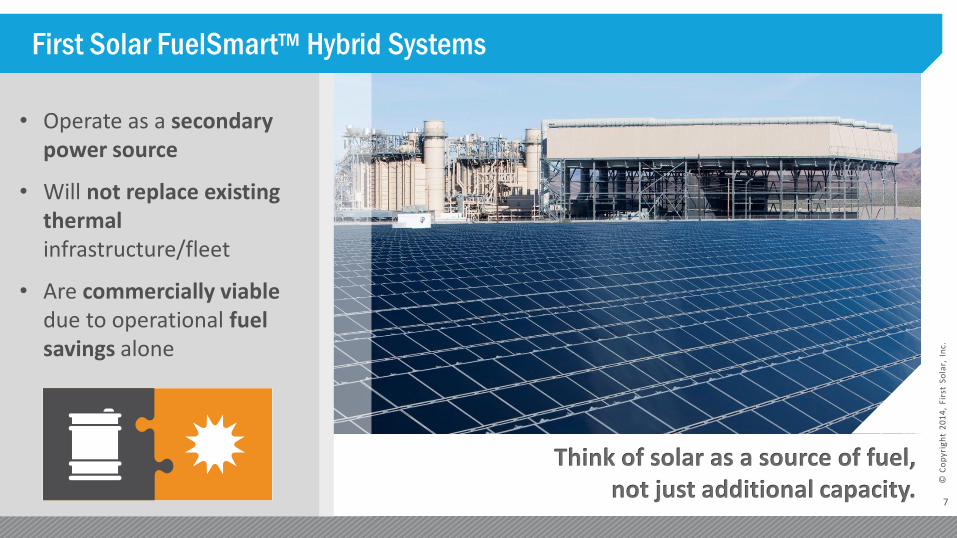
• Operate as a secondary power source
• Will not replace existing thermal infrastructure/fleet
• Are commercially viable due to operational fuel savings alone
First Solar FuelSmart™ Hybrid Systems
Think of solar as a source of fuel, not just additional capacity.

8
© C
op
yrig
ht
20
14
, Fi
rst
Sola
r, I
nc.
First Solar FuelSmart™ Benefits
• Economic
• Operational
• Environmental
10
© C
op
yrig
ht
20
14
, Fi
rst
Sola
r, I
nc.
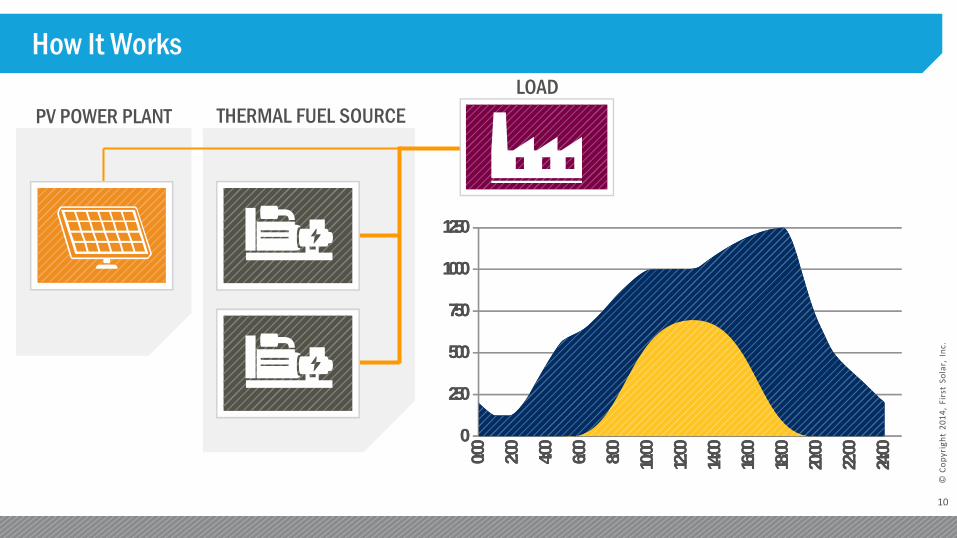
How It Works
0
250
500
750
1000
1250
0:00
2:00
4:00
6:00
8:00
10:00
12:00
14:00
16:00
18:00
20:00
22:00
24:000
250
500
750
1000
1250
0:00
2:00
4:00
6:00
8:00
10:00
12:00
14:00
16:00
18:00
20:00
22:00
24:00
LOAD
PV POWER PLANT THERMAL FUEL SOURCE
11
© C
op
yrig
ht
20
14
, Fi
rst
Sola
r, I
nc.
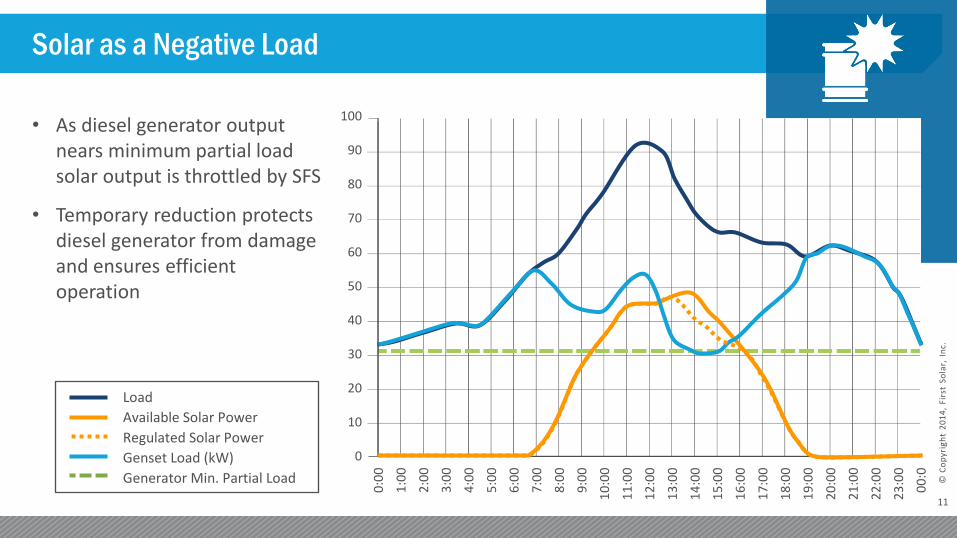
Solar as a Negative Load
100
90
80
70
60
50
40
30
20
10
0
0:0
0
1:0
0
2:0
0
3:0
0
4:0
0
5:0
0
6:0
0
7:0
0
8:0
0
9:0
0
10
:00
11
:00
12
:00
13
:00
14
:00
15
:00
16
:00
17
:00
18
:00
19
:00
20
:00
21
:00
22
:00
23
:00
00
:0
• As diesel generator output nears minimum partial load solar output is throttled by SFS
• Temporary reduction protects diesel generator from damage and ensures efficient operation
Load
Available Solar Power
Regulated Solar Power
Genset Load (kW)
Generator Min. Partial Load

12
© C
op
yrig
ht
20
14
, Fi
rst
Sola
r, I
nc.
0 4 8 12 16 20 240.0
0.2
0.4
0.6
0.8
1.0
Total Load
Diesel Power
PV Hybrid – Design Optimization
• Optimize design according to weighted criteria:
Maximize reliability
Maximum reduction of diesel
• Optimized for a simple load or a highly variable load
Lowest LCOE
Highest NPV
13
© C
op
yrig
ht
20
14
, Fi
rst
Sola
r, I
nc.
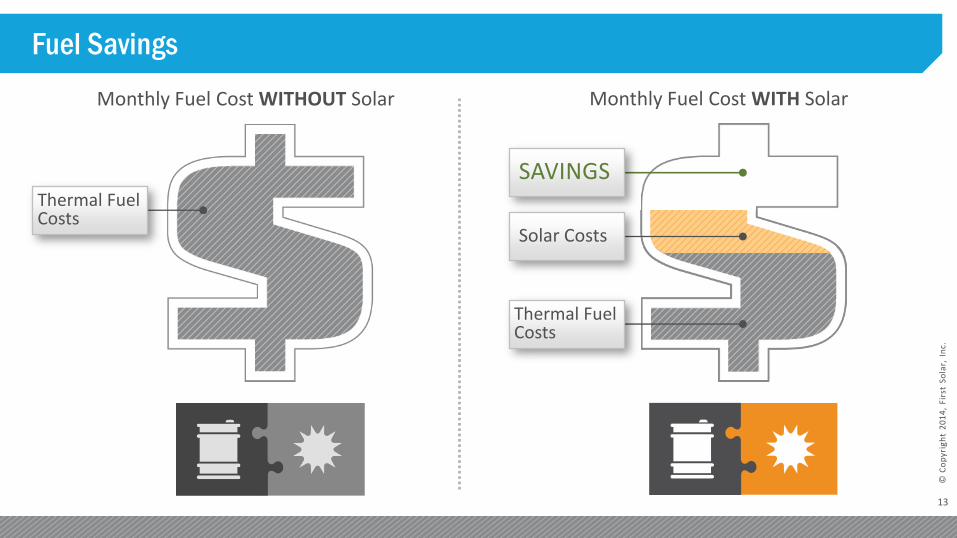
Fuel Savings
Monthly Fuel Cost WITHOUT Solar
Thermal Fuel Costs
Monthly Fuel Cost WITH Solar
Thermal Fuel Costs
Solar Costs
SAVINGS
14
© C
op
yrig
ht
20
14
, Fi
rst
Sola
r, I
nc.
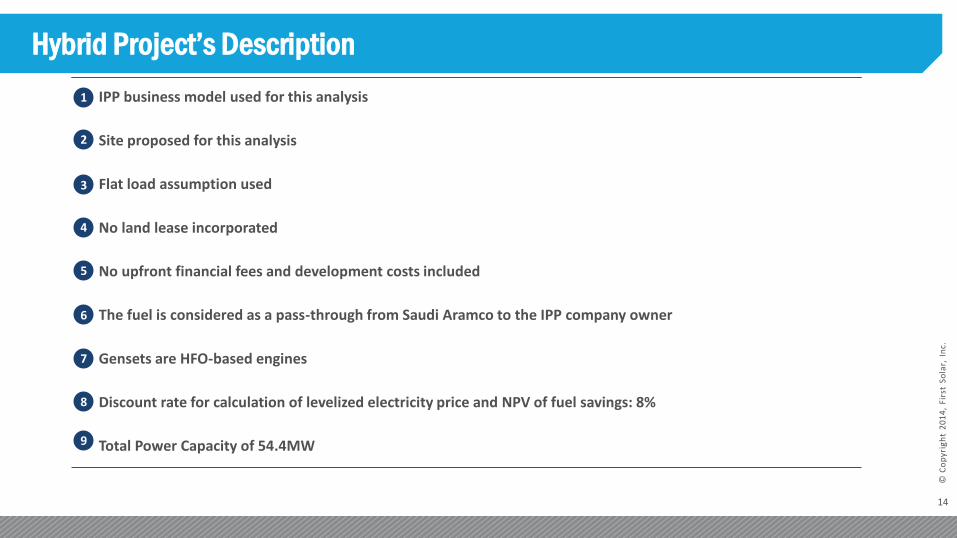
Hybrid Project’s Description
• IPP business model used for this analysis
• Site proposed for this analysis
• Flat load assumption used
• No land lease incorporated
• No upfront financial fees and development costs included
• The fuel is considered as a pass-through from Saudi Aramco to the IPP company owner
• Gensets are HFO-based engines
• Discount rate for calculation of levelized electricity price and NPV of fuel savings: 8%
• Total Power Capacity of 54.4MW
1
2
3
4
5
6
7
8
9

15
© C
op
yrig
ht
20
14
, Fi
rst
Sola
r, I
nc.
Hybrid Model – Assumptions Overview (cont’d)
COMBINED CAPEX/OPEX ASSUMPTIONS
• Total Capex (incl. IDC): US$ 115M
• Total First Year Opex (excl. fuel cost): US$ 7.5M
Optimization of the EPC cost during the construction period through the combination of construction capabilities
Optimization of the O&M cost through remote control of the PV portion and combination of the labor force on-site
Case Study: Hybrid project including a 54.4MWAC Genset facility and a 37.8MWac PV plant
Schedule
• Construction period: 15 months
• Project lifetime: 20 years
OTHER KEY ASSUMPTIONS
EPC/O&M CONSORTIUM
IPP SPV OWNER HYBRID PROJECT
OFFTAKER SAUDI ARAMCO
POTENTIAL HYBRID BUSINESS MODEL WITH SAUDI ARAMCO AS FUEL PROVIDER & ELECTRICITY OFFTAKER
Electricity cost
4.8 $cents / kWh instead of
3.7 $cents / kWh
(excl. fuel cost)
Optimized EPC and
O&M prices
Fuel supply: 635,742 barrels per year instead
of 762,875 barrels
16
© C
op
yrig
ht
20
14
, Fi
rst
Sola
r, I
nc.
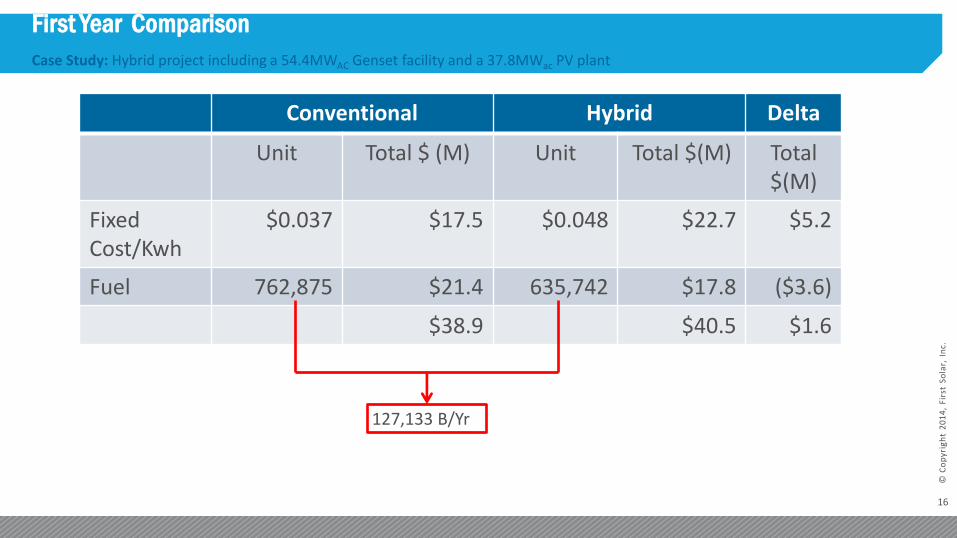
First Year Comparison
Case Study: Hybrid project including a 54.4MWAC Genset facility and a 37.8MWac PV plant
Conventional Hybrid Delta
Unit Total $ (M) Unit Total $(M) Total $(M)
Fixed Cost/Kwh
$0.037 $17.5 $0.048 $22.7 $5.2
Fuel 762,875 $21.4 635,742 $17.8 ($3.6)
$38.9 $40.5 $1.6
127,133 B/Yr

17
© C
op
yrig
ht
20
14
, Fi
rst
Sola
r, I
nc.
Hybrid Model – Daily Energy Generation
0
10,000
20,000
30,000
40,000
50,000
60,000
1 2 3 4 5 6 7 8 9 10 11 12 13 14 15 16 17 18 19 20 21 22 23 24
MW
Hours
PV Generation Gensets Generation
FLAT LOAD: 54,471 MW
ENERGY GENERATION SPLIT BY TECHNOLOGY
18
© C
op
yrig
ht
20
14
, Fi
rst
Sola
r, I
nc.
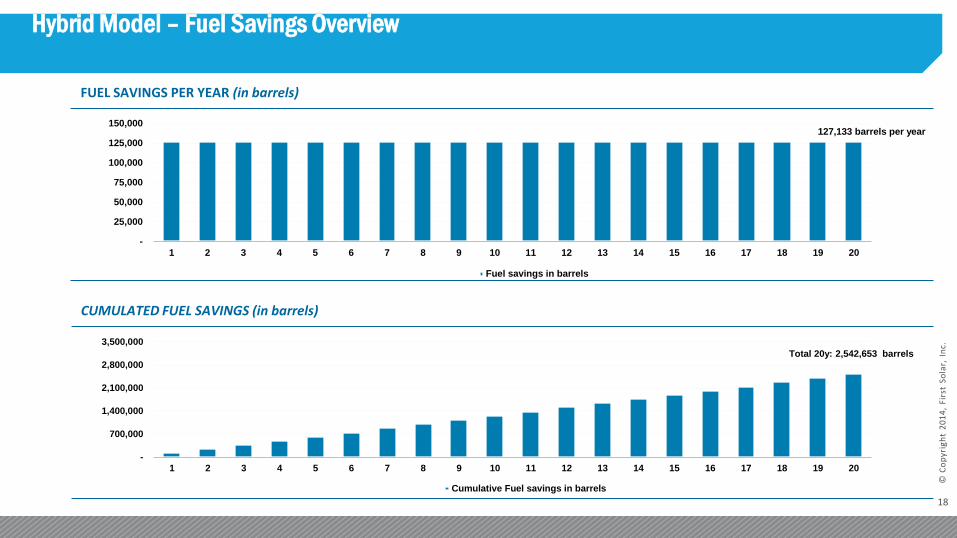
Hybrid Model – Fuel Savings Overview
CUMULATED FUEL SAVINGS (in barrels)
FUEL SAVINGS PER YEAR (in barrels)
127,133 barrels per year
-
25,000
50,000
75,000
100,000
125,000
150,000
1 2 3 4 5 6 7 8 9 10 11 12 13 14 15 16 17 18 19 20
Fuel savings in barrels
Total 20y: 2,542,653 barrels
-
700,000
1,400,000
2,100,000
2,800,000
3,500,000
1 2 3 4 5 6 7 8 9 10 11 12 13 14 15 16 17 18 19 20
Cumulative Fuel savings in barrels

19
© C
op
yrig
ht
20
14
, Fi
rst
Sola
r, I
nc.
Hybrid Model – Net Savings Evolution for Saudi Aramco
NET PRESENT VALUE OF NET SAVINGS (In US$ M) / HFO PRICE ANALYSIS (In US$ per tons)
ARAMCO BENEFIT IN HYBRID PROJECTS
1 NPV(Fuel saved in tons * Fuel price)
2 NPV(Δ Tariff * Total energy generated) -
+
= >0 WHEN HFO PRICE > $247/Tons
@ Discount rate of 8%
Fuel Price
In $ Millions 0 247 687
HYBRID (50) 0 88 (100)
(80)
(60)
(40)
(20)
0
20
40
60
80
100
0 100 200 300 400 500 600 700
In $
Mill
ion
s
Fuel Price in $ / tons
GENSET - 37.8MW PV GENSET - 0MW PV
20
© C
op
yrig
ht
20
14
, Fi
rst
Sola
r, I
nc.
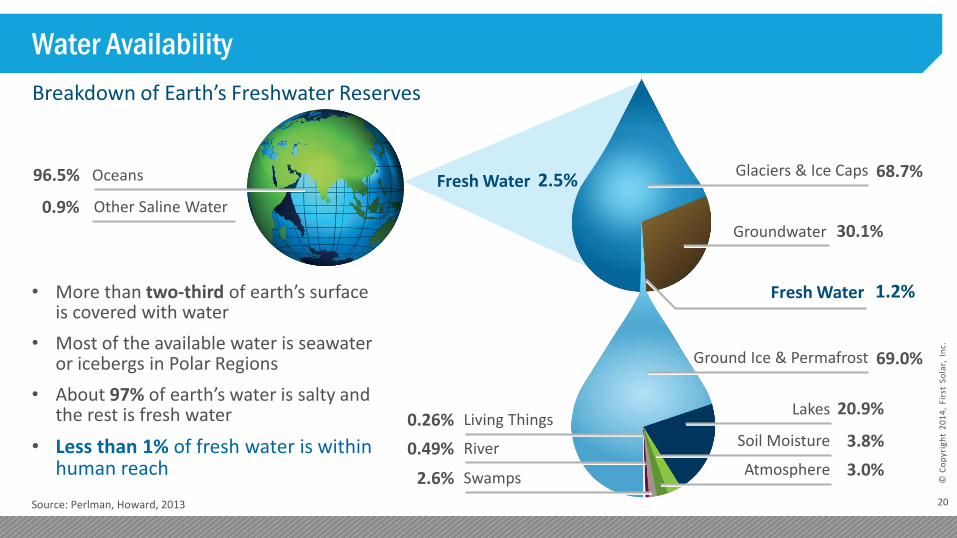
Oceans 96.5%
Other Saline Water 0.9%
Fresh Water 2.5%
Water Availability
• More than two-third of earth’s surface is covered with water
• Most of the available water is seawater or icebergs in Polar Regions
• About 97% of earth’s water is salty and the rest is fresh water
• Less than 1% of fresh water is within human reach
Source: Perlman, Howard, 2013
Breakdown of Earth’s Freshwater Reserves
Fresh Water 1.2%
68.7% Glaciers & Ice Caps
30.1% Groundwater
69.0% Ground Ice & Permafrost
20.9% Lakes
3.8% Soil Moisture
3.0% Atmosphere Swamps 2.6%
River 0.49%
Living Things 0.26%

21
© C
op
yrig
ht
20
14
, Fi
rst
Sola
r, I
nc.
Return Flow Ratio Global Horizontal Irradiation
Regions of Water Stress are the Ones Rich in Solar Irradiance
Source: Gassert, Francis, et. al. (January 2013). Aqueduct Metadata Document
Sustainable seawater desalination relying on solar energy is the right approach

22
© C
op
yrig
ht
20
14
, Fi
rst
Sola
r, I
nc.
INTRODUCTION & BACKGROUND
MARKET OVERVIEW
DESALINATION PROCESSES & TECHNOLOGIES
PRESENTING PV-RO WHITE PAPER
KEY TAKEAWAYS
MARKET OVERVIEW
23
© C
op
yrig
ht
20
14
, Fi
rst
Sola
r, I
nc.
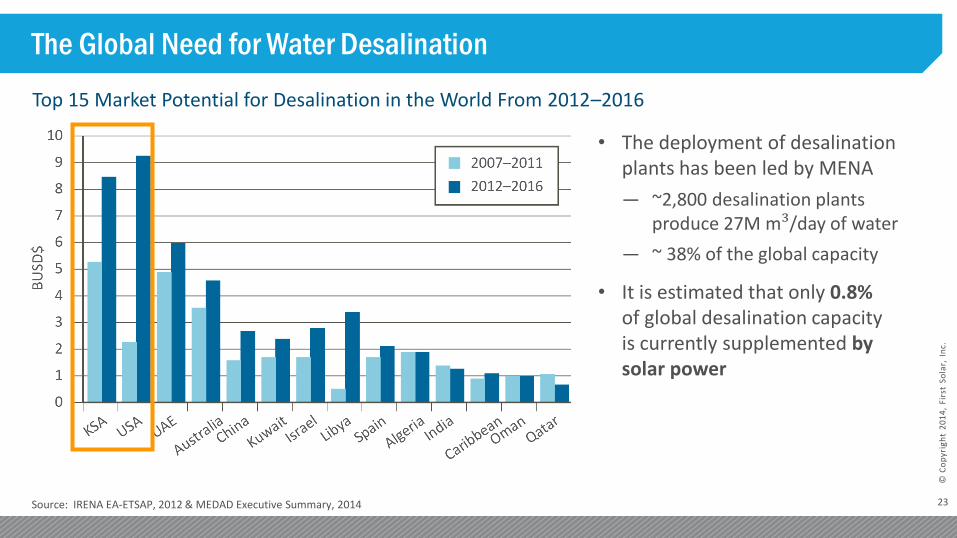
The Global Need for Water Desalination
• The deployment of desalination plants has been led by MENA
— ~2,800 desalination plants produce 27M m³/day of water
— ~ 38% of the global capacity
• It is estimated that only 0.8% of global desalination capacity is currently supplemented by solar power
Source: IRENA EA-ETSAP, 2012 & MEDAD Executive Summary, 2014
Top 15 Market Potential for Desalination in the World From 2012–2016
24
© C
op
yrig
ht
20
14
, Fi
rst
Sola
r, I
nc.
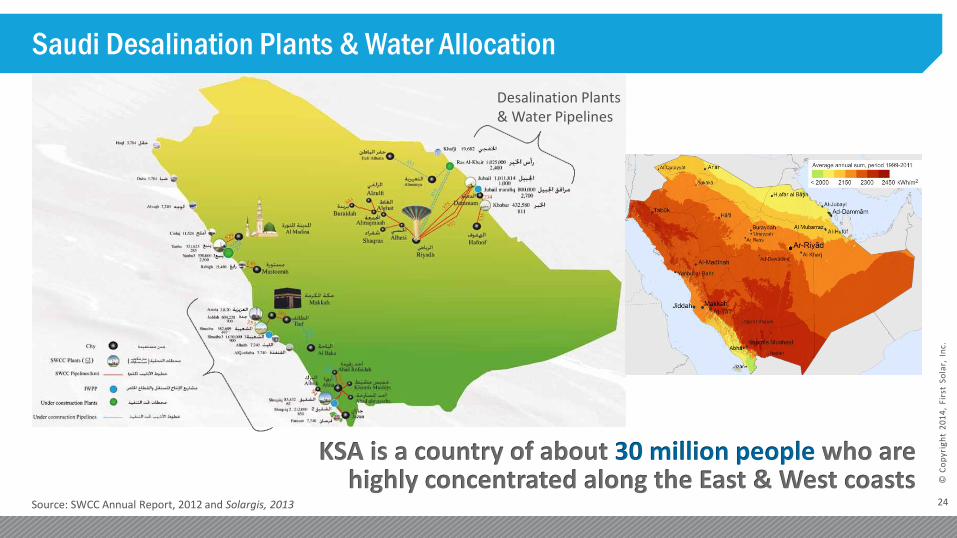
Saudi Desalination Plants & Water Allocation
KSA is a country of about 30 million people who are highly concentrated along the East & West coasts
Source: SWCC Annual Report, 2012 and Solargis, 2013
Desalination Plants & Water Pipelines
25
© C
op
yrig
ht
20
14
, Fi
rst
Sola
r, I
nc.
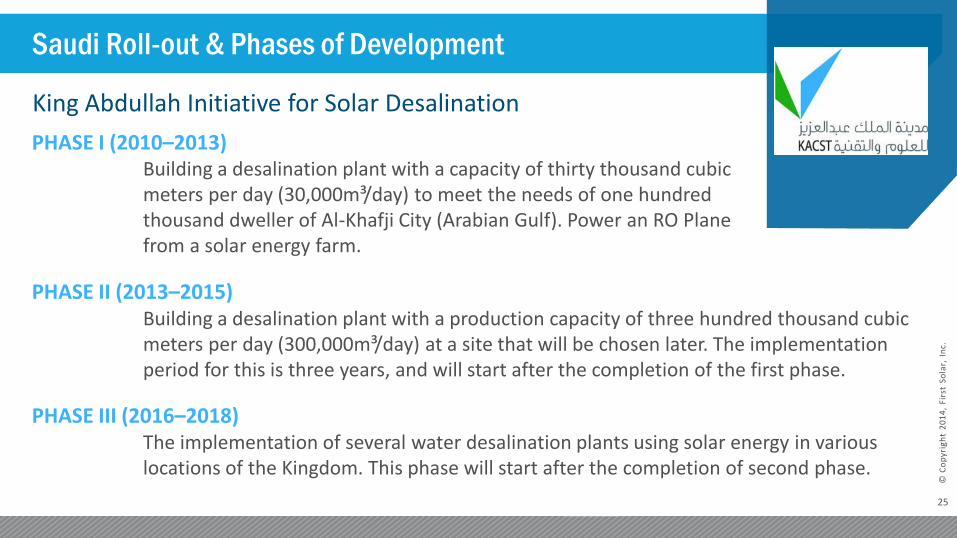
Saudi Roll-out & Phases of Development
King Abdullah Initiative for Solar Desalination
Building a desalination plant with a production capacity of three hundred thousand cubic meters per day (300,000m³/day) at a site that will be chosen later. The implementation period for this is three years, and will start after the completion of the first phase.
PHASE II (2013–2015)
Building a desalination plant with a capacity of thirty thousand cubic meters per day (30,000m³/day) to meet the needs of one hundred thousand dweller of Al-Khafji City (Arabian Gulf). Power an RO Plane from a solar energy farm.
PHASE I (2010–2013)
The implementation of several water desalination plants using solar energy in various locations of the Kingdom. This phase will start after the completion of second phase.
PHASE III (2016–2018)

26
© C
op
yrig
ht
20
14
, Fi
rst
Sola
r, I
nc.
Water Consumption Relative to Different Power Generation Technologies
Solar is How We Get it Done Each Drop Represents 100 Liters of Water
CSP WET Cooling
NUCLEAR COAL CSP DRY Cooling
PV FIRST SOLAR PV
Water Volume used by Different Generation Technologies to Produce 1Mwh of Power

27
© C
op
yrig
ht
20
14
, Fi
rst
Sola
r, I
nc.
INTRODUCTION & BACKGROUND
MARKET OVERVIEW
DESALINATION PROCESSES & TECHNOLOGIES
PRESENTING PV-RO WHITE PAPER
KEY TAKEAWAYS
DESALINATION PROCESSES & TECHNOLOGIES
28
© C
op
yrig
ht
20
14
, Fi
rst
Sola
r, I
nc.
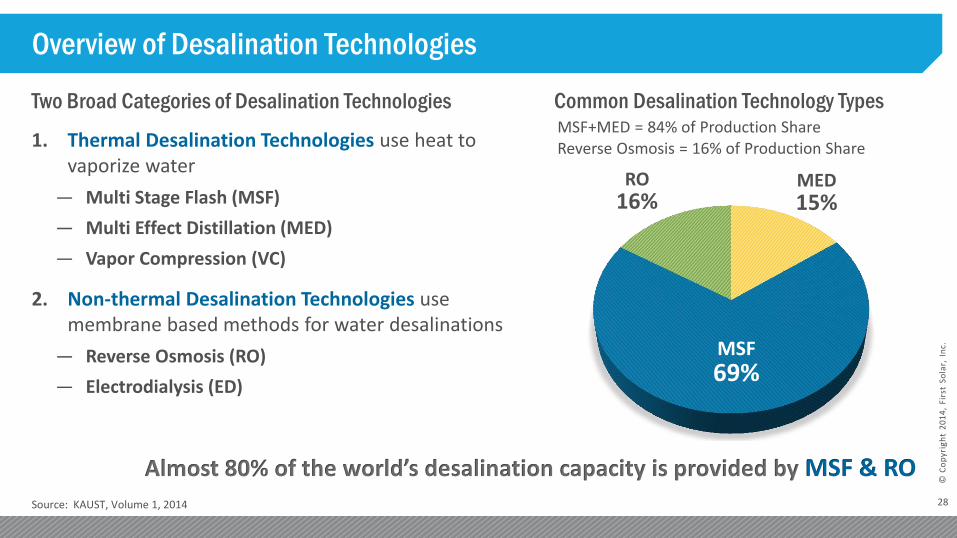
MED 15%
RO 16%
MSF 69%
Common Desalination Technology Types Two Broad Categories of Desalination Technologies
1. Thermal Desalination Technologies use heat to vaporize water
— Multi Stage Flash (MSF)
— Multi Effect Distillation (MED)
— Vapor Compression (VC)
2. Non-thermal Desalination Technologies use membrane based methods for water desalinations
— Reverse Osmosis (RO)
— Electrodialysis (ED)
Almost 80% of the world’s desalination capacity is provided by MSF & RO
Overview of Desalination Technologies
Source: KAUST, Volume 1, 2014
MSF+MED = 84% of Production Share
Reverse Osmosis = 16% of Production Share

29
© C
op
yrig
ht
20
14
, Fi
rst
Sola
r, I
nc.
Solar Desalination Processes
Source: Technology Brief, IRENA 2012
Relative Power Requirements for Various Solar Desalination Processes
MSF MED MCV RO ED
CSP thermal
PV electric
30
© C
op
yrig
ht
20
14
, Fi
rst
Sola
r, I
nc.
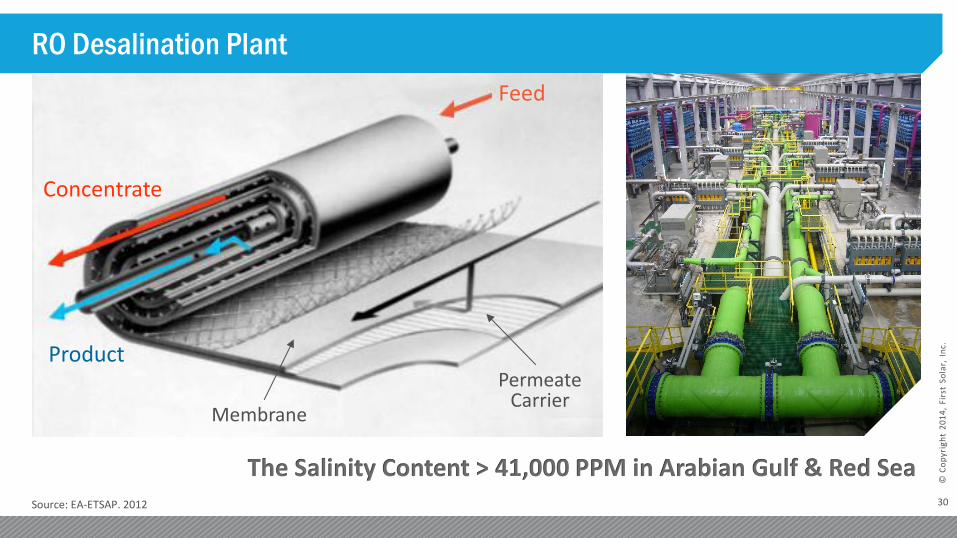
RO Desalination Plant
The Salinity Content > 41,000 PPM in Arabian Gulf & Red Sea Source: EA-ETSAP. 2012
Concentrate
Product
Feed
Permeate Carrier
Membrane

31
© C
op
yrig
ht
20
14
, Fi
rst
Sola
r, I
nc.
INTRODUCTION & BACKGROUND
MARKET OVERVIEW
DESALINATION PROCESSES & TECHNOLOGIES
PRESENTING PV-RO WHITE PAPER
KEY TAKEAWAYS
PRESENTING PV-RO CASE STUDY
32
© C
op
yrig
ht
20
14
, Fi
rst
Sola
r, I
nc.
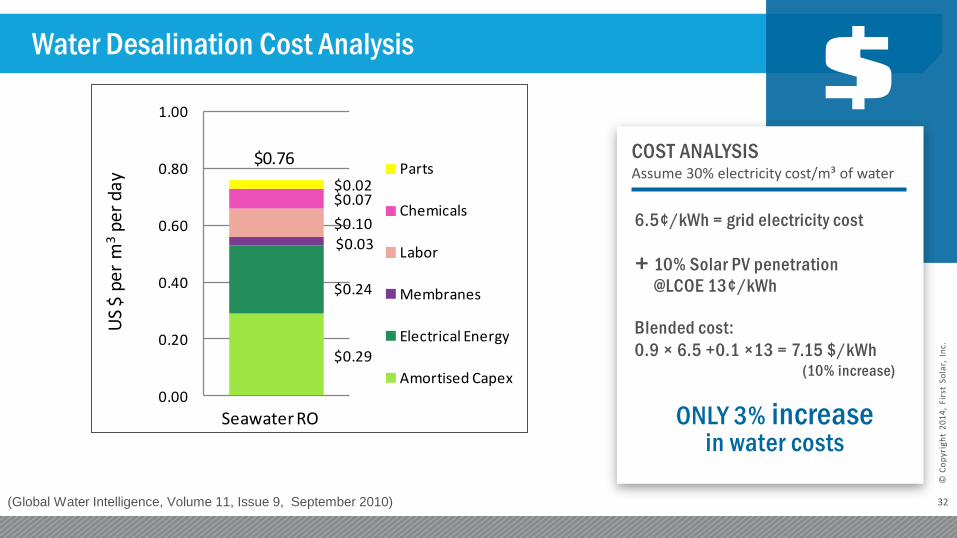
Water Desalination Cost Analysis
6.5¢/kWh = grid electricity cost
+ 10% Solar PV penetration
@LCOE 13¢/kWh
Blended cost:
0.9 × 6.5 +0.1 ×13 = 7.15 $/kWh
(10% increase)
ONLY 3% increase in water costs
COST ANALYSIS Assume 30% electricity cost/m³ of water
$0.29
$0.24
$0.03
$0.10
$0.07$0.02
0.00
0.20
0.40
0.60
0.80
1.00
Parts
Chemicals
Labor
Membranes
Electrical Energy
Amortised Capex
US
$ pe
r m
3pe
r da
y
Seawater RO
$0.76
(Global Water Intelligence, Volume 11, Issue 9, September 2010)
33
© C
op
yrig
ht
20
14
, Fi
rst
Sola
r, I
nc.
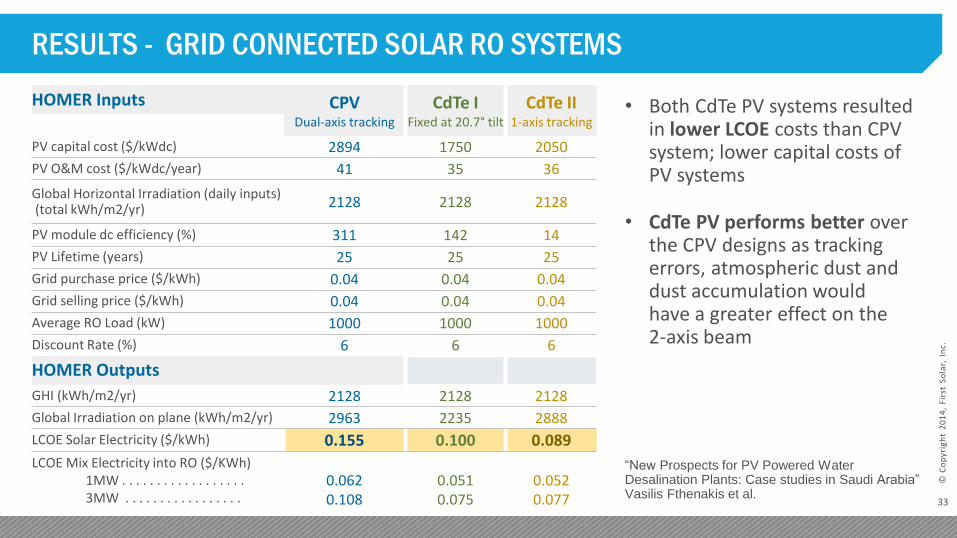
• Both CdTe PV systems resulted in lower LCOE costs than CPV system; lower capital costs of PV systems
• CdTe PV performs better over the CPV designs as tracking errors, atmospheric dust and dust accumulation would have a greater effect on the 2-axis beam
“New Prospects for PV Powered Water Desalination Plants: Case studies in Saudi Arabia” Vasilis Fthenakis et al.
HOMER Inputs CPV Dual-axis tracking
CdTe I Fixed at 20.7° tilt
CdTe II 1-axis tracking
PV capital cost ($/kWdc) 2894 1750 2050
PV O&M cost ($/kWdc/year) 41 35 36
Global Horizontal Irradiation (daily inputs) (total kWh/m2/yr) 2128 2128 2128
PV module dc efficiency (%) 311 142 14
PV Lifetime (years) 25 25 25
Grid purchase price ($/kWh) 0.04 0.04 0.04
Grid selling price ($/kWh) 0.04 0.04 0.04
Average RO Load (kW) 1000 1000 1000
Discount Rate (%) 6 6 6
HOMER Outputs
GHI (kWh/m2/yr) 2128 2128 2128
Global Irradiation on plane (kWh/m2/yr) 2963 2235 2888
LCOE Solar Electricity ($/kWh) 0.155 0.100 0.089
LCOE Mix Electricity into RO ($/KWh) 1MW . . . . . . . . . . . . . . . . . . 3MW . . . . . . . . . . . . . . . . .
0.062 0.108
0.051 0.075
0.052 0.077
RESULTS - GRID CONNECTED SOLAR RO SYSTEMS

34
© C
op
yrig
ht
20
14
, Fi
rst
Sola
r, I
nc.
1.25
1.21 1.22
1.42
1.3 1.31
$1.10
$1.15
$1.20
$1.25
$1.30
$1.35
$1.40
$1.45
CPV 1MW CdTe Lat-Tilt 1MW CdTe Axis Tracking 1MW
Wat
er P
rod
uct
ion
Co
st in
$/m
³
Total Water Production Costs for 6,550 m³/day RO Desalination
PV Electricity Costs ($/m3) is Lower for PV CdTe Modules than CPV
CPV 1MW CdTe Lat-Tilt 1MW
CdTe Lat-Tilt 3MW
CdTe 1-Axis
Tracking 1MW
CdTe 1-Axis
Tracking 3MW
CPV 3MW
CdTe PV has Lower LCOE
35
© C
op
yrig
ht
20
14
, Fi
rst
Sola
r, I
nc.
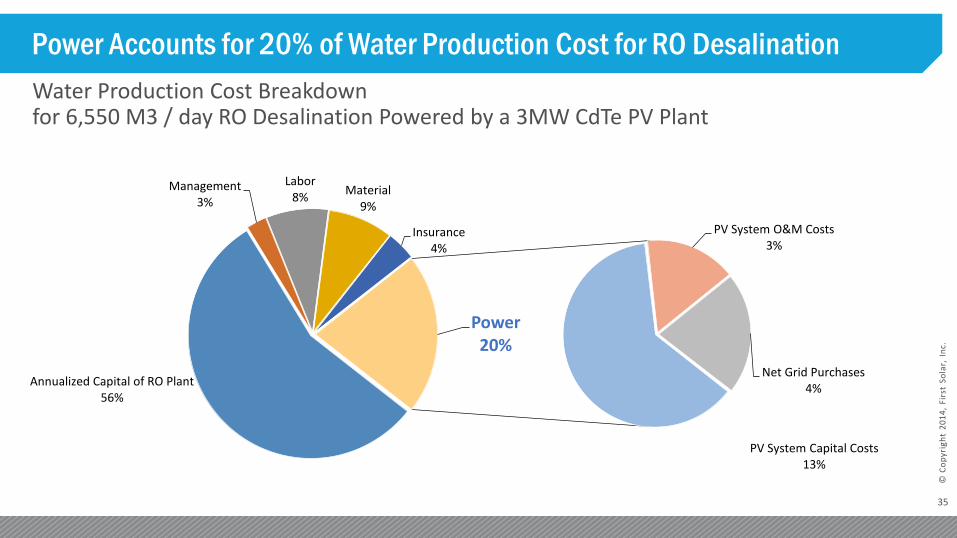
Power Accounts for 20% of Water Production Cost for RO Desalination
Water Production Cost Breakdown for 6,550 M3 / day RO Desalination Powered by a 3MW CdTe PV Plant
Annualized Capital of RO Plant 56%
Management 3%
Labor 8%
Material 9%
Insurance 4%
PV System Capital Costs 13%
PV System O&M Costs 3%
Net Grid Purchases 4%
Power 20%

36
© C
op
yrig
ht
20
14
, Fi
rst
Sola
r, I
nc.
Water Production Cost for Standalone RO/PV Scenarios
Fthenakis et al., “TECHNO-ECONOMIC EVALUATION OF STAND-ALONE, PV-POWERED, SEAWATER DESALINATION PLANTS IN SAUDI ARABIA”
RO produces 6,550 m3 of freshwater per day at 213 ppm TDS from seawater at 40,000 ppm TDS
37
© C
op
yrig
ht
20
14
, Fi
rst
Sola
r, I
nc.
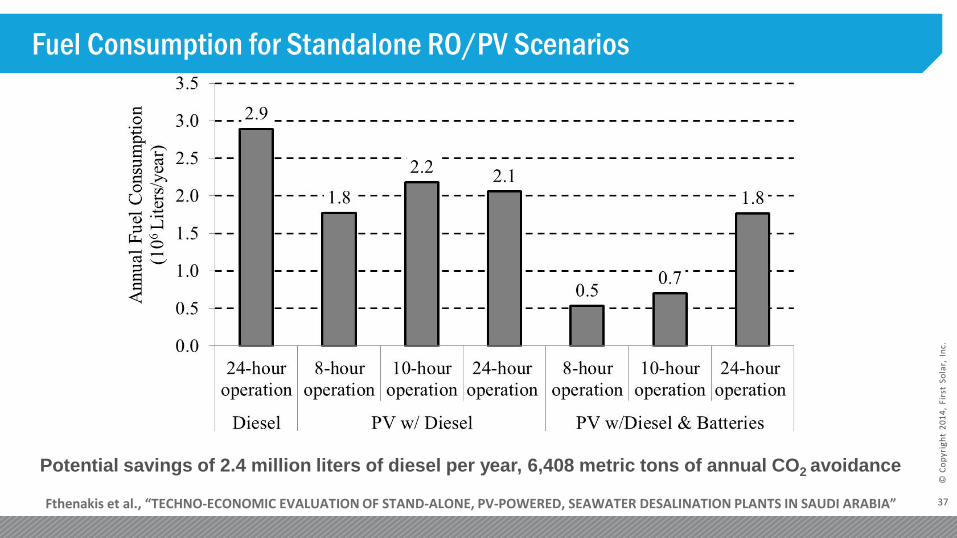
Fuel Consumption for Standalone RO/PV Scenarios
Fthenakis et al., “TECHNO-ECONOMIC EVALUATION OF STAND-ALONE, PV-POWERED, SEAWATER DESALINATION PLANTS IN SAUDI ARABIA”
Potential savings of 2.4 million liters of diesel per year, 6,408 metric tons of annual CO2 avoidance
© Copyright 2013, First Solar, Inc.
39
© C
op
yrig
ht
20
14
, Fi
rst
Sola
r, I
nc.
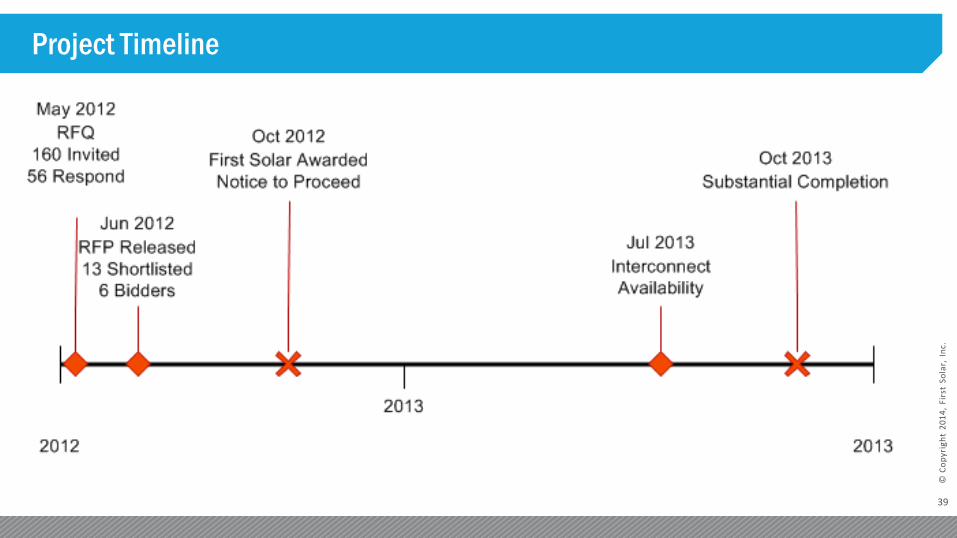
Project Timeline

40
© C
op
yrig
ht
20
14
, Fi
rst
Sola
r, I
nc.
Key Technical Challenges
HEAT + HUMIDITY SITE RISK SOILING LOCAL CODE
𝑇𝑐𝑒𝑙𝑙 = 𝑇𝑎𝑖𝑟 +
𝑁𝑂𝐶𝑇 − 20
80𝑆
• Health & Safety • @50C, Cell is 81C • Avg Humidity 50% • Ramadan work hours
• Piles rejected • Highly Corrosive • Thermal Resistivity • UXO
• Sandstorms • Up to 30% monthly
losses • Enclosure Ratings
• No precedent for PV • Extended review times • Early projects set
benchmark • Green Building

41
© C
op
yrig
ht
20
14
, Fi
rst
Sola
r, I
nc.
Challenge #2: Site Risk: Desert Pavement (CALCISILTITE Rock)
Cable Trenching done with Rock Hammer
Concrete Foundations: • 500mm diameter hole • Sand bed • Precast Concrete Ballast
• Corrosion paint • Epoxy-coated rebar
• Slurry
42
© C
op
yrig
ht
20
14
, Fi
rst
Sola
r, I
nc.
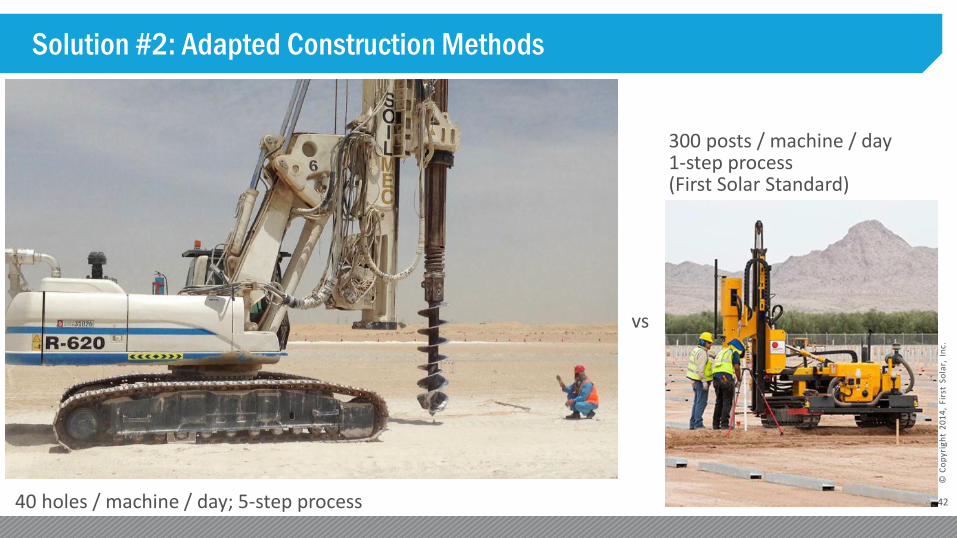
Solution #2: Adapted Construction Methods
40 holes / machine / day; 5-step process
300 posts / machine / day 1-step process (First Solar Standard)
vs
43
© C
op
yrig
ht
20
14
, Fi
rst
Sola
r, I
nc.
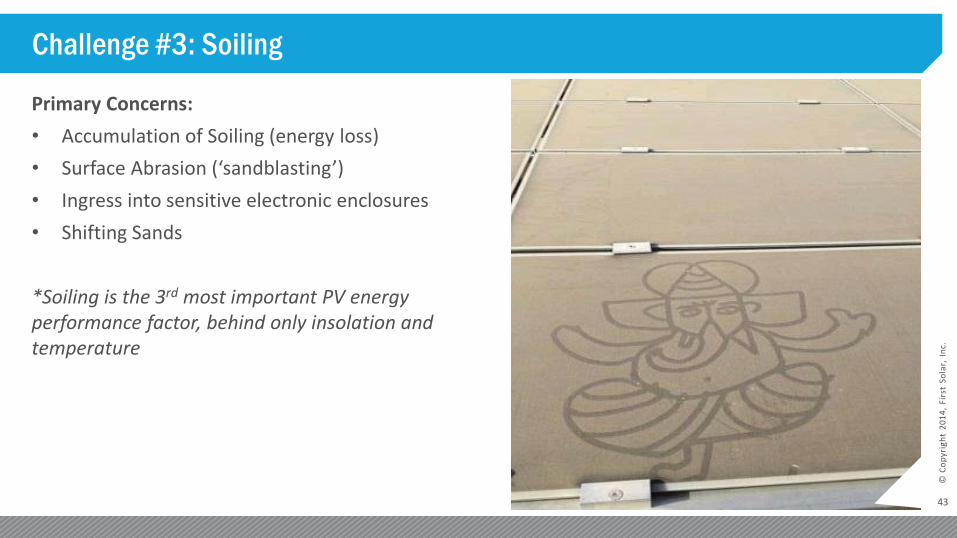
Challenge #3: Soiling
Primary Concerns:
• Accumulation of Soiling (energy loss)
• Surface Abrasion (‘sandblasting’)
• Ingress into sensitive electronic enclosures
• Shifting Sands
*Soiling is the 3rd most important PV energy performance factor, behind only insolation and temperature
44
© C
op
yrig
ht
20
14
, Fi
rst
Sola
r, I
nc.
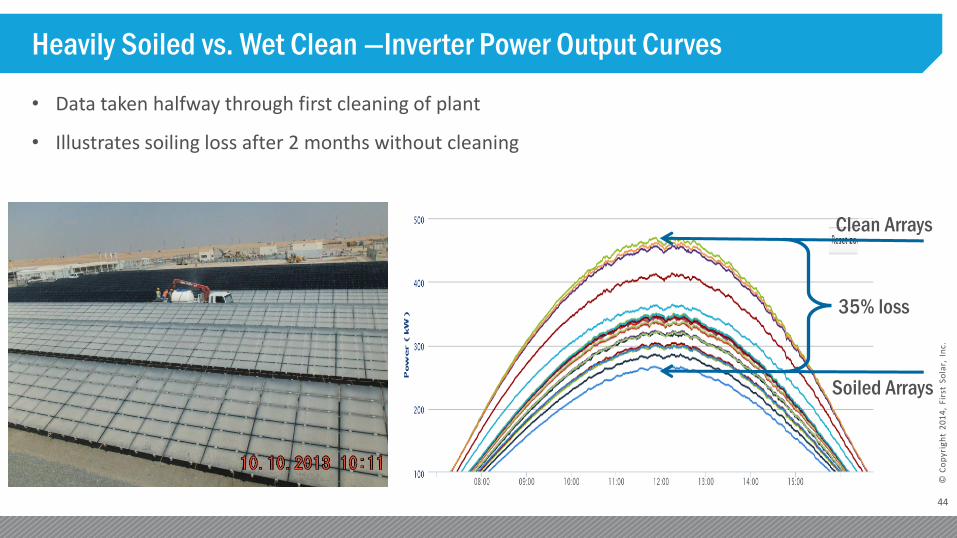
Heavily Soiled vs. Wet Clean —Inverter Power Output Curves
• Data taken halfway through first cleaning of plant
• Illustrates soiling loss after 2 months without cleaning
Clean Arrays
Soiled Arrays
35% loss
45
© C
op
yrig
ht
20
14
, Fi
rst
Sola
r, I
nc.
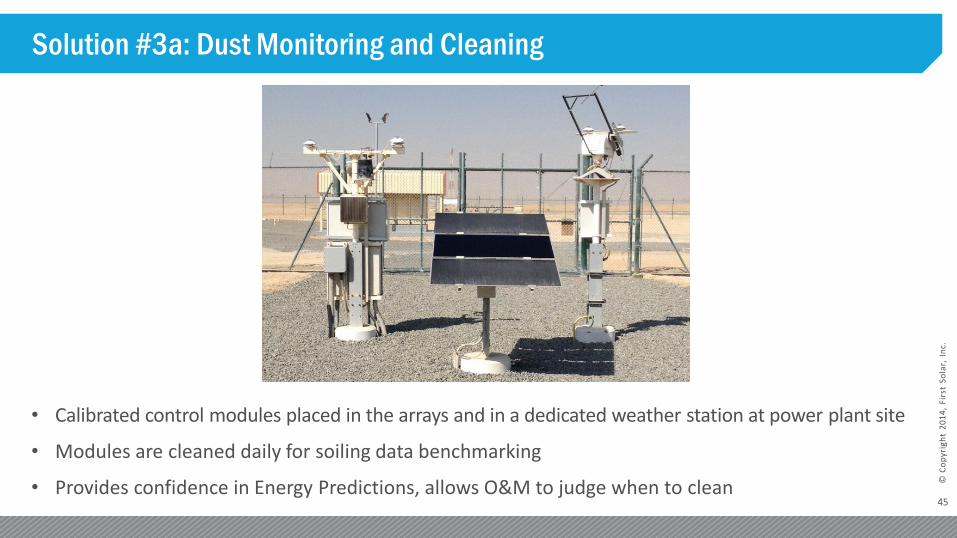
Solution #3a: Dust Monitoring and Cleaning
• Calibrated control modules placed in the arrays and in a dedicated weather station at power plant site
• Modules are cleaned daily for soiling data benchmarking
• Provides confidence in Energy Predictions, allows O&M to judge when to clean
46
© C
op
yrig
ht
20
14
, Fi
rst
Sola
r, I
nc.
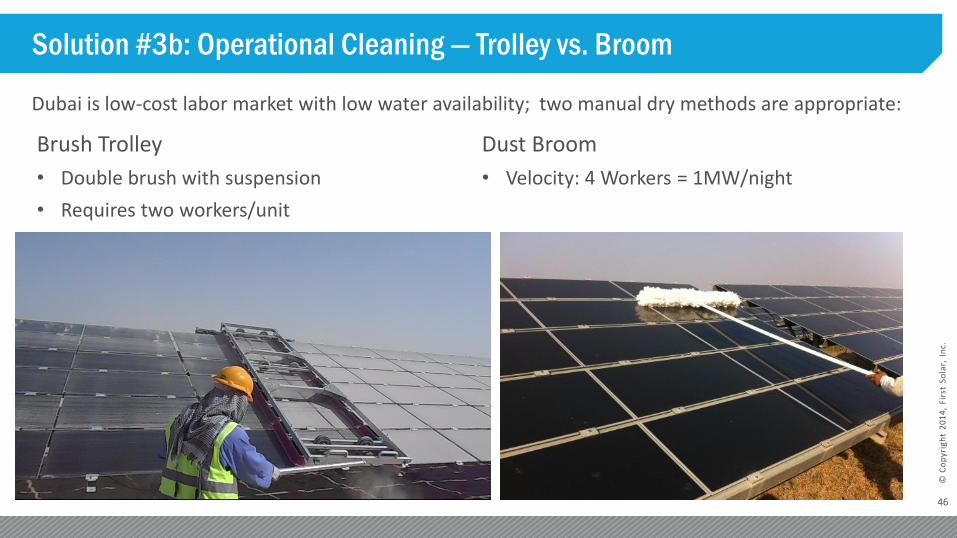
Solution #3b: Operational Cleaning — Trolley vs. Broom
Dubai is low-cost labor market with low water availability; two manual dry methods are appropriate:
Brush Trolley
• Double brush with suspension
• Requires two workers/unit
Dust Broom
• Velocity: 4 Workers = 1MW/night
47
© C
op
yrig
ht
20
14
, Fi
rst
Sola
r, I
nc.
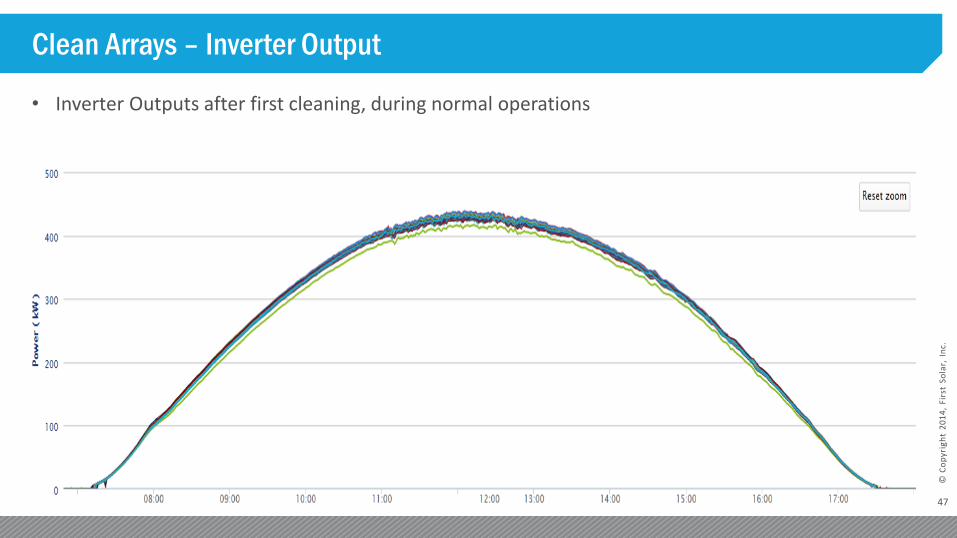
Clean Arrays – Inverter Output
• Inverter Outputs after first cleaning, during normal operations
48
© C
op
yrig
ht
20
14
, Fi
rst
Sola
r, I
nc.
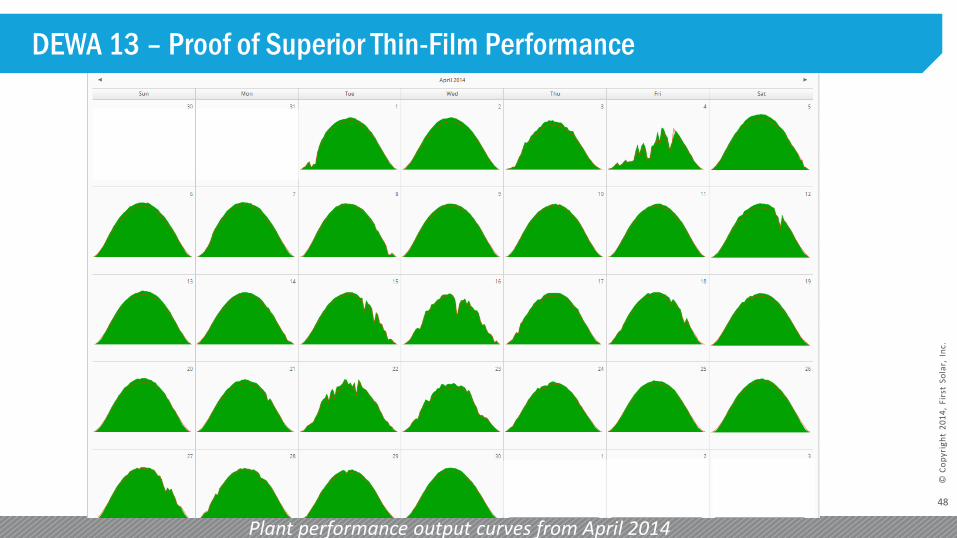
DEWA 13 – Proof of Superior Thin-Film Performance
Plant performance output curves from April 2014
49
© C
op
yrig
ht
20
14
, Fi
rst
Sola
r, I
nc.
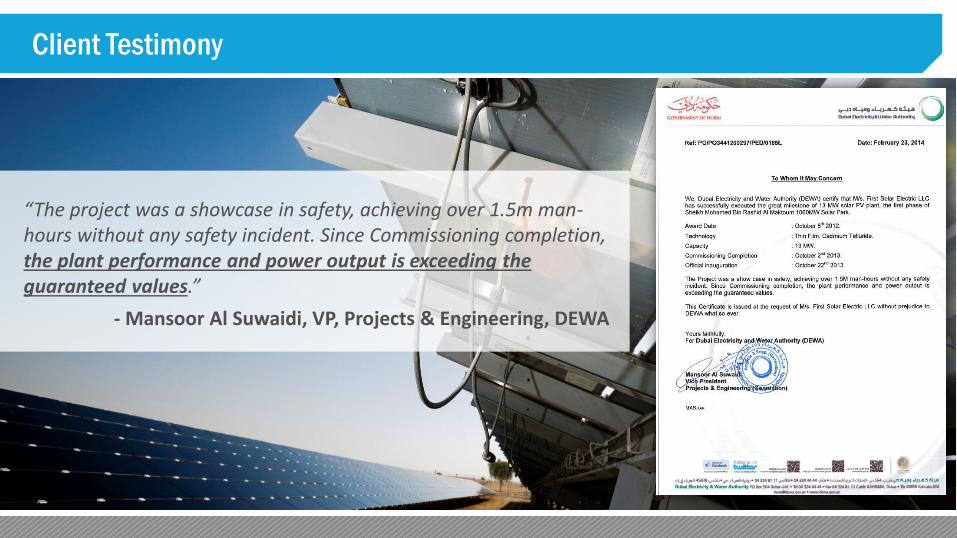
Client Testimony
“The project was a showcase in safety, achieving over 1.5m man-hours without any safety incident. Since Commissioning completion, the plant performance and power output is exceeding the guaranteed values.”
- Mansoor Al Suwaidi, VP, Projects & Engineering, DEWA

50
© C
op
yrig
ht
20
14
, Fi
rst
Sola
r, I
nc.
On Time, Incident-Free
Phase I, Mohammed bin Rashid Al Maktoum Solar Park, Dubai (13MW)
30 Weeks from ground-breaking to grid-connection
1,280 Number of personnel onsite at the peak of construction activity
1,500,000 Incident-free man hours to complete the plant

51
© C
op
yrig
ht
20
14
, Fi
rst
Sola
r, I
nc.
Challenge #4: Codes and Specifications
≠
52
© C
op
yrig
ht
20
14
, Fi
rst
Sola
r, I
nc.
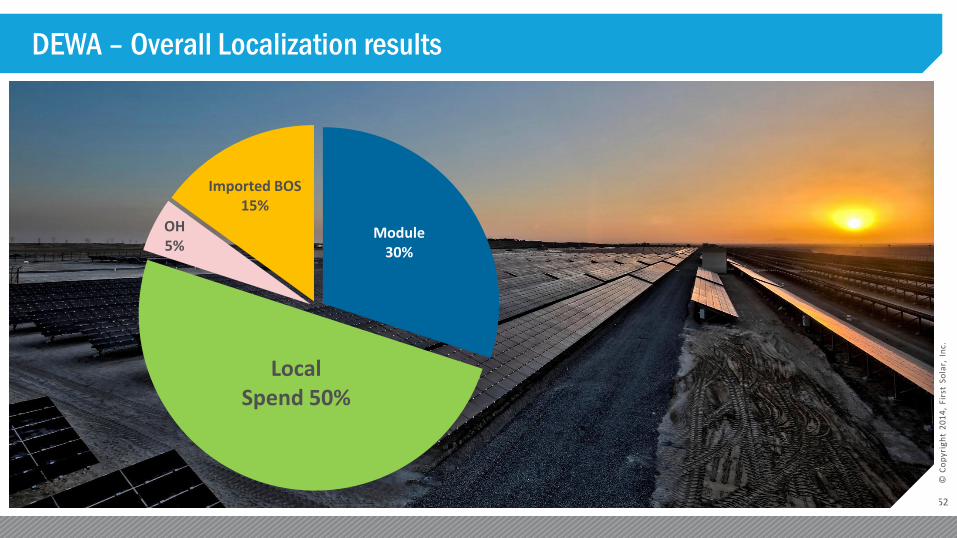
DEWA – Overall Localization results
Module 30%
Local Spend 50%
OH 5%
Imported BOS 15%
53
© C
op
yrig
ht
20
14
, Fi
rst
Sola
r, I
nc.
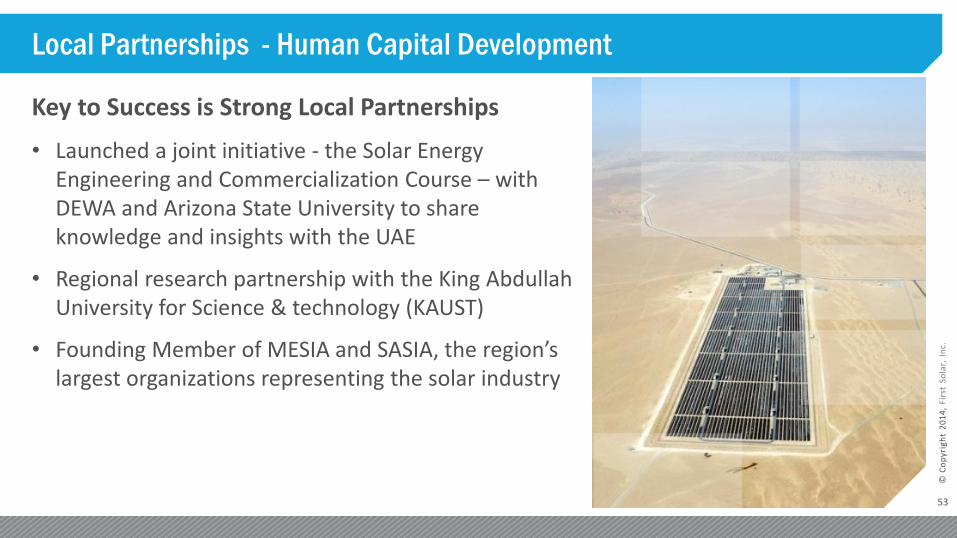
Local Partnerships - Human Capital Development
Key to Success is Strong Local Partnerships
• Launched a joint initiative - the Solar Energy Engineering and Commercialization Course – with DEWA and Arizona State University to share knowledge and insights with the UAE
• Regional research partnership with the King Abdullah University for Science & technology (KAUST)
• Founding Member of MESIA and SASIA, the region’s largest organizations representing the solar industry
54
© C
op
yrig
ht
20
14
, Fi
rst
Sola
r, I
nc.
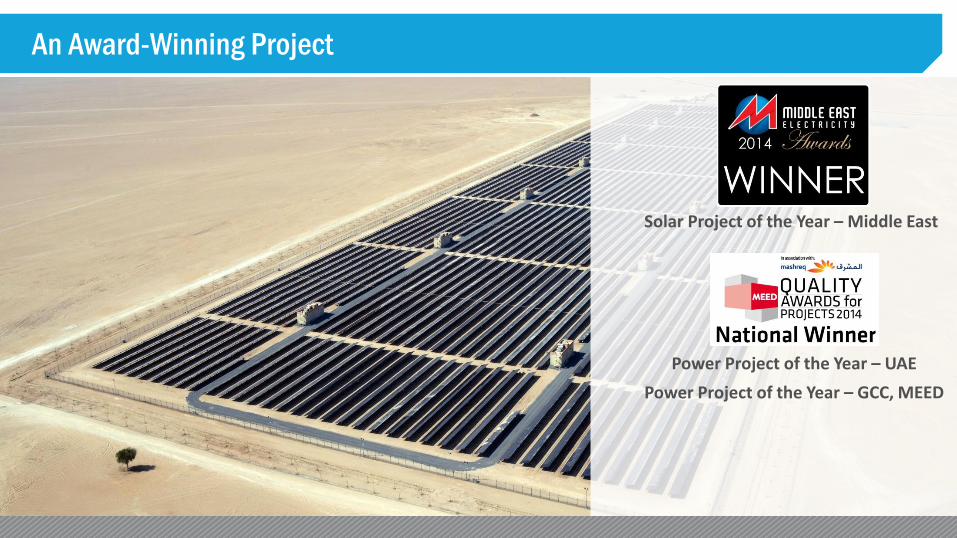
An Award-Winning Project
Solar Project of the Year – Middle East
Power Project of the Year – UAE
Power Project of the Year – GCC, MEED
55
© C
op
yrig
ht
20
14
, Fi
rst
Sola
r, I
nc.
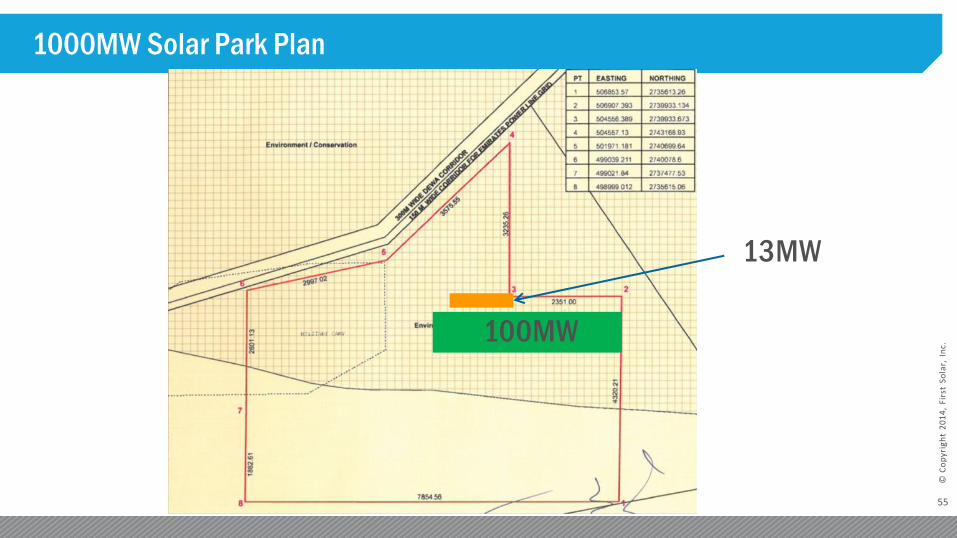
1000MW Solar Park Plan
13MW
100MW

Advantages of First Solar Modules In Rooftop Applications
57
© C
op
yrig
ht
20
14
, Fi
rst
Sola
r, I
nc.
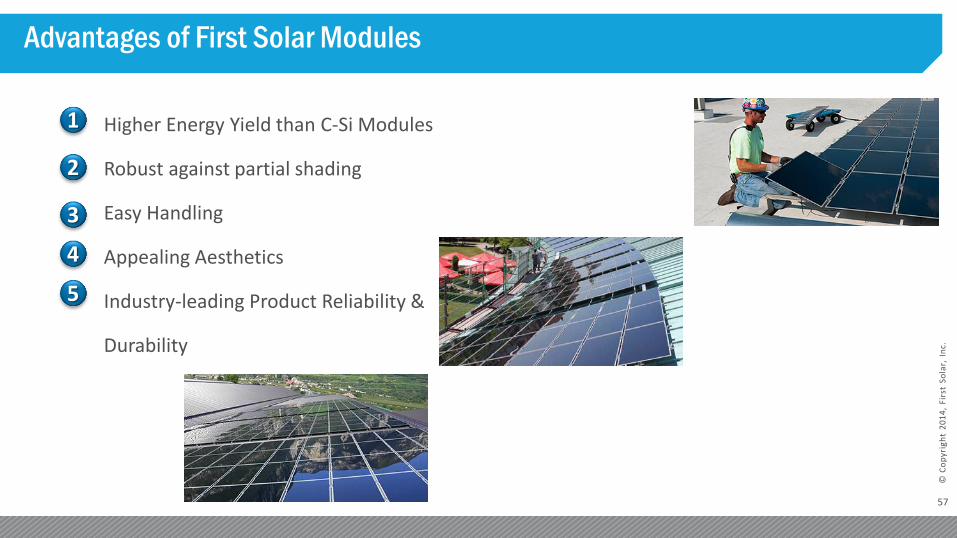
Advantages of First Solar Modules
Higher Energy Yield than C-Si Modules
Robust against partial shading
Easy Handling
Appealing Aesthetics
Industry-leading Product Reliability &
Durability
1
2
3
4
5

58
© C
op
yrig
ht
20
14
, Fi
rst
Sola
r, I
nc.
Module Performance – Comparison to c-Si
Shaded Area
Min.
Short side of module
Robust against shading in landscape orientation (perpendicular to cells)
FSLR Power loss is ~proportional to shading: 10% shading = ~10% output power loss
Typical c-Si Power loss: 10% shading = ~30% output power loss
Minimizes early morning and late evening energy loss while allowing row spacing (array
footprint) to be minimized
59
© C
op
yrig
ht
20
14
, Fi
rst
Sola
r, I
nc.
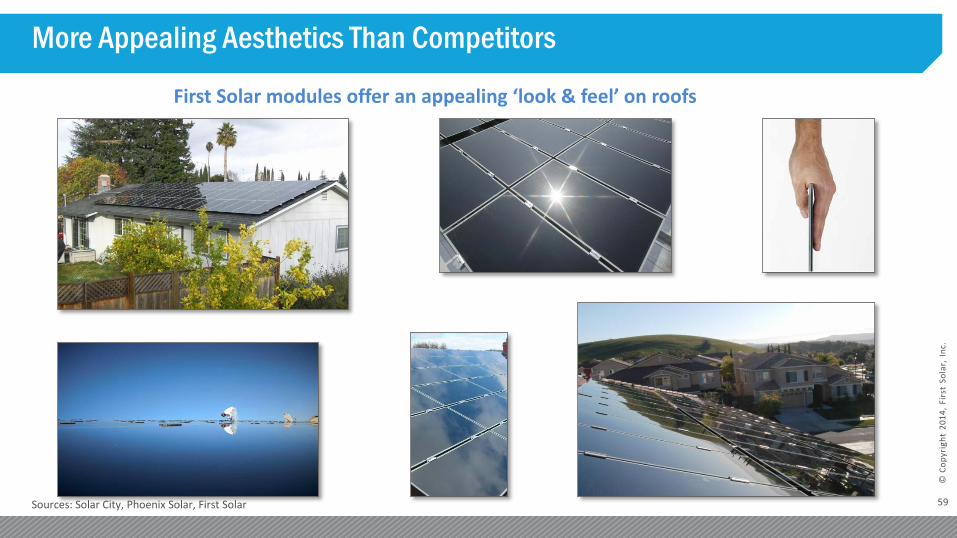
First Solar modules offer an appealing ‘look & feel’ on roofs
More Appealing Aesthetics Than Competitors
Sources: Solar City, Phoenix Solar, First Solar
60
© C
op
yrig
ht
20
14
, Fi
rst
Sola
r, I
nc.
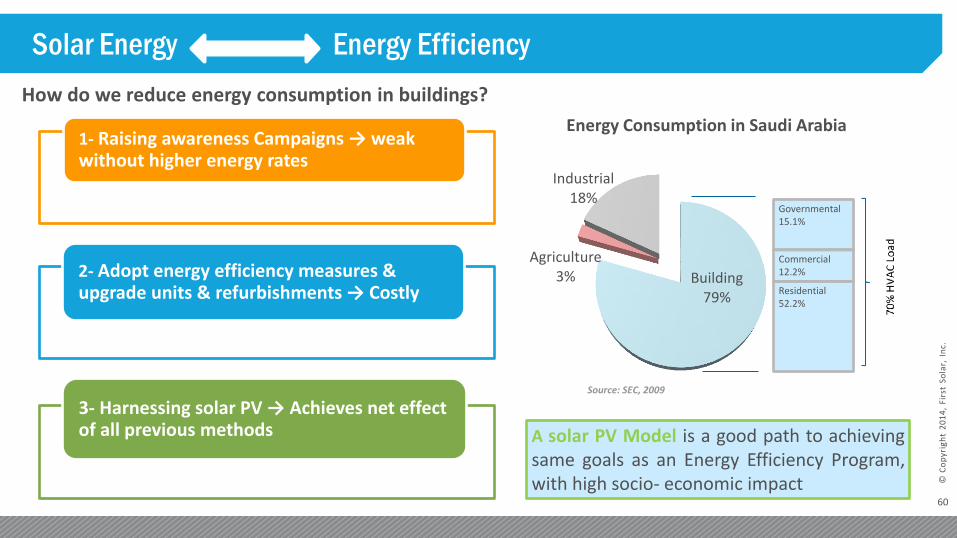
Solar Energy Energy Efficiency
1- Raising awareness Campaigns → weak without higher energy rates
2- Adopt energy efficiency measures & upgrade units & refurbishments → Costly
3- Harnessing solar PV → Achieves net effect of all previous methods
How do we reduce energy consumption in buildings?
Building 79%
Agriculture 3%
Industrial 18%
Energy Consumption in Saudi Arabia
Governmental 15.1%
Commercial 12.2%
Residential 52.2%
Source: SEC, 2009
A solar PV Model is a good path to achieving same goals as an Energy Efficiency Program, with high socio- economic impact
61
© C
op
yrig
ht
20
14
, Fi
rst
Sola
r, I
nc.
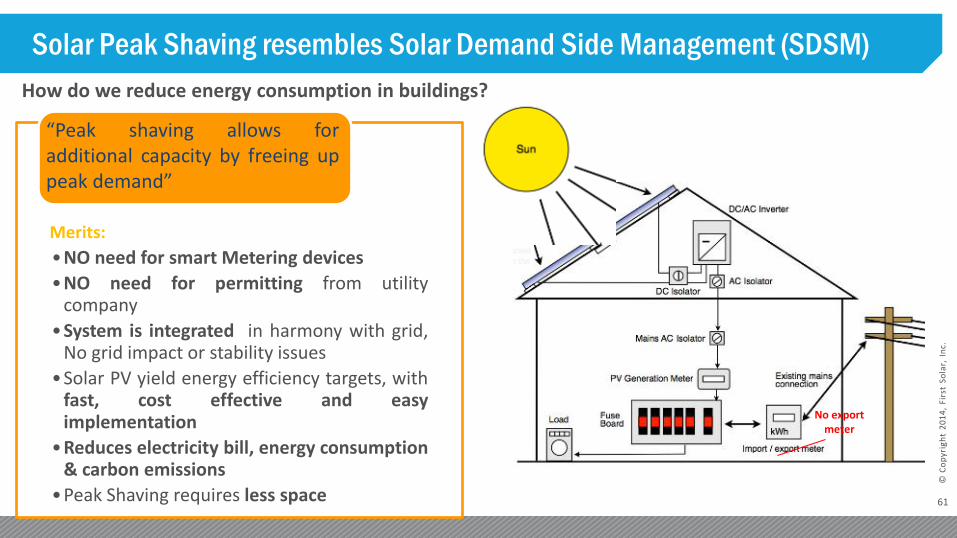
Solar Peak Shaving resembles Solar Demand Side Management (SDSM)
•NO need for smart Metering devices
•NO need for permitting from utility company
•System is integrated in harmony with grid, No grid impact or stability issues
•Solar PV yield energy efficiency targets, with fast, cost effective and easy implementation
•Reduces electricity bill, energy consumption & carbon emissions
•Peak Shaving requires less space
How do we reduce energy consumption in buildings?
Merits:
“Peak shaving allows for additional capacity by freeing up peak demand”
No export meter
62
© C
op
yrig
ht
20
14
, Fi
rst
Sola
r, I
nc.
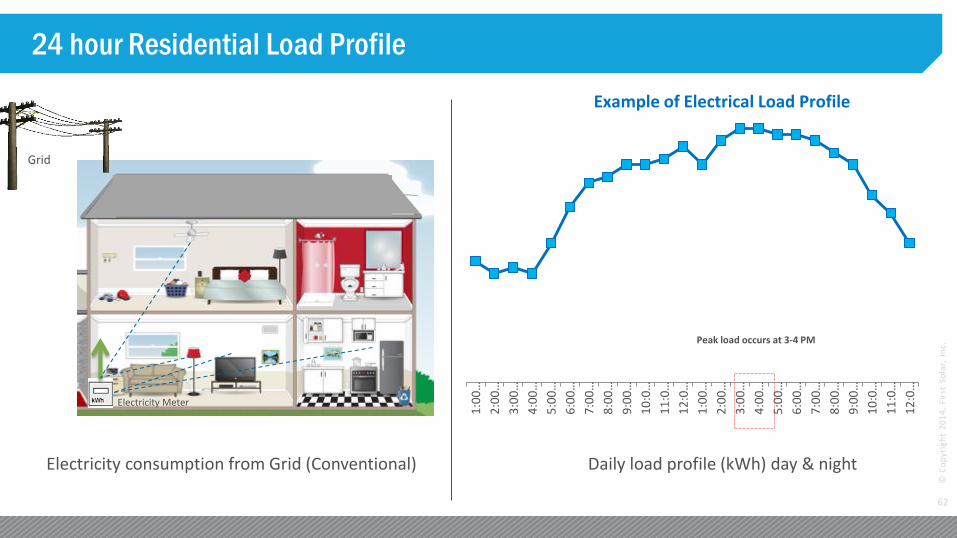
24 hour Residential Load Profile
Grid
Electricity consumption from Grid (Conventional) Daily load profile (kWh) day & night
Electricity Meter
1:0
0…
2:0
0…
3:0
0…
4:0
0…
5:0
0…
6:0
0…
7:0
0…
8:0
0…
9:0
0…
10
:0…
11
:0…
12
:0…
1:0
0…
2:0
0…
3:0
0…
4:0
0…
5:0
0…
6:0
0…
7:0
0…
8:0
0…
9:0
0…
10
:0…
11
:0…
12
:0…
Example of Electrical Load Profile
Peak load occurs at 3-4 PM
63
© C
op
yrig
ht
20
14
, Fi
rst
Sola
r, I
nc.
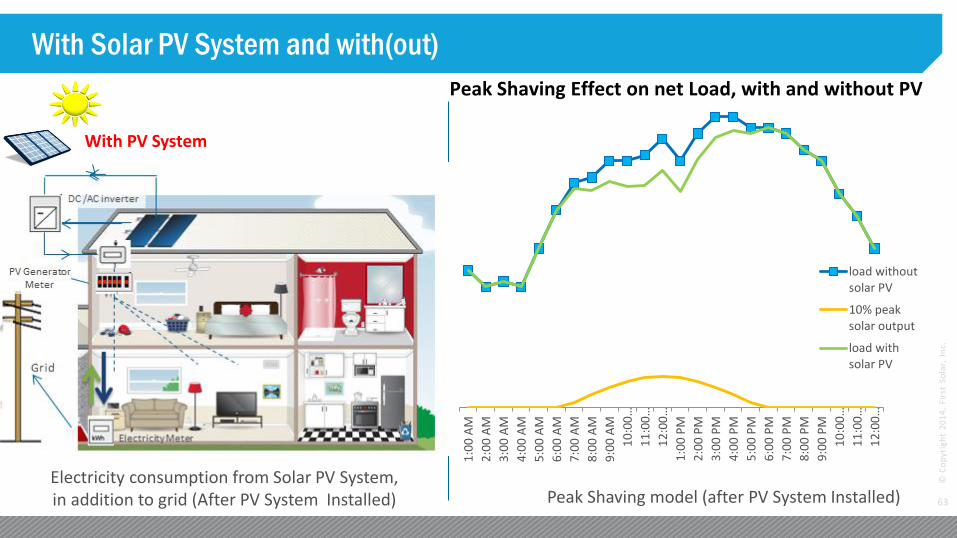
With Solar PV System and with(out)
Peak Shaving model (after PV System Installed) Electricity consumption from Solar PV System, in addition to grid (After PV System Installed)
With PV System
1:0
0 A
M
2:0
0 A
M
3:0
0 A
M
4:0
0 A
M
5:0
0 A
M
6:0
0 A
M
7:0
0 A
M
8:0
0 A
M
9:0
0 A
M
10
:00
…
11
:00
…
12
:00
…
1:0
0 P
M
2:0
0 P
M
3:0
0 P
M
4:0
0 P
M
5:0
0 P
M
6:0
0 P
M
7:0
0 P
M
8:0
0 P
M
9:0
0 P
M
10
:00
…
11
:00
…
12
:00
…
load withoutsolar PV
10% peaksolar output
load withsolar PV
Peak Shaving Effect on net Load, with and without PV

Project Profiles
65
© C
op
yrig
ht
20
14
, Fi
rst
Sola
r, I
nc.
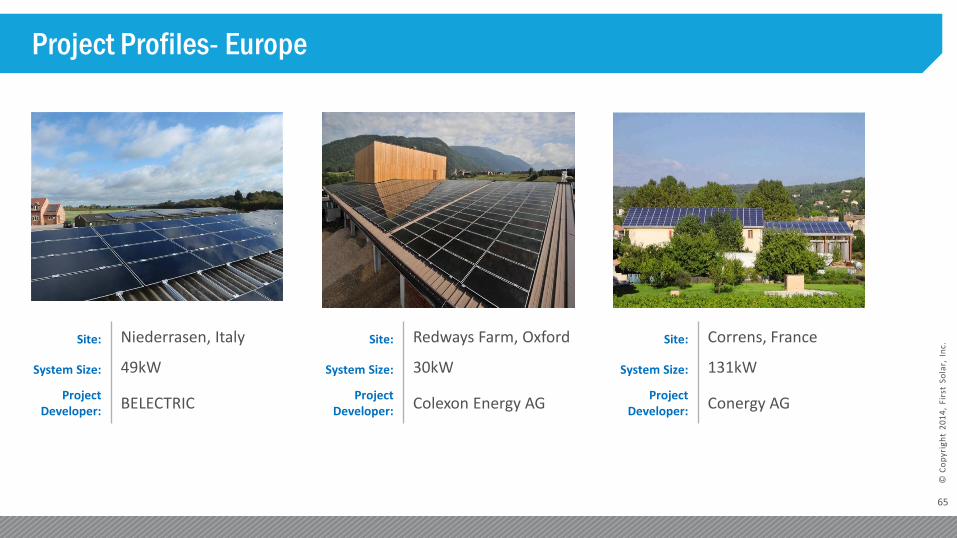
Site: Correns, France
System Size: 131kW
Project Developer:
Conergy AG
Project Profiles- Europe
Site: Niederrasen, Italy
System Size: 49kW
Project Developer:
BELECTRIC
Site: Redways Farm, Oxford
System Size: 30kW
Project Developer:
Colexon Energy AG

66
© C
op
yrig
ht
20
14
, Fi
rst
Sola
r, I
nc.
Site: Gescher, Germany
System Size: 1.4MW
Project Developer:
COLEXON Energy AG
Project Profiles- Germany
Site: Undenheim, Germany
System Size: 31kW
Project Developer:
Juwi Solar GmbH
Site:
Bodman-Ludwigshafen Germany
System Size: 211kW
Project Developer:
Phoenix Solar AG
67
© C
op
yrig
ht
20
14
, Fi
rst
Sola
r, I
nc.
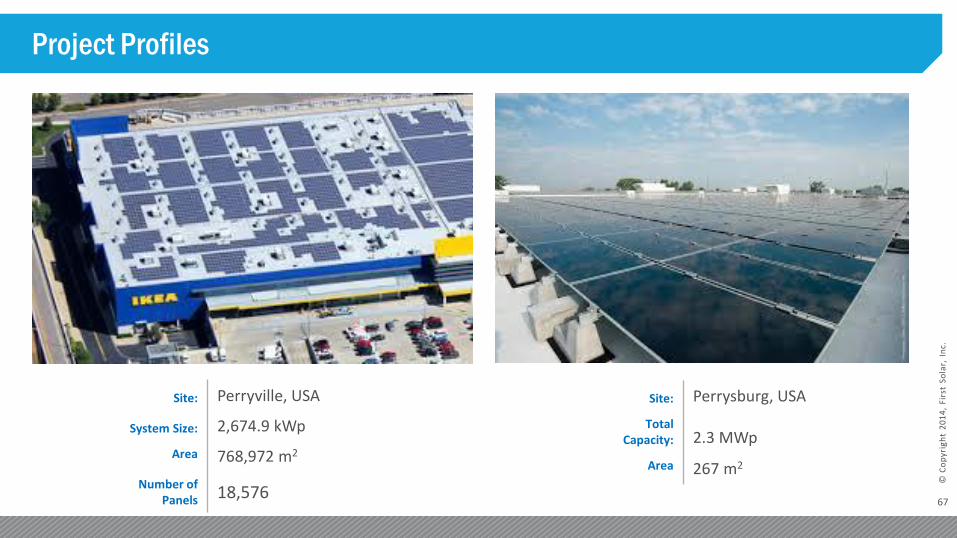
Project Profiles
Site: Perryville, USA
System Size: 2,674.9 kWp
Area 768,972 m2
Number of Panels 18,576
Site: Perrysburg, USA
Total Capacity: 2.3 MWp
Area 267 m2
68
© C
op
yrig
ht
20
14
, Fi
rst
Sola
r, I
nc.
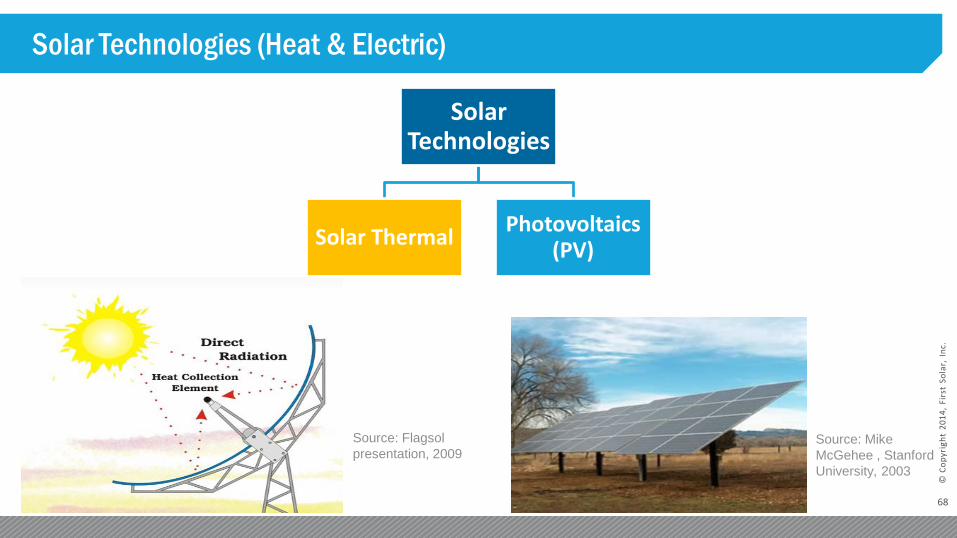
Solar Technologies (Heat & Electric)
Solar Technologies
Solar Thermal Photovoltaics
(PV)
Source: Flagsol
presentation, 2009 Source: Mike
McGehee , Stanford
University, 2003

69
© C
op
yrig
ht
20
14
, Fi
rst
Sola
r, I
nc.
Technology Companies Cost - 2012
($/W) Cost - 2015
($/W) Comments
1 Parabolic
Trough
• Abengoa NextEra Skyfuel
• With storage
$5-6*
$6-8 $3.7
• Most mature technology, first plant built in 1970s
• Highest market share • Limited cost reduction potential
2 Central Tower
• BrightSource SolarReserve eSolar • With storage
$6 - $9
$7-20 $4.8 - $7
• High efficiency potential • Several new CSP Plants being
built using the technology
3 Fresnel
Lenses
Areva Novatec Solar
$7-4.75* $2.4
• Simpler design with potential to be cheaper
• Limited Commercial traction
4 Dish Infinia N/A N/A
• No commercial plants in operation
• Very high efficiency potential • SES out of business in 2010
CSP Technologies
*Utility Scale Solar by Sun Shot , 2013
70
© C
op
yrig
ht
20
14
, Fi
rst
Sola
r, I
nc.
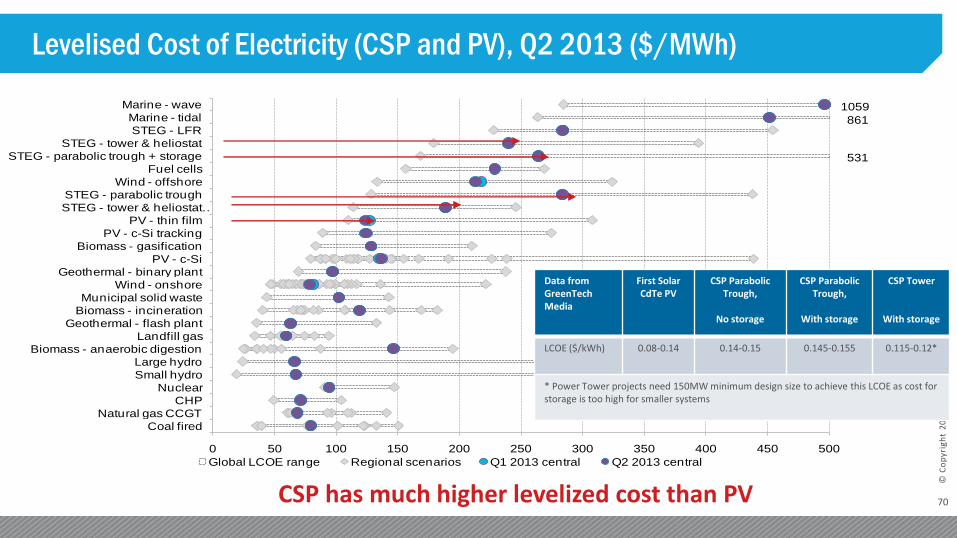
Levelised Cost of Electricity (CSP and PV), Q2 2013 ($/MWh)
• Source: Bloomberg New Energy Finance
0 50 100 150 200 250 300 350 400 450 500
Coal fired
Natural gas CCGT
CHP
Nuclear
Small hydro
Large hydro
Biomass - anaerobic digestion
Landfill gas
Geothermal - flash plant
Biomass - incineration
Municipal solid waste
Wind - onshore
Geothermal - binary plant
PV - c-Si
Biomass - gasification
PV - c-Si tracking
PV - thin film
STEG - tower & heliostat …
STEG - parabolic trough
Wind - offshore
Fuel cells
STEG - parabolic trough + storage
STEG - tower & heliostat
STEG - LFR
Marine - tidal
Marine - wave
Global LCOE range Regional scenarios Q1 2013 central Q2 2013 central
1059
861
531
CSP has much higher levelized cost than PV
Data from GreenTech Media
First Solar CdTe PV
CSP Parabolic Trough,
No storage
CSP Parabolic Trough,
With storage
CSP Tower
With storage
LCOE ($/kWh) 0.08-0.14 0.14-0.15 0.145-0.155 0.115-0.12*
* Power Tower projects need 150MW minimum design size to achieve this LCOE as cost for storage is too high for smaller systems
71
© C
op
yrig
ht
20
14
, Fi
rst
Sola
r, I
nc.
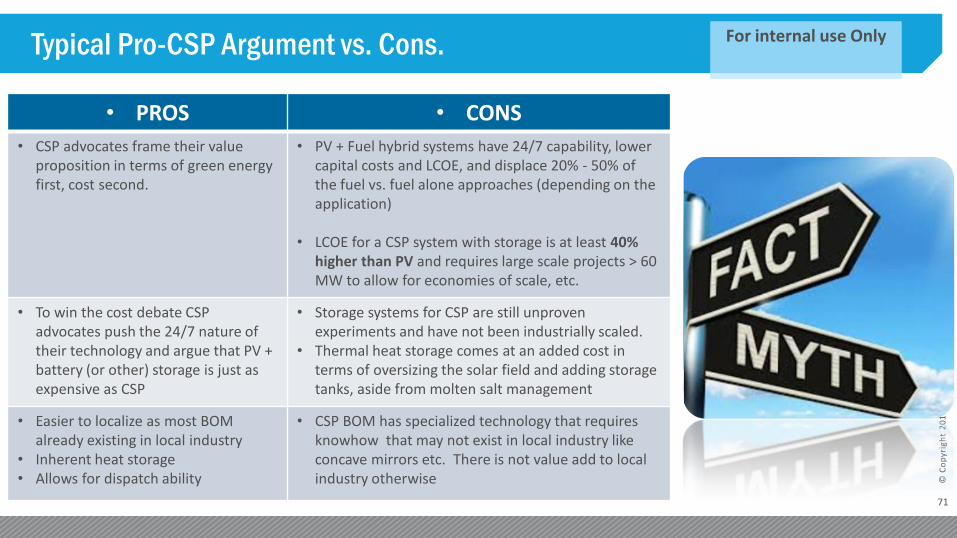
• PROS • CONS
• CSP advocates frame their value proposition in terms of green energy first, cost second.
• PV + Fuel hybrid systems have 24/7 capability, lower capital costs and LCOE, and displace 20% - 50% of the fuel vs. fuel alone approaches (depending on the application)
• LCOE for a CSP system with storage is at least 40% higher than PV and requires large scale projects > 60 MW to allow for economies of scale, etc.
• To win the cost debate CSP advocates push the 24/7 nature of their technology and argue that PV + battery (or other) storage is just as expensive as CSP
• Storage systems for CSP are still unproven experiments and have not been industrially scaled.
• Thermal heat storage comes at an added cost in terms of oversizing the solar field and adding storage tanks, aside from molten salt management
• Easier to localize as most BOM already existing in local industry
• Inherent heat storage • Allows for dispatch ability
• CSP BOM has specialized technology that requires knowhow that may not exist in local industry like concave mirrors etc. There is not value add to local industry otherwise
Typical Pro-CSP Argument vs. Cons. For internal use Only
72
© C
op
yrig
ht
20
14
, Fi
rst
Sola
r, I
nc.
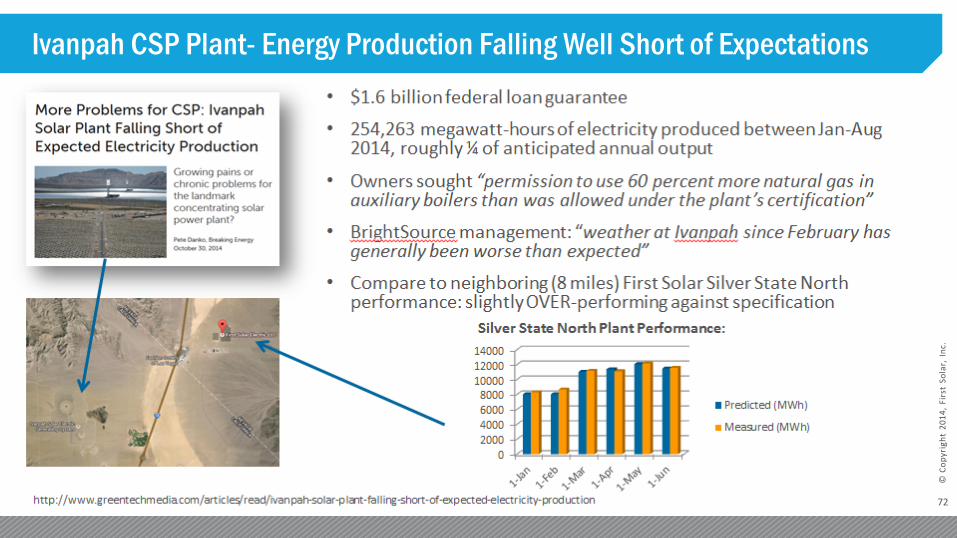
Ivanpah CSP Plant- Energy Production Falling Well Short of Expectations

© Copyright 2014, First Solar, Inc.

74
© C
op
yrig
ht
20
14
, Fi
rst
Sola
r, I
nc.
Total of 2428 MW (AC)
O&M Portfolio
75
© C
op
yrig
ht
20
14
, Fi
rst
Sola
r, I
nc.
MA
INTE
NA
NC
E
Se
rvic
es
Preventative Maintenance
Warranty Administration
Annual Operations Planning and Report
Corrective Maintenance
PE
RF
OR
MA
NC
E
En
gin
ee
rin
g
ADvise Web Portal
Weekly Performance Engineering Review
DC Health Performance Recommendations
Monthly Performance Report
TOTA
L A
SS
ET
Ma
na
gem
ent Availability Guaranteed
Lifetime Asset Maintenance/Management (No Owner Risk)
Spare Parts Procurement & Management
Weather & Energy Generation Forecasting
OP
ER
ATI
ON
S
Se
rvic
es
24x7 Plant Monitoring
24x7 Alarm Notification
Utility Interface, NERC/FERC Reporting
Monthly Performance Report
PlantView Web Portal
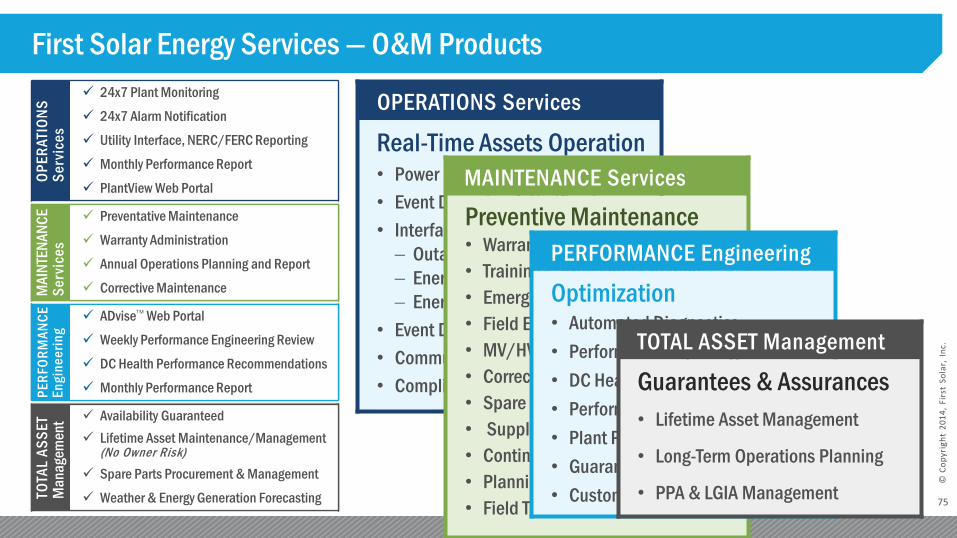
First Solar Energy Services — O&M Products
OPERATIONS Services
Real-Time Assets Operation • Power Plant Controls
• Event Detection & Notification
• Interfacing with the Utility
Outage Notification
Energy Forecasting
Energy Scheduling
• Event Detection & Notification
• Communication with Site Personnel
• Compliance & Reporting
OP
ER
ATI
ON
S
Se
rvic
es
24x7 Plant Monitoring
24x7 Alarm Notification
Utility Interface, NERC/FERC Reporting
Monthly Performance Report
PlantView Web Portal
MA
INTE
NA
NC
E
Se
rvic
es
Preventative Maintenance
Warranty Administration
Annual Operations Planning and Report
Corrective Maintenance
PE
RF
OR
MA
NC
E
En
gin
ee
rin
g
ADvise Web Portal
Weekly Performance Engineering Review
DC Health Performance Recommendations
Monthly Performance Report
TOTA
L A
SS
ET
Ma
na
gem
ent Availability Guaranteed
Lifetime Asset Maintenance/Management (No Owner Risk)
Spare Parts Procurement & Management
Weather & Energy Generation Forecasting
MAINTENANCE Services
Preventive Maintenance • Warranty Compliance
• Training & Procedure Creation
• Emergency Response
• Field Engineering
• MV/HV Testing
• Corrective Maintenance
• Spare Parts Management
• Supply Chain Management
• Continuous Improvement
• Planning & Scheduling
• Field Telemetry Calibration
MA
INTE
NA
NC
E
Se
rvic
es
Preventative Maintenance
Warranty Administration
Annual Operations Planning and Report
Corrective Maintenance
PERFORMANCE Engineering
Optimization • Automated Diagnostics
• Performance Reporting
• DC Health Monitoring
• Performance Recommendation
• Plant Performance Modeling
• Guarantee Administration
• Customer Support
PE
RF
OR
MA
NC
E
En
gin
ee
rin
g
ADvise Web Portal
Weekly Performance Engineering Review
DC Health Performance Recommendations
Monthly Performance Report
TOTAL ASSET Management
Guarantees & Assurances
• Lifetime Asset Management
• Long-Term Operations Planning
• PPA & LGIA Management TOTA
L A
SS
ET
Ma
na
gem
ent Availability Guaranteed
Lifetime Asset Maintenance/Management (No Owner Risk)
Spare Parts Procurement & Management
Weather & Energy Generation Forecasting

76
© C
op
yrig
ht
20
14
, Fi
rst
Sola
r, I
nc.
Real-Time Performance Management
• 24x7 real-time plant monitoring
• Active power plant control
• Weather forecasting and energy predictions
• Compliance
• Performance reporting to utilities, owners and site personnel
O&M Product — OPERATIONS Services
Fully integrated operations with automated controls ensure plant is operational and generating optimal energy production.
77
© C
op
yrig
ht
20
14
, Fi
rst
Sola
r, I
nc.
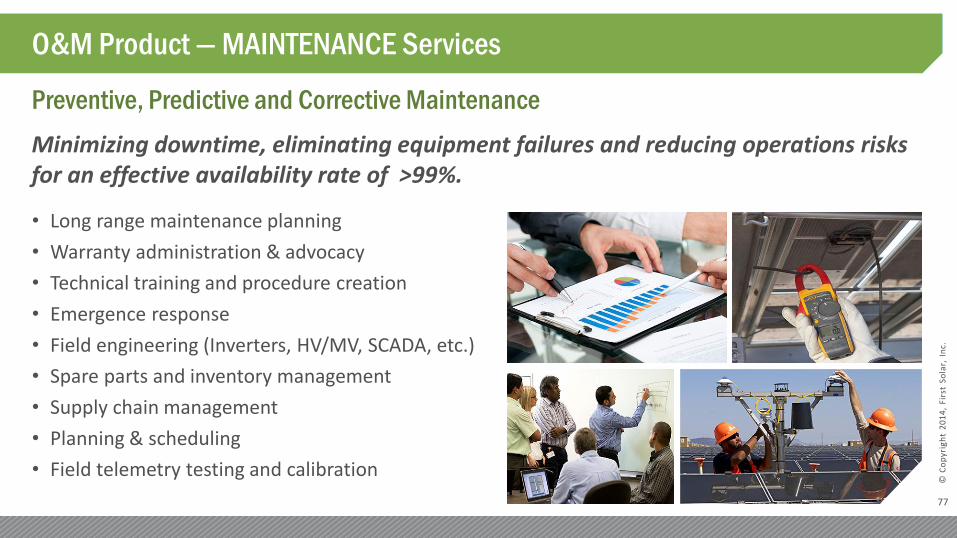
Preventive, Predictive and Corrective Maintenance
• Long range maintenance planning
• Warranty administration & advocacy
• Technical training and procedure creation
• Emergence response
• Field engineering (Inverters, HV/MV, SCADA, etc.)
• Spare parts and inventory management
• Supply chain management
• Planning & scheduling
• Field telemetry testing and calibration
O&M Product — MAINTENANCE Services
Minimizing downtime, eliminating equipment failures and reducing operations risks for an effective availability rate of >99%.
78
© C
op
yrig
ht
20
14
, Fi
rst
Sola
r, I
nc.
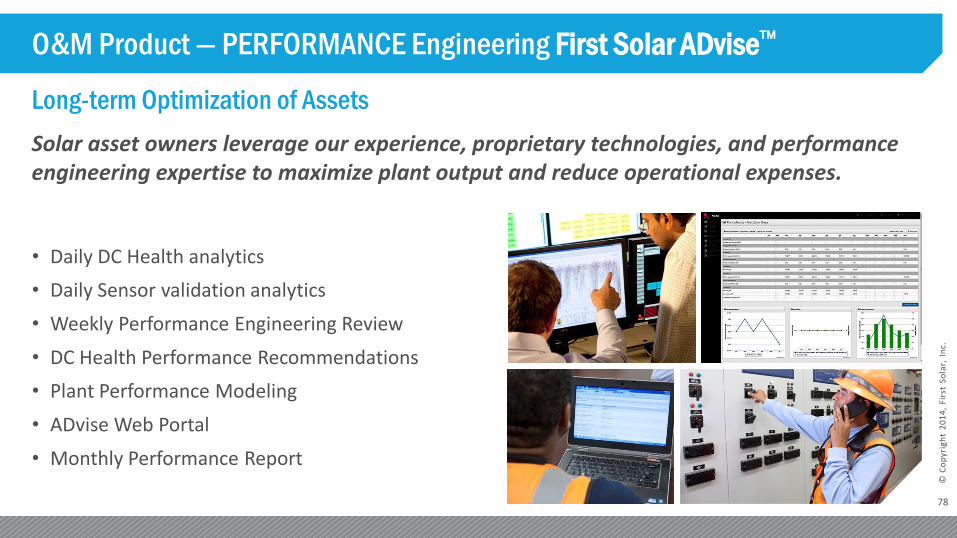
Long-term Optimization of Assets
• Daily DC Health analytics
• Daily Sensor validation analytics
• Weekly Performance Engineering Review
• DC Health Performance Recommendations
• Plant Performance Modeling
• ADvise Web Portal
• Monthly Performance Report
O&M Product — PERFORMANCE Engineering First Solar ADvise
Solar asset owners leverage our experience, proprietary technologies, and performance engineering expertise to maximize plant output and reduce operational expenses.
79
© C
op
yrig
ht
20
14
, Fi
rst
Sola
r, I
nc.
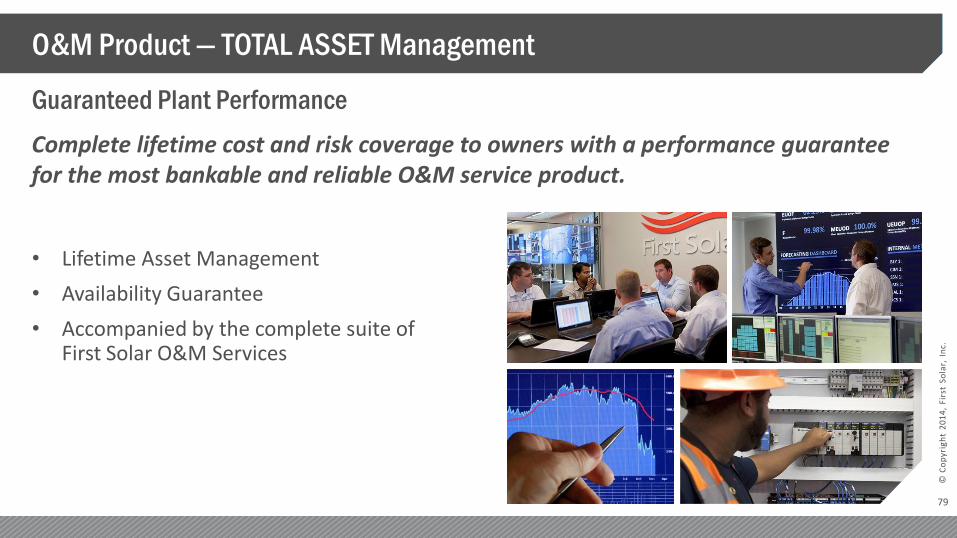
Guaranteed Plant Performance
• Lifetime Asset Management
• Availability Guarantee
• Accompanied by the complete suite of First Solar O&M Services
O&M Product — TOTAL ASSET Management
Complete lifetime cost and risk coverage to owners with a performance guarantee for the most bankable and reliable O&M service product.

80
© C
op
yrig
ht
20
14
, Fi
rst
Sola
r, I
nc.
First Solar Energy Services — O&M Products O
pe
rati
on
s S
erv
ice
s
24x7 Plant Monitoring
24x7 Alarm Notification
Utility Interface, NERC/FERC Reporting
Monthly Performance Report
PlantView Web Portal
Ma
inte
na
nce
S
erv
ice
s
Preventative Maintenance
Warranty Administration
Annual Operations Planning and Report
Corrective Maintenance
Pe
rfo
rma
nc
e
En
gin
ee
rin
g
ADvise Web Portal
Weekly Performance Engineering Review
DC Health Performance Recommendations
Monthly Performance Report
Ass
et
Ma
na
gem
ent
Availability Guaranteed
Lifetime Asset Maintenance/Management
Spare Parts Procurement & Management
Weather & Energy Generation Forecasting
Total Asset Mgmt Guarantee/ No Worry
(Cost + to Owner)
O&M Services Standard Services
ADvise Performance Optimization
Operations Plus Operations + ADvise