, coo 1733-11 polonium-210 in soils and plants
TRANSCRIPT
RECEIVED BY DTIE NOV 1 2 197&
, COO 1733-11
Polonium-210 in Soils and Plants
Special Report
U.S. Atomic Energy Commission contrac t no. A.T. (11-1) -1733
7870-1970
depar tment of radiology and radia t ion biology
5EB5FWBUTION OF THIS DOCUMENT IS UNLIMITED

DISCLAIMER
This report was prepared as an account of work sponsored by an agency of the United States Government. Neither the United States Government nor any agency Thereof, nor any of their employees, makes any warranty, express or implied, or assumes any legal liability or responsibility for the accuracy, completeness, or usefulness of any information, apparatus, product, or process disclosed, or represents that its use would not infringe privately owned rights. Reference herein to any specific commercial product, process, or service by trade name, trademark, manufacturer, or otherwise does not necessarily constitute or imply its endorsement, recommendation, or favoring by the United States Government or any agency thereof. The views and opinions of authors expressed herein do not necessarily state or reflect those of the United States Government or any agency thereof.

DISCLAIMER
Portions of this document may be illegible in electronic image products. Images are produced from the best available original document.

COO-1733-11
POLONIUM-210 IN SOILS AND PLANTS
by
Wayne R. Hansen
L E G A L N O T I C E This report was prepared as an account of work sponsored by the United States Government. Neither the United States nor the United States Atomic Energy Commission, nor any of their employees, nor any of their contractors, subcontractors, or their employees, makes any warranty, express or implied, or assumes any legal liability or responsibility for the accuracy, completeness or usefulness of any information, apparatus, product or process disclosed, or represents that its use would not infringe privately owned rights.
Special Report on U. S. Atomic Energy Commiss ion
Contract No. AT (11 - 1) - 1733
F o r Resea rch Entit led
"A study of unsupported polonium-210 for ion
exchange in soi ls and uptake in vegetat ion"
Directed by Co-pr inc ipa l Inves t igators
Robert L. Watters and J a m e s E. Johnson
Depar tment of Radiology and Radiation Biology
Colorado State Univers i ty , F o r t Col l ins , Colorado 80521
June , 1970
DISTRIBUTION OF THIS DOCUMENT IS UNLIMT1

ABSTRACT OF THESIS
POLONIUM-210 IN SOILS AND PLANTS
Polonium-210 used as a radionuclide fuel for SNAP electrical
generators may present a long term hazard if accidental release of the
isotope were to contaminate agricultural soils. Absorption of PoO„
in soils studied by bulk determination of distribution coefficients (K ,)
indicated retention in the top soil samples was correlated with silt con
tent. An empirical equation describing agricultural top soil absorption
was derived as In K = 3. 2 + 0. 046 (percent silt). The distribution
coefficients of the combined data for the A, B and C horizons combined
were correlated with soil pH and silt content and could be described by
the derived empirical equation In K, = - 1.3 + 0. 034 (percent silt) +
0.88(pH).
Polonium oxide was eluted through soil columns and successfully
tested these distribution coefficients. Greater than 98 percent of the
2 10 PoOo was retained by the first 2 cm of soil with K, ' s greater than
2 10 100. Top soil samples with K , ' s less than 100 indicated PoO„ would
be retained by the lower soil horizons. Hazards to water supplies by
movement of * Po through soil would be minimal.
2 10
Chemical species of Po in soil solution examined by electrophoresis and dialysis experiments indicated both positive and negative
species existed. Dialysis experiments indicated approximately 34 per -2 10 cent of the Po in soil solution passed through a semi-permeable
membrane. ii

p i n
Plant uptake of P o 0 2 added to three different soils was mea
sured and expressed as a transfer coefficient, U, where TT _ Po/g dry plant tissue
2 1 0 P o / g dry soil
Transfer coefficients of 11 different fruit, grain, leafy and root crops _ P £
ranged from 10" to 10" . The transfer coefficients remained constant
for the majority of plant t issues examined, although the distribution co
efficients differed for the three soils used. Calculations using the
210
transfer coefficients for estimating dietary intake of Po from vege
tables indicate a potential long-term ingestion hazard to the population.
Protein hydrolyzates of wheat and spinach were separated by paper
chromatography to investigate possible organic forms of polonium in plants. One possible organic form of polonium was observed.
2 10 Measurements of naturally occurring Po in the soil samples
indicated a range of 0. 22 to 3. 47 pCi/g in top soils. Polonium-210
measured in the vegetation used for controls in the greenhouse experi
ments indicated the primary source of the isotope was the fallout of
2 10 airborne Po and its radioactive precursors .
Wayne R. Hansen Department of Radiology and
Radiation Biology Colorado State University Fort Collins, Colorado 80521 August, 1970
i n

ACKNOWLEDGEMENTS
The work described in this dissertation was financed by the U. S.
Atomic Energy Commission under Contract AT( 11-1)-1733 with the
Office of Contracts and Grants Administration, Colorado State Univer
sity.
I would like to express my sincere appreciation to the following
individuals for their help and encouragement: Dr. Robert L. Watters,
Associate Professor of Radiology and Radiation Biology, who served
as my advisor and teacher, gave advice and encouragement that were
the primary factors leading to the completion of this paper. Dr. James
E. Johnson, Associate Professor of Animal Science, Radiology and
Radiation Biology contributed his time and advice throughout the pro
ject as Co-principal Investigator. Dr. F. Ward Whicker, Associate
Professor of Radiology and Radiation Biology helped collect soil
samples and gave valuable advice about the ecological aspects of the
project. Dr. Willard L. Lindsay, Professor of Agronomy contributed
valuable advice on the soil chemistry aspects of the project and r e
viewed several papers. Mr. Winfred D. Holley, Professor of Horti
culture provided the greenhouse space used in the study and gave
valuable advice on the greenhouse culture of plants. I would like to
thank Miss Marie Marple, Mrs. Ardis Letey and Mrs. Prisci l la Lopez
for their assistance in laboratory analyses of the soil and plant sam
ples. I would also like to thank Mr. Joseph Harness who contributed
advice and instrumentation maintainence throughout the project. iv

To my wife, Nancy Jane, must go the most sincere thanks and
appreciation. Her patience, understanding and encouragement were
instrumental in completion of this paper.
i?

TABLE OF CONTENTS
Page
CHAPTER I INTRODUCTION AND STATEMENT OF
THE PROBLEM 1
CHAPTER II LITERATURE REVIEW 4
Polonium-210 in Soils and P lan t s 4
Polonium in Relation to Man 9
Polonium-210 a s a Radionuclide F u e l . . . . 11
The Chemis t ry of Polonium 16
CHAPTER III MATERIALS AND METHODS 19
Soil Sample Collection 19
P r e p a r a t i o n of Polonium Solutions and Suspensions 20 Equi l ibr ium Distr ibution Coefficient
(Kjj) Determinat ions 21
Soil Column Elution of 2 1 0 P o 23
Determinat ion of the 2 1 0 P o Content of Soils 24 Addition of Polonium-210 to Soil for
Greenhouse Exper iments 25
P lan t ing , P lant Harves t and Plant Ana lyses . 26
E lec t rophores i s and Dialysis of Soil Solutions 35 Extrac t ion of P lant Polonium and Separat ion by P a p e r Chromatography . . . . 38
E r r o r s 39
vi

TABLE OF CONTENTS (Concluded)
Page
CHAPTER IV RESULTS AND DISCUSSION 42
Equil ibr ium Distr ibution Coefficients
(K d ) 42
Elution of Polonium from Soil Columns . . 57
Natural Polonium-210 Content of Soils . . . 65
Study of the Polonium Species in Soil
Solution 71
Polonium-210 Uptake by P l an t s 87
Control Plant Polonium-210 Content . . . . 103
P a p e r Chromatography of Plant Ex t r ac t s . 114
CHAPTER V SUMMARY OF RESULTS AND DISCUSSION. . 123
BIBLIOGRAPHY 126
APPENDIX 132
vn

LIST OF TABLES
Table 1.
Table 2.
Table 3.
Table 4.
Table 5.
Table 6.
Table 7.
Table 8.
Table 9.
Table 10.
Table 11.
Table 12.
Table 13.
Table 14.
Page 210
The physical properties of 8 4 Po as a SNAP fuel 13
2 10 The soil concentrations of Po for each planting 27
Concentration and chemical form of plant nutrients added to greenhouse irrigation water 31
Equilibrium distribution coefficients (K,) for 2 1 ^PoCl 4 and 2 1 0 P o O 2 43
Equilibrium distribution coefficients (K ,) for 2 1 0 P o O 2 44 210
Po oxide distribution coefficient as a function of particle size (Nunn silty clay loam Horizon CCa> 5 6
Elution of polonium oxide through soil columns . . 59
Elution of polonium oxide through soil columns . . 60
Elution of polonium oxide through soil columns. . 64
Natural polonium210 content of soils 66
Average 2 l 0 P o content of soils from each soil group 69
2 10 Dialysis of *'■ PoOg in deionized water and soil solutions 86
Polonium chloride transfer coefficients (U) Fort Collins silty clay loam 88
Polonium oxide transfer coefficient (U) Fort Collins silty clay loam, Kd = 230 90
V l l l

•J
LIST OF TABLES (Continued)
Page
Table 15. Polonium oxide transfer coefficient (U) -Fayette silt loam, Kd = 303 92
Table 16. Polonium oxide transfer coefficient (U) -Leon sandy loam, K = 17 95
Table 17. RaDEF ( 2 1 0 P b , 2 1 0 Bi and 2 1 0 P o chlorides) t r ans fer coefficients - Fort Collins silty clay loam . . . 96
2 10 Table 18. Chemical yields of u P o 0 2 added to plant
t issues 97 Table 19. Dry weight transfer coefficients for vegetation
grown in three soils 100
Table 20. Range in the observed dry weight transfer coefficients for 2 1 0 P o O 2 104
Table 21. Control plants 2 1 0 P o content - Fort Collins silty clay loam 105
Table 22. Control plants 2 Po content - Fayette silt loam. . 108 21 n Table 23. Control plants Po content - Leon sandy loam . . 110
Table 24. Polonium-210 uptake by plants based on control plants - Fort Collins silty clay loam 112
Table 25. Dry weight transfer coefficients for plants grown in Fort Collins silty clay loam containing 210p oo and RaDEF 113
2 10 Table 26. Ratios of Po activity in plants extract digest to the Po activity in the control digest 120
I X
LIST OF FIGURES
Page
Figure 1. Arrangement of plantings in Fayette silt loam 30
Figure 2. Water bath and stirring apparatus used for spontaneous deposition of 2*0po 34
Figure 3. The change of distribution coefficient with mixing time for Nunn silty clay loam, A . . horizon 47
Figure 4. The distribution coefficients of Nunn silty clay loam, A J J horizon determined with increasing concentrations of 2 ! 0 p o o 2 in suspension 50
Figure 5. The distribution coefficients of 18 top soils ver sus the silt content of the soil. The line is the least squares fit of the data 53
Figure 6. Paper electrophoresis of stock PoOg in Brown Soil Group, Nunn silty clay loam, leachate. . . . 73
Figure 7. Paper electrophoresis of P o 0 2 soil leachate, Brown Soil Group, Nunn silty clay loam A j . horizon 75
Figure 8. Test for diffusion of P o 0 2 solution 77
2 10 Figure 9. Paper electrophoresis of PoO~ soil leachate Brown soil, Fort Collins silty clay loam 79
Figure 10. Paper electrophoresis of 1 0PoO2 soil leachate Podzolic soil, Gogebic sandy loam 81
210 Figure 11. Paper electrophoresis of P o 0 2 soil leachate Podzolic soil, Onaway fine sandy loam 83
Figure 12. Paper chromatography of wheat leaves and stems protein extract and 2 1 " P o 0 2 digested in 6 N HC1 116

V
LIST OF FIGURES (Concluded)
Page
Figure 13. Paper chromatography of spinach leaves and stems protein extract and 2 i^PoO„ digested in 6 N HC1 118
X I

CHAPTER I
INTRODUCTION AND STATEMENT OF THE PROBLEM
The element polonium was discovered by Marie and P ie r re Curie
in 1898 while studying the radioactivity of uranium and thorium ores .
Study of the element was hampered by its low concentration in nature.
Figgins (1961) estimated the concentration to be approximately 0. 1 mg
per ton of uranium ore. All known isotopes of polonium are radio-
210 active; the longest lived naturally occurring isotope is Po (RaF)
with a 138. 4 day half-life. Polonium is formed from the radioactive
decay of uranium and it is the last radioactive element in the decay
chain. Polonium-210 decays to lead-206 99. 9988 percent of the time
via a 5. 30 MeV alpha particle. The remaining 1. 2 x 10 ° percent of
the decay is via a 4. 50 MeV alpha particle and a 0. 803 MeV gamma
ray.
2 10 Kilocurie quantities of Po have been proposed as a fuel for 210 radioisotope electrical generators. Large quantities of Po are
on q prepared by neutron irradiation of pure Bi in nuclear reactors . 210 The Bi which is formed has a half-life of five days and decays to
2 10
Po. The polonium-210 is encapsulated to maximize heat production
from the alpha decay energy and the heat is converted to electricity
through semiconductor thermoelectric elements. Radionuclide elec
trical generators have been named Systems for Nuclear Auxilary

2
Power or SNAP with major application of the units as satellite power
supplies. 210 Use of Po as a radioisotope fuel for electrical generators
requires an evaluation of the hazards associated with accidental release
of large quantities of the isotope to the biosphere. Before an evalua
tion of the hazards can be made, the behavior of the radioisotope in
biological systems must be examined. Routes of ingested forms of
210 Po must be investigated for possible short- term and long-term
radiation exposures of a population.
210 Accidental release of a large quantity of Po as an oxide over
agricultural soils may introduce a long-term hazard by contaminating
soil and vegetation. Polonium oxide deposited on soil may be retained
in the plant root zones or move through the soil to a water supply.
Polonium-210 in the plant root zone may be available for plant uptake
and entry into the food chain.
The chemical species of polonium in soil solution may control the
soil retention and plant uptake. The physio-chemical properties of the
soil interacting with the polonium oxide may determine the chemical
species. Upon entry into the plant the chemical form may influence
the availability of the isotope if ingested by animals.
2 10 Because the long-term radiological health hazards of Po r e
leased over agricultural soils are associated with soil retention and plant uptake, this research was conducted to develop data required

3
2 10 for hazards analysis. Studies of Po movement in soils had not been
210 made previously, and investigations of Po in plants were not con-
2 10 ducted for evaluation of the hazards of Po in the diet. Thus, the
purpose of this study was to develop the data necessary for estimation 210 of the hazards from deposition of Po on agricultural soils. The
objectives of the research were:
210 1. To develop predictive equations of soil retention of Po
in terms of a distribution coefficient (K_). d
2. To characterize the chemical species of polonium in soil
solution.
? 1 0
3. To measure the plant uptake of <S1 Po by the root system
and express the uptake in te rms which would allow estimation
of ingested quantities. 2 10
4. To investigate the chemical form of the Po in the plant t issues.
v

CHAPTER II
LITERATURE REVIEW
Polonium-210 in Soils and P lan t s
The source of ^ l u P o in soi ls i s the radioact ive decay of U.
222 The decay chain leads to the formation of the r a r e gas Rn. Radon-
222 has a half-life of 3.82 days which allows t ime for diffusion of the
gas into soil cap i l l a r i e s and into the a i r . Vohra , Subbaramu and Rao
(1964) es t imated that the radon content of so i l s may reach 500,000
o 222
pC i /m . The fraction of Rn escaping the soil into the a i r var ied
from 1 8 - 8 7 percent for the different soil types included in the i r
study. The fac tors that influenced day to day r e l e a s e of radon were
t e m p e r a t u r e , a i r p r e s s u r e , wind velocity and rainfal l .
Osburn (1965) d iscussed the fac tors influencing radon generat ion
and migra t ion in soil and rock s t r u c t u r e s . The highest radon g e n e r a
tion in soi ls was assoc ia ted with the clay f rac t ions . In dry soil the
movement of radon gas was diffusion controlled but in water sa tu ra ted
soi ls d isplacement of the gases moved radon out into the a i r . Hansen
et aL (1960) observed that freezing prevented radon movement in soi ls
during the winter months .
Radon-222 decays through seve ra l shor t lived daughter products 210 210
to Pb which has a 22 year half-l ife. Lead-210 decays to Bi p i r\
which decay with a five day half-life to P o . Radon-222 decays to i ts daughter products e i ther in a i r o r soil leads to the formation of

5
210 210 Pb and P o in a i r and soi l . The daughter products at tached to
a i rborne pa r t i c l e s may resu l t in fallout because of pa r t i c l e s ize or
210
may be washed from the a i r by precipi ta t ion. Fallout ' P o can be
in tercepted by plants or deposited on the top soi l .
Soils and plant m a t e r i a l s were examined for alpha activity by
Mayneord, T u r n e r and Radley (1960). Soils and plants growing on the 210 210
soi ls were ashed to dr ive off P o and the ingrowth of P o from 210 210
decay of Pb was observed with t ime . The soil and plant Po con-210 210
tents were not co r re l a t ed . -Hill (1960) examined the Pb and P o content of g r a s s , soil and ra in . He suggested that two rou tes of entry
210 210
into g r a s s were available via root uptake of Pb and Po from the
soil or d i rec t deposition on the g r a s s by ra in . Measuremen t s of the
g r a s s , soil and ra in indicated the levels in g r a s s were supported by
fallout in ra in . 210 An in t e re s t in the source of P o in human t i s sues and the imp l i -
2 10 cation that Po may be one of the carcinogenic agents in c igare t te
smoke led to a m o r e intensive study of polonium in plants and so i l s .
210 210 T s o , Hallden and Alexander (1964) de te rmined the Pb and Po
content of impor tant tobacco growing soi ls and found concentra t ions
210 ranging from 0. 26 to 1.01 pCi /g . They suggested the uptake of Pb
210 210
and Bi from the soil could account for the Po content of tobacco.
B e r g e r , E r h a r d t and F r a n c i s (1965) suggested the sou rce of po lo
nium in tobacco and vegetables was from a i r deposition. They m e a s u r e d

6
y
the polonium content of vege tab les , fresh tobacco, cured tobacco and
210 the assoc ia ted so i l s . They detected 1 to 5 pCi of P o pe r g ram of
2 10 soi l , but did not detect P o in vegetables or f resh tobacco. Cured
tobacco contained 0. 96 p C i / g of polonium and cabbages left in the
field over winter contained up to 6.6 pCi /g in the outer l eaves . The
210 center of the head did not contain detectable Po activity. T s o , Harley and Alexander (1966) exposed tobacco plants to a 500-fold
222 i nc r ea se of Rn in a i r in a greenhouse . Only a two-fold i n c r e a s e
210 210
in u P b and P o content of the tobacco was observed af ter six weeks
of exposure . T s o et a l . concluded from the exper iment that the major
route of ent ry into the tobacco plant was root uptake of 2 1 0 P b and * P o .
F r a n c i s and Ches t e r s (1967) suggested the source of 2 1 0 P o in tobacco 210 could be the decay of P b . The i r exper iment followed the change of
2 1 0 Po activity in tobacco samples and the ingrowth of polonium was
210 t r aced to P b through ana lys is of the half- l ives involved. In a m o r e
detailed study F r a n c i s , Ches t e r s and E r h a r d t (1968) exper imented with
vegetables and tobacco under greenhouse and field conditions. P lants p \ r\
grown under field conditions contained up to 10 t imes m o r e "Po than
2 10 those grown in a greenhouse . The Po content in field plants was
210 210 direct ly re la ted to the ra in content of Pb and Po at the different
field s ta t ions .
2 1 0 Examinations of d i rec t plant uptake of 6 1 u P o from soil have been
210 l imi ted to movement from nutr ient solution or Po (NOg)4 mixed

7
into soil. Menzel (1953) reported unsupported Po uptake by red
clover, sudan grass and Astragulus grown in nutrient solutions.
210 Unsupported Po is polonium present without its radioactive precursors 2 l 0 P b and 2 l 0 B i . The percent of the total present in Menzel's solution detected in the plants was 0.006 percent in red clover, 0.019
percent in sudan grass and 0. 055 percent in Astragalus. Tso and 210 Fisenne (1968) examined tobacco plant uptake of Po ( N O J . mixed
into soil. The plants were harvested after two weeks of growth in
contaminated soil and the percent uptake of the total polonium available
was measured. Upper leaves contained 0. 5 percent of the activity.
The lower leaves and stem each contained 0. 1 percent of the activity.
Root uptake of an element from soil is governed by many factors.
Several authors have reviewed the factors influencing the rate and the
amount of ion entry into roots. A review of root entry of radioisotopes
by Hope (1960) summarizes the internal and external factors to con
sider in experiments with ion uptake.
Internal plant factors that control ion entry were listed as follows:
1. Nature of the root surface area.
2. The free space available to the ion in the root.
3. The number and concentration of ion exchange centers on the
root.
4. The plant transpiration rate.

8
5. The age and rate of growth of the plant.
6. The rate of plant respiration.
7. The internal ion status of the plant.
External factors that affect root uptake of ions were generalized
in the following list:
1. Availability of the ion.
2. The chemical nature and concentration of the ion in the soil.
3. The temperature of the soil.
4. The oxygen content of the soil.
5. The water status of the soil.
6. The presence of other ions.
7. The soil pH (a special case of 6.).
The root uptake of polonium-210 may be governed by the avail
ability of the chemical species in soil which is controlled by the soil
retentive properties. Rhodes (1957 a) expressed the soil retention of
radioisotopes in terms of the equilibrium distribution coefficient. The
distribution coefficient (K.) is the ratio of the amount of radioisotope
per gram of adsorption media to the amount of radioisotope per ml of
solution at equilibrium. The K, is calculated by use of the following
equation discussed by Mayer and Tompkins (1947) in their investiga
tions of bulk ion exchange measurements.
9
where
M = the fraction of the radioisotope on the solid phase after
equilibrium. Mg = ( M t o t a l - M{) / M t Q t a l
M. = the fraction of the radioisotope in the liquid phase.
v = volume of solution.
m = soil weight.
Rhodes' investigations (1957 b) of soil factors influencing the distribu
tion coefficient indicate that the physio-chemical properties of the soil
and the radioisotope solution determine the strength of interaction.
The soil cation exchange capacity, organic matter, hydrogen ion activ
ity and the particle size distribution were correlated with changes in
the K , for plutonium and strontium.
Polonium in Relation to Man
Polonium-210 in soils and plants was implicated as one of the
major contributors to mans exposure from natural radiation in early
studies of radioisotopes in the diet. Mayneord and Hill (1959) identi-
210 fied Po as the major source of alpha activity in grass and sheep
kidneys. Hill (1962) reported that polonium accounted for the major
part of the alpha activity of botanical samples and soft tissue samples
of man. Polonium was present in soft tissue without its p recursors ,
2 1 0 Bi and 2 1 0 P b . Studies of 2 l 0 P b and 2 1 0 P o in human bone by
Holtzman (1963) and in human tissues by Osborne (1963) suggested the

10
source of the isotopes was from food, water and a i r . Hill (1963)
210 210
suggested ^ l u P b may contribute to the amount of Po detected in soft
t i s s u e s , but he s ta ted that food was probably the major source of the
isotope. Holtzman (1964) suggested food does not contain sufficient 210 210
Po to account for the amount in soft t i s s u e s . He suggested Pb 2 1 0 bound in the bone t i s sues decays to ' l u P o and is red is t r ibu ted in the
body. Blanchard (1967) suggested e i ther that redis t r ibut ion takes place
or that e r r o r s exist in d ie tary approximations and t rans fe r coefficients
from food to t i s s u e s .
In te res t in the ro le of polonium-210 in human radiat ion exposure
210 was inc reased by Radford and Hunt (1964) who suggested that P o
may be one of the carcinogenic agents of tobacco smoke. Holtzman
and Ilcewicz (1966) repor ted human t i s sues of c igare t te s m o k e r s con
tained m o r e polonium than n o n - s m o k e r s .
210 210
Repor ts of high levels of Pb and Po in environmental s a m
ples in Finland and Alaska suggested the metabol i sm of the two
isotopes could be followed in the lichen to caribou or r e indee r to 210 human food chain. Beas ley and P a l m e r (1966) r epor t ed m o r e P o
210 than Pb in caribou soft t i s s u e s . Kauranen and Miettinen (1967)
repor ted the ra t io of 2 l 0 P o to 2 1 0 P b ranged from 20 - 40 in elk and
r e indee r meat . Other soft t i s sues such as kidney and l iver had ra t ios
g r e a t e r than one. Hill (1967) suggested that differences in the c h e m i
cal form of ingested polonium may significantly change i t s

11
metabolic behavior. He postulated that polonium detected in meats of
Arctic animals was organically bound 2 1 0 P o and more available to
humans. Kauranen and Miettinen (1969) added weight to this sugges
tion with the results of their study of the Lapp food chain. They mea-
sured the Po / Pb ratio and content of lichen, reindeer and Lapp
reindeer breeders . The ratio was one for lichens which constitute
the primary food of the reindeer. The ratio was 25 to 42 for reindeer
meat. The amount of ^ l u P o in Lapps was much greater than could be
explained by the present transfer coefficients for movement of polo
nium from the gastrointestinal tract to the blood to the organ of
2 10 interest. The data suggest that the Po ingested in reindeer meat
was five times more available than would be predicted from the values
reported by the International Committee on Radiation Protection (1959)
Although the levels of polonium-210 reported in Lapps and
Eskimos are not considered dangerous, the more metabolically avail-p i n 210
able forms of Po in reindeer and caribou meat suggest Po also
may be present in plants as a more available form when ingested.
Polonium oxide deposited on the soil may be absorbed by plants and
incorporated into plant tissues in the organic form.
Polonium-210 as a Radionuclide Fuel
Polonium-210 is one of several radioisotopes proposed as a fuel
for radionuclide electrical generators. Davis (1963) in a review of

12
radioisotopes for use in the space program listed the properties of p i o
Po for use in SNAP generators. The high specific activity and the -5 alpha decay with only 1. 2 x 10 u gamma rays per disintegration made
Po an attractive isotope for short lived space missions. Table 1
210 summarizes the physical properties of Po as a radioisotope fuel
The isotope has been proposed as an energy source for land based
2 10 operations as well. Rodden (1967) suggested that Po be considered
as a fuel for an energy source for small manned Antarctic Experiment
Stations. The system would be used for short term missions at small
outposts.
Polonium-210 was first used as a fuel for radioisotope electrical
generation in SNAP III. Barmat, Anderson and Bollmeir (1959) r e
ported that SNAP III fueled with 3000 curies of 2 l 0 P o produced 5. 3
watts of electricity. Semiconductor thermoelectric elements were
used to convert the heat produced by alpha decay in the source to
electricity. Polonium also was used for the construction of a radio
isotope thruster-electrical power unit for space application by Jones
and Austin (1966) and Leventhal (1966).
The proposed use of polonium-210 as a fuel for radioisotope gen
erators in space requires an evaluation of the hazards that would be
present if an accidental release of the fuel occurred. Lieberman and
Connor (1966) stated the general safety objectives for design and use
of nuclear devices in space are the use with very low probability of

13
Table 1. The physical p rope r t i e s of ^ P o as a SNAP fuel. '
Nuclear Decay Frac t ion of Disintegrat ions Mode Energy Accompanied by Decay Mode
Alpha 5. 298 t 0.002 MeV 0.999988
Alpha 4. 5 MeV 0.000012
Gamma 0. 804 MeV 0.000012
Fuel F o r m s
Energy Available Specific Activity (wat t s /gram) ( cu r i e s /g r am)
P o metal 144 4500
Alloy GdPo 82 2573
Ta mat r ix with alloy
Ta:GdPo '
10: 1 7. 5 234
50 : 1 1.6 50. 4
F r o m "Pu-238 and Po-210 Data Sheets ' ' , (1967).

14
introducing radioisotopes into the biosphere and minimum population
radiation exposure. Harvey, Dick and Fink (1963) discussed the types
of accidents that could cause an accidental release of the radioisotope
from the fuel capsule. If a fire were to occur on a launch pad, the
fuel capsule would be exposed to shock, high temperatures and the
corrosive action of the rocket fuels. Destruction of the rocket during
an early ascent abort of the rocket could rupture the SNAP generator
by impact with land or water. Burial in soil could result in heat build
up and rupture of the fuel capsules. Burial in sea water could result
in corrosion and fuel release. Near orbit injection rocket failure
could result in re-entry with total or partial burn-up upon impact.
Re-entry from orbit after mission completion could result in total or
partial burn-up. In each case the consequences of the release of the
fuel to the biosphere must be considered. The specific problems of the
environment surrounding the radionuclide generator in the types of
accidents described by Harvey et al. are summarized in the March,
1966 report of the Ad Hoc Committee on the Nuclear Space Program
of the Atomic Industrial Forum.
2 10 Two accidents, which are examples of possible routes for Po
release from SNAP generators, occurred in 1964 and 1968. In
April , 1964 a navigational satellite employing a SNAP-9A generator
did not attain orbital velocity. Krey (1967) reported total burn-up
of the generator and release of fuel in the stratosphere. The 8Pu

(..
15
fuel was retained in the stratosphere and deposited slowly as world
wide fallout. In May, 1968 intentional destruction of the rocket during
launch immersed two SNAP 19 generators in the Pacific Ocean off the
coast of California. Luikens (1969) reported intact recovery of the
fuel capsules from the ocean floor. Corrosion removed the cooling
fins and thermoelectric semiconductor elements to leave only the p r i
mary containment. Tests of the fuel capsules for leakage indicated no
loss of 2 3 8 Pu .
Evaluation of the consequences of the release of polonium-210 fuel
requires a knowledge of the probability of such an accident occurring
and the probability of injury of a population. Coleman and Perez (1967)
divided injury to a population into two categories. F i rs t injury from
the radioisotope can occur through inhalation. Secondly injury can
result from ingestion of the radionuclide through the food chain. Willis,
Bramlitt , Paulson and Rooney (1967) suggested a long-term hazard may
2 10 exist from the PoO deposited on the soil. However, at the time of
their hazards evaluations no soil retention data were available. Cole-
210 man and Perez evaluated the ingestion hazard from "PoO deposited
on the plant directly. However, evaluations of the long-term foliar
absorption, root absorption or movement in the soil were not included
in the hazards analysis.

16
The Chemistry of Polonium
The chemical nature of polonium will govern the long-term soil
retention and plant uptake by roots or foliar absorption. However,
the chemistry of polonium is not well known because the element has
no stable isotope and the chemical studies of polonium must be con
ducted with highly radioactive samples. Figgins pointed out that
polonium-210 is the isotope most commonly used, but the high specific
activity of milligram quantities leads to radiation damage of crystal
structures or solutions.
Polonium is the heaviest element of Group VIA of the Periodic
Table. Sulfur, selenium and tellurium are the other elements of the
group. Figgins reports polonium compounds of 4-2 and +4 oxidation
states with a preferred oxidation state of +4. Bagnall (1958, 1966)
reported the formation of polonium monoxide (PoO) which rapidly
oxidizes in air to polonium dioxide (PoOJ and polonium (IV) nitrates
which decomposed to the dioxide form at 130 C. Polonium (IV) hy
droxide was prepared by Bagnall as a pale yellow precipitate formed
by the addition of aqueous NH. OH or alkali hydroxides to acid solutions
of PoCl4 . The composition of the hydroxide was reported as PoO (OH)2
by Bagnall but Ziv and Efros (1959) suggested a formula of Po (OH)4
and calculated the solubility constant as 10 ° '.
References to the solution chemistry of polonium are few and
usually the experiments have been carried out in solutions of one molar

17
ionic strength. P o 0 2 as a fallout product in rain, surface of soils ,
or plants is likely to encounter much lower ionic strengths. Weigel
(1959) studied polonium in solution between pH 1 and 14 and concluded
that the polonium existed mainly as dissolved forms at pH 1-5, 7-8
and 12-14 while between pH 6-7 and 10-11 most of the polonium existed
as a colloid. Haissinsky (1961) named colloidal solutions containing
radioactive products in unweighable and invisible quantities radio
colloids. He reported that radiocolloidal solutions of polonium are
sensitive to impurities and that polonium is readily adsorbed on
powders or precipitates. Thomas and Stannard (1964) examined
210 neutralized PoCl4 solutions. Centrifuge experiments with aged
solutions indicated that polonium was present as particles and applica
tion of Stoke1 s Law to the observed sedimentation rates indicated 95
percent of the particles in solution were greater than 0. 42 microns in
diameter. They suggested small amounts of impurities in solution
acted as nuclei for particle formation.
The chemical form of natural polonium in soils and plants has not
been explored because of the low levels detected. However, polonium
may exhibit chemical properties similar to selenium which has been
examined in plants and soils. Selenium in plants has been identified in
protein fractions of toxic wheats and weeds. Franke and Painter (1936)
linked selenium with the protein fraction of toxic wheats and Jones,
Horn and Gersdorff (1936) correlated the cystine and selenium content

18
f
of toxic wheats. Beath and Eppson (1947) reported that selenium is
present as both organically bound and inorganic selenite in some
genera of Astragalus and Stanleya. Smith (1949) using paper
chromatography identified the protein-bound selenium as seleno-
cystine and seleno-methionine. Peterson and Butler (1962) also
identified the above compounds in addition to 13 other compounds using
paper chromatography and Se. Rosenfeld and Beath (1964) reviewed
selenium in soils , plants and animals. The selenium in soils is p r e
sent as selenate, ferric selenite, and organic compounds. The
methods used for experimental determination of trace quantities of
selenium in plants suggests that a similar method may be used to
identify polonium in plant extracts.

CHAPTER III
MATERIALS AND METHODS
Soil Sample Collection
Soil samples used in this study were obtained through the U. S.
Department of A griculture, Soil Conservation Service; Colorado State
University, Department of Agronomy; and the U. S. Public Health
Service, Southeastern Radiological Health Laboratory. Profile sam
ples of two Colorado soils were collected near Harmony, Colorado and
the F rase r Experimental Forest , Colorado. These soils were the Nunn
silty clay loam representing the Brown soil group and the Darling grav
elly sandy loam, representing a Podzol. Additional profile samples of
two Gray-Brown Podzols and two Podzols were collected for this project
during soil survey activities of the Madison, Wisconsin Soil Conserva
tion Service. The soils were Fayette silt loam and Lapeer loam from
the Gray-Brown Podzol Soil Group and Gogebic sandy loam and Onaway
fine sandy loam from the Podzol Soil Group. Profile samples of a
Brunizem were obtained from the Soil Conservation Service of Des
Moines, Iowa. Two prair ie soils, Dinsdale silty clay loam and Musca
tine silty clay loam, were collected during October, 1968 and shipped
to this laboratory. Top soil samples of five Ground-Water Podzols
and four Red-Yellow Podzols were furnished by the Southeastern
Radiological Health Laboratory of the U. S. Public Health Service.

20
Profile samples of the Ground-Water Podzol, Leon sandy loam, were
collected by the Florida Soil Conservation Service.
Two large bulk samples of Fayette silt loam and Leon sandy loam
were obtained for plant uptake experiments. The Fayette silt loam
was collected at the University of Wisconsin Experiment Station at
Lancaster. Bulk samples of the A. and A 2 horizons of the Leon sandy
loam were collected by the Florida Soil Conservation Service and
shipped to this laboratory.
Soil samples were collected in polyethylene bags which were
opened in the laboratory and the soil allowed to air dry prior to
weighing for natural polonium-210 determination or other laboratory
experiments. Five hundred gram samples of each profile sample were
sent to the Colorado State Soil Testing Laboratory for chemical and
mechanical analyses.
Preparation of Polonium Solutions and Suspensions
Polonium-210 tetrachloride and polonium dioxide were purchased
from Monsanto Research Corporation, Nuclear Sources Division,
Dayton, Ohio in quantities of 1 to 5 mCi. The chloride form was
shipped as a dry deposit in a 10 ml volumetric flask. The deposit
was dissolved at room temperature in 10 ml of 1. 0 N HC1 to form a
primary solution of polonium which would not adsorb to the walls of
the container. Aliquots were withdrawn from the solution as needed

21
for addition to soils and for distribution coefficient measurements.
Monsanto Laboratories prepared the dioxide form by thermal decompo
sition of a polonium nitrate deposit in a 10 ml volumetric flask. The
polonium dioxide was suspended in 10 ml of filtered deionized water.
The filtered water was prepared by passing deionized water through a
pleated membrane cartridge having an average flow pore size of 0. 45 210 microns. The primary PoC^ s u s P e n s i ° n s had concentrations of
0. 5 mCi/ml and were handled within an enclosed radiochemistry glove
box.
Polonium dioxide suspensions were prepared for distribution coeffi
cient determinations by transfering an aliquot of the primary suspen
sion to polyethylene bottles of deionized water. Neutral polonium
chloride solutions were prepared by titrating with 0. 1 N NaOH in the
presence,of an indicator.
Equilibrium Distribution Coefficient (Kd) Determinations
The equilibrium distribution coefficient for polonium dioxide sus
pensions with soil was determined on air-dried samples. The soil
samples were used as obtained from the field with the exception that
small rocks were removed. Large clumps of soil were broken with an
agate mortar and pestle and the soil sample shaken through a 2 mm
screen. Two grams of soil were weighed into each of eight polypropy
lene centrifuge tubes. Five ml of neutral polonium chloride solution
or polonium oxide suspension were pipetted into each tube.

22
The solutions and suspensions were measured by drying one ml aliquots
in planchets and counting them in a gas flow proportional counter. The
concentration of activity ranged from 8000 to 15,000 dpm/ml. The
tubes were sealed with polypropylene friction fit closures and placed
on a wheel which rotated about a horizontal axis at 12 rpm to agitate
them. After 20 hours of rotation, the tubes were removed and placed
in a Sorvall Model RC2-B centrifuge with a Model SS-34 rotor which
was spun at 15,000 rpm for 20 minutes. A centrifugal force of 29,000
times gravity was developed which settled particles greater than 0.02
microns as calculated from equations by Jackson (1956). The samples
were removed and 1.0 ml of the supernatant liquid from each sample
was delivered to one inch stainless steel planchets with an Eppendorf
automatic pipet. The samples were dried under a heat lamp and
counted with a Radiation Counter Laboratories or Nuclear Associates
preflushed gas flow proportional counter connected to an amplifier
and scaler.
The distribution coefficient of Nunn silty clay loam was examined
for change with different concentrations of polonium oxide suspensions
and agitation time. Distribution coefficients were determined for
suspensions of 1000 dpm/ml, 2000 dpm/ml, 6000 dpm/ml, 12,500
dpm/ml and 24,000 dpm/ml. The distribution coefficients for one
hour, two hours, four hours, eight hours, sixteen hours, twenty hours,
twenty-four hours and forty-eight hours of mixing were determined.

23
Distribution coefficients as a function of soil particle size were
determined for the C/-.a horizon of the Nunn silty clay loam. Particle
sizes were separated by sieving and settling techniques according to
the methods of Jackson (1956). Soil particles were divided into
ranges of greater than 50 microns, 50 to 20 microns, 20 to 5 microns,
5 to 2 microns and less than 2 microns. The distribution coefficients
for particle size ranges were determined with polonium dioxide sus
pensions.
Soil Column Elution of 2 i 0 P o
Columns of soil having the same length as the depth of the natural
horizon were prepared in 0. 9 cm ID polyethylene tubing. The soil was
added to the column in the dry state because s lurr ies fractionated into
particle sizes with a preponderance of clay at the top. Soil samples
were ground in an agate mortar until a particle size was obtained
which would allow a flow of one to two ml of water per hour through a
2 10 column. One hundred ml aliquots of P°Op suspension containing
0.1 to 0. 2 yCi were placed at the top of the dry soil columns. Each
column was connected to a fraction collector and distilled water was
supplied to the column through a siphon tube. Elution with distilled
water was performed until the equivalent of one mean annual rainfall for
the soil ser ies had passed through the column. Water from the fraction
collector drained into polypropylene test tubes and the eluate was
24
transferred to stainless steel planchets, dried, and counted for l u P o
activity. Columns were cut into 1.0 cm sections and analyzed for
2 10 Po as described in the following section.
210 Determination of the Po Content of Soils
Two gram soil samples were weighed into eight 12 ml polypropy
lene centrifuge tubes and digested with 10 ml of 12 N HCl at 80°C for
40 minutes. The samples were centrifuged for 20 minutes at 15,500
rpm (RCF, 29,000 G) in a Sorvall high speed centrifuge. The super
natant liquid was decanted into a 500 ml polyethylene bottle. The
samples were digested two more times following the same procedure.
Each sample was diluted with 30 ml of distilled water, 250 mg of
ascorbic acid were added and the solution was titrated to neutrality
with 15 N NaOH using three drops of a methyl red-bromothymol blue
indicator. The indicator solution was prepared by adding 50 mg of
methyl red and 125 mg of bromothymol blue to 85 ml of ethanol and
15 ml of water as described by Fink (1950). The indicator was orange
at pH 4, yellow at pH 5, green at pH 7 and blue at pH 8. Four ml of
12 N HCl were added to the neutral solution and the solution was
transferred with three rinses to plating cells. The cells were made
from nursing bottles as described by Baxter and Wood (1953). Dis
tilled water was added to make up a volume of 100 ml of a 0. 5 N HCl
solution. The plating cells were placed in a water filled shaker

25
bath at 75 C for five hours. The polonium deposited spontaneously
upon nickel discs.
The polonium content of the Nunn silty clay loam and Darling
gravelly sandy loam was determined using the Sorvall high speed 210 centrifuge. The Po content of the remaining soil samples was
determined using a clinical centrifuge. Samples were spun in the
clinical centrifuge for 20 minutes at 320 rpm (RCF 1610 G). The
chemical yield for the extraction of 2 Po added to the soil was 69 t 2
percent for the procedure using the clinical centrifuge compared to
72 t 2 percent using the high speed centrifuge.
Addition of Polonium-210 to Soil for Greenhouse Experiments
Fort Collins silty clay loam, Fayette silt loam and Leon sandy
loam were transferred to the Department of Radiology and Radiation
Biology radioisotope handling facility for addition of 2 1 " P o . The soil
was measured with the planter pots to be used in the greenhouse into
a 1.5 cubic foot cement mixer. Water was added to the soil in the
mixer until a thick slurry formed. An aliquot of the polonium chloride
or polonium oxide primary solution was transferred to 200 ml of dis
tilled water and the solution added slowly with mixing to the soil
slurry. Sand and peat moss were added to the Fort Collins silty clay
loam and Fayette silt loam to produce mixtures which were 58 percent
soil, 40 percent added sand, and 2 percent peat moss by weight.
The Leon sandy loam was mixed by adding one-half of the soil to the

26
mixer, adding polonium oxide suspension and adding the remainder of
soil. After mixing, each soil was transferred to five gallon plastic
lined pails. Five random samples of approximately 20 grams were
collected for polonium assay during the transfer.
The soils were moved to the greenhouse and steam sterilized by
raising the temperature to 80 C for 30 minutes. The sterilization
killed weed seeds and bacteria which might flourish under greenhouse
conditions. After the soil cooled it was transferred to plastic planter
pots each of which contained 2500 grams dry weight of soil. Soil
mixtures for control plantings were prepared in separate apparatus
to prevent cross contamination.
Planting, Plant Harvest and Plant Analyses
Plants were started from seed in the control soils and polonium
contaminated soils. Alfalfa, barley, celery, corn, onions, peas,
potatoes, radishes, spinach, tomatoes and wheat were planted consis
tent with the depths and spacings between seeds listed by Knott (1955).
One-half inch of vermiculite on top of the soil protected the growing
plants from cross contamination of their surfaces. Plantings were
started in polonium chloride contaminated Fort Collins silty clay loam
in December, 1967. Plantings in polonium oxide contaminated soils
were started in Fort Collins silty clay loam in May, 1968 in Fayette
silt loam in March, 1969 and in Leon sandy loam in February, 1970.
Table 2 contains the polonium assay data for the soils.

27
2 10 Table 2. The soil concentrations of Po for each planting.
Chemical Form Number Range of Soil Series of 2 l 0 P o of Mixes Activity/gm
Ft. Collins silty clay loam Chloride
Ft. Collins silty clay loam Oxide
Ft. Collins silty clay loam (RaDEF) Nitrate
Fayette silt loam Oxide
Leon sandy loam Oxide
12
10
1
8
6
0 . 6 - 1 nCi
2 . 2 - 5 . 2 nCi
390 nCi
10 nCi
15-30 nCi

28
Figure 1 is a picture of the greenhouse in March, 1969 two weeks
after planting in the Fayette silt loam. The planter pots were placed
on racks in plastic lined trays containing one-inch of vermiculite to
absorb any runoff during watering. The trays were relined after each
crop was removed and the polonium contaminated soil was placed in
the radioactive waste.
The plants were irrigated with water containing a fertilizer mixture
injected into the greenhouse watering system. Table 3 l ists the nutr i
ents added to the water.
In addition to the plantings in polonium chloride and oxide contamin
ated Fort Collins silty clay loam, barley, radishes and peas were
planted in RaDEF ( 2 l 0 P b , 2 1 0 B i , and 2 1 0Po) contaminated Fort Collins
2 10
soil for comparison with the data for unsupported Po. The RaDEF
added to the soil was in nitrate form.
At maturity the control plants were harvested on different days
than the plants grown in contaminated soil to reduce the chance of
cross contamination. The plants were transported to the laboratory
in plastic bags.
Root crops were washed with a vegetable brush to remove all
visible dirt. Foliage was washed with cold water to remove any soil
or dust which may have accumulated. Samples were weighed to
obtain wet weights and dried at 100 C for 48 hours. Checks of the
dry weight with time demonstrated constant weight after 48 hours
Figure 1. Arrangement of plantings in Fayette silt loam.

00 ©

31
Table 3. Concentrat ion and chemica l form of plant nut r ien ts added to greenhouse i r r iga t ion water .
Chemical F o r m Concentrat ion
KNO3 6 m e q / l i t e r
C a ( N O s ) 2 3 m e q / l i t e r
MgS0 4 2 m e q / l i t e r
NH 4 NO3 1. 5 m e q / l i t e r
Na NO3 0 . 5 m e q / l i t e r
H 3 P O . 1.0 m e q / l i t e r
Borax 140 g rams /5000 gallons

32
of drying. The samples which weighed from one to five grams dry
weight were transferred to 500 ml Erlenmeyer flasks. The tissues were
digested using the methods for polonium analysis described by
Blanchard (1966). Twenty ml of 70 percent perchloric acid and 10 ml
of concentrated nitric acid were added and samples digested at 250°C.
For potatoes and barley stems a mixture of 20 ml of 70 percent pe r
chloric and 20 ml of concentrated HNO was more satisfactory. After
the samples were dissolved and oxides of nitrogen were no longer
evolved the temperature was raised to 400 C. The samples were
maintained at this temperature until the solutions were clear and dense
white fumes of HCIO. were present. The samples were neutralized
with 15 N NaOH using a methyl red-bromothymol blue indicator.
Eight ml of 12 N HCl were added immediately after the neutralization.
The samples were transferred with three water rinses to nursing
bottle plating cells. Distilled water was added to make up a 200 ml
0. 5 N HCl solution. The plating cells were placed in a st irr ing appara
tus - water bath for three hours at 85 C. Figure 2 illustrates the
water bath s t i r re r .
Using control plants or vegetable samples purchased at local gro
cery stores the chemical yield of the polonium assay method was
determined for each type of plant sample. The chemical yield was
2 10 determined by adding known amounts of PoC^ *° *^e ^ r v v eg e ta t ion.
Digestion and plating procedures remained as described above.

Figure 2. Water bath and stirring apparatus used for spontaneous deposition of 2 1 "Po .

00
1 ? l

35
The quantity of ^ l u P o spontaneously deposited on the nickel discs
was counted on one of three preflushed gas flow proportional counters.
One counter was reserved exclusively for counting control plant
samples. The average background of the counter was 0. 030 t 0. 004
counts per minute. The e r ro r expressed is one standard deviation
of the count rate. Low counting samples were counted to a minimum
preset count level to obtain a total standard deviation of the sample
count rate less background not to exceed t 10 percent.
Electrophoresis and Dialysis of Soil Solutions
Soil solutions for electrophoresis and dialysis were prepared by
adding one kilogram of air dried soil to two l i ters of distilled water.
The mixture was st irred for 48 hours and allowed to stand an additional
24 hours to permit settling. The solution was decanted and vacuum
filtered through a Whatman No. 41 filter paper. The solutions were
placed in refrigerated storage until used. Aliquots of solution used
for wetting electrophoresis paper or for dialysis were centrifuged for
20 minutes at 15,500 rpm (29,000 G) to remove any particles that may
210 have remained in solution. Soil solutions containing Po were p r e -
210 pared by stirring 40 g of soil in 80 ml of PoO„ suspension for 48
hours. The soil solution was decanted into centrifuge tubes. After
centrifugation, the soil solutions were placed in refrigerated storage or
used for electrophoresis or dialysis experiments.

36
The electrophoresis apparatus was a Warner Chilcott Model E-
800-2. The migration chamber has a water cooled migration table and
can be used for paper, gel, or thin layer electrophoresis. Experi
ments using the above apparatus were limited to paper electrophoresis.
Whatman No. 3M paper was cut into l" x 12" strips for use in the
electrophoresis experiments. The paper was marked for center and
marked every 0. 5 cm from center with light pencil marks along one
edge. The str ips were wet with centrifuged soil solution and the elec
trode buffer tanks filled with the same solution. After one hour, 0. 025
ml of the polonium contaminated soil solution was applied to the center
of the paper strip. The electrodes were connected and the safety
cover placed on the apparatus. After applying a potential of 500 volts
for one hour, the paper strips were removed and air dried. The paper
was cut into 0. 5 cm x 2. 5 cm strips and placed in 0. 5 N HCl in a
plating cell containing a nickel disc. The plating cell was placed in a
water bath shaker for five hours at 75 C. The nickel discs were
counted in a gas flow proportional counter. Seventy-nine percent of the
210 210
1 PoOp or Po in soil solution dried on paper str ips was recovered
in the above method.
Dialysis experiments were conducted with seamless regenerated
cellulose dialysis tubing. The tubing was cut to fit between the two
halves of a Chemical Rubber Company 25 ml dialysis cell. The cell
was constructed with two 25 ml volumes which were separated by the
37
cellulose membrane. Solution was added to each chamber by means of
a hypodermic syringe. The sample side of the cell was sealed with a
nylon screw plug. The access to the receiving solution on the other
side of the cell was through Luer-Lok Connectors. The membrane
was clamped into the cell and soil solution added to presoak the system
for 24 hours before use. The chambers were emptied and filled with
polonium contaminated soil solution in the sample chamber and soil
solution in the receiving chamber. The solution in the receiving
chamber was changed every four hours during a twelve hour period.
The solution was changed until less than 0. 5 percent of the total activity
in the system was detected in the receiving solution. The amount of
time required to reduce the amount of polonium passing through the
membrane into the receiving solution to 0. 5 percent was three to four
weeks. Each solution removed from the receiving side of the cell was
stored in a polyethylene bottle with 4 ml of 12 N HCl added. The
samples were plated onto nickel discs as previously described. At the
completion of an experiment the solution from the sample side of the
cell was removed and plated. Each chamber of the cell was rinsed
three times with 20 ml of 1 N HNO,. The acid washes and the membrane
were digested in 70 percent perchloric acid and 5 ml of concentrated
nitric acid. The samples were neutralized and plated onto nickel discs
210
in 0. 5 N HCl. The discs were counted for Po on a gas flow propor
tional counter.
38
Extraction of Plant Polonium and Separation
by Paper Chromatography
Wheat and spinach were grown in sand cultures contaminated with
210
PoO„. At maturity the plants were removed and extractions of
proteins or liquids were made immediately or the excess plant tissue
was frozen. The protein was extracted from the spinach or wheat
stems and leaves as described by Peterson and Butler (1962) and
Smith (1966). The plant tissue was boiled in 100 ml of 95 percent
ethanol and 5 percent 6 N HCl for 15 minutes. The ethanol was eva
porated by boiling on a steam bath. The dry deposit was removed and
50 mg transferred to 10 ml of 6 N HCl. Acid hydrolysis of the extract 210 was carried out in a boiling water bath for 40 hours. PoO„ sus
pension was added to 10 ml of 6 N HCl and digested in a boiling water
bath for 40 hours and used as a control sample. The solutions were
used with paper chromatography to separate the amino-acids and
peptides resulting from hydrolysis of the proteins.
Ascending paper chromatography was used with an n-butanol,
acetic acid, water solution (120 ml n-butanol, 30 ml acetic acid and
50 ml water). Chromatograms were made on 30 cm x 25 cm sheets.
The sheets were lightly pencil marked one inch in from a 30 cm border
to mark the origin. Spots of 0. 0 1 ml of digested plant extract and 210 digested P°Op w e r e dried one inch apart on the pencil line and the
sheet was stapled together to form a cylinder 25 cm high.

39
A chromatography chamber was made from a 4-liter beaker. The
walls of the beaker were lined with filter paper saturated with the
liquid phase and 50 ml of solution were added to the beaker. The
cylinder of paper was set in the solution with the origin at the bottom
and a parafilm cover sealed the beaker and prevented evaporation.
Ascent of the liquid phase required four hours to move 15 cm, then the
chromatograph was removed and dried in an oven at 100 C. A 0. 1
percent ninhydrin -acetone solution was sprayed on the chromatograph
after drying. Amino acids formed violet or pink spots on the chromato
graph after 24 hours. The dye spots were measured to determine the
distance the amino acids moved from the origin. The paper was cut
into one cm strips measured from the origin and each paper strip
placed in a plating cell containing 100 ml of 0. 5 N HCl and a nickel
disc. The disc was counted in a gas flow proportional counter.
E r ro r s
Experiments using radioactive materials in biological systems are
subject to systematic e r ro r s in laboratory measurements. Biological
variation between individuals and the randomness of radioactive decay
are e r ro r s which are inherent in the systems. Statistical methods
were used to estimate the variation in average values introduced by
these e r ro r s .
Systematic e r ro r s may enter into each sample measurement and
transcription of the data. An instrument may be read incorrectly, or

40
used incorrectly and part of the sample may be lost by transfer opera
tions and chemical operations. E r r o r s in laboratory measurements in
this study were minimized by use of calibrated balances for weights and
calibrated glassware for reagent volumes. Each chemical determina
tion was calibrated for chemical yield. Data were checked for mathe -
matical and transcription e r r o r s , but it is possible some were included
in the observations used. Mathematical e r ro r s were minimized by use
of computer programs for calculations of individual and averaged
sample data. The programs written for the data processing are in the
Appendix.
Biological variations are due to the differences between individuals
and the differences that may exist in their growth environments. Bio
logical variation between individual plants were minimized by use of
the same seed supply for most species throughout the study. Excep
tions were the use of Kennebec potatoes in the Fayette planting and the
use of Scout, a winter wheat variety, in the 2 1 0 P o C l 4 planting. Green
house conditions stablized the temperature and humidity environments
of the plants. However, small variations of the physical environment
may have existed over the length of the greenhouse bench. The biologi
cal variation introduced a source of accidental or indeterminate e r r o r s .
The use of nuclear counters to determine the concentration of 2 1 ^Po
in each sample introduced a source of e r ro r s because of the random
disintegration of radionuclides. Overman and Clark (1960) discussed

41
the application of the Normal distribution law and the associated s ta t is
tics to radioactive decay. Their methods were used to determine the
number of counts that were reasonable to accumulate for minimum
er ro r . Samples in the experiments were counted for a maximum er ro r
of 5 percent standard deviation of the net count rate in the case of 210 plants grown in soils with added Po. Control plant samples were
counted until a 10 percent standard deviation of the net count rate was
attained. The total uncertainty added to the uncertainty of the transfer
coefficients because of nuclear counting was a maximum of 5 percent.
210 The contribution of e r ro r s in the control plant Po content were
small because the activities of the plant materials grown in soils con
taining polonium were 10 to 1000 times greater than the control plant
t issues.
Each sample measurement contains the systematic and accidental
e r ro r s discussed above. Because the indeterminate sources of e r ror
are random, an estimate of the e r ror in an average value is the
Standard Er ro r (S. E. ) . The e r ro r s expressed for the average distribu
tion coefficients, the average transfer coefficients and the average
210
Po contents of plants and soils are Standard E r r o r s . Texts by
Snedecor and Cochran (1967) and Draper and Smith (1966) were con
sulted for statistical methods.
CHAPTER IV
RESULTS AND DISCUSSION
Equilibrium Distribution Coefficients (K^)
The equilibrium distribution coefficients for two different soils
were determined with PoCl . solutions and PoO- suspensions. Polo
nium oxide would be the chemical form expected from burn-up of a
SNAP radioisotope generator but polonium chloride, the more common
laboratory form, can be stored and handled in solution with more con
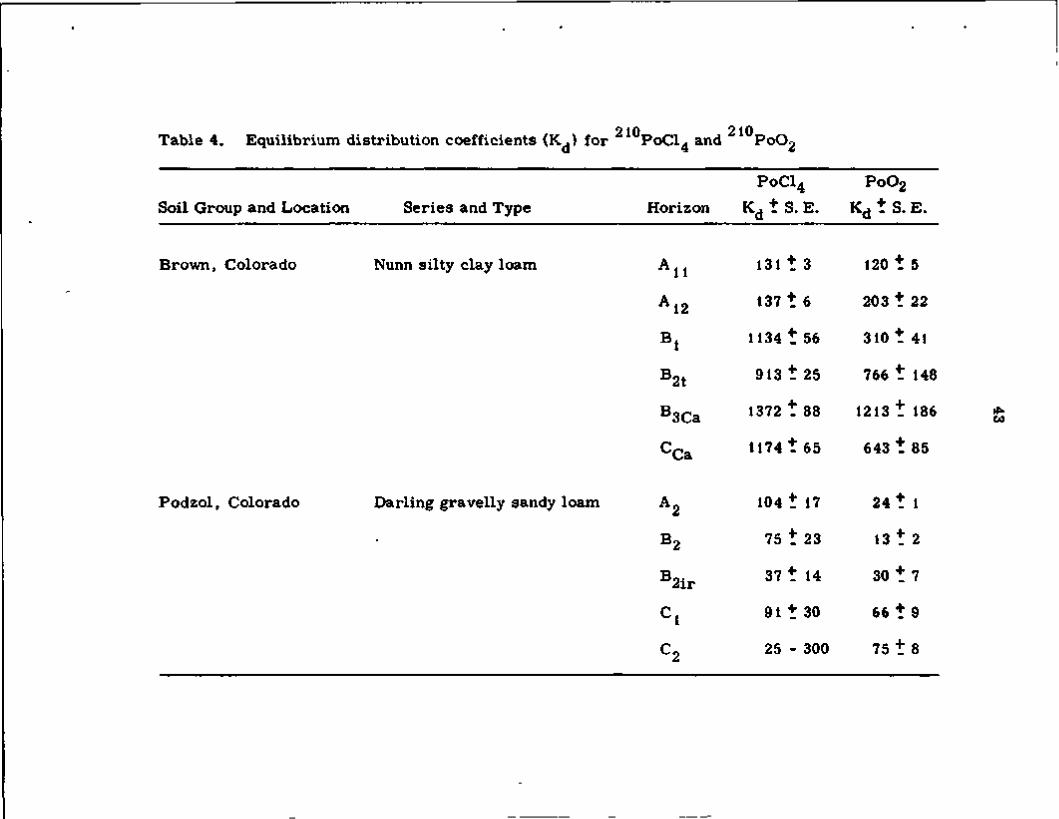
venience. Table 4 l ists the K , ' s which were determined using both
chemical forms with Nunn silty clay loam and Darling gravelly sandy
loam. The distribution coefficients determined for the Nunn ser ies
with polonium oxide suspension did not differ greatly from K, ' s deter
mined with polonium chloride solutions. However, for the Darling
ser ies soil, K, for the top soil layer changed from 104 for polonium
chloride to 24 for polonium oxide suspension. Therefore, other r e
ported distribution coefficients were determined using polonium oxide
suspensions. Table 5 l is ts the distribution coefficients for soils from
the Brown, Brunizem, Gray-Brown Podzol, Ground-Water Podzol,
Lateri t ic , Podzol and Red-Yellow Podzol Soil Groups.
The dependence of Kd on the number of hours of contact between
the soil and polonium oxide suspension is plotted in Figure 3 for Nunn
silty clay loam. A stage of equilibrium was reached after 16 hours
210 210 Table 4. Equil ibrium distr ibution coefficients (K . ) for P o C l 4 and P o 0 2
Soil Group and Location Ser ies and Type Horizon P o C l 4
Kd t S. E. P o 0 2
K J _ S. E.
Brown, Colorado Nunn si l ty clay loam 11
12
'2t
>3Ca
Ca
131 t 3
137 t 6
1134 t 56
913 t 25
1372 t 88
120 t 5
203 t 22
310 t 41
766 t 148
1213 t 186
1 1 7 4 t 6 5 643 t 85
Podzol , Colorado Darl ing gravelly sandy loam
>2ir
104 t 17
75 t 23
37 t 14
91 + 30
25 - 300
24 t 1
13 t 2
30 t 7
66 + 9
75 t 8

210, Table 5. Equilibrium distribution coefficients (Kd) for P o 0 2
Soil Group and Location Series and Type* Horizon
Brown, Colorado
Brunizem, Iowa
Fort Collins silty clay loam
Dins dale silty clay loam
Muscatine silty clay loam
Gray-Brown Podzol, Fayette silt loam Wisconsin
Lapeer loam
Ground Water Podzol, Adamsville Florida
Blanton
Kd t S. E.
Greenhouse mixture 230 + 30
A B C
A B C
A p
B l B21 B 2 2 B 2 3 C l
A P B 2 1 B 2 2 B 3 C l
A l
A ,
1030 + 976 t 723 t
1136 + 968 t
1830 +
970 + 122 t 92 t
597 t 80 +
772 t
192 t 206 t 508 + 814 + 275 +
26 t
35 +
49 127 83
118 32 210
160 3 3 55 2 29
26 11 34 42 9
2
3

Table 5. , concluded
Soil Group and Location Ser ies and Type Horizon KH t S. E.
Podzol , Wisconsin
Red-Yellow Podzol , Alabama
Lakeland
Leon
Ruskin
Gogebic sandy loam
Onaway fine sandy loam
Amite
Congaree
Independence
Wickham
A l A 2 B n C
A l
•^ir B i r h B3
A 2 B i r h Cl
25 + 2
17 + i 15 t 0 .6 55 + 17 77 + 29
17 + 1
254 + 22 371 t 36 137 + 5 242 t 25
227 + 20 412 t 150
2248 + 1200 7020 t 3600
76 + 11
405 + 28
188 t 15
49 + 3
en
L a t e r i t i c , P u e r t o Rico 137 + 12

Figure 3. The change of distribution coefficient with mixing time for Nunn silty clay loam, A . horizon.

47
10 20 TIME OF MIXING IN HOURS

48
of mixing. Twenty hours of mixing were used for the distribution
coefficients listed in Table 5.
Figure 4 is a plot of the distribution coefficient versus the initial
concentration of polonium in suspension added to the soil sample. A
least squares fit indicates that the slope of the line is statistically
zero with 95 percent confidence, i . e . the distribution coefficient is
constant if determined with polonium oxide suspensions containing
between 900 to 23,500 dpm/ml. The distribution coefficients for the
soil samples in the study were determined with suspensions concentra
tions between 10,000 and 20,000 dpm/ml. 2 10 Distribution coefficients of the soil mixtures used for the P o 0 2
uptake study in the greenhouse were 230 + 30 for the Fort Collins silty
clay loam and 303 + 21 for the Fayette silt loam. The distribution
coefficients were determined using the soil, sand and peat moss mix
tures. The 95 percent confidence intervals of the mixtures were 160 -
301 for the Fort Collins silty clay loam and 253 - 353 for the Fayette
silt loam. The confidence intervals overlap; therefore, the distribution
coefficients of the two soil mixtures were statistically equal. The d is
tribution coefficient of the Leon sandy loam used for greenhouse experi
ments was 17 + 1.
Predictive equations for the distribution coefficient were developed
using the laboratory soil data of cation exchange capacity, percent
organic matter , pH, and mechanical analyses. The data were entered
/

Figure 4. The distribution coefficients of Nunn silty clay loam, A horizon determined with increasing concentrations of 2 1 0poO 2 in suspension.

50
* 200-I-UJ
g 160-
o 120-
§ \
m 80-cr I -
40-
8 12 16 — i — 20
—r-24
INITIAL 2 ,°Po02 ADDED, dpm/ml XIO3

51
into a Stepwise Multiple Regression Computer Program with the dis
tribution coefficient considered the dependent variable. Dixon (1965)
published a set of computer programs for regression analyses which
includes the Stepwise Multiple Regression. The soil parameters of
pH, cation exchange capacity, percent organic matter , percent silt
and percent clay were considered independent variables. The first
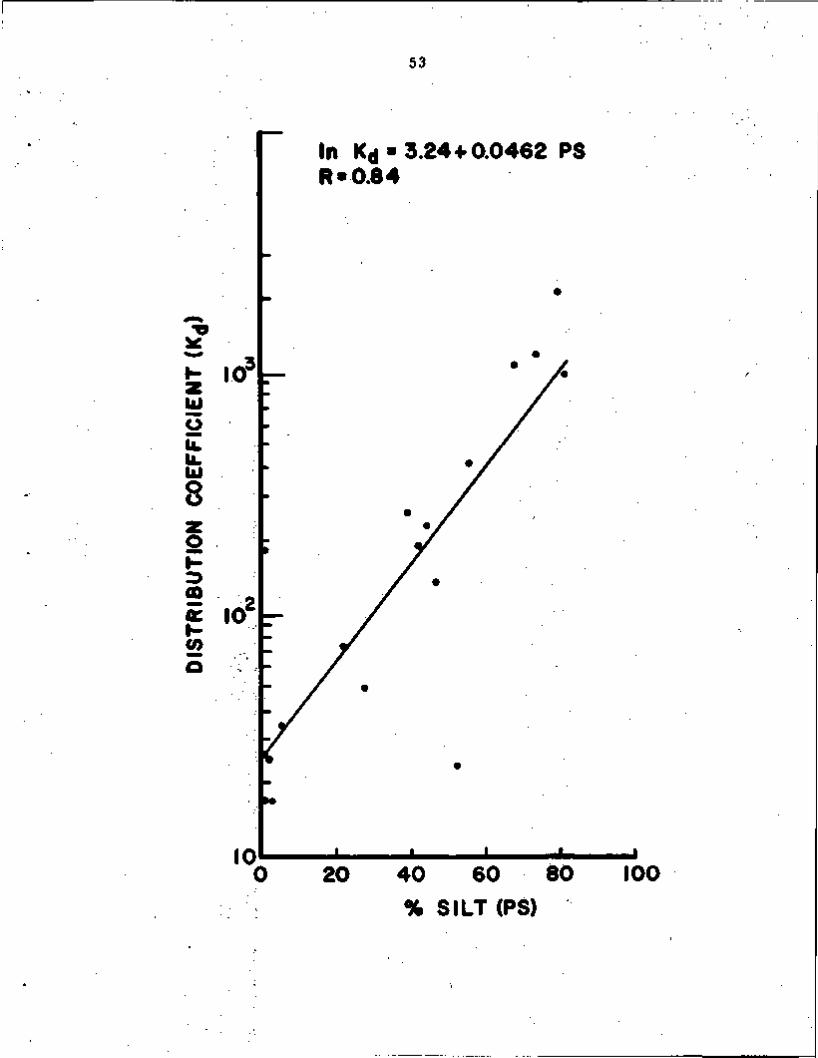
model used the data for the A horizons from 18 agricultural soil ser ies .
The statistical analysis indicated that an equation in terms of percent
silt would predict the natural log of K J . The empirical equation was
In Kd = 3.2 + (0. 046 + 0. 007) (Percent Silt) (1)
with a correlation coefficient, r , of 0. 84. The data and equation are
plotted in Figure 5.
The second model which included the data for the B and C horizons
indicated1, a In K^ which was dependent upon the pH and silt content of
the soil. The empirical equation was
In Kd = - 1.3 + (0. 034 t 0. 007)(Percent Silt) + (0. 88 + 0. 20) pH (2)
with r = 0. 74.
In most soils the ion exchange properties are usually associated
with the clay fraction. Excluding the percent silt data from the input
data for the Stepwise Multiple Regression Program computed an equa
tion in terms of pH and percent clay for the A, B and C soil horizons.

Figure 5. The distribution coefficients of 18 top soils versus the silt content of the soil. The line is the least squares fit of the data.
53
In Kd - 3.24 + 0.0462 PS R-0.84
UJ o u. u. UJ o o
I.or
GQ — 2 oc 10 CO
10 J. 20 40 60 80
% SILT (PS) 100

54
The equation was
l n K d = - 1.05 + (0.063 t 0.02l)(Percent Clay) + (0.87 t 23) pH (3)
with r = 0. 65 which is lower than the multiple correlation coefficient
of the model in terms of silt and pH. In the top soils the correlation
between In Kd and clay content was not statistically significant.
The lack of a correlation between the cation exchange capacity of
the soil and the distribution coefficient suggests the polonium oxide is
physically adsorbed. The correlation of the silt content of the soil with
the adsorption of polonium may be explained by the behavior of polo
nium in water. Bagnall has reported the formation of an insoluble
polonium hydroxide in neutral water solutions. The formula has been
reported as Po(OH)4 or PoOfOH)^- Ziv and Efros have calculated the on
solubility product of Po(OH)4 as 10 . Haissinsky observed polonium
as a radiocolloid in solutions with pH's above 3;. these solutions were
very sensitive to impurities. The polonium was adsorbed on the im
purities as a function of pH. Further , Thomas and Stannard demon
strated that 95 percent of the particles in a neutralized aged PoCU
solution were greater than 0.42 microns. The low solubility of the
hydroxide, the adsorption of radiocolloids on solid materials as a func
tion of pH and the particle nature of polonium suspensions would suggest
the adsorption of polonium on silt or clay may be controlled by soil pH
and the size of the radiocolloidal particles.

55
2 10 Table 6 l ists the change in PoC^ distribution coefficient with
change in soil particle size for a sample of the C c horizon of the
Nunn silty clay loam. The K, increased with decreasing particle
size for particles to 2 microns indicating increased adsorption with
greater surface area per gram. However, the K, of particles less
than 2 microns (clay) was the same as the 5 - 2 micron range of
particle sizes. The change of K^ with particle size ranged from 457
to 950 for the silt and clay fractions indicating strong adsorption of
210
PoOg in both fractions. The equations derived from the K, data
for the A, B and C soil horizons suggest either the silt or clay con
tents, in addition to soil pH, control the distribution coefficient of the
CQ horizon. Agreement between the two methods suggests the
empirical equations may be used for predicting distribution coefficients
in other soils. 210 Equation (1) will broadly predict the soil retention of PoC*2 *n
agricultural top soils. Equation (2) based on data from all soils and
soil horizons would be useful for predicting adsorption of polonium in
widely differing soils. Soil groups which were not included in the
study were Chestnut, Chernzems, Desert soils and Lithosols and the
Intrazonal and A zonal soils. Goldberg, Fosberg, Sachet and Reimer
(1965) report that 23. 9 percent of the land mass of the earth is exposed
rock and Lithosol type soils. The equation developed from the distribu
tion coefficients for the combined data of the A, B and C soil horizons

56
Table 6. 2 i 0 P o oxide distr ibution coefficient a s a function of pa r t i c l e s ize (Nunn si l ty clay loam Horizon C ^ a ) .
P a r t i c l e Size Range (microns) K d
> 50 (2.00 + 0.59) x 102
50 - 20 (4.57 + 0.93) x 102
2 0 - 5 (6 .98 t 2.62) x 102
5 - 2 (9. 50 + 0.45) x 102
< 2 (9.00 + 1.90) x 102

57
should predict the K , ' s of soils that fall within the soil parameters
defining equation (2). The pH range of the soil samples included in
equation (2) was from 4. 6 to 8. 4 and the silt contents varied from less
than 1 percent to 80 percent.
The distribution coefficient of a soil may not be predicted by the
equations if chelates are included in ferti l izers applied to agricultural
soils. The behavior of polonium in soils containing chelates was not
studied. Lindsay and Norvell (1959) demonstrated that the metal
chelate complex is governed by soil pH and other ions in the soil solu
tion competing for the ligand. Experiments to determine the change,
210 if any, of the distribution coefficients for Po in the presence of
chelates are needed.
Elution of Polonium from Soil Columns
Movement of polonium dioxide through soil columns by water
elution was studied in the Nunn silty clay loam, Darling gravelly sandy
loam and Leon sandy loam soil samples. The column length for each
sample was equal to the depth of the horizon of the soil where it was
sampled. The top three horizons of the Nunn ser ies each retained
more than 98 percent of the added activity in the first two cm when
eluted with one mean annual rainfall (13. 5 inches of water). Distribu
tion coefficients of the three soil horizons predict very strong retention
by each horizon. The K, of the A ^ horizon was 120, the A 1 2 horizon

58
203, the B. horizon 310. The column data for the Nunn soil is in
Table 7. Only 0. 6 percent of the total activity placed on top of the A . .
soil column was detected in the eluate. The A „ and B. horizons had
strong retention indicating that the polonium oxide deposited on this
soil type would be retained in the first 30 cm of soil with greater than
98 percent retained within the first 2. 5 cm of soil.
Table 8 contains the column data for the Darling gravelly sandy
loam which has distribution coefficients under 100 indicating the polo
nium oxide is not strongly adsorbed. The soil is covered by a litter
layer consisting of roots , pine needles and mosses. Any polonium
deposited on the watershed (Fraser Alpine Area, Colorado) would have
to percolate through this organic material . An 8 cm column of the
litter layer eluted with one mean annual rainfall of 18. 6 inches retained
only 20 percent of the polonium oxide with 80 percent of the activity
collected in the eluate. Elution of polonium oxide through the A„ hor i
zon, the first soil layer, carried 5 percent of the activity through a
7 cm column. Analyses of the column sections indicated a large f rac
tion of the polonium had moved through the soil. Although 43 percent
of the polonium remained in the top cm of the column, the third cm of
the column contained a chromatographic peak representing 32 percent
of the total activity applied to the top of the soil. Additional elution
2 10 with water would carry the Po in the chromatographic peak deeper
into the soil column.

59
Table 7.J Elution of polonium oxide through soil columns*
Soil Group - Brown Ser ies - Nunn Silty Clay Loam
Horizon K d Depth (cm) P e r c e n t of total 2 1 0 P o
A u 170 1 97 .3
2 1.2
3 0 .6
4-8 0 . 3
Eluate 0 .6
A 1 2 260 1 98 .8
2 0 .8
3 0 .2
4-12 0 .2
Eluate < 0 . 1
B{ 341 1 99 .7
2 0 .2
3-10 <;0. 1
Eluate Background
Eluted with one mean annual rainfall a t the r a t e of 1-2 m l / h r .

60
Table 8. Elution of polonium oxide through soil columns
Soil Group - Podzol Ser ies - Darl ing Gravel ly Sandy Loam
Horizon K Depth (cm) P e r c e n t of total 2 1 0 P o
Li t t e r l aye r 1
2
3
4
5
6
7
8
Eluate
14.0
1.8
0 .5
1.0
1.0
0 .8
0 .8
0.6
80 .0
24 1
2
3
4
5-8
Eluate
42 .8
12.0
32 .4
3.6
4 .2
5.0
13 1
2
3
95.6
1.4
0 .8

61
Table 8. , concluded.
Horizon K, Depth (cm) P e r c e n t of total 2 1 0 P o
4
5-12
Eluate
0 .4
1.3
0 .5
>2ir 29 1
2
3
4
5-10
Eluate
95. 1
1. 1
0.6
0 .2
1.0
2. 1
* Eluted with one mean annual rainfall at the r a t e of 1-2 m l / h r .

62
Elutions and analyses of columns of the next two soil horizons are
also listed in Table 8. Both horizons indicate strong retention of the
polonium with a small fraction escaping in the eluate. The movement
of the polonium oxide through the litter and first three soil horizons
would allow only approximately 10 of the total activity to reach the
C horizons. However, the movement of water in a watershed soil is
not usually perpendicular to the soil horizons but is a function of the
slope, rainfall intensity or snow melt rate .
An experiment peripheral to the column experiments was con
ducted with the Darling gravelly sandy loam. The complete
description of the experiment will appear in Health Physics.
Polonium oxide suspension was applied to the litter layer as a 200 yCi
point source one meter from water collection vessels at the base of a
30 percent simulated slope. Cores from the soil on which one mean
annual rainfall (18.6 inches) of ice was melted indicated both vertical
210 and horizontal movement of the PoO into the soil. The run-off
water collected at the base of the experimental slope indicated only -7
10 of the original activity moved through the soil. Data from soil
cores were used to predict the movement of a uniform deposition of
2 10
PoO„ to a stream. The equations derived indicated that only the
first 50 cm bordering a stream would contribute significant contamina
tion to the water. The quantities deposited on surface waters would be
more significant. /

63
Elution of a 7 cm column of Leon sandy loam A horizon indicated
18 percent of the added polonium oxide was moved through the column
by one mean annual rainfall of 55 inches of water (Table 9). The frac
tion of the total activity retained by the first cm of the column was 76
percent. Comparison of the activity eluted from columns of equal
lengths of Darling gravelly sandy loam (K, = 25) and Leon sandy loam
(Kd =17) indicated 5 percent of the activity was eluted from the former
and 14 percent of the total was removed from the latter by equal volumes
of water.
The eluate collected from the fraction collector was examined for
chromatographic peaks moving through the soil. Each column indi
cated a prompt pulse of activity that arrived with the water at the
bottom of the soil column. The pulse contained 0. 2 percent of the
activity placed on the Nunn silty clay loam column, 3. 3 percent of the
activity placed on the Darling gravelly sandy loam and 8. 3 percent of
the activity placed on top of the Leon sandy loam column. The r e
maining eluate collected from each column contained decreasing
amounts of activity with each additional aliquot and no chromatographic
peak was observed passing through the soil into the eluate. However,
the amount of water passed through each column (one mean annual ra in
fall) may not have been sufficient to elute adsorbed forms of polonium
signifying the distribution coefficient in each soil was substantial. The
major portion of the polonium dioxide deposited on soils with K , 's of

64
Table 9. Elution of polonium oxide through soil columns
Soil Group - Ground-Water Podzol Ser ies - Leon Sandy Loam
Horizon K. Depth (cm) P e r c e n t of total 2 1 0 P o
17 1
2
3
4
5
6
7
8
Eluate
76.2
1.3
1. 1
1. 1
0 .8
0 .6
0 .4
0 .2
18. 3
Eluted with one mean annual rainfall a t the r a t e of 1-2 m l / h r .

65
17 or greater would be retained in the top layers of soil. Movement
to a water table or aquifer would be minimal.
Natural Polonium-210 Content of Soils
The natural 2 1 ^Po contents of 17 top soils and 9 profiles were
determined. The greatest amount of polonium detected in top soil was
3. 47 t 0. 64 pCi/g and the least amount in top soil was 0. 22 + 0. 02
pCi/g. Table 10 contains the data for soils examined from Alabama,
Colorado, Florida, Iowa, Puerto Rico and Wisconsin. The range of
2 10
Po in top soils represents six soil groups. The average concentra
tion in each soil group is listed in Table 11. The average concentrations 210 indicate the distribution of Po in soils is uniform for the soil groups
tested. The range of concentrations indicate specific soil ser ies may 210 have characteristics that increase or decrease the Po content.
The natural levels of polonium detected in the soil samples were
in the same range of values reported by other investigators. Tso, 2 10 Hallden and Alexander reported the range of Po activity in eastern
U. S. tobacco growing soils as 0. 26 to 1.01 pCi/g. Berger et al.
reported an average of 2. 03 pCi/g of soil for mineral soils sampled in
Wisconsin. Francis et aL reports a higher average value of 3. 1 pCi/g
for Wisconsin soils. However, Francis et al. used a HgSO^-HClOg-HF
decomposition of the soil rather than a 12 N HCl leaching process.
210 Decomposition of the soil minerals for determination of the Po content would release polonium trapped in crystal structures.

Table 10. Natural polonium-210 content of so i l s .
Soil Group and Location Ser ies and Type Horizon 210 P o in pCi /g t S. E.
Brown, Colorado F o r t Collins sil ty clay loam
Nunn sil ty clay loam
Podzol , Colorado Darl ing gravel ly sandy loam
Podzol , Wisconsin Gogebic sandy loam
Podzol , Wisconsin Onaway sandy loam
11 A l l A i 2 Bi B 2 t B 3 C a C C a
A 2 B 2 B 2 i r Cl c2
B P B i r B i r h B 3 x Cl
A 2 B Cl c2
0.48 +0 .03
0.90 + 0 .04 0 .94 + 0 .04 0.67 t 0 .08 0 .58 t 0 .03 0 .65 t 0 .02 0 .71 t 0 .03
0.22 t 0 .02 0.22 t 0 .04 0 .64 t 0.06 0 .43 + 0 .05 0.59 + 0 .05
1.53 t O . 16 0 .33 t 0 .05 1.00 + 0. 10 0 .23 + 0 .01 0. 17 t 0 .01
0.60 + 0 .02 0 .42 + 0. 16 0. 26 + 0.02 0. 16 t 0 .01
0> ON

Table 10, continued
Soil Group and Location Ser ies and Type Horizon 2 l 0 P o in pCi /g + S. E.
Gray-Brown Podzol , Wisconsin
Fayet te si l t loam
Gray-Brown Podzol , Wisconsin
Lapeer loam
Brun izem, Iowa
Red-Yellow Podzol , Alabama
Dins dale sil ty clay loam
Muscat ine, si l ty clay loam
Amite
Congaree
A P B i B 2 1 B22 B23 B 3 Cl
A p B 2 1 B 22 B 3 Cl
A B C
A B C
A
A
1.48 t 0.06 0 .68 + 0. 12 0.86 t 0.02 0 .83 t 0 .05 1.01 t 0. 14 1.33 t 0.37 1.27 + 0 .24
1.56 + 0.09 0.26 t 0 .05 0 .77 + 0. 17 0 .43 + 0 . 0 8 0. 45 t 0 .05
1.61 + 0 .33 0 .78 + 0. 16 0 .41 + 0 .05
1.54 + 0.30 1. 11 t 0 .08 1.91 + 0 .74
0 .78 + 0.26
3.47 t 0 .64
ON
Independence A 0 .63 t 0.02

Table 10, concluded
Soil Group and Location Ser ies and Type Horizon 210 Po in pCi /g + S. E.
Ground-Water Podzol , Flor ida
Wickham
Adamsvi l le
Blanton
Lakeland
Leon
Ruskin
A
A
A
A
A. A. B; C
A
■"n
1.47 + 0.31
0.46 t 0.07
1.35 t 0.29
0.89 t 0.31
1. 47 + 0.38 0.29 + 0.05 0.33 t 0. 14 0. 15 + 0.09
1.98 t 0.27
ON 00

2 10 Table 11. Average Po content of soi ls from each soil group.
210 Number of Po Content Range of Soil Group and Location Ser ies Sampled (pCi/g t S . E . ) 2 l 0 P o Content
Brown, Colorado 1 0.90 t 0 .04
Brun izem, Iowa 2 1.57 + 0 .33 1 . 5 4 - 1 . 6 1
Gray-Brown Podzol , 2 1.51 t 0.09 1 . 4 7 - 1 . 5 6 Wisconsin
Ground-Water Podzol , 5 1.23 + 0.35 0 . 4 6 - 1 . 9 8 S
F lo r ida
Podzol , Colorado, Wisconsin 3 0 .78 + 0.16 0.22 - 1.53
Red-Yellow Podzol , 4 1.59 + 0 .31 0 . 6 3 - 3 . 4 7 Alabama
}

70
The source of 2 1 " P o in soi ls i s the radioact ive decay of 2 3 ° U
2 10 which decays through s e v e r a l radioisotopes to form P o . Because n i n 2 ^ 8
Po i s formed from decay of U, the polonium content of so i l s
would be expected to c o r r e l a t e with the uranium content of so i l s .
Invest igat ions of soi ls for cor re la t ion between 2 3 ° u and 6 R a , a
210
radionucl ide formed in the decay chain before P o , indicate no c o r
re la t ion exis ted in the r e p o r t s reviewed by Osburn. The lack of
cor re la t ion was a t t r ibuted to the chemical differences of uranium and
rad ium. Te l fa i r , G a r r i s o n and Smith (1960) observed that radium was
not in equi l ibr ium with i t s long lived p a r e n t s because of soil leaching and weathering p r o c e s s e s .
226 210 Cor re la t ions between Ra and P o concentra t ions in soil only
210 broadly pred ic t the P o content. Tso et a l . m e a s u r e d the rad ium o p t 91n and polonium ac t iv i t ies of the same so i l s . Ratios of Ra / Po
calculated from the values r epor t ed by T s o et a l . range from 1. 1 to
2 1 0 226
3 . 3 . They concluded Po is not in equi l ibr ium with Ra because
2 2 R n generated in the soil i s par t ia l ly t rapped in soil or e scapes to
the a i r .
Radon-222 decaying to i t s daughter products e i ther in a i r or soil 210 910
l eads to the formation of u P b and P o . Radon daughter products
at tached to a i rbo rne pa r t i c l e s may r e su l t in fallout that i s in te rcepted
by plants o r r e t u r n to the top soi l .

71
Study of the Polonium Species in Soil Solution
Investigations of soil solutions from 2 1 ^ P o 0 2 contaminated soil
indicated a small amount of the polonium oxide remains in solution
as a soluble or suspended chemical species. Electrophoresis and
dialysis were used to investigate the movement of the species in an
electric field and through a semi-permeable membrane.
Paper electrophoresis of an aqueous suspension of polonium oxide
placed on a paper strip saturated with Nunn silty clay loam soil solu
tion is plotted in Figure 6. Application of 500 volts across the paper
strip for one hour moved about 10 percent of the total polonium 4. 5 cm
toward the positive electrode. Soil solution containing polonium in
equilibrium with the Nunn silty clay loam was applied to a paper strip
saturated with the same soil solution. Application of 500 volts for one
hour resulted in movement of polonium toward both the positive and
negative electrodes indicating the presence of negatively and positively
charged species. Figure 7 is a plot of the data indicating the fraction
of the total polonium that moved toward each electrode. In this case
there was a greater amount of polonium that moved in the electric
field. To confirm that the electric field had caused the movement, a
paper strip was prepared in the same manner, but no electrical
potential was applied. Figure 8 indicates the results of the experiment
Only 2 percent of the total activity applied moved after one hour; the
movement was to the next 0. 5 cm. Figures 9, 10 and 11 contain the

Figure 6
L

73
PAPER ELECTROPHORESIS OF STOCK PbCfe IN BROWN SOILGROUR NUNN SILTY CLAY LOAM, LEACHATE SOIL SOLUTION pH 8.4 OPERATION TIME I HOUR AT 500V, 4 MA
CEN
TER
P 7-
®
c
£ § 0.6 s!
o 04 CM
fc
§ Q2
*^ o
-
.
! . nn_i__ . 8 - 6 - 4 - 2 0 42 +4 4-9 4-6 +8
TOWARD NEC ELECTRODE « | * TOWARD POS ELECTRODE CM. OF ION MOVEMENT FROM CENTER

Figure 7

PAPER ELECTROPHORESIS OF PoOg SOIL LEACHATE BROWN SOIL GROUR NUNN SUY CLAY LOAM A,, HORIZON SOIL SOLUTION PH 78 OPERATION TIME I HOUR AT 500 V, 5MA
UJ
o I -< a ui o <
1.0
08
06
£ CM 04 ~ 5 p u. o z o
02
COO < cc
L _L -L ± -cdCL j . X Tn-TK, -8 -7 -6' - 5 - 4 - 3 - 2 - 1 0 t| *2 *3 t4 *5 *6 *7
TOWARD NEG. ELECTRODE 4(► TOWARD POS ELECTRODE CM. OF ION MOVEMENT FROM CENTER
♦8

Figure 8

77
TEST FOR DIFFUSION OF Po02 SOLUTION
Po02 SOLUTION ON PAPER STRIP FOR I HOUR NO POTENTIAL DIFFERENCE
UJ o
o UJ 3 8-<M
u. o
< or
I.U
0.8
0.6
0.4
0.2
n
■
•
- 4 -3 -2 -S 0 +1 +2 43 44
TOWARD NEG. ELECTRODE <\> TOWARD POS.ELECTRODE
CM. OF ION MOVEMENT FROM CENTER

Figure 9

cc UJ I -
UJ o
Q UJ U <
<
o I -u. o
o < a:
PAPER ELECTROPHORESIS OF2'°Po02 SOIL LEACHATE BROWN SOIL, FORT COLLINS SILTY CLAY LOAM SOIL SOLUTION pH 7.6 OPERATION TIME Ihr. AT 500V 5ma
0.85
0.84 1 0.07 0.06
0.05
0.04-
0.03 -
0.02
0.01
0.85
0
r i m r r fTvnJ I hiTlTiTrTTLnTn fT -12 -10 -8 -6 -4 -2 0 2 4 6 8 10 12
TOWARD-ELECTRODE^j-^-TOWARD + ELECTRODE
CM OF ION MOVEMENT FROM CENTER
CO

r
Figure 10

PAPER ELECTROPHORESIS OF 21 ^ o 0 2 SOIL LEACHATE
CL UJ t -
UJ o \-< o UJ o <
Q.
o I -
0.83-
0.82-
0.07
0.06
005
0.04
0.03
P0DZ0LIC SOIL, GOGEBIC SANDY LOAM SOIL SOLUTION pH 6.6 OPERATING TIME Ihr AT 500V 5mo
O 0.02-
< 0.01
U t-**
J L ~ri
00
I rTT-n- i - rw~ -12 -10 -8 -6 - 4 -2
TOWARD - ELECTRODE ^ ~ 2 4 6 8 10 12
TOWARD ♦ ELECTRODE CM OF ION MOVEMENT FROM CENTER

Figure 11

PAPER ELECTROPHORESIS OF 210. Po02 SOIL LEACHATE
PODZOLIC SOIL, ONAWAY FINE SANDY LOAM SOIL SOLUTION pH 6.8 OPERATING TIME Ihr. AT 500V 5ma
or UJ h-UJ
o I -< o UJ o < - j a. < o i -u. o
0.35-1
0.34 D 0.06
0.05-1
0.04
0.03-1
o 0.02-
< 0.0H or *Jf ml
oo
tflh, iT-rTh-Th-i -12 -10 -8 -6 -4 -2
TOWARD- ELECTRODE ^~ 2 4 6 8 10 12
TOWARD + ELECTRODE CM OF ION MOVEMENT FROM CENTER

84
plots of the data from PoO contaminated Gogebic sandy loam, Fort
Collins silty clay loam and Onaway fine sandy loam soil solutions.
Electrophoresis experiments indicated charged species of polo-2 10 nium remain in soil solution after mixing P o 0 2 suspensions with
soil samples. Positive and negative species of polonium were ob
served in the soil solutions tested. Polonium detected at the origin 210 following electrophoresis may be a neutral species or Po strongly
adsorbed by the paper s tr ips. In the Nunn, Fort Collins and Gogebic
ser ies the predominately charged species were negative. The major
species in the Onaway ser ies were positive.
210 The predominately positive Po species in Onaway ser ies soil
solution may exist because of the low cation exchange capacity (C. E. C.)
and low organic matter content of the soil sample. The Onaway ser ies
contained 2. 4 percent organic matter and the C. E. C. was 5. 1 meq/
100 g. The Gogebic ser ies sample contained 4.0 percent organic
matter and had a C. E. C. of 16. 8 meq/100 g. The pH of the Gogebic
loam was 6. 6 compared to 6. 8 for the Onaway fine sandy loam. The
low C. E. C. and organic matter suggest an abundant supply of cations
may exist in the Onaway soil solution. Haissinsky and Weigel noted
that the radiocolloidal form of polonium is most prevalent at pH 6.9.
If the radiocolloidal form were surrounded by positive ions, it may
form a species able to move toward the negative electrode during elec
trophoresis.

85
Experiments using dialysis of the polonium contaminated soil solu
tion on one side of a semi-permeable membrane with soil solution on 210
the other side indicated " u P o species were present that pass through
a membrane. Dialysis data are summarized in Table 12. Soil solution
from ^ *0poO2 contaminated Nunn silty clay loam used as a sample
solution and uncontaminated soil solution used as the receiving solution
indicated 37 percent of the polonium passed through the membrane.
Using a water solution of polonium oxide dialyzing into filtered de -
ionized water, only 6 percent of the activity was dialyzed. Soil solu
tions from polonium oxide contaminated Fayette, Gogebic and Onaway
soils dialyzed into soil solutions from each ser ies indicated approxi
mately equal amounts of the soil solution polonium passed through the
semi-permeable membrane. Soil solutions spiked directly with 210
P o 0 2 suspension without contact with soil solid phases indicated
greater amounts of the polonium passed through the membrane.
Dialysis of the soil solutions indicated approximately the same
amounts of colloidal and ionic forms of polonium existed in the different
soil solutions tested. However, addition of polonium oxide suspension
to soil solutions without contact with the solid phases indicated an in
crease of ionic forms. The direct spike dialysis experiments suggest
that 2 1 0 P o O 2 reacts with chemical species in soil solution. Thus, the 210 ionic forms observed in soil solution after P o 0 2 suspension contact
with the soil may be formed by reaction with soil solution, but

86
2 10 Table 12. Dialysis of P o O ? in deionized water and soil solutions.
F r ac t i on Collected in Sample Receiving Solution
2 l 0 P o O suspension 0 .063
Gogebic soil solution 0. 32
Fayet te soil solution 0. 34
Nunn soil solution 0. 37
Onaway soil solution 0. 35
Fayet te soil solution 210poO 2 suspension added d i rec t ly 0. 58
Onaway soi l solution 2 1 0 p o O 2 suspens ion added di rec t ly 0. 47
Nunn soil solution 2 1 0 p o O 9 suspension added di rec t ly 0. 48

87
solid phases in the soil may preferentially adsorb specific ionic
forms.
Polonium-210 Uptake by Plants
Two plantings were analyzed for polonium-210 movement from
Fort Collins silty clay loam. The first crop was grown in PoCl4 con
taminated soil and the second planting was grown in PoO„ contaminated
210 soil. In addition enough soil was contaminated with RaDEF ( Pb, 910 210 210
Bi and Po) so that Po uptake by barley, peas and radishes 210 could be measured with radioactive precursors of Po present. A
third planting in the greenhouse was in a polonium oxide contaminated
Fayette silt loam from the Gray-Brown Podzol Soil Group and a fourth
210 planting was in the Leon sandy loam with added PoO ? .
210 The Po uptake by plants was calculated from the disintegration
210 per minute of Po per gram dry weight of plant tissue corrected for
the average control plant content determined on a dry weight basis. A
transfer coefficient, U, was calculated using the following relationship:
TT _ (corrected dpm of °Po per gram dry plant) /4* (dpm of Po per gram of dry soil at harvest)
Transfer coefficients calculated for plants grown on polonium chloride
contaminated soil are tabulated in Table 13. Table 14 contains the
data calculated for plants grown in polonium oxide added to Fort Collins
silty clay loam and Table 15 l is ts the data for plants grown in Fayette

Table 13. Polonium chloride t ransfe r coefficients (U) - F o r t Collins sil ty clay loam.
Species and Var ie ty T issue No. of Dry Wt. Trans fe r Samples Coefficient t S. E.
Wet Wt. T r a n s f e r Coefficient t S. E .
Bar ley (Hordeum vulgare ,
Betzes)
Wheat (Tr ic t ium spp. , Scout)
Onion (Allium cepa,
Mountain Danver)
Pota to (Solanum tube r sum,
Norgold)
Radish (Raphanus sa t ivus ,
Cavalier)
P e a (Pisum sa t ivum, Dwarf) Pod
Kernels Stems and Leaves
Kernels Chaff Stems and Leaves
Bulbs Tops
Whole Pulp Pee l Greens
Roots Greens
P e a s Pod Vines
20 16
7 7 9
13 27
15 14 8
14
22 22
9 9 8
(7 .4 t 3.3) (9. 7 t 3. 4)
(1 .7 t O . 6) (1 . 1 t 0. 1) (1 .4 t 0.9)
(4. 1 t 1.0) (9 .0 t 1.4)
(1 .2 t 0.2) (1 .8 t O . 7) (8. 4 t O . 8) (9 .3 t 2.5)
(7 .5 t 1.0) (8.9 t 1.9)
(1 .4 + 0.6) (5 .2 t 2. 1) (1 .6 t 0.9)
X
X
X
X
X
X
X
X
X
X
X
X
X
X
X
X
10-4 10-3
10-5 10-3 10-3
10-4 10-4
10-3 10-4 10-3 10-3
10-3 10-3
10-4 10-4 10-3
(6 .5 t 2.9) (6.6 t 2.2)
(9.0 t 4.0) (9 .4 t 1.5) (7 .5 t O . 6)
(3 .7 t 0.9) (6.6 t 1. 1)
(2 .5 t 0.4) (6 .3 t 2.9) (1 .4 t O . 1) (9 .2 t 2.5)
(5. 7 t 1. 1) (7 .5 t 1.3)
(2 .9 t 1.4) (6.6 t 2.3) (3 . 1 t 1.8)
X
X
X
X
X
X
X
X
X
X
X
X
X
X
X
X
10-4 10-4
10-6 10-4 10-4
10-5 10-5
10-4 10-5 10-3 10-4
10-4 10-4
10-5 10-5 10-4

Table 13, concluded.
No. of Dry Wt. Trans fe r Samples Coefficient t S . E . Species and Varie ty T i s sue
Wet Wt. T rans fe r Coefficient t S. E.
Tomato Pulp (Lycopersion esculentum, Juice
Marglobe) Stems Leaves
Spinach (Spinacia o l e racea ,
Badger Savoy)
Stems and Leaves
Celery Edible Stem (Apium gravelens dulce, Stem
Golden Dwarf Leaves
22
15
(1 .6 t 1.5) x 10~5 (3 .6 t 0.8) x 10-5 (1 .8 t 0.4) x 10-4 (4 .7 t 0.8) x 10-4
(2 .2 t O . 4) x 10-3 (2 .8 t 0.5) x 10"4
27 (1 .5 t 1.4) x 10~4 27 25 (1 .7 t 0.4) x 10-3
(3 .3 t O . 6) x 10-3
19 (2. 4 t 0. 4) x 10"3 18 (2 .0 t 0.5) x 10"3 25 (1.0 t 0. 1) x 10-3
(2. 1 t O . 3) x 10"4 (2 .2 t 0.7) x 10"4
(1 .5 t 0.3) x 10"4 oo CO

Table 14. Polonium oxide t rans fe r coefficient (U) - Fo r t Collins sil ty clay loam, K . = 230.
Species and Varie ty
Bar ley (Hordeum vulgare ,
Betzes)
Corn (Zea m a y s , Hybrid
Sweet)
Wheat (Tr ic t ium spp. , Chris)
Onion (Allium cepa,
Mountain Danver)
Peanut (Arachis hypogaea,
Spanette)
Pota to (Solanum tuber sum,
Norgold)
T i s sue
Kernels Stems and Leaves
Kernels Cob T a s s e l Leaves (50 days) Leaves (130 days) Stems (50 days) Stems (130 days)
Kernels Chaff
Bulb Tops
Nut Shell
Whole Pulp Pee l Greens
No. of Samples
24 23
10 10 9
16 13 22 12
9 9
25 28
12 12
14 13 7
16
Dry Wt. T rans fe r Coefficient t S. E.
(2.6 t 0.2) x t O - 4
(5. 1 t 1.7) x 10-3
(1 .8 t O . 3) x 10"5
(3.6 t 0.6) x 10"5 (5 .4 t 1. 1) x 10"5 (2. 1 t O . 4) x tO"3
(1 .2 t 0.3) x 10"3 (1 .4 t O . 4) x 10-4 (3.9 t 0.9) x tO" 4
(4 .3 t 2.7) x t O - 4
(9 .4 t 4. 0) x 10-3
(5.6 t 1.2) x 10-4 (6 .7 t 1. 1) x 10-4
(1.6 t 0. 6) x 10"3 (3 .7 t 0.5) x 10-2
(4.9 t 1.3) x 10"3 (2. 7 t 0.9) x 10-3 (3 .4 t 0.5) x tO"2
(4 .4 t 0.6) x 10-3
Wet Wt. T rans fe r Coefficient t S. E.
(2. 1 t O . 2) x 10~4
(9. 1 t 3. 1) x 10-4
(3 .5 t 0.7) x 10"6
(5 .0 t 0.8) x 10~6
(1 .5 t O . 3) x 10"5 (2.6 t 0.5) x 10"4
(1 .4 t O . 4 ) x 1 0 - 4
(1 .6 t 0. 4) x t O - 5
(4 .8 t 1. 1) x 10"5
(3 .7 t 2.3) x 10"4
(8 .7 t 3.7) x 10"3
(5. 1 t 1.5) x 10~5 (4 .9 t 0.9) x 10-5
(1 .7 t O . 6) x 10"4 (3.6 t 0.5) x 10"3
(6 .2 t 1.6) x 10"4 (3 .4 t 1. 1) x t O - 4
(5 .5 t 0.9) x 10"3 (3 .5 t 0.4) x 10"4
CO
o

Table 14, concluded.
Species and Variety Tissue No. of Dry Wt. Trans fe r Samples Coefficient t S. E.
Wet Wt. T r a n s f e r Coefficient t S. E.
Radish (Raphanus sa t ivus ,
Cavalier)
P e a (P isum sat ivum, Dwarf)
Tomato (Lycopersion esculentum,
Marglobe)
■
Alfalfa
Roots Greens
P e a s Pods Vines
Pulp Juice Plant (30 days) Leaves (50 days) Leaves (130 days) Stems (50 days) Stems (130 days)
Plan t (1st crop) (Medicago sa t iva , Ranger) Plant (2nd crop)
Celery (Apium gravelens dulce,
Golden Dwarf)
Spinach (Spinacia o le racea ,
Badger Savoy)
Plant (3rd crop)
Edible Stem Stem Leaves
Leaves Stems
26 ( 23 (
22 ( 27 ( 20 (
34 ( 30
8 ( 26 ( 25 ( 21 ( 14 (
14 ( 21 ( 15 (
21 ( 23 ( 21 (
12 ( 9 (
6.3 t O . 5) x 5.3 t 1.0) x
1.4 t O . 2) x 3.9 t O . 6) x 2. 2 t 0. 2) x
3.3 t 1.3) x
2. 1 t O . 4) x 1.4 t 0.2) x 3.7 t O . 7) x 5.0 t O . 7) x 1.6 t 2.0) x
9.2 t 3.3) x 2.9 t 0.9) x 2.9 t 0.6) x
2.7 t O . 3) x 3. 4 t 0. 4) x 3.0 t O . 6) x
7. 3 + 0.5) x 4.9 t 0.9) x
•3 ■3
0 -4
0-4 0-3
0-3 0-3 0-4 0-4 0-5
O"4
0-3 0-3
0-4 0-4 0-4
,-3
5.8 t 0.7) 5.8 t 1. 1)
3. 5 t 0. 5) 5.5 t 0.7) 3.3 t 0.3)
3. 7 t 1.5) 3.3 t 0.7) 1.7 t 0.3) 1.5 t 0.2) 5. 5 t 1.0) 3.0 t O . 4) 1. 1 t 2. 1)
1.6 + 0.6) 2.9 t 0.9) 6. 1 t 1.2)
2.9 + 0.4) 4.0 t 0.5) 3. 2 t 0.6)
8.0 t 0.5) 5.2 t 1.0)
X X
X X X
X X X X X X X
X X X
X X X
X X
lO" 4
lO" 4
10-5 10-5 10" 4
10-6 10-6 10" 4
10" 4
10-5 10-5 10-6
10" 4
lO" 4
10-4
10-5 10-5 10-5
lO" 4
10" 4
CO

Table 15. Polonium oxide t rans fe r coefficient (U) - Fayet te si l t loam, K* = 303.
Species and Var ie ty T issue No. of Dry Wt. T rans fe r
Samples Coefficient t S . E . Wet Wt. T rans fe r Coefficient t s . E .
Bar ley (Hordeum vulgare ,
Betzes)
Corn ( Z e a m a y s , Hybrid
Sweet
Wheat (Tr ic t ium spp. , Chris)
P e a (P isum sa t ivum, Dwarf)
Tomato (Lycopersion esculentum,
Marglobe)
Kernels Stems and Leaves
Kerne ls Cob Leaves (50 days) Leaves (130 days) Stems (50 days) Stems (130 days)
Kerne ls Chaff
P e a s Pods Vines
Pulp Juice Plant (7 days) P lan t (15 days) Plant (30 days) Leaves (60 days) Leaves (90 days) Stems (60 days) Stems (90 days)
9 ( 9 (
10 ( 6 (
15 ( 11 ( 13 ( 11 (
13 ( 13 (
8 ( 8 (
10 (
22 ( 22
2 ( 4 ( 6 (
14 ( 10 ( 13 ( 10 (
9.9 t 4.3) 2 .4 t 0.8)
9 .3 t 4.6) 1.7 t 1.2) 1.8 t 0.3) 1.3 t O . 5) 1.0 t 0.2) 2.7 t 0.5)
3.7 t 1.2) 2 .8 t 1.2)
3.3 t 1.0) 2.7 t 1.2) 2.2 t 0.9)
2. 2 t 0.6)
2 .2 t 0.4) 3 .4 t 0.6) 2.8 t 0.5) 1.9 t 0.5) 1.4 t 0.3) 2 .3 t 0.6) 3. 3 t 1.4)
x X
X
X
X
X
X
X
X
X
X
X
X
X
X
X
X
X
X
X
X
10-4 ( 10-2 (
10-5 ( 10-4 ( 10-3 ( 10-3 ( 10-3 ( 10-4 (
10-4 ( 10-3 (
lO" 4 ( lO"4 ( 10-3 (
10-4 (
10-3 ( 10-3 ( 10-3 ( 10-3 ( 10-3 ( 10-3 ( l O " 4
(
7. 5 t 3. 3) x 1. 1 t 0.4) x
3.6 + 1.8) x 4. 9 t 3.4) x 7.0 t 1.0) x 2. 1 t 0.8) x 3.8 t O . 8) x 6.6 t 0. 1) x
3. 1 t 1. 1) x 2.6 t 1. 1) x
7.8 t 2.3) x 4. 1 t 1.7) x 4.9 t 2.0) x
1.8 t 0.5) x 1.0 t O . 2) x 2 .5 t O . 4) x 3. 7 t 0. 7) x 3.0 t O . 6) x 2. 5 t 0. 7) x 1.9 t O . 4) x 2 .5 t 0.7) x 3.7 t 1.6) x
0-4 0-2
0-5 a-4 0-4 0-4 0-4 0-5
0-4 0-3
0-5 0-5 0-4
0-5 0-5 0-4 0-4 0-4 0-4 0-4 0-4 0-5
CO
to

Table 15, concluded.
Species and Varie ty T i s sue No. of Dry Wt. T rans fe r Samples Coefficient t S. E.
Wet Wt. T rans fe r Coefficient t S. E.
Alfalfa Plant (1st crop) (Medicago sa t iva , Ranger)
Celery Edible Stem (Apium gravelens dulce, Stem
Golden Dwarf)
Spinach (Spinacia o l e racea ,
Badger Savoy)
Onion (Allium cepa,
Mountain Danver)
Pota to (Solanum tube r sum,
Kennibeck)
Radish (Raphanus sa t ivus ,
Cavalier)
Leaves
Leaves Stems
Bulb Tops
Pulp Pee l Greens
Roots Greens
10
10 9
12
13 9
16 15
9 8 9
21 10
(6. 1 + 1. 9) x lO"2 (9. 7 t 3. 0) x 10" 3
(2 .2 t 0.8) x lO"3
(5 .7 t 1.3) x 10-4 (8 .8 t 1.0) x 10-4
(5.6 t 1.2) x lO"3
(2. 1 t 0.3) x 10-3
( 1 . 1 t O . 1) x 10"3
(5 .7 t 1.2) x lO" 4
(1 . 1 t 0.6) x lO" 3
(4.9 t 0.9) x 10 "3 (1 . 1 t O . 2) x 10"1
(7 .2 + 1.0) x l O - 3
(2. 1 t O . 2) x 10"2
(2 .7 + 1.0) x (8 .2 t 1.8) x (1 .5 t O . 2) x
(6 .8 + 1. 4) x (2. 1 t 0.3) x
(9 .7 t 1.2) x (4 .8 t 1.0) x
(1 .6 t 1.0) x (5 .4 t 1.0) x (1 .2 t O . 2) x
(5 .4 t O . 8) x (2. 1 t 0.2) x
0-4 0-5 0-5
0-4 0-4
1-5 ,-5
0 " 4
0-4 n-2
CO CO

94
silt loam containing polonium oxide. Table 16 includes data from 210 plants grown in Leon sandy loam contaminated with P o 0 2 . Table 17
l ists the transfer coefficients for barley, peas and radishes grown in
Fort Collins silty clay loam containing RaDEF.
The chemical yields for each plant tissue analysis confirm values
reported by Blanchard for radishes, potatoes and leaf vegetables.
Table 18 l ists the chemical yields determined for each of the crops
harvested from the polonium oxide contaminated soils.
Student's t test for equality of means was used to determine the
differences between transfer coefficients of the chloride and oxide
chemical forms for plants grown in Fort Collins silty clay loam. The
following types of vegetation indicated equal uptake of the chloride and
oxide forms of polonium at the 99 percent confidence level: barley,
barley stems and leaves, onions, onion tops, radishes, radish greens,
peas, pea pods, pea vines and leaves, and tomato pulp. Potatoes ana
lyzed as foliage, whole, pulp or peel and spinach indicated greater
transfer coefficients for the oxide form. Celery leaves, edible and
non-edible celery stem, tomato juice, tomato leaves, and tomato
stems had lower polonium-210 uptake from oxide contaminated soil
than from soil containing the chloride form. Comparison of the t r ans
fer coefficients of barley, peas and radishes from the polonium
chloride and oxide contaminated soils with the uptake of polonium-210
210 from soil containing RaDEF indicated the RaF ( Po) did not enter the

Table 16. Polonium oxide t rans fe r coefficient (U) - Leon sandy loam, K^ = 17.
Species and Var ie ty T i s sue No. of Samples
12 11 3 3
3 2
Dry Wt. T rans fe r Coefficient t S . E .
(4 .4 t 0.8) x 10"3
(1 .5 t 0. 1) x 10-3 (1.2 t 0.2) x 10-3 (8.7 t 2. 8) x lO" 3
(2.0 t O . 2) x 10-3 (8 .4 t 1.3) x 10-4
Wet Wt. T rans fe r Coefficient t S . E .
Radish (Raphanus sa t ivus ,
Cavalier)
Spinach (Spinacia o l e racea ,
Badger Savoy)
Roots Greens Pulp Pee l
Leaves Stems
(3 .0 t 0.3) x 10"4
(1 .2 t O . 1) x 10"4
(8.0 t 1.7) x lO"5
( 3 . 3 t 1.0) x 10" 4
(8 .3 t 1.2) x 10-5 (9 .5 t 1.3) x lO"5
(
CO Ol

Table 17. RaDEF ( ^ l u P b , ^ l u B i and ^ l u P o chlorides) t r ans fe r coefficients - F o r t Collins sil ty clay loam.
No. of Dry Wt. T rans fe r Wet Wt. T r a n s f e r Species and Var ie ty T i s sue Samples Coefficient t S. E. Coefficient ,t S. E.
Pea P e a s (P isum sat ivum, Dwarf) Pods
Vines
Kerne ls Stems and Leaves
P e a s >warf) Pods
Vines
Bar ley (Hordeum vulgare ,
Betzes)
Radish (Raphanus sa t ivus ,
Cavalier)
Roots Greens
22 22
5 5 5
10 3
(6 .4 t 1.8) x lO"5
(5.6 t 0.4) x 10"4
(3 .4 t 0. 1) x l O - 5
(7 .5 t 1.8) x lO"5
(8.9 + 2.7) x 10"4
(5 .3 t O . 4) x 10" 4
(7 .7 t 2. 1) x 10-4
(6 .0 t 1.4) x l O - 5
(2 .5 t 0.2) x l O - 4
(6 .8 t 0.2) x 10"6
(5 .4 t 1.5) x 10"6
(5 .0 t 1.5) x l O - 5
(2.6 t 0.2) x lO"5
(3 .8 t 1.0) x lO" 5

97
Table 18. Chemical yields of P o 0 2 added to plant t issues.
Percent Added Vegetation 2 l 0 p o Recovered t s. E.
Alfalfa
Bar ley
Bar ley s t ems and leaves
Corn
Corn s t ems
Corn leaves
Ce le ry (edible portion)
Ce le ry l eaves
Onion
Onion tops
P e a s
Pota to (whole)
Pota to pulp
Pota to peel
Radish roo t s
Radish g reens
Tomato juice
Tomato pulp
Tomato l eaves
Tomato s t e m s
87.9 t 5.9
92 .3 t 0 .9
94 .2 t 0 .7
95. 7 t 1.0
95.0 + 1 . 6
94.9 t 1. 2
93. 7 t 1.8
92 .9 t 1.8
95 .8 t 2.9
97 .8 t 3. 1
93.0 t 0 .8
96 .7 t 1.5
92 .9 t 9. 7
98 .6 t 0 .5
85.9 t 1. 3
87. 1 t 0. 4
100 t 6 .8
96 .9 t 2 .4
93. 3 t 0 .5
91 .3 t 0 .7

98
plant as readily. The difference in transfer coefficients in the latter
case may result from the presence of lead and bismuth or the nitrate
form of the RaDEF.
Comparisons between transfer coefficients of plants grown on
Fort Collins silty clay loam and Fayette silt loam indicated most 210
plants had equal P o 0 2 transfer coefficients for equal soil distribu
tion coefficients. Student's t test indicated the following transfer
coefficients differed at the 99 percent confidence level. Alfalfa,
edible celery stem, potato foliage, and radish greens grown in Fort
Collins silty clay loam had lower transfer coefficients and potato
peels from the same soil had a higher transfer coefficient than the
same plant t issues grown in Fayette silt loam.
The different transfer coefficients of the potato tissues may be a
variety difference. Kennebec potatoes were substituted for Norgold
because the former was the only available variety at the time of
planting in the Fayette silt loam. Potato pulp transfer coefficients for
both varieties were equal for both soil mixtures. The surface charac
terist ics of the potato tuber varieties may have introduced a difference
that changed the potato peel uptake. However, the potato pulp t r ans
fer coefficients would be the values used for dietary estimates of
ingested polonium-210. The increased transfer coefficients for the
alfalfa, edible celery stem and radish greens grown in Fayette silt
loam may result from contamination of the vegetation by the soil

99
polonium, different transpiration rates between plantings or the chemi
cal differences of the two soils. Contamination of the vegetation by
soil would have increased the Standard Error of each determination but
the Standard E r r o r s were not unusually large. Increased transpiration
also could have carried more polonium into the plant.
If the soil distribution coefficients and the plant transfer coeffi
cients correlated, the transfer coefficients for plants grown in Leon
soil would be expected to be greater than those of the Fort Collins and
Fayette soils. Comparison of data for radish roots, radish greens,
spinach leaves and spinach stems grown in Leon sandy loam with the
same vegetation from the previous two plantings indicated the transfer
coefficient may be independent of the soil distribution coefficient.
Table 19 l ists the dry weight transfer coefficients for plants grown in
the three different soils. Transfer coefficients of radish roots and
tops removed from Leon sandy loam (K ■. = 17) were equal to the t r ans
fer coefficients for the Fort Collins silty clay loam and equal or less
than the transfer coefficients of the same vegetation types from
Fayette silt loam. The transfer coefficient for spinach leaves har
vested from the Leon soil was less than the transfer coefficients for
the two earlier plantings. The transfer coefficients for spinach stems
were equal for all three soils. The comparisons suggest plant transfer
coefficients are independent of soil distribution coefficients.
Plant transfer coefficients which are independent of the soil distr i
bution coefficients suggest that factors other than soil retention control

Table 19. Dry weight t r ans fe r coefficients for vegetation grown in three so i l s .
^ l u P o 0 2 Dry Weight T rans fe r Coefficient F o r t Collins Fayet te Leon
Plant and T i s sue (Kd = 230) (Kd = 303) (Kd = 17)
Radish Roots
Radish Greens
Spinach Leaves
Spinach Stems
(6. 3 t 0. 5) x 10"3
(5 .3 t 1.0) x 10"3
(7 .3 t 0.5) x 10"3
(4.9 + 0.9) x 1 0 - 3
(7 .3 t 1.0) x 10"3
(2. 1 t 0. 2) x 10"2
(5. 6 t 1.2) x 10"3
(2. 1 t 0. 3) x 10"3
(4 .4 t 0.8) x 10 °
(1 .5 t 0. 1) x 10"3
(8 .4 t 1.3) x 10"4
(2.0 t 0. 2) x 10"3

101
210 plant uptake of PoO . Transpiration may control the amount of
2 10
Po entering the plant roots. Uptake by plant transpiration suggests
a passive uptake rather than active uptake. However, the observed
equal transfer coefficients for the same plant species grown in three 210 soil series suggest soil or plant factors which change the PoO„ in
soil solution to a common chemical form at the root surface.
Rovira (1962) reported plant roots excrete a variety of substances
which may combine with ions in the region of the plant root. Chemical
changes of the polonium species in the region of the plant root may 210 form equal amounts of a Po form which is common to a plant
species. Assuming the greenhouse conditions equalized the amount of
transpiration for the plantings in the three soil se r ies , passive uptake
210 of the chemical form of Po common to a plant species may be combined with factors that equalize or lower the transfer coefficients of plants grown in the Leon sandy loam.
The concentration of polonium-210 in plants depended upon the
period the plant had been growing. The data for tomato plants grown
in Fort Collins silty clay loam show a decrease in transfer coefficients
with growth time. At 30 days of growth the plants had a transfer coeffi -_3 cient of 2. 1 x 10 . At 50 days of growth the leaf transfer coefficient
was 5. 0 x 10" . After 130 days of growth the leaf transfer coefficient
4 -5 was 3. 7 x 10 * and the stem transfer coefficient was 1. 6 x 10 Examination of the data for the other plant types indicated that the

102
plants which matured in 30 to 60 days had transfer coefficients that _3
exceeded 2 x 10 and plants maturing in 130 to 140 days had transfer _3
coefficients that were less than 2 x 10 independent of the radioactive
decay of the polonium-210.
The decrease in transfer coefficient with time may be related to
several factors. Polonium-210 may enter the plant at the early stages
of growth and be diluted by added growth. As the plants matured, the
2 10 root supply of Po may have been depleted by uptake in early stages
210 of growth and diffusion rates of the Po species in the soil may not
have maintained the original concentrations of polonium in the region
of the roots.
The transfer coefficients for a given type of vegetation showed 210 greater concentrations of Po in the stems and leaves than in the
fruit. Concentrations in barley kernels, corn kernels, peas, tomatoes
and wheat kernels were less than the corresponding concentrations in
the stems and leaves of the same plants. Root crops such as potatoes
and radishes indicated higher concentrations in the peels than in the
pulp. The differences were an order of magnitude or smaller. The
reduced transfer coefficient for fruits again suggests the major polo
nium uptake may be passive.
Use of the transfer coefficients from edible plants grown in Fort
210 Collins soil containing P ° 0 2 indicated ingestion hazards may be
significant to populations obtaining all of their vegetable diet from

103
a contaminated agricultural area. Calculations by Watters and Hansen
(1970) indicated if one megacurie of 2 1 0Po were distributed over 62
210 square miles of alkaline agricultural land, Po could produce a one
year population dose of 0. 5 rem to the kidney from ingestion of vege
table products contaminated by root uptake. Transfer coefficients of
plants grown in the Fayette silt loam were generally equal to those of
the Fort Collins silty clay loam indicating the ingestion hazard for vege
tables grown on Gray-Brown Podzols would be the same. Table 20 lists
210 the ranges of the observed transfer coefficients for the three PoO,
plantings.
Control Plant Polonium-210 Content
210 The Po concentrations of the control plants grown in Fort
Collins silty clay loam (Table 21) are similar to those reported by
2 10 Francis et al. in their study of the Po content of plants grown under
greenhouse conditions. Comparison of the data from the plantings in
Fort Collins silty clay loam using Student's t test for equality of means
210 indicated the Po content per gram was the same at the 95 percent
confidence level for all vegetation types except barley stems and leaves,
potato pulp, peas, pea pods, wheat kernels, wheat chaff, and wheat
stems and leaves. Use of a 99 percent confidence interval allowed
acceptance of equality between the means of all vegetation types except
the peas and pea pods and the wheat tissue samples.

104
Table 20. Range in the observed dry weight t r ans fe r coefficients for 210poO o .
P lant Type and T i s sue Range for
F o r t Col l ins , Fayet te and Leon Soils
Radish roo t s Radish g reens Spinach leaves Spinach s t e m s
4. 4 x 10"° to 7 .3 x 10~6
1.5 x 10⁻³ to 2. 1 x 10⁻² 8.4 x 10⁻³ to 7 .3 x 10" 3
2.0 x 10⁻³ to 4.9 x 10⁻³
Plant Type and T i s sue Range for
F o r t Collins and Faye t te Soils
Alfalfa Bar ley ke rne l s Bar ley s t e m s and leaves Ce l e ry , edible s t em Cele ry leaves Ce le ry s t ems Corn ke rne l s Corn cob Corn leaves Corn s t ems Onion bulbs Onion tops P e a s P e a pods P e a vines and l eaves Pota to pulp Pota to peel Pota to g reens Tomato pulp Tomato juice* Tomato s t e m s Tomato leaves Wheat kerne l s Wheat chaff
9. 2 x 1 2. 6 x 1 5. 1 x 1 2 . 7 x 1 3 . 0 x 1 3 . 4 x 1 1.8 x I 3 . 6 x 1 1.2 x 1 2. 7 x 1 5 . 6 x 1 5 . 7 x 1 . 4 x 1 2 . 7 x 1 2. 2 x 1 l . l x l 4. 9 x 1 4 . 4 x 1 3 . 3 x 1 3 . 3 x 1 1.6 x 1 3 . 7 x 1 3 . 7 x 1 2 . 8 x 1
L 0 - * t LO-4 t
L0-3 t LO-4 t
LO-4 t
LO-4 t L0-5 t LO -5 t L0-3 t LO-4 t LO-4 t
LO-4 t
L 0 - 4 t L 0 " 4 t L0-3 LO-3 t
LO -3 t L0"3 t l O - 5 t 0"6 t
LO"5 t LO-4 t
LO-4 t
10-3 t
o 6. o 9. o 2. o 2. o 8. o 5. o 9. o 1. o 1. o 3. o 1. o 6. o 3. o 3.
1 x 9 x 4 x 2 x 8 x 7 x 3 x 7 x 3 x 9 x 1 x 7 x 3 x 9 x
o 2 .7 x o 3. 4 x o 1. 1 x o 2. 2 x o 1.0 x o 3. 3 x o 1. 4 x o 4. 3 x o 9 .4 x
0" z
0-4 0-2 0-3 0-4 0-4 0-5 0-4 0-3 0-4 0-3 0-4 0-4 0-4
0-3 0-2 0 - i 0-4 0-5 0-4 0-3 0-4 0-4
Wet weight t r an s f e r coefficient.

Table 21. Control plants 2 1 0p o c o n ten t - Fort Collins silty clay loam.
Species and Var ie ty
Bar ley (Hordeum vulgare , Betzes)
Corn (Zea m a y s , Hybrid Sweet)
Wheat (Tr ic t ium spp. , Chris)
Onion (Allium cepa, Mountain Danver)
Potato (Solanum tube r sum, Norgold)
Peanut (Arachis hypogaea, Spanette)
Radish (Raphanus sa t ivus , Cavalier)
T i s sue
Kerne ls Stems and Leaves
Kerne ls Cob Leaves Stems
Kernels Chaff Stems and Leaves
Bulbs Tops
Whole Pulp P e e l Greens
Nuts Shells
Roots Greens
1st Plant ing 2 1 0 p O p C i / g
dry weight * S. E.
0.030 t 0.008 0.050 t 0.007
0.043 t 0 .035 0.076 t 0.007 0.040 t 0.009
0 .13 + 0 . 0 5 0. 13 t 0.02
0.027 t 0.008 0. 16 t 0 .04 0 .054 t 0.011 0 .45 t 0. 15
0.069 t 0.011 0 .11 t O . 0 2
2nd Plant ing 2 1 0 p O p C i / g
dry weight t S. E.
0 .013 t 0 .004 0. 13 t 0 .03
Not Detected Not Detected 0 .12 t O . 0 2 0.025 t 0 .004
0.30 t O . 06 15 t 1.5 54 t 15
0.11 t O . 0 9 0 .051 t 0 .014
0.020 t 0 .004 0.017 t 0.005 0.040 t 0 .005 0. 14 t 0 .02
0 .033 + 0.020 0 .63 t 0. 10
0.097 t 0 .034 0.082 t 0.019
o Ol

Table 2 1 , concluded.
Species and Var ie ty T i s sue
1st Plant ing 2 1 0 p O p C i / g
dry weight t S. E.
2nd Plant ing 2 1 0 P o p C i / g
dry weight t S . E .
Alfalfa (Medicago sa t iva , Ranger)
Celery (Apium gravelens dulce, Golden Dwarf) Stem
Spinach (Spinacia o le racea , Badger Savoy)
P e a (Pisum sa t ivum, Dwarf)
Tomato (Lycopersion esculentum, Marglobe)
P l a n t ( 1 s t P l a n t ( 2 n d Plant (3rd
crop) crop) crop)
Edible Stem Stem Leaves
Leaves Stems
P e a s Pod Vines
Pulp Juice Leaves Stems
0.055 t 0 .015 0.11 t O . 0 4 0.068 t 0.006
0.086 t 0 .024
0.57 t O . 2 1 0.42 t 0. 14 0.29 t 0. 10
0.089 t 0.021 Not Detected 0.038 t 0 .005 0.078 t 0.009
0. 17 0. 115 0.095
0.078 0.099
0.025 0.025 0. 16
0.028
+ + +
+ +
+ + +
+
0.02 0.02 0.02
0.020 0.019
0.015 0.007 0 .03
0.004 Not Detected 0. 16 0. 19
+ +
0.05 0 .05

107
Comparison of the polonium content of the plants grown in Fayette
silt loam (Table 22) with the previous plantings indicated higher levels 210 of Po in the control plants. Wheat tissues and alfalfa contained
much greater amounts of polonium than detected in the other plants.
During the mid-point of the growth of the alfalfa and wheat in Fayette
silt loam and the wheat in the Fort Collins silty clay loam a sprayer
system was installed above a parallel bench in the greenhouse. The
spray system emitted a fine mist that drifted over the plants grown for
examination of polonium-210 content. Wheat stems and leaves r e
moved from the Fort Collins silty clay loam contained 54 t 15 pCi/g,
chaff contained 15 t 1.5 pCi/g, but the wheat kernels only contained
0. 30 t 0.06 pCi/g with the chaff removed. Wheat stems and leaves
grown in Fayette silt loam contained 67 t 27 pCi/g, wheat chaff had
22 t 1.8 pCi/g and wheat kernels 0. 66 + 0. 12 pCi/g. Alfalfa grown
during the same period in Fayette silt loam contained 3 0 + 1 5 pCi/g
compared to 0. 17 +. 0. 02 pCi/g for plants grown in Fort Collins soil
previous to the installation of the sprayer system. Hill observed that
210
rainfall accounted for the u Po levels in grass . The sprayer systems
acted as scrubbers to wash polonium from the air and deposit it on the
plants. The plantings in the Leon sandy loam (Table 23) were moved
to a different greenhouse. 210
The source of the natural levels of 6 1 u P o in plants has been a t t r i
buted to root uptake by Tso et^al. Assuming the natural polonium in

Table 22. Control plants 2 1 0 p o content - Fayette silt loam.
Species and Var ie ty
Bar ley (Hordeum vulgare , Betzes)
Corn (Zea m a y s , Hybrid Sweet)
Wheat (Tr ic t ium spp. , Chris)
Onion (Allium cepa, Mountain Danver)
Pota to (Solanum tube r sum, Kennebec)
Radish (Raphanus sa t ivus , Cavalier)
P e a (Pisum sa t ivum, Dwarf)
T issue
Kerne ls Stems and Leaves
Kerne ls Cob Leaves Stems
Kernels Chaff Stems and Leaves
Bulb Tops
Pulp Pee l Greens
Roots Greens
P e a s . Pod Vines
2 l 0 P o p C i / e dry weight t S.
0 .033 t 0.008 0.48 + 0 . 3 4
Not Detected 0 .21 t O . 0 8 0. 18 t 0 .05 0.20 ± 0 . 0 4
0.66 t 0. 12 22 t 1.8 67 t 27
0.11 + 0 . 0 7 0. 39 t 0. 16
0.033 t 0.005 0.22 ± 0 . 1 5 0.49 t O . 02
0. 12 t 0 .01 0 .24 t O . 08
0 .14 t O . 0 7 0.054 t 0.016 0.37 t O . 0 8
E.

Table 2 2, concluded.
Species and Variety Tissue 2 1 0 P o pCi/g dry weight t S. E.
Tomato (Lycopersion esculentum, Marglobe)
Pulp Juice Leaves Stems
0.28 t o . 12 Not Detected 0.21 t O . 0 7 0.091 t 0.025
Alfalfa (Medicago sativa, Ranger)
Spinach (Spinacia oleracea, Badger Savoy)
Plant (1st crop)
Celery Edible Stem (Apium gravelens dulce, Golden Dwarf) Stems
Leaves
Leaves Stems
30 t 15
0. 16 t 0.05 0.65 t O . 47 0.45 t 0. 17
0.30 t o . 14 1.50 t O . 51

210 Table 23. Control plants Po content - Leon sandy loam.
Species and Variety Tissue 210 Po pCi/g dry weight t s. E.
Radish (Raphanus sativus, Cavalier)
Corn (Zea mays, Hybrid Sweet)
Tomato (Lycopersion esculentum, Marglobe)
Roots Greens
Leaves (30 days) Stems (30 days)
Plants
0.23 + 0.04 0.65 t 0. 12
0.53 t 0. 16 0.20 t 0.01
0.50 t 0. 17

I l l
soil ac t s s imi l a r ly to P o 0 2 in so i l , apparent t r an s f e r coefficients
210 x
were calculated from the ra t io of the Po concentrat ion in the control
plants grown in F o r t Coll ins soil to the concentrat ion in the soil (0. 48
pCi /g ) . The values for the "apparent" t r a n s f e r coefficients a r e l i s ted
in Table 24. Compar ison of these coefficients with the values in
Table 14 for p lants grown in ar t i f ic ia l ly contaminated soil indicated
that the calculated apparent uptake in control plants i s one to two
o r d e r s of magnitude h igher .
Studies of 2 l 0 P b uptake by Tso et a l . suggest 2 1 0 P b and 2 1 0 P o
together in soil would lead to a t r ans fe r coefficient that is higher than 210 the t rans fe r coefficient for unsupported P o . However, ana lys is of
plants grown in F o r t Collins soil contaminated with an equil ibr ium m i x
tu r e of 2 l 0 P b , 2 l 0 B i and 2 l 0 P o (RaDEF) did not indicate an inc reased 2 10
Po t r ans fe r coefficient. Ba r l ey , p e a s , and r ad i shes grown in
RaDEF soi l s had t r ans fe r coefficients of (6. 3 t 1. 7) x 10" 5 , (3 . 4 t 0. 1)
x 10"5 and (5 . 3 t 0. 4) x 1 0 , respec t ive ly . Compar ison of the above
t r ans fe r coefficients with those for the same vegetation type in Table
25 indicated a s ta t i s t ica l ly equal o r lower uptake in each case . The 210
observat ions indicated that the Po concentrat ion in the control s a m ples was not because of root uptake and that the major source of na tura l polonium in plants would be a s suggested by Hill , B e r g e r et a l .
222 and F r a n c i s et aL The radioact ive decay of Rn in the a i r leads to
210 210 contamination of the plant foliage by fallout of * l u P b and decay to Po .

112
Table 24. Polonium-210 uptake by plants based on control plants -Fort Collins silty clay loam.
Apparent Transfer Vegetation Type Coefficient t S. E.
Grains
Bar ley Bar ley Stems and Leaves Corn Corn Cob Corn Leaves Corn Stems
Spinach Leaves Spinach Stems Cele ry (edible stem) Celery Leaves
Leafy Vegetables
Celery Stems (above f i r s t leaf node)
Onions Onion Tops Pota to (whole) Pota to Pulp Pota to P e e l Pota to Greens Radish Roots Radish Greens
P e a s Pea Pods Pea Vines and Leaves Tomato Pulp Tomato Juice Tomato Leaves Tomato Stems
Root Crops
Edible F r u i t
0 .047 0.47 0 . 0 0 . 0 0.25 0.052
0 .21 0. 16 0. 11 0. 14 0 .23
0 .23 0. 11 0.042 0.032 0. 15 0.29 0.20 0. 17
0.052 0.052 0 .33 0.058 0 . 0 0.40 0 .33
t 0.008 t 0.06
t 0 .04 t 0.008
t 0 .04 t 0 .04 t 0 .031 t 0 .01 t 0 .08
t O . 18 t 0 .03 t 0 .008 t 0.010 t 0 .02 t 0 .04 t 0 .07 t 0 .04
t 0 .031 t 0.002 t 0 .06 t 0 .008
t 0 .01 t 0 .01

113
Table 25. Dry weight t r an s f e r coefficients for plants grown in F o r t Collins si l ty clay loam containing 2 1 0 p o o 2 and RaDEF.
2 1 0 P o Dry Weight T rans fe r Coefficients Plant and T i s sue 2 l 0 P o O 2 Added RaDEF Added
Bar ley ke rne l s
Bar ley s t e m s and l eaves
P e a s
Pea pods
P e a vines
Radish roo t s
Radish g r e e n s
(2.6 t 0.2) x 1 0 - 4
(5. 1 t 1.7) x lO" 3
(1 .4 + 0.2) x 1 0 - 4
(3 .9 t 0.6) x 10" 4
(2 .2 t 0.2) x 10" 3
(6 .3 t 0.5) x 10"3
( 5 . 3 t 1.0) x 10" 3
(6 .4 t 1.8) x l O - 5
(5 .6 t 0.4) x 10" 4
(3 .4 t 0. 1) x l O - 5
(7 .5 t 1.8) x 10"5
(5 .3 t 0.4) x 10"4
(5 .3 t 0.4) x 10" 4
(7 .7 + 2. 1) x 10" 4

114
Paper Chromatography of Plant Extracts
Paper chromatographs of separated plant protein extracts indi
cated an organic form of polonium-210. Figures 12 and 13 are plots
of the fraction of 2 °Po in a sample moved by the chromatography
solvent versus the Rf, the ratio of the distance moved by a spot
of activity to the distance moved by the solvent front. Movement of 210
Po in 6 N HCl protein digest extracted from wheat leaves and
stems is plotted in Figure 12. Movement of polonium oxide digested
in 6 N HCl is plotted as a control. Figure 13 contains the plot of the
movement of 2 1 0 P o in 6 N HCl protein digest extracted from spinach
leaves and stems. The width of a bar is the uncertainty of the Rf of 210 the movement of Po activity.
210 Rf's of maximum Po activity in extracts of wheat leaves and
stems were detected between 0. 42 and 0. 48, 0. 54 and 0. 60, 0. 84 and
2 10
0. 90. Extracts of spinach leaves and stems indicated maximum ^ l u P o
activity between R^'s of 0. 18 and 0. 24, 0. 36 and 0. 42. Polonium oxide
digested in 6 N HCl moved to R* s of maximum activity between 0. 36
and 0. 42, 0. 54 and 0. 60. The 2 1 0 P o activity Rf between 0.84 and 0. 90
in extract of wheat leaves and stems moved the greatest distance and 210 no corresponding peak of Po control activity was present at the
same R^. Locations of other peaks of 2 1 0Po activity in the plant
2 10 extracts were identical or close to peaks of Po activity in the control solution. The peak of activity between 0. 84 and 0. 90 may be an

Figure 12. Paper chromatography of wheat leaves and stems protein extract and 2 i 0 p o o digested in 6 N HCl.

116
□ WHEAT LEAVES AND STEMS EXTRACT DIGESTED IN6NHCI
210 PoC DIGESTED IN 6N HCl
024 0.48 0.72 0.96 R, OF
Zi0?o

Figure 13. Paper chromatography of spinach leaves and stems protein extract and 210poo_ digested in 6 N HCl.

118
UJ _J Q. z < CO
z
O cP-CM
o z o h-< oc u.
0.24-0.22-0.20-
0.18-0.16-0.14-0.12-0.10-0.08-0.06-0.04-0.02-o.o-l
n SPINACH LEAVES EXTRACT ^ DIGESTED IN 6N HCl
| 2 , 0 P o 0 2 DIGESTED IN 6N HCl
0.24 0.48 0.72 0.96 Rf OF2,0Po
3

119
210 organic form of Po containing 12 percent of the total activity. Other
210 organical ly complexed fo rms of Po may exist in plant t i s s u e s , but
chemical p rocess ing to obtain protein hydrolyzates could des t roy o rgan -
210 210
ical ly complexed o r weakly bound P o . The organic form of P o
observed may be s t rongly bound o r complexed to a molecule which did
not undergo changes during chemical digest ions and sepa ra t ions . 210 210
Ratios of Po act ivi t ies in plant ex t rac t s to the Po act iv i t ies in control solutions at the s a m e Rf's indicate the plant m a t e r i a l s may
210 a l t e r the re la t ive amounts of Po exist ing a s different chemical
spec ie s . Table 26 l i s t s the ra t ios calculated from the data plotted in
F i g u r e s 12 and 13. At the R. between 0. 18 and 0. 24 spinach hydro ly-
210 zate contained g r e a t e r amounts of Po than the control solutions or
wheat ex t rac t . Wheat ex t rac t contained g r e a t e r re la t ive amounts of
210
* l u P o than spinach ex t rac t at R f ' s between 0. 54 and 0. 60 and 0. 84 and
0. 90. At R ' s between 0. 54 and 0. 60 the form of polonium in the con
t ro l solution was p re sen t in the g r ea t e s t r e la t ive quantity. Differences
between the r a t i o s observed in spinach and wheat ex t r ac t s indicate 210 fo rms of Po in p lan ts may vary with plant spec ie s .
210 R . ' s of organic Po in plant ex t r ac t s may change with soi l -p lant
in te rac t ions . The spinach and wheat samples used for prote in e x t r a c
t ions were grown in the s ame soi l . E l ec t rophores i s exper iments
910
indicated the re la t ive concentra t ions of charged Po spec ies in soil
solution changed with the soi l s e r i e s . P lan ts grown in different soil

120
Table 26. Ratios of 2 1 0 P o activi ty in plants ex t rac t digest to the 2 l 0 p o act ivi ty in the control digest .
R# R a t i o o f Wheat 2 l 0 P <
Control 2 1 0 P o_ 'o
Ratio of S P i n a c h ' l ° P o
Control 2 1 0 P o
0. 18 - 0 .24
0.36 - 0.42
0 .54 - 0.60
0 .84 - 0.90
0 . 3
0 .6
0 .8
5.3
4.2
2.0
0 .2
0 .8

121
210 types may contain other organic forms of Po or the relative
amount of a given chemical form may increase or decrease.
Polonium-210 detected in plants grown in soils containing added
2 10
PoO„ may enter roots as inorganic ions and undergo chemical
change within the plant, or an active uptake mechanism in the root may
form an organic species which is translocated to the aerial plant
t issue. Transfer coefficients would indicate passive uptake of 210po
is the route of entry into the plant. Rosenfeld and Beath suggested
selenium, a possible chemical analog of polonium, entered plants as
an inorganic ion. Selenite (SeOg~) translocated to the leaves of plants
was identified as the source of selenium in plants. Figgins speculated
that polonite (PoOq) ion may exist. If polonite ion exists in soil
solution it may act like selenite and enter plants through the root
system undergoing chemical changes in the leaves of the plants. 210 An organic form of Po in plants suggests the isotope may be
more available for ingestion into soft t issues of men or other animals 210 ingesting the plants. An organic form of Po in plants may act
similar to organic forms postulated to exist in reindeer and caribou
2 10 meats. The transfer of Po from meat through the gastrointestinal
t racts of Lapps and Eskimos has been found to be five times greater
than would be predicted from data based on experiments where inor-
ganic forms of ' "Po were administered to animals.

122
Possible organic forms of Po in plants suggest further experi
ments are needed to characterize the organic polonium and its behavior
in a food chain. Additional chromatographic experiments with plant
extracts and additional solvent separation systems may aid in the
study. An experiment which feeds animals with plants containing 2 °Po may act similarly to postulated organic forms in caribou and
reindeer meats. A trophic level study would use a byproduct of the
plant to animal study, such as milk, to trace the behavior of polonium
in a food chain.

CHAPTER V
SUMMARY OF RESULTS AND CONCLUSIONS
210 Kilocurie quantities of * l u P o have been proposed as a radioisotope
fuel to meet projected satellite power requirements. Accidental
2 10 release of 1 MCi of Po over an agricultural or watershed area may
introduce the isotope into food and water supplies as an oxide and result
in the exceeding of the maximum safe concentration in vegetables
grown in contaminated soils. 2 10 Adsorption of PoO in soils was studied by bulk determination
of distribution coefficients (K.) of 18 different top soils and 9 soil
profiles from 6 soil groups. Distribution coefficients were correlated
with the silt content of the top soils. An empirical equation describing
agricultural top soil adsorption was derived as In K = 3. 2 •*• 0. 046
(Percent Silt). The distribution coefficients of the combined data for
the A, B and C horizons of all soil samples were correlated with soil
pH and silt content. The empirical equation derived was In K , =
- 1.3 + 0. 034 (Percent Silt) + 0. 88 (pH). Polonium oxide eluted
through soil columns with water indicated the K J predicted soil reten-910 210
tion of ^ l u PoO . The soil adsorption indicated movement of PoO to a water supply would be minimal.
210 The chemical species of Po in soil solution were characterized
by electrophoresis and dialysis experiments. Polonium-210 in soil
solution subjected to an electric field indicated positive and negative

124
species in soil solution. The relative concentrations of the species
varied with soil type. Dialyzed soil solutions indicated approximately 210
34 percent of the Po in soil solution would pass through a semi
permeable membrane. The addition of polonium oxide directly to soil
solutions indicated soil solid phases alter the dialyzed forms.
Plants grown under greenhouse conditions were examined for a c
cumulation of natural and added 2 1 0 P o from three different soils.
Alcoholic protein extracts of wheat and spinach were separated by paper
chromatography to investigate possible organic forms of polonium.
Plant uptake of 2 1 0 P o O 2 added to soil was measured and expressed 210 as a transfer coefficient, U, which is the ratio of the amount of Po
2 10 per gram of dry plant material to the amount of Po per gram of dry
soil at the date of harvest. Transfer coefficients of 11 different fruit, -2 -6
grain, leafy and root crops ranged from 10 to 10 . The transfer
coefficients were independent of the soil distribution coefficients. Cal
culations using U to estimate the ingestion hazards indicated 1 MCi 2 deposited over 62 Mi could produce maximum permissible body burdens
210 of Po. Paper chromatography indicated one organically complexed
form of polonium-210 which represented 12 percent of the total in the
wheat protein hydrolyzate. An organic form of 2i°Po may increase the
ingestion hazard associated with plant uptake of polonium from soil.
210 Measurements of the naturally occurring Po in the soil samples
indicated a range of 0. 22 to 3. 47 pCi/g in top soils. Measurements of

125
the Po in the vegetation used for controls in the greenhouse experi
ments indicated the source of naturally occurring 210po i n p i a n t s was
the fallout of the isotope and its radioactive precursors .

BIBLIOGRAPHY-
Bagnall , K. W. 1966. The Chemis t ry of Selenium, Te l lu r ium and Polonium. E l sev ie r Publ ishing Company, New York. p . 60 -61 .
Bagnall , K. W. , D. S. Rober t son , M. A. A. Stewart . 1958. The polonium n i t r a t e s . JL Chem. Soc. p . 3633.
B a r m a t , M. , G. M. Anderson , E. W. Bol lmeier . 1959. SNAP I I I - -" E lec t r ic i ty from radionucl ides and the rmoe lec t r i c convers ion.
- Nucleonics 17: 166-167.
Bax te r , R. and D. Wood. 1953. Appara tus for plating out polonium for ana lys i s . UR-269. Universi ty of Roches te r , New York. 21 p .
Beas ley , T . M. and H. E . P a l m e r . 1966. Lead-210 and polonium-210 in biological s amples from Alaska . Science 152: 1062-1063.
Beath , O. A. and H. F . Eppson. 1947. The form of selenium in some vegetation. Wyoming Agr icu l tura l Exper iment Station, Bui. 278. Universi ty of Wyoming, L a r a m i e . 17 p .
B e r g e r , K. C. , W. H. E r h a r d t , C. W. F r a n c i s . 1965. Polonium-210 ana lyses of vegetables , cured and uncured tobacco, and assoc ia ted so i l s . Science 150: 1738-1739.
Blanchard , R. L. 1966. Rapid determinat ion of lead-2 10 and polonium 210 in environmenta l samples by deposition on nickel . Anal . Chem. 38: 189-192.
Blanchard , R. L. 1967. Relationship between 2 1 0 p o and 2 1 0 p D in man and his environment . In: Radioecological Concentrat ion P r o c e s s e s (B. Aberg and F . P . Hungate, e d s . ) , P e r g a m o n P r e s s , New York. p . 281-296.
Coleman, J . R. and L. J . P e r e z , J r . 1967. Radiological safety s tudies of space nuclear s y s t e m s . 4th Quar t , and Fina l Rept. SC-CR-67-2729 (Sandia Labora to r i e s ) , p. 77-82.
Davis , H. L. 1963. Nuclear space p ro jec t s face up to safety p r o b l e m s . Nucleonics 21: 61-65.
Dixon, W. J . 1965. Biomedical Computer P r o g r a m s , Health Sciences Computing Faci l i ty . Universi ty of California, Los Angeles . p . 233-257.

127
D r a p e r , N. R. and H. Smith. 1966. Applied Regress ion Ana lys i s , John Wiley & Sons, Inc. , New York. 407 p .
F igg ins , P . E. 1961. The Radiochemis t ry of Polonium. Nat. Acad. Sci. , Nuclear Sci. Ser . , NAS-NS-3037. Office of Technical Se rv ices , Dept. of C o m m e r c e , Washington, D. C. 68 p .
F ink , R. M. 1950. Biological Studies with Polonium, Radium, and Plutonium (R. M. Fink, e d . ) . McGraw Hill Book Company, Inc. , New York. p . 18.
F r a n c i s , C. W. and G. C h e s t e r s . 1967. Radioactive ingrowth of polonium-210 in tobacco p lants . .L Agr . Food Chem. 15: 704-706.
F r a n c i s , C. W. , G. C h e s t e r s , W. H. E rha rd t . 1968. 2 1 0 P o l o n i u m entry into p lants . Environ. Sci. Technol . 2: 690-695.
F r a n k e , K. W. and E. P . Pa in t e r . 1936. Selenium in pro te ins from toxic foodstuffs. I. R e m a r k s on the occu r rence and na ture of the selenium presen t in a number of foodstuffs or the i r der ived p roduc t s . Cerea l Chem. 13: 67-70.
Goldberg, H. M. , F . R. F o s b e r g , M. H. Sachet , A. Re imer . 1965. World dis tr ibut ion of so i l , rock and vegetation. TEI-865 . (U. S. Geological Survey). 37 p .
Haiss insky, M. 1964. Nuclear Chemis t ry and Its Applicat ions. Addison-Wesley Publ ishing Company, Inc. , Pa lo Al to , California. p . 606-610.
Hansen, R. O. , R. D. Vidal , P . R. Stout. 1960. Radioisotopes. in so i l s : phys ica l -chemica l composit ion. In: Radioisotopes in the Biosphere . (R. S. Caldecott and L. A. Snyder, e d s . ) , Universi ty of Minnesota Pr in t ing Depar tment , Minneapolis, p. 23-36.
Harvey , D. G. , P . J . Dick, C. R. Fink. 1963. Isotope genera to r re l iabi l i ty and safety. Nucleonics 21: 56-59.
Hil l , C. R. 1960. Lead-210 and polonium-210 in g r a s s . Nature 187: 211.
Hill , C. R. 1962. Identification of a e m i t t e r s in normal biological s amp le s . Health P h y s . 8: 17-25.

128
Hill, C. R. 1963. Natural occurrence of unsupported RaF C*luPo) in t issue. Health Phys. 9:952-953.
210 Hill, C. R. 1967. Routes of uptake of Po into human tissues,. In: Radioecological Concentration Processes . (B. Aberg and F . P. Hungate, eds . ) , Pergamon P r e s s , New York. p. 297-302.
Holtzman, R. B. 1963. Measurement of the natural contents of RaD (2l0pb) and RaF (210po) j n human bone - - estimates of whole body burdens. Health Phys. 9:385-400.
Holtzman, R. B. 1964. The source of unsupported 2 l 0 p o (RaF) in tissue. Health Phys. 10: 763-764.
Holtzman, R. B. and F . H. Ilcewicz. 1966. Lead-210 and polonium-210 in tissues of cigarette smokers. Science 153: 1259-1260.
Hope, A. B. 1960. Radioisotopes in plants : root entry and distribution. In: Isotopes in the Biosphere. (R. S. Caldecott and L. A. Snyder, eds . ) . University of Minnesota Printing Department,. Minneapolis, p. 60-72.
International Commission on Radiological Protection (1959). Report of Committee II on permissible dose for internal radiation. ICRP Publication 2. Pergamon P r e s s , New York. p. 217-220.
Jackson, M. L. 1956. Soil Chemical Analysis - Advanced Course. Published by the author, Department of Soils, University of Wisconsin, p. 101-170.
Jones, I. R. and G. E. Austin. 1966. POODLE Radioisotope propulsion technology. In: Radioisotopes for Aerospace Par t 2: Systems and Applications. (J. C. Dempsey and P . Polishuk, eds . ) . Plenium P r e s s , New York. p. 385-408.
Jones, D. B. , M. J. Horn, C. E. F . Gersdorff. 1937. The selenium and cystine content of some partial hydrolysis products of gluten from toxic wheat. Cereal Chem. 14: 130-134.
Kauranen, P . and J. K. Miettinen. 1967. 2 10p o a n d 210 p b i n e n v i r o n _ mental samples in Finland. In: Radioecological Concentration Processes . (B. Aberg and F . P . Hungate, eds . ) , Pergamon P r e s s , New York. p. 275-280.

129
Kauranen, P . and J. K. Miettinen. 1969. * l u P o and * l u P b in the arctic food chain and the natural radiation exposure of Lapps. Health Phys. 16: 287-296.
Krey, P . W. 1967. Atmospheric burn-up of a plutonium-238 generator. Science 158: 769-771.
Knott, J. E. 1955. Vegetable Growing. Lea & Febiger, Philadelphia. p. 64-65.
Leventhal, E. L. 1966. SNAPOODLE isotope thruster /e lectr ic power unit. In: Radioisotopes for aerospace Part 2: Systems and Applications. (J. C. Dempsey and P . Polishuk, eds . ) , Pleneum P r e s s , New York. p. 409-426.
Lieberman, J. A. and G. B. Connor. 1966. Safety considerations in the use of nuclear devices in space. Health Phys. 12: 743-750.
Lindsay, W. L. and W. A. Nor veil. 1969. Equilibrium relationships of Zn2+, Fe 3 +, Ca2+ and H+ with EDTA and DTPA in soils. Soil Sci. Soc. Amer. Proc . 33:62-68.
Luikens, R. J. 1969. Search and recovery operation: SNAP-19/ Nimbus B generators. SC-DR-68-906 (Sandia Laboratories) 105 p.
Mayer, S. W. and E. R. Tompkins. 1947. Ion exchange as a separations method. III. Equilibrium studies of the reactions of r a r e earth complexes with synthetic ion exchange resins. _J Amer. Chem. Soc. 69: 2859-2866.
Mayneord, W. V. and C. R. Hill. 1966. Spectroscopic identification of alpha emitting nuclides in biological material . Nature 184: 667-668.
Mayneord, W. V. , R. C. Turner , J. M. Radley. 1960. Alpha activity of certain botanical materials . Nature 187: 208-211.
Menzel, R. C. 1953. Polonium uptake in plants. Agriculture Research Service, U. S. Dept. of Agriculture. AECU4119.
Osborne, R. V. 1963. Lead 210 and polonium 210 in human t issues. Nature 199: 295.
Osburn, W. S. 1965. Primoridal radionuclides: their distribution, movement, and possible effect within te r res t r ia l ecosystems. Health Phys. 11: 1275-1295.

130
Overman, R. T. and H. M. Clark. 1960. Radioisotope Techniques. McGraw-Hill Book Co. , Inc. 476 p.
Peterson, P . J. and G. W. Butler. 1962. The uptake and assimilation of selenite by higher plants. Australian J. of Biol. Sci. 15: 126-146.
Radford, E. P . and V. R. Hunt. 1964. Polonium-210: a volatile radioelement in cigarettes. Science 143: 247-249.
Report of the Ad Hoc Committee on the Nuclear Space Program. 1966. An evaluation of information on the safety of radioisotope space systems. Atomic Industrial Forum Inc. 44 p.
Research and Development Report. 1967. Pu-238 and Po-210 Data sheets. MLM-1441. (Mound Laboratory), p. 69-89.
Rhodes, D. W. 1957 a. Adsorption of plutonium by soil. Soil Sci. 84: 465-471.
Rhodes, D. W. 1957 b. The effect of pH on the uptake of radioactive isotopes from solution by soil. Soil Sci. Soc. Amer. Proc . 21: 389-392.
Rodden, R. M. 1967. Radioisotope energy sources for small manned Antarctic stations. Nucl. Appl. 3: 226-232.
Rosenfeld, I. and O. A. Beath. 1964. Selenium: geobotany, biochemistry, toxicity and nutrition. Acad. P r e s s , New York. 411 p.
Rovira, A. D. 1962. Plant-root exudates in relation to the rhizosphere microflora. Soils Fer t . 25: 167-172.
Schroeder, M. C. and M. C. Crocker, J r . 1967. Study of the possible contamination of ground water from radioactive packages impacting on land - annual report. SC-CR-67-2708 (Sandia Laboratories). p. 9-13.
Smith, A. L. 1949. Separation of the selenium compounds in seleni-ferous plant protein hydrolysates by paper partition chromatography. M. S. Thesis. South Dakota State College of Agriculture and Mechanical Ar t s , Brookings. 33 p.

131
Smith, I. 1966. Chromatography and Electrophoretic Techniques, Vol. I. Interscience Publishers Inc. , New York. p. 104-169.
Snedecor, G. W. and W. G. Cochran. 1967. Statistical Methods. 6th ed. Iowa State Univ. P r e s s , Ames. 593 p.
Telfair, D. , R. Garrison, C. Smith. 1960. Natural radioactivity of Miami soils. Science 131: 727-728.
Thomas, R. G. and J. N. Stannard. 1964. Some characteristics of polonium solutions of importance in biological experiments. Radiat. Res. Supplement 5: 23-28.
Tso, T. C. and I. Fisenne. 1968. Translocation and distribution of lead-210 and polonium-210 supplied to tobacco plants. Radiat. Bot. 8: 457-462.
Tso, T. C. , N. A. Hallden, L. T. Alexander. 1964. Radium-226 and polonium-210 in leaf tobacco and tobacco soil. Science 146: 1043-1045.
Tso, T. C. , N. Harley, L. T. Alexander. 1966. Source of lead-210 and polonium-210 in tobacco. Science 153: 880.
Vohra, K. G. , M. C. Subbaramu, A. M. M. Rao. 1964. Measurement of radon in soil gas. Nature 201: 37-39.
Watters, R. L. and W. R. Hansen. 1970. The hazards implication 91 n of the transfer of unsupported * l u P o from alkaline soil to plants.
Health Phys. 18: 409-414.
Weigel, F . 1959. The Chemistry of Polonium (Transl. from German) AI-TRANS 94. (Atomics International). 39 p.
Willis, C. A. , E. T. Bramlitt , R. B. Paulson, K. L. Rooney. 1967. Safety characteristics of Po-210. SC-CR-67-2801. (Sandia Laboratories), p. 75.
Ziv, D. M. and I. A. Efros. 1959. Determination of polonium hydroxide solubility. Radiokhimiva 1:290-294. (Chem. Abstr. 53:9787).