· cnmi april 2014 resubmission part b state annual performance report (apr) for ffy 2012 cnmi...
TRANSCRIPT

CNMI April 2014 Resubmission
Part B State Annual Performance Report (APR) for FFY 2012
CNMI Part B APR for FFY 2012 (2012-2013), April 28, 2014 1
Overview of the Annual Performance Report Development: The CNMI Public School System (PSS), Special Education Program (IDEA Part B) facilitated a process for ensuring broad stakeholder involvement in the development of the CNMI IDEA Part B 2012-2013 Annual Performance Report (APR). Stakeholders included the Special Education State Advisory Panel (SESAP), school administrators, program managers, special education teachers, related service personnel and early childhood special education personnel. The review process included a discussion of OSEP’s CNMI Part B Determination Letter issued on July 1, 2013, the compliance matrix, the response table, current performance data, and improvement activities. In order to evaluate the effectiveness of SPP improvement activities, stakeholders were presented with the CNMI trend data for each Indicator. As noted in the Improvement Activity Table for each indicator, the improvement activities are organized in several categories that the stakeholders felt would have an impact on the indicator data. With technical assistance provided by the University of Guam Center for Excellence in Developmental Disabilities Education, Research, and Service (Guam CEDDERS), the stakeholders reviewed the trend data from each indicator and engaged in a discussion of the indicator progress or slippage, previous year’s activities, and whether the improvement activities needed to be revised, deleted, continued, or moved to another indicator. The development of the 2012-2013 APR included the following activities: July 2013: OSEP’s July 1, 2013 Part B “Determination” Letter, Compliance Matrix and Response
Table were disseminated to the Special Education State Advisory Panel (SESAP), the CNMI Board of Education and school leadership. The Determination Letter and Response Table were also posted on the PSS website for public dissemination.
August 27-28, 2013: PSS State level professional development for special education and general
education personnel included a review of OSEP’s July 1, 2013 Part B “Determination” Letter, Compliance Matrix and Response Table, as well as discussions regarding OSEP’s Results Driven Accountability (RDA) and the new State Systematic Improvement Plan (SSIP).
September 26, 2013: Guam CEDDERS facilitated a discussion with the PSS School Leadership
Team and SESAP members regarding the SSIP and priorities for academic programming for students with significant cognitive disabilities. The intended outcomes were to increase understanding of RDA, learner characteristics of students with significant cognitive disabilities, and how to access resources to improve academic teaching and learning for students requiring an alternate assessment based on alternate achievement standards.
October 28-31, 2013: CNMI participated in the “WRRC Regional Leadership Forum” sponsored by
the Western Regional Resource Center (WRRC). The focus of the forum was to discuss the implications of OSEP’s new RDA system and how the Pacific jurisdictions were going to meet the new requirements. The forum included discussions on fiscal accountability and how RDA will be used in the upcoming determinations.
November 8, 2013: Guam CEDDERS provided technical support to the Special Education Program
which included a review of assessment data, monitoring data, and post-school outcomes data. December 16, 2013: The Part B APR Executive Summary with Indicator trend data was provided to
the CNMI PSS Commissioner’s Leadership Team for review and input. January 9, 2014: Guam CEDDERS provided technical support during CNMI’s SESAP meeting, the
main stakeholder group for CNMI’s Part B Program. Guam CEDDERS presented information on OSEP’s RDA and how OSEP will make determinations in 2014. SESAP members reviewed the final DRAFT FFY 2012 APR with trend data presented for each indicator in comparison with national data.

CNMI April 2014 Resubmission
Part B State Annual Performance Report (APR) for FFY 2012
CNMI Part B APR for FFY 2012 (2012-2013), April 28, 2014 2
SESAP members provided input to the APR and agreed that the targets would not be revised. SESAP feedback on the APR has been incorporated into the final APR for submission.
January 10, 2014: The FFY 2012 Part B APR was submitted to the Fiscal, Personnel and
Accountability subcommittee of the Board of Education for review and approval. January 17, 2014: The Board of Education approved the FFY 2012 Part B APR for submission to
OSEP. OSEP Memorandum 14-2, October 30, 2013 OSEP Memorandum 14-2 provided additional instructions for the development of the FFY 2012 APR. OSEP provided options for each state/entity to consider in the APR development. CNMI Part B is reporting the following options chosen: • Indicator 2: CNMI Part B chooses to use the same data source and measurement used in the FFY
2010 APR. CNMI Part B submits the required Indicator 2 data and information in this APR.
• Indicator 20: CNMI Part B chooses to wait for OSEP’s calculation of CNMI’s compliance with Indicator 20 requirements. As communicated by OSEP during the November 2013 TA call, states/entities will have an opportunity to respond to OSEP’s Indicator 20 calculation during “clarification” period anticipated in April/May 2014.
• Improvement Activities: CNMI Part B chooses to keep the same format for its improvement activities under each indicator as in previous years, instead of creating one set of improvement activities for the APR referenced to each indicator.
CNMI will continue to use the following format to report on improvement activities within each Indicator. The improvement activities are organized by areas of priority needs for improvement and color-coded to show the “status” of each improvement activity. Not all indicators utilized every category of improvement as there might not have been a need for that indicator. The improvement activities listed as “completed” in the 2011-2012 APR (color coded in pink) were removed from this APR.
The improvement categories identified are as follows:
Improve Data Collection and Reporting Improve Administration and Monitoring
Review Policies and Procedures Training and Professional Development
Provide Technical Assistance Collaboration and Coordination
Increasing and or Adjusting FTE’s Other
The following table displays the “status” of the improvement activity with the color codes:
Completed Rose Continuing Lavender
Revised Light Blue New Light Green
Moved or Deleted Yellow

CNMI April 2014 Resubmission
Part B State Annual Performance Report (APR) for FFY 2012
CNMI Part B APR for FFY 2012 (2012-2013), April 28, 2014 3
Public Dissemination CNMI has posted its complete revised SPP, which includes any revisions to the SPP based on the FFY 2011 APR submission in 2013, on the PSS website at: http://www.cnmipss.org/?page_id=969. • By February 15, 2014, the CNMI will update the complete revised SPP with the status of
improvement activities reported in the FFY 2012 Part B APR. The complete revised SPP will be posted with the FFY 2012 Part B APR on the PSS website at: http://www.cnmipss.org/?page_id=969.
• By June 30, 2014, upon receipt of OSEP’s Determination Letter and Response Table for CNMI’s FFY 2012 (2012-2013) Part B APR, CNMI PSS will post OSEP’s Determination Letter and Response Table with CNMI’s FFY 2012 (2012-2013) Part B APR and SPP on the PSS website at: http://www.cnmipss.org/?page_id=969 for the SPP/APR and http://www.cnmipss.org/?page_id=869 for the Determination Letter.
• CNMI will disseminate and make available hard copies of CNMI’s FFY 2012 (2012-2013) Part B APR
to parents and public and private agencies/organizations, including, at least, the following:
The CNMI Office of the Governor Community Guidance Center The CNMI Legislative Committee on Education The Developmental Disabilities Council Offices of the Mayor for Saipan, Rota, and Tinian State Independent Living Council Public School System Board of Education Office of Vocational Rehabilitation Secretary of Commonwealth Health Center The Protection and Advocacy System Office

CNMI April 2014 Resubmission
Part B State Annual Performance Report (APR) for FFY 2012
CNMI Part B APR for FFY 2012 (2012-2013), April 28, 2014 4
Overview of the Annual Performance Report Development: Refer to page 1 of this APR for development description.
Monitoring Priority: FAPE in the LRE
Indicator 1: Percent of youth with IEPs graduating from high school with a regular diploma. (20 U.S.C. 1416 (a)(3)(A))
Measurement: States must report using the adjusted cohort graduation rate required under the ESEA.
FFY Measurable and Rigorous Target
2012
(2012-2013)
As per OSEP’s instruction, FFY 2012 (2012-2013) required reporting is the state’s examination of data for the year before the reporting year (e.g. for the FFY 2012 APR, use data from 2011-2012). Therefore, for Indicator 1, the actual data for FFY 2012 will be the FFY 2011 data. 93% of youth with IEPs will graduate with a high school diploma. (CNMI does not report graduation rate targets under ESEA Title 1)
Actual Target Data for FFY 2012 (2012-2013): As per OSEP’s instruction, Actual Target Data will be the actual data from FFY 2011 (2011-2012): Table 1: % of Youth with IEPs Graduating with a Regular Diploma in FFY 2009, 2010, & FFY 2011
School Year Special Education
Senior Enrollment*
# of Youth with IEPs graduating from high school with a regular
diploma
% of Youth with IEPs graduating from high school with a regular
diploma. 2009 - 2010 41 24 (24/41 x 100) = 59% 2010 - 2011 54 42 (42/54 x 100) = 78% 2011 - 2012 63 45 (45/63 x100) = 71%
*Student record reviews indicated the number of students that had the required credits for “senior” status.
Data Source: As an outlying area, CNMI does not report graduation data to the Department under ESEA Title 1. For this reporting period, 2011-2012, CNMI used required credits for senior status at the beginning of the school year to determine the number of seniors with IEPs. The 2011-2012 actual data provided in Table 1 shows that of the 63 seniors with IEPs, 45 or 71% graduated from high school with a regular diploma. The 18 seniors with IEPs who did not graduate in June 2012 were due to the reasons listed in Table 2. Table 2: Reasons Seniors with IEPs Did Not Graduate in SY 2011-2012
# Reasons for Not Graduating 2 Dropped Out of School 11 Lacked course credit requirements for graduation. Students continued as seniors for SY 2012-2013 3 Reached Maximum Age 2 Transfer to Regular education
18 TOTAL

CNMI April 2014 Resubmission
Part B State Annual Performance Report (APR) for FFY 2012
CNMI Part B APR for FFY 2012 (2012-2013), April 28, 2014 5
Further analysis of the graduation data was conducted to review the graduation rates of students by high school. As noted in Table 3, THS reported 100% or 3 of 3 seniors with IEPs graduated. The performance of the other high schools ranged from 38% at SSHS to 90% at RHS.
Table 3: Graduation for Special Education for FFY 2011 - 2012 by School
School
Special Education (a)
# of Youth with IEPs who Graduated
(b)
# of Seniors with IEPs
(c)
# & % of Seniors with IEPs Graduating
(a)/(b) x 100 KHS 11 15 11/15 x 100 = 73% MHS 19 27 19/27 x 100 = 70% SSHS 3 8 3/8 x 100 = 38% RHS 9 10 9/10 x100 = 90% THS 3 3 3/3 x100 = 100
TOTAL 45 63 45/63 x 100 = 71% Graduation Requirements: CNMI PSS continues to monitor the graduation rate of all students in the PSS including students with disabilities. In school year 2005-2006, the Board of Education (BOE) Policy 60-20-434: Graduation Requirements was revised from 21 credits to 28 credits (23 credits for required subjects and 5 elective credits) to receive a high school diploma. The credit requirements for graduating with a high school diploma apply also to students with disabilities. Discussion of Improvement Activities and Explanation of Slippage, if the State did not meet its target, that occurred for FFY 2012 (2012-2013): As per OSEP’s instructions, for this APR, CNMI reports FFY 2011 (2011-2012) data. FFY 2011 Performance: 71% or 45 of 63 seniors with IEPs graduated with a high school diploma indicating a slippage from last year’s reporting of 78% (42/54). CNMI did not meet its target of 93%. It should be noted that the number of enrolled seniors and graduates with an IEP increased from 2010-2011 to 2011-2012. The total number of enrolled seniors with an IEP was 63 in 2011-2012, an increase of 9 enrolled seniors with an IEP from 54 in 2010-2011. The total number of graduates with an IEP was 45 in 2011-2012, an increase of 3 from 42 in 2010-2011, representing a 7% increase in the number of graduates with an IEP. Further, of the 9 seniors with an IEP who were reported the previous year in 2010-2011 as not graduating and continuing school, 44% (4/9) completed all required course credits to graduate the following year in 2011-2012, 33% (3/9) graduated in 2012-2013, and 22% (2/9) exited high school by reaching maximum age. This means that the majority of continuing seniors or 78% (7/9) of the 2010-2011 seniors with an IEP who did not have enough credits to graduate by June 2011, eventually graduated with a high school diploma within 2 years of their senior class status in high school. Of the 18 seniors with IEPs who did not graduate in 2011-2012, 11 or 61% of these students continued school in 2012-2013. Of the 11, 55% (6/11) completed all required course credits to graduate the following year in 2012-2013, 18% (2/11) exited high school by reaching maximum age, and 27% (3/11) are still in school and are working towards completing their high school graduation credit requirements in 2013-2014. Similar to the graduation outcomes reported for the 2010-2011 seniors with an IEP that continued school, it is anticipated that the majority or 82% (9/11) of the seniors with an IEP in 2011-2012 that continued school in 2012-2013 will graduate within 2 years of their senior class status in high school.

CNMI April 2014 Resubmission
Part B State Annual Performance Report (APR) for FFY 2012
CNMI Part B APR for FFY 2012 (2012-2013), April 28, 2014 6
CNMI has the ability to track and support youth with IEPs to complete required course credits to graduate with a high school diploma. As evidenced by the graduation outcomes for those seniors with an IEP who didn’t graduate in 2010-2011 and 2011-2012, the majority of those enrolled as seniors that didn’t graduate eventually receive their high school diploma. The Public School System, under the leadership of the Commissioner of Education, continues to explore options for students at risk of dropping out to stay in school or return to school if previously dropped out. All schools are required to submit improvement plans that address efforts to improve the academic performance of all students. Based on student performance data, the school leadership is required to allocate a percentage of school funds to address the needs of students at risk of dropping out due to low academic performance. PSS continues to use a panel review process to review improvement plans and give additional suggestions on school goals or activities. Behavioral Specialists also facilitate a system of Positive Behavioral Interventions and Supports (PBIS) to assist the schools with at risk students. The Northern Marianas College (NMC), in collaboration with PSS and other agencies and community organizations, such as the Workforce Investment Agency and the Mayor’s office, continue to facilitate the Start Smart Seminar, funded by the Access College Grant. The Start Smart Seminar aims to prepare and encourage high school seniors, including students with disabilities to enroll in college, preferably at NMC. Seniors spend the day with college and career counselors who assist them with college processes, such as registration requirements, financial assistance, placement tests, course requirements, etc... This seminar has helped ease the anticipation and anxiety of students who want to enroll in college. Revisions, with Justification, to Proposed Targets/Improvement Activities/Timelines/Resources for FFY 2013: CNMI did not revise the target. As discussed on page 2 of this APR, the improvement activities are organized by areas of priority needs for improvement and color coded to show the “status” of each improvement activity. Although this FFY 2012 reporting year is the last year of the FFY 2005-2012 SPP, CNMI has updated the status of each improvement activity, including the continuation, if appropriate, of the improvement activity in FFY 2013. The following table displays the “status” of the improvement activity with the color codes:
Completed Rose Continuing Lavender
Revised Light Blue New Light Green
Moved or Deleted Light Yellow
2013-2014 IMPROVEMENT ACTIVITY TABLE Improvement
Category
Improvement Activity
Timeline
Resource
Status Improve Data Collection and
Reporting
Review data submissions with Data Managers to corroborate official reports.
Quarterly through
FFY 2012
Data Manager, School Admin., and SpEd staff
Completed 2012-2013
Continue to implement the Cutting Edj Data Collection System. Provide training on the Cutting Edj Data Collection System. to new teachers.
Annually through
FFY 2012
SpEd Special
Educators
Continuing

CNMI April 2014 Resubmission
Part B State Annual Performance Report (APR) for FFY 2012
CNMI Part B APR for FFY 2012 (2012-2013), April 28, 2014 7
Improvement Category
Improvement Activity
Timeline
Resource
Status
Improve Administration and
Monitoring
Review and verify submission of Student Data Sheet of students graduating.
In June each year through
FFY 2012
SpEd Compliance,
Data Manager, and Teachers
Completed 2012-2013
Annual review of graduation data by school administrators. School Administrators will drill down to determine the cause of students not graduating from their schools.
Annually in June through
FFY 2012
School Admin Completed 2012-2013
Training and Professional Development
Provide Training with General Education Teachers on Accommodations, Modifications and Teaching Strategies.
Annual System Professional Development
(PD) Days and School-level PD
through FFY 2012
Transition Coordinator with support from Guam CEDDERS.
Continuing
Continue Training on Positive Behavior Supports.
Annually in June of the year
through FFY 2012
Behavior Specialists
Continuing
Provide Technical Assistance
Provide training and resource materials to IEP team members on the credit requirements under the amended BOE Policies 60-20-434 to improve graduation rates, and transition requirements.
Annually through
FFY 2012
Secondary Transition
Coordinator
Continuing
Collaboration and Coordination
Provide training opportunities for parents on the IEP process to ensure understanding of the alignment of credits and IEP.
June - July at parent forums
through FFY 2012
Transition Coordinator
Parent Group
Continuing
Participate in the Transition Network Collaborative agency effort that focuses on successful transitioning of students into postsecondary outcomes.
At least Quarterly through
FFY 2012
Transition Coordinator
Continuing

CNMI
Part B State Annual Performance Report (APR) for FFY 2012
CNMI Part B APR for FFY 2012 (2012-2013) 8
Overview of the Annual Performance Report Development: Refer to page 1 of this APR for development description.
Monitoring Priority: FAPE in the LRE
Indicator 2: Percent of youth with IEPs dropping out of high school. (20 U.S.C. 1416 (a)(3)(A)) FFY 2010 Measurement: States must report using the dropout data used in the ESEA graduation rate calculation and follow the timeline established by the Department under the ESEA. FFY 2012 Measurement: States must report a percentage using the number of youth with IEPs (ages 14-21) who exited special education due to dropping out in the numerator and the number of all youth with IEPs who left high school (ages 14-21) in the denominator. Data Source: Same data as used for reporting to the Department under IDEA section 618.
FFY Measurable and Rigorous Target
2012
(2012 - 2013)
Pursuant to OSEP Memorandum 14-2, for Indicator 2, CNMI chooses to report using the same data source and measurement that the State used for its FFY 2010 APR, which includes the state’s examination of data for the year before the reporting year. Therefore, the target and actual data for FFY 2012 will be the FFY 2011 target and data.
2011
(2011 - 2012)
0% of Youth with IEPs drop out of high school.
Actual Target Data for FFY 2012 (2012-2013): As per OSEP’s options for Indicator 2 reporting, Actual Target Data will be the actual data from FFY 2011 (2011-2012): Per OSEP Memorandum 14-2, CNMI will report using the same data source and measurement that the CNMI used for its FFY 2010 APR that was submitted on February 1, 2012. Table 1: # and % of Drop Outs for Special Education for FFY 2009, FFY 2010 & FFY 2011:
School Year
Special Education (a)
Enrollment of Youth with IEPs in Grades 9 - 12
(b)
# of Youth with IEPs who Dropped out of High School
(c)
% of Youth with IEPs Dropping out of High School
(b)/(a) x 100 2009-2010 273 15 (15/273 x 100) = 5.5% 2010-2011 277 16 (16/277 x 100) = 5.7% 2011-2012 255 13 (13/255 x 100) = 5%
Source: 618 Data Table 4; PSS PEDMS Student Enrollment Data Table As an outlying area, CNMI does not report dropout data used in ESEA graduation rate calculation to the Department under ESEA Title 1. CNMI uses an event rate of calculating dropout data; the incidence of students who drop out in a single year without completing high school compared to the student enrollment in grades 9-12 for that school year (618 exit data and high school enrollment). The 2011-2012 actual data provided in Table 1 shows that of the 255 students with IEPs enrolled in grades 9 through 12, 5% (13/255) dropped out of high school.

CNMI
Part B State Annual Performance Report (APR) for FFY 2012
CNMI Part B APR for FFY 2012 (2012-2013) 9
Definition of Dropout: The CNMI PSS uses the OSEP 618 definition for “Dropped Out” which states: the total number of students who were enrolled at the start of the reporting period, but were not enrolled at the end of the reporting period, and did not exit through any other method. This includes dropouts, runaways, GED recipients, expulsions, status unknown, students who moved and are not known to be continuing in another educational program, and students exiting the system in other ways. This method of collecting dropout data is consistent for all students. Discussion of Improvement Activities and Explanation of Slippage, if the State did not meet its target, that occurred for FFY 2012 (2012-2013): As per OSEP’s options for Indicator 2 reporting, for this APR, CNMI reports FFY 2011 (2011-2012) data and compares it to CNMI’s FFY 2011 (2011 - 2012) target. FFY 2011 Performance: 5% (13/255) represents progress from last year’s report of 5.7% (16/277). CNMI did not meet its FFY 2011 target of 0%. Table 2 shows the breakdown of drop-outs by high schools. The range of youth with IEPs who dropped out was from one at Tinian High School (THS) to six at Kagman High School (KHS), with all high schools reporting at least one youth with an IEP dropping out of high school. Table 2: Enrollment and % of Drop Outs for Special Education for FFY 2011-2012 by School
School
Special Education Enrollment of Students with IEPs in grades 9 -
12
# of Youth with IEPs dropping out of high
school
% of Youth with IEPs dropping out of high school
KHS 60 6 6/60 x 100 = 10% MHS 99 4 4/99 x 100 = 4% RHI 23 1 1/23 x 100 = 4.3%
SSHS 54 1 1/54 x 100 = 1.8% THS 19 1 1/19 x 100 = 5.2%
TOTAL 255 13 13/255 x 100 = 5% As discussed earlier, CNMI demonstrated progress in the percentage of youth with IEPs dropping out of high school from FFY 2010 to FFY 2011. The difference in percentage from FFY 2010 to FFY 2011 was .7%, with the number of youth with IEPs dropping out decreasing by three from 16 in FFY 2010 to 13 in FFY 2011, which represents a decrease of 19%. The Public School System offers “credit recovery” programs in the summer months to allow students to make up credits in order for them to stay on track with their course of study. In 2011-2012, PSS initiated online classes as another method of credit acquisition for all students. Several years ago, the PSS established and continues to provide an Alternate Education Program to serve all students at risk for dropping out including students with disabilities. Revisions, with Justification, to Proposed Targets/Improvement Activities/Timelines/Resources for FFY 2013: CNMI did not revise the target. As discussed on page 2 of this APR, the improvement activities are organized by areas of priority needs for improvement and color-coded to show the “status” of each improvement activity. Although this FFY 2012 reporting year is the last year of the FFY 2005-2012 SPP, CNMI has updated the status of each improvement activity, including the continuation, if appropriate, of the improvement activity in FFY 2013.

CNMI
Part B State Annual Performance Report (APR) for FFY 2012
CNMI Part B APR for FFY 2012 (2012-2013) 10
The following table displays the “status” of the improvement activity with the color codes:
Completed Rose Continuing Lavender
Revised Light Blue New Light Green
Moved or Deleted Light Yellow
2013-2014 IMPROVEMENT ACTIVITY TABLE Improvement
Category
Improvement Activity
Timeline
Resource
Status Improve Data Collection and
Reporting
Standardize the process involved in collecting, analyzing and reporting and using dropout data.
Ongoing through FFY 2012
COE School Admin
SpEd Staff
Completed 2012-2013
Improve
Administration and Monitoring
Review data submissions to align with decrease dropout rate of student’s w/IEPs. School Admin to report data to COE at regular monthly Principal and Program manager meetings.
Monthly Reports through
FFY 2012
School Admin Part B Data
Manager
Completed 2012-2013
School Admin to drill down to determine the root cause of students dropping out and get input from the parents. School Admin to conduct informal interviews of students who dropped out to determine the reasons.
Annually through
FFY 2012
School Leadership
Completed 2012-2013
Training and Professional Development
Provide training on Intervention strategies for improving dropout rates for all high school students. School Teams meet to discuss intervention strategies to encourage students to stay in school.
School teams, in collaboration with the Secondary Transition Coordinator and Behavioral Specialist, to continue to explore options to encourage students to stay in school or return to school if previously dropped out.
At least monthly through
FFY 2012
School Admin, School
Psychologist, and Behavior
Specialist
Continuing
Provide training to Secondary Transition Focus Group members on strategies to ensure compliance with BOE policies for drop out or withdrawal.
Annually in March through
FFY 2012
Secondary Transition
Coordinator
Continuing
Provide Technical
Assistance
Monthly collection of discipline reports from all schools to determine to allow for earlier intervention of possible dropout. Meetings are held at each school to review data and create strategies to prevent students from dropping out of school.
Ongoing Monthly Staff
meetings school level through
FFY 2012
Behavior Specialist,
School Teams Transition
Coordinator
Continuing

CNMI April 2014 Resubmission
Part B State Annual Performance Report (APR) for FFY 2012
CNMI Part B APR for FFY 2012 (2012-2013), April 28, 2014 11
Overview of the Annual Performance Report Development: Refer to page 1 of this APR for development description. Monitoring Priority: FAPE in the LRE Indicator 3: Participation and performance of children with IEPs on statewide assessments:
A. Percent of districts with a disability subgroup that meets the State’s minimum “n” size that meet the State’s AYP/AMO targets for the disability subgroup.
B. Participation rate for children with IEPs. C. Proficiency rate for children with IEPs against grade level, modified, and alternate
academic achievement standards.
(20 U.S.C. 1416 (a)(3)(A))
Measurement:
A. (Choose either 3A.1 or 3A.2)
A.1 AYP percent = [(# of districts with a disability subgroup that meets the State’s minimum “n” size that meet the State’s AYP targets for the disability subgroup) divided by the (total # of districts that have a disability subgroup that meets the State’s minimum “n” size)] times 100.
A.2 AMO percent = [(# of districts with a disability subgroup that meets the State’s minimum “n” size that meet the State’s AYP targets for the disability subgroup) divided by the (total # of districts that have a disability subgroup that meets the State’s minimum “n” size)] times 100.
B. Participation rate percent = [(# of children with IEPs participating in the assessment) divided by the (total # of children with IEPs enrolled during the testing window, calculated separately for reading and math)]. The participation rate is based on all children with IEPs, including both children with IEPs enrolled for a full academic year and those not enrolled for a full academic year.
C. Proficiency rate percent = ([(# of children with IEPs enrolled for a full academic year scoring at or above proficient against grade level, modified and alternate academic achievement standards) divided by the (total # of children with IEPs who received a valid score and for whom a proficiency level was assigned, and, calculated separately for reading and math)]. The proficiency rate includes both children with IEPs enrolled for a full academic year and those not enrolled for a full academic year.
FFY Measurable and Rigorous Target
2012
(2012-2013)
A. Not Applicable to CNMI. B. 100% Participation rate of children with IEPs. C. 40% Proficiency rate for children with IEPs against grade level, modified and
alternate academic achievement standards. Actual Target Data for FFY 2012 (2012-2013): All students in the CNMI, with and without disabilities, in grades 3-12, are required to participate in the statewide assessments. As reported in the 618 Data Table 6, participation data was provided for students with disabilities who participated in the SY 2012-2013 CNMI’s Statewide Standards Based Assessment (SBA) in math and reading for grades 3 through 8, and an “End of Course” test for the secondary schools. The Stanford Achievement Test 10th Edition is also a district approved state assessment, which is administered in some of the grade levels. Alternate Assessments based on

CNMI April 2014 Resubmission
Part B State Annual Performance Report (APR) for FFY 2012
CNMI Part B APR for FFY 2012 (2012-2013), April 28, 2014 12
Alternate Achievement Standards (AA-AAS) continues to be used for students with significant cognitive disabilities in math and reading for grades 3 through 12. Measurement A: Does not apply to the CNMI. Measurement B: Participation Rate 618 Data Table 6 : Statewide Math Assessment for SY 2012-2013 – Participation
2012-2013 Statewide Assessment
3B. PARTICIPATION: MATH Assessment Grade
3 Grade
4 Grade
5 Grade
6 Grade
7 Grade
8 Grade
11 TOTAL
# %
a.
Children with IEPs 55 69 75 79 105 83 45 511
b.
Regular assess
with NO accommodations
3 3 1 3 1 0 6 17 3.3%
c.
Regular assess
with accommodations
38 58 63 63 80 70 37 409 80.0%
d. AA against grade-level academic achievement
standards
CNMI does not have an alternate assessment (AA) that tests children against grade-level academic achievement standards.
e. AA against modified
academic achievement standards
CNMI does not have an alternate assessment (AA) that tests children against modified academic achievement standards.
f.
AA against alternate academic
achievement standards
9 8 10 13 5 11 2 58 11.4%
Overall: [(b + c + d + e
+f) divided by a] 50
91% 69
100% 74
99% 79
100% 86
82% 81
98% 45
100 484 94.7% = 95%
Children with IEPs included in “a” but not included in the other subcategories:
Absent 5 0 1 0 19 2 0 27 5%
618 Data Table 6 : Statewide Reading Assessment for SY 2012-2013 - Participation
2012-2013
Statewide Assessment
3B. PARTICIPATION: READING Assessment Grade
3 Grade
4 Grade
5 Grade
6 Grade
7 Grade
8 Grade
11 TOTAL
# %
a.
Children with IEPs 55 69 75 79 105 83 45 511
b.
Regular assess
with NO accommodations
3 3 1 3 1 0 6 17 3.3%
c.
Regular assess
with accommodations
39 58 63 63 79 72 32 406 79.5%
d. AA against grade-level academic achievement
standards
CNMI does not have an alternate assessment (AA) that tests children against grade-level academic achievement standards.
e. AA against modified
academic achievement standards
CNMI does not have an alternate assessment (AA) that tests children against modified academic achievement standards.

CNMI April 2014 Resubmission
Part B State Annual Performance Report (APR) for FFY 2012
CNMI Part B APR for FFY 2012 (2012-2013), April 28, 2014 13
2012-2013
Statewide Assessment
3B. PARTICIPATION: READING Assessment Grade
3 Grade
4 Grade
5 Grade
6 Grade
7 Grade
8 Grade
11 TOTAL
# %
f.
AA against alternate
achievement standards
9 8 10 13 5 11 4 60 11.7%
Overall: [(b + c + d + e
+f) divided by a] 51
93% 69
100% 74
99% 79
100% 85
81% 83
100% 42
93% 483 94.5% = 95%
Absent 4 0 1 0 20 0 3 28 5%
Of the 511 students with IEPs in the tested grades for the SBA in the area of Math, 80% (409/511) used accommodations (excluding those who took AA-AAS) and 3.3% (17/511) did not require accommodations. Of the 511 students with IEPs in the tested grades for the SBA in the area of Reading, 79.5% (406/511) used accommodations (excluding those who took AA-AAS) and 3.3% (17/511) did not require accommodations. For the students who took an alternate assessment based on alternate achievement standards (AA-AAS), the percentage of those who participated in math and reading was 11.4% (58/511) and 11.8% (60/511), respectively. Measurement C: Proficiency Rate for students with IEPs who received a valid score and were enrolled for a full academic year and not a full academic year. 618 Data Table 6: Statewide Math Assessment SY 2012-2013 - Proficiency
2012-2013
Statewide Assessment
3C. PROFICIENCY: MATH Assessment Grade
3 Grade
4 Grade
5 Grade
6 Grade
7 Grade
8 Grade
11 TOTAL
# %
a.
Children with IEPs* 50 69 74 79 86 81 45 484
b.
Proficient or above in regular assess
with NO accommodations
3 2 0 1 0 0 0 6 1.2%
c.
Proficient or above in regular assess with accommodations
10 1 2 3 0 2 0 18 3.7%
d.
Proficient or above in AA against grade-level academic
achievement standards
CNMI does not have an alternate assessment (AA) that tests children against grade-level academic achievement standards.
e.
Proficient or above in AA against modified academic
achievement standards
CNMI does not have an alternate assessment (AA) that tests children against modified academic achievement standards.
f.
Proficient or above in AA against
alternate academic achievement
standards
2 6 1 3 1 0 1 14 2.9%
Overall: [(b + c + d + e + f) divided by a]
15/50= 30%
9/69= 13%
3/74= 4%
7/79= 9%
1/86= 1%
2/81= 2%
1/45= 2%
38/ 484
7.8%= 8%
*The number of children with IEPs in each tested grade represents those who took the test and received a valid score.

CNMI April 2014 Resubmission
Part B State Annual Performance Report (APR) for FFY 2012
CNMI Part B APR for FFY 2012 (2012-2013), April 28, 2014 14
618 Data Table 6: Statewide Reading Assessment SY 2012-2013 - Proficiency
2012-2013 Statewide Assessment
3C. PROFICIENCY: READING Assessment Grade
3 Grade
4 Grade
5 Grade
6 Grade
7 Grade
8 Grade
11 TOTAL
# %
a.
Children with IEPs* 51 69 74 79 85 83 42 483
b. Proficient or above in regular assess with
NO accommodations 1 1 0 1 1 0 1 5 1.0%
c. Proficient or above in regular assess with accommodations
1 5 2 2 2 8 1 21 4.3%
d.
Proficient or above in AA against grade-level
academic achievement standards
CNMI does not have an alternate assessment (AA) that tests children against grade-level academic achievement standards.
e.
Proficient or above in AA against modified academic
achievement standards
CNMI does not have an alternate assessment (AA) that tests children against modified academic achievement standards.
f. Proficient or above in AA against alternate
academic achievement
standards
2 4 0 2 1 1 2 12 2.5%
Overall: [(b + c + d + e +f) divided by a]
4/51= 8%
10/69= 14%
2/74= 3%
5/79= 6%
4/85= 5%
9/83= 11%
4/42= 10%
38/483
7.8%= 8%
*The number of children with IEPs in each tested grade represents those who took the test and received a valid score. Annual proficiency performance of all students in statewide assessments is disaggregated and reported by sub-categories. The following are the subcategories for reporting the data: Level 1-- Beginner, Level 2 -- Developing, Level 3 -- Proficient and Level 4 -- Advanced. These levels are used for compiling data for district and national reports. As noted in the proficiency tables, overall FFY 2012 proficiency for students with disabilities in the area of math was 8% (38/484) and in the area of reading was 8% (38/483). Those students whose scores placed them in the levels of “proficient or advanced” are deemed proficient. Public Reporting Requirement for Assessment Data. As instructed, CNMI is required to provide the URL (electronic link) to the location where CNMI publicly reports on assessments for students with disabilities with the same frequency and in the same detail as it reports on the assessment of nondisabled students, pursuant to 34 CFR 300.160(f). The PSS reports are posted on the CNMI PSS website: http://www.cnmipss.org/?page_id=255. Discussion of Improvement Activities and Explanation of Slippage, if the State did not meet its target, that occurred for FFY 2012 (2012-2013): Measurement A: Does not apply to the CNMI. Measurement B: Participation Rate Performance and Target: CNMI did not meet its FFY 2012 target of 100% for both math and reading. • Math = 95% (484/511) remains the same from last year. • Reading = 95% (483/511) indicates slippage from last year’s report of 97.8% (511/522).
Measurement C: Proficiency Rate Performance and Target: CNMI did not meet its FFY 2012 target of 40% for both math and reading. • Math = 8% (38/484) indicates slippage from last year’s report of 21% (104/496). • Reading = 8% (38/483) indicates slippage from last year’s report of 16.6% (85/511).
The state participation rate for all students, as reported in the PSS publications of the Public School System Student Academic Achievement Reports, indicate that, “The NCLB requires that 95% of students be tested either on the regular assessment, the regular assessment with accommodations for special education students, or an alternate assessment for students with severe cognitive impairments”.

CNMI April 2014 Resubmission
Part B State Annual Performance Report (APR) for FFY 2012
CNMI Part B APR for FFY 2012 (2012-2013), April 28, 2014 15
100% 100% 100% 100% 100% 100% 100% 95%
96% 97% 95% 96.5% 95%
95%
93%
97% 96% 94% 95.8%
97.8%
95%
0%
10%
20%
30%
40%
50%
60%
70%
80%
90%
100%
2006-2007 2007-2008 2008-2009 2009-2010 2010-2011 2011-2012 2012-2013
SPP Target Participation Math Participation Reading Participation
Following this premise, the number and percent of students with IEPs who participated in the CNMI’s state-wide assessment system meets the district/NCLB participation requirements for math and reading in FFY 2012. Participation Trend Data The graph below displays CNMI’s participation trend data for reading and math over the past seven years. Although CNMI has not met its target of 100% participation, CNMI continues to meet the district/NCLB requirement of 95%.
Proficiency Trend Data The graph below displays CNMI’s proficiency trend data for reading and math over the past seven years. The proficiency rate for Math dropped by 13% and in Reading by 8.6% from FFY 2011 to FFY 2012, a daunting decline that falls below the FFY 2006 performance.
Under the leadership of the Commissioner of Education, the Public School System (PSS) has taken a closer look at the academic participation and performance of all students in the PSS. The 2012-2013 CNMI PSS Academic Achievement Report shows that the PSS academic achievement accountability (AYP) goal is that 50% of student tested on SAT 10 will be at or above the 50th percentile by 2010 and that ALL students will meet or exceed challenging performance standards [SBAs] by 2014. However, results show that only 31% of the SBA benchmarks were met in FFY 2012. Though some grades and
15% 20%
30%
40%
30% 35%
40%
11% 13%
27% 24% 28%
21.0%
8% 9.2% 12%
28%
23% 24% 16.6%
8% 0%
10%
20%
30%
40%
50%
60%
70%
80%
90%
100%
2006-2007 2007-2008 2008-2009 2009-2010 2010-2011 2011-2012 2012-2013
SPP Target Proficiency Math Proficiency Reading Proficiency

CNMI April 2014 Resubmission
Part B State Annual Performance Report (APR) for FFY 2012
CNMI Part B APR for FFY 2012 (2012-2013), April 28, 2014 16
some schools have met or exceeded AYP targets, the academic gains overall have not demonstrated improved results as anticipated, including performance results of students with disabilities. In the past few years, the PSS implemented several system wide initiatives that are intended to impact improved results for all students. In 2009-2010, the PSS adopted the Common Core State Standards with full implementation in all grades in 2012-2013. PSS also partnered with the National Center and State Collaborative (NCSC) for the development and implementation of an alternate assessment based on alternate achievement standards (AA-AAS) for student with significant cognitive disabilities. Other school level instructional supports include Classroom Instruction That Works, Universal Design for Learning, Understanding by Design, Response to Intervention, Success in Sight, Sheltered Instruction Observation Protocol (SIOP) and Positive Behavioral Intervention Support Systems. Principals are also required to conduct Power Walk Through for each teacher several times per year. The data derived from Power Walk Through show the level of instruction and student engagement, at the time of the observation. Power Walk Through data are discussed with each teacher to determine how or what the teacher must do to increase higher order thinking and improve overall instructional practices. The PSS has also implemented, in collaboration and partnership with AdvancED, a Teacher and Principal Evaluation System, and recently completed a system-wide accreditation with a district-wide on-site visit from AdvancED staff in October 2013. This state-wide accreditation process will assist the PSS to determine its effectiveness as a school system in preparing all students for college and careers, and allow for a systematic way for PSS to identify areas of strengths and opportunities for improvement. Follow up training and district level visits have continued around the many initiatives in the drive to improve student performance on state-level assessments. To further assist students with disabilities, the Pacific Assessment Consortium (PAC6) PACIFIC Project administered by Guam CEDDERS, in collaboration with the National Center and State Collaborative (NCSC), facilitated regional training events and on-site follow-up visits to assist PSS with examining the implications of incorporating “college and career ready” standards into the curriculum, instruction, and assessment framework for students with significant cognitive disabilities requiring an alternate assessment based on alternate achievement standards (AA-AAS). During the week of July 9-13, 2012, Guam CEDDERS in partnership with the NCSC, facilitated follow-up regional training activities on Guam for the PAC6 Cadres. PSS participated in the follow-up training for Cadres 1 and 2 that provided training to the Cadres to further their roles as local technical support for improving academic instruction for students participating in the AA-AAS and implementing the NAAC-PAC6 Student/Program Observation Tools. PSS also participated in the regional training on “Communication Supports for Instruction and Assessment” to examine the implications of implementing a “Communication Triage” in the instruction and assessment of students with significant cognitive disabilities requiring an AA-AAS. The training provided participants with the knowledge and skills for identifying appropriate communication supports, and facilitating access to the general curriculum through integrated environments for improving literacy outcomes. On October 5, 2012, a team of PSS special education and general education teachers and staff participated in an input session facilitated by Guam CEDDERS on the NCSC math resources developed for students participating in an AA-AAS. Another input session was held again on November 8, 2012, with all special education teachers and staff, introducing selected NCSC math resources. In December 2012, a team from CNMI met with the NCSC Project Director, Rachel Quenemoen, to discuss the transition to the CCSS and the NCSC alternate assessment, and also participated in the PACIFIC Project Leadership Team meeting on December 7-8, 2012, to review CNMI’s outcomes and identify next steps for continuing the PAC6 Journey in support of critical changes to curriculum, instruction, and assessment for students with significant cognitive disabilities requiring an AA-AAS. During the week of February 25-March 1, 2013, PSS participated in the “Thinking Through Collaboration” regional training on Guam facilitated by the North Central Regional Resource Center (NCRRC), the

CNMI April 2014 Resubmission
Part B State Annual Performance Report (APR) for FFY 2012
CNMI Part B APR for FFY 2012 (2012-2013), April 28, 2014 17
Western Regional Resource Center (WRRC), and Guam CEDDERS. This training provided a guide to increase educational results for all children through communication, cooperation, coordination, and collaboration while understanding how to use the GDIER process (G=goal, D=data, I=instruction and intervention, E=evaluation, R=results and reporting). PSS continues to receive on-site technical assistance from Guam CEDDERS through the NCSC Project with training given to PSS special education staff on August 27, 2013 around curriculum, instruction, and assessment and the NCSC SCHEMA for the Common Core State Standards. In October 2013, NCSC resources were shared with selected school teams, consisting of general education and special education teachers, teacher aides, and parents, to focus on improving the instructional design for one student requiring an AA-AAS to access the general curriculum with proper supports. Both the August and October training sessions were facilitated by Guam CEDDERS in collaboration with NCSC and PAC6 Leadership Assessment Teams. For school year 2012-2013, the Commissioner of Education (COE) implemented a new initiative that uses a 40% -- 40% -- 20% formula to address improved results for all students. 40% of the school funds are to focus on students who are at proficiency, 40% of the funds are to focus on students who are below proficiency, and 20% of the funds are to be used for evidence-based instruction, including instructional technology. In an effort to leverage resources, the COE implemented Cluster Schools (Central, Northern and Southern). The school clusters include elementary, junior and high schools. The clusters are required to meet monthly to address challenges, successes, and professional development as well as share resources from lawn equipment to staff, when necessary. Revisions, with Justification, to Proposed Targets / Improvement Activities / Timelines /Resources for FFY 2013: CNMI did not revise the targets. As discussed on page 2 of this APR, the improvement activities are organized by areas of priority needs for improvement and color coded to show the “status” of each improvement activity. Although this FFY 2012 reporting year is the last year of the FFY 2005-2012 SPP, CNMI has updated the status of each improvement activity, including the continuation, if appropriate, of the improvement activity in FFY 2013. The following table displays the “status” of the improvement activity with the color codes:
Completed Rose Continuing Lavender
Revised Light Blue New Light Green
Moved or Deleted Light Yellow
2013-2014 IMPROVEMENT ACTIVITY TABLE Improvement
Category
Improvement Activity
Timeline
Resource
Status Review and
Revise Policies and Procedures
PSS has adopted the Common Core State Standards for college and career readiness for all students with full implementation in all grades in school year 2012-2013. Focus will be on supporting students with IEPs access the general curriculum to improve academic achievement
School Year 2012-2013
The COE
School Leadership
Office of
Instructional Services
SpEd
Director
Continuing

CNMI April 2014 Resubmission
Part B State Annual Performance Report (APR) for FFY 2012
CNMI Part B APR for FFY 2012 (2012-2013), April 28, 2014 18
Improvement Category
Improvement Activity
Timeline
Resource
Status
Training and Technical Assistance
Continue training on Common Core State Standards and Core Content Connectors for students with significant cognitive disabilities, and instructional strategies, as per the PSS initiatives. Ensure that all staff are aware of and utilize CCSS and NCSC resources available on the web and through other TA resources. Provide onsite technical assistance to ensure instructional strategies and PSS initiatives are implemented with fidelity. Teachers
Annually through FFY 2012
Guam CEDDERS
NCSC/NCEO
Continuing
Improve Data Collection and
Reporting
School Leadership to conduct Power Walk Through and discuss data with teachers. School Leadership to ensure data is used to improve instruction.
Monthly as per PSS requirement
through 2012-2013
School Leadership
Continuing
Collaboration and
Coordination
The PSS will implement “School Clusters” in an effort to leverage resources and to encourage a focus on comprehensive and systematic professional development for all grade levels.
Quarterly Cluster Meetings
through 2012-2013
School Leadership
Office of
Instructional Services
Continuing

CNMI April 2014 Resubmission
Part B State Annual Performance Report (APR) for FFY 2012
CNMI Part B APR for FFY 2012 (2012-2013), April 28, 2014 19
Overview of the Annual Performance Report Development:
Refer to Page 1 of this APR for development description.
Monitoring Priority: FAPE in the LRE
Indicator 4: Rates of suspension and expulsion:
A. Percent of districts that have a significant discrepancy in the rate of suspensions and expulsions of greater than 10 days in a school year for children with IEPs; and
B. Percent of districts that have: (a) a significant discrepancy, by race or ethnicity, in the rate of suspensions and expulsions of greater than 10 days in a school year for children with IEPs; and (b) policies, procedures or practices that contribute to the significant discrepancy and do not comply with requirements relating to the development and implementation of IEPs, the use of positive behavioral interventions and supports, and procedural safeguards.
(20 U.S.C. 1416(a)(3)(A); 1412(a)(22)) Measurement: A. Percent = [(# of districts that have a significant discrepancy in the rates of suspensions and expulsions
for greater than 10 days in a school year of children with IEPs) divided by the (# of districts in the State)] times 100.
B. Percent = [(# of districts that have: (a) a significant discrepancy, by race or ethnicity, in the rates of suspensions and expulsions of greater than 10 days in a school year of children with IEPs; and (b) policies, procedures or practices that contribute to the significant discrepancy and do not comply with requirements relating to the development and implementation of IEPs, the use of positive behavioral interventions and supports, and procedural safeguards) divided by the (# of districts in the State)] times 100.
Include State’s definition of “significant discrepancy.”
FFY Measurable and Rigorous Target
2012 (2012-2013)
As per OSEP’s instruction, FFY 2012 (2012-2013) required reporting is the state’s examination of data for the year before the reporting year (e.g. for the FFY 2012 APR, use data from 2011-2012). Therefore, for Indicator 4, the target and actual data for FFY 2012 will be the FFY 2011 data.
2011
(2011-2012)
A. 0% significant discrepancy in the rate of suspension and expulsion greater
than 10 days in a school year between children with disabilities and children without disabilities.
B. Not applicable to CNMI. Actual Target Data for FFY 2012 (2012-2013): As per OSEP’s instruction, Actual Target Data will be the actual data from FFY 2011 (2011-2012): Table 1: % Suspension/Expulsion for General and Special Education for FFY 2011
FFY
Students Without IEPs Students With IEPs Target
Enrollment Ages 3-21
# Suspended for > than 10 days*
% Suspended for > than 10 days
Enrollment Ages 3-21
# Suspended for > than 10 days*
% Suspended for > than 10 days**
0% Difference
2011-2012 9,574 7 (7/9574) X 100 = .073% 931 1 (1/931) X 100
= 0.107% 0.034% or
0.0% * Source: PSS Individual School Discipline Reports for 2011-2012 **Source: IDEA 618 Data, Table 5: Report of Children with Disabilities Subject to Disciplinary Removal for more than 10 days

CNMI April 2014 Resubmission
Part B State Annual Performance Report (APR) for FFY 2012
CNMI Part B APR for FFY 2012 (2012-2013), April 28, 2014 20
The 2011-2012 actual data provided in Table 1 show the number and percentage of students with and without disabilities suspended for more than 10 days. The IDEA 618 Data Table 5 reported 1 out of 931 students with disabilities suspended for more than 10 days, or 0.1%, a significant decrease from the previous year’s data of 17 out of 944, or 1.8%. Based on the PSS individual school discipline reports, 7 out of 9,574, or 0.073% of students without disabilities were suspended for greater than 10 days for this reporting year; also a significant decrease from the previous reporting year of 50 out of 10,108, or 0.49%. There were no expulsions reported for 2011-2012. Significant Discrepancy Definition: In the FFY 2008 APR, CNMI submitted the revised significant discrepancy definition of “0% difference between the two groups” – students without disabilities and students with disabilities. Discussion of Improvement Activities and Explanation of Slippage, if the State did not meet its target, that occurred for FFY 2012 (2012-2013): As per OSEP’s instructions, for this APR, CNMI reports FFY 2011 (2011-2012) data and compares it to CNMI’s FFY 2011 (2011-2012) target. FFY 2011 Performance: CNMI met its target of 0% significant discrepancy for Indicator 4A and demonstrated progress from last year’s reporting of 1.31% difference between students without IEPs and students with IEPs. As reported in Table 1, the difference in percentage between students without IEPs and students with IEPs is 0.0% or .034%. This translates into seven students without IEPs suspended greater than 10 days compared to one student with an IEP suspended greater than 10 days. This means that more students without IEPs were suspended greater than 10 days compared to students with IEPs. The long term suspension data were disaggregated by schools to determine the difference in percentage between students with and without disabilities. This analysis of the data assisted CNMI and stakeholders to determine the critical focused interventions, as opposed to comparing overall CNMI total numbers and percentages of students with and without disabilities. CNMI assessed all public schools for long-term suspensions/expulsions and did not use a minimum “n” size. Of the 19 public schools in the CNMI, 5 schools, or 26%, of the CNMI’s public schools reported students with and/or without disabilities having greater than 10 days of suspension school year 2011-2012. As shown in Table 2, only 1 of the 5 schools (SSHS) showed a “difference” of more than 1% in the percentages of reported long term suspensions for students with disabilities compared to students without disabilities. All other schools showed an improvement in their differences from FFY2010 to FFY2011. Table 2: % Suspension by School for FFY 2011
Without Disabilities Population
Students without Disabilities > 10
days
With Disabilities Population
With Disabilities >
10 Days
School % % Difference MHS 1313 1 0.07 99 0 0 -0.07 KHS 614 2 0.32 60 0 0 -0.32
DRHIJHS 247 2 0.80 33 0 0 -0.8 SSHS 832 1 0.12 54 1 1.85 +1.73
THS/JHS 207 1 0.48 22 0 0 -0.48 HJHS 1155 0 0 103 0 0 0 CHA 306 0 0 48 0 0 0
Key personnel continues to review school disciplinary data, PSS discipline policies, IEP behavioral plans, school support systems, common causes for disciplinary actions, and compares disciplinary actions between schools, in looking to improve upon the disciplinary process. The following conclusions were made pertaining to progress achieved:

CNMI April 2014 Resubmission
Part B State Annual Performance Report (APR) for FFY 2012
CNMI Part B APR for FFY 2012 (2012-2013), April 28, 2014 21
• In-school suspension (ISS) was implemented at high schools on Saipan through the Alternative Education School (located on MHS campus). The rate for suspension greater than 10 days for students with disabilities has decreased in all except one of the schools (SSHS, N=1). For the students without disabilities, decreases were seen at all secondary schools except one (DRHIJHS, N=1), making the Alternative Education School useful for keeping more students in school, as well as providing a necessary deterrent to infractions.
• Betel nut possession/use is still very common. This is most typically dealt with through work detail, ISS or after-school suspension, although subsequent infractions do lead to external suspensions.
• The PSS Behavior Specialists work closely with special education teachers, disciplinarians, general education teachers, and parents in devising behavior intervention plans and positive behavior supports and strategies. Referrals are requested for special education students before reaching >10 days suspension, so that behavioral strategies can be developed and implemented as early as possible, and the Behavior Specialists ensure that all procedural safeguards are followed according to IDEA guidelines.
Graph 1 provides a visual comparison by school of the percent of students with and without disability suspended for more the 10 days for FFY 2010 and FFY 2011. In FFY 2011, SSHS had only one student with a disability suspended greater than 10 days; the rest of the school had none. It appears that interventions implemented over the past 5 years to target the discrepancy between students with and without disabilities being externally suspended for greater than 10 days has been successful.
Graph 1: Comparison of Suspension % Rate > 10 days FFY 10-11 and FFY 11-12
*Note: these numbers represent percentages (%)
The most significant intervention over these 5 years has been the opening of the Alternative Education School (which is located on the MHS campus), with full implementation in school year 2011-2012 for all students. This self-contained school has impacted external suspensions as students are referred there for short-term in-school suspension, as well as for longer-term placement based on individual needs. The school also accommodates referrals from the other high schools in CNMI, to off-set their in-school suspension load.
MHS KHS DRHIJHS SSHS TJSHS HJHS CHA
SY 10-11 w/o 1.32 0.7 0.6 2.2 2.1 0.26 0.28
SY 11-12 w/o 0.07 0.32 0.8 0.12 0.48 0 0
SY 10-11 with 12.26 2.89 3.84 1.78 0 0 0
SY 11-12 with 0 0 0 1.85 0 0 0
0
2
4
6
8
10
12
14
Perc
enta
ge

CNMI April 2014 Resubmission
Part B State Annual Performance Report (APR) for FFY 2012
CNMI Part B APR for FFY 2012 (2012-2013), April 28, 2014 22
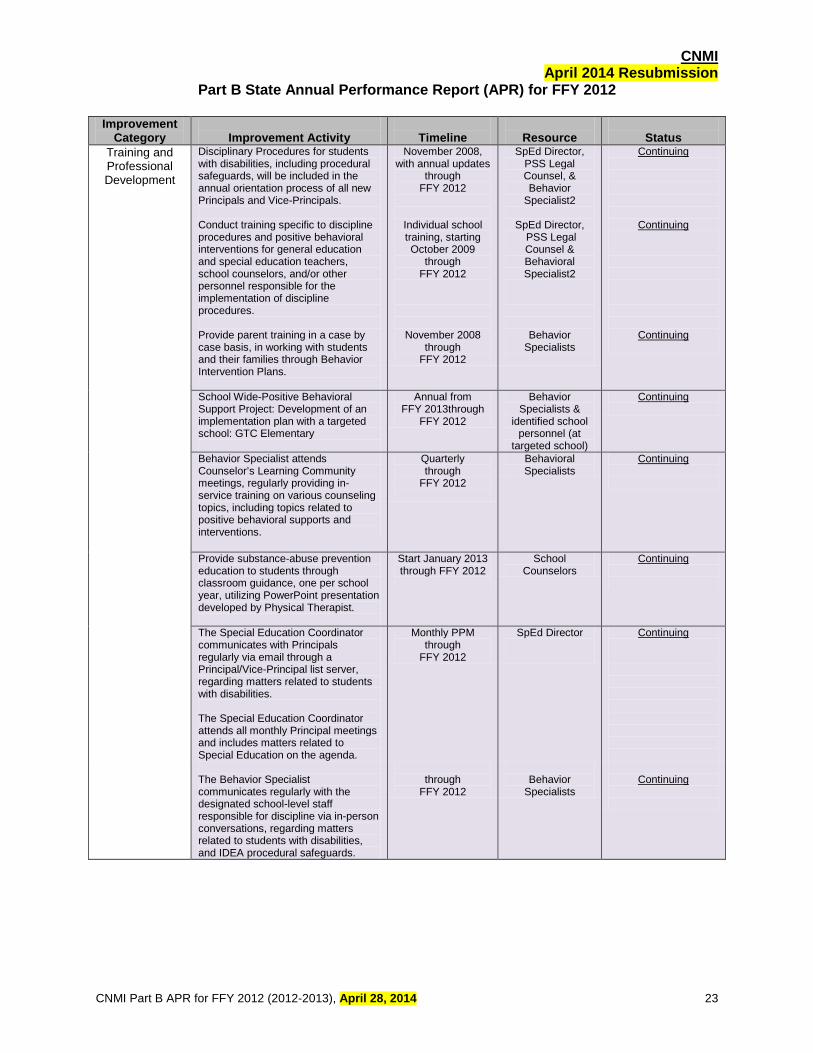
The CNMI has in place policies and procedures that are in line with IDEA regulations, including the development of IEPs, the use of positive behavioral interventions and supports, and procedural safeguards as required by 34 CFR §300.170(b). This determination was made by comparing the language in the IDEA regulations to the language in the PSS Discipline Policies, and the Special Education Procedural Manual for the development of IEPs including manifestation determinations, functional behavioral plans, behavioral supports, and removal for more than 10 days. Revisions, with Justification, to Proposed Targets / Improvement Activities / Timelines /Resources for FFY 2013: CNMI did not revise the target. As discussed on page 2 of this APR, the improvement activities are organized by areas of priority needs for improvement and color-coded to show the “status” of each improvement activity. Although this FFY 2012 reporting year is the last year of the FFY 2005-2012 SPP, CNMI has updated the status of each improvement activity, including the continuation, if appropriate, of the improvement activity in FFY 2013. The following table displays the “status” of the improvement activity with the color codes:
Completed Rose Continuing Lavender
Revised Light Blue New Light Green
Moved or Deleted Light Yellow
2013-2014 IMPROVEMENT ACTIVITY TABLE Improvement
Category
Improvement Activity
Timeline
Resource
Status Improve Data Collection and
Reporting
Work with principals toward completing monthly reports on disciplinary data, through Rediker software.
Through FFY 2012
School Level Rediker Trained
personnel
Continuing
Review and Revise Policies and Procedures
Conduct “Focus Task Group” for designated schools with significant differences in their suspension rates based on incidents; those with significant discrepancies will be required to complete worksheets developed to guide them as they analyze their data: 1. Guiding questions for the
analysis of school systems 2. Guiding questions for the
analysis of individual students.
January, 2009 and through FFY 2012
Administrators responsible for
discipline, School
Counselors, & Behavior
Specialists
Continuing
Review policies and procedures with Principals and Vice Principals, to ensure compliance and proper implementation between schools. Review and develop in-school detention options for each school, especially for those not utilizing this method of discipline.
January, 2009 and through FFY 2012
January, 2009 and through FFY 2012
Administrators responsible for discipline, Legal
Counsel, & Behavior
Specialists
Administrators responsible for
discipline, School Counselors, &
Behavior Specialists
Completed 2012-2013
Completed 2012-2013
CNMI April 2014 Resubmission
Part B State Annual Performance Report (APR) for FFY 2012
CNMI Part B APR for FFY 2012 (2012-2013), April 28, 2014 23
Improvement Category
Improvement Activity
Timeline
Resource
Status
Training and Professional Development
Disciplinary Procedures for students with disabilities, including procedural safeguards, will be included in the annual orientation process of all new Principals and Vice-Principals. Conduct training specific to discipline procedures and positive behavioral interventions for general education and special education teachers, school counselors, and/or other personnel responsible for the implementation of discipline procedures. Provide parent training in a case by case basis, in working with students and their families through Behavior Intervention Plans.
November 2008, with annual updates
through FFY 2012
Individual school training, starting October 2009
through FFY 2012
November 2008
through FFY 2012
SpEd Director, PSS Legal Counsel, & Behavior
Specialist2
SpEd Director, PSS Legal Counsel & Behavioral Specialist2
Behavior
Specialists
Continuing
Continuing
Continuing
School Wide-Positive Behavioral Support Project: Development of an implementation plan with a targeted school: GTC Elementary
Annual from FFY 2013through
FFY 2012
Behavior Specialists &
identified school personnel (at
targeted school)
Continuing
Behavior Specialist attends Counselor’s Learning Community meetings, regularly providing in-service training on various counseling topics, including topics related to positive behavioral supports and interventions.
Quarterly through
FFY 2012
Behavioral Specialists
Continuing
Provide substance-abuse prevention education to students through classroom guidance, one per school year, utilizing PowerPoint presentation developed by Physical Therapist.
Start January 2013 through FFY 2012
School Counselors
Continuing
The Special Education Coordinator communicates with Principals regularly via email through a Principal/Vice-Principal list server, regarding matters related to students with disabilities. The Special Education Coordinator attends all monthly Principal meetings and includes matters related to Special Education on the agenda.
Monthly PPM through
FFY 2012
SpEd Director
Continuing
The Behavior Specialist communicates regularly with the designated school-level staff responsible for discipline via in-person conversations, regarding matters related to students with disabilities, and IDEA procedural safeguards.
through
FFY 2012
Behavior
Specialists
Continuing

CNMI April 2014 Resubmission
Part B State Annual Performance Report (APR) for FFY 2012
CNMI Part B APR for FFY 2012 (2012-2013), April 28, 2014 24
Overview of the Annual Performance Report Development: Refer to Page 1 of this APR for development description.
Monitoring Priority: FAPE in the LRE Indicator 5: Percent of children with IEPs aged 6 through 21 served:
A. Inside the regular class 80% or more of the day; B. Inside the regular class less than 40% of the day; and C. In separate schools, residential facilities, or homebound/hospital placements.
(20 U.S.C. 1416(a)(3)(A)) Measurement: A. Percent = [(# of children with IEPs serves inside the regular class 80% or more of the day) divided
by the (total # of students aged 6 through 21 with IEPs)] times 100. B. Percent = [(# of children with IEPs served inside the regular class less than 40% of the day) divided
by the (total # of students aged 6 through 21 with IEPs)] times 100. C. Percent = [(# of children with IEPs served in separate schools, residential facilitates, or
homebound/hospital placements) divided by the (total # of students aged 6 through 21 with IEPs)] times 100.
FFY Measurable and Rigorous Target
2012
(2012-2013)
A. 78% of children ages 6-21 with IEPs inside the regular class 80% or more of day. B. 5.2% of children ages 6-21 with IEPs inside the regular class less than 40% of day. C. 0.7% of children ages 6-21 with IEPs in separate schools, residential facilities or
homebound/hospital served in private separate schools, residential placements, homebound, or hospitals.
Actual Target Data for FFY 2012 (2012-2013): Table 1: FFY 2012 Percent of Children with IEPs ages 6 to 21 and LRE
Total Number
of IEPs
(A) Inside the regular class 80% or more of the day
(B) Inside the regular class
less than 40% of the day
(C) Separate schools, residential
or home-bound/ hospital placements
809
(714/809) 88%
(12/809) x 100 = 1.5%
(2/809) x 100 = .2%
Data Source: Data used for this indicator taken from the IDEA 618 Environment, Table 3, December 1, 2012 Data Collection and Verification Upon completion of an Individualized Education Program (IEP), data are submitted to the data manager for entry into the central database. The IEP data are verified through a review of the hard copies of the IEPs before filing. The data are further verified through school level compliance monitoring and random site visits. Discussion of Improvement Activities and Explanation of Slippage, if the State did not meet its target, that occurred for FFY 2012 (2012-2013): Measurement A: Performance: CNMI data showed that 88% or 714 of 809 students with IEPs were served inside the regular class for 80% or more of the day, which remained the same percentage as last year’s reporting of 88% (731/827). CNMI exceeded its target of 78%.

CNMI April 2014 Resubmission
Part B State Annual Performance Report (APR) for FFY 2012
CNMI Part B APR for FFY 2012 (2012-2013), April 28, 2014 25
Measurement B: Performance: CNMI served 1.5% or 12 of 809 students with IEPs in the regular class for less than 40% of the day, which represented slippage from last year’s performance of 1.2% (10/827). CNMI performed better than its target of 5.2%. Measurement C: Performance: CNMI served 0.2% or 2 of 809 students with IEPs at home, which represented progress from last year’s performance of .3% (3/827). CNMI performed better than its target of 0.7%. CNMI continues to monitor placement decisions to ensure decisions are based on current evaluation and IEP progress data for each child with a disability. As shown in the graph below, the number and percentage of students in regular education classes for 80% or more of the day continues to increase. CNMI consistently surpasses the National Trend Data for students with IEPs in regular education classes for 80% or more of the day.
Trend Data of Students with IEPs in Regular Classes for ≥ 80% of the day.
OSEP Memorandum 14-2, October 2013: OSEP provided additional instructions in an effort to reduce reporting burden. For the FFY 2012 APR, States:
1) Are not required to provide an explanation of: a) progress; b) no change in actual target data from the data for FFY 2011; or c) slippage if the State meets its target.
2) Are not required to discuss improvement activities for: a) compliance indicators where the State reports 100% compliance for FFY 2012; and b) results indicators where the State has met its FFY 2012 target.
For Indicator 5, CNMI exceeded its targets and therefore is not required to provide an explanation of progress or slippage and a discussion on improvement activities.
68% 68% 70% 70%
72% 74%
76% 78% 68% 68%
74% 74% 75%
82.7% 84.8%
88% 88%
58% 59% 60% 62% 63% 64%
0%
10%
20%
30%
40%
50%
60%
70%
80%
90%
100%
2004-2005 2005-2006 2006-2007 2007-2008 2008-2009 2009-2010 2010-2011 2011-2012 2012-2013
CNMI SPP Target CNMI Performance National Data
National Trend Data taken from OSEP 2013 Part B Summary Book: Indicator 5, July 2013

CNMI April 2014 Resubmission
Part B State Annual Performance Report (APR) for FFY 2012
CNMI Part B APR for FFY 2012 (2012-2013), April 28, 2014 26
Revisions, with Justification, to Proposed Targets/Improvement Activities/Timelines/Resources for FFY 2013: CNMI did not revise the targets. As discussed on page 2 of this APR, the improvement activities are organized by areas of priority needs for improvement and color coded to show the “status” of each improvement activity. Although this FFY 2012 reporting year is the last year of the FFY 2005-2012 SPP, CNMI has updated the status of each improvement activity, including the continuation, if appropriate, of the improvement activity in FFY 2013. The following table displays the “status” of the improvement activity with the color codes:
Completed Rose Continuing Lavender
Revised Light Blue New Light Green
Moved or Deleted Light Yellow
2013-2014 IMPROVEMENT ACTIVITY TABLE Improvement
Category
Improvement Activity
Timeline
Resource
Status Improving Systems
Administration and Monitoring
Continue to monitor the IEPs to ensure LRE decisions are based on individual needs of the student.
Monthly IEP data submissions
through FFY 2012
SpEd Compliance
Monitor Data Manager
Completed 2012-2013
Conduct spot checks at the schools to ensure actual practice is what is reported Continue to provide training and technical on the revisions to annual IEP review procedures. Continue to monitor schools that may be struggling with IEP timelines.
Monthly through
FFY 2012
Monthly Principal meetings, special
education and related service
meetings and parent forums through FFY
2012
Compliance Monitor
SpEd Director
Completed 2012-2013
Providing Training and Professional Development
Work closely with the PSS Office of Instructional Services to provide training to: Special Education General Education School Leadership and Parents on Common Core State Standards and how these transfer to writing IEPs and providing instruction for students with disabilities in the regular classroom. Training will include Core Content Connectors for students with significant cognitive disabilities who take an alternate assessment.
Monthly trainings with special
education staff; School level trainings by
invitation through
FFY 2012
SpEd Director
PSS Assessment Coordinator
Guam
CEDDERS and National Center and
State Collaborative
Continuing
Continue to provide ongoing support to all teachers for including students with disabilities in general education through state level Professional Development.
Monthly contact teacher meetings
through FFY 2012
SpEd Staff
PSS Central Office
Continuing

CNMI April 2014 Resubmission
Part B State Annual Performance Report (APR) for FFY 2012
CNMI Part B APR for FFY 2012 (2012-2013), April 28, 2014 27
Overview of the Annual Performance Report Development: Refer to page 1 of this APR for development description.
Monitoring Priority: FAPE in the LRE
Indicator 6: Percent of children aged 3 through 5 with IEPs attending a:
A. Regular early childhood program and receiving the majority of special education and related services in the regular early childhood program; and
B. Separate special education class, separate school or residential facility.
(20 U.S.C. 1416(a)(3)(A)) Measurement: A. Percent = [(# of children aged 3 through 5 with IEPs attending a regular early childhood program and
receiving the majority of special education and related services in the regular early childhood program) divided by the (total # of children aged 3 through 5 with IEPs)] times 100.
B. Percent = [(# of children aged 3 through 5 with IEPs attending a separate special education class, separate school or residential facility) divided by the (total # of children aged 3 through 5 with IEPs)] times 100.
Data Source: Data collected under IDEA section 618.
FFY Measurable and Rigorous Target
2012 (2012-2013)
A. 86% of the children aged 3 through 5 with an IEP attend a regular early childhood
program and receive the majority of special education and related services in the regular early childhood program
B. 0% of the children aged 3 through 5 with an IEP attend separate special education class, separate school or residential facility.
Actual Target Data for FFY 2012 (2012-2013): As indicated in Table 1, 76% or 65 children with an IEP were attending a regular early childhood program and receiving the majority of special education and related services in the regular early childhood program. Table 1: Measurement A: Children aged 3 through 5 attending regular early childhood program and receiving the majority of special education and related services in the regular early childhood program
a. b. c. Total # of Children 3 through 5 with an
IEP
#Children aged 3 through 5 with IEP’s attending regular early childhood
program and receiving the majority of special education and related services in
the regular early childhood program
% Children attending regular early childhood programs and receiving the majority of special education
and related services in the regular early childhood program
(b/a )x100 86 65
65/86 x 100
76% Data Source: IDEA 618 Environment Data, Table 3, December 1, 2012

CNMI April 2014 Resubmission
Part B State Annual Performance Report (APR) for FFY 2012
CNMI Part B APR for FFY 2012 (2012-2013), April 28, 2014 28
Table 1: Column (a) Is the total number of children 3 through 5 years old with an IEP as reported in the 618 Child Count on December 1, 2012.
Table 1: Column (b) Is the number of children 3 through 5 with IEPs attending regular early childhood programs and receiving the majority of special education and related services in the regular early childhood program.
Table 1: Column (c) Is the percentage of children age 3 through 5 attending regular early childhood programs.
As indicated in Table 2, there are no children with an IEP attending a separate special education class, separate school, or residential facility. Table 2: Measurement B: Children aged 3 through 5 attending separate special education class, separate school or residential facility.
a. b. c. Total # of Children
3 through 5 with an IEP #Children aged 3 through 5 with IEP’s attending separate special education class, separate school or residential
facility
% Children attending separate special education class, separate
school or residential facility (b/a )x100
86 0
0/86 x 100 = 0%
Data Source: IDEA 618 Environment Data, Table 3, December 1, 2012 Table 2: Column (a) Is the total number of children 3 through 5 years old with an IEP as reported in
the 618 Child Count on December 1, 2012. Table 2: Column (b) Is the number of children 3 through 5 with IEPs attending a separate special
education class, separate school or residential facility. Table 2: Column (c) Is the percentage of children age 3 through 5 attending a separate class or
separate school or residential facility Indicator 6 data are consistent with the CNMI data submitted for IDEA 618, Educational Environments for Early Childhood. Discussion of Improvement Activities and Explanation of Slippage, if the State did not meet its target, that occurred for FFY 2012 (2012-2013): Measurement A: Performance: CNMI did not meet the target of 86% reporting 76% (65/86) for FFY 2012, which represented slippage from last year’s baseline data of 85% (88/104). Measurement B: Performance: CNMI met the target of 0% reporting 0% (0/86) for FFY 2012, which was the same percentage as last year’s baseline data. The December 1, 2012 Child Count, 618 Data, indicated 86 children, ages 3 through 5 years old had an IEP. Of the 86 preschoolers with an IEP, 29 were served in public and private kindergartens and 36 were served in Head Start, private preschools and/or child care programs for a total of 65 children aged 3 through 5 attending regular early childhood programs. No preschooler with an IEP attended a separate class or separate school or residential facility. The 21 children not accounted for in Tables 1 and 2 were served at home. Although CNMI did not meet its target for Measurement A, CNMI’s performance of 76% (65/86) in FFY 2012 was significantly higher than the national baseline data of 50% for FFY 2011 reported in the OSEP 2013 Part B Summary Book, July 2013. This means that the majority of 3 through 5 year old children with disabilities in the CNMI are served in regular early childhood programs which include Kindergarten for 5 year olds, the Head Start Program, Private Preschools, and Day Care or Child Centers.

CNMI April 2014 Resubmission
Part B State Annual Performance Report (APR) for FFY 2012
CNMI Part B APR for FFY 2012 (2012-2013), April 28, 2014 29
Special education placement decisions are made by the IEP team, including the parents, on an annual basis and are based on current evaluation and IEP progress data. Considerations for the least restrictive environment include attending a school close to home that the child would attend if the child did not have a disability unless the IEP team felt the child required some other arrangement to ensure an appropriate education or the parent chooses to keep their child home. Early Childhood Special Education (ECSE) teachers and related service providers work collaboratively with general education teachers to ensure special education and related services are provided in accordance with the child’s IEP. Special education personnel assist the classroom teachers with daily routines and the provision of appropriate accommodations such as communication systems, visual schedules, and behavioral plans. Revisions, with Justification, to Proposed Targets/Improvement Activities/Timelines/Resources for FFY 2013: CNMI did not revise the targets. As discussed on page 2 of this APR, the improvement activities are organized by areas of priority needs for improvement and color coded to show the “status” of each improvement activity. Although this FFY 2012 reporting year is the last year of the FFY 2005-2012 SPP, CNMI has updated the status of each improvement activity, including the continuation, if appropriate, of the improvement activity in FFY 2013. The following table displays the “status” of the improvement activity with the color codes:
Completed Rose Continuing Lavender
Revised Light Blue New Light Green
Moved or Deleted Light Yellow
2013-2014 IMPROVEMENT ACTIVITY TABLE
Improvement Category
Activity
Timeline
Resources
Status/Progress
Improve Administration and Monitoring
Conduct outreach to families whose children receive special education and related services at home.
Annual through
FFY 2012
ECSE Staff
Continuing
Closely monitor IEP development and placement decisions to ensure placement is based on the child unique needs.
As IEP’s are developed
and submitted
SpEd Director SpEd Compliance
Monitor
Continuing
Training and Professional Development
Conduct training for early childhood special education staff, Head Start staff and parents on instructional strategies and practices that are research and evidenced based to improve the outcomes for children. Training opportunities will include other child care providers who serve preschool children with IEP’s.
Annually during PSS and Head
Start scheduled
Professional Development through FFY
2012
ECSE Staff, Guam CEDDERS
ECTAC Resources
Head Start TA providers
Continuing

CNMI April 2014 Resubmission
Part B State Annual Performance Report (APR) for FFY 2012
CNMI Part B APR for FFY 2012 (2012-2013), April 28, 2014 30
Improvement Category
Activity
Timeline
Resources
Status/Progress
Conduct training on the on the • The P-3 Comprehensive Services
and Support Plan • The Early Learning Guidelines • The revised Head Start Curriculum
framework • The Creative Curriculum Gold • The system wide accreditation
process
Conduct training with SPED teachers, related service staff, Head Start teachers and parents on how to develop IEP’s that reflect the Early Learning standards and the Head Start Curriculum Framework Conduct training for EC SPED, Head Start and parents on the use of accommodations and modification in the Preschool Classrooms:
Beginning September
2012 through June 2013
The COE The Office of Instructional
Services SpEd Director Head Start Dir. EI Coordinator
Guam CEDDERS Head Start Regional
TA Providers
SpEd Director Head Start Disabilities Coordinator
Guam CEDDERS
Continuing
• Review and revise Head Start Curriculum Framework
• Develop and revise procedures necessary to implement the P-3 plan
• Revise procedures necessary to implement Co-Teaching model in the Head Start program
Collaboration and Coordination
The development and implementation of the P-3 Comprehensive Plan will require all stakeholders (EI staff, Head Start staff, early childhood special education staff, K to third teachers and school leadership) to work together in order to align curriculum expectations for all children and to implement effective instructional strategies that will achieve improved outcomes for all children.
Beginning September
2012 through June 2013
The COE School
Leadership Office of
Instructional Services
Continuing
Adjusting FTE’s In order to implement the Co-Teaching model, the early childhood special education staff will adjust and reorganize the staffing patterns of the SPED teachers, related service personnel and teacher aides.
June 2013 SpEd Director Continuing

CNMI April 2014 Resubmission
Part B State Annual Performance Report (APR) for FFY 2012
CNMI Part B APR for FFY 2012 (2012-2013), April 28, 2014 31
Overview of the Annual Performance Report Development: Refer to page 1 of this APR for development description.
Monitoring Priority: FAPE in the LRE
Indicator 7: Percent of preschool children aged 3 through 5 with IEPs who demonstrate improved:
A. Positive social-emotional skills (including social relationships); B. Acquisition and use of knowledge and skills (including early language/communication
and early literacy); and C. Use of appropriate behaviors to meet their needs.
(20 U.S.C. 1416 (a)(3)(A)) Measurement: Outcomes: A. Positive social-emotional skills (including social relationships); B. Acquisition and use of knowledge and skills (including early language/communication and early literacy); and C. Use of appropriate behaviors to meet their needs.
Progress categories for A, B and C: a. Percent of preschool children who did not improve functioning = [(# of preschool children who did not improve functioning) divided by (# of
preschool children with IEPs assessed)] times 100. b. Percent of preschool children who improved functioning but not sufficient to move nearer to functioning comparable to same-aged peers =
[(# of preschool children who improved functioning but not sufficient to move nearer to functioning comparable to same-aged peers) divided by (# of preschool children with IEPs assessed)] times 100.
c. Percent of preschool children who improved functioning to a level nearer to same-aged peers but did not reach it = [(# of preschool children who improved functioning to a level nearer to same-aged peers but did not reach it) divided by (# of preschool children with IEPs assessed)] times 100.
d. Percent of preschool children who improved functioning to reach a level comparable to same-aged peers = [(# of preschool children who improved functioning to reach a level comparable to same-aged peers) divided by (# of preschool children with IEPs assessed)] times 100.
e. Percent of preschool children who maintained functioning at a level comparable to same-aged peers = [(# of preschool children who maintained functioning at a level comparable to same-aged peers) divided by (# of preschool children with IEPs assessed)] times 100.
Summary Statements for Each of the Three Outcomes: Summary Statement 1: Of those preschool children who entered or exited the preschool program below age expectations in each Outcome, the percent who substantially increased their rate of growth by the time they turned 6 years of age or exited the program. Measurement for Summary Statement 1: Percent = # of preschool children reported in progress category (c) plus # of preschool children reported in category (d) divided by [# of preschool children reported in progress category (a) plus # of preschool children reported in progress category (b) plus # of preschool children reported in progress category (c) plus # of preschool children reported in progress category (d)] times 100. Summary Statement 2: The percent of preschool children who were functioning within age expectations in each Outcome by the time they turned 6 years of age or exited the program. Measurement for Summary Statement 2: Percent = # of preschool children reported in progress category (d) plus [# of preschool children reported in progress category (e) divided by the total # of preschool children reported in progress categories (a) + (b) + (c) + (d) + (e)] times 100. Measurable and Rigorous SPP Targets & Actual Target Data for FFY 2012 (2012-2013):
Summary Statements
SPP Target FFY 2012
(% of children)
Actual Data FFY 2012
(% of children)
Outcome A: Positive social-emotional skills (including social relationships)
1. Of those preschool children who entered or exited the preschool program below age expectations in Outcome A, the percent who substantially increased their rate of growth by the time they turned 6 years of age or exited the program.
96.5%
86% (c + d) /
(a + b + c + d) (10 + 8) / 0 +3
+10 +8 18/21 = 86%
2. The percent of preschool children who were functioning within age expectations in Outcome A by the time they turned 6 years of age or exited the program.
47%
52% (d + e) / TOTAL (8+ 6) /
27 14/27 = 52%

CNMI April 2014 Resubmission
Part B State Annual Performance Report (APR) for FFY 2012
CNMI Part B APR for FFY 2012 (2012-2013), April 28, 2014 32
Summary Statements
SPP Target FFY 2012
(% of children)
Actual Data FFY 2012
(% of children)
Outcome B: Acquisition/use of knowledge & skills (including early language/communication/early literacy)
1. Of those preschool children who entered or exited the preschool program below age expectations in Outcome B, the percent who substantially increased their rate of growth by the time they turned 6 years of age or exited the program.
100%
89% (c + d) /
(a + b + c + d) (16 + 7) /
(0 + 3 + 16 + 7) 23/26 = 89%
2. The percent of preschool children who were functioning within age expectations in Outcome B by the time they turned 6 years of age or exited the program.
54%
30% (d + e) / TOTAL
(7 + 1) / 27 8/27 = 30%
Outcome C: Use of appropriate behaviors to meet their needs
1. Of those preschool children who entered or exited the preschool program below age expectations in Outcome C, the percent who substantially increased their rate of growth by the time they turned 6 years of age or exited the program.
96.5%
90% (c + d) /
(a + b + c + d) (8 + 9) /
(0 + 2 + 8+ 9) 17/19 = 90%
2. The percent of preschool children who were functioning within age expectations in Outcome C by the time they turned 6 years of age or exited the program.
77%
63% (d + e) / TOTAL
(9 + 8) / 45 17/27 = 63%
Progress Data for Preschool Children FFY 2012 A. Positive social-emotional skills (including social
relationships): # of children % of children
a. Percent of children who did not improve functioning. 0 0% b. Percent of children who improved functioning but not sufficient to
move nearer to functioning comparable to same-aged peers. 3 (3/27) 11.1%
c. Percent of children who improved functioning to a level nearer to same-aged peers but did not reach. 10 (10/27)
37% d. Percent of children who improved functioning to reach a level
comparable to same-aged peers. 8 (8/27) 29.6%
e. Percent of children who maintained functioning at a level comparable to same-aged peers. 6 (6/27)
22.2% Total N = 27 100%
B. Acquisition and use of knowledge and skills (including early language/communication and early literacy): # of children % of children
a. Percent of children who did not improve functioning 0 0%
b. Percent of children who improved functioning but not sufficient to move nearer to functioning comparable to same-aged peers. 3
(3/27) 11.1%
c. Percent of children who improved functioning to a level nearer to
same-aged peers but did not reach. 16 (16/27) 59.3%
d. Percent of children who improved functioning to reach a level comparable to same-aged peers. 7 (7/27)
25.9% e. Percent of children who maintained functioning at a level
comparable to same-aged peers 1 (1/27) 3.7%
Total N = 27 100%

CNMI April 2014 Resubmission
Part B State Annual Performance Report (APR) for FFY 2012
CNMI Part B APR for FFY 2012 (2012-2013), April 28, 2014 33
C. Use of appropriate behaviors to meet their needs: # of children % of children a. Percent of children who did not improve functioning. 0 0% b. Percent of children who improved functioning but not sufficient to
move nearer to functioning comparable to same-aged peers. 2 (2/27) 7.4%
c. Percent of children who improved functioning to a level nearer to same-aged peers but did not reach. 8 (8/27)
29.6% d. Percent of children who improved functioning to reach a level
comparable to same-aged peers. 9 (9/27) 33.3%
e. Percent of children who maintained functioning at a level comparable to same-aged peers. 8 (8/29)
29.6% Total N = 27 100%
The CNMI Early Childhood Special Education (ECSE) Program continues to use the ECO Child Outcomes Summary (COS) process to collect and report Outcome data. Using the ECO 7-point rating scale with input from parents, related service personnel (if appropriate), and other preschool staff, the team determines the overall rating of the child. A copy of the completed COS form, is sent to the Special Education Data Manager to input into the database. The CNMI also continues to use the automatic calculator to generate the required OSEP categories for each Outcome Measurement and Summary Statement. For this reporting period, data are reported on 27 preschoolers with IEPs who received entry data (Measurement 1) and exit data (Measurement 2). The Outcome Measurement process is integrated throughout the referral process, including referrals for children transitioning from early intervention. All information is used to assist the team, which includes parents, to determine the Outcome Measures for each child. Discussion of Improvement Activities Completed and Explanation of Slippage, if the State did not meet its target, that occurred for FFY 2012 (2012-2013): For Outcome A: Positive Social-Emotional Skills • Summary Statement 1: • CNMI’s performance was 86% (18/21), which represented slippage from previous year’s performance
of 95% (29/35). CNMI did not meet the target of 96.5% of preschool children who substantially increased their rate of growth by the time they turned 6 years of age or exited the program.
• Summary Statement 2: • CNMI’s performance was 52% (14/27), which represented progress from last year’s performance of
47% (21/45). CNMI exceeded the target of 47% of preschool children functioning within age expectation by the time they turned 6 years of age or exited the program.
For Outcome B: Acquisition and Use of Knowledge and Skills • Summary Statement 1: • CNMI’s performance was 89% (23/26), which represented progress from last year’s performance of
84% (36/43). CNMI did not meet the target of 100% of preschool children who substantially increased their rate of growth by the time they turned 6 years of age or exited the program.
• Summary Statement 2: • CNMI’s performance was 30% (8/27), which represented slippage from previous year’s performance
of 33% (15/45). CNMI did not meet the target of 54% of preschool children functioning within age expectation by the time they turned 6 years of age or exited the program.

CNMI April 2014 Resubmission
Part B State Annual Performance Report (APR) for FFY 2012
CNMI Part B APR for FFY 2012 (2012-2013), April 28, 2014 34
For Outcome C: Use of Appropriate Behaviors to Meet their Needs, • Summary Statement 1: • CNMI’s performance was 90% (17/19), which represented a slight slippage from previous year’s
performance of 91% (32/35). CNMI did not meet the target of 96.5% of preschool children who substantially increased their rate of growth by the time they turned 6 years of age or exited the program.
• Summary Statement 2: • CNMI’s performance was 63% (17/27), which represented slippage from previous year’s performance
of 67% (30/45). CNMI did not meet the target of 77% of preschool children functioning within age expectation by the time they turned 6 years of age or exited the program.
CNMI has shown a slippage for Summary Statement 1 for Outcome A reporting 86% for this reporting period from 95% for last year and for Outcome C a slight decrease by 1% for last year with a performance of 89% for FFY 2012. CNMI increased performance by 5% for Outcome B reporting 89%. However, as indicated in Figure 1 below, CNMI is performing above the national average in all 3 outcomes of preschool children who substantially increased in their rate of growth by the time they turned 6 years of age or exit the program. Figure 1: Summary Statement 1 State and National Comparison Data
CNMI showed an increase of 5% in peformance for Summary Statement 2 for Outcome A, reporting progress of 52% and met the target for this indicator. For Outcome B and C, CNMI reports slippage for Summary Statement 2. As shown in Figure 2, comparison with national and state percentage, CNMI is performing below the national average in all 3 outcomes.
81 81 80 86 89 90
0
20
40
60
80
100
Social relationships Knowledge and skills Actions to meet needs
Perc
ent o
f chi
ldre
n
Early Childhood Special Education National and State Percentages for Summary Statement 1: Substantially
Increased Rate of Growth, 2011-12
National CNMI Note: National data based on 39 states with highest -quality data.

CNMI April 2014 Resubmission
Part B State Annual Performance Report (APR) for FFY 2012
CNMI Part B APR for FFY 2012 (2012-2013), April 28, 2014 35
Figure 2: Summary Statement 2 State and National Comparison Data
The Commissioner of Education continues to support statewide initiatives. In 2012-2013, the PSS completed a system-wide accreditation through AdvancED, including the Head Start Program. PSS also implemented the following initiatives: 1) the development and implementation of a P-3 (preschool through 3rd grade) Comprehensive Service and Support Plan; 2) revised and implemented the Early Learning Guidelines to be aligned with the Common Core Curriculum; 3) revised and implemented the Head Start Curriculum Framework; 4) adopted the Creative Curriculum Gold for the Head Start Program; 5) reorganized the early childhood special education service delivery practice from itinerate to a co-teaching model; and 6) the implemented a coaching and mentoring model in the Head Start Program. With the targeted trainings, continuous discussion with parents, changes in instructional practices, and implementation of new initiatives, as described in the Improvement Activity Table in the following pages, the CNMI anticipates improvement in the child and family outcomes for 2013-2014. OSEP FFY 2011 APR Response Table: Results Data Summary Notes, July 2013 REQUIRED ACTIONS: CNMI must report progress data and actual target data for FFY 2012 in the FFY 2012 APR. CNMI Response: Refer to the Actual Target and Discussion Sections of this Indicator. Revisions, with Justification, to Proposed Targets/Improvement Activities/Timelines/Resources FFY 2013: The CNMI did not revise the targets. As discussed on page 2 of this APR, the improvement activities are organized by areas of priority needs for improvement and color-coded to show the “status” of each improvement activity. Although this FFY 2012 reporting year is the last year of the FFY 2005-2012 SPP, CNMI has updated the status of each improvement activity, including the continuation, if appropriate, of the improvement activity in FFY 2013.
59 53
66
52
30
63
0
20
40
60
80
100
Social relationships Knowledge and skills Actions to meet needs
Perc
ent o
f chi
ldre
n
Early Childhood Special Education National and State Percentages for Summary Statement 2:
Exited within Age Expectations, 2011-12
National CNMI
Note: National data based on 39 states with highest -quality data.

CNMI April 2014 Resubmission
Part B State Annual Performance Report (APR) for FFY 2012
CNMI Part B APR for FFY 2012 (2012-2013), April 28, 2014 36
The following table displays the “status” of the improvement activity with the color codes:
Completed Rose Continuing Lavender
Revised Light Blue New Light Green
Moved or Deleted Yellow
2013-2014 IMPROVEMENT ACTIVITY TABLE Improvement
Category Activity Timeline Resources Status/Progress
Improve Administration and Monitoring
Continue to monitor the collection and reporting of outcome data to ensure data collection and reporting is consistent with the requirements.
Annual collection and
reporting through FFY
2012
ECSE Staff, Data Manger
Guam CEDDERS
Continuing
Monitor IEP development to ensure IEP content (present level of performance and goals) reflect Head Start Curriculum as well as functional skill development.
September 2012 through
June 2013
IEP teams SPED Director
Head Start Disability Coordinator
Continuing
Training and Professional Development
Continue targeted training for early childhood special education staff, Head Start staff and parents on instructional strategies and practices that are research and evidenced based to improve the outcomes for children. Training opportunities will include other child care providers who serve preschool children with IEPs.
Annually during PSS and Head
Start scheduled Professional Development through FFY
2012
ECSE Staff, Guam CEDDERS
ECO and NECTAC Resources
Head Start TA providers
Continuing
Conduct training for all EI staff, early childhood special education staff, Head Start staff and K to third grade teachers on: • The P-3 Comprehensive
Services and Support Plan • The Early Learning
Guidelines • The revised Head Start
Curriculum framework • The Creative Curriculum
Gold • The system wide
accreditation process Conduct training with SPED teachers, related service staff, Head Start teachers and parents on how to develop IEPs that reflect the Early Learning standards and the Head Start Curriculum Framework.
Beginning September
2012 through June 2013
Beginning September
2012 through June 2013
The COE The Office of Instructional
Services SpEd Director
Head Start Director EI Coordinator
Guam CEDDERS Head Start Regional
TA Providers
SpEd Director Head Start Disabilities Coordinator
Guam CEDDERS
Continuing

CNMI April 2014 Resubmission
Part B State Annual Performance Report (APR) for FFY 2012
CNMI Part B APR for FFY 2012 (2012-2013), April 28, 2014 37
Improvement Category Activity Timeline Resources Status/Progress
Review and Revise Policies and Procedures
Review policies and procedures if necessary to ensure there are not gaps or practices that may impede or prevent improved results for children.
July through FFY 2012
ECSE Staff, Guam CEDDERS
Continuing
Review and revise Head Start Curriculum Framework: • Develop and revise
procedures necessary to implement the P-3 plan
• Revise procedures necessary to implement Co-Teaching model in the Head Start program
Beginning September
2012 through June 2013
Head Start Director SpEd Director The Office of Instructional
Services
Completed 2012-2013
Collaboration and Coordination
The development and implementation of the P-3 Comprehensive Plan requires all stakeholders (EI staff, Head Start staff, early childhood special education staff, K to third teachers and school leadership) to work together in order to align curriculum expectations for all children and to implement effective instructional strategies that will achieve improved outcomes for all children.
Beginning September
2012 through June 2013
The COE School Leadership
Office of Instructional
Services
Continuing
Adjusting FTE’s In order to implement the Co-Teaching model, the early childhood special education staff will adjust and reorganize the staffing patterns of the SPED teachers, related service personnel and teacher aides.
June 2013 SPED Dir. Continuing

CNMI April 2014 Resubmission
Part B State Annual Performance Report (APR) for FFY 2012
CNMI Part B APR for FFY 2012 (2012-2013), April 28, 2014 38
Overview of the Annual Performance Report Development: Refer to page 1 of this APR for development description. Monitoring Priority: FAPE in the LRE Indicator 8: Percent of parents with a child receiving special education services who report that schools facilitated parent involvement as a means of improving services and results for children with disabilities. (20 U.S.C. 1416(a) (3) (A)) Measurement: Percent = [(# of respondent parents who report schools facilitated parent involvement as a means of improving services and results for children with disabilities) divided by the (total # of respondent parents of children with disabilities)] times 100.
FFY Measurable and Rigorous Target
2012
(2012 - 2013)
95% of parents report schools facilitated parent involvement as a means of improving services and results for children with disabilities.
Actual Target Data for FFY 2012 (2012-2013): The 2012-2013 actual data in Table 1 indicates that 89% (411/463) of the parents with valid responses to the survey reported that schools facilitated parent involvement as a means of improving services and results of children with disabilities. CNMI utilized the same survey as in the previous year. Table 1: % of Parents That Report Schools Facilitated Parent Involvement
FFY
% of Parents that Report Schools facilitated Parent Involvement
(# of respondent parents who report schools facilitated parent involvement divided by total # of respondent parents times 100).
CNMI Target
2012 - 2013 (411/463) x 100 = 89% 95% Discussion of Improvement Activities and Explanation of Slippage, if the State did not meet its target, that occurred for FFY 2012 (2012-2013): Performance: 89% (411/463). CNMI did not meet its target of 95%, and reported the same percentage for last year’s performance for Indicator 8 (89% or 373/418). For this reporting period, 886 surveys were sent to parents of students with IEPs; of which 463 surveys were returned, representing a return rate of 52% (463/886). This was an increase of 7% from last reporting period’s 45% (418/927) return rate. Surveys were sent to the school principals to disseminate to all students with IEPs enrolled in their school. The surveys included an introductory letter and a blank envelope to use when returning the completed surveys. The schools collected and compiled the surveys and submitted the sealed envelopes to Special Education Central Office, as reported by the Special Education Data Manager. Guam CEDDERS then analyzed the data for reporting the results in this Indicator. As shown in Table 1, there was an increase in the response rate for Junior High at 46% and for High School at 34% compared to the last reporting period of 38% for Junior High and 26% for High School. There was a slight decrease in the surveys returned for preschool and elementary by 6% for this reporting period. Overall, the total response rate has more than doubled since the 2006-2007 dissemination, which

CNMI April 2014 Resubmission
Part B State Annual Performance Report (APR) for FFY 2012
CNMI Part B APR for FFY 2012 (2012-2013), April 28, 2014 39
indicates that the awareness of the surveys and dissemination process is working. CNMI will continue to disseminate the surveys to principals as a strategy to continue increasing return rates of surveys. Table 2: Comparison of Parent Survey Return Rate for SY 2006 - SY 2012
School Year (SY)
Preschool/ Elementary Junior High High School Total % Return
*2006 - 2007 68/153 x 100 = 44% 25/153 x 100 = 16% 50/153 x 100 = 33% 153/781 x 100 = 20%
**2007 - 2008 67/152 x 100 = 44% 25/152 x 100 = 16% 33/152 x100 = 22% 152/781 x 100 = 20%
2008 - 2009 260/363 x 100 = 71.6% 27/363 x 100 = 7.4% 76/363 x 100 = 21% 363/822 x 100 = 44%
2009 - 2010 267/474 x 100 = 56% 55/146 x 100 = 38% 63/274 x100 = 23% 385/894 x 100 = 43%
*2010 - 2011 308/496 x 100 = 62% 44/158 x 100 = 28% 51/274 x 100 = 19% **410/938 x 100 = 44%
**2011-2012 288/418 x 100 = 69% 76/201 x 100 = 38% 54/208 x 100 = 26% 418/927 x 100 = 45%
2012- 2013 292/463 x 100 = 63% 101/221 x 100 = 46% 69/202 x 100 = 34% ***463/886 x 100 = 52%
*2006 - 2007: 10 surveys did not indicate the level; **2007 - 2008: seven (7) surveys did not indicate the level; *2010 - 2011: Seven (7) surveys did not indicate the level; **2011 - 2012: four (4) surveys did not indicate level. ***2012-2013: One (1) survey did not indicate level . Figure 1 displays the percentage of surveys returned by each level based on the overall number of surveys received. As shown in Figure 1, the majority of completed surveys were from parents at the preschool and elementary levels at 63% (292/463) of the total surveys received, which is expected based on the total number of children with IEPs. Further, 22% (101/463) of the total surveys returned represented surveys returned from the Junior High and 15% (69/463) of the total surveys represented High School parents of youth with IEPs. In addition, the percentage of surveys received by levels is representative of the school population given that the majority of children in the Public School System are at the elementary level.
Figure 1: % of Parent Surveys Received by School Levels
In the CNMI, the majority of children with IEPs are Pacific Islanders, similar to the overall population. Representation of the completed surveys was examined through the percentage of surveys returned from each island within the CNMI. For Saipan, the largest island in the CNMI, 781 surveys were disseminated; of which, 392 or 50% were returned. For the island of Tinian, 38 surveys were disseminated; of which, 21
Preschool/ Elementary,
63%
Junior High, 22%
High School, 15%

CNMI April 2014 Resubmission
Part B State Annual Performance Report (APR) for FFY 2012
CNMI Part B APR for FFY 2012 (2012-2013), April 28, 2014 40
or 55% were returned. For the island of Rota, 50 surveys were disseminated; of which, 33 or 66% were returned. Seventeen (17) completed surveys did not indicate their island community. The percentage of returned surveys for each island was at or above 50% of the surveys disseminated based on the number of children with IEPs on that island. Therefore, CNMI Indicator 8 data are representative of the children with IEPs on the 3 islands within CNMI. The CNMI PSS Part B Parent Survey on Special Education Services consists of 20 survey items that are grouped into four categories, with five questions per category (A-D):
A. Understanding of the law, rights, and procedures B. Participating/Contributing to the IEP process C. Participating in training and council/committee work D. School Culture
All statements required parents to respond by marking “Agree,” “Disagree” or “Unsure.”. The statements surveying parents on their understanding of the law, their rights, and procedures (Category A) showed approximately 82% or 381/463 of the parents responded “agree” indicating that they understood the laws and their rights as parents of children with disabilities. 89% or 411/463 parents “agreed” that they participate and contribute in the IEP process (Category B). Parents indicated they felt engaged as equal partners in their child’s program and/or offered assistance or were asked their thoughts and opinions on the matter. 52% or 240/463 parents surveyed “agreed” that they have been provided access to appropriate training (Category C) and have a greater understanding of the IEP process, IDEA and their parent rights, allowing them to actively participate in their child’s IEP Team meetings. 78% or 359/463 parents “agreed” that their child’s school, including administrators and faculty, is supportive and respond to the needs of their child and family (Category D). Based on the results by categories, the perception is that parents understand the law, their rights, and procedures, and at the current level of involvement, they feel they are engaged as collaborative partners in their child’s education. For the purpose of responding to this indicator, Category B: Participating/Contributing to the IEP process is used to determine the percent of parents that report schools facilitated parent involvement. In 2012-2013, the Public School System conducted a series of parent summits both at the state and school levels to discuss the effectiveness of the school reform initiatives. The Commissioner of Education rolled out the school reform initiatives to be implemented in 2012-2013 including the implementation of the Common Core State Standards and the Title I Program. Parents were also afforded the opportunity to participate in trainings co-facilitated or hosted by the Protection and Advocacy Program, the Deaf and Hard of Hearing Program, the Autism Society, and the consultant for visual impairments. Revisions, with Justification, to Proposed Targets/Improvement Activities/Timelines/Resources for FFY 2013: CNMI did not revise the target. As discussed on page 2 of this APR, the improvement activities are organized by areas of priority needs for improvement and color coded to show the “status” of each improvement activity. Although this FFY 2012 reporting year is the last year of the FFY 2005-2012 SPP, CNMI has updated the status of each improvement activity, including the continuation, if appropriate, of the improvement activity in FFY 2013.
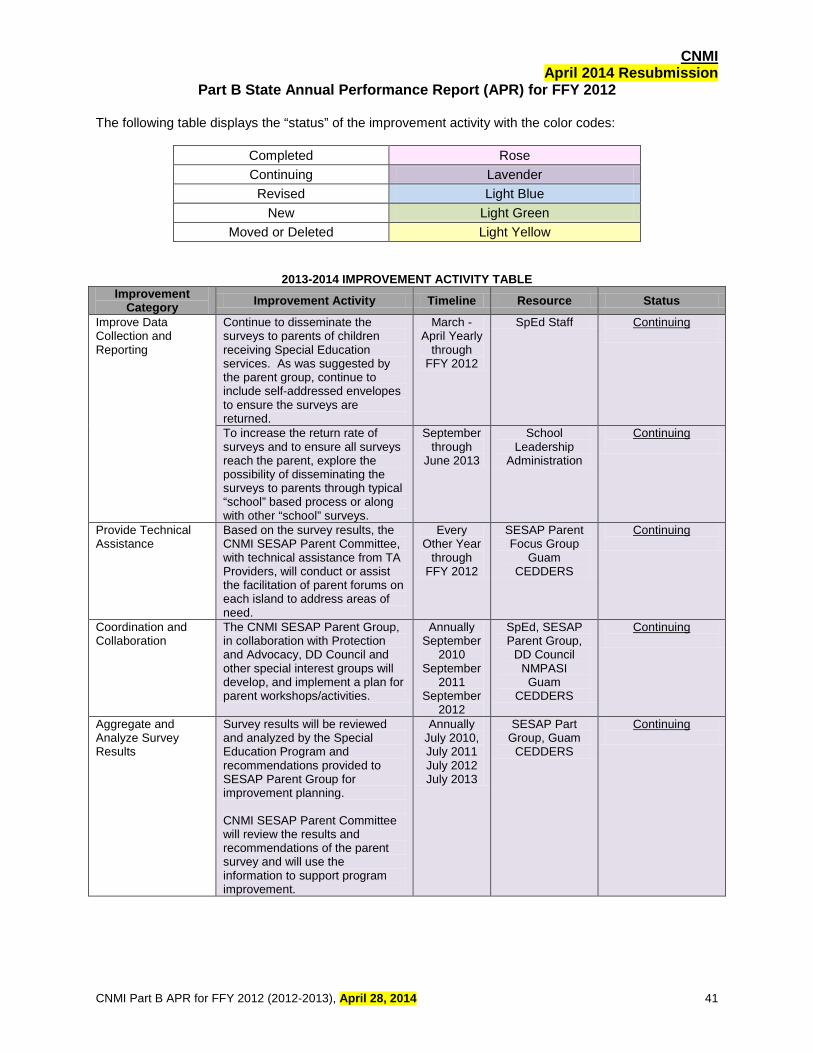
CNMI April 2014 Resubmission
Part B State Annual Performance Report (APR) for FFY 2012
CNMI Part B APR for FFY 2012 (2012-2013), April 28, 2014 41
The following table displays the “status” of the improvement activity with the color codes:
Completed Rose Continuing Lavender
Revised Light Blue New Light Green
Moved or Deleted Light Yellow
2013-2014 IMPROVEMENT ACTIVITY TABLE Improvement
Category Improvement Activity Timeline Resource Status
Improve Data Collection and Reporting
Continue to disseminate the surveys to parents of children receiving Special Education services. As was suggested by the parent group, continue to include self-addressed envelopes to ensure the surveys are returned.
March - April Yearly
through FFY 2012
SpEd Staff Continuing
To increase the return rate of surveys and to ensure all surveys reach the parent, explore the possibility of disseminating the surveys to parents through typical “school” based process or along with other “school” surveys.
September through
June 2013
School Leadership
Administration
Continuing
Provide Technical Assistance
Based on the survey results, the CNMI SESAP Parent Committee, with technical assistance from TA Providers, will conduct or assist the facilitation of parent forums on each island to address areas of need.
Every Other Year
through FFY 2012
SESAP Parent Focus Group
Guam CEDDERS
Continuing
Coordination and Collaboration
The CNMI SESAP Parent Group, in collaboration with Protection and Advocacy, DD Council and other special interest groups will develop, and implement a plan for parent workshops/activities.
Annually September
2010 September
2011 September
2012
SpEd, SESAP Parent Group,
DD Council NMPASI Guam
CEDDERS
Continuing
Aggregate and Analyze Survey Results
Survey results will be reviewed and analyzed by the Special Education Program and recommendations provided to SESAP Parent Group for improvement planning. CNMI SESAP Parent Committee will review the results and recommendations of the parent survey and will use the information to support program improvement.
Annually July 2010, July 2011 July 2012 July 2013
SESAP Part Group, Guam
CEDDERS
Continuing

CNMI April 2014 Resubmission
Part B State Annual Performance Report (APR) for FFY 2012
CNMI Part B APR for FFY 2012 (2012-2013), April 28, 2014 42
Overview of the Annual Performance Report Development: Refer to page 1 of this APR for development description. Monitoring Priority: Effective General Supervision Part B / Child Find Indicator 11: Percent of children who were evaluated within 60 days of receiving parental consent for initial evaluation or, if the State establishes a timeframe within which the evaluation must be conducted, within that timeframe. (20 U.S.C. 1416(a)(3)(B))
Measurement:
a. # of children for whom parental consent to evaluate was received. b. # of children whose evaluations were completed within 60 days (or State-established timeline).
Account for children included in a but not included in b. Indicate the range of days beyond the timeline when the evaluation was completed and any reasons for the delays.
Percent = [(b) divided by (a)] times 100.
FFY Measurable and Rigorous Target
2012 (2012-2013)
100% of children with parental consent received for initial evaluation will be evaluated within 60 days.
Actual Target Data for FFY 2012 (2012-2013): As indicated in Table 1, 183 parental consents for initial evaluations were received by the Public School System. Five of the 183 initial evaluations were completed over the 60-day timeline with valid reasons for the delay, as allowed in 34 CFR §300.301(d) and verified in the IEP files. IEP documentation indicated the children were not made available for the evaluations and several attempts were made to schedule the evaluations. Therefore, as indicated in the Part B Measurement Table, CNMI removed the five initial evaluations completed over the 60-day timeline with valid reasons from the numerator and denominator to determine the actual target data for this indicator, as reflected in Table 1. CNMI does not have a state-established timeframe different from the 60-day timeframe. For this reporting period, CNMI has demonstrated substantial compliance for this indicator reporting a performance of 98% (175/178) compliance. Table 1: Number and Percent of children whose evaluations were completed within the 60-day timeline for FFY 2012:
(a) # of children
for whom parental
consent to evaluate was
received
(b) # of children whose
initial evaluations were completed over 60
days with valid reasons for delay
(34 CFR §300.301(d))
(c) Total # of parental consent
received for Indicator 11
(a)-(b)
(d) # of children in (c) whose initial evaluations were completed within
the 60-day timeline
(e) # of children in (c)
whose initial evaluations were
completed over the 60-day timeline for an invalid reason
Indicator 11 Actual Target
Data
Percent = (d)/(c) x100
183 5 178 175 3 175/178 x 100 98%
Data Source: The evaluation data is taken from the database system of all children for whom PSS received a parental consent for an initial evaluation through the completion of the initial evaluation for the report year July 1, 2012 to June 30, 2013.

CNMI April 2014 Resubmission
Part B State Annual Performance Report (APR) for FFY 2012
CNMI Part B APR for FFY 2012 (2012-2013), April 28, 2014 43
As reported in Table 1 under “(e),” the three evaluations conducted over timeline for invalid reasons were completed from 1 day to 3 days over the 60-day requirement. Although the three were conducted late, all initial evaluations were completed. Table 2 indicates the number of delayed evaluations and reasons for the delay by school. For all evaluations conducted over the 60-day timeline, the school must submit a completed Reason for the Delay form which is verified by the Data Manager. The three evaluations conducted over the timeline with invalid reasons for delay were due to non-adherence to procedures. Table 2: Number of Delays with Reasons by School
School # Delayed Evaluations Invalid Reason for Delay KES 1 Non-adherence to procedures SVS 1 Non-adherence to procedures
Private Schools 1 Non-adherence to procedures Total 3
Data Collection and Verification The data for this indicator is taken from the database of all children for whom a consent for initial evaluation was received for the report period of July 1, 2012 to June 30, 2013. The Data Manager logs the referral information into the database which generates the time requirements (60 days from receipt of the parent consent). The Data Manager sends out the referral information to the schools and service providers responsible for the evaluation. Upon completion of evaluations, the reports are sent to the data manager to input into the database. The database is formatted to “flag” any dates over the 60-day timeline. For all red flags, a Reason for Delay form is required. The Data Manager, in consultation with the Special Education Director and Compliance Monitor, designates a determination of valid or invalid reasons for delay, consistent with 34 CFR §300.301(d). Discussion of Improvement Activities and Explanation of Slippage, if the State did not meet its target, that occurred for FFY 2012 (2012-2013): Performance: 98% (175/178). CNMI did not meet the compliance target of 100%, but maintained substantial compliance from last year’s performance of 98% (131/133). In addition, as shown in Table 3, CNMI has demonstrated substantial compliance and significant progress in this indicator over the past several years from the 2006-2007 baseline data of 27% compliance to 98% compliance for 2012-2013. Table 3: Evaluation Timeline Trend Data for the Last 7 Years
Report Year Percentage Completed within the 60-Day Timeline 2006-2007 27% 2007-2008 48% 2008-2009 83% 2009-2010 87% 2010-2011 97% 2011-2012 98% 2012-2013 98%
Displayed in Table 4 are the percentages and number of individual instances over timeline and the number of schools in which these instances occur. As shown, the percentage and number for both the individual instances and schools have decreased over the years demonstrating CNMI’s effectiveness for addressing the systemic issues of this measurement requirement.

CNMI April 2014 Resubmission
Part B State Annual Performance Report (APR) for FFY 2012
CNMI Part B APR for FFY 2012 (2012-2013), April 28, 2014 44
Table 4: Evaluation OVER Timeline Trend Data for the Last 6 Years
Report Year (a) % and # Individual Instances of
Noncompliance Completed OVER the 60-Day Timeline
% and # of Schools* in (a)
2007-2008 52% (66/128) 68%(15/22) 2008-2009 17% (27/160) 32% (7/22) 2009-2010 13% (22/172) 23% (5/22) 2010-2011 3% (5/163) 14% (3/22) 2011-2012 1.5% (2/133) 9% (2/22) 2012-2013 2% (3/178) 14% (3/22)
*Total number of schools is 22, which includes private schools as “1”, Early Childhood “1”, and 20 public schools Improvement activities that contributed to CNMI’s significant progress included the development of standard operating procedures that describe who, how, and when referrals are sent to the central office and a visual flow chart of the steps and processes. Monthly statistical reports are provided to principals with referral and IEP data. The Special Education Director and Compliance Monitor attend all monthly principal meetings and are allotted time on the agenda to discuss issues, challenges and successes in Special Education. The Evaluation Report Form was updated and reformatted to be more user friendly and includes all required documentation and timelines. Another factor that has contributed to the significant increase in timely evaluations is the schools’ implementation of Response to Intervention strategies and the use of more accurate and reliable data from a variety of sources. The school leadership has taken the lead in the past few years to ensure evaluations are conducted in a timely manner and that the IEP teams are in constant communication with each other and the parents. Under the leadership and guidance of the Commissioner of Education, the individual schools are held accountable for all processes. Correction of FFY 2011 Findings of Noncompliance: Level of compliance (actual target data) State reported for FFY 2011 for this indicator was 98%. The number of findings issued was the number of individual instances of noncompliance at the school.
1. Number of findings of noncompliance the State made during FFY 2011 (the period from July 1, 2011 through June 30, 2012) 2
2. Number of FFY 2011 findings the State verified as timely corrected (corrected within one year from the date of notification to the LEA of the finding) 2
3. Number of FFY 2011 findings not verified as corrected within one year [(1) minus (2)] 0
Correction of FFY 2011 Findings of Noncompliance Not Timely Corrected (corrected more than one year from identification of the noncompliance):
4. Number of FFY 2011 findings not timely corrected (same as the number from (3) above) 0
5. Number of FFY 2011 findings the State has verified as corrected beyond the one-year timeline (“subsequent correction”) 0
6. Number of FFY 2011 findings not verified as corrected [(4) minus (5)] 0
Verification of Correction for FFY 2011 (either timely or subsequent): In 2011-2012, two schools received a Written Notice of Findings for two individual instances of initial evaluations not completed within the 60-day timeline. Although late, both individual instances of noncompliance were verified to be completed. The two schools were verified corrected through a review of subsequent data of actual initial evaluation documents and the database within one year from the date of the notification and received a Written Notice of Timely Correction.

CNMI April 2014 Resubmission
Part B State Annual Performance Report (APR) for FFY 2012
CNMI Part B APR for FFY 2012 (2012-2013), April 28, 2014 45
Table 5 displays the verification of correction conducted for the two schools issued findings for late completion of initial evaluations in FFY 2011. Table 5: Verification of Correction of Noncompliance for 2011-2012 by Schools
#
Schools
(a) FFY 2011 (2011-2012): % and # of Individual Instances
of Noncompliance by Schools*
(b) # of Schools in (a) that demonstrated Timely Correction
(=Verified within 1 Year of Notice) 1. MHS 50% (1/2) 2. Private Schools 14% (1/7)
22% (2/9) Individual Instances of Noncompliance
2 Schools Verified Timely Correction
*All Individual Instances were late – completed over timeline. Describe specific actions that the State took to verify the correction of findings of noncompliance identified in FFY 2011: CNMI verifies correction of findings, either timely or subsequent correction, through a review of the required initial evaluation data stipulated in the Written Notice of Findings, including individual instances and additional data demonstrating 100% compliance for verified correction, consistent with OSEP Memo 09-02. All special education data are inputted into the special education excel database, with reports generated by schools. The initial evaluation data sources are the actual initial evaluation documents submitted to PSS Special Education Program for input into the special education database. Verification therefore is through a review of required documentation submitted to the PSS Special Education Program Office for input into the database. OSEP FFY 2011 APR Response Table: Compliance Data Summary Notes, July 2013:
Required Actions CNMI’s Response
Because CNMI reported less than 100% compliance for FFY 2011, CNMI must report on the status of correction of noncompliance identified in FFY 2011 for this indicator. When reporting on the correction of noncompliance, CNMI must report, in its FFY 2012 APR, that it has verified that for noncompliance identified in FFY 2011 for this indicator, CNMI: (1) is correctly implementing the specific regulatory requirements (i.e., achieved 100% compliance) based on a review of updated data such as data subsequently collected through on-site monitoring or the CNMI data system; and (2) has corrected each individual case of noncompliance, unless the child is no longer within the jurisdiction of CNMI, consistent with OSEP Memo 09-02. In the FFY 2012 APR, CNMI must describe the specific actions that were taken to verify the correction.
CNMI reports verified timely correction of FFY 2011 findings of noncompliance reported in the FFY 2011 APR for Indicator 11. Consistent with OSEP Memorandum 09-02, CNMI verified that the two schools issued findings of noncompliance were: (1) correctly implementing 34 CFR 300.301(c)(1) (i.e. achieved 100% compliance) based on a review of updated data from CNMI’s data system; and (2) has completed the evaluation, although late, for each child whose initial evaluation was not timely. Refer to discussion section of this Indicator.
Revisions, with Justification, to Proposed Targets / Improvement Activities / Timelines / Resources for FFY 2013: This is a compliance indicator therefore the target of 100% cannot be changed. CNMI did not revise the improvement activities for this indicator. As discussed on page 2 of this APR, the improvement activities are organized by areas of priority needs for improvement and color coded to show the “status” of each improvement activity. Although this FFY 2012 reporting year is the last year of the FFY 2005-2012 SPP, CNMI has updated the status of each improvement activity, including the continuation, if appropriate, of the improvement activity in FFY 2013. The following table displays the “status” of the improvement activity with the color codes:
Completed Rose Continuing Lavender
Revised Light Blue New Light Green
Moved or Deleted Light Yellow

CNMI April 2014 Resubmission
Part B State Annual Performance Report (APR) for FFY 2012
CNMI Part B APR for FFY 2012 (2012-2013), April 28, 2014 46
2013-2014 IMPROVEMENT ACTIVITY TABLE Improvement
Category
Improvement Activity
Timeline
Resource
Status Improve Data Collection and Reporting
Monthly data sheets are submitted to central office that are used to track and monitor referral dates, parental consent dates, evaluation report dates, IEP dates, and eligibility meeting dates. This is an effective data collection and reporting mechanism and will continue to be implemented in 2012-2013. Utilization of the school level network based data system will continue in 2012-2013.
2012-2013 Monthly
Assistant SpEd
Coordinator
Data Manager
Completed 2012-2013
Improve Administration and Monitoring
In line with the May 2011 revised Monitoring Procedures, On-site and off-site monitoring conducted, according to the monitoring cycle, includes evaluation timeline data. As required, corrective action plans developed to effectuate changes needed for full compliance
Timelines are defined in the
revised Monitoring Procedures
Commissioner of Education
Assistant
SpEd Coordinator
Completed
2012-2013
Conduct unannounced school visits to “spot check” to ensure what is reported is the practice.
Quarterly through
FFY 2012
SpEd Compliance
Monitor
Completed
Provide Technical Assistance
2012-2013
Monthly meetings with the Compliance Monitor and SPED Director are conducted with Special Education Teachers, Related Service Providers, and school administrators. The agenda (on file) includes items related to special education, the referral (Child Study Team Process), evaluation and re-evaluation processes and procedures. Training specific to policies and procedures continues.
Last Thursday of the Month
through FFY 2012
Assistant SpEd
Coordinator
SpEd Director
Completed 2012-2013
Focused technical assistance will be provided to schools where compliance with the timelines continues to be a challenge.
August to June of each School
Year
Assistant SpEd
Coordinator
SpEd Director
Completed 2012-2013
Provide Technical Assistance
“Star School” recognition will be issued to each school that attained 100% compliance in all areas monitored in the previous school year (as per the revised Monitoring Procedures). The STAR schools will get public recognition in the PSS new letter inserts.
At the first Principal and
Program Manager
Meeting of the school year, typically in September
through FFY 2012
SpEd Director Deleted 2012-2013
Justification: Incorporated into the revised monitoring procedures.

CNMI April 2014 Resubmission
Part B State Annual Performance Report (APR) for FFY 2012
CNMI Part B APR for FFY 2012 (2012-2013), April 28, 2014 47
Improvement Category
Improvement Activity
Timeline
Resource
Status
Facilitate meetings with school principals who have been required to submit improvement plans that include facilitated meetings with the SpEd Director if necessary
As needed Special Education Director
Continuing
Increasing and Adjusting FTE’s
Re-adjust/reassign SpEd personnel FTE’s to schools, including private schools, that continue to have challenges meeting compliance timelines if necessary. Review the duties and responsibility of the new assignment to ensure timelines and documentation are submitted in a timely manner.
Beginning January 2011
through FFY 2012
SpEd Director HR Personnel
Completed 2012-2013

CNMI April 2014 Resubmission
Part B State Annual Performance Report (APR) for FFY 2012
CNMI Part B APR for FFY 2012 (2012-2013), April 28, 2014 48
Overview of the Annual Performance Report Development: Refer to page 1 of this APR for development description.
Monitoring Priority: Effective General Supervision Part B / Effective Transition
Indicator 12: Percent of children referred by Part C prior to age 3, who are found eligible for Part B, and who have an IEP developed and implemented by their third birthdays. (20 U.S.C. 1416(a)(3)(B))
Measurement:
a. # of children who have been served in Part C and referred to Part B for Part B eligibility determination. b. # of those referred determined to be NOT eligible and whose eligibility was determined prior to their
third birthdays. c. # of those found eligible who have an IEP developed and implemented by their third birthdays. d. # of children for whom parent refusal to provide consent caused delays in evaluation or initial services
or to whom exceptions under 34 CFR §300.301(d) applied. e. # of children determined to be eligible for early intervention services under Part C less than 90 days
before their third birthdays.
Account for children included in a but not included in b, c, d or e. Indicate the range of days beyond the third birthday when eligibility was determined and the IEP developed and the reasons for the delays.
Percent = [(c) divided by (a - b - d - e)] times 100.
FFY
Measurable and Rigorous Target
2012
(2012-2013)
100% of children transitioning from Part C to Part B will have an IEP in effect by their 3rd birthday.
Actual Target Data for FFY 2012 (2012-2013): Table 1 shows 43 children were referred from Part C to Part B during this reporting year. Of the children referred, eight were determined not eligible and 35 children had an initial IEP developed prior to their third birthday. Based on the database for this reporting year, CNMI is in 100% compliance with this requirement. Table 1: FFY 2012 % of Children with IEP in Effect by 3rd Birthday a. # of children who have been served in Part C and referred to Part B for Part B eligibility
determination 43
b. # of those referred determined to be NOT eligible and whose eligibility was determined prior to third birthday 8
c. # of those found eligible who have an IEP developed and implemented by their third birthdays 35
d. # for whom parent refusals to provide consent caused delays in evaluation or initial services 0 e. # of children determined to be eligible for early intervention services under Part C less than
90 days before their third birthdays. 0
% of children referred by Part C prior to age 3 who are found eligible for Part B, and who have an IEP developed and implemented by their 3rd birthday: % = [(c)/(a - b - d - e)] x 100
35/(43-8-0-0) = 35/35 x 100 =
100% For Indicator 12, CNMI did not identify findings of noncompliance in FFY 2011.

CNMI April 2014 Resubmission
Part B State Annual Performance Report (APR) for FFY 2012
CNMI Part B APR for FFY 2012 (2012-2013), April 28, 2014 49
Data Collection and Verification Data used to report this indicator was taken from the database and verified in the child’s IEP folder. The Early Intervention Program submits a monthly listing of Part C children who will be three (3) years old during the year and who are potentially eligible for Part B services. The Early Childhood Special Education (EC-SPED) team is invited to attend all Transition Conferences of children potentially eligible for Special Education. During the Transition Conference, the EC-SPED team plans and schedules with parents the potential dates to begin the Part B evaluation and IEP process. The EC-SPED team is responsible to ensure procedural safeguard requirements are followed (Prior Written Notice provided to the parent and parental consent to evaluate is obtained prior to the evaluation). If the child is determined eligible for special education, parental consent is obtained prior to the development and implementation of initial services and placement. The EC-SPED team submits the timeline data (date of Consent to Evaluate, date of Consent for Initial IEP, and IEP implementation date) to the data manager. The data manager logs the information into the database and verifies the dates with the documents. The database is formatted to “flag” the 60-day timeline requirement and initial IEP dates that are over the child’s third birthday. For children referred from Part C whose IEPs are over their third birthday, valid Reasons for Delay allowable is parent refusal to consent to the initial evaluation or refusal to consent to the initial IEP. Discussion of Improvement Activities Completed and Explanation of Slippage, if the State did not meet its target that occurred for FFY 2012 (2012-2013): Performance: 100% (35/35), representing full compliance with Indicator 12 measurement as in previous year’s reporting. OSEP Memorandum 14-2, October 2013: OSEP provided additional instructions in an effort to reduce reporting burden. For the FFY 2012 APR, States:
1) Are not required to provide an explanation of: a) progress; b) no change in actual target data from the data for FFY 2011; or c) slippage if the State meets its target.
2) Are not required to discuss improvement activities for: a) compliance indicators where the State reports 100% compliance for FFY 2012; and b) results indicators where the State has met its FFY 2012 target.
For Indicator 12, CNMI met 100% compliance and therefore is not required to provide an explanation of progress or slippage and a discussion on improvement activities. Revisions, with Justification, to Proposed Targets/Improvement Activities/Timelines/Resources for 2013: This is a compliance indicator therefore the target of 100% cannot be changed. CNMI did not revise the improvement activities for this indicator. As discussed on page 2 of this APR, the improvement activities are organized by areas of priority needs for improvement and color-coded to show the “status” of each improvement activity. Although this FFY 2012 reporting year is the last year of the FFY 2005-2012 SPP, CNMI has updated the status of each improvement activity, including the continuation, if appropriate, of the improvement activity in FFY 2013. The following table displays the “status” of the improvement activity with the color codes:
Completed Rose Continuing Lavender
Revised Light Blue New Light Green
Moved or Deleted Light Yellow

CNMI April 2014 Resubmission
Part B State Annual Performance Report (APR) for FFY 2012
CNMI Part B APR for FFY 2012 (2012-2013), April 28, 2014 50
2013-2014 IMPROVEMENT ACTIVITY TABLE Improvement
Category Improvement Activity Timeline Resource Status
Improve Data Collection and
Reporting
The Part C and Part B data managers continue to meet on a regular basis to review and compare data entries to ensure the data sent by Part C is accurately accounted for in the Part B database.
Monthly through FFY
2012
Part C and B Data Managers
Continuing
Review and Revise Policies and Procedures
At least annually, both Part B and Part C providers will continue to review and revise if necessary, the transition procedures, including any changes that may be necessary to align with the new Part C Regulations.
April 2009 April 2010 April 2011 April 2012 April 2013
Early Childhood SpEd Teachers
and SpEd Director Guam
CEDDERS
Continuing
Disseminate the Part C Transition Directive which was signed in June 2012, to Part C and Part B providers.
September 2012
Part C Coordinator
Part B Director
Completed 2012-2013
Collaboration and Coordination
Continue to conduct joint training and meetings with Part C, Part B and Head Start staff regarding the transition process. The process of joint meetings has been very effective to ensure the transition requirements are met and all toddlers served in Part C and their families are provided a smooth transition into heard start or other preschool setting.
Quarterly through FFY
2012
Head Start, EC SpEd staff, Part C Staff
Continuing
Training and Professional Development
Conduct training on the content of the directive including the dispute resolution process and procedures.
September 2012
EI Coordinator SpEd Director
Completed 2012-2013

CNMI April 2014 Resubmission
Part B State Annual Performance Report (APR) for FFY 2012
CNMI Part B APR for FFY 2012 (2012-2013), April 28, 2014 51
Overview of the Annual Performance Report Development: Refer to page 1 of this APR for development description.
Monitoring Priority: Effective General Supervision Part B/Effective Transition
Indicator 13: Percent of youth with IEPs aged 16 and above with an IEP that includes appropriate measurable postsecondary goals that are annually updated and based upon an age appropriate transition assessment, transition services, including courses of study, that will reasonably enable the student to meet those postsecondary goals, and annual IEP goals related to the student’s transition service’s needs. There also must be evidence that the student was invited to the IEP Team meeting where transition services are to be discussed and evidence that, if appropriate, a representative of any participating agency was invited to the IEP Team meeting with the prior consent of the parent or student who has reached the age of majority. (20 U.S.C. 1416(a)(3)(B) Measurement: # youth with IEPs aged 16 and above with an IEP that includes appropriate measurable postsecondary goals that are annually updated and based upon an age appropriate transition assessment, transition services, including courses of study, that will reasonably enable the student to meet those postsecondary goals, and annual IEP goals related to the student’s transition services needs. There also must be evidence that the student was invited to the IEP Team meeting where transition services are to be discussed and evidence that, if appropriate, a representative of any participating agency was invited to the IEP Team meeting with the prior consent of the parent or student who has reached the age of majority) divided by the (# of youth with an IEP age 16 and above)] times 100.
FFY
Measurable and Rigorous Target
2012
(2012-2013)
100% of youth with IEPs aged 16 and above with an IEP that includes appropriate measurable postsecondary goals that are annually updated and based upon an age appropriate transition assessment, transition services, including courses of study, that will reasonably enable the student to meet those postsecondary goals, and annual IEP goals related to the student’s transition services needs. There also is evidence that the student was invited to the IEP Team meeting where transition services are to be discussed and evidence that, if appropriate, a representative of any participating agency was invited to the IEP Team meeting with the prior consent of the parent or student who has reached the age of majority.
Actual Target Data for FFY 2012 (2012-2013): Based on the June 30, 2013 database draw down of youths aged 16 and above with IEPs, there were 211 youths with IEPs aged 16 and above for the FFY 2012 reporting period. Table 1 indicates that CNMI demonstrated 100% compliance with Indicator 13 requirements for all 211 youth with IEPs aged 16 and above in FFY 2012. Table 1: Number and Percent of Students 16 years and above who have an IEP with the Secondary Transition Requirements
A: # Students aged 16 and above with IEPs
B: # of students with IEPs that include all secondary transition requirements
(B/A x 100)
211 211 211/211 x 100 = 100% Data Source: Cutting Edj Consulting, Inc. and Special Education Data System

CNMI April 2014 Resubmission
Part B State Annual Performance Report (APR) for FFY 2012
CNMI Part B APR for FFY 2012 (2012-2013), April 28, 2014 52
Data Collection and Verification This is the fourth year of implementation for Cutting Edj data entry which is inputted by secondary teachers at the school level and reconciled with the Special Education Data Base. The special education monitor uses the National Secondary Transition Technical Assistance Center (NSTTAC) checklist to review IEP files for transition requirements on an annual basis. The Cutting Edj Data System reports on the secondary transition planning components of IEPs of students aged 15 and above. The system flags students aged 15 who should have transition planning in their IEPs as they will turn 16 within the term of the IEP. CNMI PSS contracts with Cutting Edj Consulting, Inc. to collect the data required to report on Indicator 13 secondary transition mandates. Cutting Edj uses the NSTTAC checklist as a rigorous, valid and reliable tool to assess performance in transition planning for postsecondary activities. In partnership with other island-based agencies sharing in the responsibility of transitioning youth with disabilities, the CNMI PSS’s Secondary Transition Focus Group received intensive training on adhering to NSTTAC’s benchmarks on the documentation, collection, and reporting of valid and reliable secondary transition data. As part of the contract with Cutting Edj, CNMI PSS has been able to personalize this web-based data entry, collection, collation and reporting system. The standard reporting systems built in to the Cutting Edj Data System allows each school site to view each one of the eight items on the NSTTAC checklist. The Cutting Edj data are then verified with the IEP data in the special education data system for APR reporting. Discussion of Improvement Activities and Explanation of Slippage, if the State did not meet its target, that occurred for FFY 2012 (2012-2013): Performance: 100% (211/211), representing full compliance with Indicator 13 measurement, as in the previous year’s reporting. OSEP Memorandum 14-2, October 2013: OSEP provided additional instructions in an effort to reduce reporting burden. For the FFY 2012 APR, States:
1) Are not required to provide an explanation of: a) progress; b) no change in actual target data from the data for FFY 2011; or c) slippage if the State meets its target.
2) Are not required to discuss improvement activities for: a) compliance indicators where the State reports 100% compliance for FFY 2012; and b) results indicators where the State has met its FFY 2012 target.
3) May provide one set of improvement activities for the entire APR as long as the Improvement Activities are indexed back to reference the relevant indicators.
For Indicator 13, CNMI met 100% compliance and therefore is not required to provide an explanation of progress or slippage and a discussion on improvement activities. Correction of FFY 2011 Findings of Noncompliance: In FFY 2011, CNMI reported 100% compliance for Indicator 13 based on the special education data system. As reported in this APR for Indicator 15, in FFY 2011, one junior high school received a Written Notice of Findings for four individual instances of noncompliance with the secondary transition requirements in the IEP. The findings were made as a result of the comprehensive on-site school monitoring conducted at the junior high school in March 2012. Verification of Correction for FFY 2011 Findings of Noncompliance (either timely or subsequent): Verification of correction for the noncompliance identified at the junior high was completed on-site on May 29, 2012 within the FFY 2011 reporting period. With the individual child-specific noncompliance corrected immediately and verified in May 2012, CNMI was able to report 100% compliance for FFY 2011 Indicator 13 performance. As indicated earlier, Indicator 13 data are taken from the special education data system. Describe specific actions that the State took to verify the correction of findings of noncompliance identified in FFY 2011: CNMI verifies correction of findings, either timely or subsequent correction, through a review of the required Indicator 13 requirements stipulated in the Written Notice of Findings,

CNMI April 2014 Resubmission
Part B State Annual Performance Report (APR) for FFY 2012
CNMI Part B APR for FFY 2012 (2012-2013), April 28, 2014 53
including individual instances and additional data demonstrating 100% compliance for verified correction, consistent with OSEP Memo 09-02. All special education data are inputted into the special education excel database, with reports generated by schools. The Special Education Monitor verified that the four child-specific noncompliance findings related to Indicator 13 at the junior high were corrected by the end of May 2012. This was done through individual file reviews and verified through the special education data system. The additional data demonstrating 100% compliance for Indicator 13 requirements at the junior high were monitored through January 2013 based on the special education data system. The Written Notice of Timely Correction was issued in January 2013, which was within the one-year timeline for verified correction. Revisions, with Justification, to Proposed Targets / Improvement Activities / Timelines / Resources for 2013: This is a compliance indicator therefore the target of 100% cannot be changed. CNMI did not revise the improvement activities for this indicator. As discussed on page 2 of this APR, the improvement activities are organized by areas of priority needs for improvement and color coded to show the “status” of each improvement activity. Although this FFY 2012 reporting year is the last year of the FFY 2005-2012 SPP, CNMI has updated the status of each improvement activity, including the continuation, if appropriate, of the improvement activity in FFY 2013. The following table displays the “status” of the improvement activity with the color codes:
Completed Rose Continuing Lavender
Revised Light Blue New Light Green
Moved or Deleted Light Yellow
2013-2014 IMPROVEMENT ACTIVITY TABLE
Improvement Category Improvement Activity Timeline Resource Status
Improve Data Collection and
Reporting
Cutting Edj Data System to assess performance of transition requirements. The data will be entered by secondary teachers immediately upon completion of the IEP to ensure all components of the transition requirements are in the IEP.
Spring 2011
Spring 2012
Cuttingedj Data System
Dr. Ed O’Leary
Continuing
Data Manager will add field to data base for transition requirements.
February 2011
Data Manager Transition
Coordinator
Deleted Justification: Utilizing Cutting Edj Data System to collect and report data, with verification of IEP data in the special education data system.
Training and Professional Development
Continue to provide training opportunities for secondary teachers, school leadership, parents, and students on post school outcomes and the transition process/requirements.
Annually in the Fall and Spring through
FFY 2012
Resources: UH, NPSO, NSTTAC
Continuing
Develop resource materials to provide guidance to IEP teams on requirements for secondary transition and post-school outcomes. The resource guide will also include the process for collecting and reporting post school outcomes.
Annually through FFY 2012
Secondary Transition
Coordinator
Completed 2012-2013

CNMI April 2014 Resubmission
Part B State Annual Performance Report (APR) for FFY 2012
CNMI Part B APR for FFY 2012 (2012-2013), April 28, 2014 54
Improvement Category Improvement Activity Timeline Resource Status Technical Assistance
In addition to training and professional development opportunities, ongoing and consistent onsite TA will be provided to school teams, specifically schools with new or inexperienced teachers.
Monthly through FFY 2012
Transition Coordinator
Continuing
Collaboration and Coordination
Continue partnership with Transition Network to enhance school-to-work outcomes for all students who leave the PSS e.g. job coaching, job shadowing, self-employment Continue collaboration with national and local resource centers to maximize access to research-based resources and postsecondary education opportunities for youth with disabilities. Continue to work collaboratively with institutes of higher education to ensure pre-service instruction on IDEA transition requirements for new teachers
Annually in Fall, Winter, & Spring
through FFY 2012
May 2011 May 2012
June 2011
Transition Network-
Partnership
NSTTAC, NPSO, NDPC
CNMI PSS CTE, NMC
Transition Network, NMC
Continuing
Continue collaborative work with Dr. Ed O’Leary’s transition planning training.
Spring 2011 Dr. Ed O’Leary
Completed 2012-2013
Improve Administration and
Monitoring
Continue to review and monitor IEP files to ensure all IEPs contain the required transition components.
Quarterly
Continuing

CNMI April 2014 Resubmission
Part B State Annual Performance Report (APR) for FFY 2012
CNMI Part B APR for FFY 2012 (2012-2013), April 28, 2014 55
Overview of the Annual Performance Report Development:
Refer to page 1 of this APR for development description.
Indicator 14: Percent of youth who are no longer in secondary school, had IEPs in effect at the time they left school, and were:
A. Enrolled in higher education within one year of leaving high school. B. Enrolled in higher education or competitively employed within one year of leaving high school. C. Enrolled in higher education or in some other post-secondary education or training program; or competitively employed or in some other employment within one year of leaving high school.
(20 U.S.C. 1416(a)(3)(B))
Measurement:
A. Percent enrolled in higher education = [(# of youth who are no longer in secondary school, had IEPs in effect at the time they left school and were enrolled in higher education within one year of leaving high school) divided by the (# of respondent youth who are no longer in secondary school and had IEPs in effect at the time they left school)] times 100.
B. Percent enrolled in higher education or competitively employed within one year of leaving high school = [(# of youth who are no longer in secondary school, had IEPs in effect at the time they left school and were enrolled in higher education or competitively employed within one year of leaving high school) divided by the (# of respondent youth who are no longer in secondary school and had IEPs in effect at the time they left school)] times 100.
C. Percent enrolled in higher education, or in some other post-secondary education or training program; or competitively employed or in some other employment = [(# of youth who are no longer in secondary school, had IEPs in effect at the time they left school and were enrolled in higher education, or in some other post-secondary education or training program; or competitively employed or in some other employment) divided by the (# of respondent youth who are no longer in secondary school and had IEPs in effect at the time they left school)] times 100.
FFY Measurable and Rigorous Target
2012 (2012-2013)
A = 10% enrolled in higher education B = 62% enrolled in higher education or competitively employed C = 86% enrolled in higher education or in some other post-secondary education or training program; or competitively employed or in some other employment
Actual Target Data for FFY 2012 (2012-2013): Table 1: Survey Responses and Number of Respondents
Responses # & % of Respondents #1 “Higher Education” 11 (24%) #2 “Competitive Employment” not counted in #1 19 (42%) #3 “Some other Post-Secondary Education or Training” not
counted in #1 or #2 3 (7%)
#4 “Some other Employment” not counted in #1 , #2, or #3 4 (9%) #5 “Not Engaged” in any of the Above Activities. 8 (18%) Total Number of Respondents 45 (100%)
Monitoring Priority: Effective General Supervision Part B / Effective Transition

CNMI April 2014 Resubmission
Part B State Annual Performance Report (APR) for FFY 2012
CNMI Part B APR for FFY 2012 (2012-2013), April 28, 2014 56
Measurements % A = (#1) divided by (total respondents)
11/45 x 100 = 24%
B = (#1) + (#2) divided by (total respondents) (11+19) = 30/45 x 100 = 67%
C = (#1) + (#2) + (#3) + (#4) divided by (total respondents) (11+19+3+4) 37/45 x 100 = 82%
In FFY 2011-2012, Special Education 618 data indicated that 111 students exited special education. Of the 111, 22 transferred to regular education, 28 moved, known to be continuing, 13 dropped out, 45 graduated with a high school diploma, and 3 reached maximum age. For Indicator 14, a total of 61 secondary students had an IEP in effect when they exited and was tracked for this indicator. These include 13 drop-outs, 45 graduates with a regular high school diploma, and 3 reached maximum age. Dropout Data: Of the 13 dropouts, 10 (77%) were male, 3 (23%) were female. Of the 13, 11 (85%) had Specific Learning Disabilities (SLD), 1 (7.5%) was Other Health Impaired, and 1 (7.5%) was Hearing Impaired. Graduate Data: 45 students graduated with a regular high school diploma. Thirty-two (71%) males and 13 (29%) were females. Of the 45 graduates, 30 (67%) were identified as SLD, 5 (11%) Intellectual Disability, 4 (9%) Multiple Disabilities, 3 (7%) Other Health Impairment, 2 (4%) with Autism, and 1 (2%) with Emotional Disabilities. Reached Maximum Age Data: Of the 3 leavers who “reached maximum age,” 2 (67%) were male and 1 (33%) was female. In addition, 2 (67%) were identified as SLD, and 1 was Multiple Disabilities. Survey Respondents: Post-School outcome data should have been collected for 61 students identified as “leavers” for Indicator 14. Information was successfully collected from 45 out of the 61 students for a 74% response rate from the leavers or from families of the leavers, which represents the majority of secondary leavers and is representative of the CNMI. Table 2 displays the post-school outcomes of the 45 respondents. As shown, the majority of responding leavers were students with Specific Learning Disabilities (SLD), which is representative of the majority of leavers, as well as the majority of students with disabilities served in the CNMI. Table 2: SY 2011-2012 Exits Tracked One Year Out by Disability Category: Disability Higher
Education #1
Competitively Employed
#2
Other Post-Secondary Education
#3
Some Other Employment
#4
Not engaged #5
Total # & % (1+2+3+4+5/45)
x 100 SLD 6/11
(55%) 17/19 (90%)
1/3 (33.3%)
3/4 (75%)
2/8 (25%)
29/45 (64%)
ID 1/11 (9%)
1/4 (25%)
1/8 (12.5%)
3/45 (7%)
MD 1/11 (9%)
4/8 (50%)
5/45 (11%)
OHI 2/11 (18%)
1/8 (12.5%)
3/45 (7%)
HI 1/19 (5%)
1/3 (33.3%)
2/45 (4%)
Aut 1/11 (9%)
1/3 (33.3%)
2/45 (4%)
ED 1/19 (5%)
1/45 (2%)
11 (100%)
19 (100%)
3 (100%)
4 (100%)
8 (100%)
45/45 (100%)

CNMI April 2014 Resubmission
Part B State Annual Performance Report (APR) for FFY 2012
CNMI Part B APR for FFY 2012 (2012-2013), April 28, 2014 57
Definitions: The following definitions are used by the CNMI for Indicator 14: • Competitive employment means that youth have worked for pay at or above the minimum wage in a
setting with others who are nondisabled for a period of 20 hours a week for at least 90 days at any time in the year since leaving high school. This includes military employment.
• Higher Education means youth have been enrolled on a full- or part-time basis in a community college (2-year program), or college/university (4- or more year program) for at least one complete term, at any time in the year since leaving high school.
• Some Other Employment means youth have worked for pay or been self-employed for a period of at least 90 days at any time in the year since leaving high school. This includes working in a family business (e.g., farm, store, fishing, ranching, catering services, etc.).
• Other post-secondary education or training means youth enrolled on a full- or part-time basis for at least one complete term at any time in the year since leaving high school in an education or training program (e.g., Job Corps, adult education, workforce development program, or vocational technical school which is less than a 2-year program).
• Respondents are youth or their designated family member who answer the survey or interview questions.
• Leavers are youth who left school by graduating with a regular or modified diploma, aging out, left school early (i.e., dropped out), or who were expected to return and did not.
Data Collection Process: In June of each year, school teams (special education teachers, teacher aides, counselors, registrars) are able to gather and corroborate most of the postsecondary outcomes data from personal knowledge of the student, and from communicating directly with the students/families of students (possibly siblings, relatives, neighbors) at their respective school sites. School IEP teams currently inform the student and family that they will be contacted one year after leaving school to see if they have met their goals. During the school year, more contact information (email addresses, close family member contact information) is sought to ensure the ability to contact the student post-school. A physical map of the student’s home is required for school registration purposes. Surveys are collected and submitted to the Secondary Transition Coordinator for review to ensure that all sections have been completed correctly. The Secondary Transition Coordinator reviews the surveys for missing data and corroborates the student contact information with the current special education central office data. If there is new contact information available, the student/family is contacted and the survey is completed by the Secondary Transition Coordinator. If there is no new contact information, the student file is determined “unable to contact.” Discussion of Improvement Activities Completed and Explanation of Progress or Slippage that occurred for FFY 2012 (2012-2013): Performance A: 24% (11/45): The CNMI exceeded its target and demonstrated progress from the previous year of 16% (7/43). Performance B: 67% (30/45): The CNMI exceeded its target and demonstrated progress from the previous year of 42% (18/43). Performance C: 82% (37/45): The CNMI did not meet its target of 86%, however, did demonstrate progress from previous year of 65% (28/43). CNMI’s FFY 2012 Indicator 14 performance demonstrated progress in all three areas. CNMI’s performance for Measurements A and B exceeded CNMI’s target. For Measurement C, CNMI did not meet its target by 4%, but made significant progress from previous year’s reporting from 65% (28/43) to 82% (37/45), which represents a 17% increase, or by number, nine more leavers in Measurement C. It is worthy to note that as the PSS continues to focus its efforts on improving the transition process for all students there has been significant effort in the community to improve outcomes for high school leavers.

CNMI April 2014 Resubmission
Part B State Annual Performance Report (APR) for FFY 2012
CNMI Part B APR for FFY 2012 (2012-2013), April 28, 2014 58
In prior years, the PSS facilitated a Secondary Transition Focus Group with representatives from various agencies and parents. The focus group evolved into the Transition Network, now facilitated by the local community college. Network members include all the local agencies working with individuals with disabilities transitioning out of high school: higher education, trades institute, vocational rehabilitation counselors, Workforce Investment Agency, Developmental Disabilities Council and parents. The Transition Network created a transition resource which was distributed at community events involving transitioning youth on the three main islands. The collaborative effort of the Transition Network has ensured the sharing of knowledge on the transition process to parents and students in order for them to participate fully in the transition process: activities that were previously facilitated and funded solely by the CNMI PSS. The CNMI PSS has also called on community partner agencies to become more involved in promoting achievement for all students by expanding career and technical education pathways. The PSS Career and Technical Education (CTE) initiative expands the options for students to graduate ready for work in careers that are available in this locale. The local trade institute has made successful placements there and is developing partnerships with local businesses and industries to place more trade institute graduates. Recent legislation (2012) allows trade institute students to avail themselves of scholarships. The CNMI PSS Job Co-op program continues to collaborate successfully with local industries by organizing twice-yearly (September and February) Job Fairs. This venue allows local employers to interview high school seniors as potential employees and offer them valuable job experience and possible long-term employment. This same venue offers the students an opportunity to see what is available and practice interviewing. One sign of the established growth of this program is the role of former graduates returning as representatives of their new businesses and mentors for the new crop of graduates. Student salaries are funded by the Workforce Investment Agency (WIA), other partner agencies, or private businesses. Revisions, with Justification, to Proposed Targets/Improvement Activities/Timelines/Resources for FFY 2013: CNMI did not revise the targets. As discussed on page 2 of this APR, the improvement activities are organized by areas of priority needs for improvement and color-coded to show the “status” of each improvement activity. Although this FFY 2012 reporting year is the last year of the FFY 2005-2012 SPP, CNMI has updated the status of each improvement activity, including the continuation, if appropriate, of the improvement activity in FFY 2013. The following table displays the “status” of the improvement activity with the color codes:
Completed Rose Continuing Lavender
Revised Light Blue New Light Green
Moved or Deleted Light Yellow
2013-2014 Improvement Activities Improvement
Category
Improvement Activity
Timeline
Resources
Status Improve Data Collection and
Reporting
Inform and encourage youth to respond to the post-school interviews. Schools will inform parents and youth of the post-school interviews. The schools will obtain additional or alternate student contact information,
Annually at IEP meetings through FFY
2012
Student and Parent flyers
Secondary
Teacher
Continuing

CNMI April 2014 Resubmission
Part B State Annual Performance Report (APR) for FFY 2012
CNMI Part B APR for FFY 2012 (2012-2013), April 28, 2014 59
Improvement Category
Improvement Activity
Timeline
Resources
Status
specifically reliable email addresses. The flyers will be provided at the IEP meeting.
Improve Data Collection and
Reporting
Consider using acceptable technological means such as FaceBook, MySpace, PSS Webpages to maintain contact or communication with student who have exited.
June 2012
Special
Education Program at each school
School
Leadership
Transition Focus Group
Completed 2012-2013
Training and Professional Development
To support students to complete at least one term of higher education, the CNMI PSS will host two collaborative professional development seminars for teachers, guidance counselors, and district administrators, in partnership with the Transition Network Partnership (college disability services coordinators, vocational rehabilitation counselors, DD Council, and WIA)
Twice per Year through FFY
2012
Transition Network
Continuing
Collaboration and Coordination
Continue collaboration with national and local resource centers to access research-based resources.
May 2011 May 2012
NSTTAC, NPSO, NDPC
CTE
Completed 2012-2013

CNMI April 2014 Resubmission
Part B State Annual Performance Report (APR) for FFY 2012
CNMI Part B APR for FFY 2012 (2012-2013), April 28, 2014 60
Overview of the Annual Performance Report Development: Refer to page 1 of this APR for development description. Monitoring Priority: Effective General Supervision Part B / General Supervision
Indicator 15: General supervision system (including monitoring, complaints, hearings, etc.) identifies and corrects noncompliance as soon as possible but in no case later than one year from identification. (20 U.S.C. 1416 (a)(3)(B)) Measurement: Percent of noncompliance corrected within one year of identification: a. # of findings of noncompliance. b. # of corrections completed as soon as possible but in no case later than one year from identification.
Percent = [(b) divided by (a)] times 100. States are required to use the “Indicator 15 Worksheet” to report data for this indicator (see Attachment A).
FFY Measurable and Rigorous Target
2012
(2012-2013)
100% of CNMI’s general supervision system (including monitoring, complaints, hearings, etc.) identifies and corrects noncompliance as soon as possible but in no case later than one year from identification.
Actual Target Data for FFY 2012 (2012-2013): As per OSEP’s instructions, CNMI used the Indicator B15 worksheet to document the correction of noncompliance identified in FFY 2011. As listed in column 3, “school or system” was used to indicate the type of data review source utilized to make the findings of noncompliance.
PART B INDICATOR 15 WORKSHEET
Indicator/Indicator Clusters
General Supervision System
Components
# of School/
System Issued
Findings in FFY 2011 (7/1/11 to 6/30/12)
(a) # of
Findings of noncompliance
identified in FFY 2011 (7/1/11 to 6/30/12)
(b) # of Findings of
noncompliance from (a) for
which correction was verified no later than one
year from identification
1. Percent of youth with IEPs graduating from high school with a regular diploma. 2. Percent of youth with IEPs dropping out of high school. 14. Percent of youth who had IEPs, are no longer in secondary school and who have been competitively employed, enrolled in some type of postsecondary school, or both, within one year of leaving high school.
Monitoring Activities: Self-Assessment/ Local APR, Data Review, Desk Audit, On-Site Visits, or Other
0
0
0
Dispute Resolution: Complaints, Hearings
0
0
0
3. Participation and performance of children with disabilities on statewide assessments. 7. Percent of preschool children with IEPs who demonstrated improved outcomes.
Monitoring Activities: Self-Assessment/ Local APR, Data Review, Desk Audit, On-Site Visits, or Other
0
0
0
Dispute Resolution: Complaints, Hearings
0
0
0

CNMI April 2014 Resubmission
Part B State Annual Performance Report (APR) for FFY 2012
CNMI Part B APR for FFY 2012 (2012-2013), April 28, 2014 61
Indicator/Indicator Clusters
General Supervision
System Components
# of School/
System Issued
Findings in FFY 2011 (7/1/11 to 6/30/12)
(a) # of
Findings of noncompliance
identified in FFY 2011 (7/1/11 to 6/30/12)
(b) # of Findings of
noncompliance from (a) for
which correction was verified no later than one
year from identification
4A. Percent of districts identified as having a significant discrepancy in the rates of suspensions and expulsions of children with disabilities for greater than 10 days in a school year.
Monitoring Activities: Self-Assessment/ Local APR, Data Review, Desk Audit, On-Site Visits, or Other
0
0
0
Dispute Resolution: Complaints, Hearings 0 0 0
5. Percent of children with IEPs aged 6 through 21 -educational placements. 6. Percent of preschool children aged 3 through 5 – early childhood placement.
Monitoring Activities: Self-Assessment/ Local APR, Data Review, Desk Audit, On-Site Visits, or Other
13
Schools (Off-Site)
37
37
Dispute Resolution: Complaints, Hearings
0
0
0
8. Percent of parents with a child receiving special education services who report that schools facilitated parent involvement as a means of improving services and results for children with disabilities.
Monitoring Activities: Self-Assessment/ Local APR, Data Review, Desk Audit, On-Site Visits, or Other
0
0
0
Dispute Resolution: Complaints, Hearings
0 0 0 9. Percent of districts with disproportionate representation of racial and ethnic groups in special education that is the result of inappropriate identification. 10. Percent of districts with disproportionate representation of racial and ethnic groups in specific disability categories that is the result of inappropriate identification.
Monitoring Activities: Self-Assessment/ Local APR, Data Review, Desk Audit, On-Site Visits, or Other
Not Applicable to CNMI.
Dispute Resolution: Complaints, Hearings
Not Applicable to CNMI.
11. Percent of children who were evaluated within 60 days of receiving parental consent for initial evaluation or, if the State establishes a timeframe within which the evaluation must be conducted, within that timeframe.
Monitoring Activities: Self-Assessment/ Local APR, Data Review, Desk Audit, On-Site Visits, or Other
2
Schools (APR Data Review-Off-
Site)
2
2
Dispute Resolution: Complaints, Hearings
0
0
0
12. Percent of children referred by Part C prior to age 3, who are found eligible for Part B, and who have an IEP developed and implemented by their third birthdays.
Monitoring Activities: Self-Assessment/ Local APR, Data Review, Desk Audit, On-Site Visits, or Other
0
0
0
Dispute Resolution: Complaints, Hearings
0 0 0 13. Percent of youth aged 16 and above with IEP that includes coordinated, measurable, annual IEP goals and transition services that will reasonably enable student to meet the post-secondary goals.
Monitoring Activities: Self-Assessment/ Local APR, Data Review, Desk Audit, On-Site Visits, or Other
1
Schools (On-Site)
4
4
Dispute Resolution: Complaints, Hearings
0
0
0
Other areas of noncompliance: • Re-evaluation • Prior Written Notice • IEP Content
Monitoring Activities: Self-Assessment/ Local APR, Data Review, Desk Audit, On-Site Visits, or Other
9
Schools (5=On-Site & 4=Off-Site)
36
36
Dispute Resolution: Complaints, Hearings
0
0
0
Sum the numbers down Column a and Column b 79 79 Percent of noncompliance corrected within one year of identification =
(column (b) sum divided by column (a) sum) times 100. (b) / (a) X 100 = 100%

CNMI April 2014 Resubmission
Part B State Annual Performance Report (APR) for FFY 2012
CNMI Part B APR for FFY 2012 (2012-2013), April 28, 2014 62
CNMI, a unitary system, demonstrated verified correction of findings of noncompliance issued through five main sources of data review in FFY 2011:
1. APR Data
: As a “system” review of APR data, CNMI conducts data reviews of the compliance indicators from the special education data system at the end of each fiscal year:
a. In FFY 2011, there were two findings issued to two schools, as reported in the FFY 2011 Indicator 11 performance data.
2. Comprehensive On-Site Monitoring
: CNMI conducts comprehensive on-site school monitoring following the school cycle in the CNMI General Supervision Monitoring Procedures:
a. In FFY 2011, there were 32 findings issued to the five schools that were monitored on-site. These findings related to IEP content, reevaluation, prior written notice, and secondary transition.
3. Off-Site Monitoring of Monitoring Priorities: CNMI conducts off-site monitoring of five monitoring
priorities from the special education data system, consistent with the CNMI General Supervision Monitoring Procedures. At the closing of FFY 2011, findings of noncompliance were issued for three of the five monitoring priorities:
a. In FFY 2011, there were 35 findings issued to 11 schools for not reviewing annual IEPs in a timely manner, two findings issued to two schools for not conducting an initial IEP in a timely manner and eight findings issued to four schools related to untimely re-evaluations. The re-evaluation findings were outside the five schools which received an on-site visit.
4. Dispute Resolution System
: As a “system,” CNMI has in place the procedures for receiving and addressing complaints, hearing requests, and mediation requests:
a. In FFY 2011, there was one written complaint filed. As reported in the FFY 2011 IDEA 618 Table 7, no findings of noncompliance were issued based on the results of the investigation conducted for the written complaint filed.
5. Single Audit
: Through contractual services, CNMI conducts annual single audit program reviews of the Special Education Program:
a. The FFY 2011 Audit Report, which ended September 30, 2012, did not include any programmatic findings.
The following breakdown is provided, with an explanation of the verified timely correction of FFY 2011 findings of noncompliance: Correction of FFY 2011 Findings of Noncompliance Timely Corrected (corrected within one year from identification of the noncompliance):
1. Number of findings of noncompliance CNMI made during FFY 2011 (the period from July 1, 2011 through June 30, 2012) (Sum of Column a on the Indicator B15 Worksheet)
79
2. Number of findings CNMI verified as timely corrected (corrected within one year from the date of notification to the school of the finding) (Sum of Column b on the Indicator B15 Worksheet)
79
3. Number of findings not verified as corrected within one year [(1) minus (2)] 0

CNMI April 2014 Resubmission
Part B State Annual Performance Report (APR) for FFY 2012
CNMI Part B APR for FFY 2012 (2012-2013), April 28, 2014 63
Correction of FFY 2011 Findings of Noncompliance Not Timely Corrected (corrected more than one year from identification of the noncompliance):
4. Number of FFY 2011 findings not timely corrected (same as the number from (3) above) 0
5. Number of findings CNMI has verified as corrected beyond the one-year timeline (“subsequent correction”) 0
6. Number of findings not yet verified as corrected [(4) minus (5)] 0
Verification of Correction (either timely or subsequent) Consistent with OSEP Memorandum 09-02, CNMI reports verified timely correction of FFY 2011 findings of noncompliance through: (1) correction of all instances of noncompliance; and (2) verification that for the identified noncompliance, CNMI is correctly implementing the specific regulatory requirements demonstrated through a review of additional data. Explanation of the verified timely correction for the FFY 2011 findings of noncompliance as follows:
In FFY 2011, 11 schools received a Written Notice of Findings for 35 individual instances of noncompliance for not having reviewed or developed the annual IEP in a timely manner and two schools received a Written Notice of Findings for two individual instances of noncompliance for not conducting an initial IEP in a timely manner.
Indicator 5: Thirty-seven (37) Timely Correction of Findings of Noncompliance
Consistent with OSEP Memo 09-02, CNMI verified correction through a review of the individual correction and additional data for the noncompliance findings of timely annual IEPs for the 11 schools and initial IEPs for the two schools. Based on the required child-specific and subsequent IEP file reviews demonstrating 100% compliance for meeting the timeline requirements of the annual IEP review and initial IEP, an individual school Written Notice of Timely Correction was issued to the 13 schools. It should be noted that the individual instances for both the annual IEPs and initial IEPs were completed but were over the timeline requirements. Indicator 11: Two (2) Timely Correction of Findings of Noncompliance In FFY 2011, two schools received a Written Notice of Findings for two individual instances of initial evaluations not completed within the 60-day timeline. Although late, both instances of noncompliance were verified to be completed, as reported in the FFY 2011 APR for Indicator 11. Consistent with OSEP Memo 09-02, CNMI verified correction through a review of the individual correction and additional data for initial evaluations conducted and issued the Written Notice of Timely Correction. As reported in the FFY 2011 APR for Indicator 11, both instances of noncompliance were completed. Verification of correction therefore was a review of additional data demonstrating 100% compliance within the one-year timeframe to ensure that these two schools were implementing the timeline requirement correctly. (refer to Indicator 11 of this APR for further discussion) Indicator 13: Four (4) Timely Correction of Findings of Noncompliance In FFY 2011, 1 junior high school received a Written Notice of Findings for 4 individual instances of noncompliance with the secondary transition requirements in the IEP. The findings were made as a result of the comprehensive on-site school monitoring conducted at this junior high school. Consistent with OSEP Memo 09-02, CNMI verified correction through a review of the individual correction and additional data for the required secondary transition components in the IEP and issued the Written Notice of Timely Correction, based on the required child-specific and subsequent IEP file reviews demonstrating 100% compliance with the required documentation of the IEP secondary transition components.

CNMI April 2014 Resubmission
Part B State Annual Performance Report (APR) for FFY 2012
CNMI Part B APR for FFY 2012 (2012-2013), April 28, 2014 64
Other Areas: Thirty-six (36) Timely Correction of Findings of Noncompliance In FFY 2011, nine schools received a Written Notice of Findings for 36 individual instances of noncompliance for other IDEA related requirement areas: Timely re-evaluations, evidence of prior written notice, and IEP contents. The untimely re-evaluations were identified through the off-site monitoring, while evidence of prior written notice and IEP contents was identified through the on-site monitoring. The specific IEP components were related requirements, such as clear, concise measurable goals, recorded attempts to get parental attendance, evidence of a behavior plan, and documentation of all supplemental services and supports. Consistent with OSEP Memo 09-02, CNMI verified correction through a review of the individual correction and additional data for the specific regulatory requirements and issued Written Notice of Timely Correction based on the required child-specific and subsequent reviews demonstrating 100% compliance with the specific regulatory requirements for each of the nine schools. Discussion of Improvement Activities Completed and Explanation of Slippage, if the State did not meet its target that occurred for FFY 2012 (2012-2013): Performance: 100% (79/79), representing compliance with the Indicator 15 measurement, as in the previous year’s 100% compliance. Target: CNMI met 100% compliance. OSEP FFY 2011 APR Response Table: Compliance Data Summary Notes, July 2013
Required Actions CNMI’s Response When reporting in the FFY 2012 APR on the correction of findings of noncompliance, CNMI must report that it verified for each finding of noncompliance identified in FFY 2011 that: (1) it is correctly implementing the specific regulatory requirements (i.e., achieved 100% compliance) based on a review of updated data such as data subsequently collected through on-site monitoring or the CNMI data system; and (2) it has corrected each individual case of noncompliance, unless the child is no longer within the jurisdiction of CNMI, consistent with OSEP Memo 09-02. CNMI must describe the specific actions that were taken to verify the correction. In addition, in reporting on Indicator 15 in the FFY 2012 APR, CNMI must use and submit the Indicator 15 Worksheet. In addition, in responding to Indicator 11 in the FFY 2012 APR, CNMI must report on correction of the noncompliance described in this table under that indicator.
Refer to the Actual Target Data discussion of this Indicator for a description of the verification of correction of FFY 2011 findings of noncompliance. CNMI used the Indicator 15 worksheet. Refer to the Actual Target Data section of this Indicator. As instructed, further discussion of the verification of correction for noncompliance identified in Indicator 11 is provided under that Indicator.
OSEP Memorandum 14-2, October 2013: OSEP provided additional instructions in an effort to reduce reporting burden. For the FFY 2012 APR, States:
1) Are not required to provide an explanation of: a) progress; b) no change in actual target data from the data for FFY 2011; or c) slippage if the State meets its target.
2) Are not required to discuss improvement activities for: a) compliance indicators where the State reports 100% compliance for FFY 2012; and b) results indicators where the State has met its FFY 2012 target.
For Indicator 15, CNMI met 100% compliance and therefore is not required to provide an explanation of progress or slippage and a discussion on improvement activities.

CNMI April 2014 Resubmission
Part B State Annual Performance Report (APR) for FFY 2012
CNMI Part B APR for FFY 2012 (2012-2013), April 28, 2014 65
Revisions, with Justification, to Proposed Targets / Improvement Activities / Timelines / Resources for FFY 2013: This is a compliance indicator therefore the target of 100% cannot be changed. CNMI did not revise the improvement activities for this indicator. As discussed on page 2 of this APR, the improvement activities are organized by areas of priority needs for improvement and color coded to show the “status” of each improvement activity. Although this FFY 2012 reporting year is the last year of the FFY 2005-2012 SPP, CNMI has updated the status of each improvement activity, including the continuation, if appropriate, of the improvement activity in FFY 2013. The following table displays the “status” of the improvement activity with the color codes:
Completed Rose Continuing Lavender
Revised Light Blue New Light Green
Moved or Deleted Light Yellow
2013-2014 IMPROVEMENT ACTIVITY TABLE Improvement
Category
Improvement Activity
Timeline
Resource
Status Improve Data Collection and
Reporting
Implement the Standard Operating Procedures for monitoring the effectiveness of services through identification and correction of IDEA procedural compliance requirements in a timely manner.
During all monitoring activities or components
through FFY 2013
SpEd Compliance
Monitor
Continuing
Improve Administration and Monitoring
Present monthly compliance reports to Principals during monthly Principals’ Meetings and Contact Teachers at monthly Contact Teachers’ meetings.
Monthly through
FFY 2013
SpEd Compliance
Monitor
Continuing
Meet with the Federal Monitor on an annual basis to discuss the status of compliance of the special education program.
Annually through
FFY 2012
SpEd Coordinator
PSS Federal Program Monitor
Completed
2012-2013
Review and Revise Policies and Procedures
Implement the Focused Monitoring Plan.
Annually through
FFY 2012
SpEd Coordinator Compliance
Monitor Guam
CEDDERS
Continuing

CNMI April 2014 Resubmission
Part B State Annual Performance Report (APR) for FFY 2012
CNMI Part B APR for FFY 2012 (2012-2013), April 28, 2014 66
Overview of the Annual Performance Report Development: Refer to page 1 of this APR for development description.
Monitoring Priority: Effective General Supervision Part B / General Supervision
Indicator 18: Percent of hearing requests that went to resolution sessions that were resolved through resolution session settlement agreements. (20 U.S.C. 1416(a)(3(B))
Measurement: Percent = (3.1(a) divided by 3.1) times 100.
FFY
Measurable and Rigorous Target
2012
(2012-2013)
Targets will be set once baseline data available.
Actual Target Data for FFY 2012 (2012-2013): There were no (0) hearing requests that went to resolution sessions that were resolved through resolution session settlement agreements, as reported in the 618 Table 7 submitted in November 2013. Discussion of Improvement Activities and Explanation of Slippage, if the State did not meet its target, that occurred for FFY 2012 (2012-2013): CNMI will continue collaborative training efforts for parents and other interested individuals with the Protection and Advocacy System, Developmental Disabilities Council, Special Education, and other agencies regarding parent rights and protections. CNMI will continue to monitor procedural safeguards to ensure continued compliance. CNMI will continue to conduct interviews and surveys with parents to verify and validate their understanding of their rights, which is described as an improvement activity under Indicator 8. Revisions, with Justification, to Proposed Targets / Improvement Activities / Timelines / Resources for FFY 2013: Improvement activities specific to this indicator will be established once baseline data is available (10 or more hearing requests that went to hearing resolutions and resolved through resolution sessions).

CNMI April 2014 Resubmission
Part B State Annual Performance Report (APR) for FFY 2012
CNMI Part B APR for FFY 2012 (2012-2013), April 28, 2014 67
Overview of the Annual Performance Report Development: Refer to page 1 of this APR for development description.
Monitoring Priority: Effective General Supervision Part B / General Supervision
Indicator 19: Percent of mediations held that resulted in mediation agreements. (20 U.S.C. 1416(a)(3)(B))
Measurement: Percent = [(2.1(a)(i) + 2.1(b)(i)) divided by 2.1] times 100.
FFY
Measurable and Rigorous Target
2012
(2012-2013)
Targets will be set once baseline data available.
Actual Target Data for FFY 2012 (2012-2013): There were no (0) mediations held that resulted in mediation agreements, as reported in 618 Table 7 submitted in November 2013. Discussion of Improvement Activities and Explanation of Slippage, if the State did not meet its target, that occurred for FFY 2012 (2012-2013): CNMI will continue collaborative training efforts for parents and other interested individuals with the Protection and Advocacy System, Developmental Disabilities Council, Special Education, and other agencies regarding parent rights and protections. CNMI will continue to monitor procedural safeguards to ensure continued compliance. CNMI will continue to conduct interviews and surveys with parents to verify and validate their understanding of their rights, which is described as an improvement activity under Indicator 8. Revisions, with Justification, to Proposed Targets / Improvement Activities / Timelines / Resources for FFY 2013: Improvement activities specific to this indicator will be developed once baseline data is available (10 or more requests for mediation).

CNMI April 2014 Resubmission
Part B State Annual Performance Report (APR) for FFY 2012
CNMI Part B APR for FFY 2012 (2012-2013), April 28, 2014 68
Overview of the Annual Performance Report Development: Refer to page 1 of this APR for development description.
Monitoring Priority: Effective General Supervision Part B / General Supervision
Indicator 20: State reported data (618 and State Performance Plan and Annual Performance Report) are timely and accurate. (20 U.S.C. 1416(a)(3)(B))
Measurement: State reported data, including 618 data, State Performance Plan, and Annual Performance Reports, are: a. Submitted on or before due dates (first Wednesday in February for child count, including race and ethnicity;
and educational environments; first Wednesday in November for exiting, discipline, personnel, and dispute resolution; December 15 for assessment; May 1 for Maintenance of Effort & Coordinated Early Intervening Services; and February 1 for Annual Performance Reports).
b. Accurate, including covering the correct year and following the correct measurement.
FFY
Measurable and Rigorous Target
2012
(2012-2013)
100% State reported data (618 and State Performance Plan and Annual Performance Report) are timely and accurate.
Actual Target Data for FFY 2012 (2012-2013): As indicated in the Overview Section of this APR, CNMI Part B chooses to wait for OSEP’s calculation of CNMI’s compliance with Indicator 20 requirements. As communicated by OSEP during the November 2013 TA call, states/entities will have an opportunity to respond to OSEP’s Indicator 20 calculation during “clarification” period anticipated in April/May 2014.