peconicgreengrowth.orgpeconicgreengrowth.org/docs/orient_project/report/...clustered wastewater...
TRANSCRIPT

LICF COMMUNITY RESPONSE GRANT 2013
Replicable Model of Clustered Wastewater Treatment for
Orient, NY
Peconic Green Growth 651 W. Main Street
Riverhead, NY 11901 631 591 2402
www.peconicgreengrowth.org
December, 2013
Clustered Wastewater Treatment for Orient, NY i-1 Peconic Green Growth, Inc.
LICF COMMUNITY RESPONSE GRANT 2013
Replicable Model of Clustered Wastewater Treatment for Orient, NY
Prepared by
Peconic Green Growth, Inc. 651 W. Main St.
Riverhead, NY 11901 631 591 2402
www.peconicgreengrowth.org and
Sub-consultant
Clark Engineering and Surveying, PC
Funded by
Henry Phillip Kraft Family Memorial Fund at the Long Island Community Foundation
Long Island Sound Futures Fund/NFWF Suffolk County Water Quality Protection and Restoration Program
Patagonia, Inc.
No project can be done in isolation, our thanks to the many who supported this project including:
The Town of Southampton, especially Ross Baldwin, Director of GIS Services, and Supervisor Anna
Throne Holst and Jennifer Garvey for allowing/fostering the support.
Suffolk County: including Dorian Dale, Director of Sustainability, David Calone, Chair, SC Planning
Commission, , Kara Hahn, SC Legislature, Wayne Horsley, SC Legislator, Al Krupski, SC Legislature,
Gwynne Schroeder, Gilbert Anderson, Commissioner of SC Department of Public Works , John
Donovan, Chief Engineer of Sanitation, Walter Dawydiak, Acting Director of Environmental Quality,
Walter Hilbert, Principle Public Health Engineer, Alison Branco, Director Peconic Estuary Program,
Michael Jensen SC Bureau of Marine Resources, Jonathan S. Wanlass SC and Sarah Lansdale, Director
of Planning and Environment, Christine DeSalvo, Frank Costelli and Michael Maraviglia,
NYSDEC: Tom Boekeloo, Lorraine Holdridge, Bill Spitz, Julie Nace, Sarah Deonarine Nancy Pierson
US EPA: Kristina Heinemann, Rob Adler
U.S. Congressman Tim Bishop
NYS Assemblyman Fred W. Thiele, Jr.,
The Orient Association: Venetia Hands, President, Bob Hanlon, Ellen McNeilly, Kathleen Becker,
Catherine Chaudhuri and others. Sandra Sinclair, the Orient Country Store, the East Marion
Association.
The Nature Conservancy including Marci Bortman, Kevin McDonald, Wayne Grothe, Christopher
Clapp, Elizabeth Smith, and Stephen Lloyd,

Clustered Wastewater Treatment for Orient, NY i-2 Peconic Green Growth, Inc.
Town of Southold: Supervisor Scott Russell, the Town of Southold Trustees, in particular John
Bredemeyer, and the town planning and engineering departments.
Town of Riverhead: Sean Walter, Supervisor, Jill Lewis, Deputy Supervisor , Michael Reichel , Sewer
District Superintendent, and planning department.
Others: Sarah J. Meyland, Director of the Center for Water Management Resources, NYIT; Doug
Clark, Erin Moore (Clark Engineering); Natural Systems Utilities including Ed Clerico, Rick Cisterna,
David Smith, and Jens Riedel; Adrienne Esposito, Executive Director, and Tara Bono of Citizens
Campaign for the Environment; Bill Toedter, Director North Fork Environmental Council; Christopher
Gobler, Stony Brook University; Albert Robert Rubin, NCSU; David Berg of Cameron Engineering &
Associates; Edward Sawchuck of Aqua Vectors; William V. DeCandido of In-Pipe Technology; Candace
Balmer of RCAP Solutions; Sarah Cedar Miller, SeaTV, Lynn Dwyer, Assistant Director, NE, NFWF/LISS;
Sol Marie Alfonso-Jones and Nancy Arnold of the LICF; Bob Eichinger; Jay Prager of Maryland
Department of Environment; George Loomis, Director of New England Onsite Wastewater Training;
George Heufelder and Brian Baumgaertel of the Massachusetts Alternative Septic System Test
Center; Amy Macrellis of Stone Environmental, Inc.; Kathryn Macri and Dwight Brown of NYS EFC;
Jonathan Zwarg, RI Department of Environmental Management.
The following sponsors of the Symposium:
Platinum: Bridgehampton National Bank
Clear Flo Technologies, Inc.
Gold: The Nature Conservancy
Roux Associates, Inc.
Silver: David and Kate Calone
Lombardo Associates, Inc.
Sea Tow Services International, Inc.
Bronze: AEC Engineering Design & Construction PLLC
Coastal Pipeline Products Corp.
Excav Services
Jet Inc.
Venues: Suffolk County Community College Culinary Arts and Hospitality Center, Dave Bergen;
Greenport, Riverhead and Mattituck libraries.
AIA Peconic Chapter; Colin Goldberg;, Jason O’Dell; Hideaki Ariizumi of studio a/b architects.
The Board of Peconic Green Growth, Inc. including Drianne Benner, Joan Leavitt, Brian Mealy, Nancy
Messer, and Sherry Thomas. And all the concerned citizens who participated in our events and
survey.
December 30, 2013

Clustered Wastewater Treatment for Orient, NY i-3 Peconic Green Growth, Inc.
CONTENTS
I Background and Summary I-1 II Water Quality II-1 Test Data II-2 III Survey IV Mapping and Data Evaluation IV-1
IV-A Land-based Characteristics Influencing Water Quality IV-1 IV-B Onsite Wastewater Treatment
IV-2
IV-C
Depth to Groundwater (Map 2)
IV-3
IV-D Flooding and Storm Surge (Map 3)
IV-5
IV-E Horizontal Impact from Inundation Due to Climate Change (Maps 4 +5)
IV-6
IV-F SOILS: Drainage Class and Septic Tank Absorption (Maps 6+7 IV-8 IV-G Density IV-9 IV-H Groundwater Influence Zones (Map 9) IV-13 IV-I Priorities (Map 10) IV – 14
IV – J Proposed Districts IV – 14 IV-K Land Use and Clearances IV-14 IV-L Maps IV 15
V Engineering: Orient, New York Decentralized Wasteater Collection & Treatment Feasibility Study Phase 1 Potential Site Identification prepared by Clark Engineering & Surveying, PC
V-1 See separate Table of Contents and page numbering
VI Regulation and Management

Clustered Wastewater Treatment for Orient, NY i-4 Peconic Green Growth, Inc.
Illustrations
Page Table II-1 pH Factor in Orient Harbor II-3 Table II-2 Total Coliform Count, Orient Harbor II-3 Figure II-1 Total Nitrogen, Orient Harbor II-4 Figure II-2 2 Nitrogen Load by Source, The Nature Conservancy (detail) II-4 Figure II-3 Continuous Monitoring of Dissolved Oxygen, pH and Nitrate in Orient Harbor
August, 2012 through October 23, 2013 (USGS and PEP)
II-5
Figure IV-1 Impact on Groundwater of 2’ Rise in Mean Sea Level Rise (SCCWRMP Figure 3.39)
IV-4
Figure IV-2 LI Sound Watershed Orient # of Buildings >450SF by Depth to Groundwater IV-4 Figure IV-3 Peconic Estuary Orient # of Buildings >450SF by Depth to Groundwater IV-4 Table IV-1 # of Buildings >450 SF by Depth to Groundwater Orient IV-4 Table IV-2 # of Buildings (>450 SF) by FLOOD ZONE (FIRM)
ORIENT (North Fork)
IV-5
Table IV-3 Orient # of Buildings >450 SF by SLOSH ZONE IV-5
Figure IV-4 -6 % of Building (>450 SF) in SLOSH Zones by Orient, LI Sound, Orient and Peconic Estuary, Orient
IV-6
Figure IV-7 Horizontal Impacts of Climate Change in Orient
# Bldgs. > 450 within 100' of New High Tide Levels
IV-7
Table IV-4 ORIENT # of Buildings > 450SF Impacted by Sea Level Rise - HORIZONTAL SETBACK
IV-7
Table IV-5 # of Buildings > 450 SF in Orient by Soil Drainage Classification IV-8 Table IV-6 Septic Absorption Rating: # of Buildings > 450 SF in Orient IV-8 Table IV-7 ORIENT Parcel Size: Developed and Vacant IV-9 Figure IV-8 Orient # of Parcels by Size (acres) IV-9 Figure IV-9 Orient # of Parcels by Size (acres by Watershed IV-9 Figure IV-10 Orient % of Total Developed lots by Size (acres) IV-9 Table IV-8 Nonconforming Lots for Groundwater Management Zone IV - Lots less than 20,000
SF
IV-10
Figure IV-11 Detail of Town-wide map identifying parcels noncompliant with 20,000 SF minimum for Groundwater Management Zone IV.
IV-10
Table IV-9 Relative N Contribution Based on Lot Size IV-12 Figure IV-12
Impacts on Nitrogen Loading by Lot Size, Wastewater Treatment, Fertilizer Use, and Stormwater Run-off
IV-12
Figure IV-13 # Buildings >450 SF in Orient by Groundwater Influence Zones IV-13 Table IV-10 # Buildings > 450 SF in Orient by Groundwater Influence Zone
(Time in Years for Groundwater Travel to Reach Surface Waters)
IV-13
Table IV-11 Priority Ranking Point System IV-14

Clustered Wastewater Treatment for Orient, NY i-5 Peconic Green Growth, Inc.
APPENDICES
Appendix A Maps 1-14 Appendix B Mapping + Data Support
B-1 TNC methodology for Coastal Resilience Project 11/09 B-2 SC Summary of SCCWRMP findings B-3 Draft Suffolk County Decentralized Wastewater System Upgrade and
Nitrogen Mitigation Program Criteria & Rating System for Incentives
Appendix C Engineering C-1 Request For Proposals Design for Decentralized Wastewater Treatment
for Orient New York, 4/21/2013
C-2 Engineering Proposal submitted by Clark Engineering & Surveying, Inc., 5/16/2013
Appendix D D-1 SCCWRMP Summary of Key Findings D-2 …and not a drop to drink, February 16, 2013 D-3 Roundtable: Decentralized Wastewater Regulations and Standards, May
22, 2013
D-4 Wastewater in Our Waters: Solutions June 21, 2013 D-4a Symposium Agenda D-4b Flyer published by Suffolk County D-4c Program D-4d Ad content published in two papers with wide distribution
D-5 Marked Copy of Suffolk County Sanitary Code Article ^ D-6 Marked Copy of Guidelines for Approval of Existing Systems

Clustered Wastewater Treatment for Orient, NY I-1 Peconic Green Growth, Inc.
Replicable Model of Clustered Wastewater Treatment for
Orient, NY Clustered Wastewater Treatment for Orient, NY
Prepared by Peconic Green Growth, Inc. 2013 Funded by
Henry Phillip Kraft Family Memorial Fund at the Long Island Community Foundation Long Island Sound Futures Fund/NFWF
Suffolk County Water Quality Protection and Restoration Program Patagonia Inc.
I. BACKGROUND and SUMMARY
A. Goals (long-term): 1. Reduce risk of harmful algal blooms and degraded aquatic environments in the target area of
the Peconic Estuary and/or Long Island Sound Estuary, measured by nitrogen levels, number of bloom events, and health of shellfish and fish populations.
2. Improve and protect quality and quantity of aquifers used for drinking water.
B. Objectives: 1. Establish a model for decentralized clustered wastewater treatment for existing communities.
To date this has only been used for new developments in Suffolk County. 2. Identify governmental, management, maintenance and perceptual challenges to decentralized
clustered solutions. 3. Using existing data, apply a strategy for identifying and prioritizing target projects. 4. Improve awareness of the issue and seek voluntary buy-in to the concept of improved
decentralized wastewater treatment from the general public and the responsible governmental and community organizations.
5. Tasks 1. Surveyed residents on decentralized wastewater 2. Mapped conditions that impact water quality 3. Evaluated data from maps 4. Evaluated management and regulatory issues, particularly at the County level 5. Commenced an engineering evaluation of conditions/options/costs
6. Description Water quality in both aquifers and surface waters is the most critical challenge facing the Eastern End of Long Island, with Orient being a prototypical case. Action is needed to ensure the basic survival of society through the provision of clean drinking water and food. Clean waters are the core attractions supporting an important tourist and second home economy that influences home values and attracts investment in the area. This study focuses on excess nitrogen/nitrate loading, as this is the major cause of low dissolved oxygen in marine waters. This in turn affects aquatic life survival rates and can lead to a degraded marine environment that depletes fish, shellfish and eelgrass beds. Our focus is decentralized wastewater, as it is one of the primary sources of excess nutrient loading to our waters. People and
Clustered Wastewater Treatment for Orient, NY I-2 Peconic Green Growth, Inc.
elected officials are slow to embrace the need for nitrogen mitigation, as traditional costs for wastewater treatment have been minimal, but improvements will trigger inevitable increases in cost that will need to be absorbed by both individuals and governments. Incentives and regulatory tools will be necessary to prompt change. How this important issue is tackled, managed and financed is crucial for a successful paradigm shift. Here Orient, New York in the Town of Southold is used as a prototypical case. Water Quality Water quality in Orient is critically important – for drinking water, farming and for the preservation of waterways and marine habitats. For fresh water needs, Orient relies on a sole-source, isolated groundwater aquifer, which is replenished by rain and wastewater that filters through the ground. Nitrogen is a nutrient of concern. Due to the presence of both active agriculture and historic land development patterns using small lot sizes, nitrogen levels in groundwater are considered high, even exceeding drinking water levels in some locations. The groundwater travels to surface water bodies, where it impacts water quality. 54% of the buildings in Orient lie in the 0 – 2 year Groundwater Influence Zone, while 75% of the buildings are within a five year travel zone. This means that realized projects, especially if collective, will impact water quality quickly. Orient is surrounded by two estuaries of national importance, the Peconic Estuary and the Long Island Sound Estuary, both with nitrogen Total Maximum Daily Load (TMDL) reduction goals. These waters have the highest, SA classification, suitable for full use and harvesting for food. Excess nitrogen compounds in marine waters reduce habitat resilience and feed algal blooms that in turn affect dissolved oxygen and pH levels. The marine environment is over twenty times more sensitive to excess nitrogen loading than the drinking water standard (0.4 mg/L vs. 10 mg/L). Based on loading analyses executed by The Nature Conservancy, onsite wastewater is the major loading factor for Orient Harbor, while agriculture has the larger impact on Hallock Bay. The surrounding waters, while relatively healthy, are stressed during summer and early autumn months, as evidenced by continuous monitoring, which shows fluctuations in dissolved oxygen, nitrates, and pH factors that approach levels of concern. Oyster farmers indicated signs of stress in the 2013 season. After having the shellfish populations decimated twice by brown tides, Orient is the site of major shellfish reseeding efforts for both scallops and oysters by Cornell Cooperative Extension, while commercial oyster farming efforts are in place in Orient Harbor.
The Community Orient was chosen as a model community because community organizations are strong and there is a history of shared concern about water quality. Orient was also chosen because it is a relatively low-income, aging community that requires cost effective solutions to surface water pollution of its long and complex shoreline. This is further stressed by the large discrepancy in the incomes of its residents, as second home owners take residence. Orient includes a National Historic Landmark District with development that dates back to the 17th Century. Due to its historic nature, the majority of homes have cesspools instead of septic systems. This means that in low-lying areas, any improvements will also help address human-based pathogen issues, as well as nitrogen loading. Especially in the historic village and older seaside communities, lots are small and noncompliant, with one-third not meeting Suffolk County Sanitation Code Article 6 density requirements to address dilution of wastewater to drinking water standards. This does not even address the fact that the minimum lot size needs to be doubled to address the prevalent use of individual wells for drinking water.

Clustered Wastewater Treatment for Orient, NY I-3 Peconic Green Growth, Inc.
Survey Peconic Green Growth developed a questionnaire, with input and testing by the OA, to gather information about existing wastewater treatment systems and to assess public opinion and awareness of decentralized wastewater issues. In particular, the survey was designed to assess current knowledge and practices relative to onsite wastewater treatment, receptivity to enhanced treatment, tolerance for increased costs, and details of individual systems to improve knowledge of characteristics influencing the need for enhanced decentralized wastewater treatment. It is probably Orient’s reliance on local groundwater as its sole source for drinking water and the stewardship attitude of its residents (shepherded by the Orient Association) that make Orient the community that is most proactively responsive to the wastewater issue. Of the 573 surveys executed by Peconic Green Growth to date on wastewater, 192 are from Orient. Of the Orient responses, 42.2% were in the Long Island Sound watershed and 40.6% were in the Peconic Estuary. Another 17.1% either did not know which watershed they were in or did not answer the question. In Orient there are 540 developed parcels, with the number of responses representing a return rate of 33.6%for Orient. While the quantity of responses from Orient is strong, the content of the responses is basically in line with the overall feedback. The only strong variables were the percentage of people who relied on individual wells for drinking water rather than public water and roughly one-third have experienced flooding. Key findings are:
1. 92.2% of Orient respondents either knew precisely or approximately where their wastewater
systems are, but 38% were not sure how often their septic tanks should be pumped out.
2. 25% of home owners have never pumped out their onsite wastewater system, with another 26.6% not sure or not answering. Another 25% need to pump out their systems at intervals less than three years. Both extremes point to an issue with onsite wastewater systems.
3. 34.9% of Orient respondents have experienced flooding due to inundation during storm events.
4. While only 47.4% of respondents live in Orient full-time, another 37.5% lived there partially year-round, and only 13.5% seasonally.
5. People were tentatively open to learning about new systems, with most not sure, and interest in single systems very slightly out numbering collective systems. Positive responses outweighed negative opinions. Among those opposed, more were against community systems than single onsite enhancements.
6. Roughly half of the respondents from Orient were willing to incur costs of $500 per year for wastewater upgrades and maintenance. 87% felt that subsidy was appropriate for wastewater treatment.
Mapping and Data Peconic Green Growth, together with the GIS Department of the Town of Southampton created a series
of maps that evaluated conditions likely to be indicators of excess nitrogen loading. These included:
depth to groundwater, flood/SLOSH zones, horizontal impacts of sea level rise, soil type, density, land
use and building clearances. The depth to groundwater, flood, and horizontal impacts are all indicators
of vulnerability to climate change. Orient is vulnerable, with 36.2% of the buildings greater than 450 SF

Clustered Wastewater Treatment for Orient, NY I-4 Peconic Green Growth, Inc.
having shallow depths to groundwater. The associated wastewater systems will all eventually fail due to
inadequate depth to groundwater.
- 45.1% of the buildings greater than 450 SF are in a SLOSH Zone, while
- 69% of the buildings in the Peconic Estuary are in SLOSH Zones
- Between 1 and 213 buildings and their systems are expected to have inadequate horizontal
distances to surface water due to climate change.
Other characteristics:
- Orient has good soils for groundwater treatment of wastewater, with 90.2% being well-drained.
- One-third of all lots in Orient are smaller than the 20,000 SF required for Groundwater
Management Zone IV for onsite wastewater treatment, with 43.7% of the lots in the Peconic
Estuary being noncompliant. SC Sanitation Code Article 6 for new development requires this be
increased to 40,000 SF where public water is unavailable, as is the case here.
- 69.8% of the lots in Orient are less than one acre in size. 9.4% are less than one-quarter acre.
- Priorities were mapped, with the historic village and surrounding area being the highest.
Regulations and Management PGG drafted recommended changes to Suffolk County Sanitary Code - Article 6 and other guidance documents that would allow community wastewater treatment in existing neighborhoods and foster shared facilities. PGG developed a list of 17 action items (Appendix XX) and solicited feedback at both the May Regulators meeting and the June Symposium. A cesspool prohibition and phase-out program, incentive programs for enhancements, a fast, easier process for the approval of enhanced systems, and the need for an onsite wastewater inspection program were top choices. Currently the County grandfathers cesspools. Cesspools are also allowed to be replaced in-kind if they fail, even though they do not meet current code. PGG sees the elimination of this protection as being an important first step in leveraging action and private funds for enhanced wastewater treatment. At the same time, an approach to nitrogen mitigation and the identification of areas where community systems are viable and preferred need to be supported in a coordinated fashion. If addressed comprehensively and applied using prioritization, enhanced treatment could be introduced in a cost effective manner where the maximum environmental benefit is achieved. While management seems daunting, web-based programs make oversight of massive numbers of installations both cost effective and efficient. Currently, each sewer district is tied to physical infrastructure and requires each grouping to go through a district formation process. We propose that this approach be reevaluated. While the design of projects would still follow the existing approval process, the district could be the largest attainable by public will, with a varied fee structure based on the level of treatment/service obtained. A low fee applied throughout the district would help fund studies and subsidize improvements, with additional costs based on the level of service received. The district could be the whole county, an estuary watershed, which may require the coordination of multiple towns, a town-wide district – a concept which might be compatible with home rule and varied densities, or the hamlet level, which tends to define local identities. With any of these approaches, a data collection and inspection program would be needed, with a shared management system accessible to both local and county governments.

Clustered Wastewater Treatment for Orient, NY I-5 Peconic Green Growth, Inc.
Engineering A community will not voluntarily commit to an unknown system that impacts both the community and themselves personally. In order to understand the options, costs, nuisances (avoidance), and aesthetics of solution options, an engineering report is needed. PGG has retained Clark Engineering and Surveying, PC to work on this endeavor. Currently, the engineers have absorbed planning data and evaluated locations likely to be acceptable for collected wastewater treatment (Appendix C-1). One issue that is surfacing is that most of the suitable parcels are one of the following: open space set aside as part of a conservation subdivision, properties where development rights have been sold, parkland, farmland, or property in the public realm but dedicated for specific uses, such as a school or firehouse. More funding is needed to pursue a full engineering report. On December 12, 2013, the Suffolk County WQPRP Review Committee recommended funding fifty percent of the remaining tasks of the initial engineering report. Match will still be necessary, but we can expect to continue the report in the late Spring of 2014. This report is focused on community systems for a number of reasons:
1. Suffolk County has just expanded the number of systems it will allow for intermediate-sized wastewater treatment. Even though the current application addresses new development, there is management oversight in place to handle community systems.
2. Community systems can treat wastewater to a higher level than most onsite enhanced systems. 3. The system can be easily expanded. 4. Installations are less intrusive than central sewage treatment plants. 5. Treatment can be relocated to less vulnerable sites. 6. A concentrated application will have more environmental benefit than scattered improvements. 7. Changes to the treatment can be made more easily and cost effectively as technology improves.
The disadvantages are finding a location for treatment, the effort for district formation, and the level of oversight that may be required. People are afraid that any collective system may have a negative impact on nearby property values, as well as increase maintenance and carrying costs. The impact of any realized project is measurable. PGG is proposing seven districts within Orient for evaluation. There is the potential to impact 572 dwelling units and provide nitrogen mitigation of between 50 and 90% depending upon applicable solutions. Assuming an average of 26.82 #N/Yr/Household, x 572 households x 50% or 75% (conservative nitrogen mitigation) x 75% (to account for vacancy rates for part time use), this represents a potential nitrogen reduction of 5,753 to 8,629 pounds of nitrogen per year. Ideally a decentralized wastewater approach to treatment does not advocate one method of treatment, but applies varied solutions, whether single onsite or clustered, that are suitable for the conditions, the community, and the environmental need. A decentralized approach only addresses existing need, so payment for excess capacity does not occur. The system can be easily expanded when needed. Water is recharged locally, creating better watershed hydrological balance. Our work is not done. Peconic Green Growth will seek funding to continue its public outreach, incorporate a learning module for the local elementary school (one of the viable sites), finish the engineering report, and work with both town and county regulators to identify an acceptable process for developing and managing decentralized community systems and enhanced wastewater treatment for decentralized systems in existing communities.

Clustered Wastewater Treatment for Orient, NY II-1 Peconic Green Growth, Inc.
II. Water Quality
Clean water resources are especially important for Orient with its water-dependent economy founded in maritime, agricultural and tourist/second home industries. Orient is surrounded by two estuaries of national importance, the Peconic Estuary and the Long Island Sound Estuary, both of which are categorized as SA water bodies, which are important for shellfish/fish propagation and harvesting for food, as well as primary contact and recreation. This study focuses on nitrogen mitigation, as excess loading is recognized as a critical cause of algal blooms, which in turn impact dissolved oxygen levels – the key issue for marine life survival. The blooms also affect pH factors, with the resulting acidification of marine waters impacting shellfish formation and size (Gobler). Excess nitrogen can also affect growth and root structure balance for wetland grasses, causing vulnerability during storms. This weakness degrades habitats and the natural buffering and purification wetland vegetation normally provides. With respect to nitrogen, an acceptable, but high, level for drinking water is considered 4-6 mg/l, with 10mg/l being the Maximum Contaminant Level (MCL). Orient tends to have high nitrogen levels in groundwater, with a public well consistently surpassing the MCL for drinking water standards. We now know that a standard based on drinking water quality is not nearly good enough for surface waters. In contrast, the acceptable level to maintain marine health is a range of 0.3 – 0.5 mg/l. 9 That is a significant gap that must be closed.
Based on NYSDEC 2011 Atlantic Ocean/Long Island Sound Waterbody Inventory/Priority Waterbodies List, Vol 2, Figure 2, generally the waters around Orient are considered to experience minor impacts to surface water quality. Since the mid 1980’s, the Peconic Estuary has experienced algal blooms. Brown
tides caused by Aureococcus anophagefferens basically destroyed the shellfish industry. Just when shellfish populations were starting to be reestablished, they were depleted again by another brown tide in 1995. Orient is currently the site of major shellfish reseeding efforts for both scallops and oysters by Cornell Cooperative Extension, while commercial oyster farming efforts are in place in Orient Harbor. Currently there are three areas that experience shellfish closures, two seasonal and one permanent. Two list pathogens as the cause of the closure. Orient Harbor and LI Sound list Organics as the primary pollutant cause. Other sources, urban and storm runoff are officially listed as sources, which includes onsite wastewater treatment. While marine water quality near Orient is relatively healthy, it does show signs of stress in summer and early autumn months. This is given credence by the monitoring station, which shows fluctuations in dissolved oxygen, nitrates, and pH factors that approach levels of concern. Oyster farmers indicated signs of stress in the 2013 shellfish season and were concerned about survival rates. Other environmental indicators of stress are the disappearance of the eelgrass beds and the growing presence of macroalgae. The disappearance of beneficial eelgrass is one of the early warnings of marine degradation. In the Peconic Estuary, where eelgrass was once prevalent throughout, eelgrass basically is found only east of Shelter Island, with reductions of over 80% in 2000, with Orient being on the boundary (experiencing loss in the bays). In 1930 the Peconic Estuary contained approximately 8,720 acres of eelgrass.1 It is being replaced with macroalgae, which further degrade habitats by blocking sunlight to the sea beds. Green Fleece (Codium), an invasive macroalgae, has been documented in both Orient Harbor and Hallock Bay. A study of the nitrogen isotopes in what eelgrass remains, executed by The Nature Conservancy, indicates that human-sourced nitrogen is prevalent in the area.
Both estuaries have nitrogen Total Maximum Daily Load (TMDL) targets for mitigation that will benefit
from this project. The TMDL for the LI Sound is 58.8% overall, and 19% for nonpoint sources in Suffolk

Clustered Wastewater Treatment for Orient, NY II-2 Peconic Green Growth, Inc.
County. The Peconic Estuary has a TMDL of 25% for existing development not adjacent to impaired
waters for the Peconic Estuary, which would apply here.
This proposal is in line with the Peconic Estuary Comprehensive Concervation Management Plan
(PECCMP), Chapter 3 Nutrients Management Plan, as it supports Objective 4:Water quality preservation
in eastern waters (P 3-1), and contributes to ensuring that total nitrogen and dissolved oxygen levels are
maintained or improved (0.4mg/L target). By mitigating impacts of continued growth (P3-2) and lowering
the nonpoint groundwater nutrient loading of the eastern section, which represents 18% of the eastern
total load2, any realized outcomes from this report will “implement nonpoint source control plans” (N5)
and support equally preservation and mitigation efforts.(N7) P 3-20 The engineering report will investigate
the feasibly of implementation mechanisms to decrease nitrogen in groundwater underflow due to
onsite disposal systems, which is a priority strategy in the plan (N-5.3, Table 3 3 P3-30). Depending upon
receptivity of land owners, there might be opportunity to also incorporatethe priority strategy to reduce
agricultural nitrogen loading (N-5.4) through reuse of treated effluent.
This project also addresses the TMDL attributable to nonpoint sources in the LI Sound Study. While the
TMDL lists a 10% goal, a subsequent study increases this to 19% in Suffolk County due to the prevalence
of onsite wastewater treatment systems.3 Orient lies in Zone 11 -East, which has a contribution
efficiency factor of 55%. In terms of an efficiency ranking for nitrogen mitigation, it is 9th out of 23
listings. 4
Test data
The Suffolk County Office of Ecology, Bureau of Marine Resources has two Peconic Estuary Marine and
Estuarine Sampling stations, Orient Harbor (# 060115) and Hallock Bay or Long Beach Bay (#060330).
The data set for years 1976 through 2012 were analyzed. Only 2 of the 1141 data sets were below the
4.8 mg/L of dissolved oxygen, the level indicative of a need for management for hypoxia, with a range of
4.6 to 15.8 mg/L, an average of 8.62 mg/L and a mean of 8.3 mg/L. Occurrences during the summer
months, sometimes extending to September were the times of lowest dissolved oxygen.
pH factors were measured starting in 2010. Among 50 samples the range was from to 7.2 to 8.2 with an
average of 7.8. Just over a three-year period, the pH levels are dropping as seen in the chart below. Data
samples that were duplicative were reduced to 36 distinct events for the chart.

Clustered Wastewater Treatment for Orient, NY II-3 Peconic Green Growth, Inc.
Table II-1 pH Factor in Orient Harbor
Of the 693 records of Total Coliform, seven events exceeded Maximum Levels indicative of stressed or
impaired waters, with some events over 1600. Extremely high peaks occurred on 7/21/1989, 8/6/1997,
and 11/16/2010.
T Coliform count MPN/100ml
Date of high Date of previous count
Comments
>1600 7/21/1989 7/18/1989
80 4/24/1991 4/16/1991
50 7/27/1995 7/18/1995
90 1/30/1996 1/23/1996
>1600 8/6/1997 7/29/1997
50 8/18/1998 8/13/1998
>1600 11/16/2010 9/29/2010 Note: more research is needed to see if weather events, especially flooding occurred within the relevant time frames. If
so, the prevalence of cesspools in shallow locations may be a significant factor to the spikes.
Table II-2 Total Coliform Count, Orient Harbor
6.66.87.07.27.47.67.88.08.28.4
1/2
7/2
01
0
3/2
7/2
01
0
5/2
7/2
01
0
7/2
7/2
01
0
9/2
7/2
01
0
11
/27
/20
10
1/2
7/2
01
1
3/2
7/2
01
1
5/2
7/2
01
1
7/2
7/2
01
1
9/2
7/2
01
1
11
/27
/20
11
1/2
7/2
01
2
3/2
7/2
01
2
5/2
7/2
01
2
7/2
7/2
01
2
9/2
7/2
01
2
11
/27
/20
12
pH Factor Orient Harbor
Series1

Clustered Wastewater Treatment for Orient, NY II-4 Peconic Green Growth, Inc.
Figure II-1 Total Nitrogen, Orient Harbor
Of 174 records of T Nitrogen, only 3 equaled or exceeded 0.45, with another 17 in the 0.30’s, which is
considered a potentially stressed state. Sources of the excess nitrogen loading are from both onsite
wastewater systems and farming, being roughly equal in estimated input. Recent evaluations by The
Nature Conservancy show that in the Village the dominant contribution to Orient Harbor is from onsite
systems, and to Hallock Bay, agriculture.
Figure II-2 Nitrogen Load by Source, The Nature Conservancy (detail)
Orient Harbor is also one of the two sites where the USGS established continuous monitoring stations in
2012. This gives a good overall picture of changes to water quality as well as provides a data baseline
from which to measure impacts of any future mitigation efforts. The chart shows data from the testing
site installation from August, 2012 through October 23, 2013. This fifteen month snapshot shows how
fragile the health of this water body is. During summer/early autumn Orient Harbor dissolved oxygen
0.00
0.20
0.40
0.60
0.80
1.00
1.20
1.40
TN m
g/l
TOTAL NITROGEN, ORIENT HARBOR

Clustered Wastewater Treatment for Orient, NY II-5 Peconic Green Growth, Inc.
levels approach hypoxic states. Spikes in nitrogen loading also occurred. Anecdotally, a town trustee
informed me that the commercial oyster farm owners were concerned, as their oysters were very
stressed due to the low dissolved oxygen state experiences this summer.
Figure II-3 Continuous Monitoring of Dissolved Oxygen, pH and Nitrate in Orient Harbor
August, 2012 through October 23, 2013 (USGS and PEP)5
DRINKING WATER
Of 33 SCDHS records that showed readings for nitrates at two public wells in Orient taken between 2001 and 2013, the level of nitrates varied from 7.4 to 15.4 mg/L. Only four of the samples are lower than 10 mg/L, the maximum contaminant level for drinking water. The average was 11.5 mg/L. This represents a high level of nitrates in groundwater. The presence of extensive farmland and clusters of small, developed lots are the likely causes of the excess loading. These results indicate a critical need to protect drinking water quality in the aquifers.

Clustered Wastewater Treatment for Orient, NY III-1 Peconic Green Growth, Inc.
III. Survey
Peconic Green Growth developed a questionnaire, with input and testing by the Orient Association, to
gather information about existing wastewater treatment systems and to assess public opinion and
awareness of decentralized wastewater issues. In particular, the survey was designed to assess current
knowledge and practices relative to onsite wastewater treatment, receptivity to enhanced treatment,
tolerance for increased costs, and details of individual systems to improve knowledge of characteristics
influencing the need for enhanced decentralized wastewater treatment. While the survey was designed
for use throughout the East End, with an emphasis on 17 hamlets in the towns of Southold and
Riverhead in 2013, as of December 9, 2013 33.5% of the respondents were from Orient (192 out of 573).
Methods of outreach requesting people to take the survey included email requests through the Orient
Association and Orient Community Activities email lists, links on both the Peconic Green Growth and
Orient Association websites, hard copies available in the Country Store, distribution at meetings and
forums, contact through housing associations, solicitation in front of the post office one Saturday, and
personal contact by volunteers, including door-to-door outreach.
Of the Orient responses, 42.2% were in the Long Island Sound watershed and 40.6% were in the Peconic
Estuary. Another 17.1% either did not know which watershed they were in or did not answer the
question. In Orient there are 540 developed parcels, with the number of responses representing a
return rate of 33.6% for Orient. While participation in Orient was the highest of all other hamlets in
Southold and Riverhead, mostly due to the efforts of the OA and committed volunteers, the answers
were in line with the overall respondents. The only strong variable was the percentage of people who
relied on individual wells for drinking water rather than public water and the high percentage of owners
who had experienced flooding from storm events. Such a large response rate is extraordinary for any
survey, and appears to reflect the extremely strong interest of the community in this issue. The
immediacy of the impacts of water quality on personal welfare, as well as environmental benefits,
probably had an impact on the participation rate.
WATERSHED Orient All
Responses
LI Sound 81 42.2% 244 42.6%
Peconic 78 40.6% 199 34.7%
South Shore
11 1.9%
Don't know 26 13.5% 57 9.9%
Unanswered 7 3.6% 62 10.8%
192 100.0% 573 100.0%

Clustered Wastewater Treatment for Orient, NY III-2 Peconic Green Growth, Inc.
Survey breakdown by question
Total Survey Responses: 591 Responses as of December 9, 2013, with a further reduction by 18 due to
duplicate records, all of which were from Orient. A few of the hard copy submittals missed questions on
the second page (beginning with question 12).
1 When was your house built?
Orient
All Responses
Before 1946 77 40.1% 40.1% 172 30.0% 30.0%
1947-72 36 18.8% 58.9% 158 27.6% 57.6%
1973-2002 58 30.2% 89.1% 166 29.0% 86.6%
2003+ 18 9.4% 98.4% 66 11.5% 98.1%
Not sure 1 0.5% 99.0% 3 0.5% 98.6%
No answer 2 1.0% 100.0% 8 1.4% 100.0%
192
573
Buildings older than 1946 represent 40.1% of the homes in Orient, with another 18.8% being built
between 1947-72. Any building built before 1973 with no substantial additions is likely to have a
cesspool. The percentage of homes older than 1973 in Orient (58.9%) is unexpectedly comparable to
the overall response of 57.6%. Since the areas targeted for community systems are in older
neighborhoods, this percentage is expected to be higher for the project scope.
2 Which kind of wastewater system do you have?
Orient Total
Cesspool 77 40.1% 251 43.8%
Septic + leaching pits 47 24.5% 151 26.4%
Septic + field 23 12.0% 61 10.6%
Community 0 0.0% 7 1.2%
Central Sewer 0 0.0% 11 1.9%
Don't know 31 16.1% 67 11.7%
No answer 14 7.3% 25 4.4%
192 573
40%
19%
30%
9%
1% 1%
Orient Building Age
Before 1946
1947-72
1973-2002
2003+
Not sure
Unanswered
30%
28%
29%
11%
1% 1%
Building Age- All Survey Responses
Before 1946
1947-72
1973-2002
2003+
Not sure
Unanswered

Clustered Wastewater Treatment for Orient, NY III-3 Peconic Green Growth, Inc.
If one combines the percentage of people who have cesspools with those who don’t know, the total is
56.2%, which is just under the 58.9% of Orient homes older than 1973. The cesspools will be priority
systems for upgrade, especially if in vulnerable areas, such as flood zones or in areas with shallow depth
to groundwater.
3 How many leaching pits does your system have?
Orient
All Responses
1 10
39
2 15
42
3 4
20
More 5
14 Don't know/Not sure 21 41
55
156 No answer (total) 137
417
No answer (septic pit) -8
-5 % of systems with more than 1 pit 43.6%
48.7%
Online, this question was only triggered when a septic system with leaching pits was selected for
question #2. Since the number of responses was more than the number of people indicating they had
septic/leaching systems, some people using the hard copy but who had multiple cesspools probably
answered this question as well. This question indicates where depth to groundwater is an issue for
septic systems. If a system has more than one leaching pit, the design was most likely adjusted to allow
the installation of shallower, more numerous leaching pits to accommodate wastewater recharge
effectively. These systems will be expected to fail when groundwater levels rise due to climate change.
For Orient 43.6% of the 55 responses had multiple rings, indicating that SCDHS requirements for
alternative designs were triggered by shallow depths to groundwater.
4 Do you know where on your lot your wastewater system is?
Orient
All Responses
Yes, precisely 123 64.1%
379 66.1%
Yes, approximately 54 28.1%
123 21.5%
No, not sure 7 3.6%
32 5.6%
No answer 8 4.2% 39 6.8%
192
573
A high percentage of people were knowledgeable about the location of their systems. 92.2% of Orient
respondents knew either precisely or approximately where their systems were located. Since most of
the individual systems have buried hatches, this percentage is encouraging.

Clustered Wastewater Treatment for Orient, NY III-4 Peconic Green Growth, Inc.
5 When was your septic tank last pumped out?
Orient All Responses
<3 48 25.0% 145 25.3%
3-5 19 9.9% 59 10.3%
5-10 12 6.3% 51 8.9%
>10 13 6.8% 46 8.0%
Never 49 25.5% 131 22.9%
Not sure 33 17.2% 81 14.1%
No answer 18 9.4% 60 10.5%
192
573
Most people either have their systems pumped frequently, which indicates an issue, or never. Since
most people only pump when their systems exhibit signs of failure, the systems that are pumped
frequently probably have issues that will impact water quality. Seasonal overloading in tourist areas also
can stress onsite wastewater treatment systems, requiring additional pumping. When people never
pump, it is probably due to small households, partial use, or possibly cesspools in porous soils. The latter
condition may cause environmental harm without system function failure evident.
6 How often do you need to have your cesspool or septic tank pumped out?
Orient
All Responses
<3 12 6.3% 34 5.9%
3-5 22 11.5% 73 12.7%
5-10 30 15.6% 83 14.5%
>10 46 24.0% 118 20.6%
Not sure 73 38.0% 206 36.0%
n/a sewer 1 0.5% 9 1.6%
No answer 8 4.2% 50 8.7%
192
573
Thirty-eight percent of Orient respondents are not sure when their wastewater system should be
pumped out. Other responses are probably based on experience and the number of responses tend to
increase as the period is lengthened. Optimal periods between system pump-outs vary according to size,
usage (number of people per household), and the use/flushing of chemicals harmful to the natural
microorganisms processing the waste.
0102030405060
Orient: Last time system was pumped out
01020304050607080
Orient: Service Intervals

Clustered Wastewater Treatment for Orient, NY III-5 Peconic Green Growth, Inc.
7 Do you ever experience flooding on your site or in your basement?
Orient
All Responses
Yes 25 13.0% 50 8.7%
only major storms 37 19.3% 78 13.6%
first time Sandy 5 2.6% 13 2.3%
No 123 64.1% 404 70.5%
No Answer 2 1.0% 28 4.9%
192
573
% homes that have experienced flooding 34.9%
24.6%
Orient exhibited a high percentage (34.9%) of homes that have experienced flooding from inundation
during storm events, compared to the overall response of 24.6%. Orient is very susceptible to impacts of
climate change, with systems likely to experience temporary failure due in weather events. Pollution
from temporary events can have a severe, even lasting impact on marine ecosystems.
8 How many bedrooms does your dwelling have?
Orient All Responses
1 2 1.0%
10 1.7%
2 26 13.5%
82 14.3%
3 86 44.8%
273 47.6%
4 55 28.6%
140 24.4%
5 12 6.3%
26 4.5%
More 8 4.2%
17 3.0%
No answer 3 1.6% 25 4.4%
192
573
The number of bedrooms influence the size of the system needed to properly treat wastewater. 44.8%
of the homes have three bedrooms and 28.6% have four bedrooms. Homes in Orient are slightly larger
than the overall average.
0102030405060708090
100
Orient # of Bedrooms per Dwelling
Clustered Wastewater Treatment for Orient, NY III-6 Peconic Green Growth, Inc.
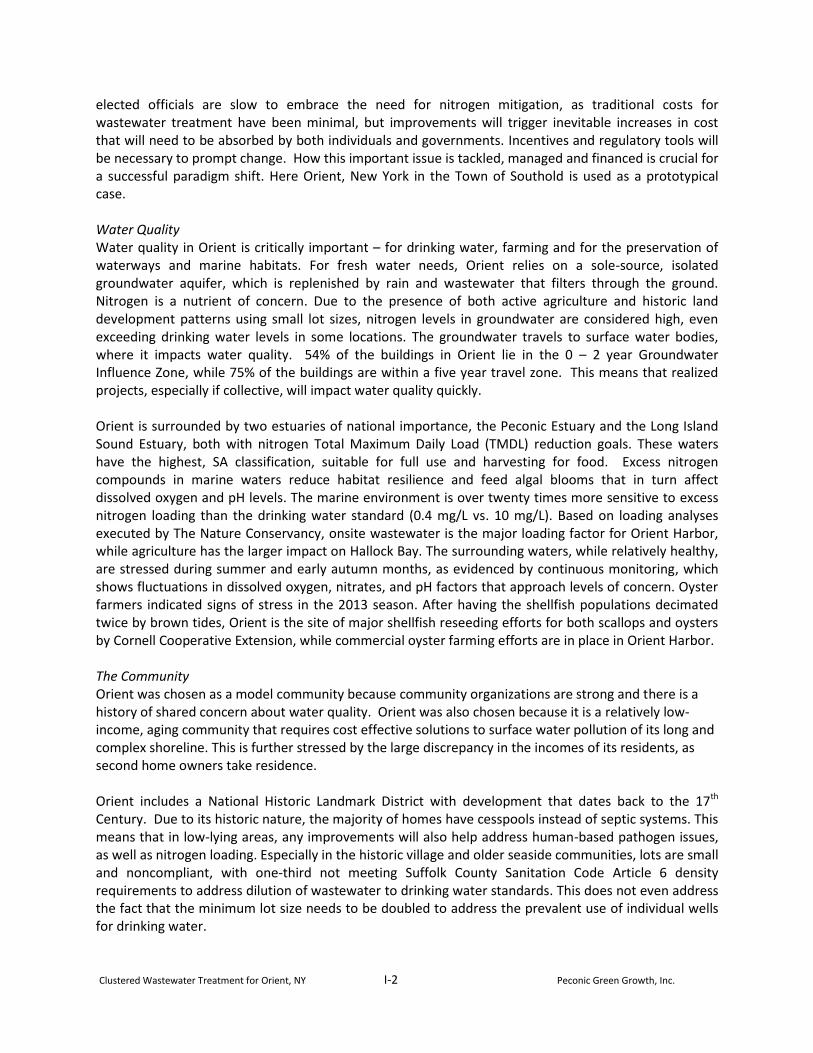
9 To what extent is your home being used?
Orient
All Responses
Full-time 91 47.4% 331 57.8%
Partially, year-round 72 37.5% 140 24.4%
Seasonally 26 13.5% 74 12.9%
No answer 3 1.6% 28 4.9%
192
573
Orient does have a high percentage of homes being used partially at 37.5%, representing a robust
second home market. Use is still predominantly year-round rather than seasonal, supplemented by a
strong tourist season. These numbers indicate a fluctuation in use that will impact treatment choices.
10 Looking ahead, if you needed to change your wastewater treatment system, which of the following would you consider? (you may pick more than 1)
Orient All Responses
Single onsite system (septic) 48 112
Single onsite enhanced 45 122
Community (decentralized) 39 117
Central sewer 30 125
Not sure 81 222
Respondents are tentative about options, with more people (42.2%) being not sure about what they
would prefer for wastewater treatment. The next choice is building to current code, using onsite septic
systems.
0102030405060708090
Orient Consideration of System Types
0
50
100
150
200
250
All Responses Consideration of System Types

Clustered Wastewater Treatment for Orient, NY III-7 Peconic Green Growth, Inc.
11 How interested would you be in learning more about advanced wastewater treatment for individual homes? (These reduce the level of contaminants leaving the system)
Orient All Responses
Extremely 37 95
Very 52 159
Possibly 67 184
Not very 7 34
Not at all 3 18
No answer 26 83
192 573
12 How interested would you be in learning more about
decentralized community wastewater systems? (These
are shared by a group of houses and treat effluent to a
higher water quality.)
Orient All Responses
Extremely 34 88
Very 53 136
Possibly 63 197
Not very 18 50
Not at all 15 38
No answer 9 64
192 573
People on the whole are cautiously interested in learning more about enhanced onsite treatment
systems for individual homes or community systems. Positive interest outweighs negativity, with many
people remaining open to the options, but without embracing them. The major difference is that those
opposed are more strongly opposed to community systems versus single onsite enhancements.
0
10
20
30
40
50
60
70
80
Extremely Very Possibly Not very Not at all Noanswer
Orient Interest in Enhanced Treatment for
Single or Community Systems
Single
Community
Clustered Wastewater Treatment for Orient, NY III-8 Peconic Green Growth, Inc.
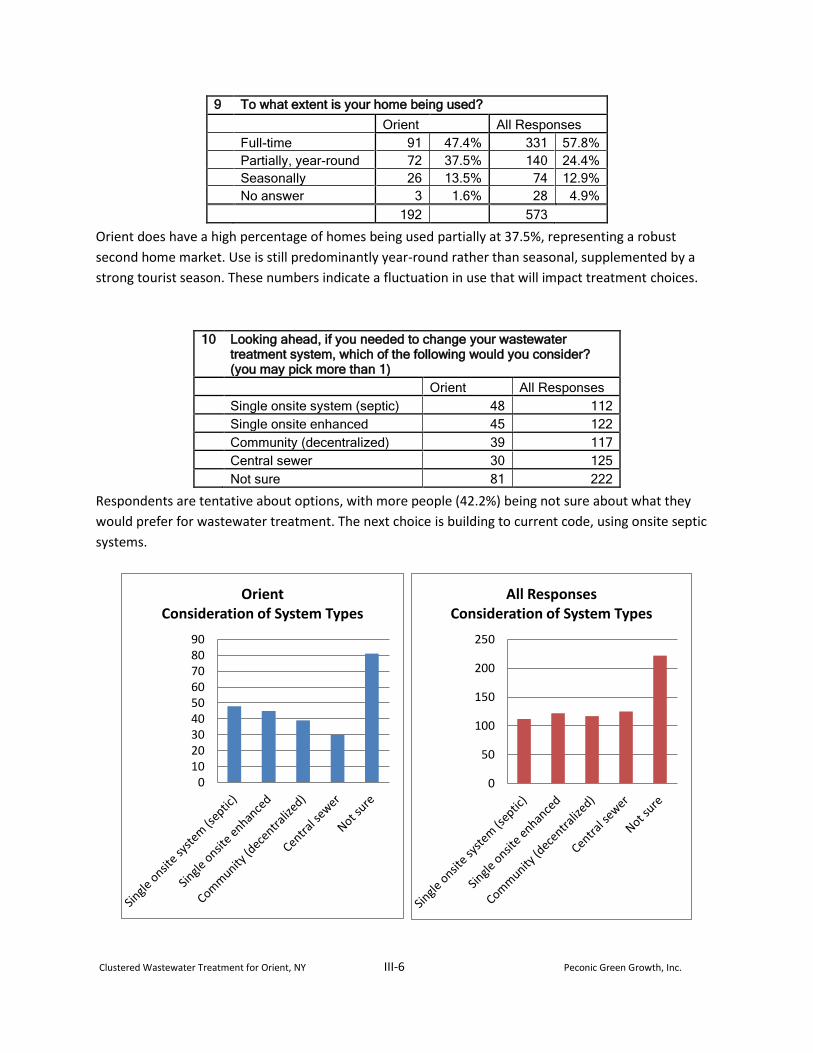
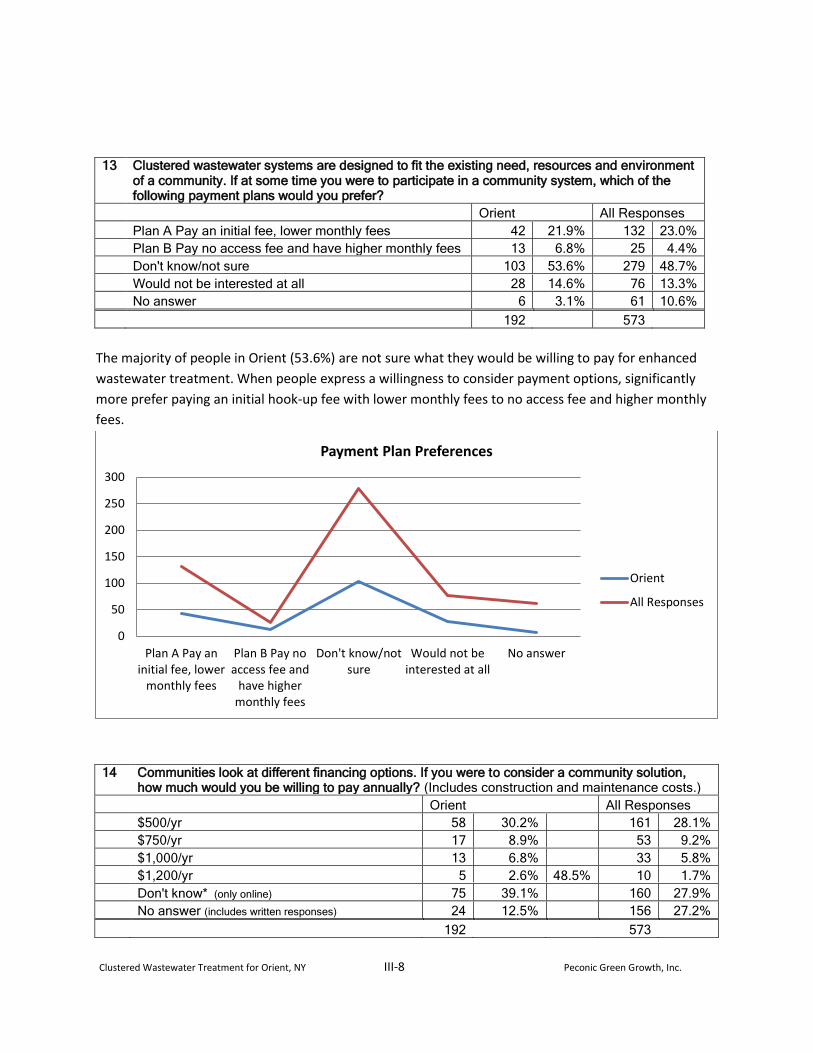
13 Clustered wastewater systems are designed to fit the existing need, resources and environment of a community. If at some time you were to participate in a community system, which of the following payment plans would you prefer?
Orient All Responses
Plan A Pay an initial fee, lower monthly fees 42 21.9% 132 23.0%
Plan B Pay no access fee and have higher monthly fees 13 6.8% 25 4.4%
Don't know/not sure 103 53.6% 279 48.7%
Would not be interested at all 28 14.6% 76 13.3%
No answer 6 3.1% 61 10.6%
192
573
The majority of people in Orient (53.6%) are not sure what they would be willing to pay for enhanced
wastewater treatment. When people express a willingness to consider payment options, significantly
more prefer paying an initial hook-up fee with lower monthly fees to no access fee and higher monthly
fees.
14 Communities look at different financing options. If you were to consider a community solution, how much would you be willing to pay annually? (Includes construction and maintenance costs.)
Orient All Responses
$500/yr 58 30.2%
161 28.1%
$750/yr 17 8.9%
53 9.2%
$1,000/yr 13 6.8%
33 5.8%
$1,200/yr 5 2.6% 48.5% 10 1.7%
Don't know* (only online) 75 39.1%
160 27.9%
No answer (includes written responses) 24 12.5% 156 27.2%
192
573
0
50
100
150
200
250
300
Plan A Pay aninitial fee, lower
monthly fees
Plan B Pay noaccess fee and
have highermonthly fees
Don't know/notsure
Would not beinterested at all
No answer
Payment Plan Preferences
Orient
All Responses

Clustered Wastewater Treatment for Orient, NY III-9 Peconic Green Growth, Inc.
Roughly half of Orient respondents are willing to pay for enhanced wastewater treatment, with 48.5%
willing to pay at least $500 annually. 39.1% are not sure. Those who wrote in an amount tended to
either say none or indicated a lower amount ranging from $100 to $300. A few indicate a need for more
information. Orient respondents are slightly more willing to pay for treatment, representing 3.7% more
than the overall response rate.
15 How do you think a community system should be funded (You may answer more than one.)
Orient
All Responses
Solely by individual participants 27 13.0% 88 26.7% 57 9.8% 192 22.5%
Supplemented by larger community that will benefit 46 22.2% 107 32.5% 146 25.1% 281 33.0%
Subsidized by County, State, or Federal Funds 73 35.3% 134 40.7% 244 41.9% 379 44.5%
All 61 29.5% 135 23.2%
207
329
582
852
People in Orient feel that wastewater treatment is a service that should be subsidized, preferably by
county, state or federal funds. Subsidy by the larger community that will benefit from regionally
improved water quality is also considered viable. Only 13% of Orient respondents feel that individuals
should bear all costs. The overall responses weigh subsidies slightly higher. Respondents were allowed
to choose more than one subsidy option.
30%
9%
7%
3%
39%
12%
Orient: Annual Cost Considerations
$500/yr
$750/yr
$1,000/yr
$1,200/yr
Don't know*(only online)
13%
22%
35%
30%
Orient Opinion on Subsidy Options
Soley byindividualparticipants
Supplementedby largercommunitythat willbenefit
Subsidized byCounty, State,or FederalFunds
All

Clustered Wastewater Treatment for Orient, NY III-10 Peconic Green Growth, Inc.
16 What is the primary source of water in your home? Orient All Responses
Individual well 170 88.5% 279 48.7%
Shared private well 2 1.0% 2 0.3%
Public water/SCWA 13 6.8% 231 40.3%
Not sure 1 0.5% 2 0.3%
No answer 6 3.1% 59 10.3%
192
573
Orient has a much higher percentage of people relying on individual wells for drinking water, with 88.5%
versus 48.7% overall. Even when using shared or public water, the source is still from the local aquifer in
Orient.
0.0%10.0%20.0%30.0%40.0%50.0%60.0%70.0%80.0%90.0%
100.0%
Primary Source of Drinking Water
Orient
All Responses
Clustered Wastewater Treatment for Orient, NY IV-1 Peconic Green Growth, Inc.
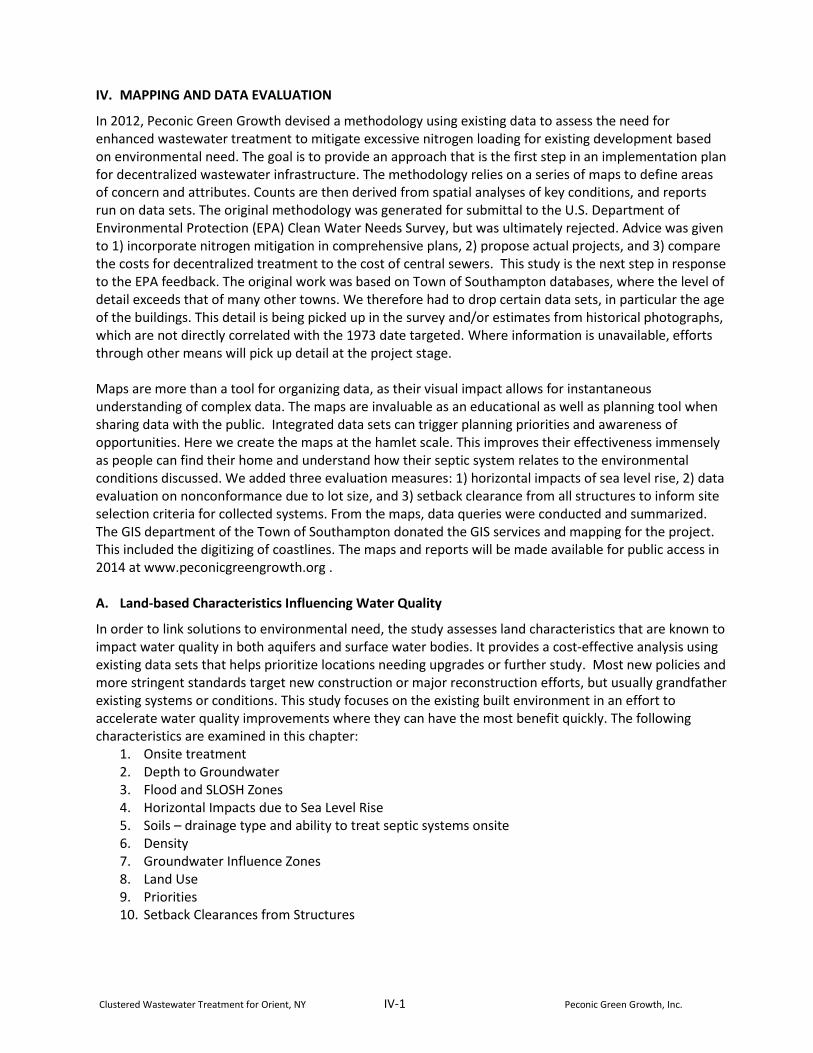
IV. MAPPING AND DATA EVALUATION
In 2012, Peconic Green Growth devised a methodology using existing data to assess the need for enhanced wastewater treatment to mitigate excessive nitrogen loading for existing development based on environmental need. The goal is to provide an approach that is the first step in an implementation plan for decentralized wastewater infrastructure. The methodology relies on a series of maps to define areas of concern and attributes. Counts are then derived from spatial analyses of key conditions, and reports run on data sets. The original methodology was generated for submittal to the U.S. Department of Environmental Protection (EPA) Clean Water Needs Survey, but was ultimately rejected. Advice was given to 1) incorporate nitrogen mitigation in comprehensive plans, 2) propose actual projects, and 3) compare the costs for decentralized treatment to the cost of central sewers. This study is the next step in response to the EPA feedback. The original work was based on Town of Southampton databases, where the level of detail exceeds that of many other towns. We therefore had to drop certain data sets, in particular the age of the buildings. This detail is being picked up in the survey and/or estimates from historical photographs, which are not directly correlated with the 1973 date targeted. Where information is unavailable, efforts through other means will pick up detail at the project stage. Maps are more than a tool for organizing data, as their visual impact allows for instantaneous understanding of complex data. The maps are invaluable as an educational as well as planning tool when sharing data with the public. Integrated data sets can trigger planning priorities and awareness of opportunities. Here we create the maps at the hamlet scale. This improves their effectiveness immensely as people can find their home and understand how their septic system relates to the environmental conditions discussed. We added three evaluation measures: 1) horizontal impacts of sea level rise, 2) data evaluation on nonconformance due to lot size, and 3) setback clearance from all structures to inform site selection criteria for collected systems. From the maps, data queries were conducted and summarized. The GIS department of the Town of Southampton donated the GIS services and mapping for the project. This included the digitizing of coastlines. The maps and reports will be made available for public access in 2014 at www.peconicgreengrowth.org .
A. Land-based Characteristics Influencing Water Quality
In order to link solutions to environmental need, the study assesses land characteristics that are known to impact water quality in both aquifers and surface water bodies. It provides a cost-effective analysis using existing data sets that helps prioritize locations needing upgrades or further study. Most new policies and more stringent standards target new construction or major reconstruction efforts, but usually grandfather existing systems or conditions. This study focuses on the existing built environment in an effort to accelerate water quality improvements where they can have the most benefit quickly. The following characteristics are examined in this chapter:
1. Onsite treatment 2. Depth to Groundwater 3. Flood and SLOSH Zones 4. Horizontal Impacts due to Sea Level Rise 5. Soils – drainage type and ability to treat septic systems onsite 6. Density 7. Groundwater Influence Zones 8. Land Use 9. Priorities 10. Setback Clearances from Structures

Clustered Wastewater Treatment for Orient, NY IV-2 Peconic Green Growth, Inc.
B. Onsite Wastewater Treatment
Before 1973, cesspools were the most common method of treating onsite wastewater. Cesspools are open-sided pits that gather all the waste collected from household uses from pipes from the home. The purpose of the cesspool is to slowly filter the wastewater into the ground through openings in side walls, acting similarly to a dry well. Older ones were often made with open-jointed block. Cesspools disperse rather than treat wastewater. When the wastewater enters the soils, oxygen reacts with wastewater to nitrify it, making nutrients available for uptake or denitrification processes. With cesspools, dissolved solids as well as liquid effluent leach into the soil, filling air gaps in the soil. The soil’s ability to naturally treat and filter wastewater is then compromised, resulting in surface ponding or transfer of poorer quality effluent to groundwater. Also, pathogens can be found in the solids. If there is not enough distance between the system and groundwater, these pathogens may enter groundwater, potentially impacting human health. With cesspools, no denitrification is presumed to have occurred. Currently, it is not required by law to upgrade a cesspool to current standards, due to exceptions for grandfathered installations. In addition, if a cesspool fails it may be replaced with another cesspool without the permit filings required by code-compliant systems. An increase in the number of bedrooms does trigger an upgrade. In 1973 new standards required the use of septic systems for onsite systems. The collected wastewater first enters an enclosed septic tank, where most solids precipitate out. The solids are treated naturally by microbial digestion in an anaerobic (without oxygen) state. Over time, if the natural processing does not keep up with the incoming volume of solids, the tank is pumped and the reduced volumes treated at scavenger plants (Riverhead). The excess liquid effluent passes to either separate leaching pits with sidewall openings or fields that disperse the liquid to soils, where the natural process of treatment continues. With a septic system, some nitrogen removal occurs, with typical levels of discharge being 40-50 mg/L. To evaluate the presence of cesspools, houses built before 1973 are considered likely to be cesspools. In Southampton, building age is part of the searchable database, but other towns do not have the same record availability. For the initial assessment for the presence of cesspools, building age is assessed at the project level based on historical aerial pictures and responses to a questionnaire. More extensive queries of building permit records, when available, can supplement this evaluation. Therefore this characteristic is not evaluated at the town-wide level or mapped here. Due to the historic nature of the hamlets and seaside developments, the overall ratios can be expected to be similar to those found in Southampton, where 54% of the buildings are older than 1973. This aligns with our survey data. Out of 573 responses 57.6% had homes older than 1973, while Orient had 58.9%. Assessing buildings sized over 450 square feet, Orient comprises a total of 962 buildings and 795 parcels. Therefore the estimated number of cesspools in Orient is between 468 and 567.

Clustered Wastewater Treatment for Orient, NY IV-3 Peconic Green Growth, Inc.
C. Depth to Groundwater (Map 2)
Standards rely on separation distances between the bottoms of leaching fields or pits and groundwater levels to properly treat wastewater effluent. The minimum distance is two feet for leaching fields. In 1995, the Suffolk County Department of Health Services (SCDHS) increased the required depth to groundwater from two feet to three feet for leaching pits, although still allowing two feet for alternative shallow systems approved by the department. Systems having less than two-to-three feet of clearance to groundwater below the leaching field or pit will have their operations compromised and need relocation and/or upgrades for proper function. While county standards are now three feet, NYS Department of Environmental Protection, Appendix 75-A.4 (a)(2) requires at least four feet of useable soil above rock, unsuitable soil and high seasonal groundwater and EPA documents even cite five feet as being preferred. Six feet is recommended when groundwater recharge enters potable aquifers.6 The Town of East Hampton requires a more stringent four-foot separation to groundwater through use of a Harbor Protection Overlay District defined in the Town Code (255-3-70). To compound the issues, the expected rise in groundwater due to climate change is expected to be one to two feet by 2080, with the East End being particularly affected due to the attenuated land masses. Figure IV-1from the Suffolk County Comprehensive Water Resources Plan (SCCWRP), shows the predicted increase in the upper glacial water levels (groundwater levels) assuming a two-foot rise in sea level. Impacts are predicted to be more severe along the northern shore due to lower stream base flow. 7 Alternative evidence incorporating glacial melt anticipates rises as high as four feet.8 This means that systems currently built to standards will become noncompliant with rising groundwater levels. To assess the impacts of groundwater level rise from climate change on the basic functions of onsite wastewater systems, key distances to groundwater that triggered changes to the design of leaching systems9 as required by the SCDHS were defined and then increased by two feet to reflect expected increases in groundwater levels. It can be expected that installations, especially older than 1995, in shallow locations, appearing here in any of the colored bands on Map 2, will start to fail as the distance to groundwater shrinks. In addition SCDHS requires grading plans when the ground surface distance to groundwater is less than seven feet10 (increased to nine feet on maps with two-foot rise adjustment). Changes to the topography can cause negative environmental repercussions, such as changes to stormwater runoff, the hardening of coastlines through the use of bulkheads, and loss of native flora. Wastewater treatment under difficult site conditions can be handled by waterproofed, enhanced systems or by relocating treatment out of critical areas. At a minimum, leaching field redesign and nitrogen treatment would be needed. Currently SCDHS does not allow septic system installation at elevations of one foot or below.11 Since elevations of up to three feet are considered ideal for buffer zones affecting water quality, lands within this zone should be targeted for conservation or zero impact solutions. To summarize, there are two major issues indicating the environmental failure of onsite wastewater treatment related to depth to groundwater: the presence of cesspools in shallow areas and inadequate distance to groundwater for proper function. Failure from these conditions is a serious threat to public and environmental health as both pathogens and nutrients, lacking even basic treatment, are flushed into aquifers and surface water bodies.

Clustered Wastewater Treatment for Orient, NY IV-4 Peconic Green Growth, Inc.
Figure III-1 Impact on Groundwater of 2’ Rise in Mean Sea Level Rise (SCCWRMP Figure 3.39)
307 buildings representing 36.2% of the buildings in Orient greater than 450 square feet are situated in locations with shallow depths to groundwater. The associated onsite wastewater treatment systems for these buildings will likely fail due to rises in groundwater elevation due to climate change. The Peconic Estuary has the major share, with 57% of the buildings being built on low lying lands. Since the North Fork topography along the LI Sound shore has some of the highest local elevations due to its formation as a terminal moraine, the shallow depths to groundwater are basically in creek basins.
Figure IV-2 Figure IV-3
# of BUILDINGS (>450 SF) by DEPTH TO GROUNDWATER: ORIENT (North Fork)
Depth to Groundwater
LIS PE Overlap Outside Total % %
Cumulative
<1 0.0% 0.0% 6 1.1% 1.1% 6 0.7% 0.7%
1.1-3 0.0% 0.0% 3 0.5% 1.6% 3 0.4% 1.1%
3.1-9 22 5.3% 5.3% 192 35.0% 36.6% 16 9 207 24.4% 25.4%
9.1-11 16 3.9% 9.2% 56 10.2% 46.8% 35 37 4.4% 29.8%
11.1-13 14 3.4% 12.6% 56 10.2% 57.0% 18 2 54 6.4% 36.2%
>13 361 87.4% 100.0% 236 43.0% 100.0% 60 5 542 63.8% 100.0%
TOTAL 413 549 129 16 849
5% 4% 3%
88%
Long Island Sound Watershed Orient Depth to Groundwater
<1
1.1-3
3.1-9
9.1-11
11.1-13
>13
1% 1%
35%
10% 10%
43%
Peconic Estuary Watershed Orient Depth to Groundwater
<1
1.1-3
3.1-9
9.1-11
11.1-13
>13

Clustered Wastewater Treatment for Orient, NY IV-5 Peconic Green Growth, Inc.
D. Flooding and Storm Surge (Map 3)
Map 3 shows areas susceptible to flooding as defined by the Federal Emergency Management Agency (FEMA) and storm surge as depicted using SLOSH (Sea, Lake and Overland Surges from Hurricanes) run by the national Hurricane Center (NHC). While the SCDHS currently does not allow septic systems to be installed in the ten year flood level,12 a considerable amount of development has occurred within the 100 year flood and storm surge areas. With global warming the frequency of these storms is expected to increase. Even temporary episodes that pollute marine waters can have a deleterious effect on habitat, shellfish and fin fish. Cesspools in flood areas are particularly vulnerable as the waste is easily flushed into flood waters, where it potentially impacts human health. Salt water infiltration also impacts the effectiveness of the natural treatment process, requiring recovery time for the bacteria to become effective again. Also, if systems are pumped when the land is still saturated, collapses can occur due to hydrostatic pressure. Waste treatment in the SLOSH zones should, at a minimum, be flood proofed and any enhanced treatment provided with generator connections. Ideally any clustered system would transport the treatment to a location outside the susceptible zones. In Orient, 23% of the buildings and their onsite systems in the Peconic Estuary and 15.4% overall are potentially impacted by flooding, with most being in the Peconic Estuary.
Table IV-2 # of BUILDINGS (>450 SF) by FLOOD ZONE (FIRM) ORIENT (North Fork)
FIRM CATEGORY LIS PE % %+ Overlap Outside Total % %+
VE 2 7 1.3% 1.3% 9 1.1% 1.1%
AE 2 111 20.2% 21.5% 1 114 13.4% 14.5%
0.2 PCT annual chance Flood Hazard
8 1.5% 23.0% 3 3 8 0.9% 15.4%
X 409 423 77.0% 100% 126 12 718 84.6% 100%
TOTAL 413 549 129 16 849
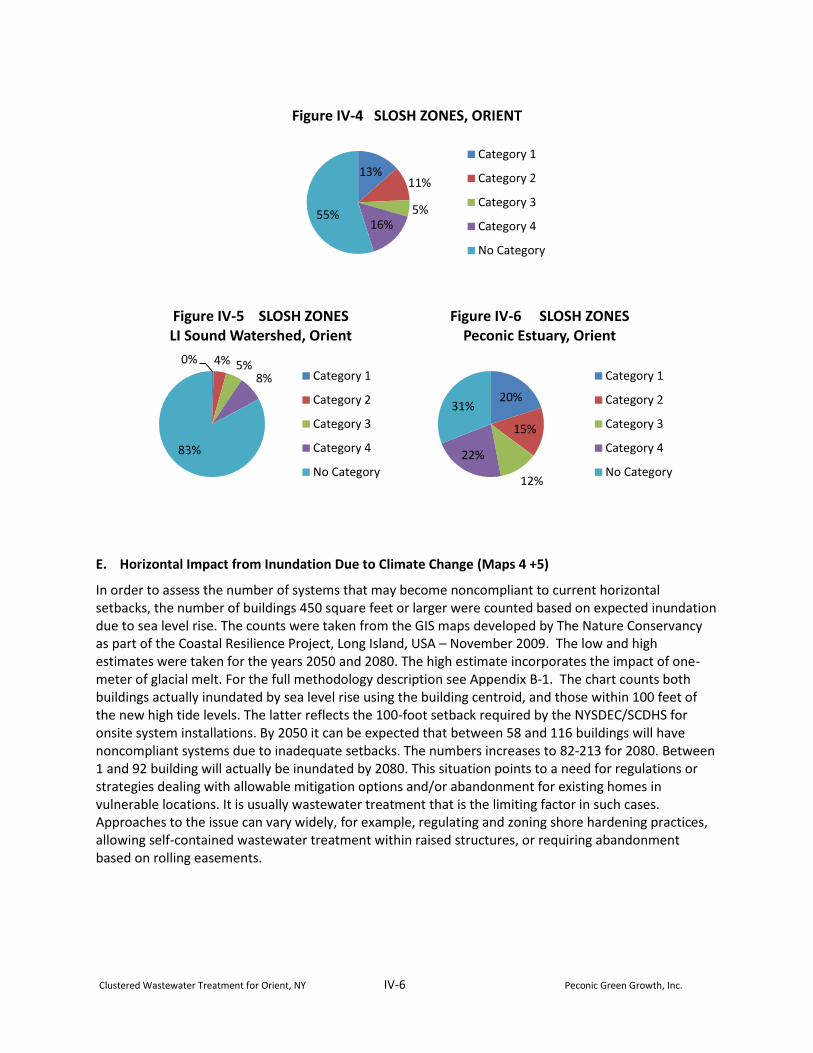
SLOSH - Sea, Lake, and Overland Surges from Hurricanes The vulnerability of areas impacted by storm surge is evident by the damage caused by storm events the world has witnessed over the past few years. Storm surge obviously increases the number of homes and onsite wastewater treatment systems vulnerable during extreme weather events. The overall percentage of buildings over 450 SF in size in SLOSH zones in Orient increases to 45.1% or 383 structures. Again, the Peconic Estuary has a disproportionate share, with 69% of the buildings situated in SLOSH zones.
Table IV-3 ORIENT # of BUILDINGS (>450 SF) by SLOSH ZONE
SLOSH - Sea, Lake, and Overland Surges from Hurricanes SLOSH ZONES LIS PE Overlap Outside Total
Category 1 2 0.5% 0.5% 110 20.0% 20.0% 3 115 13.5% 13.5%
Category 2 16 3.9% 4.4% 83 15.1% 35.2% 14 6 91 10.7% 24.3%
Category 3 21 5.1% 9.4% 65 11.8% 47.0% 43 1 44 5.2% 29.4%
Category 4 32 7.7% 17.2% 121 22.0% 69.0% 26 6 133 15.7% 45.1%
No Category 342 82.8% 100.0% 170 31.0% 100.0% 46 466 54.9% 100.0%
TOTAL 413 549 129 16 849
Clustered Wastewater Treatment for Orient, NY IV-6 Peconic Green Growth, Inc.
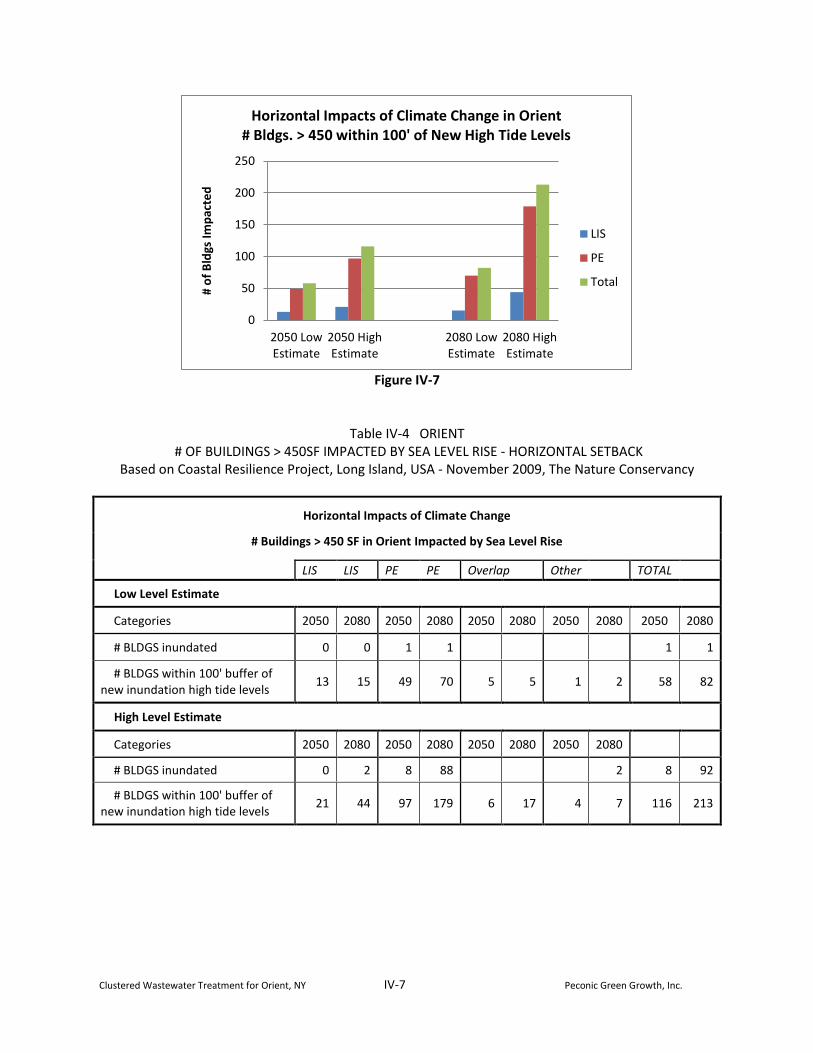
E. Horizontal Impact from Inundation Due to Climate Change (Maps 4 +5)
In order to assess the number of systems that may become noncompliant to current horizontal setbacks, the number of buildings 450 square feet or larger were counted based on expected inundation due to sea level rise. The counts were taken from the GIS maps developed by The Nature Conservancy as part of the Coastal Resilience Project, Long Island, USA – November 2009. The low and high estimates were taken for the years 2050 and 2080. The high estimate incorporates the impact of one-meter of glacial melt. For the full methodology description see Appendix B-1. The chart counts both buildings actually inundated by sea level rise using the building centroid, and those within 100 feet of the new high tide levels. The latter reflects the 100-foot setback required by the NYSDEC/SCDHS for onsite system installations. By 2050 it can be expected that between 58 and 116 buildings will have noncompliant systems due to inadequate setbacks. The numbers increases to 82-213 for 2080. Between 1 and 92 building will actually be inundated by 2080. This situation points to a need for regulations or strategies dealing with allowable mitigation options and/or abandonment for existing homes in vulnerable locations. It is usually wastewater treatment that is the limiting factor in such cases. Approaches to the issue can vary widely, for example, regulating and zoning shore hardening practices, allowing self-contained wastewater treatment within raised structures, or requiring abandonment based on rolling easements.
13% 11%
5% 16%
55%
Figure IV-4 SLOSH ZONES, ORIENT
Category 1
Category 2
Category 3
Category 4
No Category
0% 4% 5% 8%
83%
Figure IV-5 SLOSH ZONES LI Sound Watershed, Orient
Category 1
Category 2
Category 3
Category 4
No Category
20%
15%
12%
22%
31%
Figure IV-6 SLOSH ZONES Peconic Estuary, Orient
Category 1
Category 2
Category 3
Category 4
No Category
Clustered Wastewater Treatment for Orient, NY IV-7 Peconic Green Growth, Inc.
Figure IV-7
Table IV-4 ORIENT # OF BUILDINGS > 450SF IMPACTED BY SEA LEVEL RISE - HORIZONTAL SETBACK
Based on Coastal Resilience Project, Long Island, USA - November 2009, The Nature Conservancy
Horizontal Impacts of Climate Change
# Buildings > 450 SF in Orient Impacted by Sea Level Rise
LIS LIS PE PE Overlap Other TOTAL
Low Level Estimate
Categories 2050 2080 2050 2080 2050 2080 2050 2080 2050 2080
# BLDGS inundated 0 0 1 1 1 1
# BLDGS within 100' buffer of new inundation high tide levels
13 15 49 70 5 5 1 2 58 82
High Level Estimate
Categories 2050 2080 2050 2080 2050 2080 2050 2080
# BLDGS inundated 0 2 8 88 2 8 92
# BLDGS within 100' buffer of new inundation high tide levels
21 44 97 179 6 17 4 7 116 213
0
50
100
150
200
250
2050 LowEstimate
2050 HighEstimate
2080 LowEstimate
2080 HighEstimate
# o
f B
ldgs
Im
pac
ted
Horizontal Impacts of Climate Change in Orient # Bldgs. > 450 within 100' of New High Tide Levels
LIS
PE
Total

Clustered Wastewater Treatment for Orient, NY IV-8 Peconic Green Growth, Inc.
F. SOILS: Drainage Class and Septic Tank Absorption (Maps 6+7) Currently SCDHS references soils with meadow mat, bog, silts, clay or impervious matter extending below the groundwater table as being unsuitable for septic systems.13 In NYSDEC Appendix 75-A.4 (a)(1) land in the ten year flood zone and slopes greater than 15% and Appendix 75-A.4 (a)(3) soils with very rapid percolation rates faster than one minute per inch are not suitable for subsurface absorption systems unless the site is modified by blending with less permeable soil to reduce the infiltration rate. Soils that are excessively permeable do not hold the effluent long enough for natural treatment to occur in the biomat below the leaching field, increasing likelihood of groundwater contamination. To identify soil suitability, one can identify hydrologic groups, but here we based the maps on the Web Soil Survey of the Natural Resources Conservation Services (http://websoilsurvey.nrcs.usda.gov/app/HomePage.htm). Once an area of interest is defined, under the Soil Properties and Qualities tab, Soil Qualities and Features, the drainage class can be determined. The “excessively drained, poorly drained, and very poorly drained” as defined in the Soil Survey Manual http://soils.usda.gov/technical/manual will influence the choice of appropriate solutions. Here we assigned these attributes to already mapped soil types to more simply evaluate and quantify soil suitability graphically. Under the Soil Data Explorer, Suitability and Limitations Ratings, and Sanitary Facilities tabs, the Septic Tank Absorption Fields rating is defined. The “very limited” category indicates that limitations cannot generally be overcome and should trigger alternative treatment evaluation, as well as conservation efforts. The attributes used for evaluation of soil depths from 12 to 48 inches are saturated hydraulic conductivity, depth to seasonal high water table, depth to bedrock or dense material, and susceptibility to flooding. Map 6 gives an indication as to solution needs based on permeability. Map 7 indicates areas that will most likely need enhanced solutions that would range from mounding and leaching fields to specially designed sand filters and advanced treatment. In some cases clustered systems may be able to relocate the treatment or recharge areas to locations with suitable soils. Orient has a low percentage of excessively drained soils compared to the rest of the North Fork, with only 4.8% of buildings located on inappropriate soils for ground-based treatment.
Table IV-5 # of Buildings > 450 SF in Orient by Soil Drainage Classification
LIS PE Overlap Outside TOTAL
*not rated 1 22 23 2.7%
Excessively Drained 44 2 5 41 4.8%
Moderately Well Drained 8 11 19 2.2%
Poorly Drained 0 0.0%
Very Poorly Drained 0 0.0%
Well Drained 360 514 124 16 766 90.2%
TOTAL 413 549 129 16 849 849
Table IV-6 Septic Absorption Rating: # of Buildings > 450 SF in Orient
LIS PE Overlap Outside TOTAL %
Not Rated 1 23 24 2.8%
Somewhat Limited 367 525 124 16 784 92.3%
Very Limited 45 1 5 41 4.8%
TOTAL 413 549 129 16 849
Clustered Wastewater Treatment for Orient, NY IV-9 Peconic Green Growth, Inc.
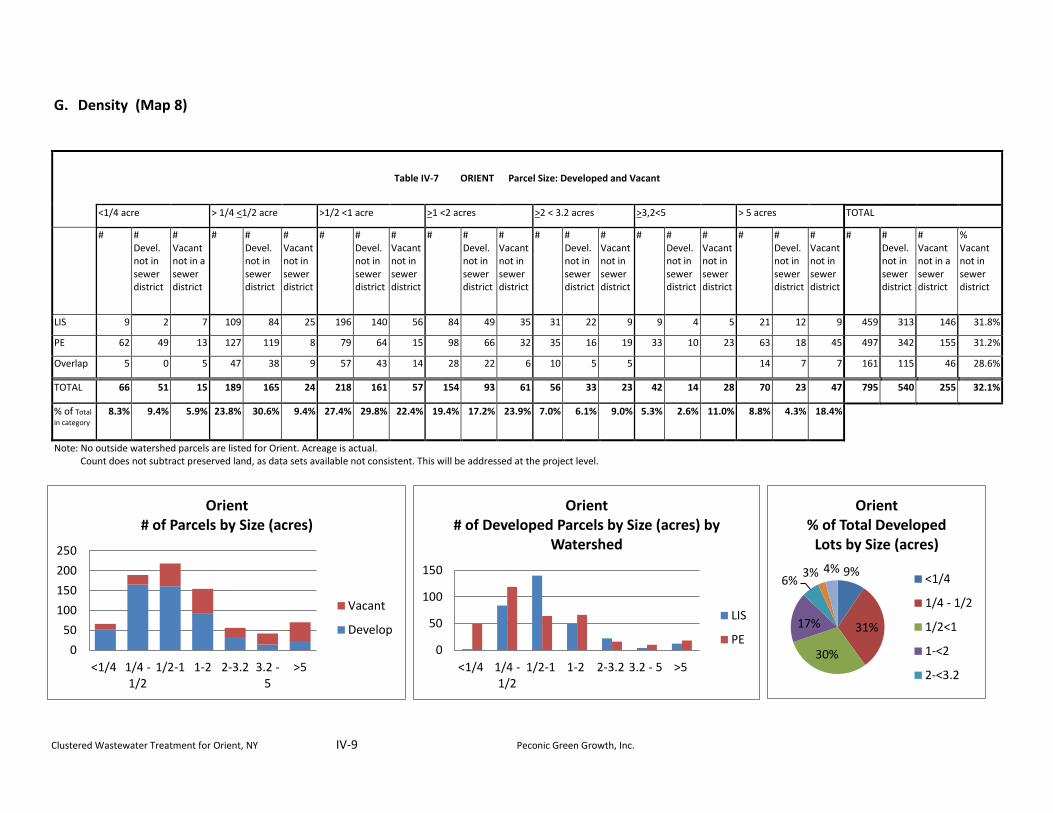
G. Density (Map 8)
Table IV-7 ORIENT Parcel Size: Developed and Vacant
<1/4 acre > 1/4 <1/2 acre >1/2 <1 acre >1 <2 acres >2 < 3.2 acres >3,2<5 > 5 acres TOTAL
# # Devel. not in sewer district
# Vacant not in a sewer district
# # Devel. not in sewer district
# Vacant not in sewer district
# # Devel. not in sewer district
# Vacant not in sewer district
# # Devel. not in sewer district
# Vacant not in sewer district
# # Devel. not in sewer district
# Vacant not in sewer district
# # Devel. not in sewer district
# Vacant not in sewer district
# # Devel. not in sewer district
# Vacant not in sewer district
# # Devel. not in sewer district
# Vacant not in a sewer district
% Vacant not in sewer district
LIS 9 2 7 109 84 25 196 140 56 84 49 35 31 22 9 9 4 5 21 12 9 459 313 146 31.8%
PE 62 49 13 127 119 8 79 64 15 98 66 32 35 16 19 33 10 23 63 18 45 497 342 155 31.2%
Overlap 5 0 5 47 38 9 57 43 14 28 22 6 10 5 5 14 7 7 161 115 46 28.6%
TOTAL 66 51 15 189 165 24 218 161 57 154 93 61 56 33 23 42 14 28 70 23 47 795 540 255 32.1%
% of Total
in category 8.3% 9.4% 5.9% 23.8% 30.6% 9.4% 27.4% 29.8% 22.4% 19.4% 17.2% 23.9% 7.0% 6.1% 9.0% 5.3% 2.6% 11.0% 8.8% 4.3% 18.4%
Note: No outside watershed parcels are listed for Orient. Acreage is actual. Count does not subtract preserved land, as data sets available not consistent. This will be addressed at the project level.
0
50
100
150
200
250
<1/4 1/4 -1/2
1/2-1 1-2 2-3.2 3.2 -5
>5
Orient # of Parcels by Size (acres)
Vacant
Develop
0
50
100
150
<1/4 1/4 -1/2
1/2-1 1-2 2-3.2 3.2 - 5 >5
Orient # of Developed Parcels by Size (acres) by
Watershed
LIS
PE
9%
31%
30%
17%
6% 3% 4%
Orient % of Total Developed
Lots by Size (acres)
<1/4
1/4 - 1/2
1/2<1
1-<2
2-<3.2

Clustered Wastewater Treatment for Orient, NY IV-10 Peconic Green Growth, Inc.
G. Density (Map 8) Traditionally wastewater treatment is handled by using lot size to dilute pollutants to a level acceptable for drinking water. This regulation impacts land use patterns and encourages sprawl. While the SCDHS currently has two minimum sizes - half acre or one acre based on hydrological zones, the draft version of the SCCWRMP recommends increasing the minimum from one-half acre to one acre in Groundwater Management Zone IV, in which Orient lays.14 Also 760-606 A 5 indicates that any new development with lots less than 40,000 square feet require community water systems, reinforcing the one-acre lot minimum, as Orient residents still rely predominantly on individual wells for their drinking water supply. Due to the historic nature of Orient’s development many parcels are nonconforming to current statute, with a third of all developed lots being nonconforming to the 20,000 SF minimum. 69.8% of the lots are less than one acre (actual size) and 9.4% are ¼ acre or less. Most small lots are in the Peconic Estuary.
Table IV-8 Nonconforming Lots for Groundwater Management Zone IV - Lots less than 20,000 SF
# lots # dev. lots
# dev. Lots
<20K SF
% < 20k SF/dev.
Lots
# vacant lots
<20k SF
% all lots <20k SF to
all lots Orient, LIS 459 313 55 17.6% 20 16.3%
Orient, PE 497 343 150 43.7% 19 19.3
Overlap 161 115 25 13
TOTAL 795 541 180 33.7% 26 25.9%
Figure IV-11 Detail of Town-wide map identifying parcels noncompliant with 20,000 SF minimum for Groundwater Management Zone IV. Standard septic systems dispense nitrogen at a rate between 40-60 mg/l. Since 10 mg/l is the maximum contaminant level for drinking water quality, the lot size impact the dilution factor. With the one acre standard the target nitrogen level after dilution is 4-6 mg/l.15 The New Jersey Pine Barrens, with conditions similar to the East End, require a minimum lot size of 3.2 acres for standard septic installations, with all lots smaller than this required to have enhanced treatment in order to attain a target of 2 mg/l. A quick calculation with a goal of 2 mg/l for Suffolk County conditions indicate that three to two acres would compensate for nitrogen from wastewater within an annual rainfall range of

Clustered Wastewater Treatment for Orient, NY IV-11 Peconic Green Growth, Inc.
37.2 inches (Cornell Extension) to 46 inches (CLRsearch.com) using an attenuation rate of 41.5% without compensation for atmospheric and fertilizer nitrogen inputs, nor for nitrogen in receiving waters. Depending upon attenuation of nitrogen, neither nitrogen goal may attain a dilution sufficient to address environmental sensitivities in water bodies, where target levels of nitrogen range from 0.3 to 0.45 mg/l. In a study of 74 watersheds in Rhode Island (similar conditions to L. I.) it was noted that two-acre lots have a negative impact on water quality.16 In the Great South Bay Study,17 an attenuation factor of 0.72 is applied for nitrogen derived from wastewater, which is considered applicable for lands more than 200 meters from shore. Pio Lombardo, P.E., stated that the attenuation should be 41.5% based on measured stream discharge.18 A dilution goal of 1.6 mg/l at 72% attenuation or 0.77 mg/l at 41.5% attenuation would meet aquatic targets of 0.45. Minimum lot sizes of 8.5 to 13.6 acres would be needed to provide adequate dilution of standard septic systems. Other references note a 20-25% attenuation rate as being typical, which would be more appropriate for lands close to the coast or measuring impact on aquifers. None of these approaches considers elevated levels of nitrogen already existing in receiving waters, as only flow is calculated. A marine environment is impacted by total pounds of nitrogen as well as concentration. TMDL’s for sewage treatment plants now use both limits. A “dilution by area” approach does not take into consideration localized conditions, especially outside lot boundaries contributing to surface water bodies. For instance a localized watershed may slope to a concentrated area, increasing total nitrogen loading impacts on water bodies. Contaminants may travel in plumes rather than being diluted evenly in groundwater. The cumulative impacts of nitrogen migrating over time and distance to surface water bodies are not considered. Also the presence of buffering wetlands and the size and flushing rates of the receiving waters will dictate how sensitive surface waters are to elevated nitrogen inputs. Sub-watershed analyses based on Total Maximum Daily Load (TMDL) calculations can inform levels of treatment and prioritize implementation strategies when considering the optimum loading rates of water bodies. Basically constricted bodies of water, such as creeks or embayments, will be more sensitive than open seas. When densities are high, not only is the amount of contamination per acre increased, but the ability of the land to mitigate conditions is compromised. With higher densities, a larger percentage of the land is covered by impervious surfaces, a condition that both hinders the groundwater recharge through precipitation, and promotes stormwater run-off, which transports more contaminants without the beneficial filtering soils provide. The smaller the lot, the more onsite wastewater treatment is the primary source of nitrogen loading. Table IV-9 represents the impact of lot size on nitrogen contributions, while Figure IV-12 shows the expected impacts of mitigation in relation to other improvements. In the SCCWRMP, the clear correlation between poor water quality and housing density is emphasized. Historical land use patterns typical of Long Island and Orient’s historic village group small lots around hamlet centers, with open space beyond. Since the overall areas of mid-to high- densities are relatively small compared to urbanized areas, the densities do not support sustainably the cost and impact of central sewer districts. The large size of central sewer districts means that wastewater is usually removed from local watersheds, thus impacting groundwater and stream recharge. With decentralized systems (including clusters) wastewater can be treated and /or reused close to the source so that groundwater is recharged in a balanced manner. Decentralized cluster systems become more economically feasible when collection distances are less than 75 feet apart, effluent-only or low-pressure options19 are introduced, and reuse opportunities incorporated. Therefore lot sizes of one-half acre or less in size are considered appropriate for cluster formations within the same watershed. Depending upon the configurations and site conditions, a cluster system could be extended to larger lots as well. In the study of the Great South Bay, Erin L. Kinney and Ivan Valiela note that when the number of homes that were sewered exceeded 75% of a watershed, the drop in nitrogen was pronounced and

Clustered Wastewater Treatment for Orient, NY IV-12 Peconic Green Growth, Inc.
therefore a significant minimum target for watershed mitigation through advanced treatment of wastewater.20
Table IV-9 Relative N Contribution Based on Lot Size
Generic N loading Assumptions Onsite systems: 7 lb N/person/year, 80% leaching to groundwater Lawn fertilizer: 175 lb N/acre/year, 6 to 20 % leaching to groundwater Agriculture (cropland): 175 to 215 lb N/acre/year, 20% leaching to groundwater Pet waste: 0.41 lb N/person/year, Unfertilized pervious area, • 1.2 lb N/acre/year
45
Figure IV-12: Impacts on Nitrogen Loading by Lot Size, Wastewater Treatment, Fertilizer Use, and Stormwater Run-off Wastewater Planning Handbook: Mapping Onsite Treatment Needs, Pollution Risks, and Management Options Using GIS, Project No. NDWRCDP, WU-HT-01-07. Figure 10-3.
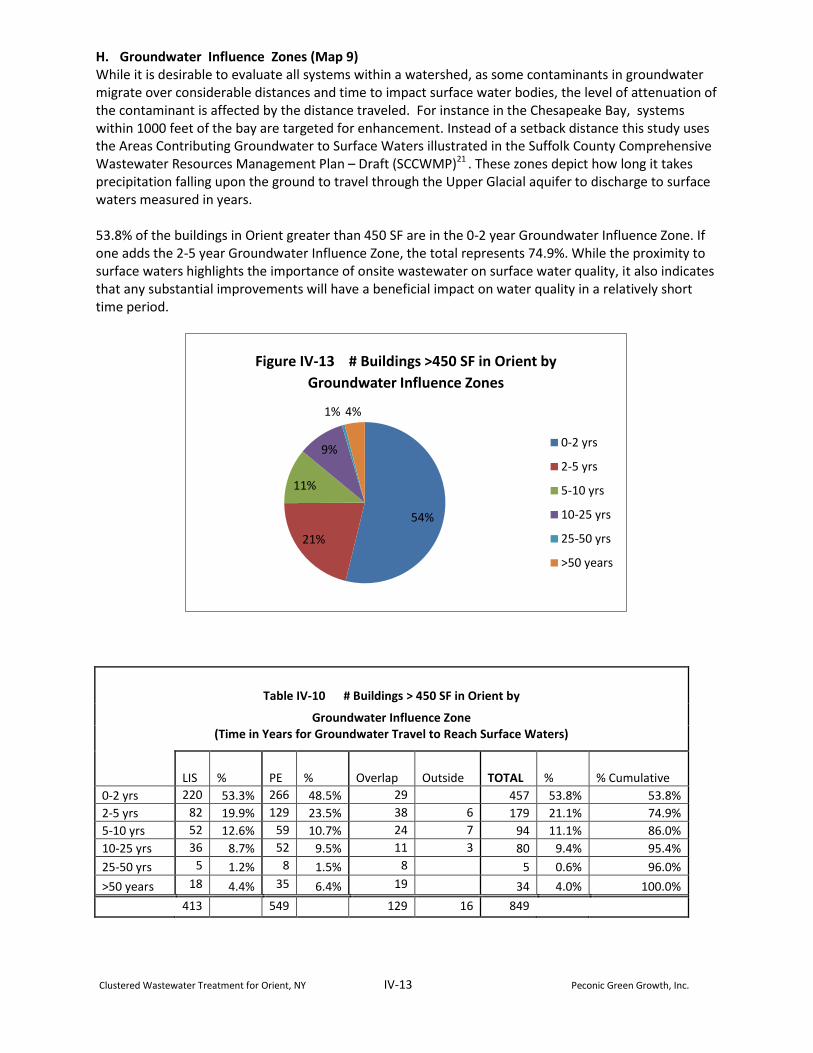
Clustered Wastewater Treatment for Orient, NY IV-13 Peconic Green Growth, Inc.
H. Groundwater Influence Zones (Map 9) While it is desirable to evaluate all systems within a watershed, as some contaminants in groundwater migrate over considerable distances and time to impact surface water bodies, the level of attenuation of the contaminant is affected by the distance traveled. For instance in the Chesapeake Bay, systems within 1000 feet of the bay are targeted for enhancement. Instead of a setback distance this study uses the Areas Contributing Groundwater to Surface Waters illustrated in the Suffolk County Comprehensive Wastewater Resources Management Plan – Draft (SCCWMP)21 . These zones depict how long it takes precipitation falling upon the ground to travel through the Upper Glacial aquifer to discharge to surface waters measured in years. 53.8% of the buildings in Orient greater than 450 SF are in the 0-2 year Groundwater Influence Zone. If one adds the 2-5 year Groundwater Influence Zone, the total represents 74.9%. While the proximity to surface waters highlights the importance of onsite wastewater on surface water quality, it also indicates that any substantial improvements will have a beneficial impact on water quality in a relatively short time period.
Table IV-10 # Buildings > 450 SF in Orient by
Groundwater Influence Zone (Time in Years for Groundwater Travel to Reach Surface Waters)
LIS % PE % Overlap Outside TOTAL % % Cumulative
0-2 yrs 220 53.3% 266 48.5% 29 457 53.8% 53.8%
2-5 yrs 82 19.9% 129 23.5% 38 6 179 21.1% 74.9%
5-10 yrs 52 12.6% 59 10.7% 24 7 94 11.1% 86.0%
10-25 yrs 36 8.7% 52 9.5% 11 3 80 9.4% 95.4%
25-50 yrs 5 1.2% 8 1.5% 8 5 0.6% 96.0%
>50 years 18 4.4% 35 6.4% 19 34 4.0% 100.0%
413 549 129 16 849
54%
21%
11%
9%
1% 4%
Figure IV-13 # Buildings >450 SF in Orient by Groundwater Influence Zones
0-2 yrs
2-5 yrs
5-10 yrs
10-25 yrs
25-50 yrs
>50 years

Clustered Wastewater Treatment for Orient, NY IV-14 Peconic Green Growth, Inc.
I. Priorities (Map 10) In an attempt to combine the separately evaluated conditions that impact water quality, the Priorities Map overlays information with assigned points to each category, which become cumulative. Peconic Green Growth worked on a committee with the SCDHS to devise a ranking system for the distribution of incentive funds for clustered decentralized wastewater treatment projects. The ranking sheet, viewable in Appendix B-3 incorporated many factors that cannot be mapped, but are related to solutions and viability, such as level of nitrogen mitigation, financial capacity, and compliance with local plans. The map prioritizes the following characteristics with the addition of soil types. Small lots in the top two rankings were flagged in black, as these parcels are appropriate for community systems.
Condition Points Assigned
Mapped Priorities Rankings
Point Range
In a TMDL area 8 Low Priority 0-8
No Public Water available 4 Medium Low Priority 9-15
Within 0-10 year travel time to significant surface water body
4 Medium Priority 16-23
Within 0-2 year travel time to significant surface water, additional points:
4 Medium High Priority 24-30
Lots less than 1 acre 4 High Priority 31-38
Lots less than ½ acre, additional points 4
SLOSH Zone 4
Flood Zone, additional points 4
Soils considered very limited for sanitary treatment
2
TOTAL 38
Table IV-11 Priority Ranking Point System
J. Proposed Districts (Map 11) Based on both the priority map and the density maps that indicate natural groups of small lots, proposed districts were introduced. When a housing development had its own association, the whole was included in the evaluation, for instance Greenway and Orient by the Sea, both near Orient Point. The priority area is the greater village area. The school, churches, and firehouse were also included due to heavier loading and opportunities to incorporate publicly controlled properties. More detail on the districts is provided in the engineering RFP Appendix C-2. These districts are meant to be a starting point for discussion, as well as offer opportunities for varied solutions. For instance, single, enhanced onsite systems might be more appropriate for district 4. District 5 might test the viability of an isolated, small cluster of homeowners where shallow depths to groundwater are limiting factors. Owner receptivity, engineering input, solution options, and cost will all have a factor in the reshaping of the proposed districts moving forward.
K. Land Use and Clearances (Map 12, 13, 14) Land use is an important factor indicating pollution risks, since high-intensity use, impervious cover, and reduced natural environment are all linked to development. While this study is focused on residential needs, thereby using density as an evaluation of intensity, uses that trigger extreme or high risk evaluation can be evaluated and added to the needs evaluation.
Map 12 combines zoning districts with lot size information. It also distinguishes vacant from developed lots. Opportunities become evident. If wastewater can be reused for toilet flushing, irrigation, nutrient extraction, and energy or heat recapture, not only does the wastewater become a beneficial commodity, but costs for both wastewater treatment and ensuring a potable water supply can be

Clustered Wastewater Treatment for Orient, NY IV-15 Peconic Green Growth, Inc.
reduced. Vacant lots near dense residential areas can be used for clustered wastewater treatment. Aerial imagery (Map 13) and maps delineating buffer zones of 200 feet (Map 14) around existing buildings help to initially identify areas suitable for community wastewater systems. The 200-foot minimal aerial separation distance from existing buildings for wastewater treatment processes enclosed in a building, buried or using covered sand filters is identified in the NYSDEC Draft Design Standards for Intermediate-sized Wastewater Treatment Systems 2012 Table B.1.
L. Maps of key indicators of nitrogen pollution
1. Water Quality: http://www.peconicgreengrowth.org/docs/maps/orient/Orient_IMPAIRED_WATER.pdf
2. Depth to Groundwater: http://www.peconicgreengrowth.org/docs/maps/orient/Orient_GW_DEPTH.pdf
3. Flood and SLOSH zones http://www.peconicgreengrowth.org/docs/maps/orient/Orient_FLOOD.pdf
4. Sea Level Rise 2050 5. Sea Level Rise 2080 6. Soil: Drainage http://www.peconicgreengrowth.org/docs/maps/orient/Orient_DRAINAGE.pdf 7. Soil: Septic Absorption
http://www.peconicgreengrowth.org/docs/maps/orient/Orient_SOILS_SEPTIC.pdf 8. Parcel Density http://www.peconicgreengrowth.org/docs/maps/orient/Orient_ACREAGE.pdf 9. Influence Zones
http://www.peconicgreengrowth.org/docs/maps/orient/Orient_INFLUENCE.pdf Maps for planning purposes:
10. Priority areas 11. Proposed districts for community systems
http://www.peconicgreengrowth.org/docs/maps/orient/OrientDistricts.pdf 12. Land Use 13. Aerial:
http://www.peconicgreengrowth.org/docs/maps/orient/Orient_IMAGERY.pdf 14. Clearance distances to buildings (200 ft)

20 Shaker Rd., P.O. Box 730, New Lebanon, N.Y. 12125 www.clarkpc.com
Orient, New York
Decentralized Wastewater Collection & Treatment
Feasibility Study
PHASE 1 Potential Site Identification
for:
Peconic Green Growth LLC Suffolk County, NY
651 W. Main Street Riverhead, NY 11901
(T) (631) 591-2402 www.peconicgreengrowth.org
December 23, 2013
Project No. 3941302

TABLE OF CONTENTS
Peconic Green Growth LLC – Wastewater Feasibility Report – Phase 1 i
SECTION 1 BACKGROUND 1.1 Introduction ........................................................................ 1-1 1.2 Wastewater Background ................................................... 1-1
1.2.1 Service Area and Flows .......................................... 1-2 1.2.2 Proposed Treatment System .................................. 1-3
1.3 Project Area Characteristics .............................................. 1-3 1.3.1 Location & Population ............................................. 1-3 1.3.2 Environmental Resources ....................................... 1-3 1.3.3 Flood Zones ............................................................ 1-4 1.3.4 Geology/Topography/Soils ..................................... 1-5 1.3.5 Groundwater ........................................................... 1-7 1.3.6 Land Use/Zoning .................................................... 1-8
SECTION 2 WASTEWATER SYSTEM ALTERNATIVES 2.1 Wastewater Collection Systems ........................................ 2-1
2.1.1 Conventional Collection System ............................. 2-1 2.1.2 Alternative Collection Systems ............................... 2-2
2.2 Wastewater Treatment Systems ....................................... 2-3 2.2.1 Conventional Treatment System Description .......... 2-3 2.2.2 Alternative Treatment System ................................ 2-4
2.3 Alternative Treatment Technologies .................................. 2-6 2.4 Wastewater Disposal Systems .......................................... 2-8
2.4.1 Seepage Pits .......................................................... 2-8 2.4.2 Open Recharge Beds ............................................. 2-9 2.4.3 Absorption Fields and Beds .................................... 2-9 2.4.4 Absorption Fields and Beds .................................. 2-10 2.4.5 Irrigation Wastewater Reuse ................................ 2-11
2.5 Wastewater Disposal Quality ........................................... 2-12
SECTION 3 TREATMENT SITE IDENTIFICATION 3.1 Treatment System Siting Constraints ................................ 3-1 3.2 Preliminary Parcel Screening ............................................ 3-5 3.3 Additional Parcel Considerations ..................................... 3-11
3.3.1 Park Land ............................................................. 3-11 3.3.2 Agricultural Districts .............................................. 3-11
SECTION 4PROJECT ADVANCEMENT 4.1 Additional Study Phases.................................................... 4-1
4.1.1 Treatment Site Identification ................................... 4-1 4.1.2 Collection and Treatment Alternative Evaluation .... 4-1 4.1.3 System Recommendations ..................................... 4-1 4.1.4 Costs & Funding ..................................................... 4-1 4.1.5 Implementation ....................................................... 4-1

Peconic Green Growth LLC – Wastewater Feasibility Report – Phase 1 ii
SECTION 5 REFERENCES
APPENDIX A ALTERNATIVE ON-SITE SEWAGE DISPOSAL SYSTEMS –
EXECUTIVE SUMMARY
APPENDIX B PRESSURIZED SHALLOW NARROW DRAINFIELDS G:\Projects\3941302\Documents\Report\WW Feasibility Study 9-20-2013.docx

SECTION 1 BACKGROUND
Peconic Green Growth LLC – Orient Wastewater Feasibility Report – Phase 1 1-1
1.1 INTRODUCTION This report presents the initial phase of a wastewater feasibility study performed for Orient. This phase identifies suitable sites within the hamlet for subsurface wastewater disposal. Additional phases will determine the most appropriate and cost-effective means of wastewater collection, treatment and disposal using the potential sites identified during this phase.
1.2 WASTEWATER NEEDS The January 2011 Suffolk County Comprehensive Water Resources Management Plan is an extensive document which provides valuable information on the impact of human activities on groundwater sources. One of the most significant contaminates of concern is nitrate. Sources of nitrate include on-site sanitary wastewater disposal in un-sewered areas, sewerage treatment plant discharges to groundwater, as well as the application of fertilizers to agricultural and manicured lands. Nitrate from these sources has resulted in contamination of drinking water supplies. Nitrate is also an important factor in eutrophication.
Wastewater has high levels of nitrogen and phosphorus. Both of these components are known as good fertilizers. Once introduced into a body of water, they cause increased plant growth, specifically of algae, which will bloom, then die and fall to the bottom of the water body and decompose. The decomposition of algae fuels bacterial growth, which consumes oxygen. Aquatic life needs oxygen and without it the water becomes “dead” which means unsuitable to sustain life. Algal blooms not only harm animals, but also block sunlight from reaching plants, which stunts or stops plant growth, destroying habitat.
The Comprehensive Water Resources Management Plan presents data which shows improved wastewater treatment is effective at lowering environmental nitrate levels. The goal of wastewater improvements in Orient will be effective treatment to preserve drinking water and environmental quality while providing a treatment system that would be compatible with the character and concerns of the community.
1.3 WASTEWATER BACKGROUND Orient is currently served by individual subsurface wastewater disposal systems (primarily cesspools) and is un-sewered. The proposed service areas for the future wastewater system are comprised of 7 different areas and are shown on Figure 1.1.

SECTION 1 BACKGROUND
Peconic Green Growth LLC – Orient Wastewater Feasibility Report – Phase 1 1-2
Figure 1.1 Proposed Service Area
Peconic Green Growth (PGG), a not-for-profit organization, has expended significant effort on developing the wastewater system needs and scope. The proposed sewer service areas shown on Figure 1.1 were developed by PGG.
1.3.1 Service Area and Flows Preliminary mapping by PPG shows seven potential wastewater districts. The final district boundaries and number of districts will most likely be adjusted based on public feedback and technical analysis going forward. These districts range in size from 11 to 393 structures with estimated flows of between 2,100 and 72,582 gallons per day (gpd). With the exception of one district (District 1), these are primarily residential areas. District 1 contains the commercial center of the hamlet of Orient and therefore a higher number of commercial and institutional properties. The table below provides the characteristics and flows of each district upon which this proposal is based.

SECTION 1 BACKGROUND
Peconic Green Growth LLC – Orient Wastewater Feasibility Report – Phase 1 1-3
Project Understanding – RFP District Characteristics District Area (acres) Buildings Dwellings Flow (gpd)
1 169 393 230 72,582 2 64 57 48 19,996 3 43 63 44 13,500 4 58 72 48 14,400 5 15 11 7 2,100 6 56 63 51 15,300 7 110 144 144 43,200
1.3.2 Proposed Treatment System PGG has indicated that the study should focus on alternative treatment technologies and collection systems. This phase of study will focus on acceptable areas for subsurface disposal.
1.4 PROJECT AREA CHARACTERISTICS
1.4.1 Location & Population
Orient is located at the very eastern end of Suffolk County on Long Island within the Town of Southold. Orient comprised of approximately 6.1 square miles including residential and commercial uses.
The population in the hamlet has increased by 4.8% from 2000 to 2010, from 709 to 743. The summer population of the hamlet is estimated to be over 1,000.
1.4.2 Environmental Resources Of the 6.1 square mile area, one square mile is water. The majority of this is Hallock Bay (Long Beach Bay), but there are also many tidal streams (NYSDEC Class SA & SC Saline Surface Waters) and wetlands. Many of the wetlands areas are designated as either federal or NYS DEC wetlands. Both of these features are shown on Figure 1.2.

SECTION 1 BACKGROUND
Peconic Green Growth LLC – Orient Wastewater Feasibility Report – Phase 1 1-4
Figure 1.2 Orient Hamlet Wetlands Source: GIS Data from Southampton GIS Department
The hamlet is located on the Nassau-Suffolk sole source Aquifer. A sole source aquifer is one that has been identified by the EPA as one which supplies at least fifty percent (50%) of the drinking water consumed in the area overlying the aquifer.
Orient is considered a Water Supply Sensitive Area under 760-706 of the Suffolk County Sanitary Code. This is defined by the code as a groundwater area separated from a larger regional groundwater system where salty groundwater may occur within the Upper Glacial aquifer. Discharge of industrial wastes in Waste Supply Sensitive Areas is restricted.
Orient also contains two estuaries of national importance, the Long Island Sound and the Peconic Estuary. An estuary is a partially enclosed body of water along the coast where freshwater from rivers and streams meets and mixes with salt water from the ocean.
1.4.3 Flood Zones The FEMA 100 year flood plain boundary is present in the proposed service area as well as Sea, Lake and Overland Surges from Hurricanes (SLOSH) zones. SLOSH zones indicate the areas of flooding that could be anticipated from category 1 – 4 storms. Both of these features are shown on Figure 1.3.

SECTION 1 BACKGROUND
Peconic Green Growth LLC – Orient Wastewater Feasibility Report – Phase 1 1-5
Figure 1.3 Orient Hamlet Floodplain & SLOSH Zones Source: PGG with support from Southampton GIS Department
1.4.4 Geology/Topography/Soils A soil map of the hamlet is shown in Figure 1.3. There are many soil types in and around the hamlet, the most prominent being: Haven, Montauk, Plymouth, Raynham, Riverhead, and Scio. A significant percentage of soils, approximately 15%, are classified as beaches (Bc)or tidal marsh (Tm). The following descriptions are based upon the USDA Natural Resources Conservation Service soil descriptions. Exact soil composition and extents requires field confirmation.
HaA, HaB, HaC – Haven loam is very deep, moderately well drained soil formed in glacial outwash plains. It consists of loamy glaciofluvial deposits over sandy and gravelly glaciofluvial deposits. This soil belongs to Hydrologic Soil Group B. Slope ranges from 0 to 12 percent.
MfB, MfC– Montauk fine sandy loam is somewhat shallow well drained soil formed in glacial moraines. It consists of loamy till over firm sandy till derived from crystalline rock. This soil belongs to Hydrologic Group B. Dense material is typically encountered at 18 to 38 inches. Groundwater is typically encountered at 16 to 36 inches. Slope ranges from 3 to 15 percent.
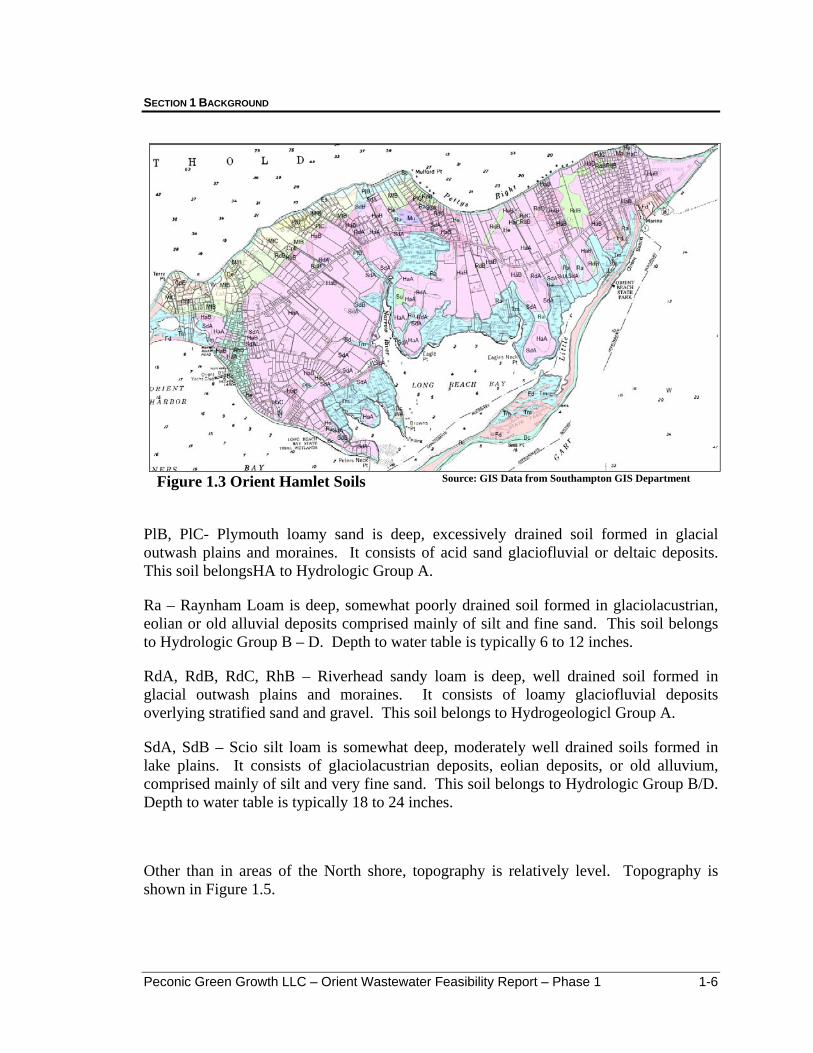
SECTION 1 BACKGROUND
Peconic Green Growth LLC – Orient Wastewater Feasibility Report – Phase 1 1-6
Figure 1.3 Orient Hamlet Soils Source: GIS Data from Southampton GIS Department
PlB, PlC- Plymouth loamy sand is deep, excessively drained soil formed in glacial outwash plains and moraines. It consists of acid sand glaciofluvial or deltaic deposits. This soil belongsHA to Hydrologic Group A.
Ra – Raynham Loam is deep, somewhat poorly drained soil formed in glaciolacustrian, eolian or old alluvial deposits comprised mainly of silt and fine sand. This soil belongs to Hydrologic Group B – D. Depth to water table is typically 6 to 12 inches.
RdA, RdB, RdC, RhB – Riverhead sandy loam is deep, well drained soil formed in glacial outwash plains and moraines. It consists of loamy glaciofluvial deposits overlying stratified sand and gravel. This soil belongs to Hydrogeologicl Group A.
SdA, SdB – Scio silt loam is somewhat deep, moderately well drained soils formed in lake plains. It consists of glaciolacustrian deposits, eolian deposits, or old alluvium, comprised mainly of silt and very fine sand. This soil belongs to Hydrologic Group B/D. Depth to water table is typically 18 to 24 inches.
Other than in areas of the North shore, topography is relatively level. Topography is shown in Figure 1.5.
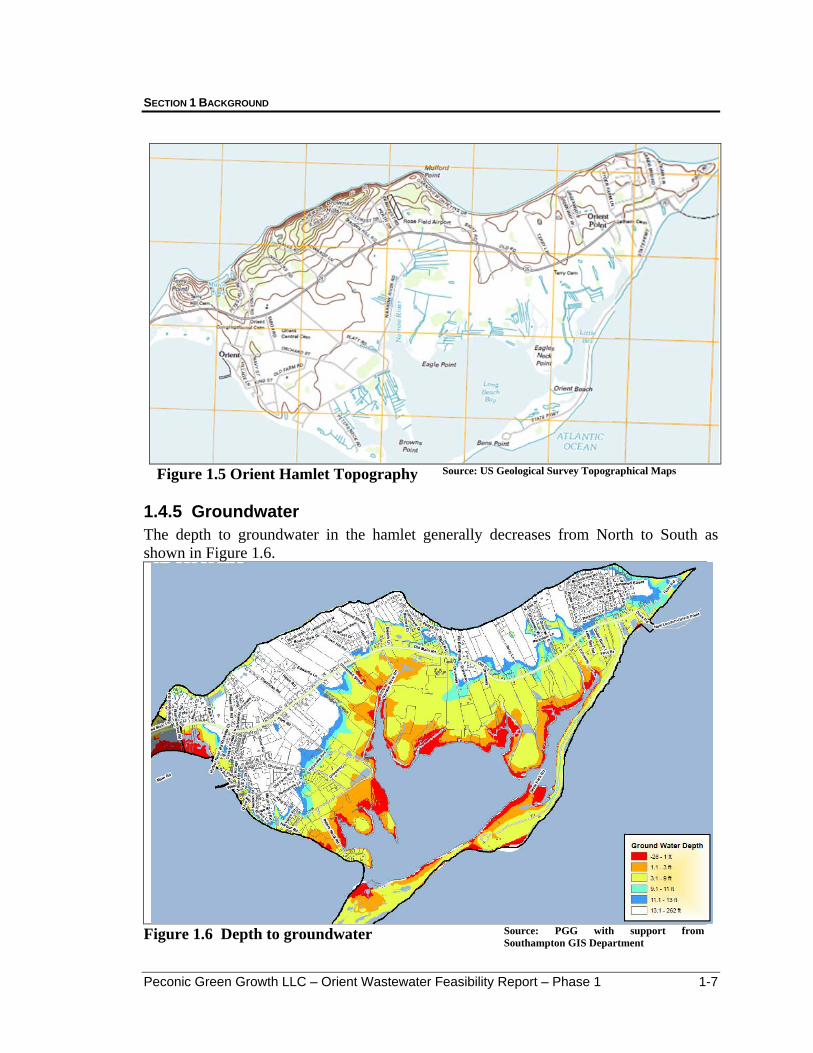
SECTION 1 BACKGROUND
Peconic Green Growth LLC – Orient Wastewater Feasibility Report – Phase 1 1-7
Figure 1.5 Orient Hamlet Topography Source: US Geological Survey Topographical Maps
1.4.5 Groundwater The depth to groundwater in the hamlet generally decreases from North to South as shown in Figure 1.6.
Figure 1.6 Depth to groundwater Source: PGG with support from Southampton GIS Department

SECTION 1 BACKGROUND
Peconic Green Growth LLC – Orient Wastewater Feasibility Report – Phase 1 1-8
It is important to note that groundwater elevations provided in Figure 1.6 have been modified to address impacts by septic system design, but regardless, show the general trend of increasing depths.
1.4.6 Land Use/Zoning Orient is within the Town of Southold. Southold’s zoning laws enable the Town to regulate specific types of development. The zoning districts present in the hamlet are described below:
Residential Low Density District (R40)
Several residential areas throughout Orient.
Minimum 1 acre lot
Residential Low Density District (R80)
Several residential areas throughout Orient.
Minimum two acre lot
Residential Low Density District (R200)
Area south of Route 25, eastern end of Orient.
Minimum lot size of 5 acres
Residential Low Density District (R400)
Orient Beach State Park
Minimum lot size of 10 acres
Hamlet Density Residential District (HD)
One lot north of Route 25, near Orient.
No specified minimum lot size
Resort Residential (RR)
One parcel on Main Street, near the center of Orient.
Zoning to provide opportunity for resort development in waterfront areas or other appropriate areas

SECTION 1 BACKGROUND
Peconic Green Growth LLC – Orient Wastewater Feasibility Report – Phase 1 1-9
Hamlet Business District (HB)
Parcels at the center of Orient.
Zoning to provide for business development in Orient central business areas
General Business District (B)
Parcels near the center of Orient.
Zoning to provide for retail and commercial business development
Marine I District (MI)
Two coastal parcels in the western portion of Orient.
Zoning to provide a waterfront location for water related uses on Town creeks and coves
Marine II District (MII)
One coastal parcel in the eastern portion of Orient.
Zoning to provide a waterfront location for water related uses on major waterways.
The Town zoning indicates that municipal uses are permitted by right in most areas, except Hamlet Density Residential where the specific use is not indicated as in all other areas. Figure 1.7 provides the zoning districts in and around the service area.

SECTION 1 BACKGROUND
Peconic Green Growth LLC – Orient Wastewater Feasibility Report – Phase 1 1-10
Figure 1. 6 Orient Hamlet Zoning Source: Town of Southold Zoning Map
MI
RR B
HD
HB

SECTION 2 WASTEWATER SYSTEM ALTERNATIVES
Peconic Green Growth LLC – Orient Wastewater Feasibility Report – Phase 1 2-1
2.1 INDIVIDUAL DISPOSAL SYSTEMS In many portions of Orient continued use of individual homeowner on-site systems may be appropriate and cost-effective. For parcels in areas with low development density, suitable soils, and a deep depth to groundwater may have conditions that can support continued use of properly designed and constructed individual septic systems.
Smaller lots in areas with dense development would require alternative technologies to provide an acceptable level of treatment to protect drinking water and environmental quality. Several alternative treatment systems discussed in the upcoming Section 2.4 are manufactured in sizes appropriate for use by individual homeowners. Please refer to Section 2.4 for more information on these units.
Alternative treatment systems require mechanical equipment (blowers and/or pumps) in order to operate effectively and, as a result, require more periodic maintenance than a conventional septic system. Typically a licensed operator will need to perform annual or biannual maintenance.
On parcels with very small, non-conforming lot sizes which have no remaining room for an appropriate treatment or disposal areas, upgrades to septic systems will not be effective in correcting current wastewater effluent quality deficiencies. Because upgrades to individual septic systems alone are not expected to be sufficient for all of Orient, other wastewater disposal improvements have been described in the following sections.
2.2 WASTEWATER COLLECTION SYSTEMS There are generally two different types of wastewater collection systems: conventional and alternative.
2.2.1 Conventional Collection System A conventional collection system consists of gravity piping, typically PVC, installed by an open trench method. This involves removing paving or sod on the ground surface, excavating to depths of 5 – 12 feet (typically, can be deeper) installing crushed stone bedding, installing rigid PVC pipe, backfilling and repairing the disturbed surface. Gravity piping must be installed carefully to maintain a constant downward slope. Access for inspection and cleaning is by pre-cast concrete manholes. Generally the smallest gravity main is 8-inches with a minimum slope of 0.4%.
Gravity systems are appropriate when there is sufficient grade to ensure required pipe slopes. However, since maintaining slope is vital to these systems, open trench construction is necessary. Open trench construction in shallow cross-country routes with sufficient space and only requiring loaming and seeding for repair can be very cost effective. Open trench construction through congested paved areas can have expensive restoration costs.
If gravity collection systems do not allow for conveyance to the treatment site, gravity piping will discharge to a pump station. Conventional pump stations typically consist of

SECTION 2 WASTEWATER SYSTEM ALTERNATIVES
Peconic Green Growth LLC – Orient Wastewater Feasibility Report – Phase 1 2-2
a pre-cast concrete wet well with two submersible wastewater pumps. Pump stations discharge to a smaller diameter forcemain. Minimum sanitary forcemain diameter is 4-inches. Pumps must maintain a flow velocity of 2 fps. Sanitary forcemain must have clean out structures every 400 – 500 feet and may require air release structures at high points.
2.2.2 Alternative Collection Systems A significant difference between conventional and alternative collection systems is the use of septic tanks. Septic tanks are typically plastic or concrete tanks which detain raw wastewater discharge from a building service. The tank is baffled which allows solids to settle to the bottom of the tank, and floatable material to form a scum layer at the top of the tank. Wastes in the tank are decomposed by aerobic digestion. Wastewater water leaving the tank, septic tank effluent, is of improved quality as solids remain with the septic tank. Septic tanks must be pumped regularly (typically every 3 – 7 years) or solids will build up in the tank and discharge in the effluent.
Figure 2.1 Typical Septic Tank Source: NYS Department of Health
While conventional wastewater collection systems convey raw wastewater, alternative collection systems typically convey septic tank effluent.
There are alternative gravity and pressure collection systems. Septic tank effluent gravity (STEG) systems use small diameter gravity collector lines to convey septic tank effluent to a treatment location. These gravity lines have a minimum diameter of 4-inches and no minimum slope but typically have a minimum velocity of 0.5 fps. Gravity lines have the

SECTION 2 WASTEWATER SYSTEM ALTERNATIVES
Peconic Green Growth LLC – Orient Wastewater Feasibility Report – Phase 1 2-3
advantage of not requiring any power to operate, and will continue to provide appropriate wastewater service even in cases of electricity outages.
Low pressure sewers consist of smaller diameter force main through which sewer flow is pumped. Septic tank effluent pumps (STEP) or grinder pumps force wastewater through the main regardless of pipe slope. Low pressure sewers can be installed by conventional open trench methods, but smaller diameter piping can also be installed by directional drilling. Directional drilling utilizes exit and entry pits, and access for service connections, but does not disturb the ground surface over the entire pipe length, significantly reducing restoration costs. The minimum diameter for low pressure sewer piping is 2-inches and there are no minimum slope requirements. Similar to conventional sanitary forcemain, low pressure sewers must have regular clean out structures and may require air release valves at high points.
2.3 WASTEWATER TREATMENT SYSTEMS Consistent with collections systems, wastewater treatment systems can be divided into two categories; conventional and alternative systems.
2.3.1 Conventional Treatment System Description Many communities have ‘conventional’ treatment systems which generally consist of the following components:
Primary treatment for the removal of solids
Secondary treatment which typically consists of biological treatment for the removal of additional contaminates
Tertiary treatment for further removal of contaminants by biological, chemical or physical means
Disinfection by chemical treatment or by UV light, and
Discharge to a surface water body or groundwater.
According to the 2012 Report on the Sewage Treatment Plants of Suffolk County, there are 43 municipal plants, 34 of which are considered tertiary plants due to nitrogen removal in their treatment processes. Of these municipal plants, 16 discharge to surface waters.
The largest municipal operator is the Southwest Sewer District which operates 21 municipal treatment plants in Islip, Babylon and Huntington with sizes ranging from 0.035 to 30.5 million gallons per day (mgd).

SECTION 2 WASTEWATER SYSTEM ALTERNATIVES
Peconic Green Growth LLC – Orient Wastewater Feasibility Report – Phase 1 2-4
Figure 2.2 Bergen Point WWTP, West Babylon, NY Source: Bing Maps
2.3.2 Alternative Treatment System Alternative treatment systems typically include:
Use of individual septic tanks for solids removal and primary treatment,
Use of several treatment locations for one community,
Packaged modular secondary/tertiary biological treatment units located at a regional locations near denser development/neighborhoods
Subsurface discharge

SECTION 2 WASTEWATER SYSTEM ALTERNATIVES
Peconic Green Growth LLC – Orient Wastewater Feasibility Report – Phase 1 2-5
Figure 2.3 Alternative Treatment, Dix Hills, NY Source: Newsday
2.3.3 Treatment System Comparison There are several differences between the two treatment plant types. Significant differences include:
Sludge Management
Piping Costs
Operation & Maintenance
One of the most challenging aspects of a conventional wastewater treatment system is solids handling. Conventional wastewater treatment systems typically consist of screening for large solids removal, comminutors, large above ground settling basins to remove the remaining solids, pumps to remove the collected solids, digesters to further break down sludge or mechanical dewatering devices and then loading facilities for trucking to conventional landfills. These components are generally expensive to build and operate especially at a small scale.
With many alternative treatment systems, solids removal occurs at each parcel or a combination of a few parcels. This allows typical residential septic tank pumpers and haulers to handle solids removal and disposal. Typically the community is responsible

SECTION 2 WASTEWATER SYSTEM ALTERNATIVES
Peconic Green Growth LLC – Orient Wastewater Feasibility Report – Phase 1 2-6
for all maintenance of septic tanks, ensuring that efficient solids removal is occurring. However, this does require the community to obtain easements from the parcel owner to be able to access and maintain the septic tanks. In Suffolk County there are several wastewater treatment plants which accept wastewater from pumped septic tanks from licensed septic haulers.
By removing solids before the wastewater is conveyed to a treatment location, a wastewater collection system can be sized at a smaller diameter, lowering installation costs. For instance gravity lines can be reduced to 4-inches where an 8-inch diameter is normally required. Pressure lines can be reduced to 2-inches where 4-inches would normally be required.
However, septic tank effluent systems that utilize pumping may be difficult to manage during power outages. Frequently, a home with no municipal wastewater services has no municipal water service either. Thus if a power outage occurs, the well is without power, as well as the wastewater system pump. If a home has a generator, it typically will be sized to accommodate the well pump, as well as the wastewater pump, also avoiding a conflict. However, if a home with municipal water service, which typically remains unaffected by power outage also, has septic wastewater pumps as part of an alternative collection system, there may be a continued source of wastewater, with no means of pumping. If a sustained power outage lasted for several days, the municipality would need to pump each septic tank into the collection system. For a conventional collection system, this would require simply providing emergency power at a central pump station, rather than requiring service at many individual systems. Both conventional and alternative systems that utilize gravity collection avoid these problems. All treatment systems, conventional and alternative, require emergency power at the main treatment location. In general, conventional wastewater treatment facilities are treating higher flows, and have more complex treatment systems due to on-site sludge management. For proper operation, conventional wastewater treatment facilities require a full time licensed operator and generally at least one other trained staff member. Alternative treatment systems typically have smaller flows and simpler treatment systems, thus staff is usually part time. Due to Orient’s the rural nature, and the style of development which includes several densely populated areas separated by large areas of much smaller population, further consideration of decentralized treatment is appropriate. Additional information on alternative treatment technologies has been presented in the following section.
2.4 ALTERNATIVE TREATMENT TECHNOLOGIES An alternative treatment system accomplishes treatment in two locations; primary treatment occurs in the on-site septic tanks, and secondary/tertiary treatment which occurs at a site where all the flow has been collected.

SECTION 2 WASTEWATER SYSTEM ALTERNATIVES
Peconic Green Growth LLC – Orient Wastewater Feasibility Report – Phase 1 2-7
Treatment efficiency for small systems is generally characterized by their efficiency at removal of organic constituents and solids. The most commonly used parameter to define the organic strength of municipal wastewater is biochemical oxygen demand (BOD). BOD is the quantity of dissolved oxygen utilized by microorganisms in the aerobic oxidation of the organic matter in wastewater over a period of time. The depletion of dissolved oxygen in wastewater is directly related to the amount of organic matter present in the wastewater.
The quantity of solids in wastewater is typically expressed as total suspended solids (TSS). Suspended solids are those removable by filtration of settling. Wastewater may also have quantities of dissolved solids, which require additional treatment for removal.
Another parameter used to gauge the strength of wastewater is nitrogen. Common forms of nitrogen are ammonia, nitrite, and nitrate. Nitrogen is used by plants for photosynthesis, and is an important component in fertilizer. Large quantities of nitrogen in wastewater discharged to a water body can cause growth of algae. Ammonia is considered a serious water pollutant as it is toxic to fish. Nitrate can easily pass through the soil to the groundwater, where it can accumulate to high levels over time, potentially contaminating drinking water sources. Typically a permit for subsurface wastewater discharge will have limitations set on ammonia (NH3). Typical individual disposal system absorption fields remove little or no nitrogen from the septic tank effluent.
Primary treatment by septic tank is effective at removing quantities of BOD and TSS and some nitrogen species. Table 2.1 below provides typical septic tank influent and effluent concentrations.
Table 2.1 Septic Tank Influent & Effluent Concentrations
Parameter Influent
Concentration Effluent
Concentration BOD 350 mg/l 150 mg/l TSS 400 mg/l 40 mg/l
NH3-N 70 mg/l 50 mg/l FOG 150 mg/l 20 mg/l
There are many suitable technologies available for wastewater treatment. However there are minimum criteria that each system must meet:
Ability to meet regulatory effluent limits
Suffolk County Department of Health Services familiarity with the system
Suffolk County has formally evaluated many innovation/alternative onsite sewage disposal system capable of denitrification, ranging from individual home systems to small plants with capacities of 30,000 gpd (approximately 100 homes). A summary of their evaluation is included in Appendix A. The following systems are approved for use in Suffolk County.
Advantex by Orenco followed by Nitrex
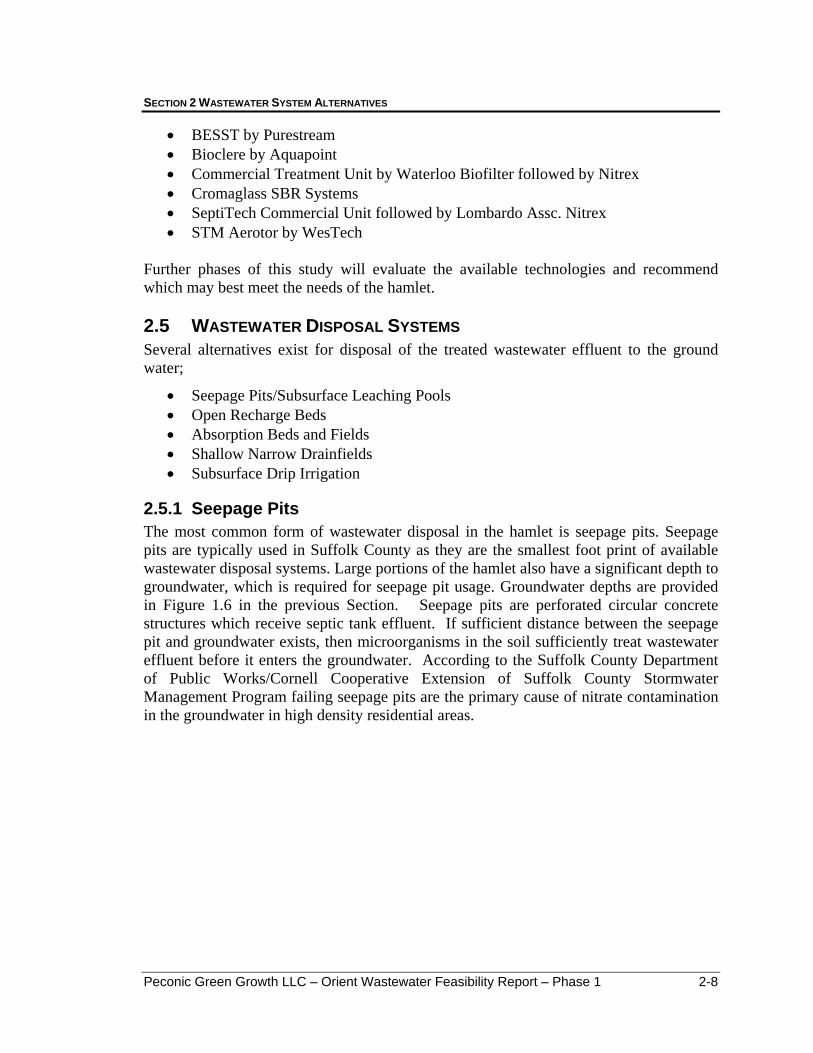
SECTION 2 WASTEWATER SYSTEM ALTERNATIVES
Peconic Green Growth LLC – Orient Wastewater Feasibility Report – Phase 1 2-8
BESST by Purestream Bioclere by Aquapoint Commercial Treatment Unit by Waterloo Biofilter followed by Nitrex Cromaglass SBR Systems SeptiTech Commercial Unit followed by Lombardo Assc. Nitrex STM Aerotor by WesTech
Further phases of this study will evaluate the available technologies and recommend which may best meet the needs of the hamlet. 2.5 WASTEWATER DISPOSAL SYSTEMS Several alternatives exist for disposal of the treated wastewater effluent to the ground water;
Seepage Pits/Subsurface Leaching Pools Open Recharge Beds Absorption Beds and Fields Shallow Narrow Drainfields Subsurface Drip Irrigation
2.5.1 Seepage Pits The most common form of wastewater disposal in the hamlet is seepage pits. Seepage pits are typically used in Suffolk County as they are the smallest foot print of available wastewater disposal systems. Large portions of the hamlet also have a significant depth to groundwater, which is required for seepage pit usage. Groundwater depths are provided in Figure 1.6 in the previous Section. Seepage pits are perforated circular concrete structures which receive septic tank effluent. If sufficient distance between the seepage pit and groundwater exists, then microorganisms in the soil sufficiently treat wastewater effluent before it enters the groundwater. According to the Suffolk County Department of Public Works/Cornell Cooperative Extension of Suffolk County Stormwater Management Program failing seepage pits are the primary cause of nitrate contamination in the groundwater in high density residential areas.
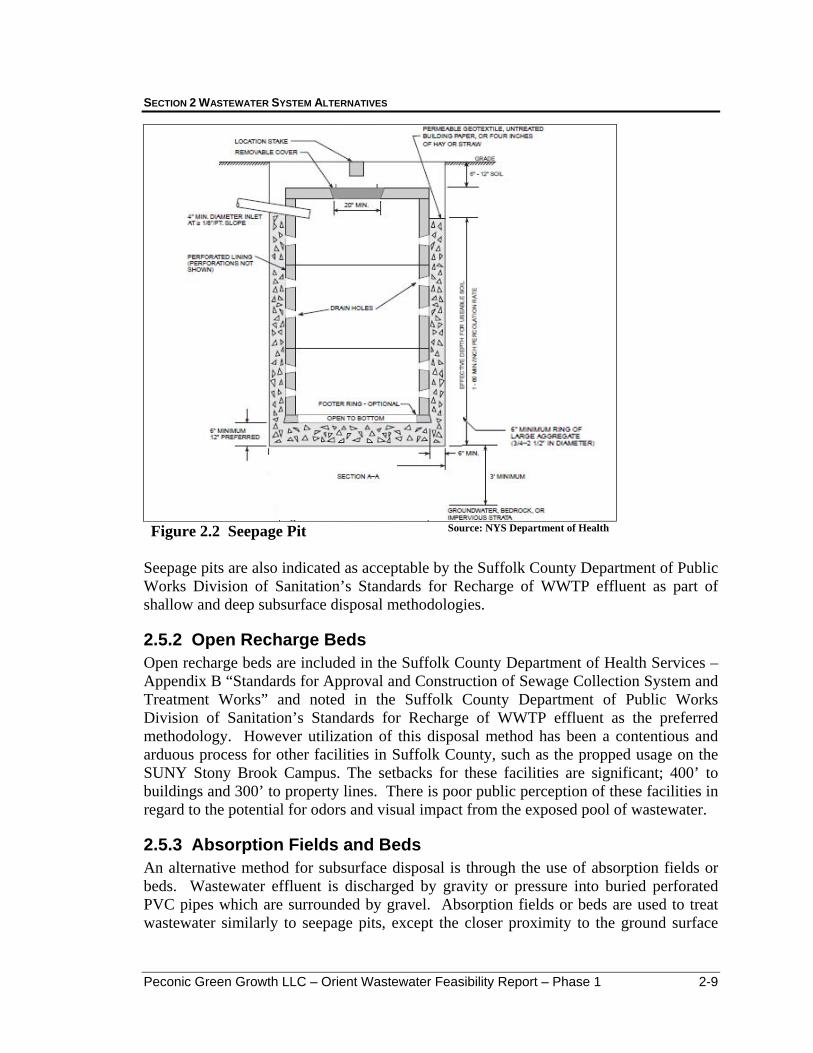
SECTION 2 WASTEWATER SYSTEM ALTERNATIVES
Peconic Green Growth LLC – Orient Wastewater Feasibility Report – Phase 1 2-9
Figure 2.2 Seepage Pit Source: NYS Department of Health
Seepage pits are also indicated as acceptable by the Suffolk County Department of Public Works Division of Sanitation’s Standards for Recharge of WWTP effluent as part of shallow and deep subsurface disposal methodologies.
2.5.2 Open Recharge Beds Open recharge beds are included in the Suffolk County Department of Health Services – Appendix B “Standards for Approval and Construction of Sewage Collection System and Treatment Works” and noted in the Suffolk County Department of Public Works Division of Sanitation’s Standards for Recharge of WWTP effluent as the preferred methodology. However utilization of this disposal method has been a contentious and arduous process for other facilities in Suffolk County, such as the propped usage on the SUNY Stony Brook Campus. The setbacks for these facilities are significant; 400’ to buildings and 300’ to property lines. There is poor public perception of these facilities in regard to the potential for odors and visual impact from the exposed pool of wastewater.
2.5.3 Absorption Fields and Beds An alternative method for subsurface disposal is through the use of absorption fields or beds. Wastewater effluent is discharged by gravity or pressure into buried perforated PVC pipes which are surrounded by gravel. Absorption fields or beds are used to treat wastewater similarly to seepage pits, except the closer proximity to the ground surface

SECTION 2 WASTEWATER SYSTEM ALTERNATIVES
Peconic Green Growth LLC – Orient Wastewater Feasibility Report – Phase 1 2-10
makes the system more aerobic, and the wastewater is dispersed over a much larger soil surface area.
Figure 2.3 Absorption Field Source: NYS Department of Health
2.5.4 Absorption Fields and Beds When any of the previously discussed absorption methodologies are used after secondary treatment, they are primarily intended for discharge of the treated effluent into the groundwater. However, there a dispersal method heavily researched by the University of Rhode Island and the Rhode Island Department of Environmental Management, Shallow Narrow Drainfields (SND), have been shown to effectively reduce nitrogen in effluent. SNDs have been studied in coastal regions of Rhode Island to evaluate their nitrogen reduction capabilities. This is important, as Rhode Island’s coastal areas were formed geologically in the same fashion as long island, and typically have the same progressions of sandy areas, sandy loam, loam and silt loam. Additional information on SNDs is provided in Appendix B. In general, a 33% - 73% reduction in nitrogen is anticipated utilizing the SND.

SECTION 2 WASTEWATER SYSTEM ALTERNATIVES
Peconic Green Growth LLC – Orient Wastewater Feasibility Report – Phase 1 2-11
Figure 2.4 Shallow Narrow Drainfield Cross Section Source: RI Dept. of Env. Management
2.5.5 Irrigation Wastewater Reuse Another potential methodology for disposing of treated wastewater effluent is subsurface drip irrigation. Subsurface drip irrigation technologies apply water to the root zone using perforated small diameter piping or porous diffusers, placed 6 to 12 inches below the soil surface.
Disposal of recycled water through subsurface drip irrigation will provide a valuable source of nitrogen for nursery stock, and an efficient water reuse method. Once the needs of the facility are better determined, a design could be completed that utilizes this appropriate technology.
Additionally, reclaimed wastewater can be utilized for spray or surface drip applications. Treatment would need to include UV disinfection.

SECTION 2 WASTEWATER SYSTEM ALTERNATIVES
Peconic Green Growth LLC – Orient Wastewater Feasibility Report – Phase 1 2-12
Figure 3.7 Drip Irrigation System Source: Geoflow, Inc.
2.6 WASTEWATER DISPOSAL QUALITY Based upon data from the Suffolk County Department of Health, and the NYS Code of Regulations Part 703: Surface Water and Groundwater Effluent Limitations for community systems, the following discharge limits are presumed:
Table 2.2Effluent Characteristics
Wastewater Component Effluent BOD5 < 30 mg/lTSS < 30 mg/lTDS 1,000 mg/l pH 6.5 – 8.5
Nitrogen < 10 mg/l

SECTION 3 TREATMENT SITE IDENTIFICATION
Peconic Green Growth LLC – Orient Wastewater Feasibility Report – Phase 1 3-1
3.1 TREATMENT SYSTEM SITING CONSTRAINTS Determining the correct siting for a wastewater treatment facility is challenging, however the use of alternative treatment technologies, with their low visual, audio and odor impact, allow for a much greater number of sites to be considered. Preliminary potential sites were identified by preliminary map review using the criteria provided in Table 3.1.
Table 3.1 Treatment Site Initial Screening
Criteria Initial Screening Vacant parcels with usable land less than 3 acres Excluded
Occupied Parcels with less than 5 acres Excluded. Assumes 5 acres needed to buffer existing house lot
100 year flood plains and SLOSH areas Excluded State and Federal Wetlands Excluded Streams, wetlands or protected water bodies Excluded areas within 100’ Steeply sloped areas (>15%) Excluded
Mapping showing each of the application of these criteria is found in Figure 3.1.

SECTION 3 TREATMENT SITE IDENTIFICATION
Peconic Green Growth LLC – Orient Wastewater Feasibility Report – Phase 1 3-2
Fig
ure
3.1
– P
arce
l Su
itab
ilit
y fo
r W
aste
wat
er D
isp
osal

SECTION 3 TREATMENT SITE IDENTIFICATION
Peconic Green Growth LLC – Orient Wastewater Feasibility Report – Phase 1 3-3
Based upon the parcels eliminated by the criteria presented in Table 3.1, twenty sites acceptable for wastewater treatment, based upon land review only, were determined and are presented on Table 3.2, from West to East.
Table 3.2 Potential Wastewater Treatment Sites
Parcel # Tax Map #
Property Owner
Property Location Acres Comment
1 2500.400.11009 Morton Orchard
St. 13.5
Nursery in Ag district, parcel in SLOSH, may have subdivision plans
2 2700.100.2003 Guadagno Orchard
St. 6.0
Farmed field in Ag. District, small portion of parcel in SLOSH, may have subdivision plans
3 1800.200.23001 Oysterponds
School District Route 25 12.9 School playing fields
behind school building 4 1800.200.33000 C&P Healy Corp Route 25 8.0 One large structure 5 1800.200.34000 Boyle Route 25 22.3 Several large structures
6 1800.600.4001 Latham Platt Road 11.7
Ag District, garage, farmed fields, portion of
parcel in SLOSH
7 1800.600.5002 Apostle Trust Route 25 4.2
Ag District, farmed fields, Suffolk County owns development rights
8 1800.600.5003 Apostle Trust Route 25 3.1
Ag District, farmed fields, Suffolk County owns development rights
9 1800.600.14009 Khedouri Ezair
Corp. Route 25 62.4
Ag District, farmed/fallow fields, southern half of
parcel in SLOSH, Town of Southold owns
development rights
10 1800.300.9009 Caslenova Route 25 11.3
Ag District, farmed/fallow fields, Suffolk County
owns development rights 11 1800.300.30003 N. Brown LLC Route 25 28.5 Ag District, farmed fields
12 1800.400.1003 Oysterponds
Corp. Route 25 16.8
Ag District, farmed fields, Peconic Land Trust
Preservation Easement
13 1800.400.7007
Sepenoski Family Farm
LLC Route 25 18.8
Ag District, farmed fields, Town of Southold owns
development rights
14 1300.200.8002 Benjamin Heath Drive 22.8 Ag District, farmed fields
15 1400.200.29003 Orient West LLC Old Road 8.7 Farmed field, southern
portion of parcel in SLOSH
16 1400.200.29004 Orient Point LLC Old Road 4.6
Farmed field with barn, southern portion of parcel
in SLOSH

SECTION 3 TREATMENT SITE IDENTIFICATION
Peconic Green Growth LLC – Orient Wastewater Feasibility Report – Phase 1 3-4
Table 3.2 (cont.) Potential Wastewater Treatment Sites
Parcel # Tax Map #
Property Owner
Property Location Acres Comment
17 1900.200.12002 Orient East LLC Old Road 16.8
Fallow field, landing strip, southern portion of parcel
in SLOSH
18 2000.100.2002 Whitsit Terry Lane 19.2
Ag District, farmed fields, portion of parcel in
SLOSH, Protected Town of Southold open space
19 2000.100.3007 Egan Route 25 30.6
Ag District, farmed fields, wooded area, portion of
parcel in SLOSH, Protected Town of
Southold open space
20 1500.200.17006 Amelias Sound Properties Inc. Route 25 32.3
Fallow field, southern portion of parcel in SLOSH
These sites are shown on Figure 3.2.
Figure 3.2 Potential Wastewater Treatment Sites

SECTION 3 TREATMENT SITE IDENTIFICATION
Peconic Green Growth LLC – Orient Wastewater Feasibility Report – Phase 1 3-5
3.2 PRELIMINARY PARCEL SCREENING After the parcels identified by the matrix constraints were determined, additional review of the parcels was completed. Based upon more detailed review of land use and other constraints, additional parcels were excluded from further review.
The most common cause for exclusion was active farming of food crops. Food crops are annual planting which require plowing and replanting every year. This would be a high potential for disturbance of any wastewater disposal system. Also, utilizing wastewater for irrigation of edible products requires additional treatment including filtration and disinfection which would significantly impact treatment costs.
Table 3.3 Preliminary Wastewater Treatment Site Screening
Parcel #
Property Owner Comment Action
1 Morton
Nursery use may be compatible with wastewater disposal, parcel in Ag. District, 4.8 acres of parcel in SLOSH leaving 8.7 acres.
Include in further study
2 Guadagno
Fallow field or pasture Ag. District, <0.5 acre parcel in SLOSH leaving 5.5 acres available for disposal, Ag
district requirements must be adhered to Include in
further study
3
Oysterponds School District
Elementary School playing fields behind school building, wastewater disposal in playing field is compatible use.
Advantage of not being in Ag. District. Include in
further study
4 C&P Healy
Corp This parcel appears to be a horse farm. Include in
further study
5 Boyle This parcel appears to be a horse farm. Include in
further study
6 Latham This parcel appears to be a vegetable farm. Exclude from
further analysis
7 Apostle Trust This parcel appears to be a berry farm.
Exclude from further analysis
8 Apostle Trust This parcel appears to be a berry farm
Exclude from further analysis
9 Khedouri
Ezair Corp. Over 20 acres are not in SLOSH. Town development
rights. Include in
further study
10 Caslenova Ag District, County development rights. Include in
further study
11 N. Brown
LLC
The southern portion of this is a plowed farm field. Plowing would be incompatible with effluent disposal.
The northern portion of this parcel is mature trees. Exclude from
further analysis
12 Oysterponds
Corp. This parcel is a plowed farm field. Plowing is
incompatible with effluent disposal. Exclude from
further analysis
13
Sepenoski Family Farm
LLC This parcel is a plowed farm field. Plowing is
incompatible with effluent disposal. Exclude from
further analysis
14 Benjamin This parcel appears to be a vineyard. Exclude from
further analysis
15 Orient West
LLC This parcel is a plowed farm field. Plowing is
incompatible with effluent disposal. Exclude from
further analysis

SECTION 3 TREATMENT SITE IDENTIFICATION
Peconic Green Growth LLC – Orient Wastewater Feasibility Report – Phase 1 3-6
16 Orient Point
LLC
This parcel appears to be a fallow field. If no longer used regularly for agriculture, maybe available for
disposal. This parcel is not in the Ag. District. Include in
further study
17 Orient East
LLC This parcel appears to contain brush to mature trees.
This parcel is not in the Ag. District. Include in
further study
18 Whitsit Parcel is a plowed field in the Ag. District, Town
protected open space. Exclude from
further analysis
19 Egan
The southern portion of this is a plowed farm field in SLOSH zone. The northern portion is mature trees.
Town protected open space. Exclude from
further analysis
20
Amelias Sound
Properties Fallow field with southern portion in SLOSH. Include in
further study
As provided in the Suffolk County Department of Health Services – Appendix B “Standards for Approval and Construction of Sewage Collection System and Treatment Works”, the following assumptions were made in regard to the treated wastewater effluent disposal:
- 2.3 gpd/sq ft application rate. Per Suffolk County guidance a 5 gpd/sq ft application rate is permissible (10 gpd/sqft is permitted with filtered wastewater), but without detailed treatment process analysis, we are recommending use of a use more conservative number)
- a 100% reserve/expansion area - a minimum 25’ setback to property lines - a minimum 100’ setback to surface waters or wetlands - a minimum 200’ setback from surrounding wells (assumed 200’ from property line
on small adjacent parcels and assumed to be in general area of building on large buildings on adjacent parcels)
- A field efficiency of 30% was assumed. This means that of the available area, it was assumed that 30% was actually used as disposal area, and the remaining was separation between disposal practices, areas where manifold piping was, and other spacing.
Table 3.3 provides the estimated wastewater disposal capability of each parcel.
Table 3.4 Preliminary Wastewater Disposal Capacity
Parcel ID
Total Area
(acres)
Useable Area
(acres)
Field Area
(acres)Absorption
Area (sf)
Disposal Capacity
(gpd) 1 13.5 0.70 0.35 4,590 10,557
2 6 3.72 1.86 24,300 55,890
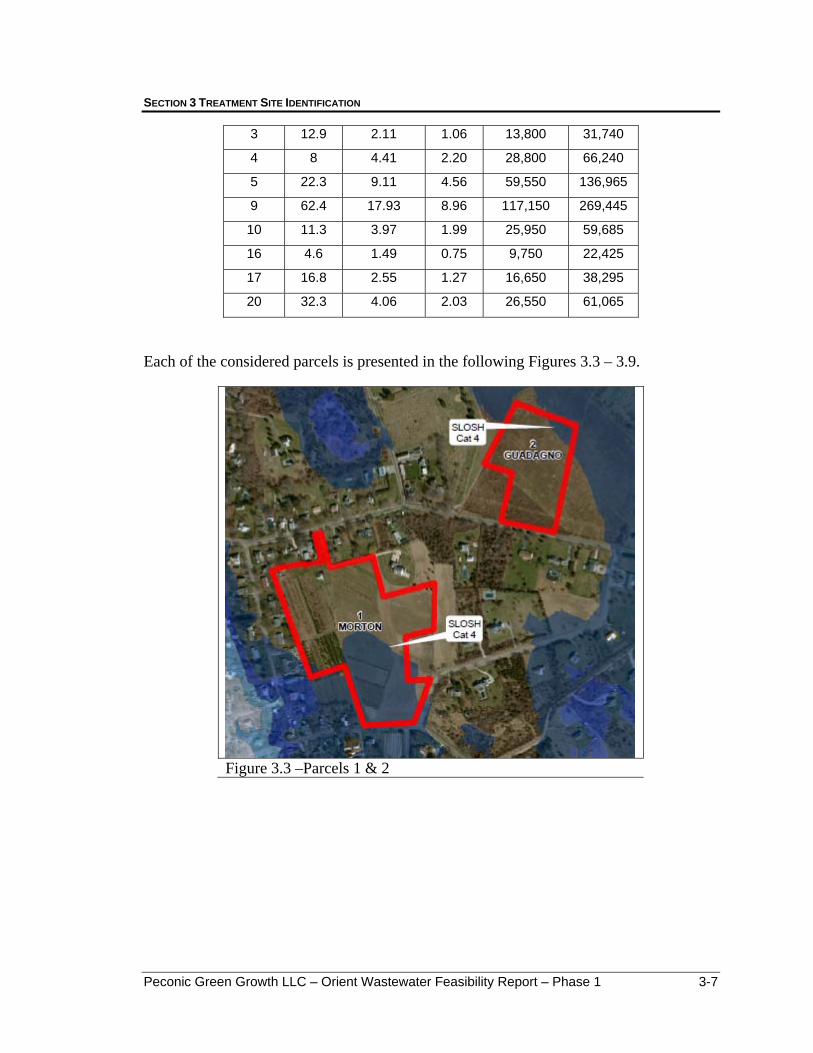
SECTION 3 TREATMENT SITE IDENTIFICATION
Peconic Green Growth LLC – Orient Wastewater Feasibility Report – Phase 1 3-7
3 12.9 2.11 1.06 13,800 31,740
4 8 4.41 2.20 28,800 66,240
5 22.3 9.11 4.56 59,550 136,965
9 62.4 17.93 8.96 117,150 269,445
10 11.3 3.97 1.99 25,950 59,685
16 4.6 1.49 0.75 9,750 22,425
17 16.8 2.55 1.27 16,650 38,295
20 32.3 4.06 2.03 26,550 61,065
Each of the considered parcels is presented in the following Figures 3.3 – 3.9.
Figure 3.3 –Parcels 1 & 2

SECTION 3 TREATMENT SITE IDENTIFICATION
Peconic Green Growth LLC – Orient Wastewater Feasibility Report – Phase 1 3-8
Figure 3.4 Parcels 3, 4 & 5

SECTION 3 TREATMENT SITE IDENTIFICATION
Peconic Green Growth LLC – Orient Wastewater Feasibility Report – Phase 1 3-9
Figure 3.5 – Parcel 9
Figure 3.6 – Parcel 10
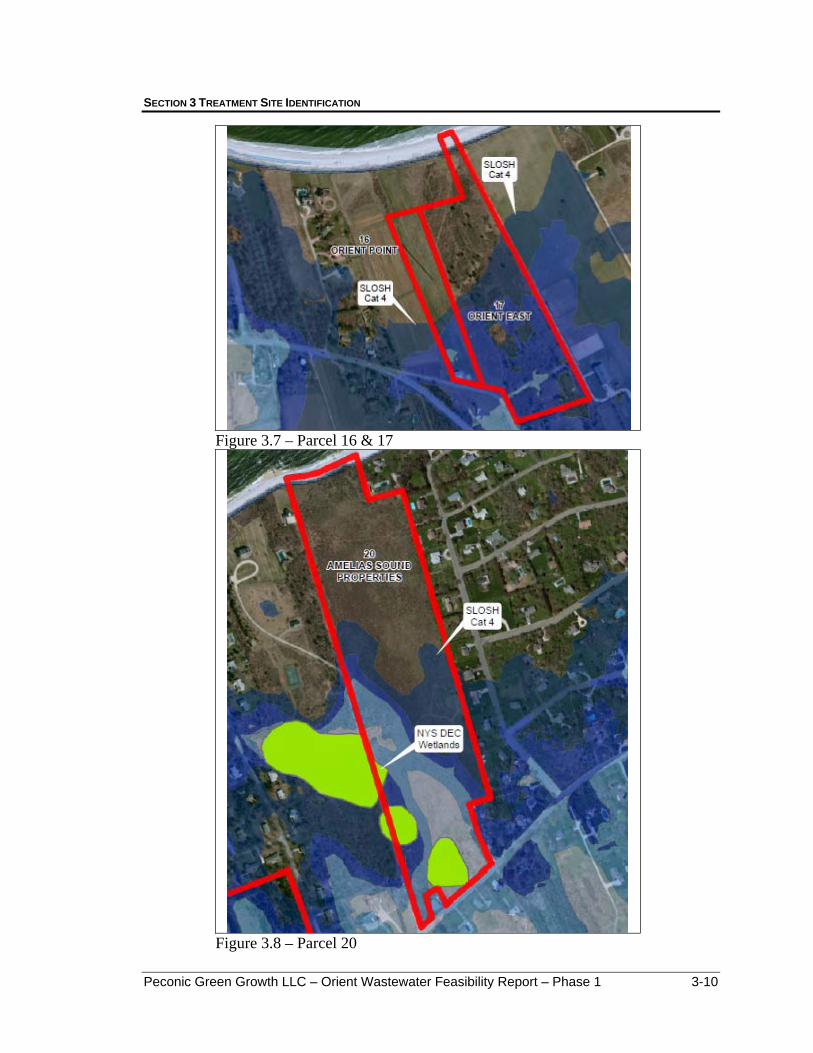
SECTION 3 TREATMENT SITE IDENTIFICATION
Peconic Green Growth LLC – Orient Wastewater Feasibility Report – Phase 1 3-10
Figure 3.7 – Parcel 16 & 17
Figure 3.8 – Parcel 20
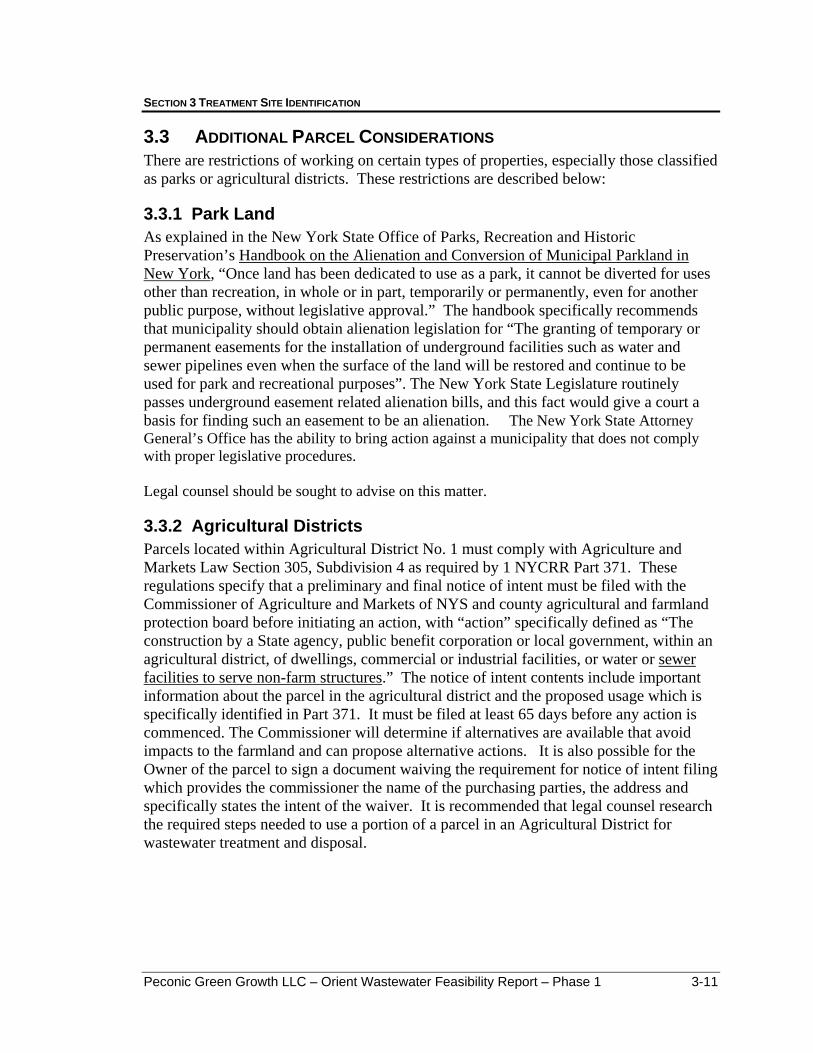
SECTION 3 TREATMENT SITE IDENTIFICATION
Peconic Green Growth LLC – Orient Wastewater Feasibility Report – Phase 1 3-11
3.3 ADDITIONAL PARCEL CONSIDERATIONS There are restrictions of working on certain types of properties, especially those classified as parks or agricultural districts. These restrictions are described below:
3.3.1 Park Land As explained in the New York State Office of Parks, Recreation and Historic Preservation’s Handbook on the Alienation and Conversion of Municipal Parkland in New York, “Once land has been dedicated to use as a park, it cannot be diverted for uses other than recreation, in whole or in part, temporarily or permanently, even for another public purpose, without legislative approval.” The handbook specifically recommends that municipality should obtain alienation legislation for “The granting of temporary or permanent easements for the installation of underground facilities such as water and sewer pipelines even when the surface of the land will be restored and continue to be used for park and recreational purposes”. The New York State Legislature routinely passes underground easement related alienation bills, and this fact would give a court a basis for finding such an easement to be an alienation. The New York State Attorney General’s Office has the ability to bring action against a municipality that does not comply with proper legislative procedures. Legal counsel should be sought to advise on this matter.
3.3.2 Agricultural Districts Parcels located within Agricultural District No. 1 must comply with Agriculture and Markets Law Section 305, Subdivision 4 as required by 1 NYCRR Part 371. These regulations specify that a preliminary and final notice of intent must be filed with the Commissioner of Agriculture and Markets of NYS and county agricultural and farmland protection board before initiating an action, with “action” specifically defined as “The construction by a State agency, public benefit corporation or local government, within an agricultural district, of dwellings, commercial or industrial facilities, or water or sewer facilities to serve non-farm structures.” The notice of intent contents include important information about the parcel in the agricultural district and the proposed usage which is specifically identified in Part 371. It must be filed at least 65 days before any action is commenced. The Commissioner will determine if alternatives are available that avoid impacts to the farmland and can propose alternative actions. It is also possible for the Owner of the parcel to sign a document waiving the requirement for notice of intent filing which provides the commissioner the name of the purchasing parties, the address and specifically states the intent of the waiver. It is recommended that legal counsel research the required steps needed to use a portion of a parcel in an Agricultural District for wastewater treatment and disposal.

SECTION 3 TREATMENT SITE IDENTIFICATION
Peconic Green Growth LLC – Orient Wastewater Feasibility Report – Phase 1 3-12
3.3.3 Development Rights In a purchase of development rights program, a landowner voluntarily sells the parcels development rights to a governmental agency or land trust. In the case of farmland, the agency typically pays the farmer the difference between the agricultural value of the land, and the land’s potential development value. When the property is sold, an easement which restricts the use of the land for agricultural uses incorporated in the title. Private ownership of the parcel is maintained.
There are several parcels where development rights of the parcel have been purchased by the Town or County. Easements on development rights are not consistent from parcel to parcel, but most easements limit use of property to agricultural production. While certainly it seems that some form of agricultural production could be maintained while also using the property for wastewater disposal, it is likely to be a challenging process to utilize parcels with development right easements for wastewater disposal purposes. These parcels include: parcel #9, Khedouri Ezair Corp., and parcel #10, Caslenova. While these parcels have been included on the list for further study, legal review of the specifics of the easements for these two parcels should be completed to determine siting feasibility.

SECTION 4 PROJECT ADVANCEMENT
PGG – Hamlet of Orient – Wastewater Feasibility Report - Phase 1 4-1
4.1 ADDITIONAL STUDY PHASES
To complete the Wastewater Feasibility Report, the following additional phases are recommended.
4.1.1 Treatment Site Identification The effort to identify appropriate treatment sites should continue with onsite soils review of each of the feasible sites needs to be completed to confirm the NRCS soil data. A biologist may need to complete the wetlands delineation.
4.1.2 Collection and Treatment Alternative Evaluation In concert with continuing to refine acceptable treatment sites, a complete analysis on the collection and treatment methodologies presented in this report needs to be completed and a preferred treatment alternative identified. The analysis should be based upon costs, regulatory compliance, and appropriateness for the community and expandability. As there are significant difference in space requirements, identifying the preferred technology will impact capacity of feasible disposal parcels, thus both aspects need to be considered together.
4.1.3 System Recommendations Combining the results of the parcel identification, and the collection and treatment system analysis a comprehensive wastewater approach for the 7 districts should be completed, and project phasing should be recommended.
4.1.4 Costs & Funding The engineering report should include:
An estimate of probable construction and operation and maintenance costs for the recommended alternative.
An estimate of sewer use rates for each parcel using the Equivalent Dwelling Unit (EDU) methodology.
The funding required to reach the maximum rate of $500 per EDU will be calculated.
4.1.5 Implementation The report should present any additional tasks that will need to be completed before design could begin. These could include: regulatory agency concurrence, wetlands delineation, additional subsurface exploration, easement procurement, and SEQR preparation and submission.

SECTION 5 REFERENCES
PGG – Hamlet of Orient – Wastewater Feasibility Report - Phase 1 5-1
Standards for Approval of Plans and Construction for Sewage Disposal Systems for Other than Single-Family Residences, Suffolk County Department of Health Services Division of Environmental Quality, 2008.
Alternative On-Site Sewage Disposal Systems, Task IX – Summary Report, Suffolk County, New York Department of Health Services, Office of Wastewater Management, 2013.
Rhode Island Department of Environmental Management, Guidelines fo rhte Design and Use of Sand Filters and Pressureized Shallow-Narrow Drainfields, 2010.
Season Variation in Nitrogen Leaching from Shallow-Narrow Drainfields, Holden et. al., 2004.
Design Standards for Intermediate-Sized Wastewater Treatment Systems, New York State Department of Environmental Conservation, 2012.
Individual Residential Wastewater Treatment Systems Design Handbook, New York State Department of Health, 1996.
Recommended Standards for Wastewater Facilities, Great Lakes-Upper Mississippi River Board of State and Provincial Public Health and Environmental Managers, 2004 Edition.
Suffolk County Sanitary Coe Standards, Suffolk County Department of Health Services, November 2011.
Suffolk County Comprehensive Water Resources Management Plan, CDM et. al, August 2010.
Sewage Treatment Plants in Suffolk County: Case Studies, Stony Brook State University of New York, Long Island Groundwater Research Institute, 2011. G:\Projects\3941302\Documents\Report\WW Feasibility Study 12-23-2013.docx

APPENDIX A ALTERNATIVE ON-SITE SEWAGE DISPOSAL SYSTEMS –
EXECUTIVE SUMMARY

SUFFOLK COUNTY, NEW YORK DEPARTMENT OF HEALTH SERVICES OFFICE OF WASTEWATER MANAGEMENT ALTERNATIVE ON-SITE SEWAGE DISPOSAL SYSTEMS TASK IX–SUMMARY REPORT
H2M Project No.: SCHS 09-01 Draft: August 2012
Final: February 2013 Prepared by: Ho lzmacher , McLendon & Mur re l l , P .C. D iv is ion o f Was tewate r Eng ineer ing 175 P ine lawn Road , Su i te 308 Me lv i l l e , New York 11747
SUFFOLK COUNTY DEPARTMENT OF HEALTH SERVICES
OFFICE OF WASTEWATER MANAGEMENT
TASK IX – SUFFOLK COUNTY DEPARTMENT OF HEALTH SERVICES ALTERNATIVE
ON-SITE SEWAGE DISPOSAL SYSTEMS STUDY SUMMARY REPORT
3 H2M architects + engineers
EXECUTIVE SUMMARY
The Suffolk County Department of Health Services (SCDHS) retained the services of Holzmacher,
McLendon and Murrell, P.C. (H2M) to determine the feasibility of instituting alternative on-site
wastewater treatment systems into decentralized sewered communities or in single family residential
properties that could better manage total nitrogen discharged to groundwater. The project objective, as
stated in the County’s Request for Proposal, is to investigate the performance, installation and design
costs, economic benefits, and operation and maintenance requirements for alternative on-site sewage
disposal systems for projects generating a flow less than 30,000 gpd. The investigation was broken down
into two different treatment categories. The first category was defined as single-family residential
dwellings with flows from 300 to 1,000 gallons per day (GPD); the second category was defined as other
than single-family comprised of commercial, industrial, or high-density residential properties, with flows
from 1,000 GPD to 30,000 GPD. For the purposes of this report, the first flow category will be referred to
as residential applications, while the second flow category will be referred to as commercial applications.
The investigation was broken down into the following nine (9) tasks composed of reports and progress
meetings with the Department.
Task I, III, V, VI – Progress meetings to discuss previously submitted Task Reports
Task II – Review of Standards, Codes, and Regulations for On-Site System Technologies
Task IV A and B – Selection, Sampling, and Evaluation of AOSSDS
Task IV C – System Assessment and Acceptance using SCDHS Requirements
Task VI – Cost and Benefit Analysis
Task VIII – Evaluations of Conditions and Restrictions Under Which AOSSDS are Permitted for
use in Massachusetts, Rhode Island, New Jersey, and Maryland
Task IX – Study Summary, Findings and Recommendations
Overall study conclusions and recommendations for the individual residential applications:
The NitrexTM System was the only on-site treatment system that consistently met the 10 mg/l total
nitrogen discharge requirement.
Suffolk County currently utilizes the practice of limiting the building density in order to protect
both the drinking and surface water supplies in addition to conventional sanitary systems.
At this point in time, further study and modeling are necessary to determine if additional nitrogen
controls are required and to what extent. This companion study is currently in the planning stage.
There are numerous policy concerns with the proposed use of treatment systems for individual
residences. These deal not only with potential public health nuisances, but also with various

SUFFOLK COUNTY DEPARTMENT OF HEALTH SERVICES
OFFICE OF WASTEWATER MANAGEMENT
TASK IX – SUFFOLK COUNTY DEPARTMENT OF HEALTH SERVICES ALTERNATIVE
ON-SITE SEWAGE DISPOSAL SYSTEMS STUDY SUMMARY REPORT
4 H2M architects + engineers
social and economic concerns that transcend the purview of Department of Environmental
Quality (DEQ) – especially since the goal is generally surface water protection, rather than
strictly public health and drinking water.
Ultimately, once DEQ is able to provide facts grounded in science, issues can be fully vetted by
policymakers in an informed manner to support a reasoned and systematic regional approach to
treatment on individual residences, with the goal of garnering public support and implementation
funding.
Overall study conclusion and recommendations for commercial projects:
The NitrexTM System, Aqua Point – Bioclere®, WesTech’s STM-AerotorsTM, and BESST
technologies were added to the list of technologies that the Department would approve.
Cromaglass, SBR, and MBR technologies are currently approvable technologies.
For larger communal systems (i.e. commercial property or small housing clusters), the owners
could propose to install an alternative system as a demonstration system providing that the project
is within the sanitary density permitted under Article 6 of the Suffolk County Sanitary Code and
that the proposed system is in conformance with separation distances as specified in Appendix A
of the Commercial Standards.

APPENDIX B PRESSURIZED SHALLOW NARROW DRAINFIELDS

SEASONAL VARIATION IN NITROGEN LEACHING FROM SHALLOW-NARROW DRAINFIELDS
S.A. Holden1, M.H. Stolt2, G.W. Loomis3, and A.J. Gold4
ABSTRACT
Nitrogen removal from septic tank effluent is one of the most pressing issues in coastal areas undergoing growth and development. Seven home-sites using onsite wastewater treatment systems were monitored in coastal Rhode Island to examine N treatment and leaching. The primary treatment units at these sites include: geo-textile filters; recirculating sand filters; single pass sand filters; a fixed activated sludge treatment system; and a modular peat filter. The final treatment step of all of these systems is a pressure-dosed shallow-narrow drainfield (SND). This paper focuses on N-removal by the SND serving these sites (treatment performance of the secondary treatment units will be delivered in a separate paper). Sites vary in age from four to six years. Five suction-cup lysimeters were installed at each site, three within the SND and two within a control plot (i.e., outside the drainfield area). In the SND, lysimeters were installed in the undisturbed soils adjacent to each trench at a depth of 30 cm below the drainfield lines. Control lysimeters were placed at 70 cm below the soil surface. Soil porewater samples were collected through the lysimeters twice seasonally from the winter of 2001 until the summer of 2003 and analyzed for total N. Average concentrations of N entering the groundwater for these seven sites ranged from 2 to 41 mg/L (ppm). Six of the seven sites showed a 33 to 73% overall reduction in N levels as a result of treatment in the SND. Seasonal effects were recognized for inputs of N into the groundwater for two of the sites. There were no observed seasonal effects on the amount that N levels were reduced as a result of treatment in the SND. Porewater samples collected from the control area of two sites had considerably higher levels of total nitrogen (TN) than those below the SND. The higher N levels outside the SND are likely the result of excess fertilizer additions to the lawns. KEYWORDS. Alternative onsite wastewater treatment, Nitrogen reduction, Shallow-narrow drainfield, Low pressure distribution.
INTRODUCTION
The major pollutants to ground and surface waters from onsite wastewater disposal systems (OSWDS) are N, P, and pathogens (Reneau et al., 1989). Nitrogen is generally considered the most mobile of the three, thus assessment of N concentrations in pore and groundwaters below an OSWDS can be used to estimate the potential for pollution from the system (Loomis, 1999). The main sources of N in domestic wastewater are feces, urine, food, and chemical wastes (Siegrist and Jenssen, 1989). The N found in wastewater is mostly organic nitrogen (NH3-R), nitrate (NO3
-), nitrite (NO2-), ammonium (NH4
+), and nitrogen gas (Burks and Minnis, 1994). Under aerobic conditions organic nitrogen and ammonium (the most abundant forms of N) are oxidized to nitrate (Walker et al, 1973; Lance, 1975). Nitrate is not adsorbed to the negatively charged soil particles, therefore it leaches easily, and may reach the groundwater resulting in contaminated drinking water and eutrophication of surrounding coastal waters (Stolt and Reneau, 1991; Peterson and Simpson, 1992; Burks and Minnis, 1994; Brady and Weil, 2002; Loomis et al., 2001). Most OSWDS rely on denitrification to convert nitrate to N2 gas, which is then released to the atmosphere (Siegrist and Jenssen, 1989; Reneau et al., 1989; Stolt and Reneau, 1 Steven A. Holden, Graduate Assistant, Natural Resources Science, University of Rhode Island 2 Mark H. Stolt, Associate Professor, Natural Resources Science, University of Rhode Island 3 George W. Loomis, Research and Extension Soil Scientist and Director of Onsite Wastewater Training Center, University of Rhode Island 4 Art J. Gold, Professor and Cooperative Extension Water Quality Program Leader, University of Rhode Island

1991). In order for denitrification to occur certain conditions; such as an available carbon source, anaerobic conditions, and a favorable soil temperature and pH (Brady and Weil, 2002); must exist. Conventional OSWDS, however, are designed for aerobic treatment of effluent and will remove little N through denitrification. Numerous studies have focused on the effectiveness of alternative OSWDS to remove N from domestic wastewater (Stolt and Reneau, 1991; Peterson and Simpson, 1992; Loomis et al., 2001). Most of these studies have focused on the effectiveness of secondary treatment units, such as sand filters and aeration treatment units, to remove N and have not evaluated final treatment of the wastewater. One commonly used final treatment step used for alternative systems is a shallow narrow drainfield (SND), sometimes referred to as a low pressure distribution system (Carlisle, 1980; Simon and Reneau, 1985; Stewart and Reneau, 1988). A SND consists of a series drainfield lines, placed 25-45 cm below the soil surface, that are pressure dosed with effluent from a secondary treatment unit. The SND offers many potential advantages over a conventional drainfield. By being closer to the surface, a SND creates a larger aerobic treatment zone for the effluent before it reaches the ground water or a limiting layer. Another advantage is that the system is pressure dosed and will disperse the effluent equally over the drainfield preventing overloading. Microbial and root biomass greatly decreases at a depth below 50 cm (Brady and Weil, 2002), thus by having the drainfield lines in the upper 25 to 45 cm of soil the effluent is released in a zone where roots and soil microbes are most active (Stewart and Reneau, 1988). This allows for the increased uptake and transformation of N in the wastewater. The objectives of this study were to examine the amount of N potentially entering the groundwater below SND in Rhode Island and to determine if time of year affects the groundwater inputs. Our hypothesis was that reduced biological activity would occur in the SND during winter and late fall and result in an increase in the amount of N entering the groundwater from these systems. We assumed that soil porewaters collected 30 cm below the SND lines would represent N concentrations entering the shallow groundwater in these coastal settings.
METHODOLOGY Seven home-sites located in coastal resource areas of Rhode Island were chosen for study. The sites vary in the type of secondary treatment, age (four to six years old), placement of the drainfield lines, and loading rates (Table 1). Each site has a SND as the final treatment step for waste disposal. Ceramic cup lysimeters were installed at each site: three directly adjacent to the trenches in the SND and two in a control area. A push probe (diameter equal to lysimeter) was used to install the lysimeters and reduce disturbance of the natural soil during installation. The base of the lysimeters was located 30 cm below the trench bottom (depth was measured from the middle of the ceramic cup). Lysimeters within the control were placed 70 cm below the soil surface at all the sites. The top of each lysimeter was 5-10 cm below the soil surface. A bucket auger (10 cm diameter) was used to excavate a space to allow access to the lysimeter. These access ports were stabilized with an appropriate sized section of PVC pipe. The PVC pipe was sealed with a #11 rubber stopper or a plastic cover. A screened PVC well was placed 90 cm from the outside of the SND at a depth of 60 cm below the trench bottom to monitor the water table level at each site. The purpose of the well was to confirm that the water table was not approaching the treatment zone of the SND and that we were collecting porewater samples (i.e. not collecting samples below the water table). Redox potential was measured at selected sites using six redox probes (electrodes) inserted along the drainfield to a depth equal to the trench bottom. Potentials were also measured at the same depth in the control area. Values were corrected by adding the standard potential of a saturated calomel reference electrode at a pH = 7 (244 mV). The soil redox potential measurements were made to determine if Eh levels were low enough in the SND for denitrification to occur (Mohn et al., 2000).
2

Soil-porewater samples were collected from the lysimeters on consecutive days each season from the winter of 2002 until summer 2003: a total of 14 samplings over the seven seasons. To collect the samples, a vacuum was established within each lysimeter using a field pump and portable power source. The following day the soil porewater was extracted from the lysimeter by extending a tube to the bottom and pumping the water into a labeled 120 ml bottle. Effluent was sampled from the secondary treatment unit of every system. Effluent from the LON, LIN, and MCG sites (Table 1) were collected 15 times between August 1997 and February 1999 (Sykes et al., 1999; Sykes, 2001). Effluent from the HAZ, TAR, TWE, and SIS secondary units were collected seasonally from the winter of 2002 until summer 2003. Soil porewater and effluent samples were stored in 120 ml econoware brown-glass bottles at 40 C until analyzed. Soil-porewater and effluent samples were prepared for analysis by filtering them through a #2 Whatman filter using a Buchner funnel connected to a vacuum. One mL of sample was diluted by a factor of 20 and added to a 40 mL glass vial. A 5 mL liquid digestion reagent, consisting of recrystallized potassium persulfate (K2S2O8), boric acid (H3BO3), and 1N sodium hydoxide (NaOH), was added to the samples. The samples were boiled in a water bath for 15 minutes and left overnight (American Public Health Association, 1995). Standards, created using potassium nitrate (KNO3), were also digested following the same procedure. The following day the samples were analyzed for total N using a rapid flow analyzer (RFA-300, ALPKEM Corp.).
RESULTS AND DISCUSSION
Nitrogen Entering the Groundwater Average N levels in the soil porewaters, based on seasonal sampling over a 20-month period, ranged from 2 to 42 mg/L (Figs. 1-7). Nitrogen levels from individual lysimeters ranged from 0 to 121 mg/L. Because of dry conditions during the summer of 2002, no soil-porewater samples could be obtained from the control areas of the MCG, HAZ, TAR, and LON sites and the SND from the LIN site (Figs. 1, 2, 3, 6, and 7). Concentrations of N entering the groundwater from the LIN and TAR sites were below drinking water standards (10 mg/L N) for nearly every season (Figs. 2 and 7). At the other 5 sites, N levels entering the groundwater were mostly well above the drinking water standard. Two of the sites, LON and MCG, showed a trend suggesting seasonal effects on the amount of N entering the groundwater (Figs. 1 and 2). At these two sites porewater collected in the winter had the highest N concentrations, spring and summer months showed lower levels, and the levels increased in the fall. Although this trend was not strong, it was recognized for both years. We suspect that lower soil temperatures in the winter and fall resulted in reduced biological activity (plant growth, nutrient uptake, and microbial activity) in the SND such that more N was entering the groundwater during this time of year. Seasonal effects on the amount of N entering the groundwater were not apparent at the LIN, TAR, HAZ, SIS, and TWE sites (Figs. 3-7). Variations in the soil types within the SND, effluent N concentrations, or loading rates may have masked any seasonal patterns for these sites and contributed to the amount of variability seen in the MCG and LON sites. Reductions in Nitrogen Levels within the SND Reduction in N concentrations, based on seasonal effluent levels and N concentrations in the porewater samples, for the TWE, SIS, HAZ, and TAR sites range from 0 to 97%. No seasonal effect on N removal was observed. Average N concentration reductions for the entire sampling period were 53, 43, 40, and 33% for TWE, SIS, HAZ, and TAR sites, respectively. Reduced concentration levels in N can be attributed to plant uptake, denitrification, and dilution. Since our porewater samples were collected above the water table, we expect little dilution to occur within
3

the 30 cm of soil between the disposal points in the SND and where the lysimeters were located. Lush green grass was observed in all the sites at times during the spring, fall, and summer at each site. These observations suggest that the grassroots had access to both water and nutrients over the SND and may potentially remove N during the growing season. Over time, however, N mineralization will reach some equilibrium with N uptake by the grass and this effect will likely be inconsequential. Our redox potential measurements were lower in the SND than the control and at or below potentials reported for denitrification to occur. Therefore, we expect that denitrification may be the leading factor in the reduction of N concentrations in these four sites. Effluent levels dosed on the SND at the LON, LIN, and MCG sites were measured in 1997 through 1999 (Sykes et al., 1999; Sykes, 2001). Since, the data reported here represent N levels reaching the groundwater for 2002 and 2003, examining seasonal effects was not possible. Based on average N levels for the effluent, and our seasonal porewater measurements, reduction of N due to treatment in the SND of these three systems is estimated to range from 0 to 99%. This range in values is similar to the range for the four sites where both effluent and porewater samples were collected seasonally. The average reduction for the entire sampling period, however, was much different. Nitrogen levels in four of the seven porewater samples collected from the LON site were higher than average effluent levels recorded for an 18 month period from 1997 to 1999. At the LIN site, there was a much higher percent of reduction (73%) than observed at any of the other sites. These data suggest that effluent N levels leaving the secondary treatment unit may have increased between 1999 and 2002 at the LON site and decreased at the LIN site during the same period. These differences in N levels in the effluent are likely due to changes in water usage or occupancy by the homeowner, resulting in higher or lower levels of contaminants entering the SND. Control Plot N Levels Ratios of N in porewaters below the SND to N concentrations below the control plots ranged from 0.2 to 18.4. The LIN and TAR sites had ratios of less than one, meaning more N was present in porewater samples collected below the control plots than porewater extracted below the SND (Figs. 2 and 7). For the LIN site, five of the six seasonal measurements show this trend (Fig. 2). Similarly in the TAR site, levels of N in the control exceeded the SND in all cases where porewater samples could be extracted (Fig. 7). In both of these cases, the porewater entering the groundwater from the control plots was much higher than drinking water standards. This is significant, since the alternative systems at these locations have greatly reduced N additions coming from disposal of domestic wastewater to less than 10 mg/L. The lawns at these locations are plush and green suggesting the likely source of the elevated N concentrations in the control plots is excess fertilizer.
SUMMARY AND CONCLUSIONS
Alternative OSWDS are called upon in areas where soils are marginal with respect to their treatment capacity or resources are such that special requirements are in place to minimize development impacts on water quality. Numerous studies have evaluated the effectiveness of the secondary units that define the alternative OSWDS to treat wastewater. Few studies, however, have addressed the effectiveness of SND as the final treatment step in an alternative OSWDS. In our study we found that on average as much as 73% of the N leaving a secondary unit can be removed by a SND, and that between 33 and 53% of the N is commonly removed. We expected considerable seasonal variations in the N removal. These effects, however, were only observed in two of the seven sites we studied. The lack of consistent evidence of seasonal effects on N removal may be the result of variations in soil type, N concentrations in the effluent, and loading rates. Variations in water usage by the homeowner may also make seasonal effects less evident. Although as much as 73% of the N disposed of in a SND may be removed, we found that N concentrations reaching the groundwater below these systems were well above drinking water
4
standards. These data suggest that although alternative measures were taken in these critical coastal resource areas of Rhode Island to control N additions to the groundwater from onsite waste disposal, more work needs to be done to control N entering our ground and surface waters.
REFERENCES
1. American Public Health Association, American Water Works Association and Water Pollution Control Federation. 1995. Standard Methods for Examination of Water and Wastewater, 19th ed. Washington, D.C.
2. Brady, N.C., and R.R.Weil. 2002. The Nature and Properties of Soils-13th Edition. Prentice Hall, Upper Saddle River, NJ.
3. Burks, D.B., and M.M. Minnis. 1994. Onsite Wastewater Treatment Systems. Hogart House Ltd., Madison, WI.
4. Carlile, B.L. 1980. Use of shallow, low pressure injection systems in large and small installations. In Proccedings of the 6th National Conference on Individual Onsite Wastewater Systems, 371-385. N.I. McClelland, ed. National Sanitation Foundation, Ann Arbor, MI.
5. Lance, C.L. 1975. Fate of nitrogen in sewage effluent applied to the soil. Journal of the Irrigation and Drainage Division. 101:131-144
6. Loomis, G., L. Joubert, B. Dillmann, D. Dow, J. Lucht, and A. Gold. 1999. A watershed risk-based approach to onsite wastewater management - A Block Island, Rhode Island case study. In 10th Northwest On-Site Wastewater Treatment Short Course and Equipment Exhibition, 249-262. R.W. Seabloom, ed. University of Washington, Seattle, Washington.
7. Loomis, G.W., D.B. Dow, M.H. Stolt, L.T. Green, and A.J. Gold. 2001. Evaluation of innovative onsite wastewater treatment systems in the Green Hill Pond watershed, RI – A NODP II project update, on-site wastewater treatment. In 9th National Symposium on Individual and Small Community Sewage Systems, 506-515. K. Mancl, ed., ASAE, Fort Worth, Texas.
8. Mohn, J., A. Schürmann, F. Hagedorn, P. Schleppi, and R. Bachofen. 2000. Increased rates of denitrification in nitrogen-treated forest soils. Forest Ecology and Management. 137:113-119.
9. Peterson, C.E., and T.W.Simpson. 1992, Alternative on-site wastewater treatment and disposal systems. Department of Crop and Soil Environmental Sciences and Virginia Cooperative Extension Service, College of Agricultural and Life Sciences, Virginia Polytechnic Institute and State University, Blacksburg, Virginia.
10. Reneau, R.B. Jr., C. Hagedorn, and M.J. Degen. 1989. Fate and transport of biological and inorganic contaminants from on-site disposal of domestic wastewater, Journal of Environmental Quality. 18:135-144.
11. Siegrist, R.L., and P.D.Jenssen, 1989. Nitrogen removal during wastewater infiltration as affected by design and environmental factors. In 6th Northwest On-Site Wastewater Treatment Short Course, 304-318. R.W.Seabloom, and D. Lenning, eds.University of Washington, Seattle, Washington.
12. Simon, J.J., and R.B. Reneau JR., 1985. Hydraulic performance of prototype low pressure distribution systems. In Proceedings of 4th National Symposium on Individual and Small Community Sewage Systems. 251-259. ASAE, St. Thomas, MI.
13. Stewart, L.W., and R.B. Reneau JR., 1988. Shallowly placed, low pressure distribution system to treat domestic wastewater in soil with fluctuating high water tables, Journal of Environmental Quality. 17:499-504.
5

14. Stolt, M.H., and R.B. Reneau JR., 1991. Potential for contamination of ground and surface waters from on-site wastewater disposal systems: Crop and Soil Environmental Sciences Department, Virginia Polytechnic Institute and State University, Blacksburg, Virginia.
15. Sykes, A.D., G. Loomis, D. Dow, and M.H. Stolt. 1999. Evaluation of treatment performance in Rhode Island sand filters. In Proceedings from the Annual Meetings of the National Onsite Wastewater Recycling Association. 195-200. Jekyll Island, Georgia
16. Sykes, A.D., 2001. Performance of sand filters in Rhode Island, Department of Natural Resources, Non-Thesis Masters Degree Report, University of Rhode Island, Kingston, Rhode Island.
17. Walker, W.G., J. Bouma, D.R. Keeney, and F.R. Magdoff. 1973. Nitrogen transformation during subsurface disposal of septic tank effluent in sands: I. Soil transformation, Journal of Environmental Quality 2:521-525.
6

Table 1: Study sites characteristics.
Site System Installation
Date Drainfield Line Depth
(cm) Secondary Treatment Unit
Average Loading Rate (gpd)
LON Spring 1997 36 - 46 Above-Grade Recirculating Sand Filter 165
LIN Spring 1997 23 - 35 At-Grade Recirculating Sand Filter 131
MCG Spring 1997 28 - 38 Single-Pass Sand Filter 249
TWE Winter 1998 25 - 30 Recircualting Geo-Textile Filter 66
SIS Spring 1999 41 - 70 Peat Filter / UV Unit 130
HAZ Spring 1999 29 - 56 Single-Pass Sand Filter 155
TAR Summer1999 28 - 38 Fast Activated Sludge Unit / UV Unit 236
7
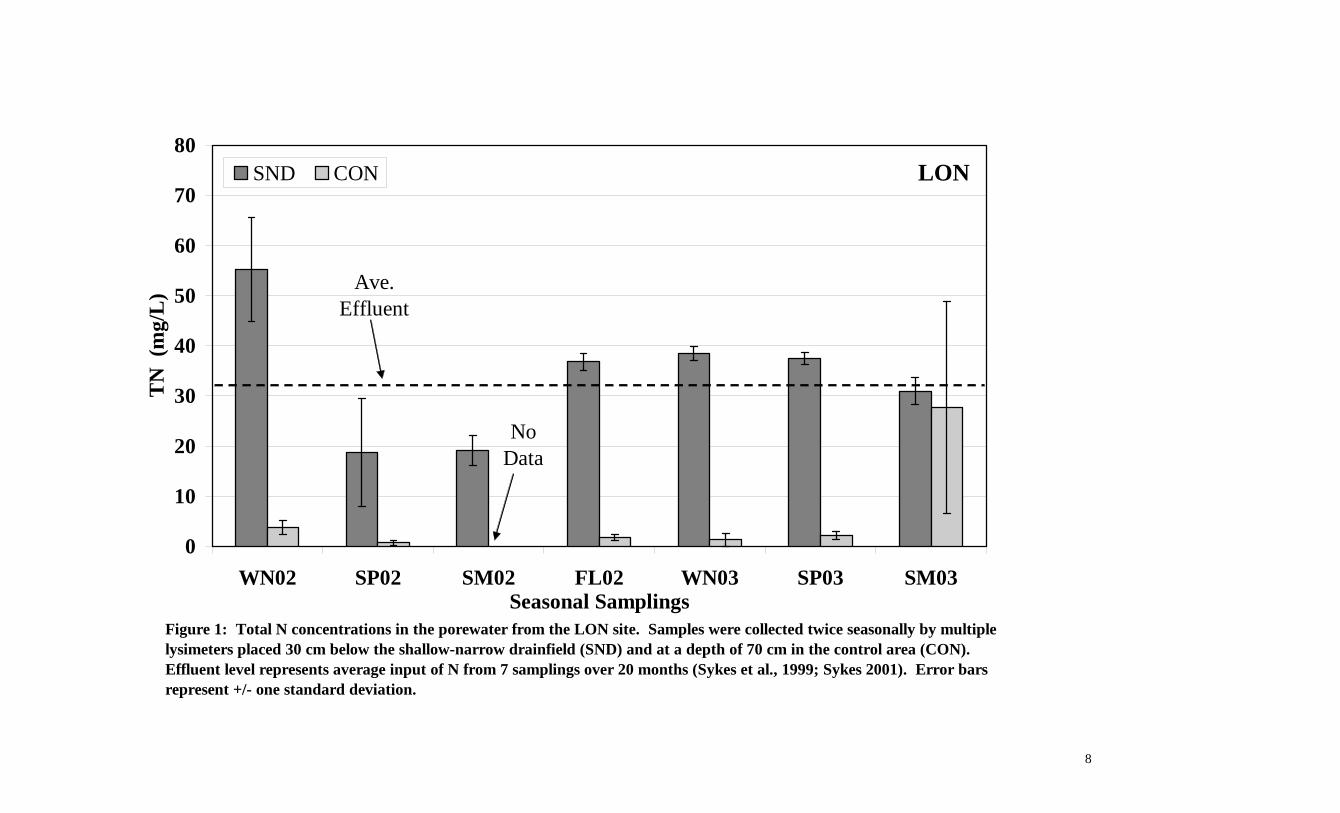
0
10
20
30
40
50
60
70
80
WN02 SP02 SM02 FL02 WN03 SP03 SM03Seasonal Samplings
TN
(m
g/L
)SND CON
Figure 1: Total N concentrations in the porewater from the LON site. Samples were collected twice seasonally by multiple lysimeters placed 30 cm below the shallow-narrow drainfield (SND) and at a depth of 70 cm in the control area (CON). Effluent level represents average input of N from 7 samplings over 20 months (Sykes et al., 1999; Sykes 2001). Error bars represent +/- one standard deviation.
Ave. Effluent
LON
No Data
8
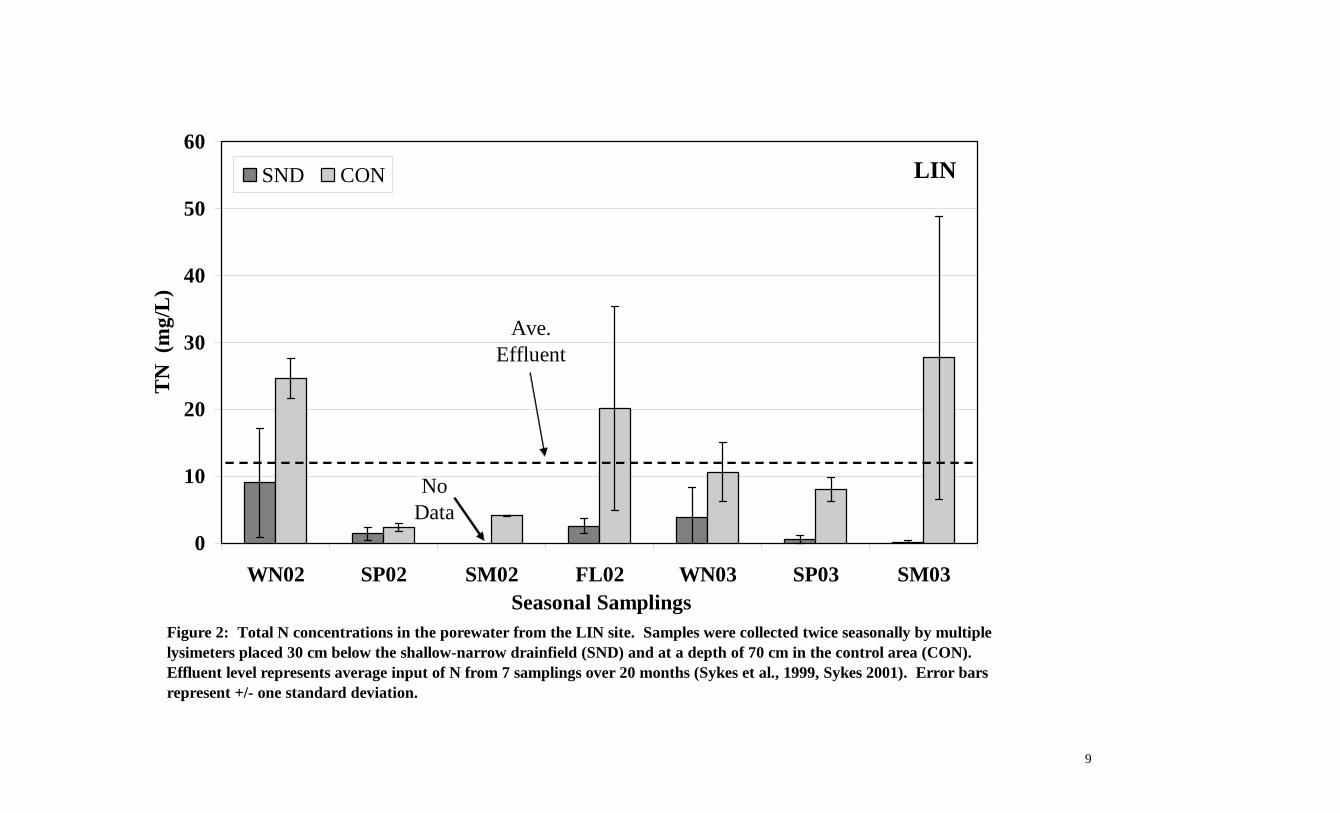
0
10
20
30
40
50
60
WN02 SP02 SM02 FL02 WN03 SP03 SM03Seasonal Samplings
TN
(m
g/L
)SND CON
No Data
LIN
Ave. Effluent
Figure 2: Total N concentrations in the porewater from the LIN site. Samples were collected twice seasonally by multiple lysimeters placed 30 cm below the shallow-narrow drainfield (SND) and at a depth of 70 cm in the control area (CON). Effluent level represents average input of N from 7 samplings over 20 months (Sykes et al., 1999, Sykes 2001). Error bars represent +/- one standard deviation.
9

0
10
20
30
40
50
60
WN02 SP02 SM02 FL02 WN03 SP03 SM03Seasonal Samplings
TN
(m
g/L
)SND CON
No Data
MCG
Ave. Effluent
Figure 3: Total N concentrations in the porewater from the MCG site. Samples were collected twice seasonally by multiple lysimeters placed 30 cm below the shallow-narrow drainfield (SND) and at a depth of 70 cm in the control area (CON). Effluent level represents average input of N from 7 samplings over 20 months (Sykes et al., 1999; Sykes 2001). Error bars represent +/- one standard deviation.
10
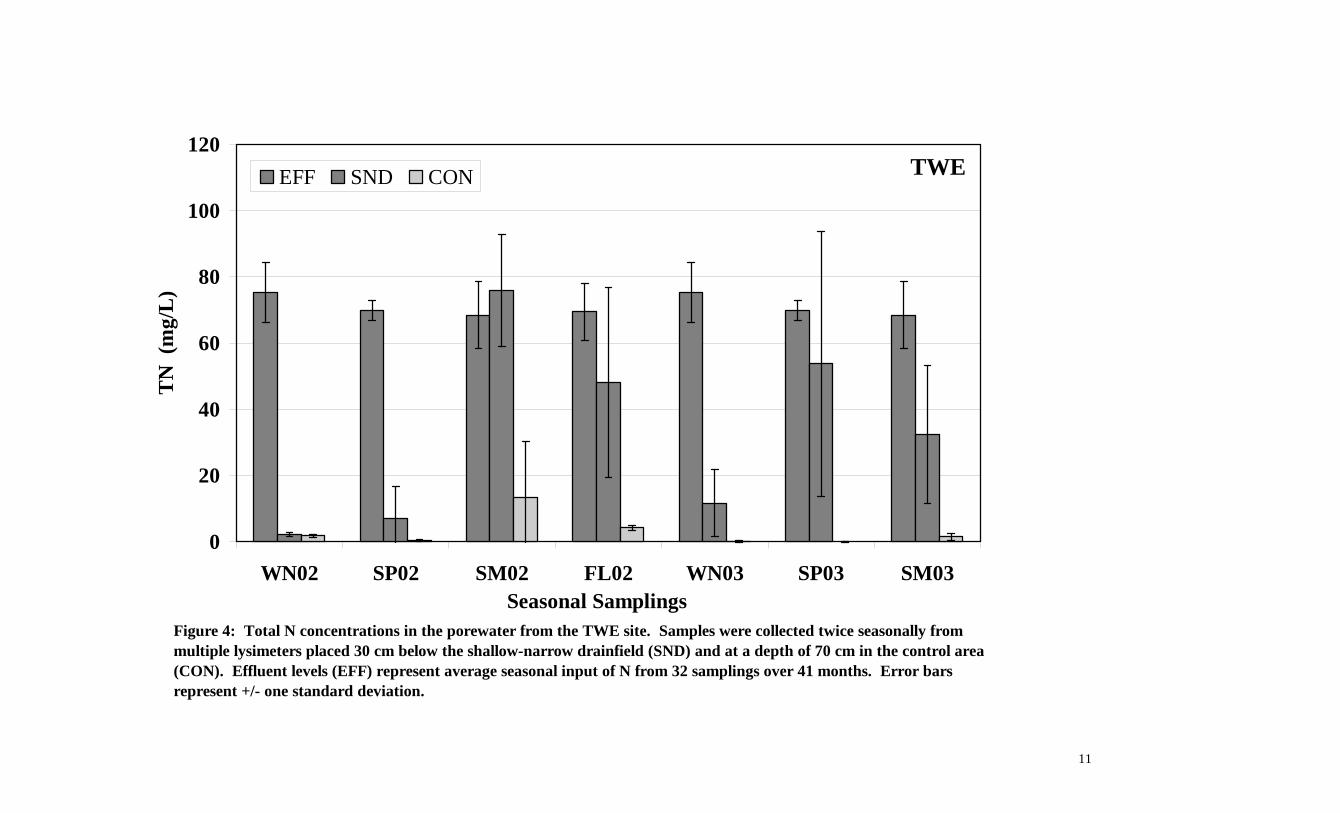
0
20
40
60
80
100
120
WN02 SP02 SM02 FL02 WN03 SP03 SM03Seasonal Samplings
TN
(m
g/L
)EFF SND CON TWE
Figure 4: Total N concentrations in the porewater from the TWE site. Samples were collected twice seasonally from multiple lysimeters placed 30 cm below the shallow-narrow drainfield (SND) and at a depth of 70 cm in the control area (CON). Effluent levels (EFF) represent average seasonal input of N from 32 samplings over 41 months. Error bars represent +/- one standard deviation.
11

0
20
40
60
80
100
120
WN02 SP02 SM02 FL02 WN03 SP03 SM03Seasonal Samplings
TN
(m
g/L
)EFF SND CON SIS
Figure 5: Total N concentrations in the porewater from the SIS site. Samples were collected twice seasonally from multiple lysimeters placed 30 cm below the shallow-narrow drainfield (SND) and at a depth of 70 cm in the control area (CON). Effluent levels (EFF) represent average seasonal input of N from 32 samplings over 41 months. Error bars represent +/- one standard deviation.
12

0
20
40
60
80
100
120
140
WN02 SP02 SM02 FL02 WN03 SP03 SM03Seasonal Samplings
TN
(m
g/L
)EFF SND CON
No Data
HAZ
Figure 6: Total N concentrations in the porewater from the HAZ site. Samples were collected twice seasonally from multiple lysimeters placed 30 cm below the shallow-narrow drainfield (SND) and at a depth of 70 cm in the control area (CON). Effluent levels (EFF) represent average seasonal input of N from 32 samplings over 41 months. Error bars represent +/- one standard deviation.
13
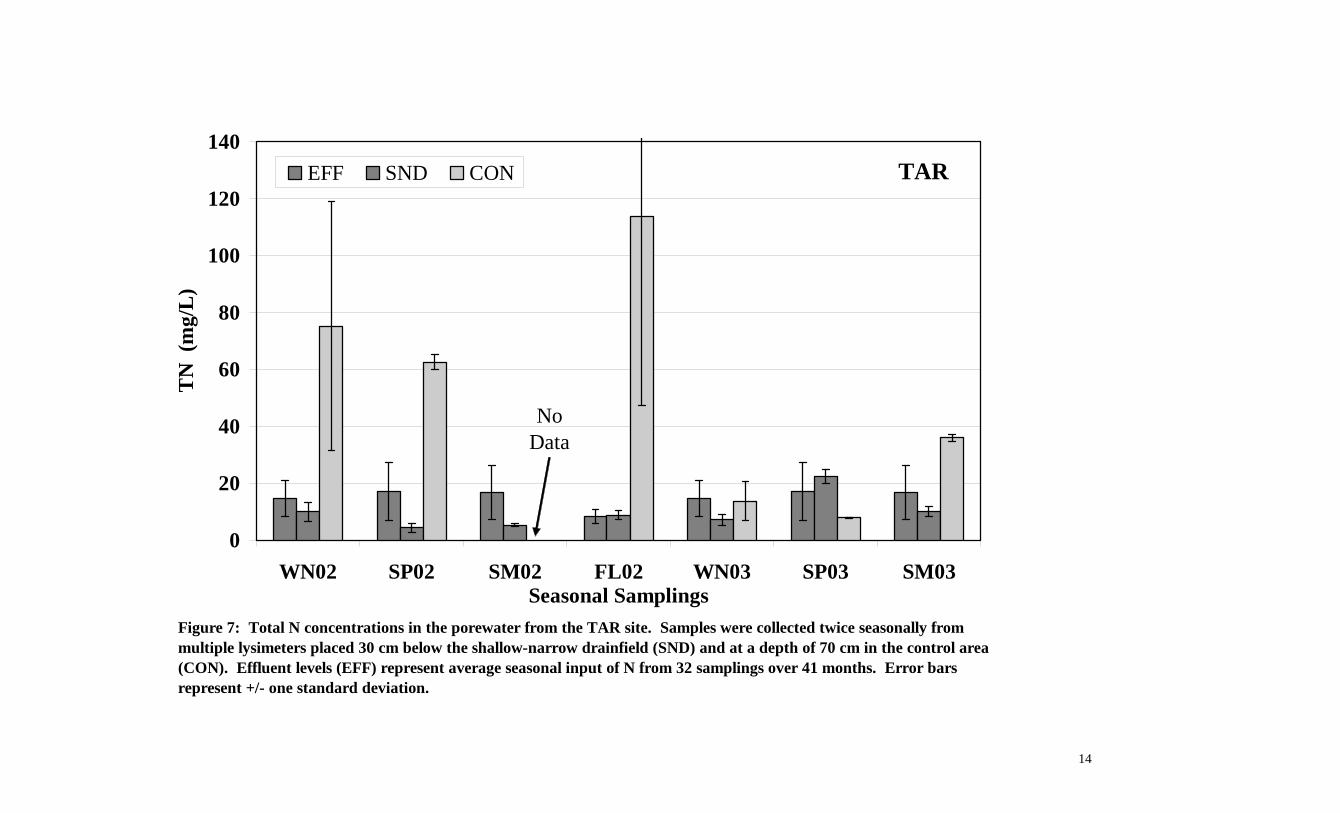
0
20
40
60
80
100
120
140
WN02 SP02 SM02 FL02 WN03 SP03 SM03Seasonal Samplings
TN
(m
g/L
)EFF SND CON
No Data
Figure 7: Total N concentrations in the porewater from the TAR site. Samples were collected twice seasonally from multiple lysimeters placed 30 cm below the shallow-narrow drainfield (SND) and at a depth of 70 cm in the control area (CON). Effluent levels (EFF) represent average seasonal input of N from 32 samplings over 41 months. Error bars represent +/- one standard deviation.
TAR
14

Clustered Wastewater Treatment for Orient, NY VI-1 Peconic Green Growth, Inc.
VI. REGULATION AND MANAGEMENT Regulation and management are intertwined with public outreach, consensus and political will. The later has to happen before changes will occur. Repetition of message is needed to gain consensus. Data back-up and scientific studies will give leaders the needed basis upon which they can make decisions when introducing new programs and regulations. Christopher Gobler at Stony Brook University and The Nature Conservancy have produced presentations and studies that define the level of degradation and document onsite wastewater role as a primary source of excess nitrogen in aquifers and marine waters. Armed with recent studies and planning data, regulators can act in good conscience. There is understandable caution relative to the introduction of enhanced wastewater treatment, due to the inevitable increase in cost to both individuals and governments. Feedback from PGG’s survey indicates overwhelmingly that people feel wastewater treatment is a function that is suitable for subsidy (87%). Traditionally, people assume that central sewers are the only method of addressing this issue. This study helps dispel that notion, as decentralized options are viable on Long Island. Developers and commercial interests favor sewer districts, as increased densities usually are allowed, sometimes without limit. In reaction to this, many of the environmentally sensitive areas have eschewed sewer districts due to fear of the overdevelopment that is often associated with their introduction. This can be overcome by shifting the focus on flow rates to actual pounds of nitrogen loading, defining environmentally sensitive areas with nitrogen mitigation targets, which basically codify existing TMDL’s, and adhering to strong zoning regulations that do not allow planned development districts or variances in sensitive areas. For Orient the nitrogen mitigation targets are a 25% reduction in the Peconic Estuary and 19% overall reduction in the LI Sound watershed. A decentralized approach to wastewater treatment would be suitable for an approach that provides infrastructure for existing mitigation needs only. A. SCCWRMP Suggested Actions The SCDHS generated the Draft Suffolk County Comprehensive Water Resources Management Plan, which is the source of strong data documenting rising nitrogen levels in groundwater. Applicable recommendations for action include:
1. Within the 25-year travel time to streams and sensitive surface waters and 50-years to public supply wellfields:
a. Prioritize open space protection b. Evaluate TDR programs (so not a receiving area) c. Avoid siting Sewage Treatment Plants (STP) in zone unless mass loading of nitrogen
discharge is reduced (assume within the sub-watershed) from non-STP scenario 2. Target nitrogen flows to 4-6 mg/l instead of the drinking water standard of 10 mg/l in areas with
unsewered, subsized lots. 3. Amend Article 6 of the SC Sanitary Code to require that densities do not exceed one dwelling
unit (DU)/acre for all unsewered areas, with Groundwater Management Zone 4 being a first priority (Orient is in Zone 4)
4. Protect the drinking water supply by reducing demand, (odd-even lawn watering days and sprinkler rain sensors recommended)
5. Consider the development of watershed rules and regulations and source water protection standards.
B. Events/Presentations To further discussion on the issues of decentralized wastewater treatment and help identify feasible action plans to allow and promote enhancements, three forums were held by PGG in addition to numerous presentations.

Clustered Wastewater Treatment for Orient, NY VI-2 Peconic Green Growth, Inc.
1. …and not a drop to drink, Forum on Wastewater and Water Quality, February 16, 2013, , Poquatuck Hall, Orient Cohosted by the Orient Association (OA)and the East Marion Community Association (EMCA). With an introduction from Venetia Hands, President of the OA, presentations were made by Sarah J. Meyland, MS, JD, professor, on hydrology and environmental need, Glynis Berry, AIA, LEED AP on planning issues, and Douglas C. Clark, PE, LEED AP, on decentralized wastewater systems. The planning maps and survey developed as part of this project were introduced to the community. Following the presentations, an active dialog took place between the audience and the panel regarding the issues covered. Approximately 80 people attended. The success of this event was due to the collaboration and efforts of all hosts. The OA in particular helped prepare the survey, mail invitations, design an ad for the local paper, and organize the meeting. OA paid for the advertisement and mailing. Peconic Green Growth took responsibility for the speakers, presentations, and speaker expenses. Many preparatory meetings occurred, including one on February 5, 2013 with the Town Supervisor. He and representatives from the Town Board and Trustees (who are responsible for coastal issues) attended the forum. The presentations are available on at PGG’s website at: http://peconicgreengrowth.org/orient-project/ Questions for discussion, press release and submitted responses to the forum are included in Appendix D-2.
2. Roundtable: Decentralized Wastewater Regulation and Standards May 22, 2013, Riverhead The roundtable successfully gathered regulatory representatives and experts in the field of wastewater treatment. Twenty-two representatives of state, county and municipal government, as well as engineers familiar with decentralized wastewater treatment issues gathered to discuss action plans. For the agenda, attendees, and minutes, see Appendix D-3. This conference was intended to provide an opportunity for brainstorming action items and needs. The input generated by this program was especially timely, as NYSDEC was in the final stages of developing Standards for Intermediate Sized Wastewater Treatment Systems, and the County had a draft of its Comprehensive Water Resources Management Plan (SCCWRMP), and was in the midst of studying technologies for intermediate systems. While extensive information was shared, most regulatory representatives appeared to maintain their respective positions. The level of interactive dialog and modification of pre-existing viewpoints seemed limited. This may have been due to the large size of the group, and the fact that some attendees seemed to be observing and gathering information rather than actively participating. A draft Action Plan list was given to the participants to evaluate after the meeting, but only four responded. Some issues that were discussed included the need for incentive funding, faster approval process for alternative systems, a phase-out program for cesspools, and the need for an onsite inspection program. There are several points where state and county standards and regulations differ.
3. Wastewater in Our Waters: SOLUTIONS June 21, 2013, Riverhead This all-day symposium included twelve speakers and two panel discussions. A diverse audience of 160 attendees included representatives from of all levels of government, agency representation, professionals, civic associations and environmental groups, with strong participation by Suffolk County. Topics included: 1) WHY SHOULD WE CARE, discussing environmental issues, water quality status and planning efforts 2) SOLUTIONS: Technology for Decentralized Treatment including presentations by the Suffolk County Department of Health Services (SCDHS) on recently approved community systems, and keynote presentations by Albert Robert Rubin and Ed Clerico, both national experts in wastewater engineering. The day ended with presentations and panel discussions on RESPONSIBLE MANAGEMENT AND FINANCING FOR DECENTRALIZED WASTEWATER TREATMENT.
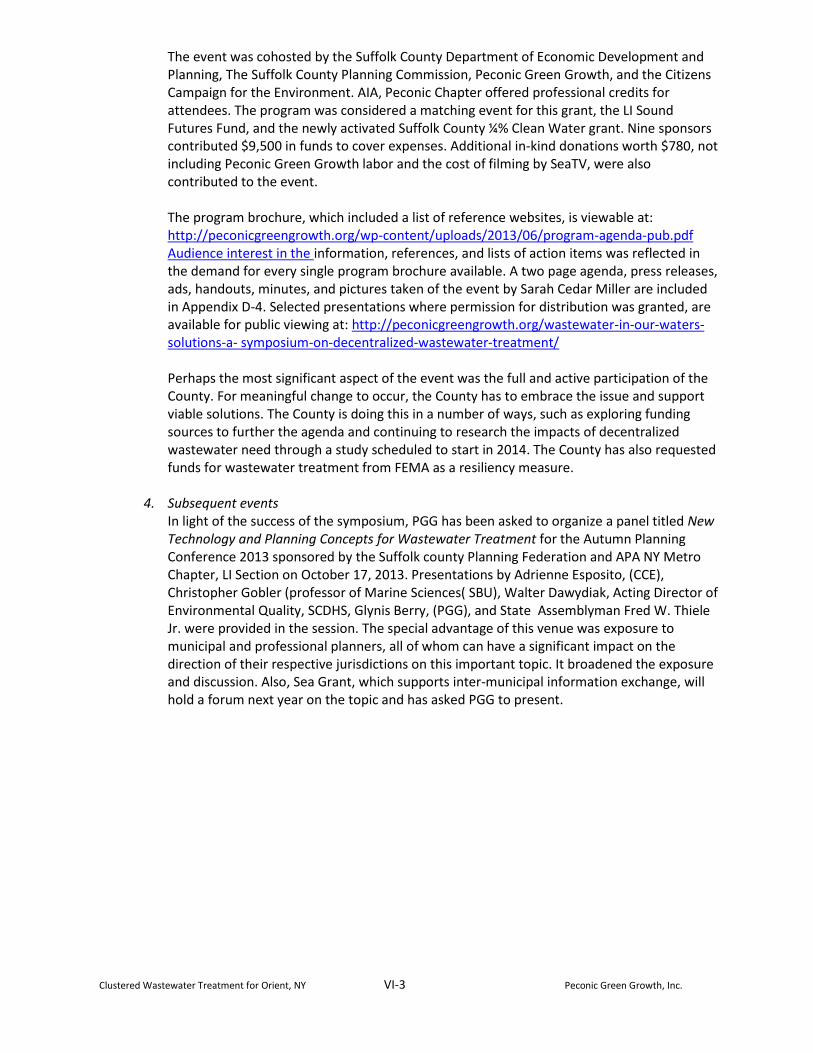
Clustered Wastewater Treatment for Orient, NY VI-3 Peconic Green Growth, Inc.
The event was cohosted by the Suffolk County Department of Economic Development and Planning, The Suffolk County Planning Commission, Peconic Green Growth, and the Citizens Campaign for the Environment. AIA, Peconic Chapter offered professional credits for attendees. The program was considered a matching event for this grant, the LI Sound Futures Fund, and the newly activated Suffolk County ¼% Clean Water grant. Nine sponsors contributed $9,500 in funds to cover expenses. Additional in-kind donations worth $780, not including Peconic Green Growth labor and the cost of filming by SeaTV, were also contributed to the event. The program brochure, which included a list of reference websites, is viewable at: http://peconicgreengrowth.org/wp-content/uploads/2013/06/program-agenda-pub.pdf Audience interest in the information, references, and lists of action items was reflected in the demand for every single program brochure available. A two page agenda, press releases, ads, handouts, minutes, and pictures taken of the event by Sarah Cedar Miller are included in Appendix D-4. Selected presentations where permission for distribution was granted, are available for public viewing at: http://peconicgreengrowth.org/wastewater-in-our-waters-solutions-a- symposium-on-decentralized-wastewater-treatment/ Perhaps the most significant aspect of the event was the full and active participation of the County. For meaningful change to occur, the County has to embrace the issue and support viable solutions. The County is doing this in a number of ways, such as exploring funding sources to further the agenda and continuing to research the impacts of decentralized wastewater need through a study scheduled to start in 2014. The County has also requested funds for wastewater treatment from FEMA as a resiliency measure.
4. Subsequent events
In light of the success of the symposium, PGG has been asked to organize a panel titled New Technology and Planning Concepts for Wastewater Treatment for the Autumn Planning Conference 2013 sponsored by the Suffolk county Planning Federation and APA NY Metro Chapter, LI Section on October 17, 2013. Presentations by Adrienne Esposito, (CCE), Christopher Gobler (professor of Marine Sciences( SBU), Walter Dawydiak, Acting Director of Environmental Quality, SCDHS, Glynis Berry, (PGG), and State Assemblyman Fred W. Thiele Jr. were provided in the session. The special advantage of this venue was exposure to municipal and professional planners, all of whom can have a significant impact on the direction of their respective jurisdictions on this important topic. It broadened the exposure and discussion. Also, Sea Grant, which supports inter-municipal information exchange, will hold a forum next year on the topic and has asked PGG to present.

Clustered Wastewater Treatment for Orient, NY VI-4 Peconic Green Growth, Inc.
C. Action Items Peconic Green Growth Suggested Action Items - List
1 Dedicated Staff Member for decentralized wastewater
2 Cesspool prohibition for further installation
3 Cesspool phase-out – prioritized/failure
4 Onsite inspection program
5 Enhanced Treatment Units (ETU)with nitrogen mitigation-establish PILOT PROGRAM, use NSF Standard 245 certified systems + department approved
6 Enhanced treatment w/ pressurized, shallow, narrow fields (PSNDs from URI) Establish a PILOT PROGRAM
7 Committee to recommend changes to codes /guidelines for Decentralized Wastewater Treatment and nitrogen mitigation including both single onsite and cluster/community systems
8 Funding to incentivize ETU’s
9 Funding for decentralized cluster design and installation
10 Increase minimum lot size equivalent to 1 acre everywhere
11 Develop info/guidance on flow vs. pollutant loading with max. limits. Develop Info/guidance to counter fear of over-development that comes with sewer extensions; id alternatives (reuse)
12 Introduce new minimum lot size in critical watersheds, otherwise nitrogen mitigation required
13 Develop faster, clearer approval process for alternative systems SC, NYSDEC + NYSDOH, esp. in priority areas/failing conditions.
14 Develop a coordinated certification system for Responsible Management Entities
15 Establish priority areas
16 Develop coordination with research facilities (URI, Stony Brook, MASSTC, NSF, EPA’s ETV
17 Develop nitrogen mitigation program for existing large-scale onsite systems with densities greater than 1 dwelling unit per acre.
18 Pursue reuse options for treated wastewater
19 Incorporate water conservation improvements with each wastewater project for existing buildings
20 Pilot a urine diversion/composting project

Clustered Wastewater Treatment for Orient, NY VI-5 Peconic Green Growth, Inc.
D. Chart of Recommended Action Items Submitted to Suffolk County for Consideration DECENTRALIZED WASTEWATER RECOMMENDED ACTION ITEMS AND CHANGES TO CODES, STANDARDS, DIRECTIVES, or POLICIES
# Item Code/Standard/ Directive
Note
All references to Suffolk County Sanitary Code (SCSC) can be seen on a marked copy (Exhibit XX)
1 Prohibition of installations of Cesspools Any repair or replacement of an existing onsite wastewater treatment system will require compliance with existing standards and codes, including new nitrogen mitigation programs where applicable.
SCSC 760-705A and B 2 a New Directive
Eliminate exemption for existing (in 1973) residential structures to obtain a permit for discharge of sewage from an existing residential structure to a private or individual sewage disposal system. Issue new directive. Impacts: - Increases cost of repair for owner of pre-1973 homes, - Provides equitable treatment of all single-family home
owners - Leverages private money and increases likelihood of
voluntary participation in phase-out program, nitrogen mitigation, and pilot community systems
- Improves water quality and reduces risk of pathogens in flood zones and shallow depths to groundwater
Related Actions:
- Inspection program - Phase-out program
Directive DEQ Policy 12
Approval for Existing Residences
Eliminate language exempting houses constructed prior to 1973. (Exhibit XX)
2 Phase-out of Cesspools Proposal actively retires cesspools with prioritization for areas doing the most environmental harm, such as flood zones, areas using wells for drinking water, shallow depths to groundwater, as well as those exhibiting signs of failure.
New See Exhibit XX Draft Proposal to Phase Out Cesspools Possibly as a directive and for reference in both Residential and Commercial Standards Impacts: - Same as 1 - Speeds process of rehabilitation and realization of water
quality improvements - Depending upon how and when inspections and/or upgrades

Clustered Wastewater Treatment for Orient, NY VI-6 Peconic Green Growth, Inc.
are required, the real estate industry may oppose this. - Generates jobs
Related actions:
- Onsite inspection program - SCDHS staffing - Website Management System - Inspector Training Program - Fund for financially disadvantaged (CDC?) - Nitrogen mitigation program
3 Re-categorize Groundwater Management Hydrogeologic Zone IV to the more stringent requirements applicable to Zones III, V and VI This will help protect areas of the five eastern towns, triggering a need for denitrification at lot sizes of 40,000 sf. This area is environmentally sensitive, relying on isolated aquifers for drinking water, as well as being in critical watersheds Note: this suggestion could be trumped by a more stringent one regarding nitrogen mitigation in watersheds (See XXX below) Also, all hydrogeologic zones could be upgraded to the 40,000 standard, further simplifying the code.
SCSC 760-605 A. 3 and 4 760-605 B. 1 and 2 760-6 05 C 760-605 D 760-607 A 1 and 2 760-607 B 1 and 2 760-607 C 1 a and b 760-607 E and F
Switches the categorization of Zone IV in all references. Impacts:
- Allows the environmentally vulnerable forks to be equably regulated, as portions fall in zones III and V.
- Increases costs to developers who want denser development than allowed currently.
- Much of the area is already up-zoned, so impact is minimal.
- Sets standard for retrofits to higher level if retrofit program is introduced
Related actions: - Retrofit program - Nitrogen mitigation program in watersheds
4 Community systems in existing neighborhoods Currently community systems tend to be installed in new developments proposing densities that exceed current guidelines. This would allow denitrification in existing neighborhoods, with a priority given to communities in environmentally sensitive areas with systems that do not meet current guidelines..
SCSC 760-502 4 a(need for pilot exemptions, new guidance on joining muni/cty projects) 760-605 title 760-605A 5 (new) 760-607 A 5 (new) 760-607 B 4 760 – 607 C 4,5,10(new)
Add “or retrofits to existing neighborhoods” to relevant passages or create a separate section. At issue in existing regulation is allowance to cross property lines and placement in areas without public water. (In fact, areas on individual wells with lots smaller than one acre should be a priority.) Increasing system size from 15,000 to 30,000 would be compatible with a SCDHS study and serve a need for large systems in existing neighborhoods. Some setbacks may possibly be relaxed for existing conditions and some interpretations clarified in guidance documents (Such as open waters vs. vegetated sand filters) . At issue is a requirement that if a community system is present/planned, people would have to hook up. Will pilots be the same? First attempt is to gain voluntary

Clustered Wastewater Treatment for Orient, NY VI-7 Peconic Green Growth, Inc.
participation. Alternative is to do something similar to SCWA, where need a % of property owners to agree, than all need to join. Also would need to offer exemption to properties that invested in enhanced single treatment units. Will also need to develop easement/access agreements (similar to LIPA for transformers?) Impacts:
- Increase cost for existing owners - Increase need for oversight and maintenance - Emergency resilience (both positive and negative) - Improved water quality in existing neighborhoods with
conditions substandard to current regulations - Increased jobs
Related actions:
- Onsite inspection program - SCDHS staffing - Website Management System - Inspector Training Program - Fund for financially disadvantaged (CDC?) - Master plans depicting locations for community systems
and shared treatment - Nitrogen mitigation program - Development of RME (each Town? Private?) - Pilot for single onsite systems
5 Nitrogen Mitigation Program In 50-year influence zone of groundwater to either surface waters in critical watersheds or to public water wells, introduce nitrogen mitigation. For existing neighborhoods, this could be phased in, with new solutions as part of pilots. Initial focus should be in the 0-5 year zones
SCSC 760-605 A 5 (new) 760-605 C and D 760-607 A 5 (New) 760-607 C 1 c (new) 760-706 760-706 A 3 New section/directive Add reuse to options in guidelines/standards
This program would support both retrofit and new development treatment. At issue is deciding the appropriate level of mitigation needed to maintain healthy waters. This is also where some of the controversy will be evident. Targets can be a percentage with many programs starting at 50%, while others aim for 90%. Also a relative nitrogen loading/acreage minimum should be defined as both flow and pound load, guiding when nitrogen mitigation is required (80,000-120,000 for 2 mg/l, up to 8 acres for marine water targets, coupled with usage loads). Targets could be set with an initial default or current TMDL goals that would be replaced by sub-watershed targets once defined by studies and approved policies.

Clustered Wastewater Treatment for Orient, NY VI-8 Peconic Green Growth, Inc.
This program would trump suggestion #3, making it ineffective. For denitrification, but still effective for allowable building densities. The same code sections still need to be addressed. Impacts:
- Increase cost for owners and developers - Increase need for oversight and maintenance - Emergency resilience (both positive and negative) - Improved water quality in existing neighborhoods with
conditions substandard to current regulations - Increased jobs
Related actions:
- Onsite inspection program - SCDHS staffing - Website Management System - Inspector Training Program - Fund for financially disadvantaged (CDC?) - Watershed plans defining/amending TMDL levels - Development of RME (each Town? Private?) - Community systems for existing neighborhoods - Pilot for single onsite systems - New guideline sections for alternative systems and reuse
6 Pilot Program for Alternative Individual Systems, Enhanced Treatment Units and/or Leaching Systems Three-phased program for alternative onsite systems
- Pilot - Probation - Accepted Use
SCSC 760-607 A 5 (new) 760-607 B 6 Residential Standards 5-114A, require maintenance contract
This program would allow the continuous evaluation and installation of new technology for enhanced wastewater treatment. Reuse and extraction should be a subset of this program. It could be coordinated with programs such as EPA’s ETV, URI and MA Septic Testing Facility (Who are jointly applying for a grant to develop apps on performance, etc.) Any system with operating parts should require a maintenance contract. Impacts:
- Increase cost for owners and developers - Increase need for oversight and maintenance - Emergency resilience - Stimulate new industries/products - Improved water quality Increased jobs

Clustered Wastewater Treatment for Orient, NY VI-9 Peconic Green Growth, Inc.
Related actions: - Onsite inspection program - SCDHS staffing - Website Management System - Inspector Training Program - Fund for financially disadvantaged (CDC?) - Watershed plans defining/amending TMDL levels - Development of RME (each Town? Private?) - Community systems for existing neighborhoods - New guideline sections for alternative systems and reuse
7 Inspection program New Directive Require single onsite wastewater systems to be inspected once every five years until a recommended pattern emerges based on data (first one may require pump-out and be more extensive than subsequent inspections). At the beginning, sample homes could be tested more frequently to evaluate seasonal issues/pump-out intervals. Wastewater haulers can be incorporated into program so that input is obtained at the same time as maintenance appointments, reducing overall costs. Impacts:
- Onsite system data collected - Supply data for web-based reporting system - Slight increase in cost for home owners - Educates both owners and government on type and
condition of infrastructure
Related actions: - Cesspool phase-out - Web-based management system - Pilot and enhanced onsite systems - Education/certification program
8 Web-based Management System for Decentralized Wastewater
New Effort Program aimed to help owners, designers, inspectors, responsible management entities and government oversight. Web-based system will ultimately cut costs, speed data evaluation, provide for timely maintenance program, and track effectiveness of systems. Together with the inspection program, could also combine historical data and site GPS records to create reliable data base and interactive maps. This would also help speed and reduce costs

Clustered Wastewater Treatment for Orient, NY VI-10 Peconic Green Growth, Inc.
for the design and permit process. Impacts:
- Accurate data to inform inspection, design and decision-making process
- Reduce costs and time for permits permit streamlining/data access
- More responsibility for homeowners
Related Actions: - Inspection program - Accelerated approval process - Pilot for enhanced onsite program
9 Faster, clearer approval process for alternative systems by the County, NYSDEC, and NYSDOH
Program would be responsive to needs, such as cesspool failure, priority areas, while maintaining quality control when coupled with a web-based reporting program. There would be continuous evaluation/installation of new technology when coupled with the pilot/probation program. (his was identified as having the highest need from meeting participants, together with the cesspool prohibition/phase-out programs.) Impacts:
- Enable more installations of enhanced systems - Greater positive impact to water quality at times of
system failure - Supports the pilot/probation program - Advances the cesspool phase-out and nitrogen mitigation
program - Reduces costs to owner, designer and manufacturer
Related Actions:
- Inspection Program - Pilot for enhanced onsite program - Web-based management system - SCDHS staff dedication to decentralized
10 Education/Certification Program for Inspectors, Responsible Management Entities, designers, installers, as well as develop general information for homeowners
Program will prepare all for new reporting and design standards. Certification will allow for tracking and information dissemination, and coordinated data/system management.

Clustered Wastewater Treatment for Orient, NY VI-11 Peconic Green Growth, Inc.
Impacts: - Better performance of installations through oversight - Better tracking of projects - Increased job opportunity
Related Actions:
- Inspection Program - Pilot for enhanced onsite program - Web-based management system
11 Nitrogen mitigation program for existing commercial systems that do not incorporate denitrification but have equivalent densities of more than 300 gpd per acre in the 50-year influence zone in watersheds
This program would accelerate denitrification in priority areas, as one project could mitigate significant loading. Pilot of interventions as components to the systems will help evaluation of the cost/benefit of varied approaches. Impacts:
- Accelerated denitrification - Evaluation of larger-scaled solutions - Improved water quality - Increase in maintenance/oversight costs
Related Actions:
- Expansion of pilot program - Watershed denitrification program - Web-based management
12 Resilience for Climate Change – Decentralized Systems
Standard: Residential 5 105 B 1 5- 105 B 3 5- 110 2 5 113 exemption for STEP/G Add back flow protectors? Issue re: septic tank depths, waterproofing specification (also contamination), and salt water immersion
This would combine actions from other programs with three main goals:
1. Increased minimum depth to groundwater from 3’ to 4 or 5 feet
2. Waterproof and/or removal of treatment from the flood/SLOSH zones
3. Support redundancy/rebound from natural disasters
Impacts: - Less pollution to groundwater and surface water bodies - Reduced failure due to rises in groundwater levels - Increased cost
Related Actions:
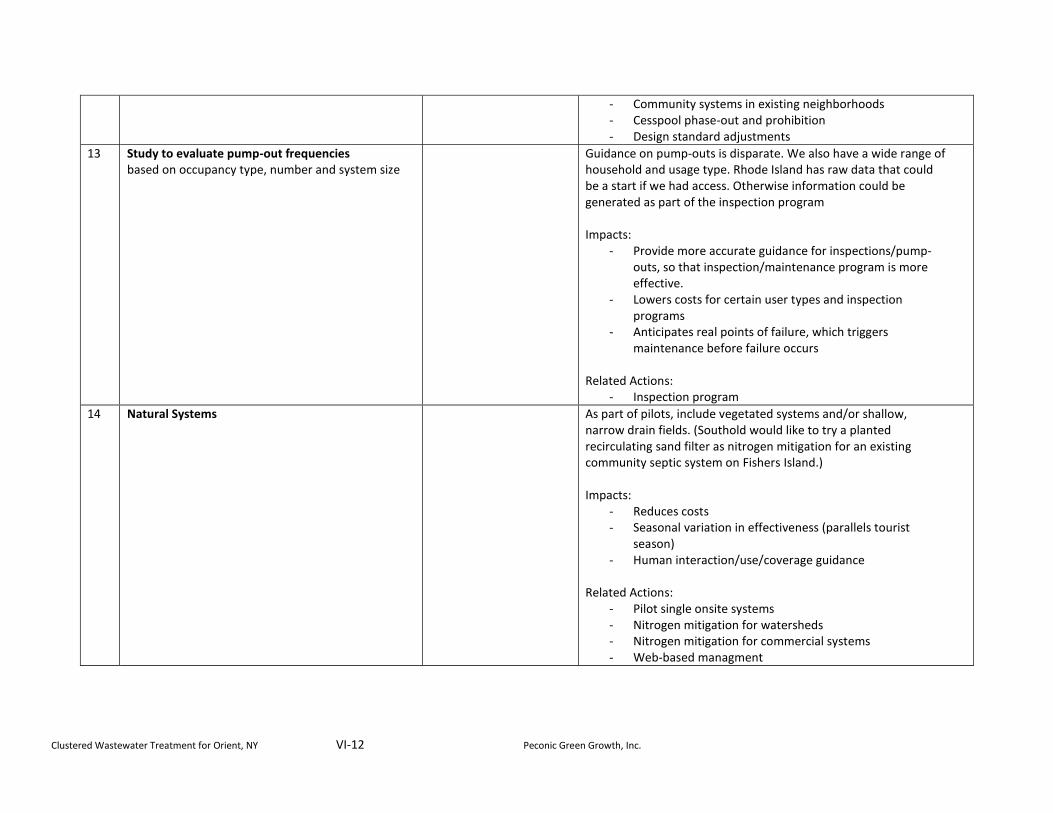
Clustered Wastewater Treatment for Orient, NY VI-12 Peconic Green Growth, Inc.
- Community systems in existing neighborhoods - Cesspool phase-out and prohibition - Design standard adjustments
13 Study to evaluate pump-out frequencies based on occupancy type, number and system size
Guidance on pump-outs is disparate. We also have a wide range of household and usage type. Rhode Island has raw data that could be a start if we had access. Otherwise information could be generated as part of the inspection program Impacts:
- Provide more accurate guidance for inspections/pump-outs, so that inspection/maintenance program is more effective.
- Lowers costs for certain user types and inspection programs
- Anticipates real points of failure, which triggers maintenance before failure occurs
Related Actions: - Inspection program
14 Natural Systems As part of pilots, include vegetated systems and/or shallow, narrow drain fields. (Southold would like to try a planted recirculating sand filter as nitrogen mitigation for an existing community septic system on Fishers Island.) Impacts:
- Reduces costs - Seasonal variation in effectiveness (parallels tourist
season) - Human interaction/use/coverage guidance
Related Actions:
- Pilot single onsite systems - Nitrogen mitigation for watersheds - Nitrogen mitigation for commercial systems - Web-based managment

Clustered Wastewater Treatment for Orient, NY VI-13 Peconic Green Growth, Inc.
15 Cesspool or leaching pit reuse When infrastructure is in good repair, it may be repurposed for use in either the rehabilitated wastewater treatment system or for stormwater management
SC 760-502 4.f SC 760-711
Add “or re-purposed for approved reuse (permitted) as part of a leaching or stormwater system (EPA injection well consideration) Note: Needs guidance documentation Impacts:
- Save money during upgrades/add redundancy for emergencies
Related Actions: Cesspool Phase-out Community systems Onsite Enhanced Systems Resilience for Climate Change
16 Town Program that is More Restrictive than County Regulations
Clear guidance and process is needed for when municipalities choose to have a more restrictive policy than county standards. (For instance EH does have a cesspool prohibition, but other towns have not been successful when trying to obtain improved treatment, density evaluations or TDR restrictions. Also, the County code is less restrictive rather than more restrictive relative to some of the State guidelines.
MISCELLANEOUS ITEMS/QUESTIONS
Clarify definitions of Community Sewerage System. Also limitations of use .
760-601C 760-7 760 607 c 4
Redefine for size, type, as well as ownership. Define community system consistently Cesspool
Residential and Commercial Standards Compatible with Septic Tank Effluent Pump (STEP) systems Pump references Vacuum details Component Design for flexibility Reuse of wastewater Repurpose of leaching/cesspools
“Requires conventional subsurface in addition to xx” 50115 A Composters: only in addition to regular systems. Should we have exceptions to this? If have maintenance contract, sensors? For shallow locations? Otherwise good as adds resiliency – but will never happen due to cost.
Alternative drain fields / recycling sand filters

Clustered Wastewater Treatment for Orient, NY VI-14 Peconic Green Growth, Inc.
E. Dedicated Staff Member for Decentralized Wastewater Issues/Programs Ideally this position would be in the Suffolk County Department of Health Services (SCDHS), the Division of Environmental Quality, responsible for decentralized wastewater treatment for both individual onsite systems and clusters. If the County does not wish to support this position, another alternative would be to have a person jointly supported by participating towns, such as the five East End towns, or by a watershed coalition. Since the East End has surface water issues in three major watersheds and home rule status exists, the municipal coalition might be preferred.
Possible duties include: 1. Oversee design contracts for decentralized clusters and enhanced treatment units 2. Develop and oversee pilot projects for decentralized systems, both single and clustered systems 3. Manage lists of accepted, piloted, and excluded technologies for use in Suffolk County 4. Devise and supervise educational and certification programs for septic system inspectors (most
likely haulers) 5. Devise and supervise education and certification of Responsible Management Entities and/or any
contracts to accomplish these tasks 6. Develop reporting process, including GIS 7. Supervise reporting system for decentralized inspections 8. Develop public educational materials 9. Supervise incentive programs for implementation 10. Track and facilitate approval process for alternative systems and clusters for existing communities,
including coordination with SCDPW Currently there is no staff dedicated to a proactive program addressing decentralized wastewater treatment issues. Review of permit applications is the only active function. While existing and proposed studies evaluate the establishment of sewer districts, they do not compare or evaluate the need for community clusters in existing neighborhoods. While densities in western Suffolk County may support the high costs of sewer districts (densities of 2,403 persons per square mile, Eastern Suffolk has densities of 395 persons per square mile. (P 1-4 SCCP). The Suffolk County Department of Health Services intends to let a contract to investigate enhanced treatment units for small onsite systems and conduct planning tasks. Cost: up to $100,000 per year Responsibility: Either County or municipalities (Note: Subsequent to the May 22 meeting, SCDHS hired back a retired employee on a part-time basis to address decentralized issues and work on final aspect of SCCWRMP.
F. Proposal for Cesspool Phase-out and Prohibition (Short, medium and long-term)
Cesspools will no longer be allowed to be installed in Suffolk County When a cesspool is replaced it will be with one of the following:
a. connection to an existing or new sewer district b. connection to a community system c. compliant onsite septic system d. if in a location requiring a more stringent design, an enhanced system as described
separately

Clustered Wastewater Treatment for Orient, NY VI-15 Peconic Green Growth, Inc.
A. When a cesspool fails it must be replaced as soon as possible within a time limit of one year for failure type i- iii, three years for iv-vi, and five years for vii – viii.
Failure is defined as one of the following:
i the cesspool fails to accept or dispose of sewage, as evidenced by sewage on the ground surface above or adjacent to the cesspool, or in the building served.
ii. the liquid depth in a cesspool is less than six (6) inches from the inlet pipe invert iii. pumping is required more than two (2) times a year iv. the cesspool is within 200 feet of a public drinking water well or surface water body v. the cesspool is within 150 feet of a private drinking well vi. the bottom of the cesspool is less than three feet to groundwater vii. the cesspool is in a flood or SLOSH zone viii. the cesspool is on a lot of less than one-half acre in size
B. Within one year of a sale of a home, any cesspool will be required to be replaced.
C. When a home is renovated where the renovation costs are at least 30% of the value of the home or $100,000 whichever is less, any existing cesspool must be replaced.
D. Any cesspool larger than 1000 gal must be replaced within one year
E. When upgrading a cesspool, enhanced treatment for nitrogen mitigation shall be
required in designated watersheds: a. Long Island Sound Watershed b. Peconic Estuary Watershed c. South Shore Estuary Reserve Watershed d. Forge River Watershed e. Within 200 feet of any surface water body f. Any specially designated communities or locations where more stringent municipal
regulations apply.
F. Exemptions: a. Systems planned to be incorporated within a proposed sewer district or expansion of an
existing system by ______________. b. Systems to be incorporated within a community system by _________ c. Systems on lots where the estimated nitrogen levels are calculated to be no more than
0.5 mg/l (this can be anywhere from 0.5 to 2 mg/l) after area dilution through lot size is considered.
d. A land conservation program designed to counter nitrogen mitigation on adjacent lands abutting surface waters.
e. Proven hardship, allowed five years for compliance Note: Requirements other than failure could be phased in by targeting systems in phases based on the travel time it takes groundwater to reach surface water bodies. Year Cesspools in 0-2 year influence zones _______ Cesspools in 2-5 year influence zones _______ Cesspools in 5-10 year influence zones _______ Cesspools in 10-25 year influence zones _______ Cesspools in 25-50 year influence zones _______

Clustered Wastewater Treatment for Orient, NY VI-16 Peconic Green Growth, Inc.
The nitrogen mitigation program should be coordinated with pilot, system inspection or evaluation, installer/inspector certification, Responsible Management Entities certification, and incentive programs.
Discussion: In Suffolk County cesspools were allowed for onsite wastewater treatment until 1973, when septic systems were required for new construction. Unless an alteration increases wastewater loading, cesspools are still allowed to be reinstalled when replacing an existing cesspool. Cesspools allow untreated sewage to percolate directly to soil and groundwater. They dispose of wastewater, rather than treat it. Disease-causing pathogens can exit the system and enter groundwater. Dissolved particles can leach into the soil, filling voids, hindering percolation, and impacting the natural oxidation process. According to a major research program, nowhere else in the United States allows the replacement of a cesspool with another cesspool. Seventy-five percent of County buildings utilize onsite septic systems. “Out of the 325,777 homes in Suffolk County that predate the Sanitary Code (1973), there are approximately 252,530 homes that are not on sewers and do not have a sanitary system that conforms to Standards.” For the five eastern towns the estimated number is 24,138. (Based on 1970 census data, P 8, Suffolk County Decentralized Wastewater Needs Survey SCDWNS) Many of these cesspools are in vulnerable locations. For instance in Southampton, 15.2% of all buildings are cesspools in the 0-2 year influence zone where groundwater contributes to surface water bodies.4206 buildings in Southampton are assumed to have cesspools and are sited on one-quarter (1/4) acre lots or smaller.(PGG) Most of the five eastern towns are expected to experience a rise of one-to-two feet in groundwater levels due to climate change by 2080, and this is a conservative number. As a result it can be expected that all cesspools at elevations of 13’ or below are likely to fail due to depth to groundwater issues. Providing solutions to vulnerable cesspool and septic systems in flood, surge or shallow depths to groundwater will add resiliency to the vital communities lining the coast. Costs As described in the SCDWNS, the average cost for a 1,500 gallon septic system is $6,880 including abandonment of the cesspool. Special conditions raise this price to $19,346 for a deep system and $53,230 for a raised, shallow system. An enhanced system can cost between $20,000 and $35,000. If 25,000 units were targeted (10% of the county total), assuming the same overall percentage breakdown as the County Needs Report, 95 units could be upgraded for every million dollar investment. It may be possible to lower unit costs by reusing existing cesspools, contracting for bulk prices for approved systems, or installing community solutions to units on small lots. Standard: 53.3% Deep: 25.5% Shallow: 21.2%
$533,000 77
$255,000 13
$212,000 4
$1,000,000 95 If the program prioritizes projects along the coast and in flood zones, if one considered all having enhanced treatment, costing $25,000, 40 could be installed per one million dollars.

Clustered Wastewater Treatment for Orient, NY VI-17 Peconic Green Growth, Inc.
Financing A revolving loan program and/or incentive/grant program needs to be available for people upgrading. Below are several charts showing funding scenarios for a revolving loan program. All assume a five-year payback period, servicing full costs for 95 units per million dollars or an average cost of $10,526 per unit. This simple analysis assumes that interest rates equal inflation, so no accounting for this differentiation was made. If the loan program were limited to residents with incomes below the median, private capital investment is leveraged. Assuming half the target property owners meet income criteria, and 25% of those are second home owners due to the tourist nature of coastal properties, 9375 owners would be expected to need access to the revolving loan fund. A larger fund amount at the start of the program will help realize impacts sooner. This program should be coupled with a grant program for enhanced treatment and nitrogen mitigation. Assuming an incremental cost of $10,000 per dwelling unit, 100 upgrades would be accomplished for every $1,000,000 invested. With both the revolving loan fund and grant program, the same ratios for upgrades and enhanced treatment could be offered for community systems as well as single onsite systems. There is also a need for funds to cover engineering fees for community systems. Attached is a ranking sheet to assess priorities of applications. Income criteria should also be considered.
Scenario 1 Scenario 2 Scenario 3
Cash Added Return # Cash Added Return # Cash Added Return #
Year 1 $5,000,000 475 $5,000,000 475 $3,000,000 475
Year 2 $1,000,000 95 $1,000,000 $1,000,000 190 $3,000,000 $600,000 342
Year 3 $1,200,000 114 $1,000,000 $1,400,000 228 $3,000,000 $1,320,000 410
Year 4 $1,440,000 137 $1,000,000 $1,880,000 274 $3,000,000 $2,184,000 492
Year 5 $1,728,000 164 $1,000,000 $2,456,000 328 $3,000,000 $3,220,800 591
Year 6 $2,073,600 197 $1,000,000 $3,147,200 394 $3,000,000 $4,464,960 709
Year 7 $1,488,320 141 $1,000,000 $2,976,640 378 $3,000,000 $5,357,952 794
Year 8 $1,585,984 151 $1,000,000 $3,371,968 415 $3,000,000 $6,309,542 884
Year 9 $1,663,181 158 $1,000,000 $3,766,362 453 $3,000,000 $7,307,451 979
Year 10 $1,707,817 162 $1,000,000 $4,143,634 489 $3,000,000 $8,332,141 1077
Year 11 $1,703,780 162 $1,000,000 $4,481,161 521 $3,000,000 $9,354,409 1174
Year 12 $1,629,816 155 $1,000,000 $4,747,953 546 $3,000,000 $10,332,299 1267
Year 13 $1,658,116 158 $1,000,000 $5,102,215 580 $3,000,000 $11,327,169 1361
Year 14 $1,672,542 159 $1,000,000 $5,448,265 613 $3,000,000 $12,330,694 1456
Year 15 $1,674,414 159 $1,000,000 $5,784,646 645 $3,000,000 $13,335,342 1552
Year 16 $1,667,734 158 $1,000,000 $6,112,848 676 $3,000,000 $14,335,983 1647
Year 17 $1,660,524 158 $1,000,000 $6,439,185 707 $3,000,000 $15,332,297 1742
Year 18 $1,666,666 158 $1,000,000 $6,777,432 739 $3,000,000 $16,332,297 1837
Year 19 $1,668,376 158 $1,000,000 $7,112,475 771 $3,000,000 $17,333,323 1932
Year 20 $1,667,543 158 $1,000,000 $7,445,317 802 $3,000,000 $18,333,848 2027
$5,000,000 $30,556,414 3378 $24,000,000 $83,593,300 10221 $60,000,000 $177,444,507 22747
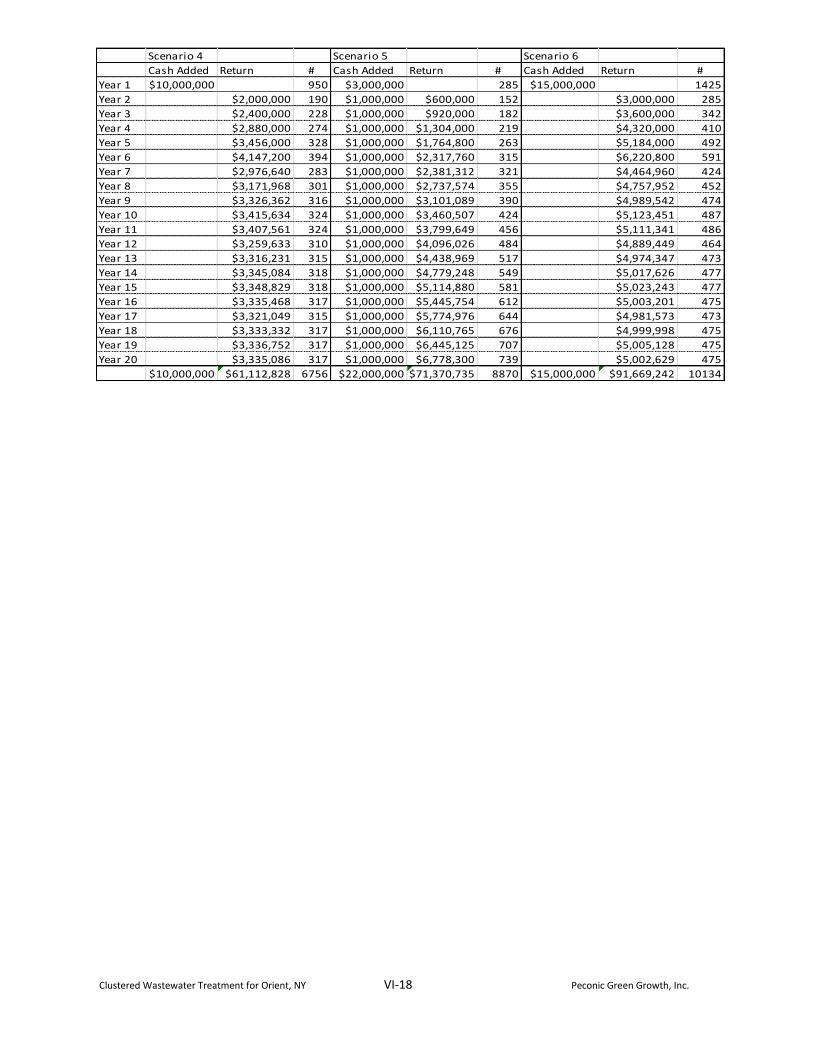
Clustered Wastewater Treatment for Orient, NY VI-18 Peconic Green Growth, Inc.
Scenario 4 Scenario 5 Scenario 6
Cash Added Return # Cash Added Return # Cash Added Return #
Year 1 $10,000,000 950 $3,000,000 285 $15,000,000 1425
Year 2 $2,000,000 190 $1,000,000 $600,000 152 $3,000,000 285
Year 3 $2,400,000 228 $1,000,000 $920,000 182 $3,600,000 342
Year 4 $2,880,000 274 $1,000,000 $1,304,000 219 $4,320,000 410
Year 5 $3,456,000 328 $1,000,000 $1,764,800 263 $5,184,000 492
Year 6 $4,147,200 394 $1,000,000 $2,317,760 315 $6,220,800 591
Year 7 $2,976,640 283 $1,000,000 $2,381,312 321 $4,464,960 424
Year 8 $3,171,968 301 $1,000,000 $2,737,574 355 $4,757,952 452
Year 9 $3,326,362 316 $1,000,000 $3,101,089 390 $4,989,542 474
Year 10 $3,415,634 324 $1,000,000 $3,460,507 424 $5,123,451 487
Year 11 $3,407,561 324 $1,000,000 $3,799,649 456 $5,111,341 486
Year 12 $3,259,633 310 $1,000,000 $4,096,026 484 $4,889,449 464
Year 13 $3,316,231 315 $1,000,000 $4,438,969 517 $4,974,347 473
Year 14 $3,345,084 318 $1,000,000 $4,779,248 549 $5,017,626 477
Year 15 $3,348,829 318 $1,000,000 $5,114,880 581 $5,023,243 477
Year 16 $3,335,468 317 $1,000,000 $5,445,754 612 $5,003,201 475
Year 17 $3,321,049 315 $1,000,000 $5,774,976 644 $4,981,573 473
Year 18 $3,333,332 317 $1,000,000 $6,110,765 676 $4,999,998 475
Year 19 $3,336,752 317 $1,000,000 $6,445,125 707 $5,005,128 475
Year 20 $3,335,086 317 $1,000,000 $6,778,300 739 $5,002,629 475
$10,000,000 $61,112,828 6756 $22,000,000 $71,370,735 8870 $15,000,000 $91,669,242 10134

Clustered Wastewater Treatment for Orient, NY VI-19 Peconic Green Growth, Inc.
A COMBINED PROGRAM: The following is a recommended program combining an upgrade loan program, grants for enhanced treatment and funds for decentralized cluster design. The intent is to provide a decentralized program appropriate for the lower-density communities in vulnerable, environmentally sensitive locations, typical of the East End. This is proposed to augment, not replace the sewer design projects being planned in western Suffolk County. The program assumes $6,000,000 per year for the first two years, $7,000,000 in years three through five, and five million per year afterwards. Any money not used would be rolled over for use in the following years to accommodate education, pilot programs, design and permitting lags.
Cash Added Return # Cash Added Return # Cash Added Return #
Year 1 $3,000,000 285 $1,500,000 150 $1,500,000 750
Year 2 $3,000,000 $600,000 342 $1,500,000 150 $1,500,000 750
Year 3 $3,000,000 $1,320,000 410 $3,000,000 300 $1,000,000 500
Year 4 $3,000,000 $2,184,000 492 $3,000,000 300 $1,000,000 500
Year 5 $3,000,000 $3,220,800 591 $3,000,000 300 $1,000,000 500
Year 6 $1,000,000 $4,464,960 519 $3,000,000 300 $1,000,000 500
Year 7 $1,000,000 $4,957,952 566 $3,000,000 300 $1,000,000 500
Year 8 $1,000,000 $5,429,542 611 $3,000,000 300 $1,000,000 500
Year 9 $1,000,000 $5,851,451 651 $3,000,000 300 $1,000,000 500
Year 10 $1,000,000 $6,184,941 683 $3,000,000 300 $1,000,000 500
Year 11 $1,000,000 $6,377,769 701 $3,000,000 300 $1,000,000 500
Year 12 $1,000,000 $6,760,331 737 $3,000,000 300 $1,000,000 500
Year 13 $1,000,000 $7,120,807 771 $3,000,000 300 $1,000,000 500
Year 14 $1,000,000 $7,459,060 804 $3,000,000 300 $1,000,000 500
Year 15 $1,000,000 $7,780,582 834 $3,000,000 300 $1,000,000 500
Year 16 $1,000,000 $8,099,710 864 $3,000,000 300 $1,000,000 500
Year 17 $1,000,000 $8,444,098 897 $3,000,000 300 $1,000,000 500
Year 18 $1,000,000 $8,780,851 929 $3,000,000 300 $1,000,000 500
Year 19 $1,000,000 $9,112,860 961 $3,000,000 300 $1,000,000 500
Year 20 $1,000,000 $9,443,620 992 $3,000,000 300 $1,000,000 500
$30,000,000 $113,593,334 13641 $57,000,000 $0 5700 $21,000,000 $0 10500
Scenario 7
Revolving Loan Section
Scenario 7
Grants for enhancement $10,000
per dwelling unit
Scenario 7 Design
funds for decentralized clusters or
expansions of existing systems
Considerations: - Suffolk County Department of Health Services should be updated to reflect new policy and
standards supportive of the program. - The opportunity to upgrade needs to be more attractive than non-action. - Evaluation, oversight, and disciplinary action of noncompliance need to be incorporated. - An inspection program should be developed simultaneously. To counter fears of uncontrolled development if wastewater is advanced, the following will help counter this:
i. Incorporate total pounds of nitrogen as well as flow into regulations, standards and guidance.
ii. Incorporate TMDL and watershed nitrogen mitigation goals in standards with comparable minimum lot sizes (enlarged).
iii. Focus efforts/funding on existing noncompliant installations
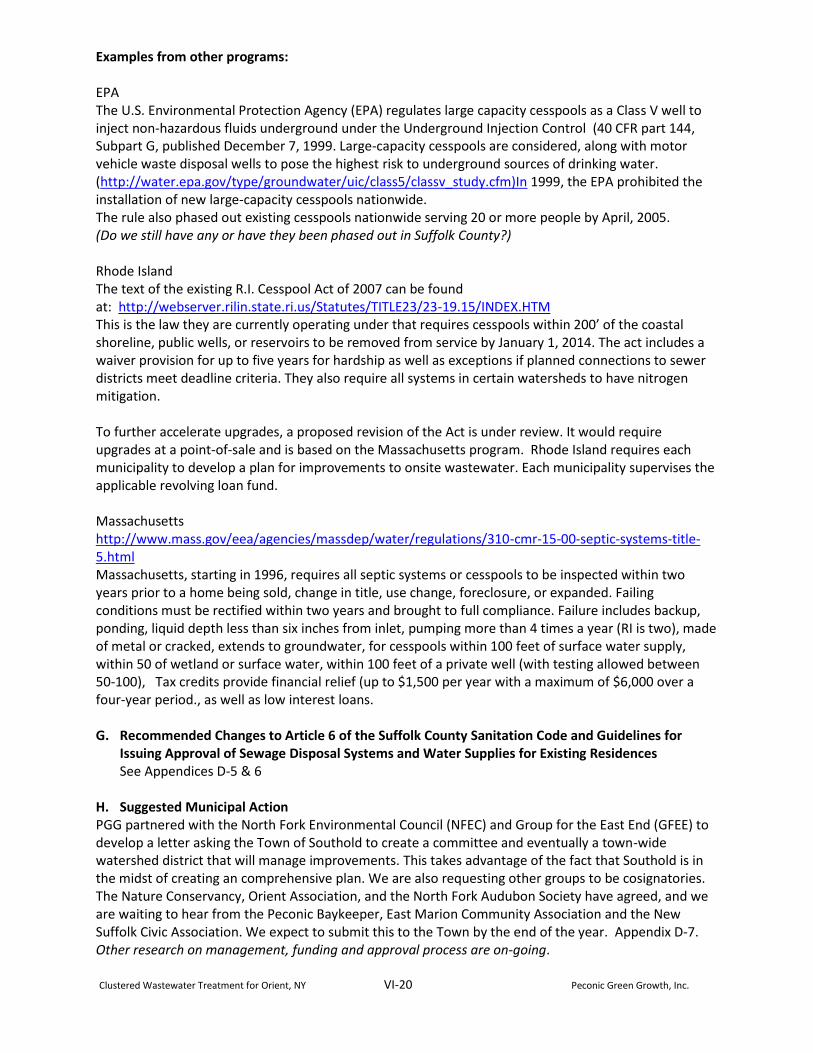
Clustered Wastewater Treatment for Orient, NY VI-20 Peconic Green Growth, Inc.
Examples from other programs: EPA The U.S. Environmental Protection Agency (EPA) regulates large capacity cesspools as a Class V well to inject non-hazardous fluids underground under the Underground Injection Control (40 CFR part 144, Subpart G, published December 7, 1999. Large-capacity cesspools are considered, along with motor vehicle waste disposal wells to pose the highest risk to underground sources of drinking water. (http://water.epa.gov/type/groundwater/uic/class5/classv_study.cfm)In 1999, the EPA prohibited the installation of new large-capacity cesspools nationwide. The rule also phased out existing cesspools nationwide serving 20 or more people by April, 2005. (Do we still have any or have they been phased out in Suffolk County?) Rhode Island The text of the existing R.I. Cesspool Act of 2007 can be found at: http://webserver.rilin.state.ri.us/Statutes/TITLE23/23-19.15/INDEX.HTM This is the law they are currently operating under that requires cesspools within 200’ of the coastal shoreline, public wells, or reservoirs to be removed from service by January 1, 2014. The act includes a waiver provision for up to five years for hardship as well as exceptions if planned connections to sewer districts meet deadline criteria. They also require all systems in certain watersheds to have nitrogen mitigation. To further accelerate upgrades, a proposed revision of the Act is under review. It would require upgrades at a point-of-sale and is based on the Massachusetts program. Rhode Island requires each municipality to develop a plan for improvements to onsite wastewater. Each municipality supervises the applicable revolving loan fund. Massachusetts http://www.mass.gov/eea/agencies/massdep/water/regulations/310-cmr-15-00-septic-systems-title-5.html Massachusetts, starting in 1996, requires all septic systems or cesspools to be inspected within two years prior to a home being sold, change in title, use change, foreclosure, or expanded. Failing conditions must be rectified within two years and brought to full compliance. Failure includes backup, ponding, liquid depth less than six inches from inlet, pumping more than 4 times a year (RI is two), made of metal or cracked, extends to groundwater, for cesspools within 100 feet of surface water supply, within 50 of wetland or surface water, within 100 feet of a private well (with testing allowed between 50-100), Tax credits provide financial relief (up to $1,500 per year with a maximum of $6,000 over a four-year period., as well as low interest loans.
G. Recommended Changes to Article 6 of the Suffolk County Sanitation Code and Guidelines for
Issuing Approval of Sewage Disposal Systems and Water Supplies for Existing Residences See Appendices D-5 & 6
H. Suggested Municipal Action PGG partnered with the North Fork Environmental Council (NFEC) and Group for the East End (GFEE) to develop a letter asking the Town of Southold to create a committee and eventually a town-wide watershed district that will manage improvements. This takes advantage of the fact that Southold is in the midst of creating an comprehensive plan. We are also requesting other groups to be cosignatories. The Nature Conservancy, Orient Association, and the North Fork Audubon Society have agreed, and we are waiting to hear from the Peconic Baykeeper, East Marion Community Association and the New Suffolk Civic Association. We expect to submit this to the Town by the end of the year. Appendix D-7. Other research on management, funding and approval process are on-going.

FOOTNOTES 1. Stephenson, L.B., Eelgrass Management Plan for the Peconic Estuary, Yaphank, NY: Peconic Estuary
Program, 2009, 7 2. Peconic Estuary Comprehensive Conservation Management Plan, Table 3-1 3. Suffolk County North Shore Embayments Watershed Management Plan, Volume I, Long Island
Sound Zone 11, November 2007 prepared by North Shore Embayments Consulting Team of Nelson, Pope & Voorhis and EEA, Inc. for Suffolk County Department of Health Services Division of Environmental Quality
4. A Total Maximum Daily Load Analysis to Achieve Water Quality Standards for Dissolved Oxygen in Long Island Sound Prepared in Conformance with Section 303(d) of the Clean Water Act and the Long Island Sound Study. Prepared by NYSDEC and Connecticut DEP, 2000, Tables 6 + 7
5. USGS monitoring station 01304200 Orient Harbor at Orient, NY operated in cooperation with Peconic Estuary Program, Suffolk County Department of Health Services
http://waterdata.usgs.gov/ny/nwis/uv/?site_no=01304200 6. Salveson, Andrew, Zhi Zhou, Brad A. Finney, Mary Burke, and Jong Chan Ly, Low-Cost Treatment
Technologies for Small-Scale Water Reclamation Plants, Alexandria, VA: Water Use Foundation, 2009 Appendix D, Table D, 85
7. SCCWRMP P 3-104ff 8. The Nature Conservancy, www.coastalresilience.org 9. Standards Approval of Plans and Construction – Sewage Disposal Systems for Single-Family
Residences, Suffolk County Department of Health Services Division of Environmental Quality, 1995, Tables 3 & 4, 18
10. Ibid., 5-106-B2, 6. 11. Ibid, 5-105-B3, P5
12. Ibid, 5-105 B 1, 5. 13. Ibid, 5-105 B5, 5. 14. SC Summary of Findings for Suffolk County Comprehensive Water Resources Management Plan
15. SCCWRMP, 5-47. 16. Salveson, Andrew, Zhi Zhou, Brad A. Finney, Mary Burke, and Jong Chan Ly, Low-Cost Treatment
Technologies for Small-Scale Water Reclamation Plants, Water Use Foundation, Alexandria, VA, 2009 17. Kinney, E.L. and Valiela, I., 2011, “Nitrogen Loading to Great South Bay: Land Use, Sources,
Retention, and Transport from Land to Bay,” Journal of Coastal Research, West Palm Beach, Florida, 27, 4, 679.
18. Pio Lombardo, correspondence, September 15, 2011. 19 Comparison of Costs for Wastewater Management Systems Applicable to Cape Cod, Guidance to
Cape Cod Towns Undertaking Comprehensive Wastewater Management Planning, 2010 prepared by Barnstable County Wastewater Cost Task Force for the Association to Preserve Cape Code, Cape Code Business Roundtable, and Cape Cod Water Protection Collaborative, P 38 ff.
20. Kinney and Valiela, Nitrogen Loading to GSB: Land Use, Sources, Retention, and Transport from Land to Bay, 677
21 SCCWRMP Figure 5-9 22 SCCWRMP Summary of Key Findings P2 (See Appendix D-1 40. Peconic Estuary CCMP, 2-15 41. Suffolk County Comprehensive Plan 2035 Volume One A: Inventory, Haupauge, NY, 2011, 3-4 42. EPA.gov 43. Onsite Wastewater Treatment Systems Manual EPA/625/R-00/008, February 2002, Ch.1, Table 1-3.
http://www.epa.gov/nrmrl/pubs/625r00008/html/625R00008.htm

APPENDIX A
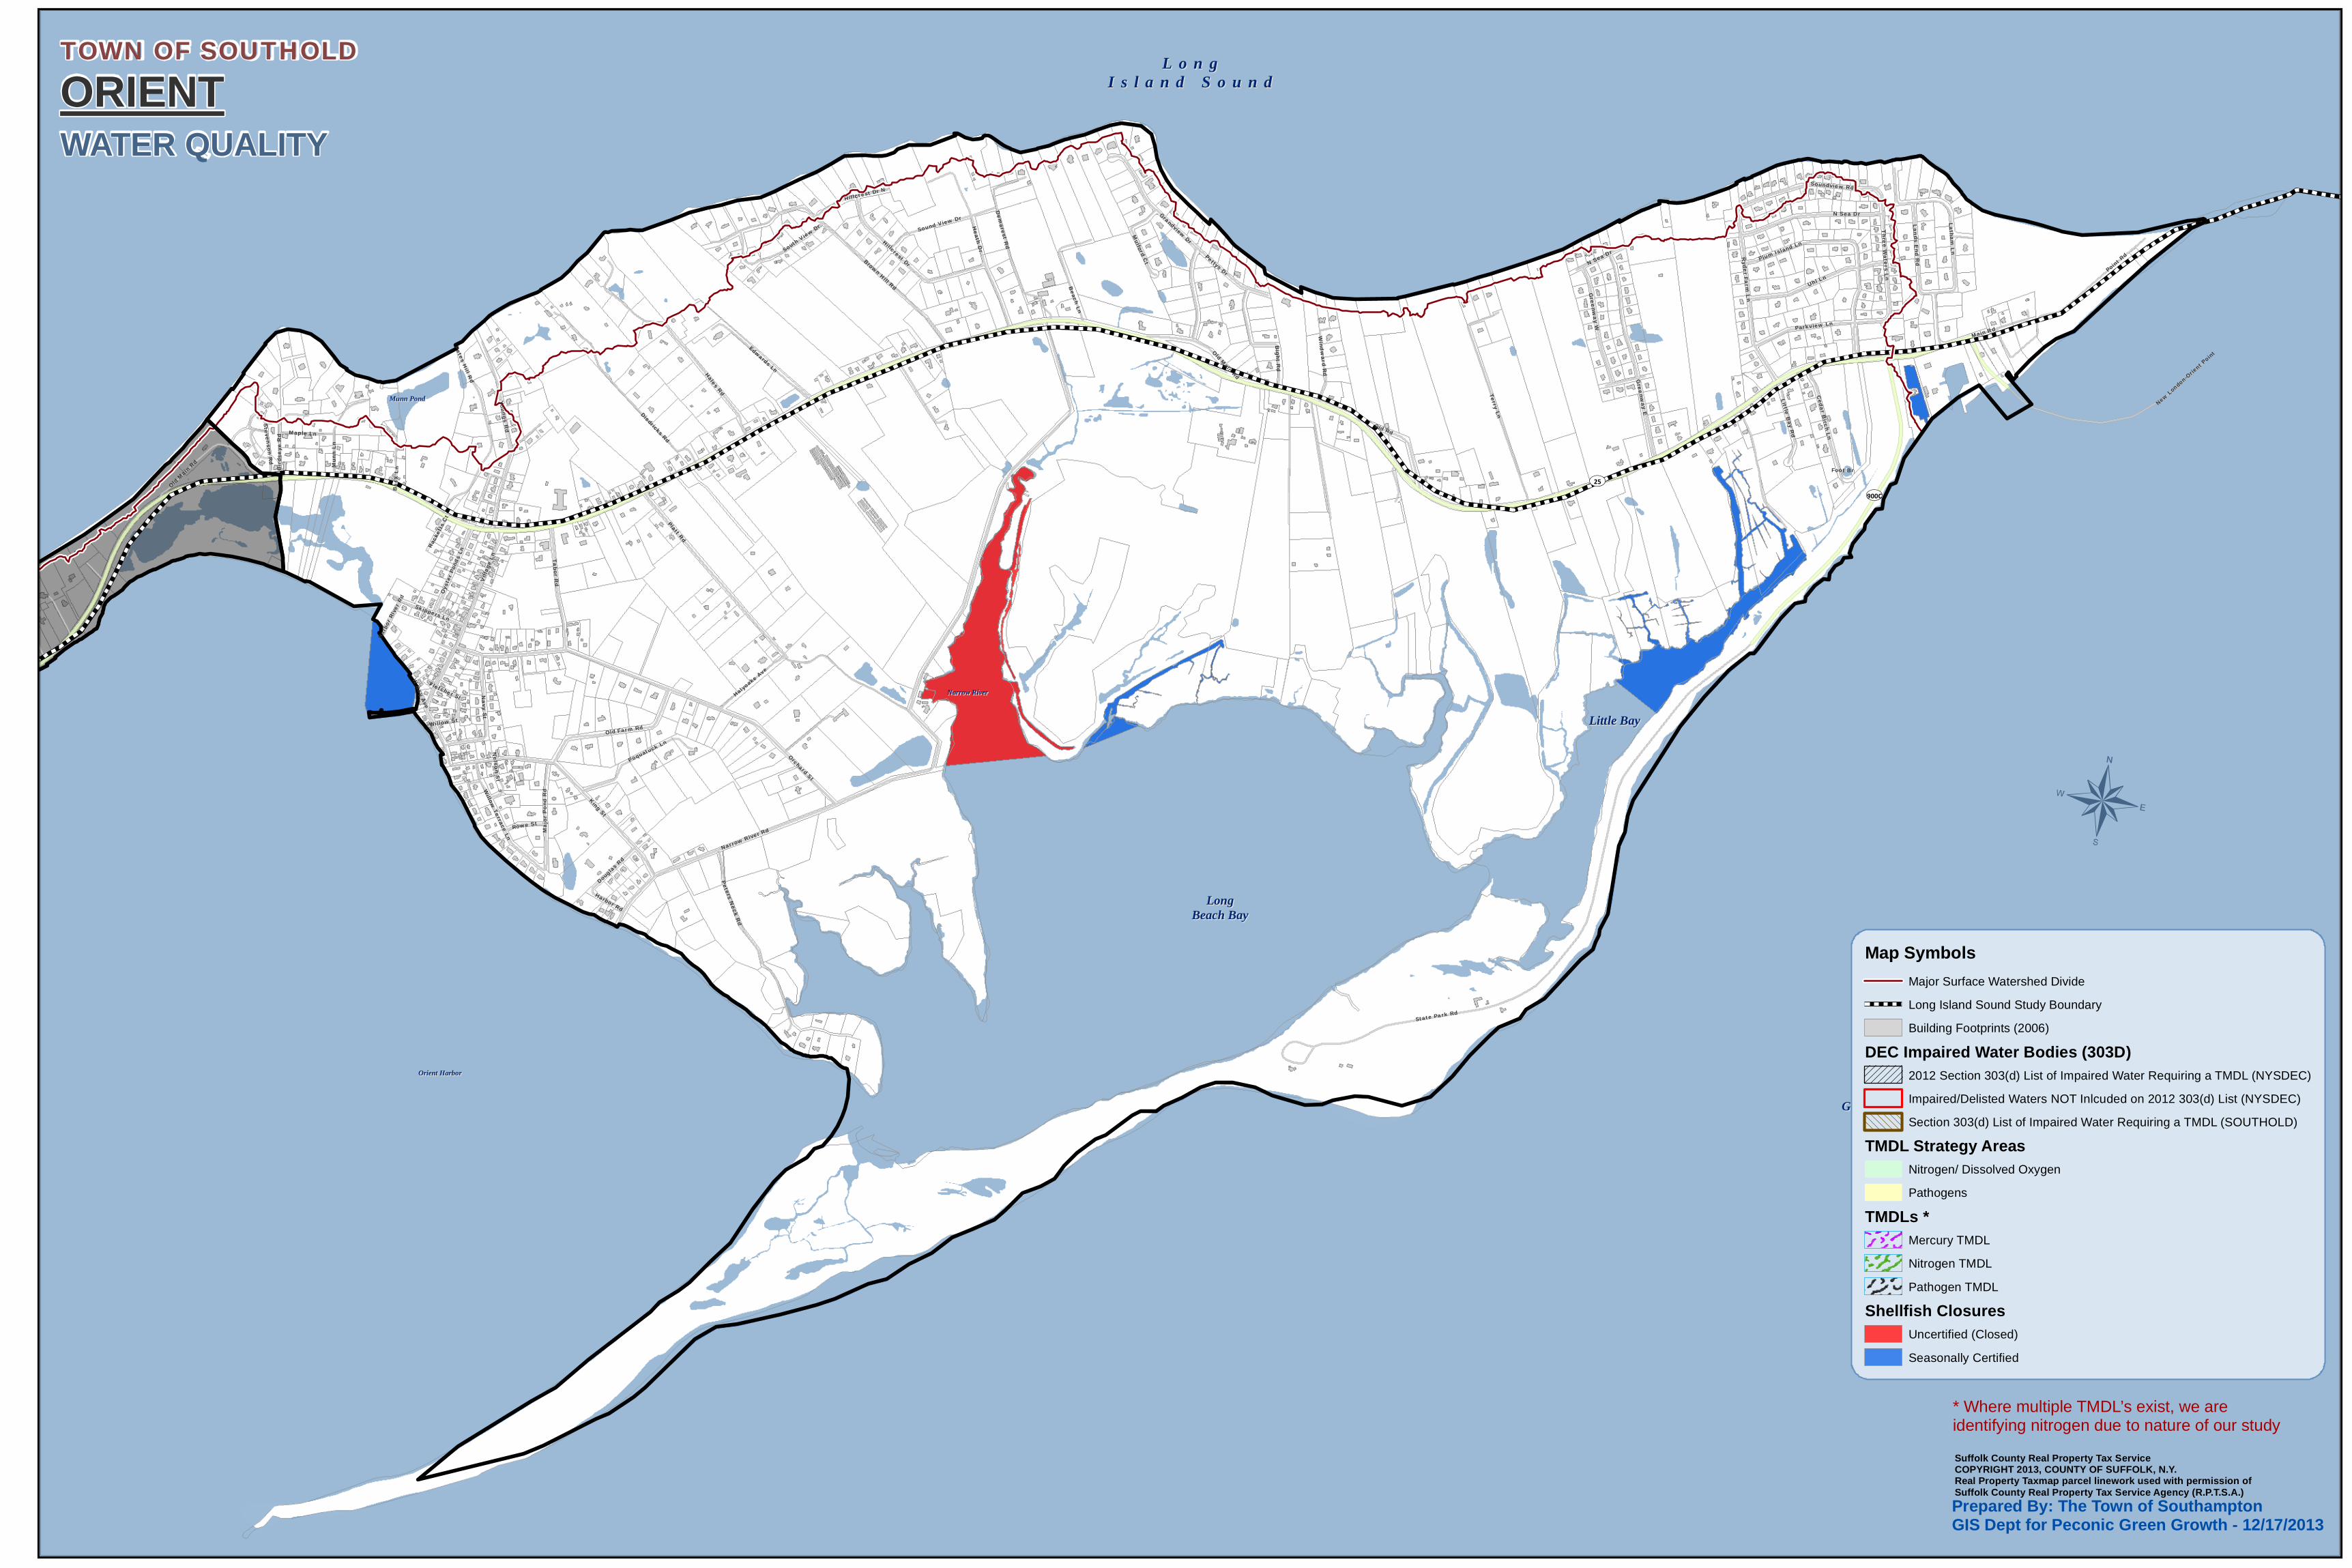
Narrow RiverNarrow River
Gardiners BayGardiners Bay
LongLongBeach BayBeach Bay
Little BayLittle Bay
Munn PondMunn Pond
Orient HarborOrient Harbor
L o n gL o n gI s l a n d S o u n dI s l a n d S o u n d
UV900CUV25
Narrow River Rd
State Park Rd
Platt Rd
Orchard St
King St
Hales Rd
Vill
age
Ln
Terry Ln
Youngs Rd
Uhl Ln
Gree
nway E
Point Rd
Diedricks Rd
N Sea Dr
Old Rd
Grandview Dr
Brown Hill Rd
Tabor R
d
Lands E
nd Rd
Heath D
r
Na vy S
t
Hillcrest Dr
Petes Hill R
d
Peters Neck R
d
Bight R
d
Ryde
r Far m
Ln
Dem
arest Rd
Old Farm Rd
Edwards Ln
Parkview Ln
Soundview Rd
Plum Island Ln
Mun
n L
n
Gree
nway W
Pettys Dr
Beach Ln
La th am L n
Old M
ain
Rd
Poquatuck Ln
Cedar B
irch Ln
New Lon
don-O
rient P
oint
Th re
e Waters Ln
Sound View Dr
Bac
k L
n
Maj
or P
ond
RdW
illow Terrace Ln
Lit tle B
ay Rd
Mulford C
t
Maple Ln
South View Dr
Bir
dse
ye R
d
Oys
ter
Pond
s Ln
Wind
ward R
d
Halyoake A
ve
Skippers Ln
Hillcrest Dr N
Dougla
s Rd
W B
ay Ave
Rowe St
Nelso
n St
Harbor Rd
Main Rd
Rac
kett
s C
t
Steven
s on Rd
Fletcher St
Har
bor
Rive
r R
d
Willow St
Foot Br
N Sea Dr
Old Main Rd
TOWN OF SOUTHOLD
ORIENT
Map Symbols
Major Surface Watershed Divide
Long Island Sound Study Boundary
Building Footprints (2006)
DEC Impaired Water Bodies (303D)
2012 Section 303(d) List of Impaired Water Requiring a TMDL (NYSDEC)
Impaired/Delisted Waters NOT Inlcuded on 2012 303(d) List (NYSDEC)
Section 303(d) List of Impaired Water Requiring a TMDL (SOUTHOLD)
TMDL Strategy Areas
Nitrogen/ Dissolved Oxygen
Pathogens
TMDLs *
Mercury TMDL
Nitrogen TMDL
Pathogen TMDL
Shellfish Closures
Uncertified (Closed)
Seasonally Certified
¬
WATER QUALITY
Suffolk County Real Property Tax ServiceCOPYRIGHT 2013, COUNTY OF SUFFOLK, N.Y.Real Property Taxmap parcel linework used with permission ofSuffolk County Real Property Tax Service Agency (R.P.T.S.A.)
Prepared By: The Town of Southampton GIS Dept for Peconic Green Growth - 12/17/2013
* Where multiple TMDL’s exist, we areidentifying nitrogen due to nature of our study
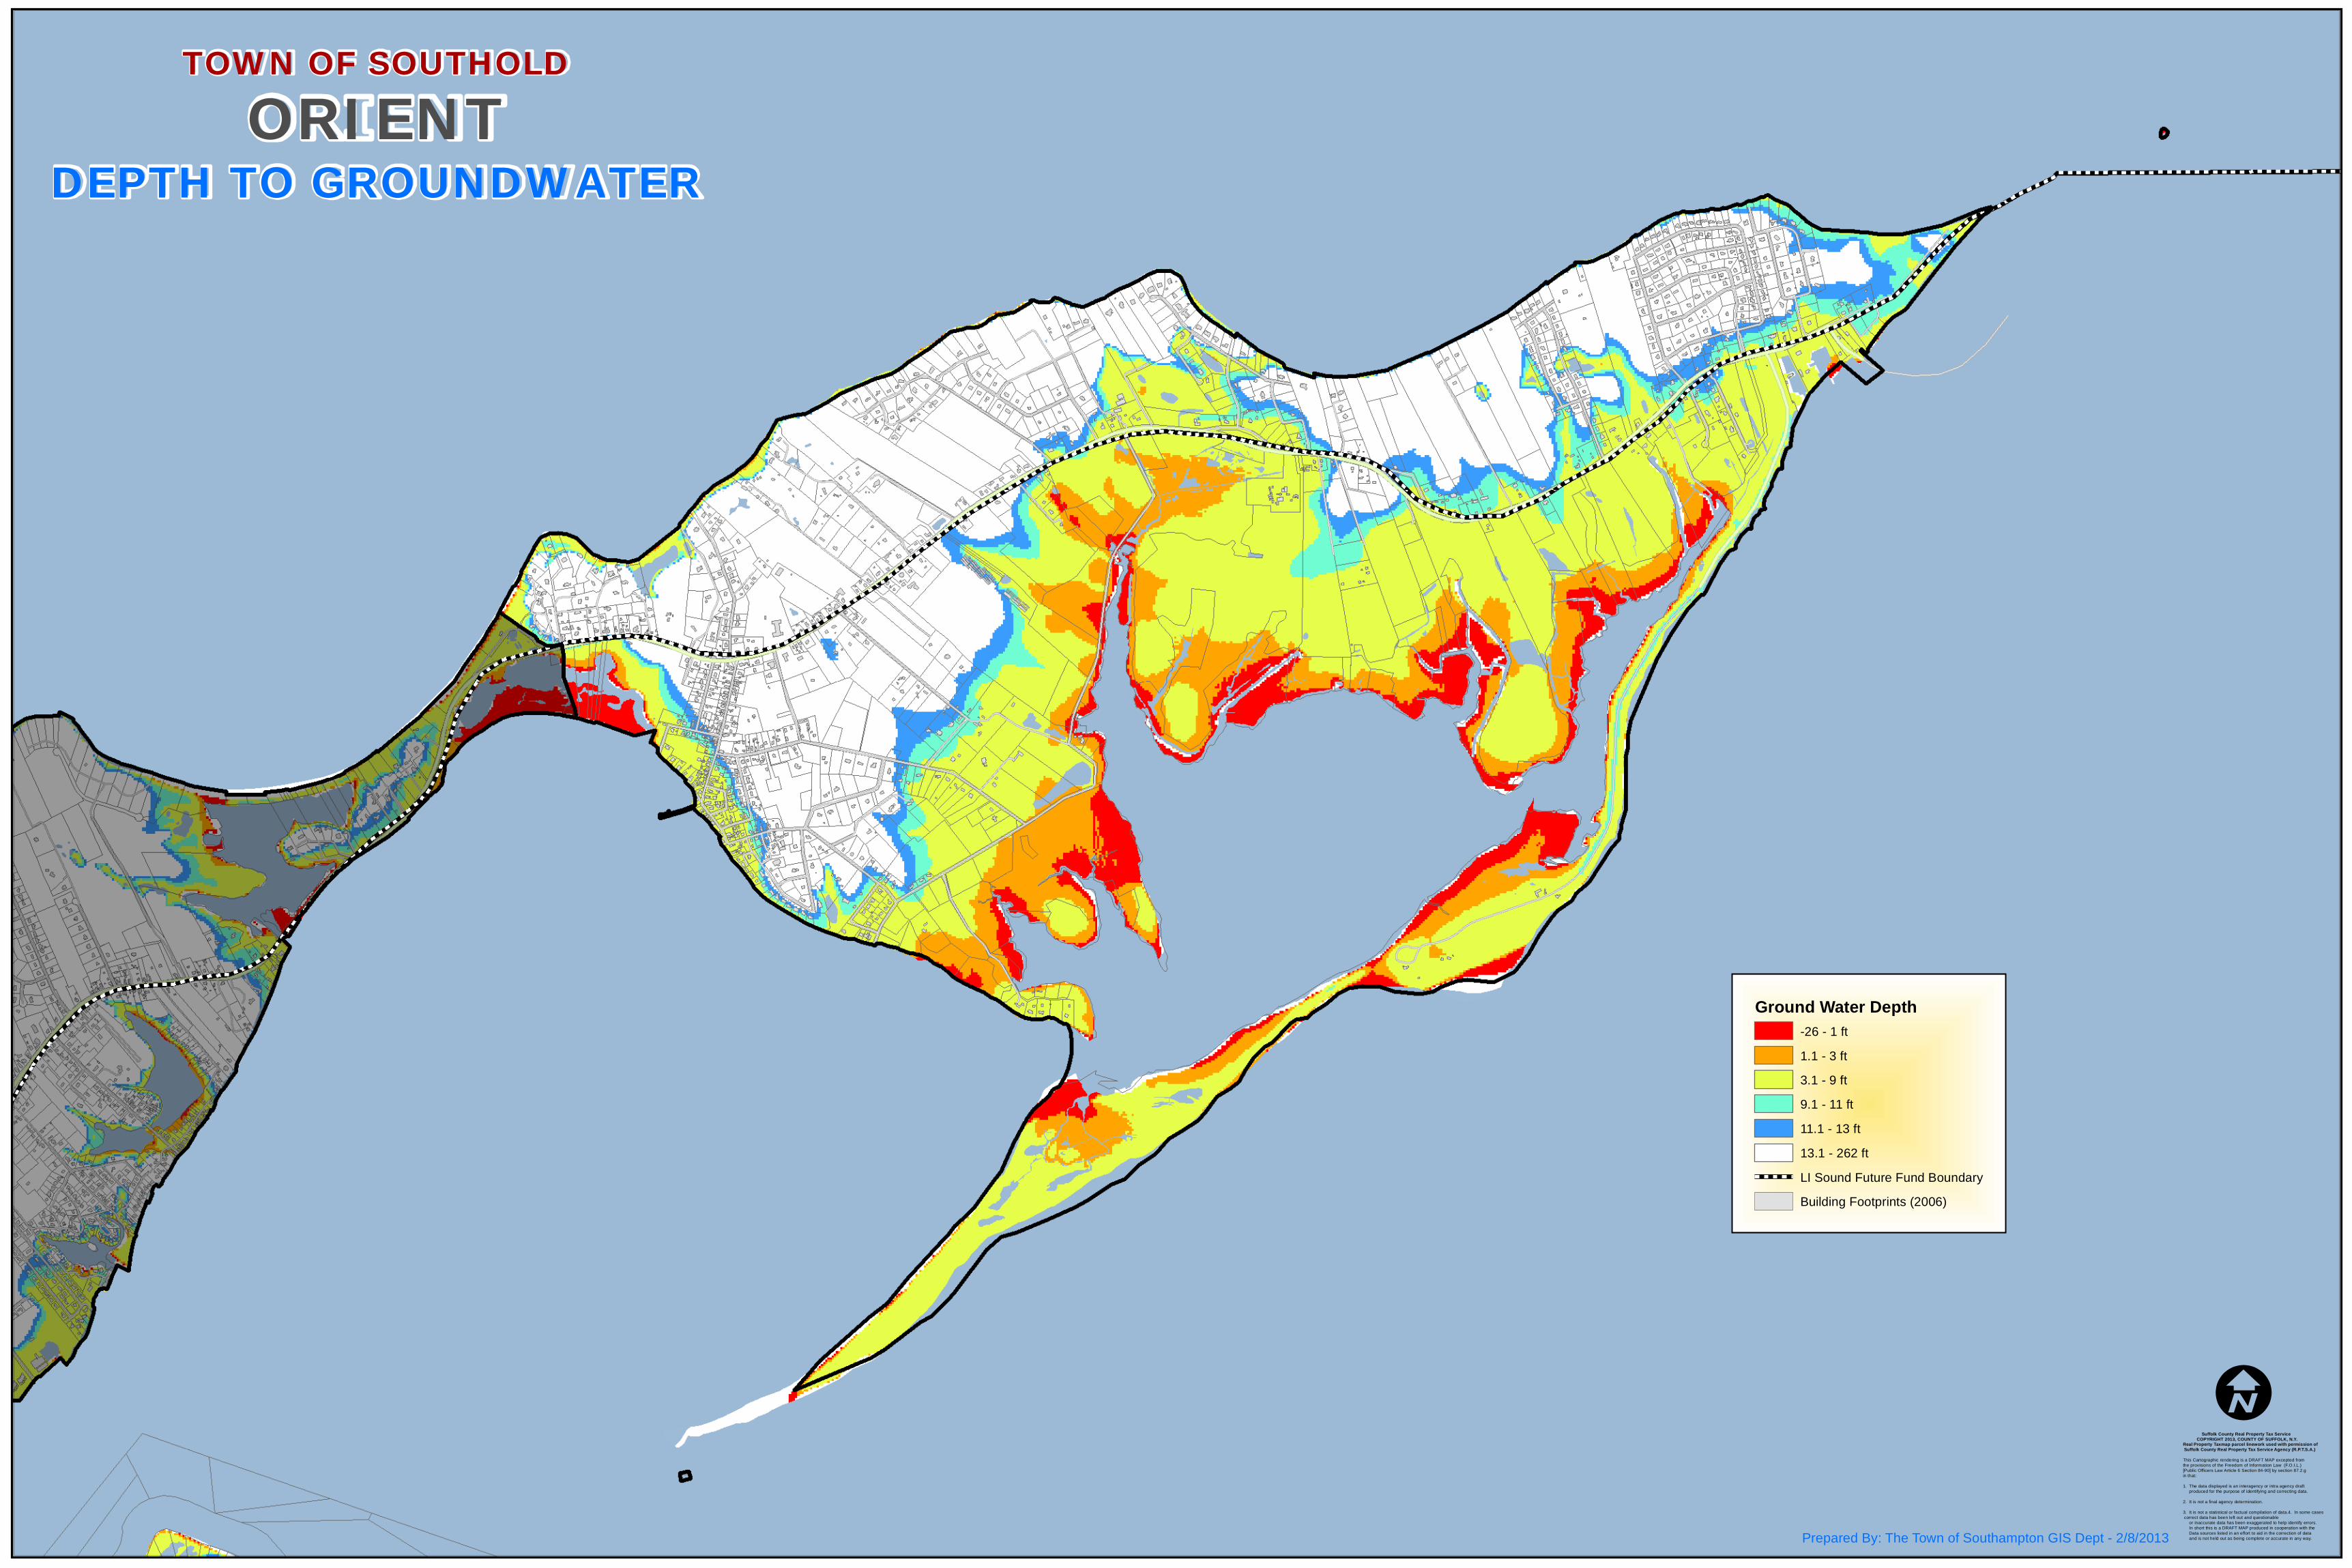
I Suffolk County Real Property Tax Service COPYRIGHT 2013, COUNTY OF SUFFOLK, N.Y.Real Property Taxmap parcel linework used with permission of Suffolk County Real Property Tax Service Agency (R.P.T.S.A.)
This Cartographic rendering is a DRAFT MAP excepted fromthe provisions of the Freedom of Information Law (F.O.I.L.)[Public Officers Law Article 6 Section 84-90] by section 87.2.gin that:
1. The data displayed is an interagency or intra agency draft produced for the purpose of identifying and correcting data.
2. It is not a final agency determination.
3. It is not a statistical or factual compilation of data.4. In some cases correct data has been left out and questionable or inaccurate data has been exaggerated to help identify errors. In short this is a DRAFT MAP produced in cooperation with the Data sources listed in an effort to aid in the correction of data and is not held out as being complete or accurate in any way.Prepared By: The Town of Southampton GIS Dept - 2/8/2013
TOWN OF SOUTHOLD
ORIENT
Ground Water Depth
-26 - 1 ft
1.1 - 3 ft
3.1 - 9 ft
9.1 - 11 ft
11.1 - 13 ft
13.1 - 262 ft
LI Sound Future Fund Boundary
Building Footprints (2006)
DEPTH TO GROUNDWATER

I Suffolk County Real Property Tax Service COPYRIGHT 2013, COUNTY OF SUFFOLK, N.Y.Real Property Taxmap parcel linework used with permission of Suffolk County Real Property Tax Service Agency (R.P.T.S.A.)
This Cartographic rendering is a DRAFT MAP excepted fromthe provisions of the Freedom of Information Law (F.O.I.L.)[Public Officers Law Article 6 Section 84-90] by section 87.2.gin that:
1. The data displayed is an interagency or intra agency draft produced for the purpose of identifying and correcting data.
2. It is not a final agency determination.
3. It is not a statistical or factual compilation of data.4. In some cases correct data has been left out and questionable or inaccurate data has been exaggerated to help identify errors. In short this is a DRAFT MAP produced in cooperation with the Data sources listed in an effort to aid in the correction of data and is not held out as being complete or accurate in any way.Prepared By: The Town of Southampton GIS Dept - 2/8/2013
TOWN OF SOUTHOLD
ORIENT
FEMA FIRM (2009)
Flood Zone
0.2 PCT CHANCE FLD HAZARD
A
AO
AE
VE
SLOSH (2012)
Category
1
2
3
4
LI Sound Future Fund Boundary
Building Footprints (2006)
FLOOD DATA

Narrow RiverNarrow River
Gardiners BayGardiners Bay
LongLongBeach BayBeach Bay
Little BayLittle Bay
Dam PondDam Pond
Dam PondDam Pond
Munn PondMunn Pond
Orient HarborOrient Harbor
L o n gL o n gI s l a n d S o u n dI s l a n d S o u n d
UV900CUV25
Narrow River Rd
Sta
te P
ark
Rd
Platt Rd
Orchard St
King St
Hales Rd
Vill
age
Ln
Terry Ln
Youngs Rd
Uhl Ln
Greenw
ay E
Point
Rd
Diedricks Rd
N Sea Dr
Old Rd
Grandview Dr
Brown Hill Rd
Tabor Rd
Land s E
nd Rd
Heath D
r
Nav y St
Hillcrest Dr
Petes Hill R
d
Peters Neck R
d
Big
ht R
d
Ryde r Farm
Ln
Dem
arest Rd
Old Farm Rd
Edwards Ln
Parkview Ln
Soundview Rd
Munn
L n
Greenw
ay W
Pettys Dr
Beach Ln
Latham Ln
Old M
ain
Rd
Poquatuck Ln
Plum Island Ln
Cedar B
irch Ln
New L
ondo
n-Orie
nt Poin
t
Three W
a te rs L n
Sound View Dr
Back L
n
Major P
ond R
d
Willow
Terrace Ln
Little Bay R
d
Mulford C
t
Maple Ln
South V
iew Dr
Birdse
ye Rd
Oys
ter
Pond
s Ln
Wind
ward R
d
Halyo
ake A
ve
Skippers Ln
Hillcrest Dr N
Dougla
s Rd
W B
ay Ave
Rowe St
Nelson S
t
Harbor Rd
Main Rd
Rac
kett
s C
t
Fletcher St
Har
bor
Riv
er R
d
Willow St
Foot Br
N Sea Dr
Old Main Rd
TOWN OF SOUTHOLD
ORIENT
Map Symbols
Major Surface Watershed Divide
Long Island Sound Study Boundary
Sea Level Rise 2050
Low End Scenerio
High End Scenerio
¬
SEA LEVEL RISE - 2050
Suffolk County Real Property Tax ServiceCOPYRIGHT 2013, COUNTY OF SUFFOLK, N.Y.Real Property Taxmap parcel linework used with permission ofSuffolk County Real Property Tax Service Agency (R.P.T.S.A.)
Prepared By: The Town of Southampton GIS Dept for Peconic Green Growth - 9/20/2013

Narrow RiverNarrow River
Gardiners BayGardiners Bay
LongLongBeach BayBeach Bay
Little BayLittle Bay
Dam PondDam Pond
Dam PondDam Pond
Munn PondMunn Pond
Orient HarborOrient Harbor
L o n gL o n gI s l a n d S o u n dI s l a n d S o u n d
UV900CUV25
Narrow River Rd
Sta
te P
ark
Rd
Platt Rd
Orchard St
King St
Hales Rd
Vill
age
Ln
Terry Ln
Youngs Rd
Uhl Ln
Greenw
ay E
Point
Rd
Diedricks Rd
N Sea Dr
Old Rd
Grandview Dr
Brown Hill Rd
Tabor Rd
Land s E
nd Rd
Heath D
r
Nav y St
Hillcrest Dr
Petes Hill R
d
Peters Neck R
d
Big
ht R
d
Ryde r Farm
Ln
Dem
arest Rd
Old Farm Rd
Edwards Ln
Parkview Ln
Soundview Rd
Munn
L n
Greenw
ay W
Pettys Dr
Beach Ln
Latham Ln
Old M
ain
Rd
Poquatuck Ln
Plum Island Ln
Cedar B
irch Ln
New L
ondo
n-Orie
nt Poin
t
Three W
a te rs L n
Sound View Dr
Back L
n
Major P
ond R
d
Willow
Terrace Ln
Little Bay R
d
Mulford C
t
Maple Ln
South V
iew Dr
Birdse
ye Rd
Oys
ter
Pond
s Ln
Wind
ward R
d
Halyo
ake A
ve
Skippers Ln
Hillcrest Dr N
Dougla
s Rd
W B
ay Ave
Rowe St
Nelson S
t
Harbor Rd
Main Rd
Rac
kett
s C
t
Fletcher St
Har
bor
Riv
er R
d
Willow St
Foot Br
N Sea Dr
Old Main Rd
TOWN OF SOUTHOLD
ORIENT
Map Symbols
Major Surface Watershed Divide
Long Island Sound Study Boundary
Sea Level Rise - 2080
Low End Scenerio
High End Scenerio
¬
SEA LEVEL RISE - 2080
Suffolk County Real Property Tax ServiceCOPYRIGHT 2013, COUNTY OF SUFFOLK, N.Y.Real Property Taxmap parcel linework used with permission ofSuffolk County Real Property Tax Service Agency (R.P.T.S.A.)
Prepared By: The Town of Southampton GIS Dept for Peconic Green Growth - 9/20/2013
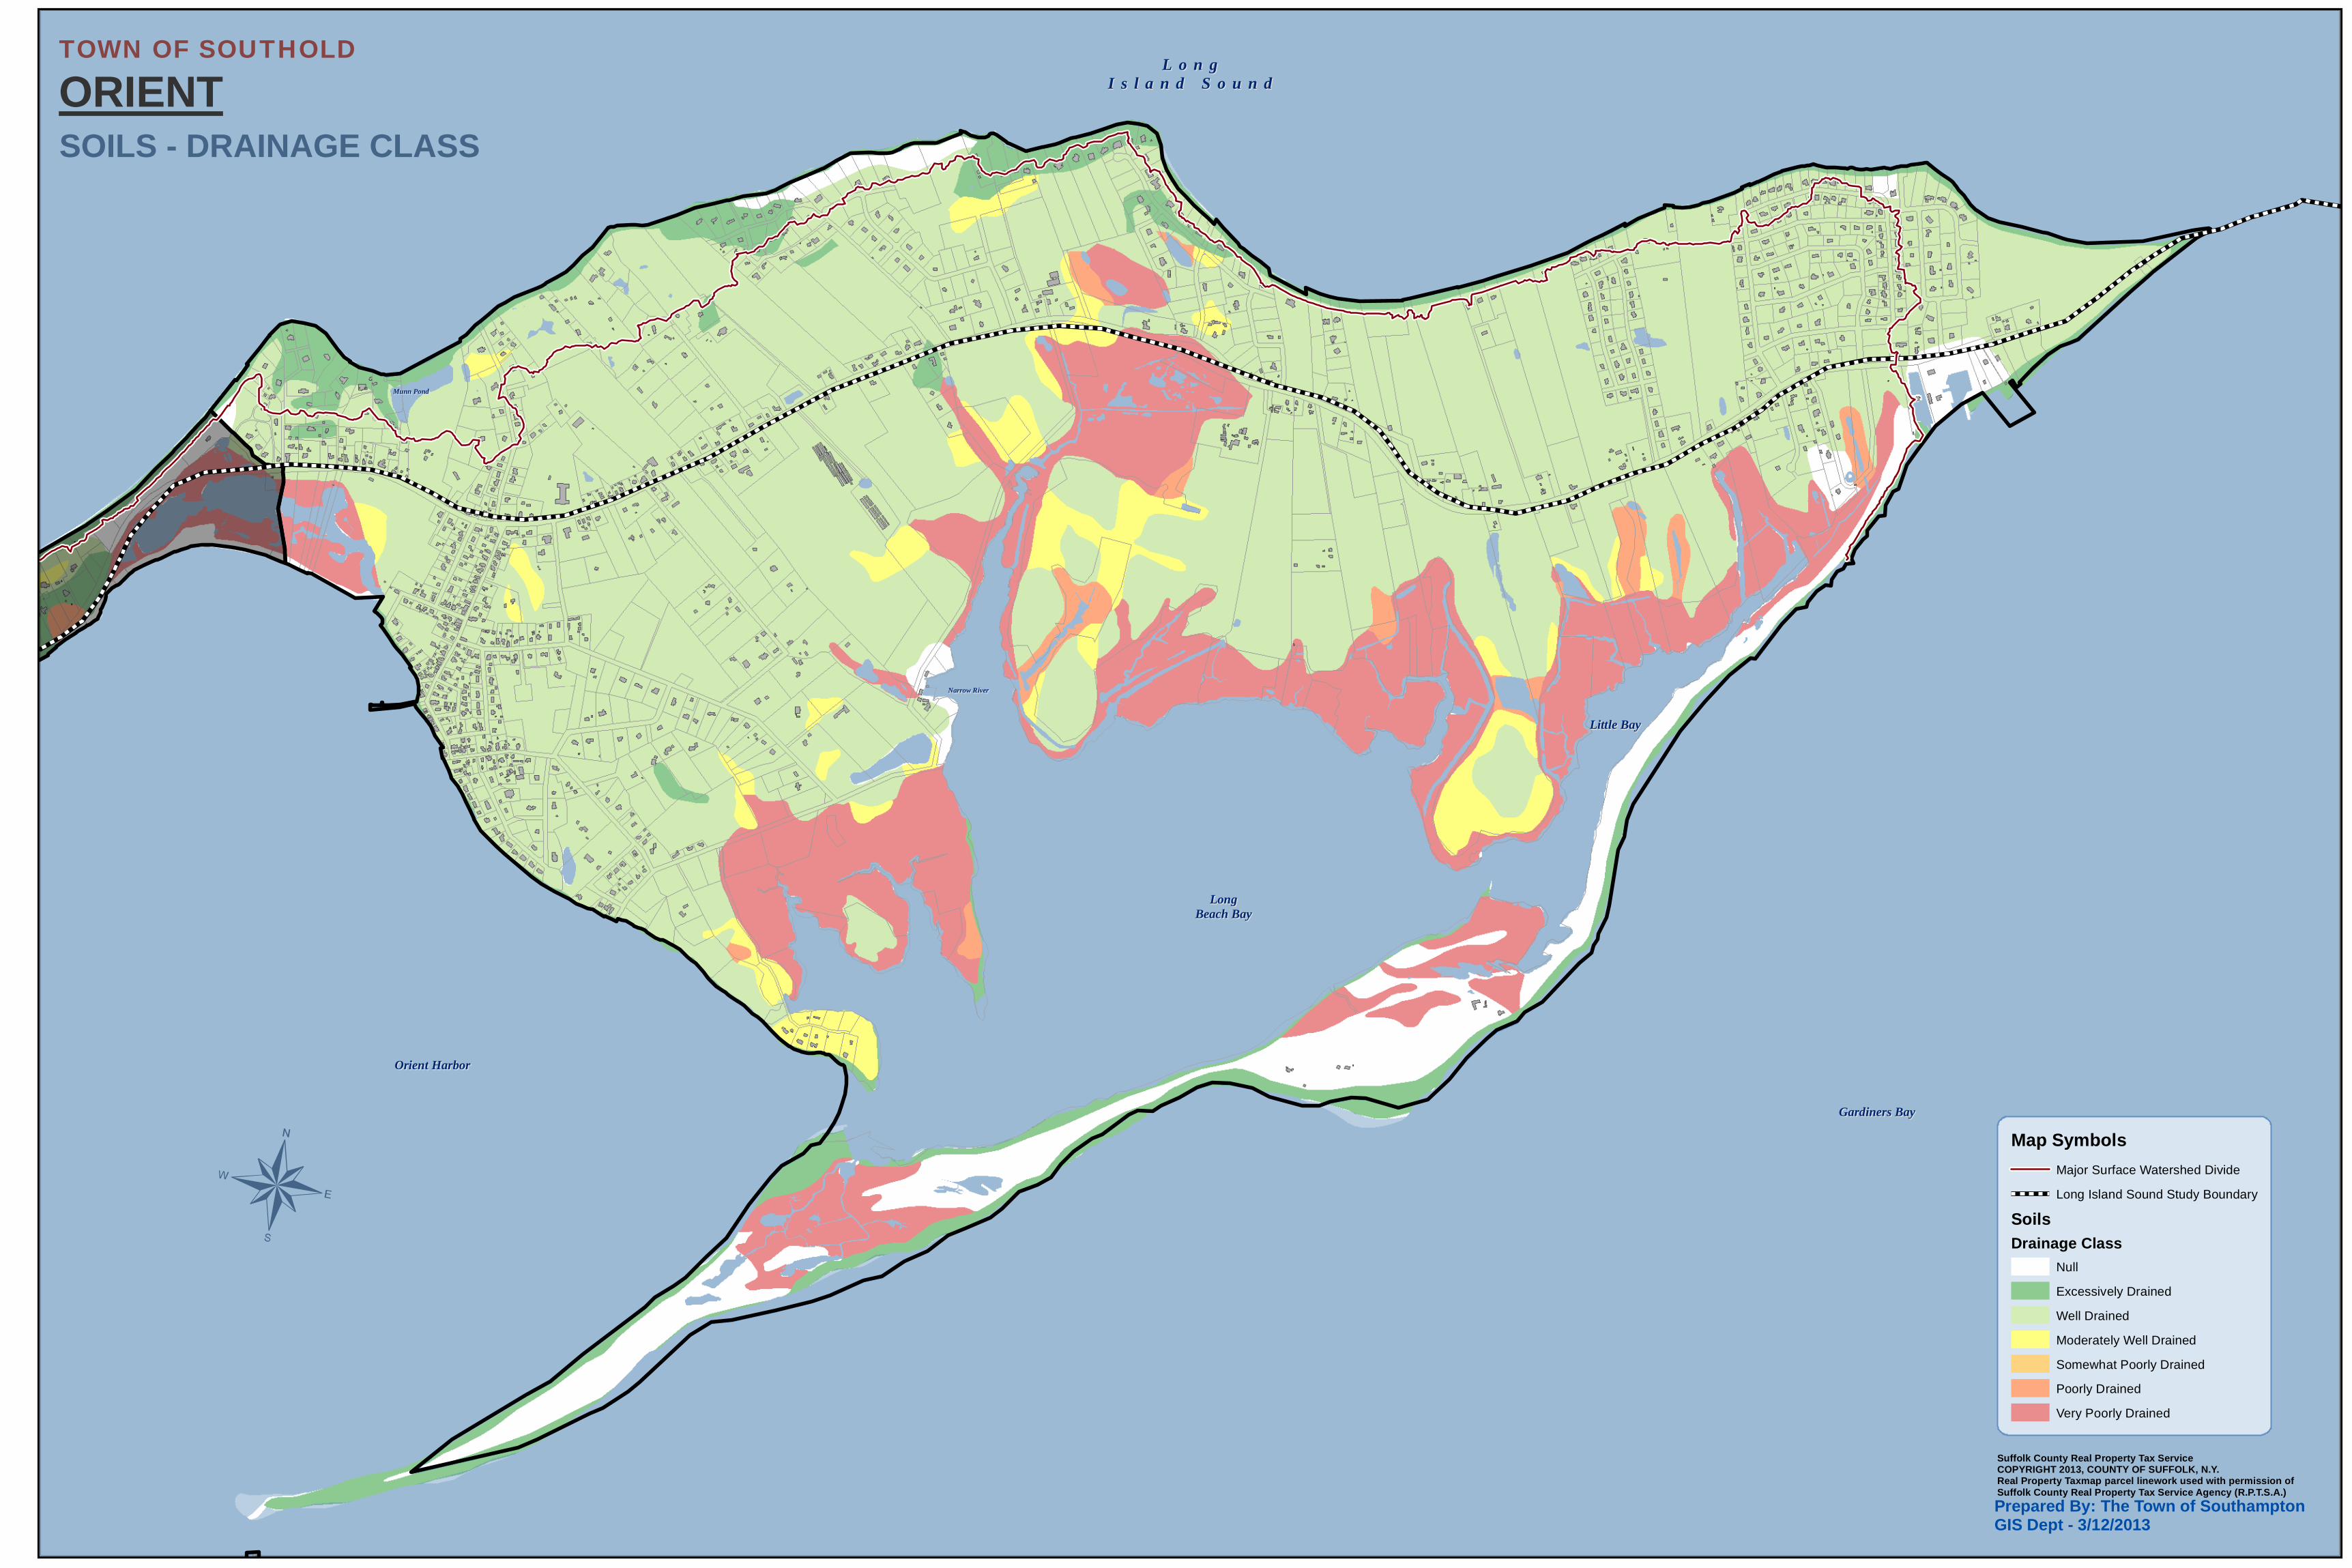
Narrow RiverNarrow River
Gardiners BayGardiners Bay
LongLongBeach BayBeach Bay
Little BayLittle Bay
Munn PondMunn Pond
Orient HarborOrient Harbor
L o n gL o n gI s l a n d S o u n dI s l a n d S o u n d
TOWN OF SOUTHOLD
ORIENT
Map Symbols
Major Surface Watershed Divide
Long Island Sound Study Boundary
Soils
Drainage Class
Null
Excessively Drained
Well Drained
Moderately Well Drained
Somewhat Poorly Drained
Poorly Drained
Very Poorly Drained
SOILS - DRAINAGE CLASS
¬
Suffolk County Real Property Tax ServiceCOPYRIGHT 2013, COUNTY OF SUFFOLK, N.Y.Real Property Taxmap parcel linework used with permission ofSuffolk County Real Property Tax Service Agency (R.P.T.S.A.)
Prepared By: The Town of Southampton GIS Dept - 3/12/2013
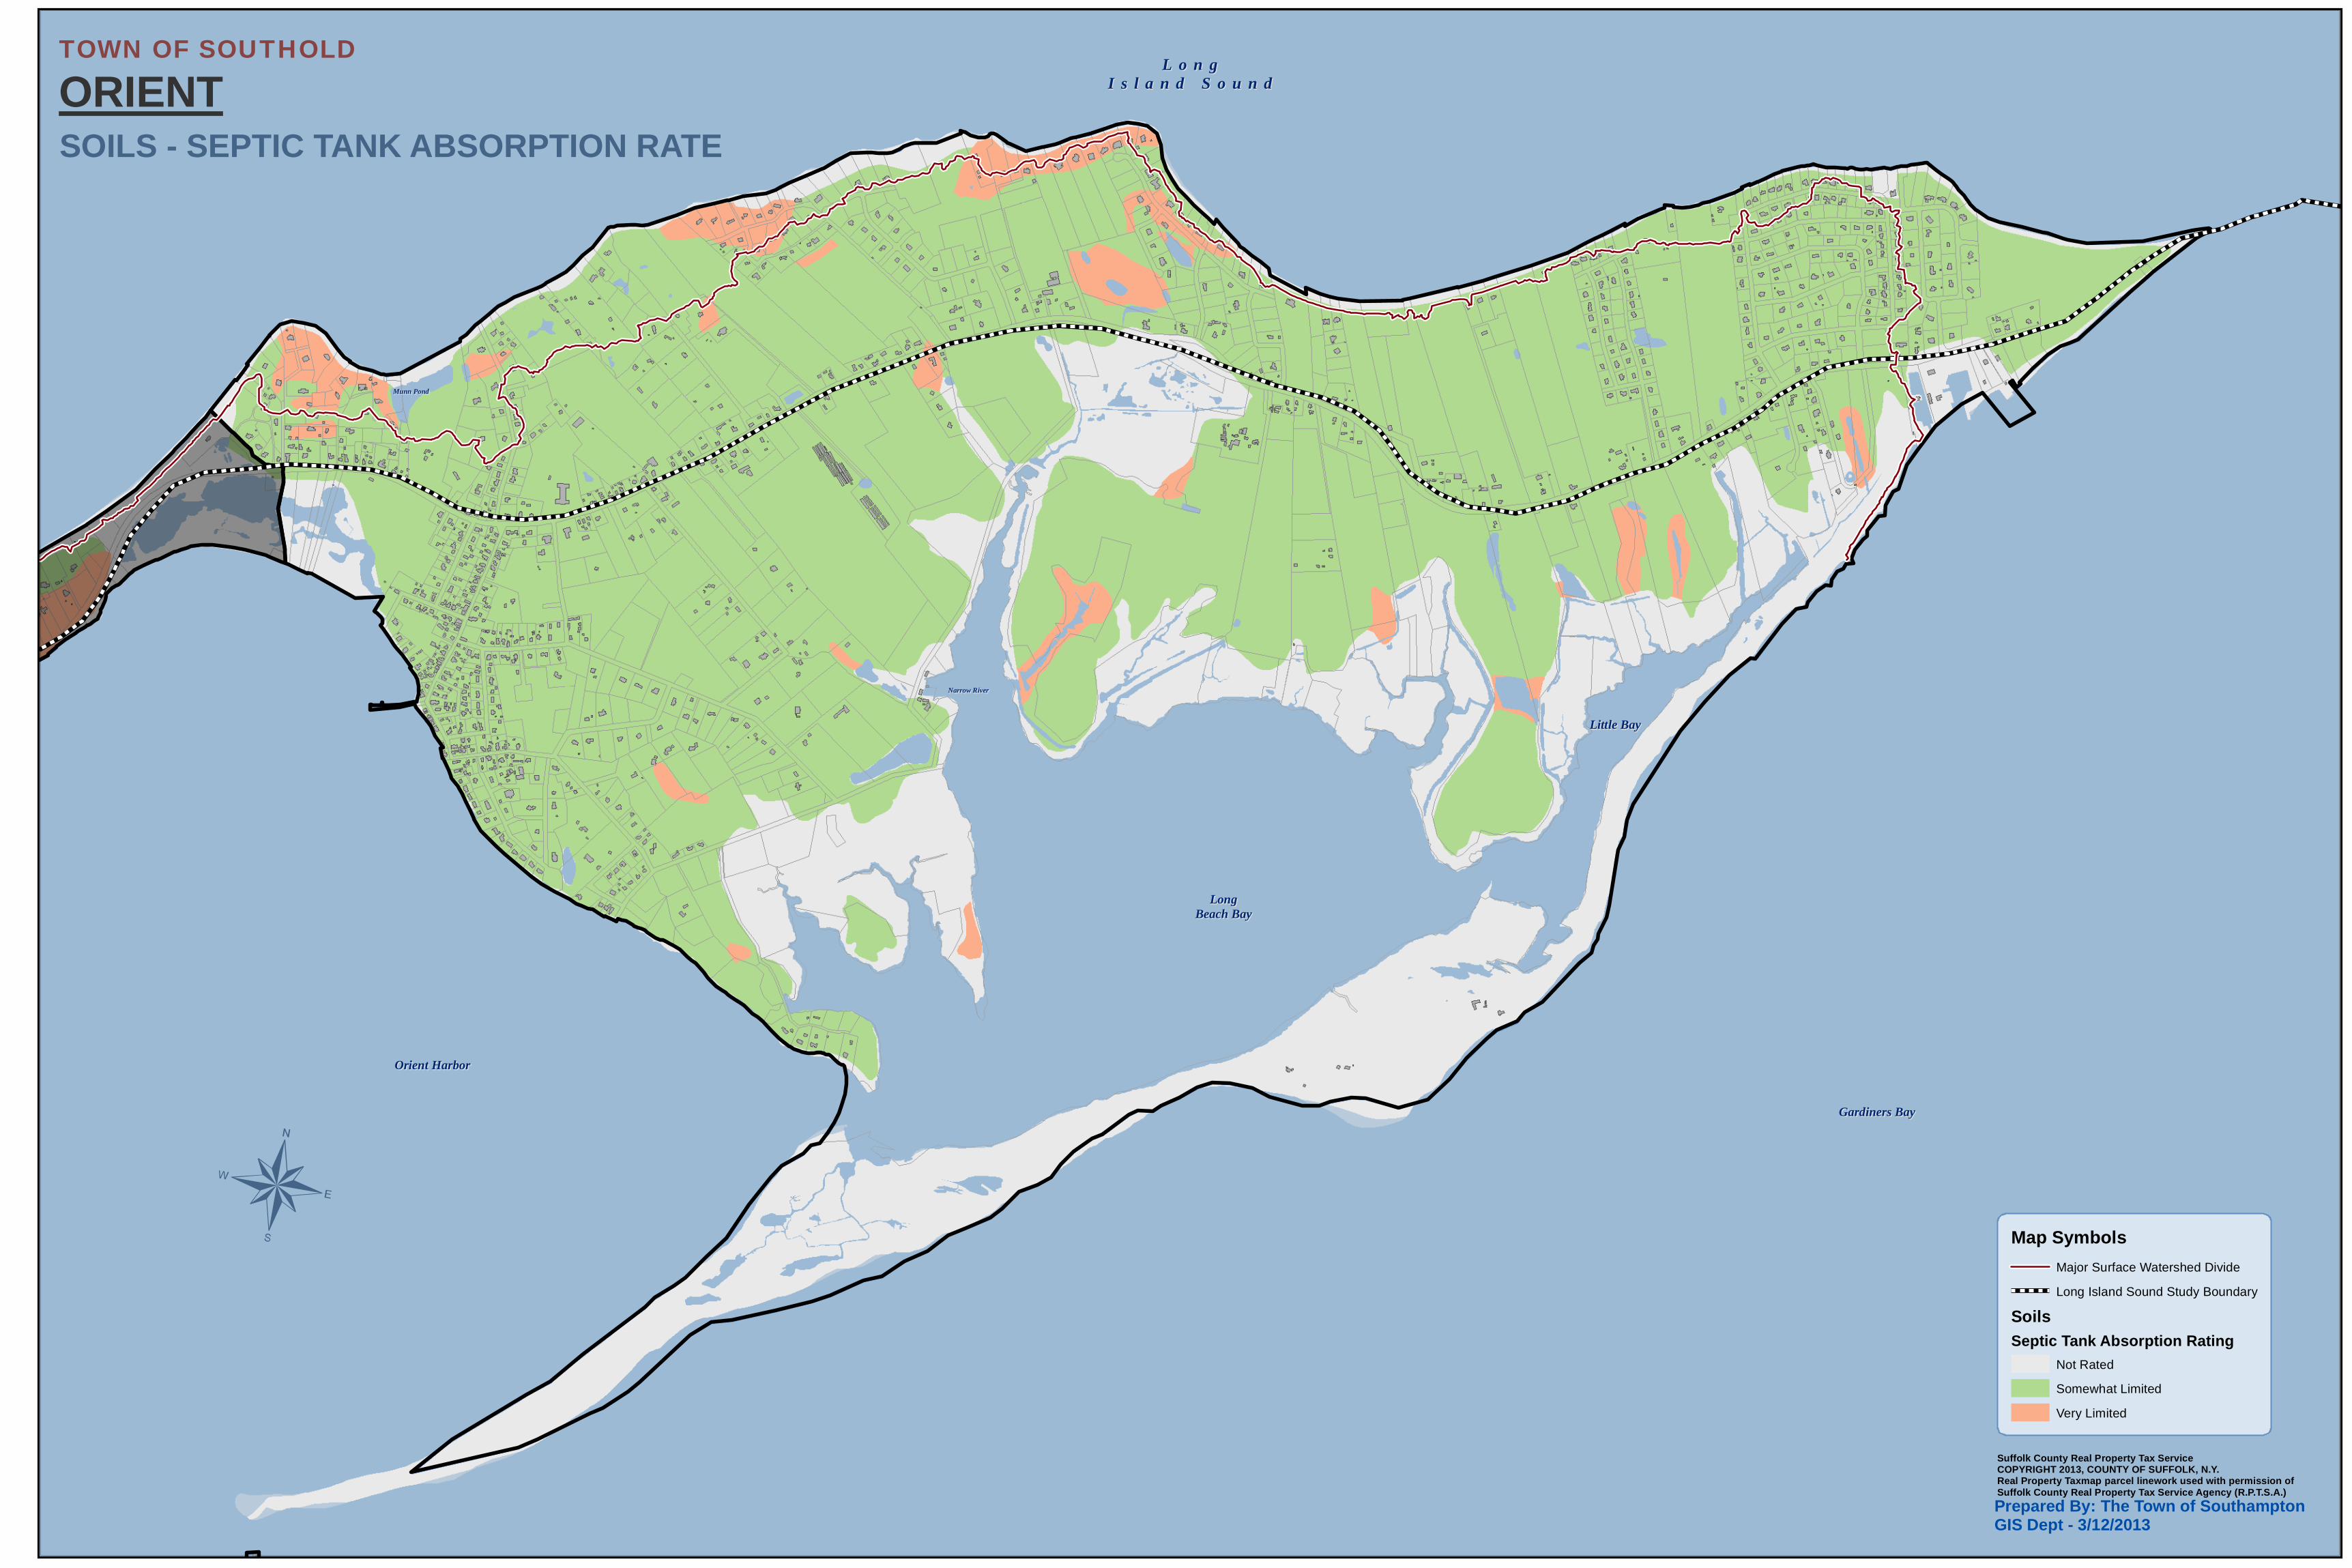
Narrow RiverNarrow River
Gardiners BayGardiners Bay
LongLongBeach BayBeach Bay
Little BayLittle Bay
Munn PondMunn Pond
Orient HarborOrient Harbor
L o n gL o n gI s l a n d S o u n dI s l a n d S o u n d
TOWN OF SOUTHOLD
ORIENT
Map Symbols
Major Surface Watershed Divide
Long Island Sound Study Boundary
Soils
Septic Tank Absorption Rating
Not Rated
Somewhat Limited
Very Limited
SOILS - SEPTIC TANK ABSORPTION RATE
¬
Suffolk County Real Property Tax ServiceCOPYRIGHT 2013, COUNTY OF SUFFOLK, N.Y.Real Property Taxmap parcel linework used with permission ofSuffolk County Real Property Tax Service Agency (R.P.T.S.A.)
Prepared By: The Town of Southampton GIS Dept - 3/12/2013

I Suffolk County Real Property Tax Service COPYRIGHT 2013, COUNTY OF SUFFOLK, N.Y.Real Property Taxmap parcel linework used with permission of Suffolk County Real Property Tax Service Agency (R.P.T.S.A.)
This Cartographic rendering is a DRAFT MAP excepted fromthe provisions of the Freedom of Information Law (F.O.I.L.)[Public Officers Law Article 6 Section 84-90] by section 87.2.gin that:
1. The data displayed is an interagency or intra agency draft produced for the purpose of identifying and correcting data.
2. It is not a final agency determination.
3. It is not a statistical or factual compilation of data.4. In some cases correct data has been left out and questionable or inaccurate data has been exaggerated to help identify errors. In short this is a DRAFT MAP produced in cooperation with the Data sources listed in an effort to aid in the correction of data and is not held out as being complete or accurate in any way.Prepared By: The Town of Southampton GIS Dept - 2/8/2013
TOWN OF SOUTHOLD
ORIENT
Parcel Acreage
0 - 1/4 Acre
1/4 - 1/2 Acre
1/2 - 1 Acre
1 - 2 Acres
2 - 3.2 Acres
3.2 - 5 Acres
5 Acre+
LI Sound Future Fund Boundary
PARCEL ACREAGE

Narrow RiverNarrow River
Gardiners BayGardiners Bay
LongLongBeach BayBeach Bay
Little BayLittle Bay
Munn PondMunn Pond
Orient HarborOrient Harbor
UV900CUV25
Narrow River Rd
State Park Rd
Platt Rd
Orchard St
King St
Hales Rd
Vill
age
Ln
Terry Ln
Young
s Rd
Uhl Ln
Gree
nway E
Point Rd
Diedricks Rd
N Sea Dr
Old Rd
Grandview Dr
Brown Hill Rd
Tabo r Rd
Lands E
nd Rd
Heath D
r
Navy S
t
Hillcrest Dr
Petes Hill R
d
Peters Neck R
d
Bight R
d
Ryde
r Far m L
n
Dem
ares t Rd
Old Farm Rd
Edwards Ln
Parkview Ln
Soundview Rd
Plum Island Ln
Mun
n L
n
Gree
nway W
Pettys Dr
Beach Ln
Latham Ln
Old M
ain R
d
Poquatuck Ln
Cedar B
irch Ln
New Londo
n-Orie
nt Poin
t
Thre
e Wat er s Ln
Sound View Dr
Bac
k L
n
Maj
or P
ond
RdW
illow Terrace Ln
Little B
ay Rd
Mulford C
t
Maple Ln
South View Dr
Bir
dse
ye R
d
Oys
ter
Pond
s Ln
Wind
ward R
d
Halyoake
Ave
Skippers Ln
Hillcrest Dr N
Dougla
s Rd
W B
ay Ave
Rowe St
Nelso
n St
Harbor Rd
Main Rd
Rac
kett
s Ct
Stevenson R
d
Fletcher St
Har
bor
Riv
er R
d
Willow St
Foot Br
N Sea Dr
Old Main Rd
TOWN OF SOUTHOLD
ORIENT
Map Symbols
Major Surface Watershed Divide
Long Island Sound Study Boundary
Building Footprints (2006)
DEC Impaired Water Bodies (303D)
2012 Section 303(d) List of Impaired Water Requiring a TMDL (NYSDEC)
Impaired/Delisted Waters NOT Inlcuded on 2012 303(d) List (NYSDEC)
Section 303(d) List of Impaired Water Requiring a TMDL (SOUTHOLD)
TMDLs
Mercury TMDL
Nitrogen TMDL
Pathogen TMDL
Areas Contributing Groundwater to Surface Water (SCDHS)
YEARS
0-2 years
2-5 years
5-10 years
10-25 years
25-50 years
¬
INFLUENCE ZONES
Suffolk County Real Property Tax ServiceCOPYRIGHT 2013, COUNTY OF SUFFOLK, N.Y.Real Property Taxmap parcel linework used with permission ofSuffolk County Real Property Tax Service Agency (R.P.T.S.A.)
Prepared By: The Town of Southampton GIS Dept for Peconic Green Growth - 12/16/2013

Narrow RiverNarrow River
Gardiners BayGardiners Bay
LongLongBeach BayBeach Bay
Little BayLittle Bay
Dam PondDam Pond
Munn PondMunn Pond
Orient HarborOrient Harbor
L o n gL o n gI s l a n d S o u n dI s l a n d S o u n d
UV900CUV25
Narrow River Rd
Sta
te P
ark
Rd
Platt Rd
Orchard St
King St
Hales Rd
Vill
age
Ln
Terry Ln
Youngs Rd
Uhl Ln
Greenw
ay E
Point
Rd
Diedricks Rd
N Sea Dr
Old Rd
Grandview Dr
Brown Hill Rd
Tabor R
d
Lands E
n d Rd
Heath D
r
Nav y St
Hillcrest Dr
Petes Hill R
d
Peters Neck R
d
Big
ht R
d
Ryde r Farm
Ln
Dem
arest Rd
Old Farm Rd
Edwards Ln
Parkview Ln
Soundview Rd
Munn
Ln
Gree
nway W
Pettys Dr
Beach Ln
Latham Ln
Old M
ain
Rd
Poquatuck Ln
Plum Island Ln
Cedar B
irch Ln
New L
ondo
n-Orie
nt Poin
t
Three W
a te rs Ln
Sound View Dr
Back L
n
Major P
ond R
d
Willow
Terrace Ln
Little Bay R
d
Mulford C
t
Maple Ln
South V
iew Dr
Birdse
ye Rd
Oys
ter
Pond
s Ln
Wind
ward R
d
Halyo
ake A
ve
Skippers Ln
Hillcrest Dr N
Dougla
s Rd
W B
ay Ave
Rowe St
Nelson S
t
Harbor Rd
Main Rd
Rac
kett
s C
t
Fletcher St
Har
bor
Riv
er R
d
Willow St
Foot Br
N Sea Dr
Old Main Rd
TOWN OF SOUTHOLD
ORIENT
Map Symbols
Major Surface Watershed Divide
Long Island Sound Study Boundary
Med. & High Priorities and <= 1/2 acre
Building Footprints (2006)
Priorities (Developed)
TOTALS
Low Priority (0 - 8)
Medium Low Priority (9 - 15)
Medium Priority (16 - 23)
Medium High Priority (24 - 30)
High Priority (31 - 38)
¬
PRIORITIES
Suffolk County Real Property Tax ServiceCOPYRIGHT 2013, COUNTY OF SUFFOLK, N.Y.Real Property Taxmap parcel linework used with permission ofSuffolk County Real Property Tax Service Agency (R.P.T.S.A.)
Prepared By: The Town of Southampton GIS Dept for Peconic Green Growth - 8/16/2013

1
7
2
4 6
3
5
Narrow RiverNarrow River
Gardiners BayGardiners Bay
LongLongBeach BayBeach Bay
Little BayLittle Bay
Munn PondMunn Pond
Orient HarborOrient Harbor
L o n gL o n gI s l a n d S o u n dI s l a n d S o u n d
TOWN OF SOUTHOLD
ORIENT
¬
Suffolk County Real Property Tax ServiceCOPYRIGHT 2013, COUNTY OF SUFFOLK, N.Y.Real Property Taxmap parcel linework used with permission ofSuffolk County Real Property Tax Service Agency (R.P.T.S.A.)
Prepared By: The Town of Southampton GIS Dept - 3/21/2013
POTENTIAL WASTEWATER DISTRICTS
72 Structures
57 Structures
393 Structures
83 Structures
*Structure Count based on 2006 Bldg. Footprints
11 Structures
63 Structures
144 Structures

UV900C
UV25
Narrow River Rd
State Park Rd
Platt Rd
Orchard St
King St
Hales Rd
Vill
age
Ln
Terry Ln
Young
s Rd
Uhl Ln
Gree
nway E
Point Rd
Diedricks Rd
N Sea Dr
Old Rd
Grandview DrBrown Hill Rd
Tabo
r R
d
Lan
ds E
nd R
d
Heath D
r
Nav
y S
t
Hillcrest Dr
Petes Hill R
d
Peters Neck R
d
Big
ht R
d
Ryde
r Farm
Ln
Dem
arest Rd
Old Farm Rd
Edwards Ln
Parkview Ln
Soundview Rd
Plum Island Ln
Mun
n L
n
Greenw
ay W
Pettys Dr
Beach Ln
Lath
am L
n
Old Main R
d
Poquatuck Ln
Cedar B
irch Ln
New London-Orie
nt Point
Thr
ee
Wat
ers
Ln
Sound View Dr
Bac
k L
n
Maj
or P
ond
Rd
Willow
Terrace Ln
Little B
ay Rd
Mulford C
t
Maple Ln
South View Dr
Bir
dse
ye R
d
Oys
ter
Pond
s Ln
Win d
ward R
d
Halyoake Ave
Skippers Ln
Hillcrest Dr N
Douglas Rd
W B
ay Ave
Rowe St
Nelso
n St
Harbor Rd
Main Rd
Rack
etts
Ct
Ste ve n
s on Rd
Fletcher St
Harb
or R
iver
Rd
Willow St
Foot Br
N Sea Dr
Old Main Rd
TOWN OF SOUTHOLD
ORIENT
Map Symbols
Long Island Sound Study Boundary
Building Footprints (2006)
LAND USE
Unknown
Low Density Residential
Medium Density Residential
High Density Residential
Commercial
Industrial
Institutional
Recreation and Open Space
Agricultural
Vacant
Transportation
Utilities
Waste Handling and Management
Surface Waters
LAND USE
O r i e n tH a r b o r
Suffolk County Real Property Tax ServiceCOPYRIGHT 2013, COUNTY OF SUFFOLK, N.Y.Real Property Taxmap parcel linework used with permission ofSuffolk County Real Property Tax Service Agency (R.P.T.S.A.)
Prepared By: The Town of Southampton GIS Dept - 2/15/2013

I Suffolk County Real Property Tax Service COPYRIGHT 2013, COUNTY OF SUFFOLK, N.Y.Real Property Taxmap parcel linework used with permission of Suffolk County Real Property Tax Service Agency (R.P.T.S.A.)
This Cartographic rendering is a DRAFT MAP excepted fromthe provisions of the Freedom of Information Law (F.O.I.L.)[Public Officers Law Article 6 Section 84-90] by section 87.2.gin that:
1. The data displayed is an interagency or intra agency draft produced for the purpose of identifying and correcting data.
2. It is not a final agency determination.
3. It is not a statistical or factual compilation of data.4. In some cases correct data has been left out and questionable or inaccurate data has been exaggerated to help identify errors. In short this is a DRAFT MAP produced in cooperation with the Data sources listed in an effort to aid in the correction of data and is not held out as being complete or accurate in any way.Prepared By: The Town of Southampton GIS Dept - 2/8/2013
TOWN OF SOUTHOLD
ORIENT
LI Sound Future Fund Boundary
2010 IMAGERY

Narrow RiverNarrow River
Gardiners BayGardiners Bay
LongLongBeach BayBeach Bay
Little BayLittle Bay
Dam PondDam Pond
Munn PondMunn Pond
Orient HarborOrient Harbor
L o n gL o n gI s l a n d S o u n dI s l a n d S o u n d
UV900CUV25
Narrow River Rd
Sta
te P
ark
Rd
Platt Rd
Orchard St
King St
Hales Rd
Vill
age
Ln
Terry Ln
Youngs Rd
Uhl Ln
Greenw
ay E
Point
Rd
Diedricks Rd
N Sea Dr
Old Rd
Grandview Dr
Brown Hill Rd
Tabor R
d
Lands E
n d Rd
Heath D
r
Nav y St
Hillcrest Dr
Petes Hill R
d
Peters Neck R
d
Big
ht R
d
Ryde r Farm
Ln
Dem
arest Rd
Old Farm Rd
Edwards Ln
Parkview Ln
Soundview Rd
Munn
L n
Gree
nway W
Pettys Dr
Beach Ln
Latham Ln
Old M
ain
Rd
Poquatuck Ln
Plum Island Ln
Cedar B
irch Ln
Thre
e Wa te rs Ln
Sound View Dr
Back L
n
Major P
ond R
d
Willow
Terrace Ln
Little Bay R
d
Mulford Ct
Maple Ln
South V
iew Dr
Birdseye Rd
Oys
ter
Pond
s Ln
Wind
ward R
d
Halyo
ake A
ve
Skippers Ln
Hillcrest Dr N
Dougla
s Rd
W Bay Ave
Rowe St
Nelson S
t
Harbor Rd
Main Rd
Rac
kett
s C
t
Stevenson Rd
Fletcher St
Har
bor
Riv
er R
d
Willow St
Foot Br
N Sea Dr
Old Main Rd
TOWN OF SOUTHOLD
ORIENT
Map Symbols
Major Surface Watershed Divide
Long Island Sound Study Boundary
200' Buffer of Buildings
¬
200' BUFFER OF BUILDINGS
Suffolk County Real Property Tax ServiceCOPYRIGHT 2013, COUNTY OF SUFFOLK, N.Y.Real Property Taxmap parcel linework used with permission ofSuffolk County Real Property Tax Service Agency (R.P.T.S.A.)
Prepared By: The Town of Southampton GIS Dept for Peconic Green Growth - 9/13/2013

APPENDIX B

Coastal Resilience, Long Island, USA – November 2009 Coastal Resilience Project: The purpose of the Coastal Resilience project is to provide communities with easy access to information to assist in coastal planning, zoning, acquisition, and other management decisions regarding resources at risk from sea level rise (SLR) and coastal hazards. One of the principal products of the project is a spatially explicit web mapping tool that provides forecasts of inundation on the south shore of Long Island under different sea level rise and storm surge scenarios. This web mapping tool is intended to assist local participatory stakeholder processes in towns and villages on Long Island in order to garner awareness and guide decision makers on climate change issues. Specifically this application tries to identify explicit relationships between ecological, social and economic indicators and thereby provide a comprehensive platform for decision making. Category: Flood Scenarios General Description: Sea level rise scenarios were generated for the Coastal Resilience project by faculty from the Columbia University Center for Climate Systems Research (CCSR) and NASA Goddard Institute for Space Studies based on the best available scientific information about greenhouse gas emissions and sea level rise. Sea level rise projections were then used in conjunction with elevation data to generate spatially-explicit inundation projections. Sources:
International Panel on Climate Change (IPCC) Program for Climate Model Diagnosis and Intercomparison Goddard Institute for Space Studies, New York, NY Tide gauge data, the Battery and Montauk - NOAA LiDAR data, Suffolk County Information Services
Sources of Global Circulation Models (GCMs)
Goddard Institute for Space Studies, New York, NY – (GISS) NOAA Geophysical Fluid Dynamics Laboratory, Princeton, NJ – (GFDL) United Kingdom Meteorological Office, UK – (UKMO) National Center for Atmospheric Research, Boulder, CO – (NCAR) Meteorological Institute of the Rheinische Friedrich-Wilhelms Universität, Bonn,
Germany – (MIUB) Meteorological Research Institute, Japan – (MRI) National Frontier Research Center for Global Change, Japan The Model for
Interdisciplinary Research on Climate - (MIROC) Caveats and Limitations: Sea level rise projections using the Global Circulation Models (GCMs) have a 'model-based probability'. This represents what is the most likely outcome based upon projections across the seven models. It does not taken into account the possibility that all of the GCM's could be wrong; instead it looks for consensus. For each decade CCSR and NASA produced GCM sea

level rise projections (3 IPCC emission scenarios x 7 GCMs). Two additional scenarios were calculated: an A2 IPCC scenario with 1-meter of ice sheet melting over the next century, and an A2 scenario with a 2-meter melting over the same time period. This allows us to show the mean value as well as the range (high/low) or some other measure of the distribution (Table 1). Since the sea level rise projections vary from model to model these scenarios are estimates and therefore no specific model output should be considered a prediction of future conditions. Instead, they should be considered as a range of most likely outcomes (as shown by the table below) based upon the present state of the art climate models. Table 1. Example of Three Decades of Projected GCM Sea Level Rise for the South Shore, Long Island
Projection* 2020 (inches) 2050 (inches) 2080 (inches) GFDL - A2 4.21 10.71 22.51 GISS - A2 4.17 11.25 20.62
UKMO - A2 5.40 11.48 21.43 MIROC - A2 3.94 12.02 24.49
MRI - A2 1.42 5.59 12.11 MIUB - A2 4.05 7.47 16.65 NCAR - A2 2.26 10.21 21.32 GFDL - A1b 4.98 12.64 22.71 GISS - A1b 4.97 10.09 18.28
UKMO - A1b 4.22 10.00 16.97 MIROC - A1b 3.59 13.48 25.55
MRI - A1b 1.59 6.03 11.97 MIUB - A1b 2.68 9.39 16.29 NCAR - A1b 3.19 10.43 17.88 GFDL - B1 3.76 10.05 16.03 GISS - B1 3.77 9.40 14.87
UKMO - B1 4.85 8.51 13.76 MIR - B1 5.52 13.63 21.95
MRIOC - B1 1.56 5.04 9.32 MIUB - B1 4.70 9.23 15.88 NCAR - B1 2.86 7.37 12.08
Mean 3.70 9.72 17.75
Low 1.42 5.04 9.32
16.7% 2.40 7.40 12.66
83.3% 4.93 11.84 22.32
High 5.52 13.63 25.55 *Projection – 7 GCMs x 3 emission scenarios (B1, A1b, A2) The “bathtub” method of mapping water surfaces on the LiDAR digital elevation model (DEM) was used for this project. This method simply “raises the water surface” or delineates a contour on a DEM based on a value. A major drawback of this method is that it does not take into account or model the hydraulics of SLR. Further, low elevation values are inundated as the bathtub fills although some of these values are not necessarily connected with the main body of water moving landward. This has created discontinuous ponds that lie upland of a future Mean High Water tide line. Future mapping efforts will take those areas into account and will likely be
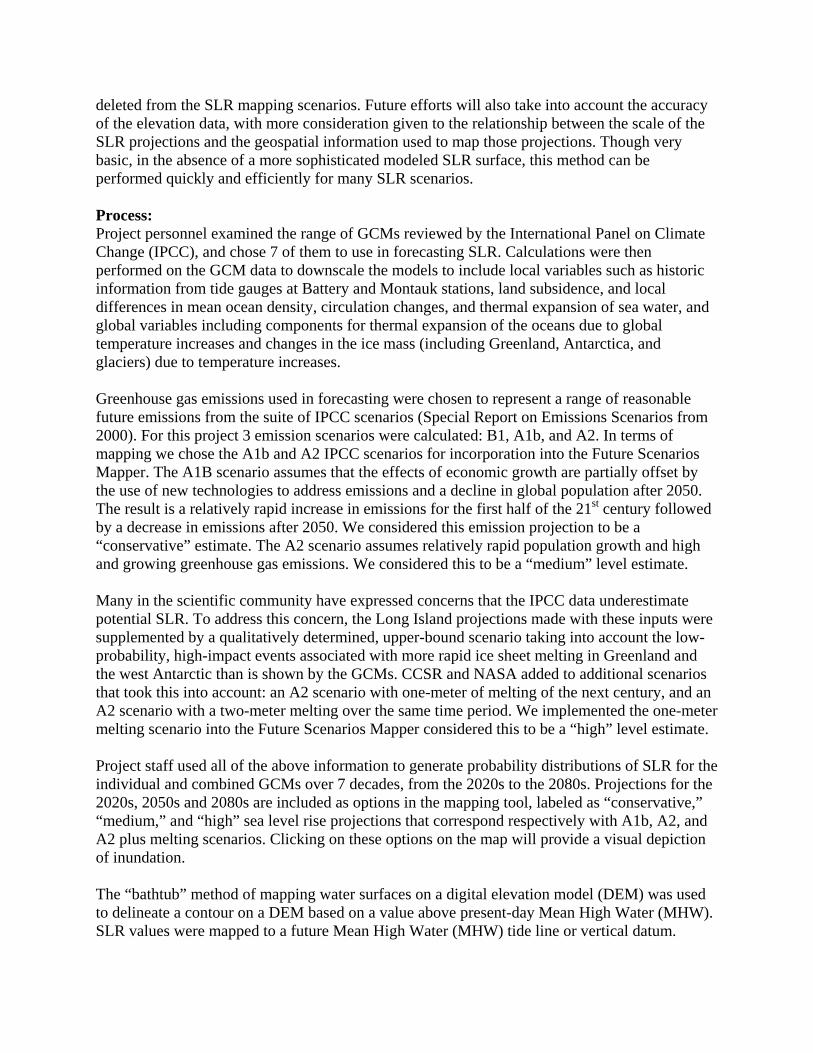
deleted from the SLR mapping scenarios. Future efforts will also take into account the accuracy of the elevation data, with more consideration given to the relationship between the scale of the SLR projections and the geospatial information used to map those projections. Though very basic, in the absence of a more sophisticated modeled SLR surface, this method can be performed quickly and efficiently for many SLR scenarios. Process: Project personnel examined the range of GCMs reviewed by the International Panel on Climate Change (IPCC), and chose 7 of them to use in forecasting SLR. Calculations were then performed on the GCM data to downscale the models to include local variables such as historic information from tide gauges at Battery and Montauk stations, land subsidence, and local differences in mean ocean density, circulation changes, and thermal expansion of sea water, and global variables including components for thermal expansion of the oceans due to global temperature increases and changes in the ice mass (including Greenland, Antarctica, and glaciers) due to temperature increases. Greenhouse gas emissions used in forecasting were chosen to represent a range of reasonable future emissions from the suite of IPCC scenarios (Special Report on Emissions Scenarios from 2000). For this project 3 emission scenarios were calculated: B1, A1b, and A2. In terms of mapping we chose the A1b and A2 IPCC scenarios for incorporation into the Future Scenarios Mapper. The A1B scenario assumes that the effects of economic growth are partially offset by the use of new technologies to address emissions and a decline in global population after 2050. The result is a relatively rapid increase in emissions for the first half of the 21st century followed by a decrease in emissions after 2050. We considered this emission projection to be a “conservative” estimate. The A2 scenario assumes relatively rapid population growth and high and growing greenhouse gas emissions. We considered this to be a “medium” level estimate. Many in the scientific community have expressed concerns that the IPCC data underestimate potential SLR. To address this concern, the Long Island projections made with these inputs were supplemented by a qualitatively determined, upper-bound scenario taking into account the low-probability, high-impact events associated with more rapid ice sheet melting in Greenland and the west Antarctic than is shown by the GCMs. CCSR and NASA added to additional scenarios that took this into account: an A2 scenario with one-meter of melting of the next century, and an A2 scenario with a two-meter melting over the same time period. We implemented the one-meter melting scenario into the Future Scenarios Mapper considered this to be a “high” level estimate. Project staff used all of the above information to generate probability distributions of SLR for the individual and combined GCMs over 7 decades, from the 2020s to the 2080s. Projections for the 2020s, 2050s and 2080s are included as options in the mapping tool, labeled as “conservative,” “medium,” and “high” sea level rise projections that correspond respectively with A1b, A2, and A2 plus melting scenarios. Clicking on these options on the map will provide a visual depiction of inundation. The “bathtub” method of mapping water surfaces on a digital elevation model (DEM) was used to delineate a contour on a DEM based on a value above present-day Mean High Water (MHW). SLR values were mapped to a future Mean High Water (MHW) tide line or vertical datum.

Vertical datum conversions were necessary to map the correct MHW plus SLR values on the DEM, which was based on the NAVD88 vertical datum.


Project: Funding Request:
DRAFT
SUFFOLK COUNTY DECENTRALIZED WASTEWATER SYSTEM UPGRADE AND NITROGEN MITIGATION PROGRAM
CRITERIA & RATING SYSTEM
Rev. Draft October 3, 2012
PROJECT CRITERIA
Must meet the first factor below, and 5 of the remaining 6 factors below: Yes No
1. Project complies with Appendix A of SCDHS Commercial Construction Standards which currently allows for advanced subsurface nitrogen removal for flows of up to 15,000 gpd (as of October 2012) for commercial projects or residential clusters (1,000 gpd or greater), or is in conformance with other current SCDHS Construction Standards or has otherwise been approved by the SCDHS, and, if not passive, evidence of an annual maintenance contract under an approved management company has been provided (under SPDES permit, or within an acceptable management district created in accordance with state law).
2. Project is consistent with at least one of the following plans: Suffolk County’s Comprehensive Plan, Long Island Regional Economic Development Council Strategic Plan, estuary plans, the draft Comprehensive Water Resources Management Plan, Local Waterfront Revitalization Plans adopted by NYS, or applicable community-based locally-adopted municipal plans that have also been appropriately referred to the Suffolk County Planning Commission. For purposes of decentralized systems, this can be demonstrated by a showing that the project protects or improves the quality of drinking waters within the 50-year groundwater-contributing area to public supply wells, or areas served by private wells, or project protects or improves the quality of nitrogen-sensitive waterbodies within the 25-year groundwater travel time to surface waters and tributaries of Long Island Sound, South Shore Estuary Reserve, or Peconic Estuary.
3. Project applicant demonstrates the financial capacity to successfully implement project & demonstrates the experience to successfully carry out the project.
4. Project applicant demonstrates the ability to start the construction within 12 months of contract execution.
5. Project or site does not have current or foreseeable access to existing county, municipal or other community/decentralized sewage systems.
6. Site and its proposed use(s) will not compromise or reduce any environmentally sensitive natural habitats such as wetlands, rare upland plant/forest habitats, habitats of endangered, threatened and/or special concern species pursuant to Federal/New York State listings.
7. Project substantially addresses pre-existing sewage flow, rather than sewage flow from new development for which sewage treatment is necessary due to SCDHS density restrictions.
PROJECT CHARACTERISTICS Score
A. Financial Leverage (20 points max)
1. Project demonstrates private and/or non-county public investment. (20% match: 5 points; 30% match: 10 points; 40% match: 15 points; 50% match: 20 points)
B. Environmental Impact (80 points max) ** Nitrogen % reduction as compared to that from conventional septic systems
1. Project complies with the Total Maximum Daily Load (TMDL) requirement, or significantly reduced nitrogen load (50% or more**) in an area subject to a nitrogen TMDL. (8 points)
2. Project demonstrates a significant surface water benefit (minimum 50% reduction of nitrogen**) within 10-year travel time to sensitive water body (Peconic Estuary, LI Sound, etc.) (4 points) or 2-year travel time to sensitive water body (8 points)
3. Project demonstrates a significant drinking water benefit (minimum 50% reduction of nitrogen** within 10-year travel time to public water supply well, or in an area predominantly served by private wells) (4 points) or within a 2-year travel time to public supply wells. (8 points)
4. Project serves nonconforming lots in areas that were developed prior to the establishment of Article 6 of the Suffolk County Sanitary Code and have remained unsewered – majority of lots < 1 acre (4 points) or majority of lots < ½ acre (8 points)
5. Project reduces nitrogen discharge to below 25 mg/l (2 points), 10 mg/l (4 points) or 5 mg/l (8 points)
6. Project replaces a cesspool or failing system (8 points)
7. Project demonstrates attainment of advanced environmental performance credentials (i.e. LEED) and/or energy efficient measures and/or adhere to Low-Impact Development or Better Site Design and/or employ green infrastructure and/or water conservation measures (e.g., stormwater management, green roofs, repurposing wastewater). (8 points)
8. Project is located in a flood zone and upgrades a pre-existing non-conforming system or recharges pre-existing sanitary wastewater out of the flood zone. (8 points)
9. Project promotes an integrated watershed approach (e.g., a pilot project with demonstrated goal of meaningful subregional water quality improvement). (16 points)
Total Score (maximum = 100 points)

APPENDIX C
PECONIC GREEN GROWTH
REQUEST FOR PROPOSALS
DESIGN FOR DECENTRALIZED WASTEWATER TREATMENT FOR ORIENT, NEW YORK
April 21, 2013
By
Peconic Green Growth, INC (not-for-profit)
651 West Main Street
Riverhead, NY 11901
T 631 591 2402

651 West Main Street Riverhead, NY 11901 T 631 591 2401 www.peconicgreengrowth.org
The intent of the Request for Proposals (RFP) is to solicit professional design services for enhanced
wastewater treatment for designated districts in Orient, NY. (Please see attached map). Because of
various geological and land usage aspects of the area, decentralized community systems are favored,
possibly combined with on-site systems serving single homes or businesses where appropriate.
The design services will be divided into two phases: engineering report for submission to regulatory
jurisdictions for approval of the schematic design, and final design suitable for submittal for regulatory
approvals and for bidding for construction. A contextually appropriate approach is desired, suitable for
this environmentally sensitive and historic neighborhood.
The evaluation will assess a minimum of two alternative approaches for:
- Cost/benefit and environmental impacts, consider effects of climate change - Impacts on homeowners and the neighborhood - System reliability and performance - Design and system requirements for proper installation - Development issues - Examples of installed projects using the same technology with client contact information - Impact of water conservation program
For the selected approach, the designer will:
- Identify locations for system including those suitable for off-site treatment, - Justification for recommended system approaches - Two-staged designs of the clustered systems
o Engineer’s report for initial agency evaluation o Final design
- Identification of environmental controls, flushing and testing needs - Detail options for wastewater reuse - Cost estimates, including
o Construction costs o Operation and management costs including labor needs (including man-hours, tasks,
skill levels required and reporting /testing needs) o Life-cycle costs o Comparison to the typical costs of, and issues raised by a central sewer solution o Funding needed to obtain a maximum of $500/year operating/capital costs (grant
applications and other strategies for fund raising will be explored) o Land acquisition/leasing if needed
- The design tasks are to include the above listed items, but not limited to them. Both the initial engineer’s report and final design shall meet criteria for submittal as required by the relevant Suffolk County and New York State Agencies and Departments.
651 West Main Street Riverhead, NY 11901 T 631 591 2401 www.peconicgreengrowth.org
Expected products include:
1. An evaluation of options with cost projections 2. Recommend preferred alternatives (after public input) with the identification of potential sites
for treatment and discharge. Include cost estimates for capital, operation and maintenance, and life-cycle costs
3. Identification of relevant regulatory or community implications 4. Identification of any capacity for expansion and scaling 5. A recommended conceptual design scheme for the collection, treatment and disposal of
wastewater 6. Submission of an engineer’s report for regulatory review with cost estimate 7. Final design, cost estimate and construction schedule 8. Preparation of the required number of copies of materials for regulatory bodies plus two to
Peconic Green Growth as well as two electronic copies both in pdf and autocad formats (Revit files also acceptable, compatible with 2011 version)
9. Conduct the following planned meetings (plus others as appropriate): a. Initiation meeting with community and Town b. Field meetings as needed to collect information for initial design work c. Preliminary meeting to discuss options with community and Town d. Presentation of Engineer’s report (one to community/Town, another to County) e. Final presentation (one to community/Town, another to County)
BACKGROUND
Orient is an historic community first settled in the 1600’s and is surrounded by two estuaries of national
significance: The Long Island Sound and the Peconic Estuary. Long Beach Bay (also known as Hallock’s
Bay) and Orient Harbor are both listed as Significant Coastal Fish and Wildlife Habitats (SCFWH) by New
York State (NYS) Department of Environmental Conservation. The area does not have public water,
relying on individual wells for drinking and other domestic water use. The aquifer is single, sole-source
and isolated from the upper glacial aquifer of the North Fork. Homes built before 1973 are likely to have
cesspools instead of septic tank/leaching pit configurations, unless the home was expanded. Much of
the area is either in a flood or SLOSH zone with shallow depths to groundwater. Because of its historic
building patterns, many of the lots are small and do not meet current guidelines for minimum lot sizes
needed to sufficiently dilute wastewater to meet drinking water standards. Nitrate levels in
groundwater are relatively high, and salt intrusion is occurring in some locations along the coast.
Nitrogen levels in the bay are recommended to be below 0.40mg/l along the shoreline to maintain a
healthy marine environment. In some coastal areas of the community, the nitrogen level is approaching
and even exceeding this recommended maximum. The area has a high percentage of part-time or
seasonal home owners, representing 50.7% of the dwellings. This means that any solution will need to
be able to handle a wide range of flows.
Consideration of how the system will work during electrical outages needs to be included in the
evaluation. Discharge is to be to subsurface, not to surface waters. We would also welcome
opportunities for treated wastewater reuse, whether for irrigation, farming, toilet flushing, or a

651 West Main Street Riverhead, NY 11901 T 631 591 2401 www.peconicgreengrowth.org
pressurized water system as a supplement to the current sources of water used by the fire department.
We are willing to consider innovative approaches addressing regulatory issues and oversight, but the
proposal must ultimately meet County approvals. Therefore if the proposed system is not currently an
approved type, the consultant needs to supply demonstrable research data acceptable to Boards of
Review.
Submission
Due Date:
1. Letter of interest and proposal signed by responsible agent of the company. 2. Proposal of costs according to attached format, and hourly rates for any additional work not
required as part of this proposal that may be requested. 3. Description of your project approach. Please describe in detail the tasks needed to accomplish
the project. Discuss any unique aspects of the project or special considerations. If there are potential tasks that may be considered but not part of the core work, please identify as separate line items.
4. Firm description including legal structure, areas of expertise, time in business, number of employees, and other information that would characterize your firm. Provide the address and contact information of the main office and office that will manage the project.
5. Description of relevant projects designed by your firm. For each project mentioned, include the name, address, telephone number and email address for a person familiar with your work for the project. (minimum of three)
6. Identification of, role and resume of people proposed to work on this project, including primary project manager or supervisor. Please identify any sub-consultants.
7. Please provide a timetable for the design services including each activity and overall project completion, with key milestones identified.
8. Please identify any information that may be needed to complete the design and not part of the proposal, including but not limited to soil borings, information for environmental impact statements and similar items.
9. Provide two electronic copies, one in word and excel and the other in a pdf format and two paper copies of your proposal.
Selection Process
The proposals will be evaluated by a committee based on the following factors:
1. Firm history and capability to perform the project 2. Relevant project experience 3. Qualification of the team members 4. Project approach and schedule 5. Fee proposal
Interviews may be required for final selection.
Peconic Green Growth (PGG) reserves the right to award the contract to other than the proposer
presenting the lowest price. PGG may negotiate with one or more proposers. PGG reserves the right to
retain the services of more than one consultant, each assigned a different geographic area within the
651 West Main Street Riverhead, NY 11901 T 631 591 2401 www.peconicgreengrowth.org
community (districts). The size of the district may be amended to reflect both public input and the
consultant’s recommendations. No proposer shall have any rights arising against PGG from such
invitation or negotiations. Selection of one or more proposals, or rejection of all proposals, shall be in
the sole discretion of Peconic Green Growth. Due to availability of funds, Peconic Green Growth may
limit the tasks or phase the tasks of the proposal, at any time prior to the completion of the project. The
applicant will be expected to carry relevant general, employment, and professional insurance coverage
If any of the proposed fees represents a reduced rate from normal, please identify this differential, as it
may be used for matching fund purposes.
RFP Selection Schedule:
1. RFP released: April 21, 2013 2. Proposals Due: May 16, 2013 3. Decision of Award: June 22, 2013 or earlier
Peconic Green Growth has made every effort to provide accurate data and information, but it does not
guarantee the accuracy of any data included in the RFP. Flow data will be updated before start of
contract.
Peconic Green Growth is not responsible for proposer’s costs to respond to the RFP. Costs for
developing the proposal are entirely the responsibility of the proposers and shall not be reimbursed.
If you have any questions, please send by email to Glynis Berry at [email protected]
A copy of all submitted proposals will be sent to all applicants.
Please submit your proposal to:
Peconic Green Growth, Inc
651 West Main Street
Riverhead, NY 11901
T 631 591 2402
Attention: Ms. Glynis Berry, AIA, LEED AP, Director
Attachment:
1. Fee Proposal Format 2. Map of proposed districts:
http://www.peconicgreengrowth.org/docs/maps/orient/OrientDistricts.pdf 3. More maps of key conditions of Orient can be found at:
http://peconicgreengrowth.org/community-maps/

APPENDIX D


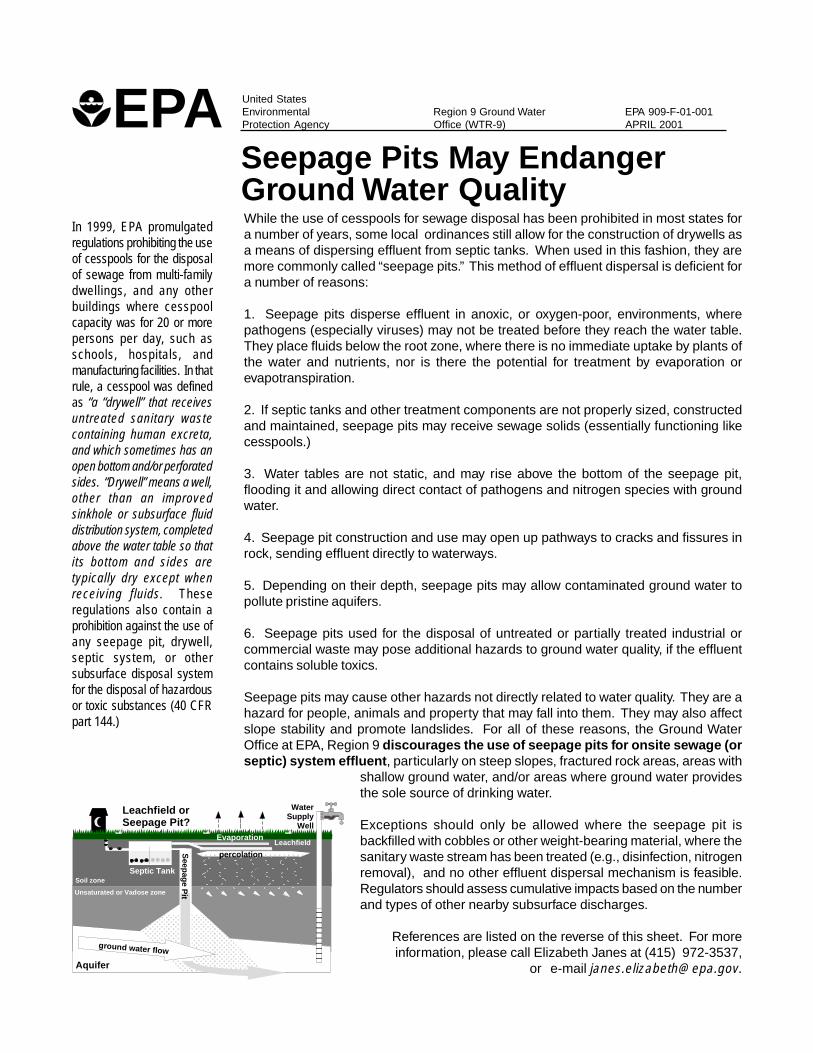
����������������������������������������������������
����������������������������������������������
EPA United States Environmental Region 9 Ground Water EPA 909-F-01-001 Protection Agency Office (WTR-9) APRIL 2001
In 1999, EPA promulgated regulations prohibiting the use of cesspools for the disposal of sewage from multi-family dwellings, and any other buildings where cesspool capacity was for 20 or more persons per day, such as schools, hospitals, and manufacturing facilities. In that rule, a cesspool was defined as “a “drywell” that receives untreated sanitary waste containing human excreta, and which sometimes has an open bottom and/or perforated sides. “Drywell” means a well, other than an improved sinkhole or subsurface fluid distribution system, completed above the water table so that its bottom and sides are typically dry except when receiving fluids. These regulations also contain a prohibition against the use of any seepage pit, drywell, septic system, or other subsurface disposal system for the disposal of hazardous or toxic substances (40 CFR part 144.)
Seepage Pits May Endanger Ground Water Quality While the use of cesspools for sewage disposal has been prohibited in most states for a number of years, some local ordinances still allow for the construction of drywells as a means of dispersing effluent from septic tanks. When used in this fashion, they are more commonly called “seepage pits.” This method of effluent dispersal is deficient for a number of reasons:
1. Seepage pits disperse effluent in anoxic, or oxygen-poor, environments, where pathogens (especially viruses) may not be treated before they reach the water table. They place fluids below the root zone, where there is no immediate uptake by plants of the water and nutrients, nor is there the potential for treatment by evaporation or evapotranspiration.
2. If septic tanks and other treatment components are not properly sized, constructed and maintained, seepage pits may receive sewage solids (essentially functioning like cesspools.)
3. Water tables are not static, and may rise above the bottom of the seepage pit, flooding it and allowing direct contact of pathogens and nitrogen species with ground water.
4. Seepage pit construction and use may open up pathways to cracks and fissures in rock, sending effluent directly to waterways.
5. Depending on their depth, seepage pits may allow contaminated ground water to pollute pristine aquifers.
6. Seepage pits used for the disposal of untreated or partially treated industrial or commercial waste may pose additional hazards to ground water quality, if the effluent contains soluble toxics.
Seepage pits may cause other hazards not directly related to water quality. They are a hazard for people, animals and property that may fall into them. They may also affect slope stability and promote landslides. For all of these reasons, the Ground Water Office at EPA, Region 9 discourages the use of seepage pits for onsite sewage (or septic) system effluent, particularly on steep slopes, fractured rock areas, areas with
shallow ground water, and/or areas where ground water provides the sole source of drinking water.
Septic Tank
���������������������������������������������������� ���������������������������������������������������� ���������������������������������������������������� ����������������������������������������������������
����������������������������������������������
ground water flow
Seep
age P
it
���
Water Supply
Well
Soil zone
Unsaturated or Vadose zone
Aquifer
Evaporation
Leachfield or Seepage Pit?
Leachfield
percolation
Exceptions should only be allowed where the seepage pit is backfilled with cobbles or other weight-bearing material, where the sanitary waste stream has been treated (e.g., disinfection, nitrogen removal), and no other effluent dispersal mechanism is feasible. Regulators should assess cumulative impacts based on the number and types of other nearby subsurface discharges.
References are listed on the reverse of this sheet. For more information, please call Elizabeth Janes at (415) 972-3537,
or e-mail [email protected].

From CSU-Chico/EPA Onsite Status Report(survey done 1999)
Seepage Pit References
1. Need for Soil Treatment (see also county and state water quality plans, and onsite sewage regulations.)
Crites, Ron and Tchobanoglous, George: Small and Decentralized Wastewater Management Systems, McGraw-Hill, 1998, page 653: ...Removal of microorganisms, including pathogenic bacteria, viruses, and helminths, is accomplished by soil filtration, adsorption, desiccation, radiation, predation, and exposure to other adverse environmental conditions.
International Association of Plumbing and Mechanical Officials, 1998 California Plumbing Code, Title 24, Appendix K3: ...(4) the minimum required area of porous formation shall be provided in one or more seepage pits. No excavation shall extend within ten (10) feet of the water table nor to a depth where sewage may contaminate underground water stratum that is usable for domestic purposes.
Oakley, Stewart M., for California Wastewater Training and Research Center, September 1999, Onsite Wastewater and Nitrogen Removal: Within a well-designed and constructed subsurface absorption trench, diffusion of oxygen into the vadose zone promotes the biological oxidation of NH4+ (ammonia) to N03- through biological nitrification. Depending on soil moisture conditions and organic matter concentrations within the soil column, N03- can be reduced, under anoxic conditions, to N2 gas through heterotrophic biological denitrification. A carbon source is required for denitrification to occur. In many instances there may not be sufficient organic substrate at a depth below the “A” horizon to promote denitrification; under these conditions N03-N can migrate into the groundwater aquifer. The conventional practice of constructing relatively deep subsurface soil absorption trenches (2 to 4 feet) for septic tank effluents thus may often have the effect of exacerbating denitrification problems and enhancing nitrate movement into groundwater. (page 5.)
USEPA, October 1980, Design Manual, Onsite Wastewater Treatment and Disposal Systems: ...Travel through two to four feet of unsaturated soil is necessary to provide adequate removal of pathogenic organisms and other pollutants from the wastewater before it reaches the groundwater. (p. 207)...Seepage pits are generally discouraged by many local regulatory agencies in favor of trench or bed systems... Maintaining sufficient separation between the bottom of the seepage pit and the high water table is particularly important consideration for protection of ground water quality. (p. 235)
US EPA, June 1987, Septic Tank Siting to Minimize the Contamination of Ground Water by Microorganisms: ...As the septic tank effluent percolates through the soil, its bacteriological quality changes depending upon the characteristics of the subsurface environment. One of the most important factors is the pore size of the soil matrix. Many bacteria are large enough to be filtered out as the water moves through the soil pores, thus limiting the depth of penetration. Another limitation on the distances bacteria can travel is the moisture content of the soil; bacteria can move
greater distances in saturated soil than in unsaturated soil (Hagedorn, 1984, p. 9)
2. Slope Stability
California Coastal Commission, Land Form Alteration Policy Guidance, Attachment 2, December 1993: ...Septic systems with leach fields require fairly gently sloping land with granular soils to be effective. Most local health departments are familiar with the slope and soil requirements for safe septic operation. In addition to testing that the soils on site will percolate, it is normal for leach fields to be limited to slopes less than 30%. In some locations this limitation can effectively prohibit development on a lot; however, some areas such as Los Angeles county allow seepage pits to be used if leach fields cannot be established... In areas with landslide potential, slides can be activated by increases in groundwater... Although a single septic system may not be enough to raise concern about the activation of a landslide, the cumulative impact from ten or twenty lots, with septic systems, irrigated landscaping and other small sources of groundwater, may pose a serious concern.
3. Collapse Hazard: See http://www.vvdailypress.com/ topstory/dp120400d.html (November 2000, Apple Valley, California incident, reported in (High Desert) Daily Press.
of 55 counties responding YES NO Standa rd drain field 2 ’-6’ allowed 55 0 Shallow trenches <2’ allowed 44 11 Deep trenches >6 ’ allowed 37 18 At-grade* allowed 38 16 Imported fill* allowed 28 27 Sand-lined trenches* allowed 22 33 Gravel-less (chambers)* allowed 48 7 Seepage pits allowed 28 25 Co nstru cte d w etla nd* allow ed 2 51 Evapotranspiration system*
allowed 25 28 Pressure drip irrigation* allowed 17 36 Absorption mound* allowed 42 11
CalifoEXAMPLE: Local Variation in California. From rnia Onsite Status Report, CSU-Chico CWTRC/EPA (1999)
U n d e r g r o u n d Injection Control Onsite WastewaterRegulations may Online:be found at Title www.epa.gov/owm/decent/40 of the Code of index.htmRegulations, or www.nsfc.wvu.edu parts 144-147.
DISCLAIMER: The statements in this document are intended solely as guidance. This document is not intended, nor can it be relied upon, to create any rights enforceable by any party in litigation with the United States. EPA or the program Primacy Agency may decide to follow the guidance provided in this document, or to act at variance with the guidance based on its analysis of the specific facts presented. This guidance may be revised without public notice to reflect changes in EPA’s approach to implementing the authorities discussed in the document or to clarify and update text.
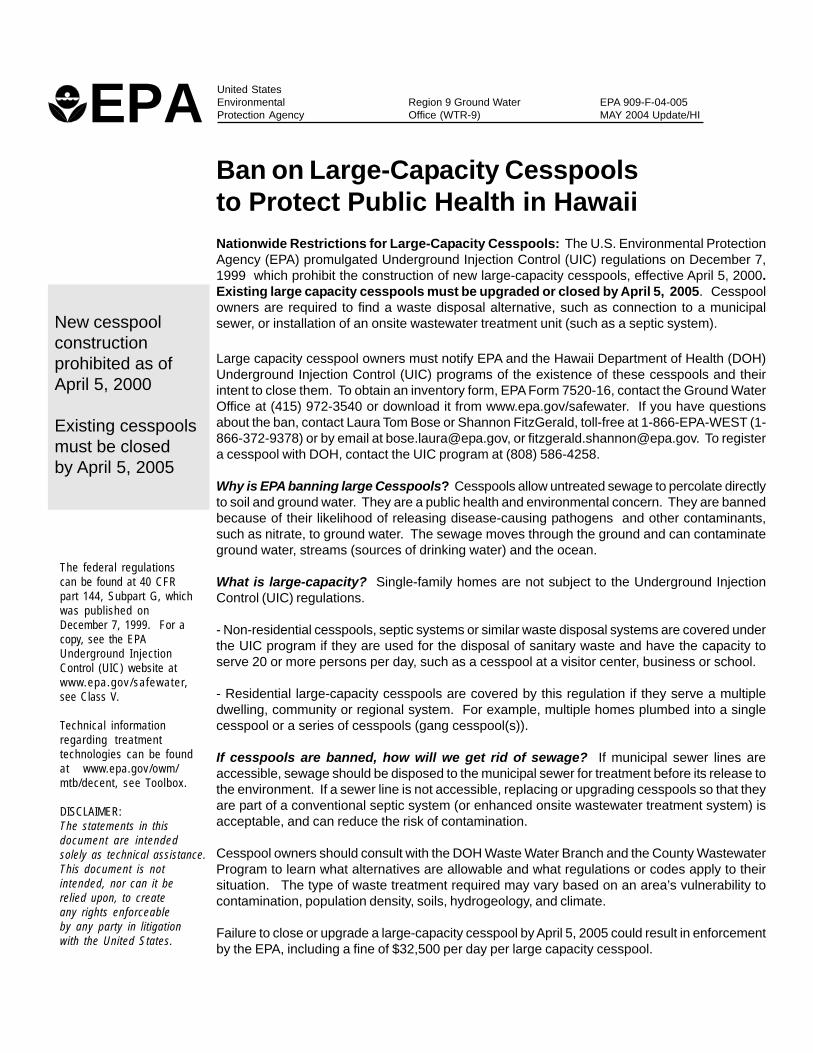
EPA United States Environmental Region 9 Ground Water EPA 909-F-04-005 Protection Agency Office (WTR-9) MAY 2004 Update/HI
New cesspool construction prohibited as of April 5, 2000
Existing cesspools must be closed by April 5, 2005
The federal regulations can be found at 40 CFR part 144, Subpart G, which was published on December 7, 1999. For a copy, see the EPA Underground Injection Control (UIC) website at www.epa.gov/safewater, see Class V.
Technical information regarding treatment technologies can be found at www.epa.gov/owm/ mtb/decent, see Toolbox.
DISCLAIMER: The statements in this document are intended solely as technical assistance.This document is not intended, nor can it berelied upon, to createany rights enforceableby any party in litigationwith the United States.
Ban on Large-Capacity Cesspools to Protect Public Health in Hawaii
Nationwide Restrictions for Large-Capacity Cesspools: The U.S. Environmental Protection Agency (EPA) promulgated Underground Injection Control (UIC) regulations on December 7, 1999 which prohibit the construction of new large-capacity cesspools, effective April 5, 2000. Existing large capacity cesspools must be upgraded or closed by April 5, 2005. Cesspool owners are required to find a waste disposal alternative, such as connection to a municipal sewer, or installation of an onsite wastewater treatment unit (such as a septic system).
Large capacity cesspool owners must notify EPA and the Hawaii Department of Health (DOH) Underground Injection Control (UIC) programs of the existence of these cesspools and their intent to close them. To obtain an inventory form, EPA Form 7520-16, contact the Ground Water Office at (415) 972-3540 or download it from www.epa.gov/safewater. If you have questions about the ban, contact Laura Tom Bose or Shannon FitzGerald, toll-free at 1-866-EPA-WEST (1-866-372-9378) or by email at [email protected], or [email protected]. To register a cesspool with DOH, contact the UIC program at (808) 586-4258.
Why is EPA banning large Cesspools? Cesspools allow untreated sewage to percolate directly to soil and ground water. They are a public health and environmental concern. They are banned because of their likelihood of releasing disease-causing pathogens and other contaminants, such as nitrate, to ground water. The sewage moves through the ground and can contaminate ground water, streams (sources of drinking water) and the ocean.
What is large-capacity? Single-family homes are not subject to the Underground Injection Control (UIC) regulations.
- Non-residential cesspools, septic systems or similar waste disposal systems are covered underthe UIC program if they are used for the disposal of sanitary waste and have the capacity to serve 20 or more persons per day, such as a cesspool at a visitor center, business or school.
- Residential large-capacity cesspools are covered by this regulation if they serve a multiple dwelling, community or regional system. For example, multiple homes plumbed into a single cesspool or a series of cesspools (gang cesspool(s)).
If cesspools are banned, how will we get rid of sewage? If municipal sewer lines are accessible, sewage should be disposed to the municipal sewer for treatment before its release to the environment. If a sewer line is not accessible, replacing or upgrading cesspools so that they are part of a conventional septic system (or enhanced onsite wastewater treatment system) is acceptable, and can reduce the risk of contamination.
Cesspool owners should consult with the DOH Waste Water Branch and the County Wastewater Program to learn what alternatives are allowable and what regulations or codes apply to their situation. The type of waste treatment required may vary based on an area’s vulnerability to contamination, population density, soils, hydrogeology, and climate.
Failure to close or upgrade a large-capacity cesspool by April 5, 2005 could result in enforcement by the EPA, including a fine of $32,500 per day per large capacity cesspool.

Regulatory Terms The following definitions are provided to assist you with understanding the regulatory requirements and are taken from the federal regulations at 40 CFR part 144.3 and Hawaii Administrative Rules (HAR), Title 11, Chapters 23 and 62.
Cesspool means a “drywell” that receives untreated sanitary waste containing human excreta, and which sometimes has an open bottom and/or perforated sides. [CFR] Further, it is an individual wastewater system which is designed to receive no more than 1000 gallons per day of domestic wastewater. [HAR]
Drywell means a well, other than an improved sinkhole or subsurface fluid distribution system, completed above the water table so that its bottom and sides are typically dry except when receiving fluids. [CFR]
Individual Wastewater System means a facility which is designed to receive and dispose of no more than 1000 gallons per day of domestic wastewater. [HAR]
Sanitary waste (domestic waste) means liquid or solid wastes originating from human activities, such as wastes collected from toilets, showers, wash basins, sinks used for cleaning domestic areas, food preparation, clothes or dish washing operations. [CFR]
Seepage pit means an excavation in the ground which receives the discharge from treatment units and permits the effluent to seep through its bottom or sides to gain access to the underground formation.[HAR]
Septic system means a “well” that is used to emplace sanitary waste below the surface and is typically comprised of a septic tank and subsurface fluid distribution system or disposal system, e.g. seepage pit. [CFR]
Subsurface fluid distribution system means an assemblage of perforated pipes, drain tiles, or other similar mechanisms intended to distribute fluids below the surface of the ground. [CFR]
Well means a bored, drilled, or driven shaft whose depth is greater than the largest surface dimension; or, a dug hole whose depth is greater than the largest surface dimension; or, an improved sinkhole; or, a subsurface fluid distribution system.[CFR]
Other questions about Cesspools:
What does it mean “have the capacity to serve more than 20 persons per day?” Any cesspool that is being used or has been used by 20 persons in a single day meet the federal definition of a large capacity cesspool.
Influent (waste(s)
Sludge Accumulat
Leachate
) cover (sometimes at ground from building surface or buried)
Excavation
Fluid Level
Brick, stone, concrete Block, Ring, or Precast Chamber, or other sidewall material, with Open Joints
Backfill Material
ion water table
Typical Cesspool Design
What if my cesspool disposes of more than just sanitary waste or domestic wastewater? A cesspool receiving a combination of sanitary waste and/or a commercial waste, such as a cesspool serving a hospital, laundromat or supermarket is an industrial well. It is subject to federal and DOH UIC regulations as well as DOH Wastewater regulations. If the cesspool serves or has served 20 or more persons, it must be closed by April 2005. In addition, under state law, cesspools and other individual wastewater systems receiving less than 1000 gallons per day (gpd) cannot be used for industrial wastewater disposal, are in violation of state law, and must upgrade. Cesspools receiving flows of greater than 1000 gpd and all injection wells must apply for a permit from the DOH UIC program.
What if my cesspool is not a drywell by the federal definition? The term “drywell” is used in the regulation to cover the most common type of construction. Some areas may use other designs. Some areas may also experience changes in water table levels, so that a cesspool is in the saturated zone. Cesspools that intersect the water table are banned by DOH and must be upgraded. Discharge of untreated sewage directly into the water table may be an even greater risk than discharge to soil above the water table, particularly in the transport of viruses.
How do I close my cesspool? The DOH UIC program has specific backfilling requirements that are issued to the facility after an abandonment application is submitted by the facility. Backfilling should not occur unless backfilling instructions are issued. For information, contact the UIC program at (808) 586-4258.
How do I replace my system? Plans must be prepared by a professional engineer for all new or replacement wastewater systems and must be submitted to the DOH Wastewater Branch for review and approval prior to construction. For information, contact the Wastewater Branch at (808) 586-4294.