© businessoulu 2011, the innovation systems and financials tools. case-finland/oulu. petri...
TRANSCRIPT

© BUSINESSOULU 2011, WWW.BUSINESSOULU.COM
The Innovation systems and financials tools. Case-Finland/Oulu.
Petri Karinen, Head of International Affairs
BusinessOulu
Oulu, Finland

Innovation policy and systems Innovation policy remains an art rather than a science. There are innovation policy theories but they are often mute on how to
adapt and change existing policies into new directions. At least since the works of Solow (1956, 57) and Arrow (1962), it has
been widely acknowledged that innovation is the principal engine of economic growth.
The Finnish innovation policy system is currently based on a subset of main tools:
intellectual property, subsidies (and R&D funding) and public production.
Co-operation between different organizations (public/private) is very important
Petri Karinen, © BUSINESSOULU 2011, WWW.BUSINESSOULU.COM
Source: Discussion papers No. 1185, Tuomas Takalo, RATIONALES AND INSTRUMENTS FOR PUBLIC INNOVATION POLICIES, ETLA 2009.

The complexity of the Finnish innovation system
Petri Karinen, © BUSINESSOULU 2011, WWW.BUSINESSOULU.COM
Source: Veugelers, Aiginger, Breznitz, Edquist, Murray, Ottaviano, Hyytinen, Kangasharju, Ketokivi, Luukkonen, Maliranta, Maula, Okko, Rouvinen, Sotarauta, Tanayama, Toivanen, Ylä-Anttila. 28 Oct. 2009. Evaluation of the Finnish National Innovation System – Policy Report. Taloustieto Oy.

Regional Innovation policy Innovation policy is national, the regional dimension is nonetheless rather
important. Innovative activity is highly concentrated regionally in Finland. Should innovation policy
ignore regional pattern and consider it only as a natural outcome in a globalised world or
should it take the regional dimension into account and aim reducing regional variations.
According to the Ministry of Employment and the Economy (MEE), there is only one rationale behind ’regional’ innovation policy: It aims at seeking innovative potential in all regions by reducing the information gap of the local actors.
it varies far more by the size than by the location of firms. The target group is small and medium-sized enterprises (SMEs)
Petri Karinen, © BUSINESSOULU 2011, WWW.BUSINESSOULU.COM

Geographical distribution of public R&D units
Petri Karinen, © BUSINESSOULU 2011, WWW.BUSINESSOULU.COM
Source: Veugelers, Aiginger, Breznitz, Edquist, Murray, Ottaviano, Hyytinen, Kangasharju, Ketokivi, Luukkonen, Maliranta, Maula, Okko, Rouvinen, Sotarauta, Tanayama, Toivanen, Ylä-Anttila. 28 Oct. 2009. Evaluation of the Finnish National Innovation System – Policy Report. Taloustieto Oy.
OULU
VILLE HEIKKINEN © BUSINESSOULU 2011, WWW.BUSINESSOULU.COM
Finland’s innovation activity

Finland’s innovation activity Finland’s innovation investment and performance are among the strongest in the
OECD area. Gross expenditure on R&D (GERD) was 3.7% of GDP in 2008 and Finland aims at
GERD intensity of 4% of GDP
Finland’s strong R&D investment is reflected in solid innovation-related outcomes.
64 triadic patents per million population in 2008 (almost double the OECD average) 1 573 scientific articles per million population in 2008 (third among OECD countries
and contributed 0.5% of the world share of scientific publications)
In 2008 Finland led the OECD with 16 researchers per thousand employment, and almost 60% of all researchers were in the business sector
Finland’s key economic sector is manufacturing, principally the wood, metals, engineering, telecommunications and electronics industries
(Source: OECD SCIENCE, 174 TECHNOLOGY AND INDUSTRY OUTLOOK 2010 © OECD 2010)
VILLE HEIKKINEN © BUSINESSOULU 2011, WWW.BUSINESSOULU.COM

Evolution of total R&D hours worked in Finland by sector
Petri Karinen, © BUSINESSOULU 2011, WWW.BUSINESSOULU.COM
Source: Veugelers, Aiginger, Breznitz, Edquist, Murray, Ottaviano, Hyytinen, Kangasharju, Ketokivi, Luukkonen, Maliranta, Maula, Okko, Rouvinen, Sotarauta, Tanayama, Toivanen, Ylä-Anttila. 28 Oct. 2009. Evaluation of the Finnish National Innovation System – Policy Report. Taloustieto Oy

Sectoral research in Finland by research area, budget funding (2009)
Petri Karinen, © BUSINESSOULU 2011, WWW.BUSINESSOULU.COM
Source: Veugelers, Aiginger, Breznitz, Edquist, Murray, Ottaviano, Hyytinen, Kangasharju, Ketokivi, Luukkonen, Maliranta, Maula, Okko, Rouvinen, Sotarauta, Tanayama, Toivanen, Ylä-Anttila. 28 Oct. 2009. Evaluation of the Finnish National Innovation System – Policy Report. Taloustieto Oy.

R&D investments in some countries
Source: OECD, Main Science and Technology Indicators
5.0
4.5
4.0
3.5
3.0
2.5
2.0
1.5
1.0
0.5
0.0
Percentage of GDP

EU member states’ innovation performance
Source: Innovation Union Scoreboard (IUS) 2010
Sweden, Denmark, Finland and Germany are innovation leaders in the EU.SII points 2010 (Summary Innovation Index)

Innovation and competitiveness
Source: The Information Technology and Innovation
Foundation ITIF; The Atlantic Century II, Benchmarking EU & US, Innovation and competitiveness
Finland was ranked second with R&D input and personnel, venture capital, productivity and trade indicators.

Competitiveness
Sources: WEF, The Global Competitiveness Report 2011-2012 and IMD World
Competitiveness Yearbook 2011
Total ranking 2011-2012
IMDTotal
competitiveness2010
WEFGlobal
competitiveness2011
534
11014122620
1 768
2313
4
132
45896
12111013171914
123 56789
10111213141516
157
2011
SwitzerlandSingaporeSweden
USAGermanyNetherlandsDenmarkJapanGreat BritainHong KongCanadaTaiwanQatarBelgiumNorway
Finland

Innovation index
09-2The Innovation index covers quality of research institutions, company spending on R&D,
university and industry research collaboration, availability of scientists and engineers,
utility patents and intellectual property protection.
Source: WEF, The Global Competitiveness Report 2010-2011010
Points according to WEF

Finland leads in technology and innovation
Measurements of the comparison are R&D investments as percentage of GDP, scientific and engineering researchers per capita and patents per capita.
Source: Martin Prosperity Institute: Global technology rankings.
12
34
56
78
910
1112
1314
1516
1718
Ranking

Ranking of EU countries The Lisbon Review
Info
rmat
ion
soc
iety
Inno
vatio
n
and
R&D
Lib
eral
isatio
n
Totalrank
Networ
k
ind
ustri
esFin
ancia
l
ser
vices
Enter
prise
env
ironm
ent
Socia
l i
nclu
sion
Sweden
DenmarkNetherlandsLuxembourgGermanyAustriaFranceGreat BritainBelgiumIrelandEstoniaCyprusSloveniaCzechia
Finland284751639
111813101520
13672945
14111710121915
42761
17101211
853
131519
3214598
1314
61116
71510
13567249
1011
814181216
1532796
104
1413
8161217
2135
1248976
1014211113
1752643
1110
89
14131812
123456789
101112131415
Susta
inab
le
deve
lopm
ent

Petri Karinen, © BUSINESSOULU 2011, WWW.BUSINESSOULU.COM
Oulu today and Oulu ecosystem
Petri Karinen, senior advisor
BusinessOulu
Petri Karinen, © BUSINESSOULU 2011, WWW.BUSINESSOULU.COM
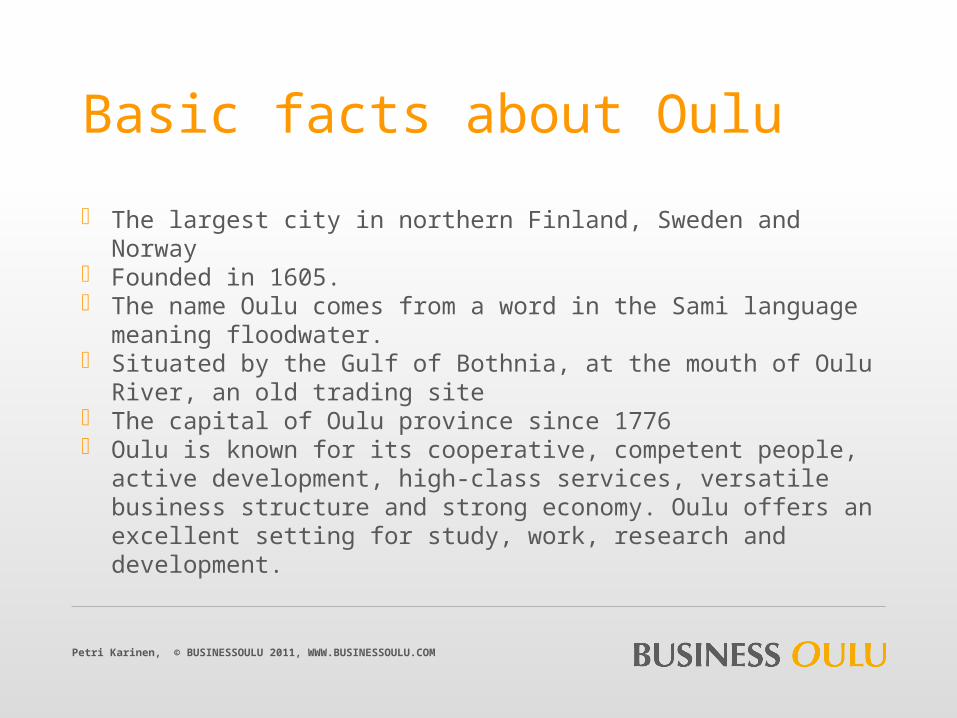
Basic facts about Oulu
The largest city in northern Finland, Sweden and Norway Founded in 1605. The name Oulu comes from a word in the Sami language meaning
floodwater. Situated by the Gulf of Bothnia, at the mouth of Oulu River, an old
trading site The capital of Oulu province since 1776 Oulu is known for its cooperative, competent people, active
development, high-class services, versatile business structure and strong economy. Oulu offers an excellent setting for study, work, research and development.
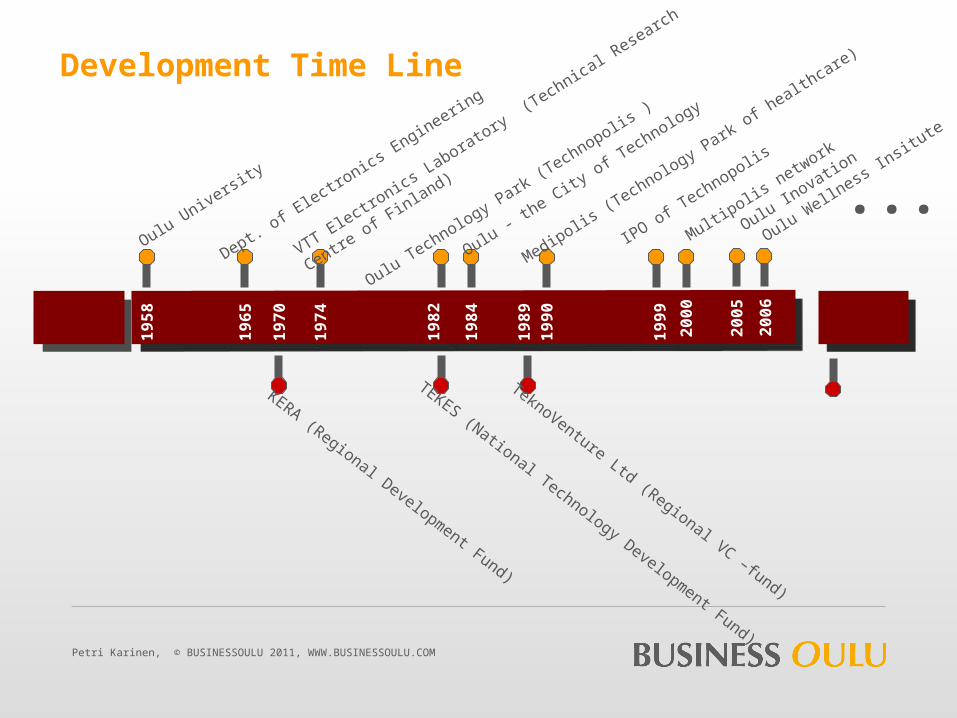
Oulu University
Dept. of E
lectronics Engineerin
g
VTT Electronics Laboratory (T
echnical Research
Centre of F
inland)
Oulu Technology Park (Technopolis )
Oulu - the City of T
echnology1
95
8
19
65
19
74
19
82
19
84
19
90
Medipolis (Technology Park of h
ealthcare)
19
99
IPO of Technopolis
...
20
00
19
70
KERA (Regional Development Fund)
TEKES (National Technology Development Fund)
19
89
TeknoVenture Ltd (Regional VC –fund)
Multipolis network
Oulu Inovatio
n
20
05
20
06
Development Time Line
Oulu Wellness In
situte
Petri Karinen, © BUSINESSOULU 2011, WWW.BUSINESSOULU.COM

Oulu University
Dept. of E
lectronics Engineerin
g
VTT Electronics Laboratory
Oulu Technology Park
Oulu - the City of T
echnology1
95
8
19
65
19
74
19
82
19
84
19
90
Medipolis
19
99
IPO of Technopolis
20
00
19
70
19
89
Multipolis network
Oulu Inovatio
n Ltd
20
05
20
06
Development Time Line
Creation of Education Base
Creation of R&D Base
Creation of Business Dev. Infra
”Birth” of the SME’s .
Attracting of Larger Corporations
Growth of Telecom Cluster
Globalisation of Telecom Cluster
Transformation...
Oulu Wellness In
situte
2010
Petri Karinen, © BUSINESSOULU 2011, WWW.BUSINESSOULU.COM
BusinessOulu

Oulu University
Dept. of E
lectronics Engineerin
g
VTT Electronics Laboratory
Oulu Technology Park
Oulu - the City of T
echnology1
95
8
19
65
19
74
19
82
19
84
19
90
Medipolis
19
99
IPO of Technopolis
...
20
00
19
70
KERA (Regional Development Fund)
TEKES (National Technology Development Fund)
19
89
TeknoVenture Ltd (Regional VC –fund)
Multipolis network
Oulu Inovatio
n Ltd
20
05
20
06
Development Time Line
Basic Industries (Forest, Metals, Food, ...) towards higher processing grade with higher productivity
Electronics, Instruments, Machines, Automation, ...
Wireless Telecom Industries, R&D-, Manufacturing, Services
Software, Medical, Wellness, Bio, Environment, Water, Renwable Energy, ...
.... ???
Industrial Focus
Oulu Wellness In
situte
Petri Karinen, © BUSINESSOULU 2011, WWW.BUSINESSOULU.COM

Oulu Today
A global leader in wireless IT technology Fifth in R&D spending per capita in Europe First in R&D spending per capita in Finland A true testing and piloting laboratory Leading edge technologies for a global market place Headquarters for Europe’s largest technology park Second largest university in Finland Second largest airport in Finland City region population of more than 230,000, more than 100 different nationalities City of 30,000 students 32.6% of population in Oulu with university degree (EU average 20%)
Petri Karinen, © BUSINESSOULU 2011, WWW.BUSINESSOULU.COM

Population on 1 Jan 2011 141 000 men 63,484 48.8 % women 66,694 51.2 %foreighner 2 417 1.9 %
In terms of population, Oulu is the sixth largest city in Finland One of the fastest growing urban centres in the country The average age of people living in Oulu was 36 years.
Surface area 449,2 km² land 369,7 km² water 79,5 km²
Population and surface area Education 2009
University secondary primary
Petri Karinen, © BUSINESSOULU 2011, WWW.BUSINESSOULU.COM
Oulu regionNorthern ostrobothnia
Finland

Why Oulu In FinlandOulu is number 1 in regional growth competitiveness comparison in Finland
Growth competitiveness index (GCI)
Competitiveness index (CI)
Source: Tekes report 243/2009 Regional vitality and competitive advantages
GCI CIRank Rank
Growth competitiveness index emphasizes:•Regional knowhow•Innovation factors (R&D spending, patents and high technology share of added value)•Accessibility of the region (airport connections and industry connections to markets)

CITY OF OULU Ranked as one of the top 28 cities in IT in the world
HelsinkiStockholm
Malmö/Copenhagen
Baden-WüttemburgBavaria Area
Israel
HelsinkiStockholm
Malmö/Copenhagen
Baden-WüttemburgBavaria Area
Israel
KiotoTaipei
HsinchuMelbourneBangalore
KiotoTaipei
HsinchuMelbourneBangalore
Dublin London
CambridgeFlander Area
Thames ValleyParis
Dublin London
CambridgeFlander Area
Thames ValleyParis
BostonNew YorkRaleigh/Durham/
Chapel HillMontreal
BostonNew YorkRaleigh/Durham/
Chapel HillMontreal
SeattleSilicon ValleySan Fransisco
San JoseLos AngelesAlbuquerque
Austin
SeattleSilicon ValleySan Fransisco
San JoseLos AngelesAlbuquerque
Austin
SOURCE: Kaleva, Wired MagazineCopyright: Invest in Oulu/Oulu Innovation Ltd.
OULUOULU
Petri Karinen, © BUSINESSOULU 2011, WWW.BUSINESSOULU.COM

City of Wireless R&D and Beyond
• World’s leading center of mobile communications technology and applications• Additional vertical expertise, research and business development in HealthBio, Wellness, CleanTech, Optical Technologies and Printed Electronics
• A major center for Nokia’s and Nokia Siemens Network’s R&D and production (Nokia employs approx. 5,000 people in Oulu)
• A remarkable tech economy: 17,000 hi-tech R&D jobs 800 IT companies U.S. $6.5 billion revenue
• Europe’s most significant hi-tech powerhouse
Petri Karinen, © BUSINESSOULU 2011, WWW.BUSINESSOULU.COM

Oulu IT Track Record is a Global Success Story2010 World's First Fully 'Open' Mobile Device Powered by Moblin and
Android Communities 2009 Linux Phone launch2008 World 1st pedestrian navigation phone2007 Launch of mobile Wimax test network2005 The world’s 1st public NFC user2004 The world’s 1st commercial Edge high-speed network2003 Europe’s 1st free urban area WLAN network2002 The world's 1st WCDMA (3GPP) telephone call1996 The world’s 1st WCDMA telephone call1993 Modern menu-driven user interface style for mobile phone1992 The 1st contactless fare collection system for public transportation1991 The world's 1st GSM telephone call1991 The world's 1st GSM base station1982 Europe’s largest science park1981 The world's 1st NMT network
Petri Karinen, © BUSINESSOULU 2011, WWW.BUSINESSOULU.COM

More than 200 Global Companies Operate in Oulu
Petri Karinen, © BUSINESSOULU 2011, WWW.BUSINESSOULU.COM

Oulu Innovation AllianceThe Oulu Innovation system

Background Oulu has a long tradition in co-operation between education and
research institutes, companies and public sector. Oulu’s high-tech image was built on this co-operation in 1980´s. As a collaborative continuation, the city of Oulu established a
taskforce to work on suggestions for the renewal of Oulu’s innovation environment in 2007.
As a result of the Oulu Triple Helix report, a strategic innovation alliance agreement was undersigned in February 2009.
The Oulu Innovation Alliance was formed between the City of Oulu, University of Oulu, Oulu University of Applied Sciences, VTT Technical Research Centre of Finland and Technopolis.

Oulu Innovation Alliance (OIA) The ultimate target of the Oulu Innovation Alliance
agreement is to keep Oulu as an internationally acknowledged center for innovation.
The OIA founding partners have committed1. To focus their operations, education, research and
development activities on agreed innovation areas.2. To invest in the development of agreed infrastructures.3. To create and develop mechanisms for mutual use.
The initial focus areas were agreed as Internet research, printed electronics, international business, environment and healthcare sectors.

Oulu Innovation Alliance
OIA Board
OIA Working committee
Directors of innovation centers
CEHT CIECEWICPrinto Cent
SkyPro MAIGBE
© BUSINESSOULU 2011, WWW.BUSINESSOULU.COM
Financials tools: Case-Finland/Oulu.

VC Model...
... is broken
Previous VCs have become PEs
Time for new models
VILLE HEIKKINEN © BUSINESSOULU 2012, WWW.BUSINESSOULU.COM

Equity Financing Trends
Traditional Venture Capitalists have become risk averse and prefer later stage investments
Lack of Early Stage Financing
Starting a business is faster and cheaper than earlier (cloud services etc.)
Early stage investment should carry further
VILLE HEIKKINEN © BUSINESSOULU 2012, WWW.BUSINESSOULU.COM
Seed
Startup
A-round
B-round...
Seed and Startup
A-round, B-round...
Earlier Today

Sources of financing (current and potential)
VILLE HEIKKINEN © BUSINESSOULU 2012, WWW.BUSINESSOULU.COM
BusinessOulu ?

Sources of financing Business Angels
Only investors investing to the seed stage
Accelerators / Micro VCs Investing thousands of euros instead of millions
VCs Has an important role in making scalable businesses to grow
fast Outside Europe have started to provide more added value
Crowdfunding Risk of having ”dumb money” Angels are afraid of crowdfunding
VILLE HEIKKINEN © BUSINESSOULU 2012, WWW.BUSINESSOULU.COM

Future?
Visible angel investments are representing more than 5% of new jobs created in the US (Sohl 2010)
Invisible market much greater
90’s was the decace of VC investments 00’s was the decade of PE investments 10’s is the decade of Micro VC / Angel investments
Finland is really highly ranked and appreciated in the startup field Berlin considered best / easiest place to get funding at the
moment
VILLE HEIKKINEN © BUSINESSOULU 2012, WWW.BUSINESSOULU.COM
Oulu Region and Northern Startup Fund
VILLE HEIKKINEN © BUSINESSOULU 2012, WWW.BUSINESSOULU.COM

National VC investments versus R&D investments in 2006
Petri Karinen, © BUSINESSOULU 2011, WWW.BUSINESSOULU.COM
Source: Veugelers, Aiginger, Breznitz, Edquist, Murray, Ottaviano, Hyytinen, Kangasharju, Ketokivi, Luukkonen, Maliranta, Maula, Okko, Rouvinen, Sotarauta, Tanayama, Toivanen, Ylä-Anttila. 28 Oct. 2009. Evaluation of the Finnish National Innovation System – Policy Report. Taloustieto Oy.

H1/2011 Investment Statistics - Finland Finnish portfolio companies received 568 MEUR from
Finnish and foreign private investors 300 MEUR to life science industry 45 MEUR to companies on seed, startup and later venture
stage (“venture stage”) and 523 MEUR to “buyouts” 90 investments to venture stage companies and 63
“buyouts” 22 MEUR to venture stage companies and 399 MEUR to
“buyouts” by foreign investors (Source: FVCA statistics, 30 August 2011)
Finnish High-Tech companies received 112 MEUR 30 MEUR to Rovio/Angry Birds 58,7 MEUR as second round financing 71,3 MEUR by foreign investors 35,1 MEUR to mobile sector (Source: Technopolis Online, press release by
Technopolis Oyj, 1 September 2011)
Ville Heikkinen © BUSINESSOULU 2011, WWW.BUSINESSOULU.COM
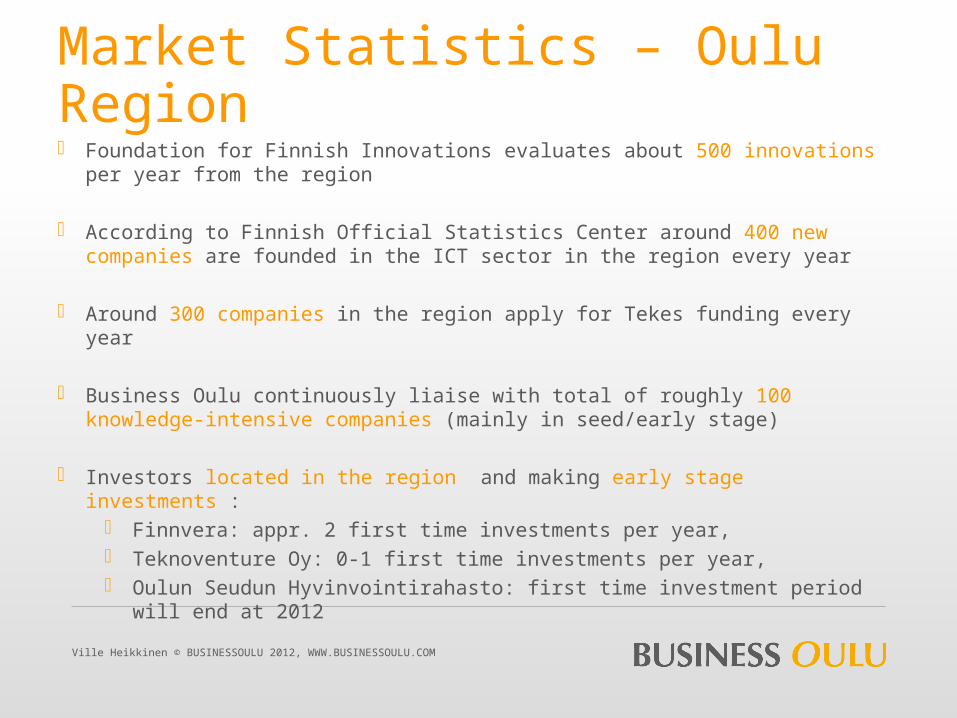
Market Statistics – Oulu Region Foundation for Finnish Innovations evaluates about 500 innovations per
year from the region
According to Finnish Official Statistics Center around 400 new companies are founded in the ICT sector in the region every year
Around 300 companies in the region apply for Tekes funding every year
Business Oulu continuously liaise with total of roughly 100 knowledge-intensive companies (mainly in seed/early stage)
Investors located in the region and making early stage investments : Finnvera: appr. 2 first time investments per year, Teknoventure Oy: 0-1 first time investments per year, Oulun Seudun Hyvinvointirahasto: first time investment period will
end at 2012
Ville Heikkinen © BUSINESSOULU 2012, WWW.BUSINESSOULU.COM

Gaps in the Ecosystem of Northern Finland / Oulu Region
AA BB CC DD
CO
MP
ETEN
CES
RIS
K C
AP
ITA
L
Investors (as board members)Board-level mgmtskills
Executive / directorskills
Dedicated / expert skills
GAP:Experienced entrepreneurs, business managers (Business Angels)as active directors of a start-up company
New Entrepreneurs
National
Regional
GAP:Equity funding for high-growthstart-up companies
SITRA, Finnvera, Veraventures
Finnish Industry Investment
Individual VCs and VC Funds
Pre-seed Seed Start-up Growth
Avera
Ville Heikkinen © BUSINESSOULU 2012, WWW.BUSINESSOULU.COM

Northern Start-up Fund in BriefAim
Establish a 35 M€ fund for financing seed, start-up, and expansion stage companies in Oulu Region/ Northern Finland.
Fund Structure Public-Private Partnership, utilizing funding from European Union sources. 70 / 30 (Public / Private) investment proportions. Liquidation preference for private investors.
Operational Goals Attract public and private investments to finance the most promising companies. Attract international business professionals to invest in the companies and actively work for
them. Activate Business Angel Investments.
Target Companies Are in Oulu Region / Northern Finland and operate in knowledge intensive industry. Are willing and able to enter into international business and are seeking for fast growth.
Ville Heikkinen © BUSINESSOULU 2012, WWW.BUSINESSOULU.COM

Conclusion
The Finnish low success in promoting high-growth businesses and enterprises seems to be our weak point.
There is much room for improvement in fostering high growth entrepreneurship. I especially endorse two points that were addressed in the evaluation:
You need international, national and local innovation systems and policies. The financial tools are playing key role for the whole system.
there is a need to promote the activity of experienced business angels and early-stage investors/funds to assist entrepreneurs.
Taxation might indeed be a policy instrument to be used in order to create incentives for investors, entrepreneurs and other talented people who are in the core of our innovation system.
Petri Karinen, © BUSINESSOULU 2011, WWW.BUSINESSOULU.COM

Thank you
VILLE HEIKKINEN © BUSINESSOULU 2012, WWW.BUSINESSOULU.COM
Petri KarinenHead of International [email protected]