© boardworks ltd 2003 1 of 17 interpreting results modelling this icon indicates that detailed...
TRANSCRIPT
© Boardworks Ltd 20031 of 17
Interpreting Results
Modelling
This icon indicates that detailed teacher’s notes are available in the Notes Page.
For more detailed instructions, see the Getting Started presentation.
This icon indicates the slide contains activities created in Flash. These activities are not editable.

© Boardworks Ltd 20032 of 17
Does it work?
It is very important to test that the data entered is correct. This can be done by spot checking some of the numerical data.It is essential that formulas are entered correctly and tested to ensure that they work as they should.This can be done by doing the calculation using another method – for example with a calculator or mentally.
Do not forget to spell check!

© Boardworks Ltd 20033 of 17
Can you spot the mistakes in this spreadsheet? There is one spelling mistake; one wrong amount entered; and one formula which should be add, not subtract.
© Boardworks Ltd 20034 of 17
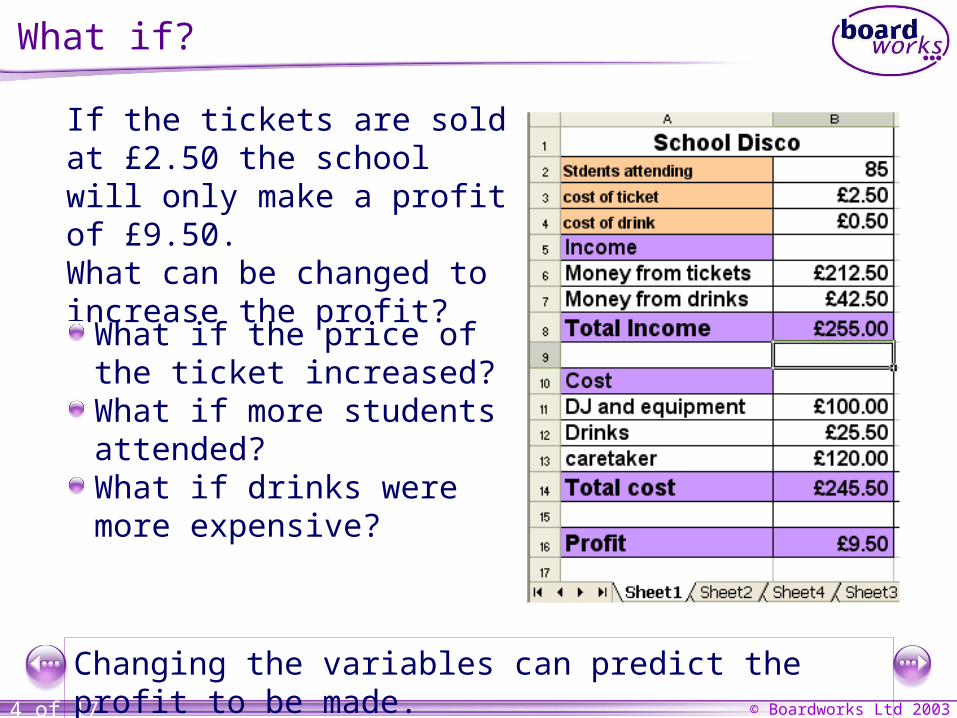
What if?
If the tickets are sold at £2.50 the school will only make a profit of £9.50. What can be changed to increase the profit?
Changing the variables can predict the profit to be made.
What if the price of the ticket increased?What if more students attended?What if drinks were more expensive?

© Boardworks Ltd 20035 of 17
Ticket price increased?More students attended? Drink price increased?
A B C
What if…
Which model earns the most income?
A, B, or C?
A earns the most income

© Boardworks Ltd 20036 of 17
Ticket price increased?More students attended? Drink price increased?
A B C
What if…
Which model earns the lowest profit?
A, B, or C?
B earns the lowest profit

© Boardworks Ltd 20037 of 17
Ticket price increased?More students attended? Drink price increased?
A B C
What if…
Which model has the highest cost?
A, B, or C?
A has the highest cost
© Boardworks Ltd 20038 of 17
Compare the previous slide to the next…
both slides show the profit using three different variableshowever, the graph is much easier to read and interpret than the spreadsheet.

© Boardworks Ltd 20039 of 17
£0.00
£50.00
£100.00
£150.00
£200.00
£250.00
£300.00
£350.00
£400.00
am
ou
nt
120 students drinks @ 75p tickets @ £3.00
What if?
Comparing Profits
Income
Cost
Profit
© Boardworks Ltd 200310 of 17
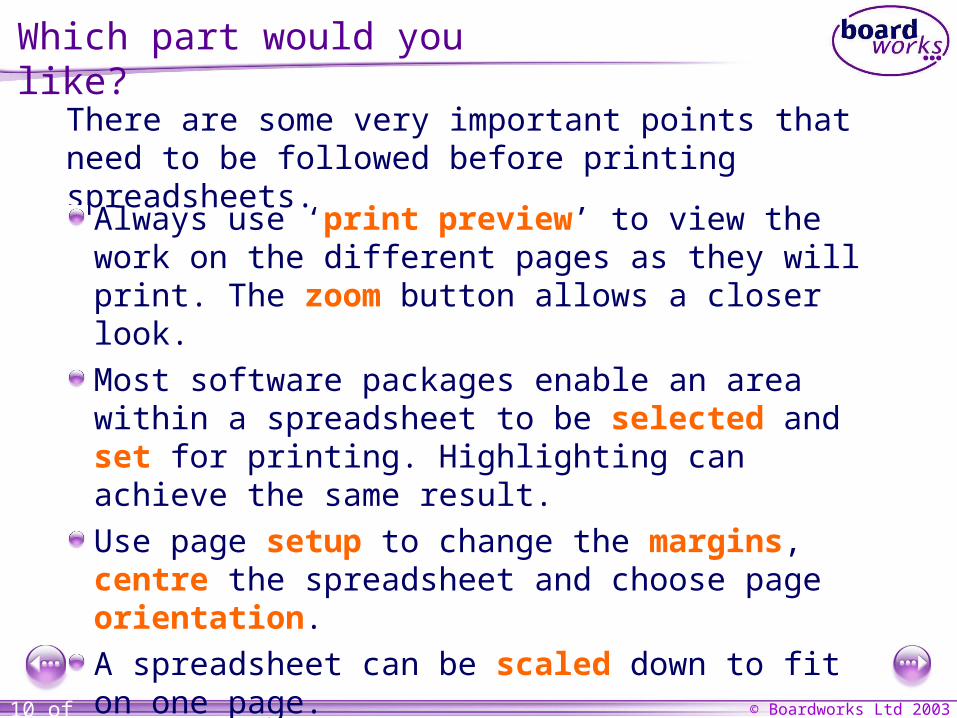
Which part would you like?
There are some very important points that need to be followed before printing spreadsheets.
Always use ‘print preview’ to view the work on the different pages as they will print. The zoom button allows a closer look.
Most software packages enable an area within a spreadsheet to be selected and set for printing. Highlighting can achieve the same result.
Use page setup to change the margins, centre the spreadsheet and choose page orientation.
A spreadsheet can be scaled down to fit on one page.
Always include a footer with your name.

© Boardworks Ltd 200311 of 17

© Boardworks Ltd 200312 of 17
It’s all in the graph
The graph shows that aiming to have 120 will provide the most profit at the disco.
Always add a caption explaining what the graph demonstrates.
Don’t forget to add a title and label the x and y axis. A legend explains what each of the data series are.

© Boardworks Ltd 200313 of 17

© Boardworks Ltd 200314 of 17
0 20 40 60 80 100
percentage
Bobby Redding
Sarah Hook
Frances Ross
Jack Bysouth
Ali Mohammed
Diane Simpson
stu
den
ts
Percentage Marks
Students test marks for 2003/2004
010203040506070
students
mark
s
autumn
spring
summer
Pie chart
Line graph
Bar chart

© Boardworks Ltd 200315 of 17

© Boardworks Ltd 200316 of 17
When you have completed your model you need to interpret the data and talk about your findings.
This is best achieved by word processing a report.
You should copy and paste graphs from your spreadsheet software and add them to your report.
Graphs will help to demonstrate your findings and conclusions.

© Boardworks Ltd 200317 of 17
All data on spreadsheets should be checked for mistakes.Formulas should be double-checked by testing some using a calculator.Spreadsheets are useful to ask “What if?” questions.Changing a variable will also change the contents of all the cells it appears in.There are many choices that can be made when printing a spreadsheet.Graphs and charts enable information to be presented much more easily.Different charts are used for different purposes.
Summary
What can I remember?