© arema 2016® 185 · lateral forces within the track superstructure (2-6), mostlydeveloping a...
TRANSCRIPT

Comparison of Lateral Load Performance of Concrete Crosstie Heavy Haul Fastening Systems
Authors
Donovan E. HolderRail Transportation and Engineering Center – RailTEC Department of Civil and Environmental EngineeringUniversity of Illinois at Urbana-Champaign205 N. Mathews Ave., Urbana, IL 61801 (217) [email protected]
Yu QianRail Transportation and Engineering Center – RailTEC Department of Civil and Environmental EngineeringUniversity of Illinois at Urbana-Champaign205 N. Mathews Ave., Urbana, IL 61801 (217) [email protected]
Matthew V. CsengeRail Transportation and Engineering Center – RailTEC Department of Civil and Environmental EngineeringUniversity of Illinois at Urbana-Champaign205 N. Mathews Ave.,Urbana, IL 61801 (217) [email protected]
J. Riley EdwardsRail Transportation and Engineering Center – RailTEC Department of Civil and Environmental EngineeringUniversity of Illinois at Urbana-Champaign205 N. Mathews Ave., Urbana, IL 61801 (217) [email protected]
Marcus S. DerschRail Transportation and Engineering Center – RailTEC Department of Civil and Environmental EngineeringUniversity of Illinois at Urbana-Champaign205 N. Mathews Ave., Urbana, IL 61801 (217) [email protected]
Brandon J. Van DykVossloh Fastening Systems America233 S. Wacker Dr. #9730Chicago IL, 60606(312) [email protected]
Number of Words3,888
ABSTRACT
There are many unique designs of elastic fastening systems used throughout the world that have been
developed to meet a variety of design specifications and performance expectations. Historically, the most
common types of fastening systems used for concrete crossties in North America are the Safelok I or e-
clip systems. However, in recent years, railroads have begun implementing the Skl-style (W) fastening
system with concrete crossties in existing and new heavy-haul freight railroad mainlines. To better
understand how the Skl-style system performs under the magnitude of lateral loads observed on heavy
haul freight railroads, research was conducted by the Rail Transportation and Engineering Center
(RailTEC) at the University of Illinois at Urbana-Champaign (UIUC). The focus of this paper is on
© AREMA 2016® 185

laboratory characterization of the lateral load path through the Skl-style W 40 fastening system on a full-
scale laboratory setup. These data were then compared to experimentation conducted on the Safelok I
fastening system under the same loading conditions. Laboratory experimentation comparison concluded
that lateral wheel load is primarily transferred into three crossties for both systems, the lateral wheel load
imparted into the angled guide plate of the W 40 system was higher than the lateral wheel load imparted
into the shoulder of the Safelok I, and the lateral stress placed on the lateral crosstie bearing area for the
W 40 system is lower than the lateral stress placed on the lateral crosstie bearing area of the Safelok I
system. It is the authors’ intent that the information in this paper will assist the rail industry in improving
fastening system design and performance for North American heavy-haul freight railroad applications
through the use of quantitative loading data as inputs for the future implementation of mechanistic design.
INTRODUCTION
Concrete crossties are an appealing alternative to conventional timber crossties for many reasons,
primarily due to their durability and high load-carrying capacity. However, increasing axle loads, coupled
with the demanding loading environment seen in certain portions of the North American rail network, have
presented engineering challenges for the design and performance of concrete crossties and their
fastening systems. A survey conducted in 2012 by the Rail Transportation and Engineering Center
(RailTEC) at the University of Illinois at Urbana-Champaign (UIUC) determined that wear of fastening
system components and rail seat deterioration (RSD) are two of the most critical problems observed in
concrete crosstie track in North America (1). It is hypothesized that one of the primary contributors to
both of these problems is the high lateral load that is expected to occur within the track superstructure in
certain heavy haul freight railroad locations. This hypothesis cannot be addressed due to the fact that
lateral load performance of track superstructure has not been thoroughly investigated.
There has been progress in recent years in terms of research that was aimed at quantifying
lateral forces within the track superstructure (2-6), mostly developing a detailed understanding of the
lateral load demands on fastening system components. These initial experiments primarily focused on
the performance of a widely-used spring clip system, the Safelok I, but the magnitude of lateral loads
imparted on fastening system components and the distribution of lateral forces within the track
superstructure are believed to be dependent on the type of fastening system used. In recent years, North
186 © AREMA 2016®

American railroads have begun implementing Skl-style (W) fastening systems with concrete crossties in
both existing and new heavy-haul freight railroad infrastructure. Although the systems are performing
well in demanding North American track locations, little research has been conducted on Skl-style
systems with respect to the lateral load demands placed on the components under heavy haul loads. To
improve the current understanding of Skl-style fastening systems, laboratory experimentation was
conducted at UIUC to further understand the lateral load performance of the systems. The performance
of the Skl-style system was then compared to similar laboratory experimentation conducted on the widely-
used Safelok I system in order to better understand how the Skl-style system performs under North
American heavy haul freight railroad axle loads.
OVERVIEW OF FASTENING SYSTEMS
W 40 HH AP System
The Skl-style system chosen to conduct lateral load experimentation is the W 40 HH AP fastening system
(hereafter referred to as the “W 40” or “W 40 system”) manufactured by Vossloh Fastening Systems (7).
The W 40 system is comprised of tension clamps, angled guide plates, a rail pad, and an abrasion plate,
and is held together by tie (i.e. lag) screws (Figure 1) inserted into an embedded dowel.
Figure 1. Vossloh Fastening Systems W 40 HH AP fastening system (8)The angled guide plates allow for the distribution of lateral force along the entire length of the rail seat and
are designed to stress the concrete crosstie in pure compression (8). Additionally, the system is
equipped with an abrasion plate designed to protect the rail pad and to mitigate RSD, one of the most
© AREMA 2016® 187

critical problems with concrete crossties and fastening systems in North America today (1). The geometry
of the tension clamp is optimized such that the residual stress within the tension clamp is reduced after
typical rail deflection, increasing the fastening system’s ability to sustain adequate clamping force (8).
Safelok I System
Lateral load experiments were also conducted on concrete crossties equipped with the Safelok I fastening
system, commonly manufactured by Pandrol and Progress Rail Services. This past research effort
conducted by RailTEC was funded by the Federal Railroad Administration (FRA), to better understanding
concrete crosstie track performance. The Safelok I system is one of the most common fastening systems
installed on North American heavy haul concrete crosstie track, and as such, the advantages and
disadvantages of this fastening system are relatively well-understood in the North American heavy haul
industry. The components of the Safelok I fastening system, and how they are installed on a concrete
crosstie can be seen in Figure 2.
Figure 2. Components of the Safelok I fastening system
Steel shoulders are embedded into the concrete crosstie during casting. Insulators are used to
electrically isolate the rail from the clips. A two-part rail pad and abrasion frame is installed underneath
188 © AREMA 2016®

the rail on each rail seat to increase the resilience of the system, and help better distribute vertical and
lateral load into the concrete crosstie rail seat.
LABORATORY EXPERIMENTATION
Laboratory Experimentation Objective
The primary objective of this research endeavor is to quantify the lateral load path through the track
superstructure equipped with the W 40 system by investigating the global lateral load distribution through
the track superstructure, and the lateral force applied to the field-side angled guide plate. The data
collected from experimentation with the W 40 system will then be compared with data collected from past
experimentation with the Safelok I system. The Safelok I system is widely used within the North
American heavy haul freight railroad industry, and provides for a good baseline to better understand the
performance of the W 40 system.
Experimentation System
Experimentation for both the W 40 and Safelok I systems was performed on the full-scale Track Loading
System (TLS), located in RailTEC’s Research and Innovation Laboratory (RAIL) in Champaign, Illinois,
USA. The TLS allows for the application of load to a 22-foot (6.7-m) long section of concrete crosstie
track (Figure 3). Track components are assembled on a full-depth section of track that includes eleven
crossties spaced at 24 inches (61 cm) on center. Static combinations of vertical and lateral loads were
applied to the journals of a 36-inch (91.4 cm) diameter railcar wheel set. Vertical and lateral loads were
adjusted separately using a control system. The TLS uses two servo-hydraulic actuators mounted
vertically and a hydraulic cylinder mounted laterally on a self-reacting steel frame that encapsulates the
track structure. A special assembly for each journal was designed to attach one vertically-mounted
actuator and the horizontally-mounted hydraulic cylinder to one journal and the second vertically-mounted
actuator to the opposite journal.
© AREMA 2016® 189

(a) (b)
Figure 3. RailTEC’s Track Loading System (TLS) in the Research and Innovation Laboratory (RAIL), Champaign, Illinois, USA a) W 40 experimentation setup
b) Safelok I experimentation setup
The testing setups on the TLS for the W 40 and Safelok I system experimentations were identical (same
crosstie spacing, rail size, ballast depth, etc.). New fastening systems were used in all experimentation
conducted on the TLS for both the Safelok I and W 40 systems.
Lateral Wheel Load Measurement
Lateral wheel loads were measured to quantify the load magnitude entering the rail at the wheel-rail
interface. Lateral loads were measured using four strain gauges, two installed on each side of the rail
centered above the rail seat. Strain gauges to measure loads were wired in full Wheatstone bridges and
installed above the center five crossties on the TLS.
Measurement of Lateral Force through Fastening System
In order to quantify the lateral load magnitude and path through the fastening system, RailTEC
researchers developed the Lateral Load Evaluation Device (LLED) (4, 5, 6). A unique LLED was
designed for both of the fastening systems compared in this paper. The LLED uses strain gauges to
measure the bending strain of a load cell that is placed in four-point bending. Strains measured on the
LLED that are induced from lateral loads are resolved into forces using calibration curves generated by
190 © AREMA 2016®

experiments conducted on a uniaxial loading machine.
The installation of the LLED in the Safelok I system involves grinding away a portion of the field
side shoulder, and replacing it with the LLED (Figure 4a). A steel shim was manufactured to cover the
front of the device in the Safelok I system to limit possible damage to the insulator and LLED during
experimentation. The stiffness and geometry of the LLED is similar to the original shoulder to ensure
equivalent conditions.
For the W 40 system, two LLEDs are installed in the field-side angled guide plate in order to
obtain the total magnitude of lateral force imparted in the face of the angled guide plate by the rail base
(Figure 4b). LLEDs are installed in pockets that are machined into the field side angled guide plates and
were designed to maintain fastening system geometry and stiffness in a manner that is representative of
the un-instrumented fastening system (Figure 4b). Steel shims were manufactured and placed at the
back of the LLEDs to decrease the possibility of the LLED damaging the guide plate during
experimentation.
a)
© AREMA 2016® 191

b)
Figure 4. Image of LLEDs and the installation of the instrumentation in fastening system a) LLED designed and installed for Safelok I system b) LLED designed and installed for the W 40 system
Laboratory Instrumentation Layout
For each fastening system, the LLED-equipped systems were symmetrically installed on five of the eleven
concrete crossties on the TLS. The instrumentation was installed on the middle crossties of the TLS to
avoid
any
192 © AREMA 2016®

influence of boundary conditions at the ends (Figure 5). The five concrete crosstie installation was
chosen for instrumentation due to past experience of load distribution from field experimentation
performed by RailTEC, and established theories on vertical pressure distribution (9).
For each fastening system tested, only one rail was heavily instrumented due to the manner in
which lateral force is applied to the wheelset on the TLS (Figure 5). The horizontally-mounted hydraulic
cylinder applies lateral force on the wheelset toward the west rail causing the flange of the wheel to be
braced against this rail as lateral load is increased. This causes higher lateral forces to be imparted on
the west rail making it the more critical rail to investigate when analyzing lateral load path.
GLOBAL DISTRIBUTION OF LATERAL FORCES
The lateral force distribution through the track superstructure with each fastening system was
quantified and compared to investigate how different fastening systems distribute load globally. This
distribution was analyzed by applying load directly over each heavily instrumented crosstie on the TLS,
and quantifying the distribution of lateral force resisted by the field side angled guide plates of the W 40
system or field side shoulder of the Safelok I system. An example of the global lateral load distribution
observed in laboratory experimentation with both fastening systems tested can be seen in Figure 6. In
this figure a vertical wheel load of 40 kips (178 kN) was held constant on the TLS track as lateral load
was applied (Figure 6). The y-axis in this figure was obtained by dividing the lateral force measured from
the LLEDs within the field angled guide plate or embedded shoulder of a given crosstie by the lateral
wheel load applied to the rail.
From experimentation conducted on the TLS with each fastening system, it was observed that
lateral load was primarily distributed into the crosstie directly below the point of load application, as well
as the two adjacent crossties. As seen in Figure 6, the W 40 systems were better able to globally
distribute lateral force from the rail into their angled guide plates than the Safelok I system was able to
distribute lateral force into its embedded shoulders.
© AREMA 2016® 193

Figure 5. Global distribution of lateral wheel load in track installed with the W 40 and Safelok I systems
Figure 6 also shows that the lateral load measured by the LLEDs installed in the shoulders of the
Safelok I systems were considerably lower than the lateral force applied to the rail. In the particular case
shown in Figure 6, the LLED-measured lateral load only accounts for 63% of the lateral wheel load
applied to the rail for Safelok I system, and 90% for the W 40 system. It is hypothesized that this occurs
due to the lateral frictional forces at the rail seat playing a more significant role in resisting lateral wheel
load for the Safelok I system in comparison to the W 40 system. In the case of the W 40 system, the lack
of reliance on lateral frictional forces at the rail seat to transfer lateral wheel load into the concrete
crosstie is also hypothesized to make this system less abrasive to the concrete rail seat which could help
mitigate the initiation of RSD.
LATERAL FORCE THROUGH FASTENING SYSTEM
Quantifying the lateral force applied to the field side angled guide plate of the Skl-style fastening system
has never been performed before, and is an important step to further the understanding of the demands
placed on this component. Additionally, quantitative lateral force data provide insight on how the lateral
194 © AREMA 2016®

force is transferred from the rail head to the different components within the fastening system and track
superstructure.
Figure 7 shows a comparison of lateral force resisted on rail bearing area for the W 40 and
Safelok I systems with increasing lateral wheel load and under a constant vertical load of 40 kips (178 kN)
on each journal. The data shown in this figure were collected from instrumented crossties on the TLS
when the point of load application was directly over the crosstie being investigated. All data seen was
zeroed to remove any lateral load caused by the application of vertical load to the wheelset.
Figure 6. Lateral force resisted on rail bearing area for W 40 and Safelok I systems under a vertical load of 40 kips (178 kN)
As seen in Figure 7, as lateral wheel load increased the lateral force on rail bearing area also
increased. Figure 7 also shows that under similar lateral wheel loads, the magnitude of lateral force
resisted by the rail bearing area of the Safelok I system was lower than the lateral force resisted by the W
40 system. The higher lateral force resisted by rail bearing area of the W 40 system is possibly due to the
fact that, when compared to the Safelok I, the W 40 system relies less on lateral frictional forces at the rail
seat as a medium to transfer lateral wheel load into the concrete crosstie.
© AREMA 2016® 195

In order to properly compare the performance of the W 40 system to the Safelok I system, the
data collected from the laboratory experimentation must be normalized to account for the difference in
fastening system designs, particularly related to bearing area. Normalizing the data was conducted by
calculating the lateral stress on the lateral rail bearing area and lateral crosstie bearing area. Lateral
stress on these bearing areas is defined as:
Lateral Stress = Lateral Load Evaluation Device Force Lateral Force Bearing Area The location of the lateral rail and lateral crosstie bearing areas used to calculate the lateral stress
distribution through the fastening system can be seen in Figure 8.
a)
b)
Figure 7. a) Lateral rail bearing area b) Lateral crosstie bearing area
Figure 9 compares the lateral stress on the lateral rail bearing area of both fastening systems as
lateral wheel load was increased and a constant 40-kip (178-kN) vertical load was applied to the
wheelset. To better explain the data values portrayed on Figure 9, a black dashed line was inserted to
196 © AREMA 2016®

show the 95th percentile lateral wheel load from a locomotive in North America. The value of the 95th
percentile lateral wheel load from a locomotive was obtained from past research work conducted by
RailTEC on the analysis of truck performance detector (TPD) data obtained on curves that were 6
degrees or less located on heavy haul mainlines (10). For the calculations of lateral stress on lateral rail
bearing area for each system, it was assumed that 100% of the lateral rail bearing area was in contact
with the rail. Due to the wide overlapping and scatter of data obtained from each system, RailTEC
researchers concluded that the normalized lateral stress on the lateral rail bearing area for each system is
comparable.
Figure 8. Lateral stress on lateral rail bearing area
Figure 10 compares the lateral stress on the lateral crosstie bearing area of both fastening
systems as lateral wheel load was increased and a constant 40-kip (178-kN) vertical load was applied to
the wheelset. For the calculations of lateral stress on lateral crosstie bearing area for each system, it was
assumed that 100% of the crosstie bearing area was in contact with the crosstie. As seen in this figure,
due to the larger crosstie bearing area of the W 40 system, the lateral stress on the crosstie is less than
the Safelok I system. It is also important to note that, for the W 40 system, the lateral load is transferred
© AREMA 2016® 197

into the concrete crosstie purely as a compressive stress. The Safelok I system design, due to the
geometry of the embedded shoulder, ultimately transfers the lateral stress into the crosstie as a
combination of compressive, shear, and tensile stresses.
Figure 9. Lateral stress on lateral crosstie bearing area
CONCLUSIONS
This study used RailTEC’s TLS at RAIL to evaluate the lateral load path through the W 40 and Safelok I
systems under static loading conditions that were representative of revenue service loading magnitudes.
Specifically, this paper investigated the global distribution of lateral load through the track superstructure,
as well as the lateral load path through a single fastening system. The following conclusions were drawn
from the results of the laboratory experimental investigation:
Lateral wheel load is mainly transferred to three crossties for both fastening systems investigated.
The relationship between lateral wheel load and lateral forces resisted by the field-side angled
guide plate or field side shoulder is non-linear.
198 © AREMA 2016®

The lateral wheel load resisted by the angled guide plate of the W 40 system directly below the
point of load application is higher than the lateral wheel load resisted by the shoulder of the
Safelok I system.
When lateral force is normalized to account for the differences in fastening system rail bearing
areas, the lateral stress on the lateral rail bearing area for both fastening systems is comparable.
When lateral force is normalized to account for the differences in fastening system crosstie
bearing areas, the lateral stress on the lateral crosstie bearing area of the W 40 system is lower
than the Safelok I system.
ACKNOWLEDGEMENTS
This research was solely funded by Vossloh Fastening Systems. The lead author was supported by
Vossloh Fastening Systems as a part of a sponsored research grant. J. Riley Edwards has been
supported in part by grants to RailTEC from CN, Hanson Professional Services, and the George
Krambles Transportation Scholarship Fund. For providing direction, advice, and resources, the authors
would like to Brent Williams from GM2 Associates and Chris Kenyon from Vossloh Fastening Systems
America. The authors would also like to thank Tim Prunkard and Darold Marrow from UIUC for their
assistance in fabricating and deploying the instrumentation, and undergraduate research assistants Dan
Rivi, Zachary Jenkins, Max Silva, Emily East, and Brevel Holder for their assistance in analyzing the data
presented in this paper.
© AREMA 2016® 199

REFERENCES
1. Van Dyk, B. 2014. Characterization of the Loading Environment for Shared Use Railway
Superstructure in North America. Published Masters thesis. University of Illinois at Urbana-
Champaign, Urbana, IL, USA.
2. Holder, D.E., B.A. Williams, M.D. Dersch, J.R. Edwards and C.P.L. Barkan. 2015. Quantification
of Lateral Forces in Concrete Sleeper Fastening Systems Under Heavy Haul Freight Loads.
In: Proceedings: The 11th International Heavy Haul Association Conference, Perth, Australia,
June 2015.
3. Williams, B.A., M.S. Dersch, J.R. Edwards and C.P.L. Barkan. 2015. Quantification of Lateral
Forces in Concrete Crosstie Fastening Systems. In: Proceedings: Transportation Research Board
94th Annual Conference, Washington, DC, USA, January 2015.
4. Williams, B.A., J.R. Edwards, M.S. Dersch, C.P.L. Barkan and R.G. Kernes. 2014. Experimental
Field Investigation of the Effects of Lateral Load Distribution on Concrete Crosstie Track.
In: Proceedings: The American Railway Engineering and Maintenance-of-Way Association
Annual Conference, Chicago, IL, USA, September 2014.
5. Williams, B.A., J.R. Edwards, R.G. Kernes and C.P.L. Barkan. 2014. Analysis of the Lateral Load
Path in Concrete Crosstie Fastening Systems. In: Proceedings: The 2014 Joint Rail Conference,
Colorado Springs, CO, USA, April 2014.
6. Williams, B.A., R.G. Kernes, J.R. Edwards and C.P.L. Barkan. 2014. Lateral Force Measurement
in Concrete Crosstie Fastening Systems. In: Proceedings: Transportation Research Board 93rd
Annual Conference, Washington, DC, USA, January 2014.
7. Rail fastening system for concrete sleepers on heavy-haul lines – System W 40 HH (Heavy Haul),
Vossloh Fastening Systems, Inc. Available from: < http://www.vossloh-fastening-
systems.com/media/downloads/pdfs/prospekte/2012/System_W40HH_HHAP_GB_mo.pdf >.
8. Van Dyk, B., W. Bosterling, M. Harrass, N. Wiethoff, A. Wroblewski. 2015. Rail Fastening System
Design Considerations to Reduce The Stress Within Haul Track Supersstructure. In:
Proceedings: International Heavy Haul Conference Fastening System Session, Perth, Australia,
Jun 2015, pp. 1308-1315.
200 © AREMA 2016®

9. Hay, W.W. 1982. Railroad Engineering, 2nd ed., John Wiley and Sons, New York, NY, USA.
10. Scheppe, A.J., J.R. Edwards, M.S. Dersch and C.P.L. Barkan. 2015. Quantifying Lateral
Wheel Loading Variation Using Truck Performance Detectors. In: Proceedings: The 11th
International Heavy Haul Association Conference, Perth, Australia, June 2015.
© AREMA 2016® 201

9. Hay, W.W. 1982. Railroad Engineering, 2nd ed., John Wiley and Sons, New York, NY, USA.
10. Scheppe, A.J., J.R. Edwards, M.S. Dersch and C.P.L. Barkan. 2015. Quantifying Lateral
Wheel Loading Variation Using Truck Performance Detectors. In: Proceedings: The 11th
International Heavy Haul Association Conference, Perth, Australia, June 2015.
202 © AREMA 2016®

AR
EM
A 2
01
6 A
nn
ual
Con
fere
nce
& E
xp
osi
tion
Lat
eral
Load
Per
form
ance
of
Sk
l-St
yle
Fas
ten
ing S
yst
em i
n
Hea
vy
Hau
l T
rack
Don
ova
n E
. H
old
er, Se
an L
in, M
atth
ew V
. C
sen
ge,
Yu
Qia
n, M
arcu
s S.
Der
sch
, an
d J
. R
iley
Ed
war
ds
© AREMA 2016® 203

AREMA 2016 Annual Conference & Exposition
Outline Motivation Overview of Fastening System Instrumentation Overview Field Site Images Quantifying Lateral Force Through Fastening System
Load Magnitude Load Distribution
Conclusions Future Work
AREMA 2016 Annual Conference & Exposition
Motivation Forces through the track superstructure are believed to contribute significantly to crosstie and fastening system deterioration Understanding the magnitudes and distribution of lateral load through the fastening system and crosstie is therefore important to understand the deteriorations
Broken/Worn Shoulder
Broken/Worn Insulator Rail Seat Deterioration
AREMA 2016 Annual Conference & Exposition
Lag screw with washer
Tension clamp
Angled guide plate
Abrasion plate
Rail pad
Plastic dowel (insert)
Field Side Gauge Side
Overview of W 40 HH AP Fastening System Components
AREMA 2016 Annual Conference & Exposition
Hypothetic Lateral Load Path Through Fastening System
Lateral Wheel Load
Bearing Forces
Frictional Forces
AREMA 2016 Annual Conference & Exposition
Instrumentation Overview Governing critical questions:
What is the lateral stress on fastening system’s rail bearing area?
Over how many crossties/fastening systems are lateral wheel loads distributed?
Vossloh instrumentation description and methodology
Vossload Cell : Two LLEDs in one angled guide plate
AREMA 2016 Annual Conference & Exposition
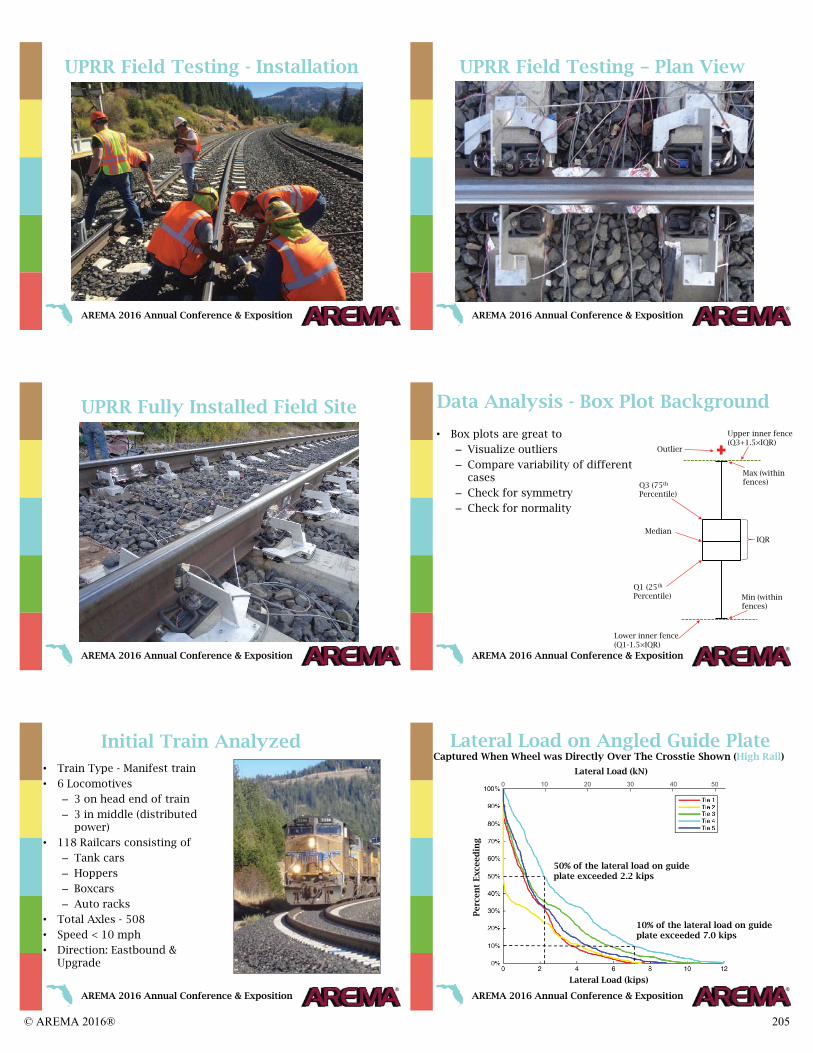
UPRR Field Instrumentation Layout
Lateral Load on Angled Guide Plate
Rail Displacement (Base Vertical, Base Lateral)
Rail Displacement (Base Vertical) Rail Seat Pressure (MBTSS)
Conducted in Soda Springs, California (Sierra Nevada Mountains) on the Union Pacific Railroad’s Roseville Subdivision Degree of curvature ’ curve radius ’ ( m) Annual tonnage MGT and grade Two zones of instrumentation:
Zone 1 (numbered crossties): W 40 HH AP system (today’s focus) one (lettered crossties): W AP system
Zones separated by buffer crossties to eliminate boundary conditions New fasteners were installed Data collected - September
Crosstie Bending Strain
204 © AREMA 2016®
AREMA 2016 Annual Conference & Exposition
UPRR Field Testing - Installation
AREMA 2016 Annual Conference & Exposition
UPRR Field Testing – Plan View
AREMA 2016 Annual Conference & Exposition
UPRR Fully Installed Field Site
AREMA 2016 Annual Conference & Exposition
Data Analysis - Box Plot Background
Max (within fences)
Min (within fences)
Box plots are great to
Visualize outliers
Compare variability of different cases
Check for symmetry
Check for normality
Median
IQR
Q ( th
Percentile)
Q ( th
Percentile)
Lower inner fence (Q - ×IQR)
Outlier
Upper inner fence (Q ×IQR)
AREMA 2016 Annual Conference & Exposition
Initial Train Analyzed Train Type - Manifest train
6 Locomotives
on head end of train
in middle (distributed power)
Railcars consisting of
Tank cars
Hoppers
Boxcars
Auto racks
Total Axles -
Speed mph
Direction: astbound Upgrade
AREMA 2016 Annual Conference & Exposition
Lateral Load on Angled Guide Plate
50% of the lateral load on guide plate exceeded 2.2 kips
10% of the lateral load on guide plate exceeded 7.0 kips
Lateral Load (kips)
Per
cen
t Exce
edin
g
Lateral Load (kN)
Captured When Wheel was Directly Over The Crosstie Shown (High Rail)
© AREMA 2016® 205
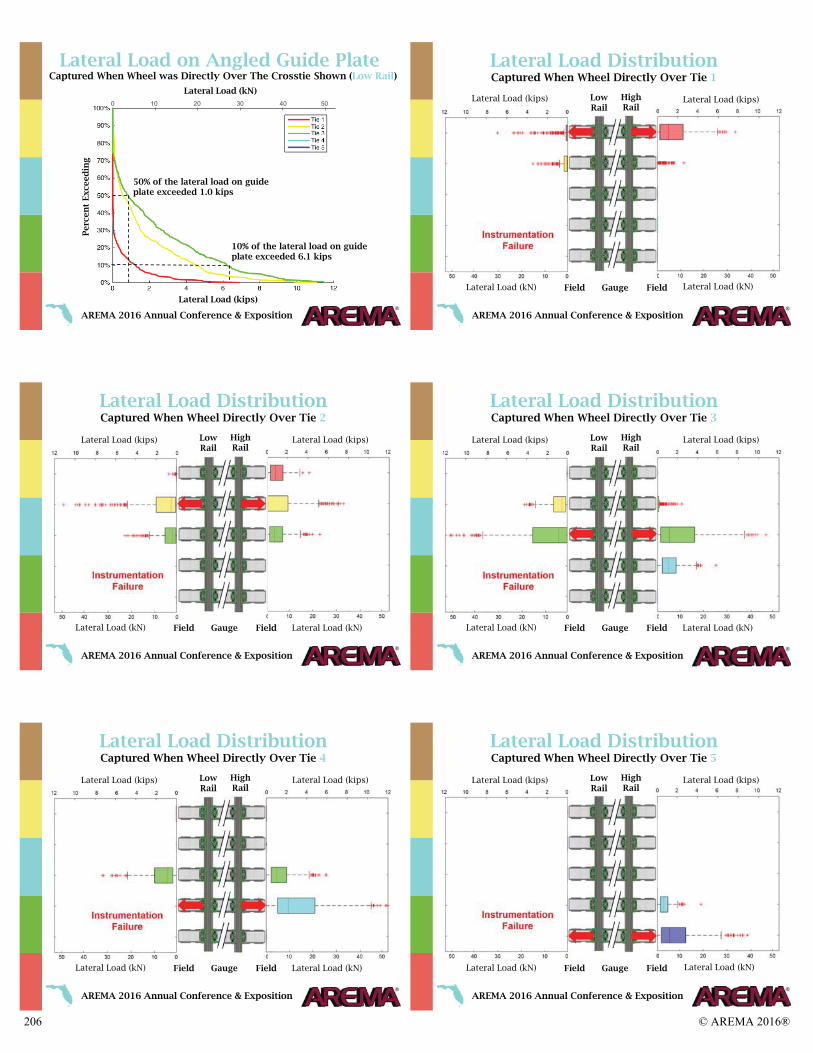
AREMA 2016 Annual Conference & Exposition
50% of the lateral load on guide plate exceeded 1.0 kips
10% of the lateral load on guide plate exceeded 6.1 kips
Lateral Load (kips)
Per
cen
t Exce
edin
g
Lateral Load (kN)
Lateral Load on Angled Guide Plate Captured When Wheel was Directly Over The Crosstie Shown (Low Rail)
AREMA 2016 Annual Conference & Exposition
Lateral Load Distribution Captured When Wheel Directly Over Tie 1
Lateral Load (kips) Lateral Load (kips)
Lateral Load (kN) Lateral Load (kN)
Low Rail
High Rail
Field Field Gauge
AREMA 2016 Annual Conference & Exposition
Lateral Load Distribution Captured When Wheel Directly Over Tie 2
Lateral Load (kips) Lateral Load (kips)
Lateral Load (kN) Lateral Load (kN)
Low Rail
High Rail
Field Field Gauge
AREMA 2016 Annual Conference & Exposition
Lateral Load Distribution Captured When Wheel Directly Over Tie 3
Low Rail
High Rail
Field Field Gauge
Lateral Load (kips) Lateral Load (kips)
Lateral Load (kN) Lateral Load (kN)
AREMA 2016 Annual Conference & Exposition
Lateral Load Distribution Captured When Wheel Directly Over Tie 4
Low Rail
High Rail
Field Field Gauge
Lateral Load (kips) Lateral Load (kips)
Lateral Load (kN) Lateral Load (kN)
AREMA 2016 Annual Conference & Exposition
Lateral Load Distribution Captured When Wheel Directly Over Tie 5
Low Rail
High Rail
Field Field Gauge
Lateral Load (kips) Lateral Load (kips)
Lateral Load (kN) Lateral Load (kN)
206 © AREMA 2016®

AREMA 2016 Annual Conference & Exposition
UPRR Train Data Collected - Reefer train (MBTSS data only)
- Empty grain trains
- Empty autorack trains
- Loaded autorack train
- Empty intermodal train
4 - Loaded intermodal trains
- Amtrak trains
- MOW water train
- Loaded manifest train
- Mixed manifest train
- Loaded ballast train
Intermodal Train
Manifest Train AREMA 2016 Annual Conference & Exposition
50% of the lateral load on guide plate exceeded kips 0.9 kips
10% of the lateral load on guide plate exceeded 6.0 kips
Lateral Load on Guide Plate Captured When Wheel was Directly Over Crosstie
Lateral Load (kips)
Per
cen
t Exce
edin
g
Lateral Load (kN)
AREMA 2016 Annual Conference & Exposition
Field Experimentation Initial Conclusions
Lateral load into the angled guide plates was distributed over three crossties, with minimal load recorded beyond these (i.e. over five crossties)
There is significant variation of lateral load on the angled guide plates of the W 4 system from the manifest train
Loads measured ranging from to kips
Lateral loads on the high rail are generally higher than those on the low rail, despite most train passes occurring below balanced speed for the curve
Locomotives generated the highest lateral loads and empty railcars generated the lowest lateral loads
AREMA 2016 Annual Conference & Exposition
Future Work Conduct field analysis of W 4 system performance on BNSF’s Crawford Hill (Butte Subdivision)
High tonnage, curved location with variable conditions
BNSF Crawford Hill 23 March 2016
BNSF Crawford Hill 22 March 2016
AREMA 2016 Annual Conference & Exposition
Acknowledgements For funding this project:
Vossloh Fastening Systems America (VFSA)
Union Pacific Railroad
Assistance with field experimentation
For assistance with the project:
Max Silva, Michael Yang, Emily East, Dan Rivi, Zach Jenkins, Brevel Holder,
For fabrication of components and sensors:
Tim Prunkard and the CEE Machine Shop at UIUC
Current employer of lead presenter:
AREMA 2016 Annual Conference & Exposition
Donovan Holder Bridge EIT email: [email protected] Sean Lin Graduate Research Assistant email: [email protected] Matthew V. Csenge Manager of Experimentation email: csenge @Illinois.edu Yu Qian Research Engineer email: yu ian @Illinois.edu Marcus S. Dersch Senior Research Engineer email: mdersch @Illinois.edu J. Riley Edwards Research Scientist and Senior Lecturer email: jedward @Illinois.edu
Contact Information
© AREMA 2016® 207