topics · and analytics initiatives with key decisions in marketing and brand ... online project...
TRANSCRIPT

a s u p p l e m e n t t o c o n s u m e r g o o d s t e c h n o l o g y a n d r i s n e w s
Analyzing the State of Retailer/Supplier Collaboration for: Topics:
• Product Quality• Big Data• Moving to New Markets• Reaching the Consumer• Mobility
TiTle sponsor sTudy sponsors
®
2012

edit noteMaybe we're saying many of the same messages we've said before: Consumer goods manufacturers want bet-ter demand signals and more efficient supply chains; retailers want the right assortment at the right price in each market; and both want the ability to serve the customer in new and improved ways. What's changing is how quickly manufacturers and retailers must move forward to remain competitive and to capture the cus-tomer when they can. A major driver of collaboration is the need to make business decisions closer to demand, and we think collaboration and new technology are critically important to their joint success.
04 StAte of CollAborAtioniDC Manufacturing and retail insights discuss how manufacturers and retailers area responding to today's economic indicators.
06 ProDuCt QuAlityManufacturers and retailers are desperate to avoid product quality or safety problems, while being pressured to deliver a more differentiated, personalized product experience. is it any wonder product quality and safety is becoming a higher priority?
08 big DAtAManufacturers and retailers must align the objectives of big data and analytics initiatives with key decisions in marketing and brand management, supply management and fulfillment, etc. then big data technology won't be just a shiny new object.
10 Moving into neW MArketSData collaboration and global logistics management are key en-abling technologies in the drive to reduce supply chain costs while expanding into new regional locations.
14 reAChing the ConSuMerinventory optimization and social media can help Cg manufactur-ers and retailers connect with the consumer.
16 Mobilityfrom innovation to inventory management, mobility is becom-ing an extension of many core processes and functions within the manufacturing environment.
C o n t e n t S
kim knicklePractice DirectoriDc manufacturing insights
TECHNOLOGY GROUP
www.edgellcommunications.com
PrinteD in
the u.s.a.
member
member
ShAreD StrAtegy rePort 2012 | cgt | s s 3
publisheralbert Guffanti [email protected]
editorialexecutive editor: Kara Romanow [email protected]
editor: Alliston Ackerman [email protected]
assistant editor: Alarice Padilla [email protected]
salesassociate Publisher: Diana Masurack Mann [email protected]
senior account manager: Bill Little [email protected]
assistant to Publisher: Jen Johnson [email protected]
art and productioncreative Director: Colette Magliaro [email protected]
art Director: Pamela C. Ravetier [email protected]
Production manager: Pat Wisser [email protected]
online mediaVice President of media integration: Rob Keenan [email protected]
Director of lead Generation & audience Development: Jason Ward [email protected]
Web Development manager: Scott Ernst [email protected]
Online Project manager: Susan Gould [email protected]
marketing/events/circulationDirector, event Planning: Patricia Benkner [email protected]
Director, event content: John Hall [email protected]
circulation manager: Jeffrey Zabe [email protected]
subscriptions: 978-671-0449
reprints: [email protected], 212-221-9595
corporateceO/chairman: Gabriele A. Edgell [email protected]
President: Gerald C. Ryerson [email protected]
Vice President: John Chiego [email protected]
Founder: Douglas C. Edgell, 1951-1998
corporate officeEdgell Communications 4 Middlebury Boulevard Randolph, NJ 07869-1111 (973) 607-1300 • Fax (973) 607-1395 www.consumergoods.com

s s 4 | cgt | ShAreD StrAtegy rePort 2012
ConsumerPrice Index
200
250
240
230
220
210
Jan. Feb. Mar. April May June July Aug. Jan. Feb. Mar. April May June July Aug. Sept.Sept. Oct. Nov. Dec.
220.223 221.309 223.467 224.906 225.964 225.722 225.922 226.545 226.889 225.421 226.23 225.672 226.665 227.663 229.392 230.085 229.815 229.478 229.104 230.379 231.407
Source: U.S. Bureau of Labor Statistics Data (CPI-U All Items unadjusted), U.S. Census (New Privately Owned Housing Units Starts unadjusted), and University of Michigan, 2012
< 2011 2012 >
state of collaboration The 2012 Shared Strategy Report brings together expertise from IDC Manufacturing Insights and IDC Retail Insights to assess the state of collaboration between consumer goods (CG) manufacturers and retailers.
CGT: consumer sentiment continues to be a difficult read. We've seen a recent upswing in back-to-school, but overall uncertainty still exists. What do you see ahead for retailers and cg manufacturers, given these fluctuating numbers (see figure 1a and 1b)?
Ellis: Consumer sentiment has become tied closely to the consumer's perceptions of “wealth”, so stock market perfor-mance and the health of the housing market are influencing purchases in a way that perhaps they shouldn't. We expect this to continue for the foreseeable future, which makes the upcoming holiday season somewhat difficult to predict. Most CG manufacturers we speak with are guardedly optimistic about the coming months, and expect to see modest growth over last year.
hand: What is so interesting about this market is the fluctuat-ing inventories, where retailers are trying to reduce their assort-ments and overall inventory in store. There is a general uncertainty whether the consumer will be more optimistic and therefore spend more. This means that retailers absolutely have to try to place or-ders closer to demand, which fuels efforts in reducing cycle times, improving fulfillment strategies and deferring purchases. Global container shipments were low in September, as reported by IMF, so there is no foregone conclusion that the holiday season is going to be fantastic, even though NRF is predicting increased holiday sales.
The Bottom line: Despite expectations of modest growth, the longer-term forecast is still uncertain, and CG manufacturers and retailers need to adjust production and fulfillment to mitigate risk.
CGT: the fragile nature of the economy and the ongoing movement in raw materials pricing has made it difficult to improve net margins. how are retailers and cg manufac-turers responding (see figure 2)?
New StartHousing
Index
ConsumerSentiment
Index
Jan. Feb. Mar. April May June July Aug. Jan. Feb. Mar. April May June July Aug. Sept. Oct.Sept. Oct. Nov. Dec.
74.2 77.5 67.5 69.8 74.3 71.5 63.7 55.7 59.4 60.8 63.7 69.9 75 75.3 76.2 76.4 79.3 73.2 72.3 73.6 74.3 78.340.2 35.4 49.9 49 54 60.5 57.6 54.5 58.8 53.2 53 42.7 47.2 49.7 58 66.8 67.8 74.7 69.2 70.1 79
Source: U.S. Bureau of Labor Statistics Data (CPI-U All Items unadjusted), U.S. Census (New Privately Owned Housing Units Starts unadjusted), and University of Michigan, 2012
30
40
50
60
70
80< 2011 2012 >
fiGurE 1a: economic indicators: consumer sentiment index, new start housing index, January 2011 – october 2012
fiGurE 1B: economic indicators: consumer price index, January 2011 – september 2012

ShAreD StrAtegy rePort 2012 | cgt | s s 5
Retail Trade
Consumer Products
80
100
120
Avg 08 Avg 09 Avg 10 Q111 Q211 Q311 Q411 Q112 Q212 Q312 Q412 Q113
100.8343 89.3629 91.821593347598.19736101103.2982032103.079356797.19193223 105.7931593109.4109.7104.3111.1
Source: IDC Manufacturing Insights' Global Performance Index and IDC estimates, 2012
106.6062103.9972104.211213102106.7861077105.1920894118.5019957106.6642517113.490045114.8115.5101.9108.2
80
100
120
Retail Trade
Consumer Products
1
2
3
4
5
6
Avg 09 Avg 10 Q111 Q211 Q311 Q411 Q112 Q212 Q312 Q412 Q113
3.321912527 5.072387457 4.291699886 4.931200027 5.757900238 3.776750088 4.192599773 4.7 5.6 3.6 4.11.9302250445 2.50562494975 2.5079 2.654799938 2.623899937 2.403599977 2.793600082 2.9 2.8 2.7 2.5
Source: IDC Manufacturing Insights' Global Performance Index and IDC estimates, 2012
fiGurE 2: consumer packaged goods manufacturing and retail industry net profit margins
fiGurE 3: consumer packaged goods manufacturing and retail industry inventory trends
Ellis: Margins continue to be a key focus for the CG manufacturer. Price increases remain problematic, so com-panies are focusing on driving product mix to higher-margin product lines with aggressive innovation and promotion programs, even as they pursue cost reduction and optimization programs.
hand: It has taken several years in the wake of this decade's recession for retailers to adjust their practices to minimize margin loss. Retailers have improved since then in forecasting an appro-priate inventory and being more responsive to customer needs. One key is retailers' ability to run targeted promotions that drive profitable sales in their stores. Precision marketing techniques will continue to be important. Another area is improving collaboration to drive more fixed, lower-cost materials into the products retailers buy. The best tactic is to be able to respond in real time to consumer buying patterns, which enables retailers to plan for and adjust for markdowns without suffering margin erosion.
The Bottom line: Both CG manufacturers and retailers are using targeted promotions to capitalize market opportunities while finding ways to reduce costs.
CGT: how have continued attempts to reduce costs while improving service levels impacted inventory and assort-ment mixes at stores (see figure 3)?
Ellis: I don't think they are necessarily mutually exclusive. Manufacturers have become better at manag-ing SKU portfolios, encouraging facings and placement for those that sell. Inventory management has also improved to the point that lower inventory levels do not have to mean lower service levels.
hand: In general, retailers look to spend capital somewhere other than inventory, such as on technology that supports a bet-ter omnichannel customer experience. At the same time, they are reducing overall inventory investments. Retailers are moving toward localized assortments to match the local audience better. With a reduced inventory assortment, it becomes imperative for retailers to have technology in place at the point of sale to serve the customer, getting them the inventory that might not be avail-able in the channel they are currently shopping.
The Bottom line: Retailers are using technology to offset service impacts from inventory reductions, while CG manu-facturers are focused on optimizing inventory management.
simOn ellisiDc manufacturing insights
leslie hanDiDc retail insights
ThE analYsTs

s s 6 | cgt | ShAreD StrAtegy rePort 2012
48.7 34.6
37.2 37.9
12.8 25.5
48.7%34.6%
37.2%37.9%
12.8%25.5%
We are primarily a cost-focused organization.
We are primarily a productquality-focused organization.
FOCUS
We are primarily a service-focused organization.
Source: IDC Manufacturing and Retail Insights 2012 CG MANUFACTURINGRETAIL
0 10 20 30 40 50
82.1 76.5
59 73.9
56.4 34
44.9 51
41 41.8
11.5 13.1
82.1%76.5%
59%73.9%
56.4%34%
44.9%51%
41%41.8%
11.5%13.1%
Improve overall customer service
Reduce overall supply chain costs
PRIORITY
Improve product quality/safety
Respond more quickly to supply ordemand changes (supply chain agility)
Improve supply chain riskawarenes and mitigation
Improve the process of bringingnew products to market
Source: IDC Manufacturing and Retail Insights 2012Note: Multiple responses permitted.
CG MANUFACTURINGRETAIL
0 10 20 30 40 50 60 70 80
fiGurE 4: primary focus of supply chain
fiGurE 5: top 3 supply chain priorities over next 12 months
Product QualityA high Priority to MAxiMize revenue
In a recent supply chain survey conducted by IDC Manufacturing and Retail Insights, manufacturers said they considered themselves to be stewards of product quality more frequently than either cost or service (see Figure 4).
Interestingly, large enterprise manufacturers value product quality fairly close to cost, but small-er manufacturers show a larger gap, suggesting that they view the product itself as the means for competitive success in the marketplace. While the focus on product quality is not new, this is the first time we have seen it as the top response when ask-ing about supply chain centricity.
Despite this reported product centricity, “re-duce overall supply chain costs” was still selected by the majority of the respondents as their top pri-ority over the next 12 months (see Figure 5). This reflects that the focus for supply chain organiza-tions remains efficiency and elimination of waste.
So, is there inconsistency between the stra-tegic aspiration in the supply chain (what we say we want to be) and the tactical/operational realities (what we do)?
To a degree, the answer is "yes", although one can make the argument that product, cost and service are not mutually exclusive. All are neces-sary to varying degrees as "table stakes" for the successful manufacturer and retailer. Reinforc-ing this notion is the more than 50 percent of re-spondents who selected both “improve product quality/safety” and “improve overall customer service” in their top three priorities. The only exception to this is retailers who clearly feel that product quality is the primary responsibility of the branded products manufacturer.
Taking a closer look at how companies plan to improve product quality is instructive. Interest-ingly, the most highly rated activities were internal capabilities — deploying lean/Six Sigma more broadly, improving factory maintenance and over-sight, and reevaluating cost/quality trade-offs — rather than the external, extended supply chain
s s 6 | cgt | ShAreD StrAtegy rePort 2012
ShAreD StrAtegy rePort 2012 | cgt | s s 7
56.8 25
47.7 51.9
45.5 51.9
38.6 46.2
38.6 36.5
34.1 38.5
22.7 44.2
56.8%25%
47.7%51.9%
45.5%51.9%
38.6%46.2%
38.6%36.5%
34.1%38.5%
Reevaluate productcost/quality tradeoffs
Improve factory maintenanceand oversight procedures
DRIVER
Improve collaborationwith suppliers
Enabling better supply chainvisibility and/or traceability
Ensure compliance with existingregulatory standards and
environmental sustainabilityexpectations in the market
Establishing or more broadlydeploying lean, six-sigma,
or other quality managementprocesses across the supply chain
22.7%44.2%
Enhancing the services-relatedsupply chain, including reverse
logistics, recall managementand service parts management
Source: IDC Manufacturing Insights 2012Note: Multiple responses permitted.
CG MANUFACTURINGRETAIL
0 10 20 30 40 50 60 70 80
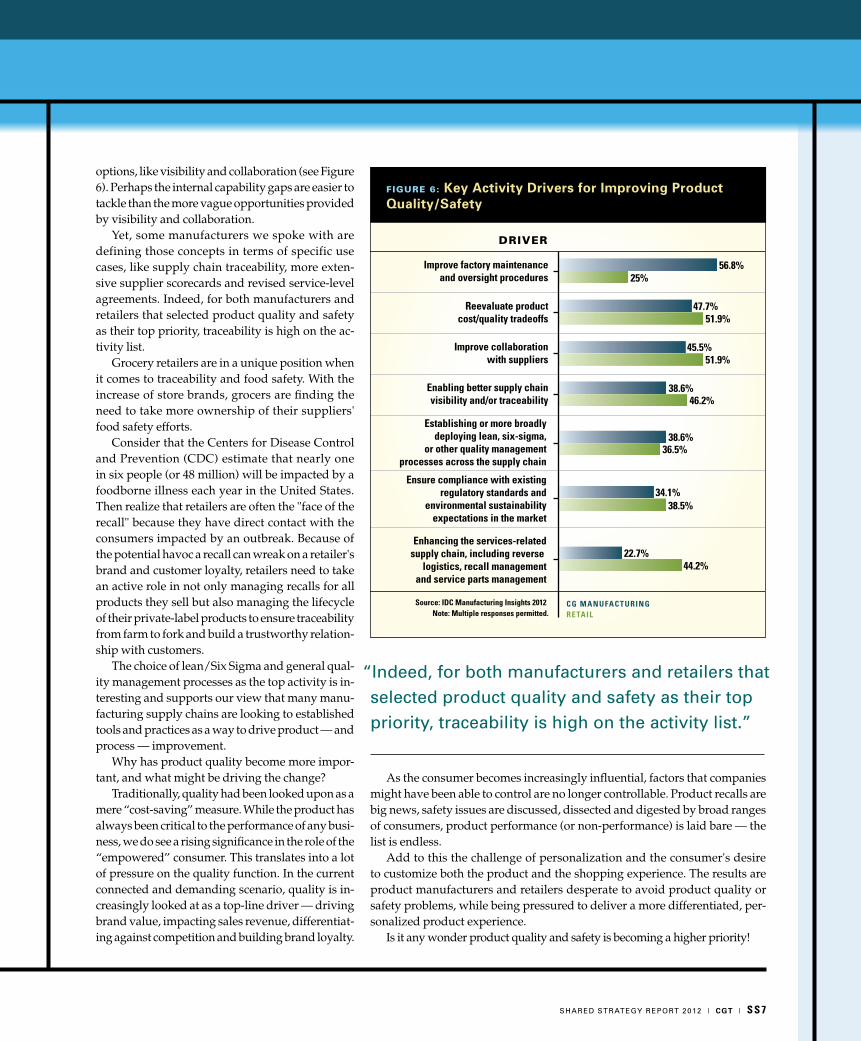
fiGurE 6: key activity drivers for improving product Quality/safety
options, like visibility and collaboration (see Figure 6). Perhaps the internal capability gaps are easier to tackle than the more vague opportunities provided by visibility and collaboration.
Yet, some manufacturers we spoke with are defining those concepts in terms of specific use cases, like supply chain traceability, more exten-sive supplier scorecards and revised service-level agreements. Indeed, for both manufacturers and retailers that selected product quality and safety as their top priority, traceability is high on the ac-tivity list.
Grocery retailers are in a unique position when it comes to traceability and food safety. With the increase of store brands, grocers are finding the need to take more ownership of their suppliers' food safety efforts.
Consider that the Centers for Disease Control and Prevention (CDC) estimate that nearly one in six people (or 48 million) will be impacted by a foodborne illness each year in the United States. Then realize that retailers are often the "face of the recall" because they have direct contact with the consumers impacted by an outbreak. Because of the potential havoc a recall can wreak on a retailer's brand and customer loyalty, retailers need to take an active role in not only managing recalls for all products they sell but also managing the lifecycle of their private-label products to ensure traceability from farm to fork and build a trustworthy relation-ship with customers.
The choice of lean/Six Sigma and general qual-ity management processes as the top activity is in-teresting and supports our view that many manu-facturing supply chains are looking to established tools and practices as a way to drive product — and process — improvement.
Why has product quality become more impor-tant, and what might be driving the change?
Traditionally, quality had been looked upon as a mere “cost-saving” measure. While the product has always been critical to the performance of any busi-ness, we do see a rising significance in the role of the “empowered” consumer. This translates into a lot of pressure on the quality function. In the current connected and demanding scenario, quality is in-creasingly looked at as a top-line driver — driving brand value, impacting sales revenue, differentiat-ing against competition and building brand loyalty.
“indeed, for both manufacturers and retailers that selected product quality and safety as their top priority, traceability is high on the activity list.”
As the consumer becomes increasingly influential, factors that companies might have been able to control are no longer controllable. Product recalls are big news, safety issues are discussed, dissected and digested by broad ranges of consumers, product performance (or non-performance) is laid bare — the list is endless.
Add to this the challenge of personalization and the consumer's desire to customize both the product and the shopping experience. The results are product manufacturers and retailers desperate to avoid product quality or safety problems, while being pressured to deliver a more differentiated, per-sonalized product experience.
Is it any wonder product quality and safety is becoming a higher priority!

s s 8 | cgt | ShAreD StrAtegy rePort 2012
37.2 17.3
31 19.5
28.7 49
20.2 17.2
15.5 18.9
9.3 8.3
37.2%17.3%
31%19.5%
28.7%49%
20.2%17.2%
15.5%18.9%
9.3%8.3%
Analysis of transactionaldata from sales systems
Analysis of operations-related data
DRIVER
Analysis of online customerbehavior-related data
Analysis of machineor device data
Non-analytic workloads (OLTP systems, web sites, e-mail apps)
Service innovation
Source: IDC Global Technology and IndustryResearch Organization IT Survey, 2012
Note: Multiple responses permitted.
CG MANUFACTURINGRETAIL
0 10 20 30 40 50 60 70 80
24.8 26.8
15.5 6.9
14 27.5
14 11
14 7.9
10.1 13.2
7.8 6.7
24.8%26.8%
15.5%6.9%
14%27.5%
14%11%
14%7.9%
10.1%
7.8%6.7%
13.2%
Cost of technology infrastructure
Deciding what data is relevant
CHALLENGE
None
Selecting the right technology
Lack of business support
Not having the right IT skills
Not having the right analytics staff
Source: IDC Global Technology and Industry Research Organization IT Survey, 2012
CG MANUFACTURINGRETAIL
0 10 20 30 40 50 60 70 80
fiGurE 7: big data drivers
fiGurE 8: big data challenges
big DataneW teChnology ProMoteS ConSuMer knoWleDge AnD buSineSS vAlue
Our research shows a high level of adoption of busi-ness intelligence (BI) or analytics solution. But the cost of BI technology is a challenge — a sign that com-panies aren't getting the value they’d like from the investment. Along comes talk of "big data" tools, but we need to first establish that this is something new.
We use a catchy definition for big data — vol-ume (data quantity), velocity (data speed), variety (data types and sources), and most importantly, value to refer to the technology's decreasing price points and the ability to drive greater benefits. In fact, IDC forecasts the big data technology and services market will grow to $16.9 billion in 2015.
Where we see the greatest interest among retail-ers, and a fairly strong interest from CG manufac-turers, is in analyzing online customer behavior — clickstream analysis, web logs and social net-working data. We also note that CG manufactur-ers expect to apply big data tools to downstream transactional data (see Figure 7). However, the biggest challenge of big data is identifying relevant data (see Figure 8) — a new aspect of what we see as a challenge of BI in general: identifying where we can find value in using the technology. The op-portunity for productive collaboration is ultimately in driving decisions that create value from big data in terms of customer loyalty, revenue growth, cost reduction and risk mitigation.
Examples include optimization of trade promo-tions, assortments, marketing campaigns and bet-ter predictive analytics of consumer behavior — all for improved financial results and greater customer lifetime value. We suggest that CG manufacturers and retailers align the objectives of big data and analytics initiatives with key decisions in market-ing and brand management, merchandising and product management, channel performance and operations, and supply management and fulfill-ment. Then big data technology won't be just a shiny new object, and its value will be clear.

s s 1 0 | cgt | ShAreD StrAtegy rePort 2012
ClassifyScreenLicenseOrchestrateDocumentTrack/TraceControl CostComply
Export Process
BuyerSeller
ClassifyScreenLicenseOrchestrateDocumentTrack/TraceControl CostComply
Import Process
Select carriersBook carriersConsolidate freightTrack shipments
Forwarder
International Carrier
Transport GoodsTrack ShipmentsOn-time arrivals Broker
Pre-entryClear customs
Source: IDC Retail Insights
moving to new markets PreSSureS on SourCing AnD logiStiCS AS We exPAnD geogrAPhiCAlly
Inte
rfac
e Ru
les:
mar
ket
and
cust
omer
pri
ority
, in
vent
ory
polic
y, N
PDI
Demand Organization
Supply Organization
Suppliers
Factories
Regional Warehouses
Local DC Logistics
Customer Service
Sales/RetailSupport
Local DC Logistics
Customer Service
Sales/RetailSupport
Local DC Logistics
Customer Service
Sales/RetailSupport
Source: IDC Manufacturing Insights 2012
fiGurE 9: balancing regional supply with national demandOne of the more intriguing topics for study in the CG supply chain is the notion of global sourcing as it pertains to moving into new markets. At IDC Manu-facturing and Retail Insights, we have been exploring this topic for some years now, and have envisioned a global sourcing approach that we call “Profitable Proximity Sourcing", where companies balance lead-time and cost optimization with near- versus far-shoring. A recent supply chain survey revealed that 58 percent of CG manufacturers outsource the manu-facturing of some portion of their products. Although this number may sound high, it puts them behind most other types of manufacturers. For example, 65 percent of high-tech companies outsource some of their manufacturing. We expect CG manufacturers to outsource even more of their manufacturing, espe-cially as they expand into new regions.
Basically, many CG manufacturers are taking a regional view for the supply side of their supply
fiGurE 10: logistics complexities of moving to markets

s s 1 2 | cgt | ShAreD StrAtegy rePort 2012
chain organizations, while maintaining a national, or country-level, view for the demand side. In other words, the supply network is viewed from the perspective of anticipated regional demand, while the demand side (demand planning, logistics and customer service) is specific to a particular country (see Figure 9).
The challenge for the manufacturer, particularly when considering the introduction of new products or the movement into new markets, is the appli-cation of the “interface rules” — how to balance country-level (and customer) priority within those countries. Most companies we see who have ad-opted this regional/national approach are reluctant to move product from country to country via intra-network shipments after the initial regional replen-ishment plan has been agreed. But, such movements are often necessary given the inherent forecast error. Forecast precision and inventory visibility are key enablers for this regional-national approach. Apply-ing greater pressure, and reliance, on the collabora-tive dialogue between manufacturers and retailers is critical, particularly in moving to new markets.
The regional-national approach is also impacting retailers' desire to add distribution channels, from warehouses to brick-and-mortar stores, provid-ing retailers with operations on the ground in the regions where they are sourcing. The complexity of logistics increases in this new configuration of mov-ing goods between supply sources and a variety of distribution channels to meet customer needs. Re-tailers and manufacturers alike are relying more on 3PLs and external brokers to handle the movement of goods internationally (see Figure 10).
According to the “2013 17th Annual Third-Party Logistics Study” from Capgemini Consulting, Penn State University, Korn/Ferry International and Pan-alpina, 65 percent of shipper respondents report an increase in their use of 3PL services as a key driver of supply chain innovation and risk mitigation.
One of the challenges for retailers and manufac-turers is that often, 3PLs aren't as good at manag-ing the inherent risks of moving goods globally and regionally as they should be. Environmental disasters or political situations in a region can have a devastating impact on the entire supply chain. In-creased specialization of manufacturing in regions around the world enhances the challenge, exposing members up the value chain to potential disrup-
57.8 51.3
57.8 51.3
51.6 20.5
40.6 41.9
34.4 46.2
28.1 28.2
12.5 29.9
9.4 11.1
57.8%51.3%
57.8%51.3%
51.6%20.5%
40.6%41.9%
34.4%46.2%
28.1%
12.5%29.9%
9.4%11.1%
28.2%
Reduce transportationand/or logistics costs
Reducing procurement costs
DRIVER
Establishing or more broadly deploying lean,six-sigma or other quality management
processes across the supply chain
Reducing inventory cost includingpostponement techniques
Decrease energy and/or fuel consumption
Decrease packaging costs
Streamline the number of SKUs
Outsourcing manufacturing operations
Source: IDC Manufacturing and Retail Insights 2012
Note: Multiple responses permitted.CG MANUFACTURINGRETAIL
0 10 20 30 40 50 60 70 80
fiGurE 11: key activity drivers behind reducing supply chain costs
tions. 3PLs still have significant progress to make in addressing the growing demands of the customers they serve.
Even as retailers and manufacturers find themselves increasing the complexity of their supply chains, both are intent on reducing supply chain costs. Reducing procurement, transportation and logistics costs are significant drivers behind reducing supply chain costs for both retailers and manufacturers (see Figure 11). The confluence of capable technologies and business needs is helping to support these cost-reduction efforts even as retailer and manufacturers are improving levels of just-in-time inventory delivered to the customer. Data collaboration and global logistics management are key enabling technologies for this drive to reduce supply chain costs while expanding into new regional locations.
“Applying greater pressure, and reliance, on the collaborative dialogue between manufacturers and retailers is critical, particularly in moving to new markets.”

55.8 47
51.2 47.6
31.8 28.8
30.2 38.9
30.2 24.4
26.4 33.3
24.8 27.7
22.5 27.1
17.8 13.2
9.3 12
55.8%47%
51.2%47.6%
31.8%28.8%
30.2%38.9%
30.2%24.4%
26.4%33.3%
24.8%27.7%
22.5%27.1%
Increase awareness of productsand/or services
Gather feedback from customers on productsand services/engage customers more deeply
DRIVER
Keep up with competitors
Help employees be more effective
Share knowledge within your organization
Identify partners or prospects
Use the latest technologies
Respond to customer questions or complaints/improve the quality and speed of operations
Source: IDC Global Technology and IndustryResearch Organization IT Survey, 2012
Note: Multiple responses permitted.
CG MANUFACTURINGRETAIL
0 10 20 30 40 50 60 70 80
s s 1 4 | cgt | ShAreD StrAtegy rePort 2012
reaching the consumerinventory oPtiMizAtion AnD SoCiAl MeDiA Drive MeAningful ConneCtionS
58.7 46
56.5 73.5
54.3 53.1
52.2 17.7
28.3 37.2
26.1 33.6
58.7%46%
56.5%73.5%
54.3%53.1%
52.2%17.7%
28.3%37.2%
Improving inventory performance
Improve fulfillment execution
DRIVER
Increase demand forecasting accuracy
Improving manufacturing executionand/or flexibility
Enabling better supply chain visibilityand/or traceability
26.1%33.6%
Improve collaboration with suppliers
Source: IDC Manufacturing and Retail Insights 2012Note: Multiple responses permitted.
CG MANUFACTURINGRETAIL
0 10 20 30 40 50 60 70 80
fiGurE 12: key activity drivers behind improving customer service priority
fiGurE 13: top drivers for using social media
Retailers are intent on providing new options such as same-day delivery of goods as they redefine customer service in an omnichannel environment, where shoppers seamlessly buy across brick-and-mortar and e-commerce channels.
Retailers, like Walmart, are in pilot or early implementation of programs that leverage real estate they already own, turning stores into pseu-do-distribution centers that provide faster service and more flexible delivery options to the customer while reducing costs (or at least trying to). The result? Improved customer satisfaction.
This omnichannel distribution requires visibility into inventory levels for all parties. Retailers want to reduce inventory levels while serving the customer better with the right mix of product at the right time, delivered where the customer wants it. Both improv-ing fulfillment execution and improving inventory performance were top drivers for retailers and manu-facturers in their efforts to improve customer service (see Figure 12). This requires better collaboration to share inventory information to meet customer needs.
Among the ways retailers and manufacturers must collaborate in this new distribution model is to share content and customer feedback that can enrich the consumer's relationship with a brand as well as understanding the full breadth of a product offering. The top two drivers for using social me-dia tools by both retailers and manufacturers are to gather feedback from customers and increase awareness of products and services (see Figure 13). Working together, retailers and manufacturers can collaborate on descriptive content about products, product reviews, and even go-to-market efforts that incorporate social and e-commerce tactics. Manu-facturers in particular are interested in using social media to deliver a cohesive brand message, and help employees be more effective.

s s 1 6 | cgt | ShAreD StrAtegy rePort 2012
mobilityMobile DeviCeS SuPPort inventory MAnAgeMent AnD Drive innovAtion
3.62 3.65
3.24 3.48
3 3.02
2.87 3.41
3.623.65
3.243.48
33.02
2.873.41
Mobility
Big Data/Analytics
NEW TECHNOLOGY
Cloud Computing/Software-as-a-Service
Social Business tools
Source: IDC Manufacturing and Retail Insights 2012Note: Rated on a scale of 1 to 5
CG MANUFACTURINGRETAIL
0 10 20 30 40 50 60 70 80
100% of Apps75 - 99% of Apps50 - 74% of Apps25 - 49% of Apps1 - 24% of Apps0% of Apps
Source: IDC Manufacturing and Retail Insights 2012
10.2%
18.5%
24.1%
9.5%
22.6%
26%7.8%
19.5%
14.5%
11.1%
17.6%
18.5%CHALLENGE
CG MANUFACTURING RETAIL
fiGurE 14: mobility: #2 new technology for retailers and cg manufacturers
fiGurE 15: mobile apps dominate application development plans
Retailers and manufacturers alike have identi-fied the important role mobility is playing in their respective industries (see Figure 14). Mobility is becoming an extension of many core processes and functions within the manufacturing environ-ment. And, mobile capabilities in the retail setting are becoming ubiquitous, to the benefit of both shoppers and store personnel. The primary retailer focus for mobility has been on commerce- and productivity-related applications for improving customer service through customer-owned and in-store mobile devices, loyalty apps and other in-store retail execution capabilities.
In addition to the customer service focus of mo-bility in retail, many retailers and manufacturers have been using mobile devices to support inven-tory management, in-store as well as in distribu-tion centers and warehouses. Big box retailers are using them for receiving and ordering processes, as well as in warehouses for piece-picking activities. Manufacturers are using mobile devices to support many core fulfillment functions and help provide visibility into the movement of product through the supply chain.
Retailers and manufacturers are demonstrating their awareness of the importance of continuing to innovate around leveraging mobility, and it's hav-ing a direct impact on development organizations (see Figure 15). The fact that close to 10 percent of retailers and CG manufacturers surveyed intend to devote 100 percent of their net new apps to mobile platforms is astounding. And, consider that anoth-er 20 percent, give or take, is investing 75 percent to 99 percent of their app resources to mobile.
Early results in the field have been extremely positive with mobility. For example, Nordstrom has been an innovator of mobile applications in stores, viewing mobility as an extension of many of its existing applications and systems. The retailer has introduced iPhones to supplement registers, with additional functions, like inventory checking and order management, enabling the sales associ-
ates to improve productivity while closer to the customer. The results have been very positive, increasing Nordstrom's average transaction size as well as its gross margin. Clearly, the message is getting through that mobility is a critical technology for retail and CG manufacturing.

W e W i s h t o t h a n k o u r rEsEarCh parTnErsTiTlE sponsor sTudY sponsors