, airport surface detection equipment (asde… · introduction . purpose. the purpose of the operat...
TRANSCRIPT
I
,..t.leJI~ No. FAA·RD·81·2 ~ FAA·CT·81·6
_, AIRPORT SURFACE DETECTION EQUIPMENT (ASDE)-3
OPERATIONAL EVALUATION
Louis A. Dvorsky,}. , AntbolY J. SwezeDY
E~.il R. Hartz
FEDERAL AVIAnON ADMINISTRATION TECHNICAL CENTER
Atlantic City Airport, Itl. 08405
. ' .
~~. ~
. .
FINAL REPORT
IIl1CH 1981 ,, f)'\"'
Document is available to the U.S. public through the National Technical Information Service.
Springfield. Virginia 22161.
Prepared for
U. S. DEPARTMENT OF TRANSPORTATION FEDERAL AVIATION ADMINISTRAnON
Systems Research &Development Service Washington, D. C. 20590

Technical ~eport Documentation Page
1. Report No. 3. Recipient's Catalog No.2. Government Accession No.
FAA-RD-81-2 4. Title and Subtitle 5. Report I)ate
March 1981 AIRPORT SURFACE DETECTION EQUIPMENT (ASDE)-3 6. Performing Organi zation Code OPERATIONAL EVALUATION
t-:.----;--;--;--;-----------------------------j 8. Performing Organi zation Report No. 7. Author! s)
FAA-CT-81-6L. Dvorsky, A. Swezeny, and E.. Hartz 10. Work Unit No. (TRAIS)9. Perform·ing Organization N~me and Address
Federal Aviation Administration Technical Center 11. Contract or Grant No.
143-102-540Atlantic City Airport, New Jersey 08405
13. Type of Report and Period Coveredf-o-----------------------------....,12. Sponsoring Agency Name and Address U.S. Department of Transportation Final Federal Aviation Administration April 14 - May 30, 1980 Systems Research and Development Service 14. Sponsoring Agency Code Washington, D.C. 20590
15. Supplementary Notes
16. Abstract
Operational tests were performed on the Airport Surface Detection Equipment (ASDE)-3 radar. Three teams of air traffic controllers, two per team, with current field ASDE-2 experience, were used as test subjects. The controllers were from the Eastern and New England Regions. These tests were conducted to determine the extent to which the ASDE-3 met' requirements as presented by the Air Traffic Service (ATS) and what the controllers t opinions were of the radar.
Tests conducted were: airport surface coverage capabil ity, target detect ion as a funct ion of speed between aircraft and aircraft to obs truct ion resolut ion, target S1ze and shape determination, standing target heading, and runway clearance.
17. Key Words
ASDE Radar
18. Oi stri bution Stotement
Document is available to the U.S. public through the National Technical Information Service, Springfield, Virginia 22161
19. Security Clossif. (of this report)
Unclassified
20. Security Classif. (of this poge)
Unclassified
21. No. of Pages
43
22. Price
Form DOT F 1700.7 (8-72) Reproduction of completed page authori zed

TABLE OF CONTENTS
Page
INTRODUCTION 1
Purpose Background System Description
DISCUSSION 4
Test Configuration 4 Test Procedures and Results 4 Controller Questionnaire Results 19
SUMMARY OF RESULTS 22
CONCLUSIONS 23
RECOMMENDATIONS 24
APPENDICES
A -- Outline of Operational Requirements B -- Moving Target Position Error Analysis C -- Subject Controller Questionnaire ASDE-3
•
iii

LIST OF TABLES
Table
1
2
3
4
5
6
7
8
9
10
11
12
13
•
Target Resolution -- Two Aircraft
Obstruction Resolution
Identification of Targets by Size Estimates
Identification of Targets by Size
Page
STC Attenuation in dB Versus Range 10
Speed Test Target Brightness Averages On a Scale of 0 to 5 11
Target Resolution - Two Aircraft (7 t 500-Foot Site) 13
Target Resolution - Aircraft and Pinto (7 t 500-Foot Site) 13
(l t 500-Foot Site) 13
15
- Percentage of Correct 15
- Error Breakdown by Airframe 16
Identification of Recorded Targets by Size -- Percentage Of 16 Correct Estimates
Runway Clearance Discrimination -- Nose (Time in Seconds) 20
Runway Clearance Discrimination - Tail (Time in Seconds) 20
Functional Comparison of ASDE-3 to ASDE-2 21
Effectiveness of Unit Controls and Indicators 21
v

..
INTRODUCTION
PURPOSE.
The purpose of the operat ional evaluat ion of the Airport Surface Detection Equipment (ASDE)-3 System t located at the Federal Aviat ion Adminis trat ion (FAA) Technical Center t Atlantic City Airport t N.J' t was to determine the degree to which the operational requirements established by the Air Traffic Service (ATS) were fulfilled t develop a direct controller comparison of the ASDE-3 to the ASDE-2 system performance t and evaluate the operational usefulness of ASDE-3 enhancement features.
BACKGROUND.
The ASDE-2 now used at several major airports has been operational for the past 20 years. Be ing a vacuum tube design t it has had a maintenance problem with tube failures t resulting in mean time between failures (MTBF) rate of approximately 200 hours. In addition t the radar is nearly useless in heavy rain due to backscatter from rain droplets t resulting in a "white-out" and to absorption of signals at its emitted frequency by the rain.
In order to correct the above deficiencies t the Transportation Systems Center (TSC) t under FAA Systems Research and Development Service (SRDS) sponsorshiPt issued a contract (DOT-TSC-1373) to Cardion Electronics for development of the ASDE-3 engineering model and Display Enhancement Unit (DEU). Upon completion, the system was shipped to the FAA Technical Center for engineering evaluation by TSC and operational evaluation by the FAA. The operational tests were begun on April 14 t 1980 t and completed May 30 t 1980.
SYSTEM DESCRIPTION.
The ASDE-3 radar uses a solid-state design. Several new features have been added to provide a state of the art and
pract ical airport sur face detect ion system. The new features are:
1. Antenna design for continuous focus from near to far field.
2. Rotat ing radome of a smaller cross section than a conventional radome which provides a constant window for the antenna and also sheds precipitation t eliminating losses due to radome coating by rain t snow, or ice (figure 1).
3. A new pedestal with belt drives which reduce noise.
4. A single oscillator 1S used for the local oscillator (LO), as well as the frequency source for the traveling wave tube (TWT) transmitter.
5. The pulse repetition frequency (PRF) is selectab Ie at 13 t 16, and 20 kilohertz (kHz)t staggered or fixed.
6. Transmitter frequency agility is available t . as well as several fixed frequencies from 15.7 to 16.2 gigahertz (GHz).
7. The solid-state receiver has a 6 decibel (dB) noise. figure and a 20 dB dynamic range.
8. A DEU is part of the system (figure 2). This unit provides airport mapping and target enhancement between the map boundary lines. Background may be reduced or el iminated while not affecting the enhanced targets. The display of the ASDE-3 is an analog scan converted television (TV) with 1,225 scan lines per frame.
This radar operates in the frequency range of 15.7 to 16.2 GHz with a pulse width of 36 nanoseconds (ns), a peak power of 10 kilowatts (kW), and a range of 18 tOOO feet. It has three fixed PRF's of 13 t 16 and 20 kHz. The selected PRF may also be staggered. In addition to the variable PRF, the carr ier frequency may be var ied in thirteen 30 megahertz (MHz) steps or any
1

FIGURE 1. ASDE-3 TOWER WITH ROTODOME
2

1IL.-<._.........L-I.,;•......;81-6- 2
DISPLAY ENHANCEMENT UNIT (DEU)
R MAINTENANCE CONTROL UNITI
FIGURE 2. DISPLAY ENHANCEMENT UNIT
3

combination thereof. These features are to reduce or eliminate second time around targets, amplitude variations of small targets, and clutter due to precipitation. The sensitivity time control (STC) is programmable so each site can have its own unique STC curve.
The antenna is circularly polarized with an azimuth beam width of 0.25°. The elevation main beam is between 1.6° and 2.0° wide at the half-power points, with secondary beam cosecant to the 1.5 power shaping from _2° to _4° and cosecant shap ing from -4° to -31 ° . The antenna and radome rotate at 62 revolut ions per minute (rpm).
The output video passes through the DEU to the high resolut ion analog scan converter and then to the New Bright Radar Indicator Tower Equipment (NU-BRITE) display (figure 3).
Range and XY offset are continuously variab Ie at the scan converter or the remote display control unit. A block diagram of the system is shown in figure 4.
DISCUSSION
TEST CONFIGURATION.
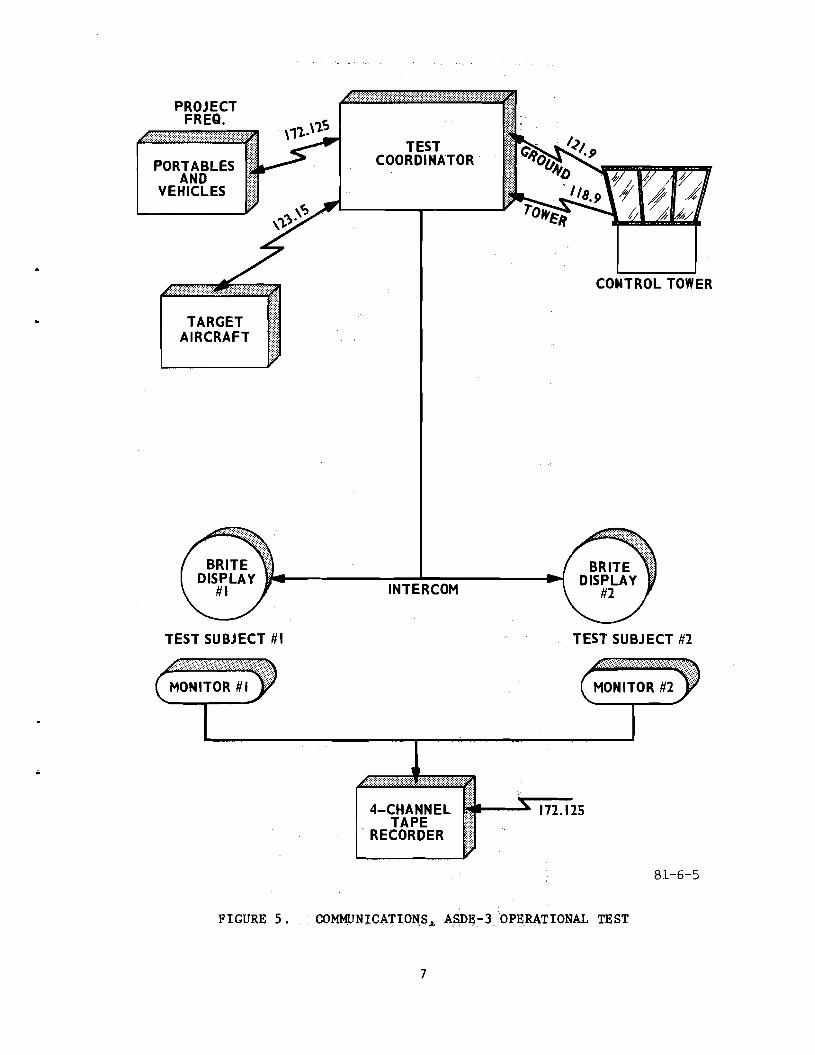
The operational tests were set up to address all applicable items in the Out 1 ine of Operat ional Requirements (appendix A). The tests were run using both live and recorded video data. The live tests were controlled by the test coordinator (figure 5) who communicated with the test subjects via intercom, received very high frequency (VHF) ground and local control, communicated with portable (hand held) and vehicle stations via VHF-frequency modulation (FM) and with the project aircraft via VHF ai.rcraft frequency. The test subjects comprised three teams, each consisting of two air traffic controllers from airports with ASDE-2 facilities. The airports and number of controllers from each were: (1) Boston, one;
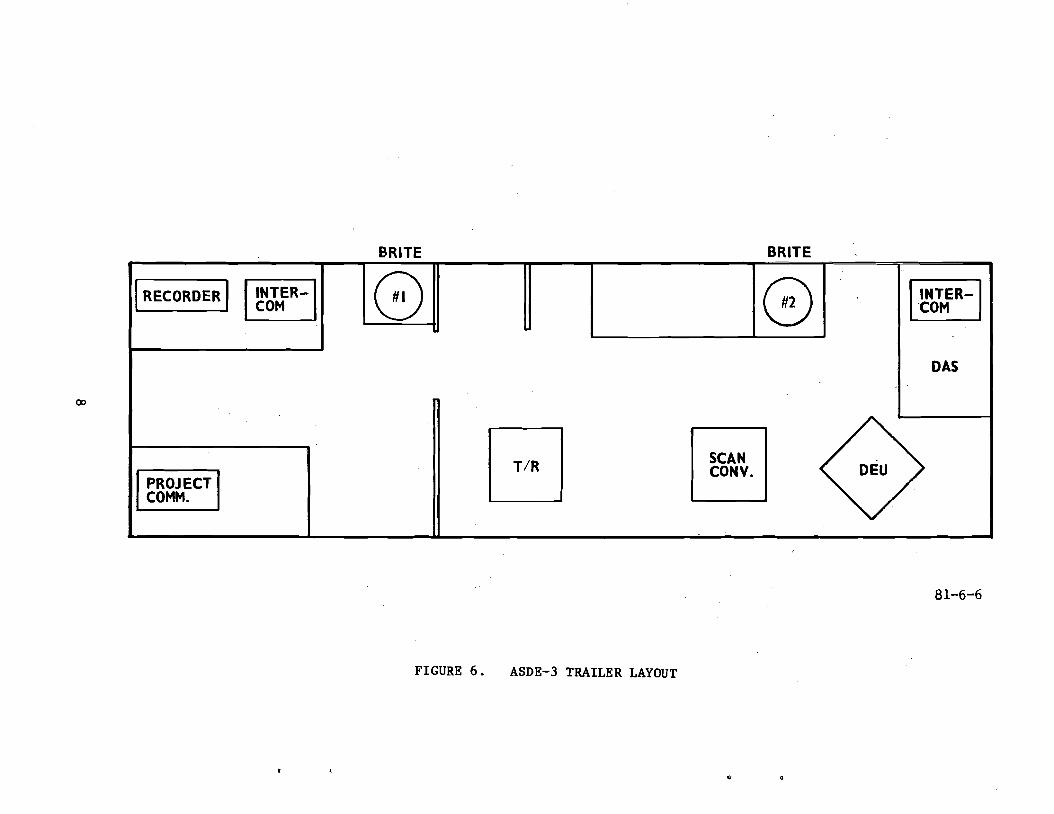
(2) Washington, D.C. (Dulles International Airport), one; (3) New York (John F. Kennedy International Airport), two; and (4) Newark, two. Each subject controller was located approximately 3 feet in front of a NU-BRITE display and was monitored by project personnel. A 4-channel tape voice recorder was also used where required by the test (figure 6).
Each team was fami 1 iarized with the operation of the system and given a demonstration of frequency agility, staggered PRF, and sector blanking. All the tests were performed with five step frequency agility, 20 kHz staggered PRF and STC, as shown in table 1.
When targets planned for the tests were not available, the nearest airframe in size and shape was substituted. The Technical Center aircraft used were a Convair CV-580, a Gulfstream G-159, and, in one test, a Convair CV-880.
wi th the DEU operat ional, each controller was allowed to set the map and background controls as he desired. This simulated the operating conditions 1n the field.
TEST PROCEDURES AND RESULTS.
AIRPORT COVERAGE. The test site was the Atlantic City (ACY) Airport surface. An aircraft (Gulfstream G-I59 or Convair CV-580) and a Ford Pinto automobile were directed along runways and taxiways by ground control on a predetermined route, the Pinto trail ing the aircraft by approximately 200 feet. Figure 7 shows the route on the airport. Appropriate radio communication was established between the aircraft, Pinto, ground control, and test coordinator prior to the start of each test.
The first test was performed with the DEU operating. The test subjects were to observe both targets along the entire route, while noting target returns on separate airport maps. Returns were classified from one to
4

FIGURE 3. NU-BRITE DISPLAY WITH REMOTE CONTROL UNIT
5

____
RADOME
217.24 INCHES1"" --......(.V PEDESTAL ASSY/''''V-- { \,\.".::" MOUNTING LEG 72.00tCHES \ \'" l~,
~ "',' ~,"~:l\ ~"""~=':-:='i-i:.:t~..\~~IANEMOMETER I~ \ l
-
I I I I IL
TEST TOWER ROOM- r----T
CDMPRESSOR
r I IL ON FIELD ...J
6.00 INCHES /'.... ..IIq ANTENNA DRIVE
36.00 INCHES 1 RADOHE HEAT .J
--~ ROOF
_~W~~S~S__ __---- - .- -II LOAD CELLS ~ RADAR
CONTROL r--+ CONTRACTOR UNIT BOX
-----t------ --------.--------I : I POWER
WAVEI GUIDE I RADOME
IDEHYDRATOR 'I ~ HEAT
I CONTROL II UNIT
I I I HEAT CONTROL...J ACP. ARP. ALARMS.
IINTERLOCKS
VIB SENSOR I RADAR CONTROL I ISWITCHING UNIT I I
I I ~ANTENNA DRIVE
r--I--..., I RADOME HEAT
I CONTRUL
II RECEIVER/ I I I TRANSMITTER VIDEO I I
I I II II I I I I CONTROLS
FREQ. TRIGGER I I INDICATORS AGILITY CONTROLS IMONITDRING ISTC
I I I I I I
II I CONTROLSI MAINTENANCE I INDICATORS
SYNCHRON- I I RADAR CONTROL
ACP. ARP. PRETRIGIZER I I UNITTRIGGERS
tI CONTROL ENABLE I I o TVI ACP.ARP I I RANGE I I ACP I ON/OFF
ANALOG XY OFFSET FREQUENCY ARP VIDEO MAP ERASE DISPLAY
I ~lPEElRIG I I SCAN CONTROLAGILITY. STC CONVERTER
MAP UNITI I RACK
I BACKGROUNO
RAIN I I BYPASS GAIN
I DISPLAY IBAC~~:OUND BRIGHTNESSPOWER CONTRAST SUPPLY I ENHANCEMENT ON/OFFUNIT I BYPASS CONTROLS
I I.L_~~A~_J MAG TAPE I TV DISPLAY UNIT COMPOSITE 0HP982SA I I VIDEO
PROGRAM- I IPLOTTER MABLE DESK TEST.sr:: CALCULATOR I EQUIPMENT
IPRINTER
f~~~: IL____ ...JI
TV DISPLAY
CLOCK COMPOSITE 0 ~ MAINTENANCE VIDEO CONTROLRAIN RACKGAUGES
.1- 6 4 R
FIGURE 4. BLOCK DIAGRAM, ASDE-3 SYSTEM
6
PROJECT
CONTROL TOWER
TARGET AIRCRAFT
FREQ.
PORTABLES AND
VEHICLES
TEST COORDINATOR
INTERCOM
TEST SUBJECT #1 TEST SUBJECT #2
/:::::::::::::::::::::::::;::::::;:...;:::;:::::::::::::::::::::::::::::;::;ii:i'
4-CHANNEL Il*-~ 172.125 TAPE nr
'RECORDER ':::i:)
81-6-5
FIGURE 5. COMMUN:rCA'rIONS~ ASDlj:-30PERATIONAL TEST
7
00
BRITE BRITE
IRECORDER I I~J~R-I G G IINTER-!'COM
DAS
G ~CONY. DEU PROJECT COMM.
FIGURE 6. ASDE-3 TRAILER LAYOUT
'"
81-6-6

CONTROL TOWE~ •
•ASDE-3
ACY MUNICIPAL TERMINAL
RAMP SPEED 10 MPH
o 600 1000. 1 t t , ,! , !
SCALE ----_ FEET
FIGURE 7. AIRPORT COVERAGE - ROUTE TAKEN BY AIRCRAFT AND VEHICLE
9
81-6-7
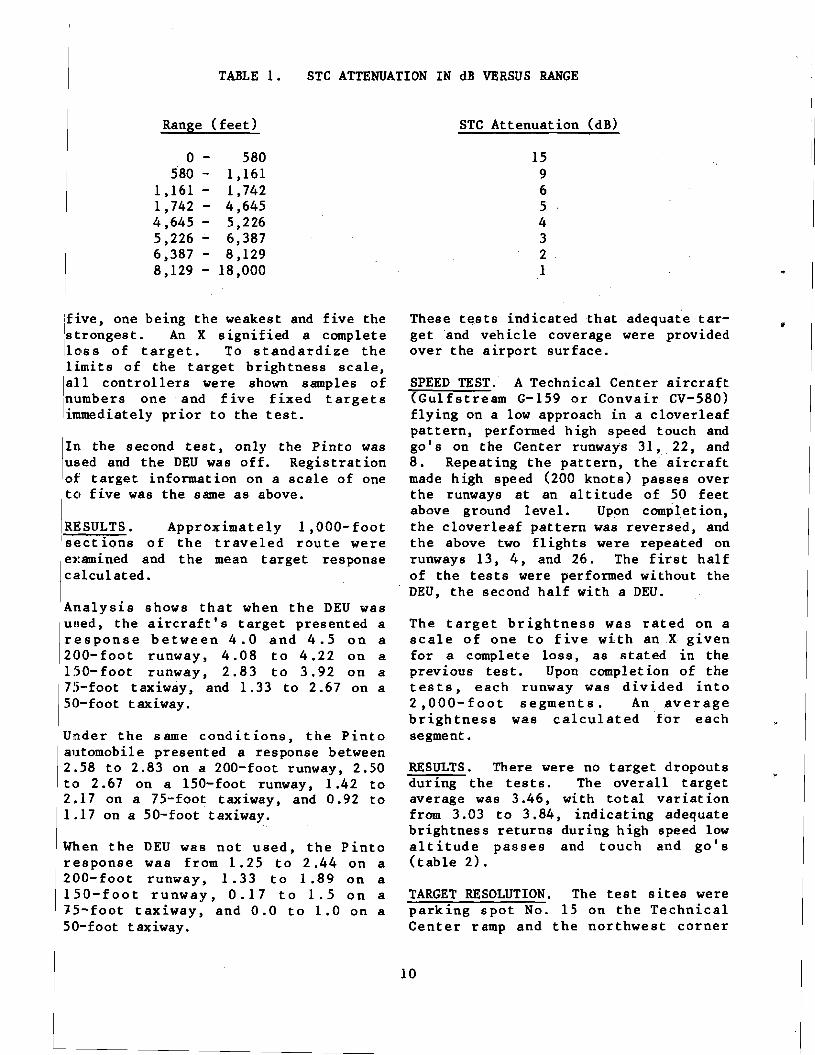
TABLE 1. STC ATTENUATION IN dB VERSUS RANGE
Range (feet)
o - 580 580 1,161
1.161 1.742 1.742 4.645 4.645 5,226 5.226 6.387 6.387 8.129 8.129 - 18.000
Ifive. one being the weakest and five the Istrongest. An X signified a complete 10lss of target. To standardize the limits of the target brightness scale. all controllers were shown samples of numbers one and five fixed targets immediately prior to the test.
Inl the second test. only the Pinto was used and the DEU was off. Registration of' target information on a scale of one tel five was the same as above.
RESULTS. Approximately 1.000-foot SE!ct ions of the traveled route were e]l:amined and the mean target response cdcu1ated.
Analysis shows that when the DEU was used. the aircraft's target presented a response between 4.0 and 4.5 on a 200-foot runway. 4.08 to 4.22 on a 150-foot runway. 2.83 to 3.92 on a 75-foot taxiway, and 1.33 to 2.67 on a 50-foot taxiway.
Under the same conditions, the Pinto automobile presented a response between 2.58 to 2.83 on a 200-foot runway. 2.50 tl:) 2.67 on a 150-foot runway. 1.42 to 2.17 on a 75-foot taxiway. and 0.92 to 1.17 on a 50-foot taxiway.
When the DEU was not used. the Pinto response was from 1.25 to 2.44 on a 200-foot runway. 1.33 to 1.89 on a ISO-foot runway. 0.17 to 1.5 on a J5-foot taxiway. and 0.0 to 1.0 on a 50-foot taxiway.
STC Attenuation (dB)
15 9 6 5 4 3 2 1
These tests indicated that adequate target and vehicle coverage were provided over the airport surface.
SPEED TEST. A Technical Center aircraft (Gu1fstream G-159 or Convair CV-580) flying on a low approach in a cloverleaf pattern. performed high speed touch and go's on the Center runways 31 •. 22. and 8. Repeating the pattern. the aircraft made high speed (200 knots) passes over the runways at an altitude of 50 feet above ground level. Upon completion. the cloverleaf pattern was reversed, and the above two fl ights were repeated on runways 13. 4. and 26. The first half of the tests were performed without the DEU. the second half with a DEU.
The target brightness was rated on a scale of one to five with an.X given for a complete loss, as stated in the previous test. Upon completion of the tests, each runway was divided into 2 .OOO-foot segments. An average brightness was calculated for each segment.
RESULTS. There were no target dropouts during the tests. The overall target average was 3.46. with total variat ion from 3.03 to 3.84. indicating adequate brightness returns during high speed low a1 t itude passes and touch and go's (table 2).
TARGET RESOLUTION. The test sites were parking spot No. 15 on the Technical Center ramp and the northwest corner
10
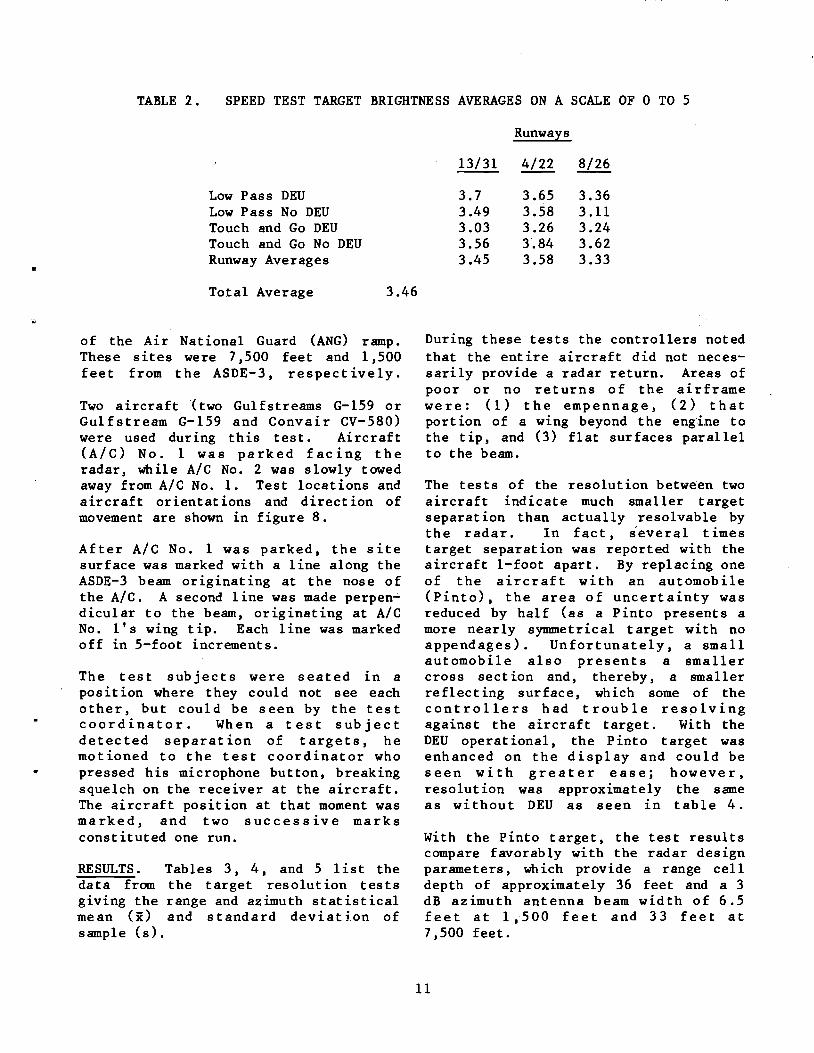
TABLE 2. SPEED TEST TARGET BRIGHTNESS AVERAGES ON A SCALE OF 0 TO 5
Runways
13/31 4/22 8/26
•
Low Pass DEU Low Pass No DEU Touch and Go DEU Touch and Go No DEU Runway Averages
Total Average 3.46
3.7 3.49 3.03 3.56 3.45
3.65 3.58 3.26 3.84 3.58
3.36 3.11 3.24 3.62 3.33
of the Air National Guard (ANG) ramp. During these tests the controlle~s noted These sites were 7,500 feet and 1,500 that the entire aircraft did not necesfeet from the ASDE-3, respect ively. sarily provide a radar return. Areas of
poor or no returns of the airframe Two aircraft (two Gulfstreams G-159 or were: (1) the empennage, (2) that Gulfstream G-159 and Convair CV-580) port ion of a wing beyond the engi.ne to were used during this test. Aircraft the tip, and (3) flat surfaces parallel (A/C) No. 1 was parked facing the to the beam. radar, while A/C No. 2 was slowly towed away from A/C No.1. Test locations and The tests of the resolution between two aircraft orientat ions and direct ion of aircraft indicate much smaller target movement are shown in figure 8. separat ion than actually resolvable by
the radar. In fact, several times After A/C No. 1 was parked, the site target separation was reported with the surface was marked with a line along the aircraft I-foot apart. By replacing one ASDE-3 beam originat ing at the nose of of the aircraft with an automobile the A/C. A second line was made perpen~ (Pinto), the area of uncertainty was dicular to the beam, originating at A/C reduced by half (as a Pinto presents a No. l's wing tip. Each line was marked more nearly syuunetrical target with no off in 5-foot increments. appendages). Unfortunately, a small
automobile also presents a smaller The test subjects were seated in a cross section and, thereby, a smaller position where they could not see each reflect ing surface, which some of the other, but could be seen by the test controllers had trouble re~olving
coordinator. When a test subject against the aircraft target. With the detected separation of targets, he DEU operational, the Pinto target was motioned to the test coordinator who enhanced on the display and could be pressed his microphone button, breaking seen with greater ease; however, squelch on the receiver at the aircraft. resolution was approximately the same The aircraft position at that moment was as without DEU as seen in table 4. marked, and two successive marks constituted one run. With the Pinto target, the test results
compare favorably with the radar design RESULTS. Tables 3, 4, and 5 1ist the parameters, wh ich provide a range cell data from the target resolution tests depth of approximately 36 feet and a 3 giving the range and azimuth statistical dB azimuth antenna beam width of 6.5 mean (x) and standard deviation of feet at 1,500 feet and 33 feet at sample (s). 7,500 feet.
11

COII/TIIOL TOWEA •
•ASDE-3
" .. c I ii c ~
ACY MUNICIPAL TEAM/NAL
RAMP SPEED 10 MPH A =TARGET RESOLUTION SITES AND
CONFIGURATIONS
B=OBSTRUCTION RESOLUTION SITE AND CONFIGIIRATION
AIRCRAFT NOT TO SCALE o l,
800 ! ,
1000 , !
SCALE---__ FEET
FIGURE 8. TARGET AND OBSTRUCTION RESOLUTION TEST SITES
12
81-6-8

TABLE 3. TARGET RESOLUTION - TWO AIRCRAFI' (7,sOO-FOOT SITE)
Range(i) Range(s) Azimuth(i) Azimuth(s) ( feet> ( feet) (feet) ( feet>
DEU 6.17 4.13 14.92 8.07
No DEU 4.67 4.62 24.17 9.69
•
..
TABLE 4. TARGET RESOLUTION - AIRCRAFT AND PINTO (7,sOO-FOOT SITE)
Range(i) Range(s) Azimuth(i) Azimuth(s) ( feet> (feet) (feet) ( feet)
DEU 41.16 21.19 27.06 21.27
No DEU 73.89 17.62 20.89 19.93
TABLE 5. TARGET RESOLUTION - TWO AIRCRAFT (l,sOO-FOOT SITE)
Range(i) Range(s) Azimuth(i) Azimuth(s) ( feet) ( feet> (feet) ( feet>
.. No DEU 8.25 7.60 10.13 10.30
13

OBSTRUCTION RESOLUTION. An aircraft was pos it ioned on the Technical Center ramp near the north corner of the hangar (figure 8), 10 feet from the northwest wdl and facing the ASDE. The aircraft WilS then slowly towed away from the hangar wall until both test subjects rf~solved the hangar and aircraft into sleparate targets. This tes~ was repeated. Upon completion, the aircraft WeiS repositioned against the adjacent (northeast) wall of the hangar, 10 feet from the corner and pointing perpendicular to the ASDE beam. The aircraft WeiS, again, slowly moved until notified otherwise by the test coordinator. These tests were also performed using several other structures on the airport and the Pinto automobile.
For these tests, the test subjects were again seated in a posit ion where they could not see each other, but could be s,een by the test coord inator. When a test subject detected separation of targets, he motioned to the test coordinator who pressed h is microphone button, breaking sque lch on the receiver at the aircraft. The aircraft position at that moment was marked, and two successive marks constituted one run (as in the target resolution test). There were cases where two targets could be resolved at the starting point of 10 feet, in which case, the aircraft was moved toward the hangar to within 1 foot of the wall.
Unfortunately, the aircraft tests could be performed only at the northwest corner of the hangar since other locations around the test center did not leave enough maneuvering space. Therefore, obstruction shadowing testing could not be performed. Since a high fence is installed between the hangar and the ASDE, a tall airframe was required to prevent biasing of results, leaving only the Convairs CY-580 and CY-880. The DEU was not used as all the locations were QIU t s ide the map enhancement areas. These tests were repeated at buildings 241 and 271 (on the ANG Ramp) using the
Pinto automobile. The test results are shown in table 6.
The difference between results obtained wi th the two a ir frames and with the vehicle is discussed in the preceding test. Again, since the Pinto automobile approaches a symmet rical target, it provides a truer picture of the actual resolution capability.
TARGET SIZE AND SHAPE. The test subjects, under direction of the test coordinator, identified selected targets according to size. Originally, it was intended to use the three standard classifications (small, large, and heavy) used in the Air Traffic Control Handbook 7110.65B, appendix 3. However, the controllers took exception to this system of rating as it was not detailed enough to accurately describe system capabilities. It was agreed to classify the aircraft into four classes (small, medium, large, and heavy). During data reduction, the sizes were reclassified into the original three classes, as specified in the operational test plan, classifying medium as either large or small. The results were then compared against the standard classification list and are shown in table 7.
Analysis of the wrong estimates by aircraft type is shown in table 8. The Error column in table 8 indicates whether the erroneous estimates were larger or smaller on the average than the actual classification by a plus or a minus symbol, respectively.
When conditions precluded airport operations, the target size and shape tests were performed using video recorded targets. These targets were prerecorded at doub Ie size to provide 1 ine resolution similar to the NU-BRITE display. The results of the recorded tests are shown in table 9.
Comparison of results of live to recorded targets (tables 7 and 9), indicate a high degree of correlation
14
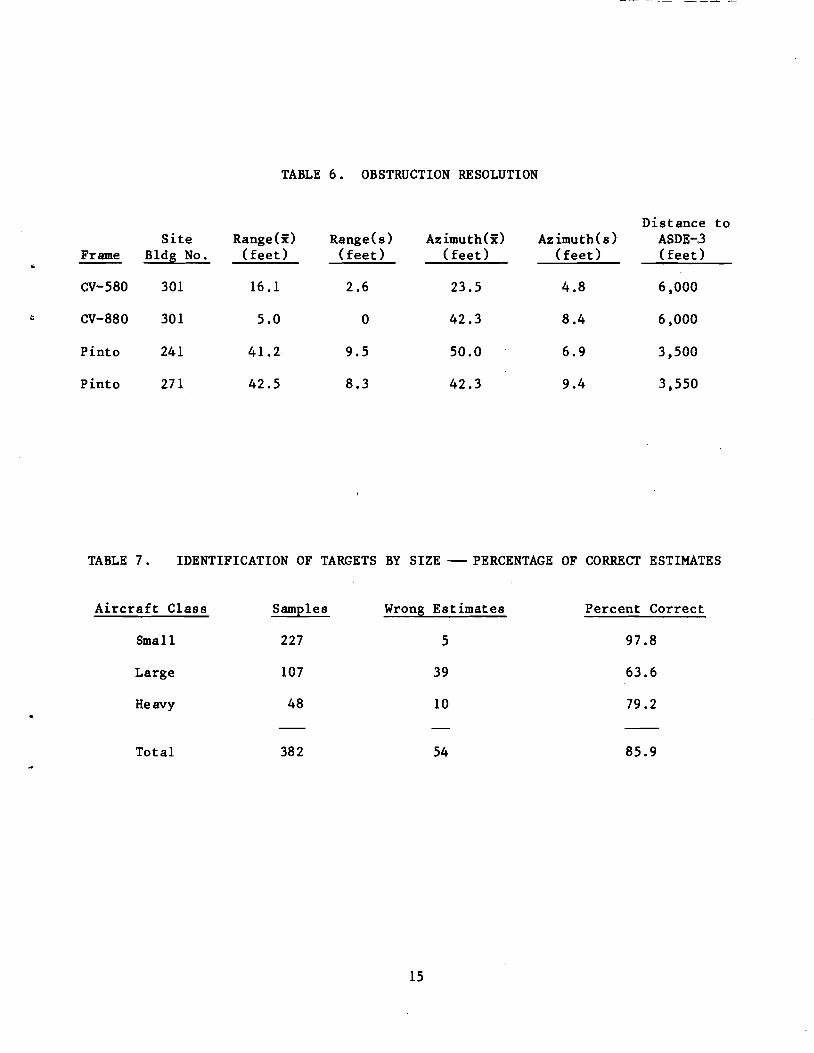
TABLE 6. OBSTRUCTION RESOLUTION
Distance to Site Range(ic) Range(s) Az imut h (ic) Azimuth(s) ASDE-,3
Frame Bldg No. (feet) (feet) (feet) (feet) (feet)
CV-580 301 16.1 2.6 23.5 4.8 6,000
CV-880 301 5.0 0 42.3 8.4 6,000
Pinto 241 41.2 9.5 50.0 6.9 3,500
Pinto 271 42.5 8.3 42.3 9.4 3,550
TABLE 7. IDENTIFICATION OF TARGETS BY SIZE -- PERCENTAGE OF CORRECT ESTIMATES
Aircraft Class Samples Wrong Estimates Percent Correct
Small 227 5 97.8
Large 107 39 63.6
Heavy 48 10 79.2
Total 382 54 85.9
15

TABLE 8. IDENTIFICATION OF TARGETS BY SIZE - ERROR BREAKDOWN BY AIRFRAME
Total Wrong Percent Aircraft Type Class Samples Estimates Correct Error
F-l06 Large 54 16 70.4
Twin Otter DH-6 Small 42 4 90.5 +
Ei-747 Heavy 34 2 94.1
Kingaire Small 16 1 93.8 +
Jet Commander Large 14 9 35.7
n-707-300 Heavy 12 5 58.3
Jet Star Large 10 5 50.0
Gulf at ream G-159 Large 8 7 12 .5
l~alcon Jet Jl.arge 6 2 66.7
C-14l Heavy 4 3 25.0
TABLE 9. IDENTIFICATION OF RECORDED TARGETS BY SIZE - PERCENTAGE OF CORRECT ESTIMATES
Aircraft Class Samples Wrong Estimates Percent Correct
Small 24 3 87.5
Large 44 9 79.5
Heavy 32 3 90.6
Total 100 15 85.0
16

between the two tests. In all cases of large and heavy aircraft errors, the aircraft size was underestimated, which is attributed to the poor reflect ivity of wing tips and tail surfaces. It was observed that the test subjects went through a learning curve where they repeatedly identified an airframe from the target shape on the display whether correct ly ident if ied by target class or not. It is assumed that the 85.9 percent correct estimate figure
• would have been even higher if the subjects had been corrected the first time they had seen and misident ified a target.
STANDING TARGET HEADING (VIDEO TAPE). Video tape recordings were made of two aircraft, a Convair 580 and a Gulfstream G-159. Test sites were the ends of runway 13/31. Radio communicat ion was established between the aircraft pilot and the video tape recorder operator. The pilot turned the aircraft to a magnet ic head ing, then informed the operator of that heading. The radar display was then taped and the tape counter read-out was logged along with the heading.
Al though the Gul f stream presented a good target on the radar display, the target was symmetrical with practically no distinguishing characteristics; therefore, it was not used during the actual tests.
All video recordings were taped at 2X magnification because the radar display has 1,225 1 ines and the video monitor only has 525 lines. This made the line resolution of the monitor almost the same as the display. However, there was further degradation of resolution due to secondary recording (a recording made of a NU-BRITE display picture rather than the direct output of the scan converter).
The test subjects viewed the video monitor and recorded aircraft heading. These recorded data were then compared
with the master video tape log. Each subject was given seven headings to identify. For two of these headings the DEU was turned off. .
RESULTS. Two head ings, south and west, were presented wh i Ie the system was operated without the DEU. The average error for the 12 samples was 58 percent. The error for south was 67 percent and the error for wes twas 50 percent.
Four headings, north, east, south, and west, were presented while the system was operated with the DEU. The average error for the 30 samples was 23 percent. The error for north was 0.0 percent, east was 0 . 0 percent, south' was 67 percent, and west was 50 percent. The wide variations were due to the subject ive nature of the test and to the small sample size.
RUNWAY CLEARANCE DISCRIMINATION. Three sites on the airport surface, which are outlined in figure 9, were used for this test. The intersect ions ut il ized were as follows:
1. Technical Center ramp, entering taxiway K.
2. Taxiway K, entering taxiway B.
3. Leaving taxiway B, entering taxiway J.
4. Taxiway J, entering Technical Center ramp.
5. Leaving taxiway B, entering taxiway at end of runway 13.
6. Taxiway at end of runway 13, entering runway 13.
7. Leaving runway 13, entering taxiway C.
8. Taxiway C, entering taxiway B.
9. Taxiway runway 8.
G, entering and leaving
17

COIIITIIOL TOWER •
•ASDE-3
ACV MUIIIICIPAL TEIIMINAL
RAMP SPEED 10 MPH
o 600 1000 1 t , , t !, ,!
SCALE---__ FEET
RUmJAY CLEARANCE DISCRIMINATION SITESFIGURE 9.
18
31-G-9

..
10. Taxiway D, entering and leaving runway 8.
A Convair 580 taxied the prescribed route under the direction of ground control. Radio communication was established between the aircraft pilot, ground control, test coordinator, and ground observer. The funct ion of the ground observer was to position himself at strategic points so he could visually witness the aircraft entering and leaving an intersection. He signaled via the radio link the instant of each occurrence. Each test subject was positioned in front of a radar display and called nose or tail as the aircraft entered or left an intersection. These responses were picked up by a microphone which was attached to a four-channel audio tape recorder. Each controller had his own microphone and tape channel. The ground observer's transmissions were also taped on another channel.
The test was conducted with the DEU off and then on. The aircraft taxi speed was approximately 15 miles per hour (mph) at the intersections.
Data were extracted from the tape by output ting each channel to a separate speaker. A stop watch was used to time the responses, the ground observer being the reference. An "early" time was assigned if the controller's response preceded the reference and a "late" time if the reference preceded the controller. "On" time was ass igned if the controller and the reference responses were simultaneous.
RESULTS. Tables 10 and 11 are the reduced data of this test. In table 10, the early value of NOSE is the time in seconds that the controllers saw the aircraft enter the intersect ion before it actually did. The late value is the time before the aircraft had already entered the intersection.
Since the data are a composite of all the intersect ions tested, any data
skewing due to the aircraft aspect with relation to the ASDE-3 site is cancelled out.
Table 11 indicates a greater data dispers ion than table 10. The greater numbers for the tail position are due to the target trail during air craft movement. Lower numbers are not to be expected at operational sit es since: (l) the des ign minimum point target resolution is 30 feet, (2) an aircraft at 15 mph moves 21 feet between radar scans, (3) a moving aircraft leaves a veloc itydependent trail, and (4) 11 feet scan converter reso lu t ion. An analys is of these errors is in appendix B.
Analysis of the data shows the DEU helpful when an aircraft is entering an intersection, while it is of no help when an aircraft is clearing it.
CONTROLLER QUESTIONNAIRE RESULTS.
Upon complet ion of the tests, each group of subjects was given a series of quest ions to answer about their impression of the ASDE-3. A summary of these answers is given below.
1. All subjects tested worked at sites equipped with ASDE-2 and were acquainted with the ASDE-2 operation.
2. All the test subjects saw a large improvement in the operational usefulness of the ASDE-3 over the ASDE-2.
3. Cons idering individual funct ions or part s of the ASDE-3 versus ASDE-2, the composite controllers' responses are shown in table 12.
4. The effect iveness of unit controls and indicators of the ASDE-3 as they affect the controllers' responses in an operat ional sett ing are shown in table 13.
19

TABLE 10.
Collect ive Time
Samples 111
}ol[ean 0.78
Standard 1.04 Deviation
TABLE 11.
Collect ive Time
Samples 110
~Iean 2.16
Standard 3.04 Deviation
RUNWAY CLEARANCE DISCRIMINATION-- NOSE
DEU
On Early Late Collective Time Estimate Estimate Time
9 31 72 45
0 1.61 1.98 0.12
0 1.00 1.54 2.34
RUNWAY CLEARANCE DISCRIMINATION -- TAIL
DEU
On Early Late Collect.ive Time Estimate Estimate Time
8 18 84 41
0 1.30 3.11 2.12
0 1.12 2.82 2.64
(TIME IN SECONDS)
NO DEU
On Early Late Time Estimate Estimate
11 12 22
0 2.60 1.66
0 2.37 1.35
(TIME IN SECONDS)
NO DEU
On Early Late Time Estimate Estimate
8 3
0 1.27 3.03
0 0.67 2.51
20
30

TABLE 12. FUNCTIONAL COMPARISON OF ASDE-3 TO ASDE-2
Much Slightly Not As Better Better Same Good
Display crispness 5 1
Displayed target
Runway presentation
Flicker free display 2 2 2 Display clutter 4 2 Affect of ambient light 1 1 4 Target detection 5 1 Target resolution 5 1
position accuracy 5 1
.. without DEU 1 5
- no response
TABLE 13. EFFECTIVENESS OF UNIT CONTROLS AND INDICATORS
Fine Needs Totally Not Needed As Is* Improvement* Unacceptable* During Test*
Display control unit map 4 2
Radar control unit - T/R
Radar control unit
Radar control unit
Radar control unit
Display control unit background 6 Display control unit threshold 4 TV display control'brightness 6 TV display control contrast 6 TV display control video 5 1 TV display control composite 6 DEU - background video 6 DEU - map line intensity 5 1 DEU - threshold setting 3 DEU - range offset 6 DEU - range control 6 DEU - off-centering control 6 DEU - brightness 6 DEU - contrast 6 DEU - analog scan erase 6 DEU - set presentation selector 6
control indicator 5
radome heat 5
antenna drive 4
radar power 4
- no reponse * numbers under column heads indicate number of controllers selecting results.
21
5. Operational usefulness.
a. All controllers saw much use for the ASDE-3 at their site.
b. Operationally the best aspects of the ASDE-3 are, in order of importance (the number preceeding each statement is the number of subjects sl!1ect ing that category): (1) 5-DEU/map, l--heavy weather operat ion (each team observed moderate to heavy rain and fog during the test; snow or ice conditions were not encountered during the test period); (2) 2";'weather operation, l--antenna, I-map, I-resolution; and (3) 2--variable range controls, I-sharpness of display.
c. Operationally, the worst aspect of the ASDE-3 was that one subject felt that the l-DEU map needs improvement in accuracy and line width before going to the field.
d. Other Unprovements needed are: (1) possibly a beacon return, and (2) add alphanumerics for positive identification, such as Tower Automated Ground Surveillance System (TAGS).
6. Comparison to Air Traffic Service's requirements. In response to the operational test plan questionaire, all subjects stated that: "In its present state, the ASDE-3 completely conforms to the Air Traffic Services requirements." The tes t sub jec ts' general comment s were:
a. "If the runway end was fanned about 20° with the DEU map lines, an A/C would be 'painted' on final approach prior to landing. I believe this would be a great help if the weather was solid IFR" (Instrument Flight Rules).
b. The ASDE-3 radar antenna noise level in the equipment room, located 6 feet below the rotating antenna, was "very quiet."
c. "Airports which are level four or five and have ASDE, should be
equipped with two complete sets of BRITE radar display access controls ASDE-3 DEU in order to allow the independent use by the ground controller to get better aircraft definition by use of shorter range usage where he may not have to monitor complete airport area at all times. This will allow the local controller some flexibility at the same time in his operation of the ASDE-3 DEU."
d. Sector Blanking. "This could possibly be a distraction. If this is incorporated in the system, the control should be available to the controller." (Sector blanking is a requirement for spectrum approval.)
e. Control unit selector of two presentat ions. "The time to switch, erase, and readjust to the new setting could cause confusion of position of aircraft. This feature may have use at some facilities."
SUMMARY OF RESULTS
Results of the ASDE-3 operational tests indicate that:
1. Aircraft and vehicular targets were visible on all runways and taxiways with the exception of certain portions of the 50-foot wide perimeter taxiway where a Pinto automobile momentarily disappeared.
2. High speed (200 knots at 50-foot altitude) targets were tracked over all the Technical Center runways with no target dropouts.
3. Target resolution: resolution between aircraft and vehicles averaged 41 feet in range and 27 feet in azimuth at a 7,500-foot distance from the radar. The resolut ion between aircraft is similar to the resolution between aircraft and vehicles. Excellent results are due to the poor reflectivity of portions of the aircraft.
22

4. Obstruction resolution for a vehicle averaged 42 feet in range and 45 feet in azimuth at a distance of 3,500 feet. For aircraft, the resolution was 16 and 5 feet in distance and 23.5 and 42 feet in azimuth for a Convair CV-580 and a CV-880, respectively, at a distance of 6,000 feet. Excellent results are due to the poor reflectivity of portions of the aircraft.
5. Target size identification tests resulted in 98 percent correct estimates for small, 64 percent for large, and 79 percent for heavy live targets. The
.. overall correct estimate average was 85.9 percent. Video recorded target estimates were 87 percent correct for small, 79 percent for large, and 91 percent for heavy targets. Overall correct estimate average for recorded targets was 85 percent.
6. The average error in standing target headings was 23 percent with the DEU and 58 percent without the DEU for a Convair CV-580.
7. During the runway clearance discrimination test, the average for aircraft entering a runway was 0.78 seconds (17 feet) late with DEU and 0.12 seconds (2.6 feet) late without DEU. Results for the aircraft exiting a runway are 2.16 seconds (47.5 feet) late wi th DEU and 2.12 seconds (46.6 feet) late without DEU. The high numbers for exit ing aircraft are due to the target trail behind a moving aircraft on the display.
8. System operation was not degraded during periods of heavy rain or fog.
CONCLUSIONS
From the test and questionnaire results, it was concluded that:
1. The Airport Surface Detection Equipment (ASDE)-3 provides adequate
airport coverage for detection of aircraft and service vehicles on the Atlantic City Airport surface~
2. The ASDE-3 provided good detect ion of high speed low altitude· targets.
3. The target resolution requirement (25 feet) was not met in range or azimuth using an aircraft and vehicle or two aircraft as test targets.
4. The ASDE-3 will provide correct target size estimates approximately 85 percent of the time. This number can be increased as the controller memorizes aircraft shapes along with their class ificat ion.
5. Target heading discrimination capabi! ity was poor, being very dependent on the type of airframe under test and its orientation with respect to the radar.
6. Although the average position of the moving aircraft nose was within 17 feet of the runway intersection edge, a one standard deviation value of +45 feet exceeded the 20-foot requirement. The tail position estimate was approximately three times greater with a standard deviation of +67 feet.
7. The operational displays are clear of clutter, flicker free, of uniform brightness, and are continuously usable in all light conditions. The outlines of all runways, taxiways, and holding areas are clearly discernible.
8. The system provides a clear picture under conditions of heavy rain and fog.
9. The antenna noise level is nondistractive. Vibration in the cab due to the antenna rotation is very low.
RECOMMENDATIONS
Based on the operational test results, it is recommended that:
23

1. The airport surface detection equipment (ASDE)-3 system be considered for implementation at field facilities.
2. An extended evaluation of the system b·e performed utilizing local controllers during periods of heavy rain, fog, and snow. For this purpose, an ASDE-3 display would be remoted to the Atlantic City Tower.
24

APPENDIX A
OUTLINE OF OPERATIONAL REQUIREMENTS
On April 26, 1977, ARD-lOO received the following outline of operational requ1rements for Airport Surface Detection Equipment (ASDE)-3 from AAT-I00.
1. Independent displays at local and ground control positions with individual offset, variable range, intensity, and associated operational controls are required at each site.
2. The operat ional displays must be clear of clutter, fl icker free, of uniform brightness, and continuously usable in all light conditions. The outline of all runways, taxiways, and instrument landing system (ILS) critical holding areas must be clearly discernible.
3. The operational displays must have a presentation with enough clarity to determine aircraft heading when standing, and to distinguish between small aircraft (Category I, II) / service vehicles, large and heavy aircraft (Category III) by size/shape of the target displayed. This display clarity must be present under all weather conditions including heavy rain, snow, fog, etc.
4. The actual position of the aircraft must be within 20 feet of the displayed target position. These targets must be well defined and blooming eliminated.
5. Provide complete coverage at airports with obstructing buildings such as large hangars. Eliminate shadowing on the movement area.
6. The radar- must be a high resolution radar capable of detecting all aircraft and service vehicles operating on the runways and taxiways. This includes those taxiways immediately adjacent to the gate/ramp areas.
7. The operational displays must be of high resolution to permit high speed targets such as an F-4 Fighter Jet (that has a landing speed of 165 knots) to be continuously discernible.
8. ASDE radar must have target resolution of 25 feet or less on the operational display of all targets at an altitude of at least 100 feet and below. This will provide air traffic control (ATC) with arrival and departure assurance.
9. The antenna noise level must be nondistractive. Where the antenna is mounted on the tower, vibration in the cab must be eliminated when the antenna rotates.
A-I

APPENDIX B
MOVING TARGET POSITION ERROR ANALYSIS
The moving target position errors on an Airport Surface Detection Equipment (ASDE)-3 display fall into four categories.
1. Errors due to the time between plan position indicator (PPI) sweeps.
2. Errors due to the scan converter/New Brite Radar Indicator Tower Equipment (NU-BRITE) display raster.
3. Pulse shaping and antenna radiation pattern errors.
4. Vidicon target voltage delay errors.
Considering these errors one at a time, the most obvious is the sweep error. Since the ASDE-3 antenna is rotating at 62 revolutions per minute (rpm), the PPI sweep will cross the moving target approximately once per second, forming a series of trailing images on the NU-BRITE display screen. The error itself occurs when the exact target position is required at time T, which mayor may not be coincidental with the sweep crossing of the target. The error bounds are TO-Tl = 0 seconds where the required target position and sweep are coincidental, and 0.97 seconds or the time of the next sweep. Since displayed targets always indicate the past history of the target, the error is cumulative in the positive direction. The maximum distance a target will have traveled during this time is shown in equation B-1.
Es = NV (B-1)
where Es = error due to sweep time, N = time required for an antenna revolution (in this case 0.97 seconds), and V = target velocity in feet/second (22 feet/second used in testing).
For the above conditions Es = 21.29 feet.
Ideally, for a small target, the raster error (Er) would vary as
2REr = --___ S cos 9
Where R = coverage radius of the display in feet (for the Atlantic City Airport R is considered 6,500 feet).
S = number of scan lines per frame (1,225). 9 = the target true bearing (assuming display north is at zero degrees).
However, due to the transmited pulse rise and fall times of 9 nanoseconds (ns) each, and the antenna horizontal beam width of 0.25°, a Swerling 1.5 square meter (m2) calibrated target was measured as covering 38 feet in depth and 52 feet in azimuth at a range of 8,800 feet. The target (regardless of size) covers at least several raster scan lines and equation 2 simplifies to
2R.ER = S
B-1
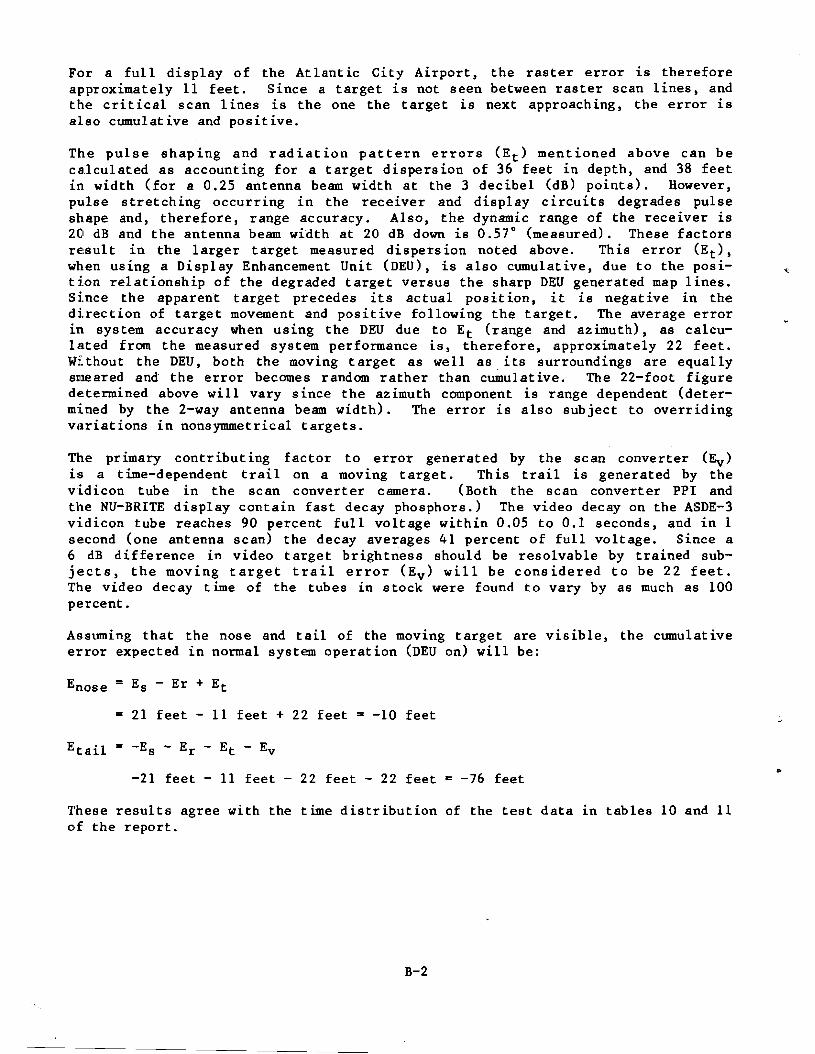
For a full display of the Atlantic City Airport, the raster error is therefore approximately 11 feet. Since a target is not seen between raster scan lines, and the critical scan lines is the one the target is next approaching, the error is also cumulative and positive.
The pulse shaping and radiation pattern errors (E t ) mentioned above can be ca.1culated as accounting for a target dispersion of 36 feet in depth, and 38 feet in. width (for a 0.25 antenna beam width at the 3 decibel (dB) points). However, pulse stretching occurring in the receiver and display circuits degrades pulse shape and, therefore, range accuracy. Also, the dynamic range of the receiver is 20 dB and the antenna beam width at 20 dB down is 0.57° (measured). These factors re~sult in the larger target measured dispersion noted above. This error (E t ), when using a Display Enhancement Unit (DEU) , is also cumulative, due to the position relationship of the degraded target versus the sharp DEU generated map lines. Since the apparent target precedes its actual position, it is negative in the direction of target movement and positive following the target. The average error in system accuracy when using the DEU due to Et (range and azimuth), as calculllted from the measured system performance is, therefore, approximately 22 feet. Without the DEU, both the moving target as well as its surroundings are equally slilleared and the error becomes random rather than cumulative. The 22-foot figure dE~termined above will vary since the azimuth component is range dependent (determined by the 2-way antenna beam width). The error is also subject to overriding variations in nonsymmetrical targets.
The primary contributing factor to error generated by the scan converter (Ev ) i:9 a time-dependent trail on a moving target. This trail is generated by the vidicon tube in the scan converter camera. (Both the scan converter PPI and the NU-BRITE display contain fast decay phosphors.) The video decay on the ASDE-3 vidicon tube reaches 90 percent full voltage within 0.05 to 0.1 seconds, and in 1 s,econd (one antenna scan) the decay averages 41 percent of full voltage. Since a 6 dB difference in video target brightness should be resolvable by trained subjects, the moving target trail error (Ev ) will be considered to be 22 feet. The video percent.
decay time of the tubes in stock were found to vary by as much as 100
Assuming that error expected
the nose in normal
and tail of the moving tasystem operation (DEU on)
rget are will be:
visible, the cumulative
Enos e = Es - Er + Et
= 21 feet - 11 feet + 22 feet = -10 feet
.. -21 feet - 11 feet - 22 feet - 22 feet = -76 feet
These results agree with the time distribution of the test data 1.n tables 10 and 11 of the report.
B-2

APPENDIX C
SUBJECT CONTROLLER QUESTIONNAIRE ASDE-3
1. Have you regularly worked an operational position at which ASDE was available?
yes-- no--
Go Go
to to
section 2. section 3.
~ 2. ASDE-2/ASDE-3'Comparison
2a. Compare the over-all operational usefulness of ASDE-3 versus ASDE-2.
large improvement slight improvement same not as good
Go
Go
to
to
question 2c.
question 2b.
2b. Why? _
2c. Consider individual
Display crispness
Flicker free display
Display clutter
functions or parts of the ASDE-3 versus ASDE-2.
much slightly not as better better same good*
Affect of ambient light
Target detection
Target resolution
Displayed target position accuracy
Runway presentation without DEU
*For each check in the "not as good" column, please explain your opinion fully on the back of this page.
C-I

------------------------
------
------------------
3. Unit Controls and Indicators.
In this section we will be considering the various controls and indicators of the ASDE-3 as they affect you, the controller, in an operational setting.
Please rate each with one of the following:
1. Fine as is 2. Needs improvement. Please comment on the back of this 3. Totally unacceptable. page if answer is #2 or #3. 4. Not needed during test.
Display Control Unit - map Display Control Unit background Display Control Unit threshol9 TV Display Control - brightness TV Display Control contrast TV Display Control video TV Display Control composite DEU - background video DEU - map line intensity----- DEU - threshold setting DEU - range offset
___ DEU - range control DEU - brightness
--- DEU - contrast DEU - analog scan erase DEU - set presentation selector Radar Control Unit - T/R control indicator Radar Control Unit - radome heat Radar Control Unit - antenna drive Radar Control Unit - radar power
4. Operational Usefulness circle one
4a. I can see (much, some, little, no) use for the ASDE-3 at my site.
4b. Operationally the best aspect of the ASDE-3 are (in order of importance):
4c. Operationally the worst aspects of the ASDE-3 are (in order of importance):
..
C-2
---
4d. Essential improvements needed by the ASED-3 are (in order of importance):
4e. Other improvements needed are:
5. Comparison to Air Traffic Service's Requirements.
In its present state, the ASDE-3 conforms to the Air Traffic Service's requirements:
___ completely.
except as follows:
We appreciate your cQoperation and your considerable contribution towards the success of this project. Any further comments you may have will be appreciated and may be placed on the back of this page.
C-3