# ##@ 6 #1...* . - 2 , *--9-, 2 - *9 ) &( )/ 3(% *9 ) ' *)4* * 2 - *9 ) & ,, 2 ,,...
TRANSCRIPT

UNITED STATES SECURITIES AND EXCHANGE COMMISSIONWashington, D.C. 20549
Form 20-FANNUAL REPORT PURSUANT TO SECTION 13 OR 15(d)
OF THE SECURITIES EXCHANGE ACT OF 1934For the fiscal year ended December 31, 2017
Commission file number 001-32575
Royal Dutch Shell plc(Exact name of registrant as specified in its charter)
England and Wales(Jurisdiction of incorporation or organisation)
Carel van Bylandtlaan 30, 2596 HR, The Hague, The NetherlandsTel. no: 011 31 70 377 9111
[email protected](Address of principal executive offices)
Securities registered pursuant to Section 12(b) of the Act
Title of Each Class Name of Each Exchange on Which RegisteredAmerican Depositary Shares representing two A ordinary sharesof the issuer with a nominal value of €0.07 each
New York Stock Exchange
American Depositary Shares representing two B ordinary sharesof the issuer with a nominal value of €0.07 each
New York Stock Exchange
1.625% Guaranteed Notes due 2018 New York Stock Exchange1.9% Guaranteed Notes due 2018 New York Stock Exchange2.0% Guaranteed Notes due 2018 New York Stock ExchangeFloating Rate Guaranteed Notes due 2018 New York Stock Exchange1.375% Guaranteed Notes due May 2019 New York Stock Exchange1.375% Guaranteed Notes due September 2019 New York Stock Exchange4.3% Guaranteed Notes due 2019 New York Stock ExchangeFloating Rate Guaranteed Notes due 2019 New York Stock Exchange2.125% Guaranteed Notes due 2020 New York Stock Exchange2.25% Guaranteed Notes due 2020 New York Stock Exchange4.375% Guaranteed Notes due 2020 New York Stock ExchangeFloating Rate Guaranteed Notes due 2020 New York Stock Exchange1.75% Guaranteed Notes due 2021 New York Stock Exchange1.875% Guaranteed Notes due 2021 New York Stock Exchange2.375% Guaranteed Notes due 2022 New York Stock Exchange2.25% Guaranteed Notes due 2023 New York Stock Exchange3.4% Guaranteed Notes due 2023 New York Stock Exchange3.25% Guaranteed Notes due 2025 New York Stock Exchange2.5% Guaranteed Notes due 2026 New York Stock Exchange2.875% Guaranteed Notes due 2026 New York Stock Exchange4.125% Guaranteed Notes due 2035 New York Stock Exchange6.375% Guaranteed Notes due 2038 New York Stock Exchange5.5% Guaranteed Notes due 2040 New York Stock Exchange3.625% Guaranteed Notes due 2042 New York Stock Exchange4.55% Guaranteed Notes due 2043 New York Stock Exchange4.375% Guaranteed Notes due 2045 New York Stock Exchange3.75% Guaranteed Notes due 2046 New York Stock Exchange4.00% Guaranteed Notes due 2046 New York Stock Exchange
Securities registered pursuant to Section 12(g) of the Act: noneSecurities for which there is a reporting obligation pursuant to Section 15(d) of the Act: none
Indicate the number of outstanding shares of each of the issuer’s classes of capital or common stock as of the close of the period covered by the annual report.Outstanding as of December 31, 2017:4,570,138,647 A ordinary shares with a nominal value of €0.07 each.3,742,624,272 B ordinary shares with a nominal value of €0.07 each.
Indicate by check mark if the registrant is a well-known seasoned issuer, as defined in Rule 405 of the Securities Act. ☑ Yes ☐ NoIf this report is an annual or transition report, indicate by check mark if the registrant is not required to file reports pursuant to Section 13 or 15(d) of the Securities ExchangeAct of 1934. ☐ Yes ☑ NoIndicate by check mark whether the registrant (1) has filed all reports required to be filed by Section 13 or 15(d) of the Securities Exchange Act of 1934 during the preceding12 months (or for such shorter period that the registrant was required to file such reports), and (2) has been subject to such filing requirements for the past 90 days. ☑ Yes ☐ NoIndicate by check mark whether the registrant has submitted electronically and posted on its corporate website, if any, every Interactive Data File required to be submitted andposted pursuant to Rule 405 of Regulation S-T (§232.405 of this chapter) during the preceding 12 months (or for such shorter period that the registrant was required tosubmit and post such files). ☑ Yes ☐ NoIndicate by check mark whether the registrant is a large accelerated filer, an accelerated filer, a non-accelerated filer, or an emerging growth company.See definition of “large accelerated filer,” “accelerated filer,” and “emerging growth company” in Rule 12b-2 of the Exchange Act.
Large accelerated filer ☑ Accelerated filer ☐ Non-accelerated filer ☐ Emerging growth company ☐
If an emerging growth company that prepares its financial statements in accordance with U.S. GAAP, indicate by check mark if the registrant has elected not to use theextended transition period for complying with any new or revised financial accounting standards† provided pursuant to Section 13(a) of the Exchange Act. ☐ † The term “new or revised financial accounting standards” refers to any update issued by the Financial Accounting Standards Board to its Accounting StandardsCodification after April 5, 2012. Indicate by check mark which basis of accounting the registrant has used to prepare the financial statements included in this filing: U.S. GAAP ☐ International Financial Reporting Standards as issued by the International Accounting Standards Board. ☑ Other ☐ If “Other” has been checked in response to the previous question, indicate by check mark which financial statement item the registrant has elected to follow. Item 17 ☐ Item 18 ☐ If this is an annual report, indicate by check mark whether the registrant is a shell company (as defined in Rule 12b-2 of the Exchange Act). ☐ Yes ☑ NoCopies of notices and communications from the Securities and Exchange Commission should be sent to:Royal Dutch Shell plcCarel van Bylandtlaan 302596 HR, The Hague, The NetherlandsAttn: Linda M. Szymanski


Contents
01
118
INTRODUCTION
FINANCIAL STATEMENTSAND SUPPLEMENTS
01 Form 20-F 02 Cross reference to Form 20-F 118 Independent Auditors’ Reports related to
the Consolidated and Parent CompanyFinancial Statements
04 Terms and abbreviations 05 About this Report
06
137 Consolidated Financial Statements 179 Supplementary information – oil and gas
(unaudited)
STRATEGIC REPORT
199 Parent Company Financial Statements 06 Chair’s message 208 Independent Auditors’ Reports related to
the Royal Dutch Shell Dividend AccessTrust Financial Statements
07 Chief Executive Officer’s review
08 Strategy and outlook
10 Business overview 213 Royal Dutch Shell Dividend Access TrustFinancial Statements
12 Risk factors
17 Market overview
21719 Summary of results 22 Performance indicators 24 Integrated Gas ADDITIONAL INFORMATION
31 Upstream
217 Shareholder information
38 Oil and gas information 224 Section 13(r) of the US Securities ExchangeAct of 1934 disclosure
46 Downstream 53 Corporate 225 Non-GAAP measures reconciliations 54 Liquidity and capital resources 227 Index to the Exhibits 58 Environment and society 228 Signatures 62 Climate change and energy transition E1 Exhibits 67 Our people
69
GOVERNANCE
Cover image 69 The Board of Royal Dutch Shell plc 72 Senior Management
The fingerprint reflects how people arecentral to powering progress with more andcleaner energy, from our retail sites to ouroffshore operations.
73 Directors’ Report 76 Corporate governance 90 Audit Committee Report 94 Directors’ Remuneration Report
Cover Claire ConceptDesign Conran Design GroupTypesetting Donnelley Financial SolutionsPrinter Damen Drukkers under ISO 14001

Cross reference to Form 20-F
Part I PagesItem 1. Identity of Directors, Senior Management and Advisers N/AItem 2. Offer Statistics and Expected Timetable N/AItem 3. Key Information
A. Selected financial data 21, 219 B. Capitalisation and indebtedness N/A C. Reasons for the offer and use of proceeds N/A D. Risk factors 12-16
Item 4. Information on the Company A. History and development of the company 08, 10, 19-20, 24-37, 46-49, 55-57, 217, 225-226 B. Business overview 08-21, 24-53, 58-61, 179-198, 224 C. Organisational structure 10, E2-E20 D. Property, plant and equipment 08-09, 12-16, 19-20, 24-52, 58-61, 179-198
Item 4A. Unresolved Staff Comments N/AItem 5. Operating and Financial Review and Prospects
A. Operating results 12-16, 19-53, 166-172 B. Liquidity and capital resources 08-09, 19-21, 24-25, 31-33, 46-48, 53-58, 146-148, 156-159, 163-172 C. Research and development, patents and licences, etc. 11 D. Trend information 08-09, 12-16, 17-23, 24-29, 31-37, 46-49, 53, 62-66 E. Off-balance sheet arrangements 57 F. Tabular disclosure of contractual obligations 57 G. Safe harbour 57
Item 6. Directors, Senior Management and Employees A. Directors and senior management 69-72, 77-81 B. Compensation 97-108 C. Board practices 69-72, 76-83, 90-93, 97, 107-108, 114-116 D. Employees 67, 176 E. Share ownership 68, 80, 94-117, 172-173, 217
Item 7. Major Shareholders and Related Party Transactions A. Major shareholders 218 B. Related party transactions 74, 145, 155, 177, 216 C. Interests of experts and counsel N/A
Item 8. Financial Information A. Consolidated Statements and Other Financial Information 54-57, 135-178, 210-216 B. Significant changes 75
Item 9. The Offer and Listing A. Offer and listing details 220 B. Plan of distribution N/A C. Markets 217 D. Selling shareholders N/A E. Dilution N/A F. Expenses of the issue N/A
Item 10. Additional Information A. Share capital N/A B. Memorandum and articles of association 83-89 C. Material contracts N/A D. Exchange controls 222 E. Taxation 222-223 F. Dividends and paying agents N/A G. Statement by experts N/A H. Documents on display 5 I. Subsidiary information N/A
Item 11. Quantitative and Qualitative Disclosures About Market Risk 54, 156, 166-172
INTRODUCTION SHELL ANNUAL REPORT AND FORM 20-F 2017 02

Part I PagesItem 12. Description of Securities Other than Equity Securities
A. Debt Securities N/A B. Warrants and Rights N/A C. Other Securities N/A D. American Depositary Shares 217, 221-222
Part II Item 13. Defaults, Dividend Arrearages and Delinquencies N/AItem 14. Material Modifications to the Rights of Security Holders and Use of Proceeds N/AItem 15. Controls and Procedures 82-83, 135, 210-211, E21-E22Item 16. [Reserved] Item 16A. Audit committee financial expert 76-78, 90Item 16B. Code of Ethics 77Item 16C. Principal Accountant Fees and Services 93, 177, 216Item 16D. Exemptions from the Listing Standards for Audit Committees 77Item 16E. Purchases of Equity Securities by the Issuer and Affiliated Purchasers 56, 80Item 16F. Change in Registrant’s Certifying Accountant N/AItem 16G. Corporate Governance 76-77Item 16H. Mine Safety Disclosure N/A Part III Item 17. Financial Statements N/AItem 18. Financial Statements 135-178, 210-216Item 19. Exhibits 227, E1-E27
INTRODUCTION SHELL ANNUAL REPORT AND FORM 20-F 2017 03

Currencies$ US dollar€ euro£ sterling
Units of measurementacre approximately 0.004 square kilometresb(/d) barrels (per day)boe(/d) barrels of oil equivalent (per day); natural gas volumes are
converted into oil equivalent using a factor of 5,800 scf per barrelkboe(/d) thousand barrels of oil equivalent (per day); natural gas volumes are
converted into oil equivalent using a factor of 5,800 scf per barrelMMBtu million British thermal unitsmtpa million tonnes per annumper day volumes are converted into a daily basis using a calendar yearscf(/d) standard cubic feet (per day)
ProductsGTL gas to liquidsLNG liquefied natural gasLPG liquefied petroleum gasNGL natural gas liquids
MiscellaneousADS American Depositary ShareAGM Annual General MeetingAPI American Petroleum InstituteCCS carbon capture and storageCCS earnings earnings on a current cost of supplies basisCO2 carbon dioxideEMTN Euro medium-term noteEPS earnings per shareFCF free cash flowGAAP generally accepted accounting principlesGHG greenhouse gasHSSE health, safety, security and environmentIAS International Accounting StandardIEA International Energy AgencyIFRS International Financial Reporting Standard(s)IOGP International Association of Oil & Gas ProducersIPIECA International Petroleum Industry Environmental Conservation
Association (global oil and gas industry association forenvironmental and social issues)
LTIP Long-term Incentive PlanOECD Organisation for Economic Co-operation and DevelopmentOML oil mining leaseOPEC Organization of the Petroleum Exporting CountriesOPL oil prospecting licencePSC production-sharing contractPSP Performance Share PlanREMCO Remuneration CommitteeSEC US Securities and Exchange CommissionTRCF total recordable case frequencyTSR total shareholder returnWTI West Texas Intermediate
Terms and abbreviations
INTRODUCTION SHELL ANNUAL REPORT AND FORM 20-F 2017 04

The Royal Dutch Shell plc Annual Report and Form 20-F (this Report) serves as theAnnual Report and Accounts in accordance with UK requirements and as the AnnualReport on Form 20-F as filed with the US Securities and Exchange Commission (SEC) forthe year ended December 31, 2017, for Royal Dutch Shell plc (the Company) and itssubsidiaries (collectively referred to as Shell). This Report presents the ConsolidatedFinancial Statements of Shell (pages 137-178), the Parent Company Financial Statementsof Shell (pages 199-207) and the Financial Statements of the Royal Dutch Shell DividendAccess Trust (pages 213-216). Cross references to Form 20-F are set out on pages 02-03of this Report. Financial reporting terms used in this Report are in accordance with InternationalFinancial Reporting Standards (IFRS). The Consolidated Financial Statements comprisethe financial statements of the Company and its subsidiaries. “Subsidiaries” and “Shellsubsidiaries” refer to those entities over which the Company has control, either directly orindirectly. Entities and unincorporated arrangements over which Shell has joint controlare generally referred to as “joint ventures” and “joint operations” respectively, andentities over which Shell has significant influence but neither control nor joint control arereferred to as “associates”. “Joint ventures” and “joint operations” are collectively referredto as “joint arrangements”. In addition to the term “Shell”, in this Report “we”, “us” and “our” are also used to referto the Company and its subsidiaries in general or to those who work for them. Theseterms are also used where no useful purpose is served by identifying the particular entityor entities. The term “Shell interest” is used for convenience to indicate the direct and/orindirect ownership interest held by Shell in an entity or unincorporated joint arrangement.The companies in which Royal Dutch Shell plc has a direct or indirect interest are separatelegal entities. Shell subsidiaries’ data include their interests in joint operations. We also refer to “Shell’s net carbon footprint” in this Report. This includes Shell’s carbonemissions from the production of our energy products, our suppliers’ carbon emissions insupplying energy for that production, and our customers’ carbon emissions associatedwith their use of the energy products we sell. Shell only controls its own emissions but, tosupport society in achieving the Paris Agreement goals, we aim to help and influencesuch suppliers and consumers to likewise lower theirs. The use of the terminology“Shell’s net carbon footprint” is for convenience only and not intended to suggest theseemissions are those of Shell or its subsidiaries. Except where indicated, the figures shown in the tables in this Report are in respect ofsubsidiaries only, without deduction of any non-controlling interest. However, the term“Shell share” is used for convenience to refer to the volumes of hydrocarbons that areproduced, processed or sold through subsidiaries, joint ventures and associates. All of asubsidiary’s production, processing or sales volumes (including the share of jointoperations) are included in the Shell share, even if Shell owns less than 100% of thesubsidiary. In the case of joint ventures and associates, however, Shell-share figures arelimited only to Shell’s entitlement. In all cases, royalty payments in kind are deductedfrom the Shell share. The financial statements contained in this Report have been prepared in accordance withthe provisions of the Companies Act 2006 and with IFRS as adopted by the EuropeanUnion. As applied to the financial statements, there are no material differences from IFRSas issued by the International Accounting Standards Board (IASB); therefore, thefinancial statements have been prepared in accordance with IFRS as issued by the IASB.IFRS as defined above includes interpretations issued by the IFRS InterpretationsCommittee. Except where indicated, the figures shown in this Report are stated in US dollars. As usedherein all references to “dollars” or “$” are to the US currency.
This Report contains forward-looking statements (within the meaning of the US PrivateSecurities Litigation Reform Act of 1995) concerning the financial condition, results ofoperations and businesses of Shell. All statements other than statements of historical factare, or may be deemed to be, forward-looking statements. Forward-looking statementsare statements of future expectations that are based on management’s current expectationsand assumptions and involve known and unknown risks and uncertainties that couldcause actual results, performance or events to differ materially from those expressed orimplied in these statements. Forward-looking statements include, among other things,statements concerning the potential exposure of Shell to market risks and statementsexpressing management’s expectations, beliefs, estimates, forecasts, projections andassumptions. These forward-looking statements are identified by their use of terms andphrases such as “aim”, “ambition”, “anticipate”, “believe”, “could”, “estimate”, “expect”,“goals”, “intend”, “may”, “objectives”, “outlook”, “plan”, “probably”, “project”, “risks”,“schedule”, “seek”, “should”, “target”, “will” and similar terms and phrases. There are anumber of factors that could affect the future operations of Shell and could cause thoseresults to differ materially from those expressed in the forward-looking statementsincluded in this Report, including (without limitation): (a) price fluctuations in crude oiland natural gas; (b) changes in demand for Shell’s products; (c) currency fluctuations;(d) drilling and production results; (e) reserves estimates; (f) loss of market share andindustry competition; (g) environmental and physical risks; (h) risks associated with theidentification of suitable potential acquisition properties and targets, and successfulnegotiation and completion of such transactions; (i) the risk of doing business indeveloping countries and countries subject to international sanctions; (j) legislative, fiscaland regulatory developments including regulatory measures addressing climate change;(k) economic and financial market conditions in various countries and regions;(l) political risks, including the risks of expropriation and renegotiation of the terms ofcontracts with governmental entities, delays or advancements in the approval of projectsand delays in the reimbursement for shared costs; and (m) changes in trading conditions.Also see “Risk factors” on pages 12-16 for additional risks and further discussion. Noassurance is provided that future dividend payments will match or exceed previousdividend payments. All forward-looking statements contained in this Report are expresslyqualified in their entirety by the cautionary statements contained or referred to in thissection. Readers should not place undue reliance on forward-looking statements. Eachforward-looking statement speaks only as of the date of this Report. Neither the Companynor any of its subsidiaries undertake any obligation to publicly update or revise anyforward-looking statement as a result of new information, future events or otherinformation. In light of these risks, results could differ materially from those stated,implied or inferred from the forward-looking statements contained in this Report. This Report contains references to Shell’s website and to the Shell Sustainability Report.These references are for the readers’ convenience only. Shell is not incorporating byreference any information posted on www.shell.com or in the Shell Sustainability Report. DOCUMENTS ON DISPLAYDocuments concerning the Company, or its predecessors for reporting purposes, whichare referred to in this Report, have been filed with the SEC and may be examined andcopied at the public reference facility maintained by the SEC at 100 F Street, N.E.,Room 1580, Washington, DC 20549, USA. For further information on the operationof the public reference room and the copy charges, call the SEC at 1-800-SEC-0330. Allof the SEC filings made electronically by Shell are available to the public on the SECwebsite at www.sec.gov (commission file number 001-32575). This Report is alsoavailable, free of charge, at www.shell.com/annualreport or at the offices of Shell in TheHague, the Netherlands and London, United Kingdom. Copies of this Report also may beobtained, free of charge, by mail.
About this Report
INTRODUCTION SHELL ANNUAL REPORT AND FORM 20-F 2017 05

I would like to take this opportunity to thank everyone who contributed to Shell’s strongbusiness performance in 2017, including our customers, partners and staff. The successfulintegration of BG’s business into our portfolio during 2016, combined with ongoingefforts to reduce costs and debt, are helping to reshape Shell into a world-classinvestment. In his review, our Chief Executive Officer Ben van Beurden outlines our performanceand how this is creating value for shareholders. I would like to talk about how we are alsoworking to thrive in the energy transition, while continuing to contribute to society. The challenge facing global society is clear: more than 1 billion people in the developingworld today still live without the full benefits that energy can provide. Many hundreds ofmillions more will need energy in the future. Bringing the benefits of energy to everyoneon the planet, while managing the risks of climate change, will require fundamentalchanges in the way energy is produced and used around the world. As Mahatma Gandhi is often quoted as saying, “The future depends on what you dotoday.” Shell is working today to make a better future. In a step that demonstrates ourdetermination to play our part in a cleaner energy future, we announced an ambition,pegged to society’s progress, to reduce the net carbon footprint of our operations and ofour customers’ emissions from using our products. As part of our drive to help power progress with more and cleaner energy solutions, wewill offer customers more low-carbon products and services, such as lower-carbon fuelsfor drivers and low-carbon energy for homes and businesses. Expanding our power supply business, including investments in electric vehicle chargingsystems, will help us to deliver cleaner energy while other parts of our business work tomeet rising global demand for key products such as natural gas, the cleanest-burninghydrocarbon. Powering an increasing variety of human activities with electricity can help to reduceemissions while providing energy to more people. To reduce emissions, this long-termelectrification of the economy will require a combination of renewables and more naturalgas in place of coal. However, electricity is unlikely to replace oil or natural gas in some key parts of theeconomy, such as in heavy road transport, aviation and shipping. This means the worldwill need large quantities of oil and natural gas for decades to come. At the same time,production from many oil and gas fields is declining and continued investment is neededto develop new resources. Oil and gas will remain central to our business for many years. We are increasingly active in wind and solar power. But today, the greatest contributionShell can make to providing more and cleaner energy is to deliver more natural gas. Gasis expected to play an increasingly important part in global energy supply over the nextfew decades as more communities seek cleaner alternatives to coal. Using natural gas for power generation or as a cleaner fuel for transport, for example, canplay a critical role in tackling climate change. But emissions of its chief component,methane, a potent greenhouse gas, must be reduced. Shell and seven other major naturalgas producers announced plans in November to further reduce methane emissions fromassets they operate. But business alone cannot drive the wider and more profound changes required acrossglobal society. Governments around the world need to accelerate change by establishingpolicies that encourage businesses to do more to overcome the challenges ahead.Governments need to introduce
policies that reshape several sectors of the economy and enable the development oflower-carbon and renewable sources of energy, supported by technologies such as carboncapture and storage. One of the most effective ways of doing this are government-led carbon pricingmechanisms. Any such framework for incentivising the multitrillion-dollar investmentsthat will be needed to combat climate change must have strong global support. Societywill be able to achieve much more once effective government-led carbon pricing systemsare in place. As the future depends on what we all do today, Shell is already working to ensure itslong-term business relevance by playing an active role in the energy transition. The quality and diversity of our people are vital to the success of our approach. In 2017,we welcomed two more women to the Board. Today, we agreed to seek shareholderapproval for the appointment of Ann Godbehere at the Annual General Meeting (AGM)to be held in May. If approved by shareholders, five women and six men will sit on theBoard before this year is over. I would like to thank Hans Wijers, who will not be standing for reappointment at theAGM, for his nine years of outstanding contributions to the Board, including service asSenior Independent Director, Chair of the Remuneration Committee and Chair of theCorporate and Social Responsibility Committee. It is a real honour to serve as Chair of your Board as we continue to work to make afuture that is better for all.
Chad HollidayChair
Strategic ReportChair’s message: Powering progress together
STRATEGIC REPORT SHELL ANNUAL REPORT AND FORM 20-F 2017 06

Shell delivered a strong financial performance in 2017. We are making good progresstowards building a world-class investment case. Higher oil and gas prices, combined with our relentless focus on performance andcompetitiveness, enabled us to increase our operating cash flow. We also further reshapedand refined our portfolio through our divestment programme. These factors helped toreduce debt and strengthen our financial framework. We continue to closely control costsand investment levels, working to improve our capital efficiency while improving thequality of our portfolio through asset sales and new projects. There was a terrible incident in Pakistan in June when a contractor road tanker overturnedwhile transporting fuel from a Shell depot, following which there was a spill thatsubsequently ignited. Tragically, the fire caused more than 200 fatalities. Sadly, acontractor also died in a road accident in Canada and we had a fatality in Nigeria. Theseincidents underscore the need for all Shell contractors, suppliers and employees to adhereto effective health and safety standards at all times. Any incident is one incident too manyand we must reflect deeply on these events. We must redouble our focus on safety. RESULTSIncome for the period was $13.4 billion in 2017 compared with $4.8 billion in 2016.Earnings on a current cost of supplies basis were $12.5 billion, compared with $3.7billion in 2016. A rise in crude oil and natural gas prices supported Upstream and Integrated Gasearnings. Our Downstream earnings benefited from improved refining and chemicalsindustry conditions. We distributed $15.6 billion to shareholders in dividends in 2017, including those takenas shares under our Scrip Dividend Programme. The strength of our balance sheet,coupled with strong cash flows and continuing focus on capital efficiency, allowed us tocancel the Scrip Dividend Programme with effect from the fourth quarter 2017 dividend.I am confident that we can do this while investing at levels that maintain growth in ourportfolio. At Management Day in November, we confirmed our intention to undertake a sharebuyback programme of at least $25 billion in the period 2017 to 2020, subject toprogress with debt reduction and a recovery in oil prices. We also raised our outlook forannual free cash flow to between $30 billion and $35 billion by 2020, at a Brent crude oilprice of $60 a barrel (real terms 2016). This is $5 billion more than the outlook range wegave in June 2016. This includes the impact of acquisitions and proceeds fromdivestments, while excluding free cash flow from assets after planned divestments. Our delivery of new projects continues and we remain on track to deliver 1 millionbarrels of oil equivalent a day (boe/d) from new projects between 2014 and 2018.Overall, our production averaged 3.7 million boe/d in 2017, in line with 2016, withproduction from new fields offsetting the impact of field declines and divestments. Our $30 billion divestment programme for 2016-18 made good progress in 2017.Divestments included oil sands interests in Canada, onshore upstream operations inGabon, a number of assets in the UK North Sea, and our shares in Woodside in Australia.Other divestments included our interest in a petrochemicals joint venture in Saudi Arabiaand the separation of assets of the Motiva joint venture in the USA. This streamlining of our portfolio is part of our ongoing effort to raise efficiency throughreduced costs and concentrating on our most competitive businesses.
The progress of our divestments has helped us to reduce net debt, with gearing standingat 24.8% at the end of 2017, down from 28.0% at the end of 2016. Debt reductionremains a priority and after this programme is completed we expect to continuedivestments at an average rate of more than $5 billion a year until at least 2020. Capital investment in 2017 was $24 billion. That is lower than the $25 billion outlook wehave given and reflects continued capital discipline and capital efficiency improvements.We will continue to carefully control our investment levels. We expect our annual organiccapital investment to remain between $25 billion and $30 billion until 2020. But we see$30 billion as a ceiling, even if oil prices rise, while $25 billion is not a floor – we maygo below this. We maintain a “lower forever” approach to our cost management, with an outlook of lessthan $38 billion a year for operating expenses until at least 2020, assuming no portfolioimpacts or other external effects. This outlook excludes potential impacts of restructuringand redundancies, as well as certain other provisions. ENERGY FUTUREOver the next few decades, we plan to show leadership in the oil and gas industry, whileresponding to society’s need for more and cleaner energy as the world moves to a low-carbon energy system. Tackling climate change is a multi-generational challenge for society – includingbusinesses, governments and consumers. As the global population grows and livingstandards rise, it will mean society meeting increasing energy demand with an ever-lowercarbon footprint. We will play our part. In November, we announced a net carbon footprint reduction ambition covering not justemissions from our own operations but also those produced by customers when they usethe energy products we sell. We plan to do this in step with society’s drive to align withthe Paris climate agreement. We aim to reduce the overall footprint of our energyproducts by around 20% by 2035 and by around half by 2050. This measure will bereviewed every five years to ensure progress is in line with wider society’s progresstowards the reductions required to meet the Paris goals.
Our New Energies unit, which we created in 2016, invested in commercial opportunitieslinked to the energy transition in 2017. We acquired NewMotion, one of Europe’s largestelectric vehicle charging providers, in October. And, in December, we agreed to buy FirstUtility, a household energy provider in the UK. We expect our capital investment in New Energies to be $1 billion to $2 billion a year, onaverage, until 2020. We will continue to target opportunities in new fuels and power, twoareas where we can effectively apply our Downstream and Integrated Gas expertise. Such steps, combined with the strategy and strength of our portfolio that underpins them,will help deepen Shell’s financial resilience and competitiveness, helping to ensure ourlong-term business relevance during the energy transition.
In a changing energy landscape, we will continue our focus on delivering strongshareholder returns and cash as we progress confidently along the path to becoming –and remaining – a world-class investment.
Ben van BeurdenChief Executive Officer
Chief Executive Officer’s review:Building a world-class investment case
STRATEGIC REPORT SHELL ANNUAL REPORT AND FORM 20-F 2017 07

STRATEGYShell’s purpose is to power progress together with more and cleaner energy solutions.Our strategy is to strengthen our position as a leading energy company by providing oiland gas and low-carbon energy as the world’s energy system changes. Safety and socialresponsibility are fundamental to our business approach. Shell will only succeed byworking with customers, governments, business partners, investors and otherstakeholders. Our strategy is founded on our outlook for the energy sector and the chance to grasp theopportunities arising from the substantial changes in the world around us. The risingstandard of living of a growing global population is likely to continue to drive demandfor energy, including oil and gas, for years to come. At the same time, technologychanges and the need to tackle climate change means there is a transition under way to alower-carbon, multi-source energy system with increasing customer choice. We recognisethat the pace and specific path forward is uncertain and so requires agile decision making. STRATEGIC AMBITIONSAgainst this backdrop, we have the following strategic ambitions to guide us in pursuingour purpose: ■ to provide a world-class investment case. This involves growing free cash flow and
increasing returns, all built upon a strong financial framework and resilient portfolio;■ to thrive in the energy transition by responding to society’s desire for more and
cleaner, convenient and competitive energy; and■ to sustain a strong societal licence to operate and contribute to society through a shared
value approach to our activities. The execution of our strategy is founded on becoming a more customer-centric andsimpler company, focused on delivering higher and more predictable returns andgrowing free cash flow. By investing in competitive projects, driving down costs andselling non-core businesses, Shell continues to seek to reshape its portfolio into a moreresilient and focused company. Our ability to achieve our strategic ambitions depends on how we respond to competitiveforces. We continuously assess the external environment – the markets as well as theunderlying economic, political, social and environmental drivers that shape them – toevaluate changes in competitive forces and business models. We undertake regularreviews of the markets we operate in and analyse our traditional and non-traditionalcompetitors’ strengths and weaknesses to understand our competitive position. Wemaintain business strategies and plans that focus on actions and capabilities to create andsustain competitive advantage. We maintain a risk management framework that regularlyassesses our response to, and risk appetite for, identified risk factors (see “Risk factors” onpage 12). STRATEGIC THEMESAs part of our strategy, we divide our portfolio into strategic themes, each with distinctivecapabilities, growth strategies, risk management, capital allocation and expected returns: ■ Cash engines are strategic themes that are expected to provide strong and resilient
returns and free cash flow, funding shareholder returns and strengthening the balancesheet. Shell continues to invest in selective growth opportunities for cash engines. Ourcash engines are Conventional Oil and Gas in Upstream, Integrated Gas, and OilProducts in Downstream.
■ Growth priorities are the cash engines of the future. Shell seeks to invest in affordablegrowth in advantaged positions with a pathway to free cash flow and returns in the nearfuture. Our growth priorities currently are Deep water in Upstream and Chemicals inDownstream.
■ Emerging opportunities are strategic themes that are expected to become growthpriorities after further development. These opportunities should provide us withmaterial growth in free cash flow in the next decade or beyond. We seek to manage ourexposure to these businesses while establishing scale. Our emerging opportunitiescurrently are Shales in Upstream and New Energies, which is part of the Integrated Gasand New Energies organisation.
For more details on how the strategic themes are embedded into our businesses, see“Business Overview” on page 11. Our intention is to have an advantaged and resilient position in each strategic theme todrive an optimal free cash flow and returns profile over multiple timelines. When we setour plans and goals, we do so on the basis of delivering sustained returns over decades.
We aim to leverage our diverse global business portfolio and customer-focusedbusinesses, which have been built around the strength of the Shell brand. Our Executive Directors’ remuneration is linked to the successful delivery of our strategy,based on performance indicators that are aligned with shareholder interests. Long-termincentives form the majority of the Executive Directors’ remuneration for above-targetperformance. Our Long-term Incentive Plan includes cash generation, capital discipline,and value created for shareholders. See the “Directors’ Remuneration Report” on page112. OUTLOOK FOR 2018 AND BEYONDWe continuously seek to improve our operating performance, with an emphasis onhealth, safety, security, environment and asset performance. In order to maximise sustainable free cash flows, we will also continue to manageoperating expenses, capital investment, divestments and delivery of new projects. We maintain a “lower forever” mindset in our cost management, with an outlook of lessthan $38 billion a year for operating expenses until 2020, assuming no portfolio impactsor other external effects. This outlook excludes potential impacts of restructuring andredundancies, as well as certain other provisions. Our organic capital investment outlook remains between $25 billion and $30 billion ayear until 2020. We see $30 billion as a ceiling, even in a high oil price environment. For2018, we expect to maintain capital investment in the lower part of this range.
We will continue delivering our 2016-18 divestment programme of $30 billion. This is astrategic value-driven, not a time-driven, programme and an integral element of Shell’sportfolio improvement plan. We believe we have already significantly high-graded ourportfolio and will continue with an annual average outlook of at least $5 billion ofdivestments over the period 2019 to 2020. We remain on track to deliver new projects particularly in Brazil, the USA and Australiabetween 2014 and 2018, which we believe will add 1 million barrels of oil equivalent aday, or $10 billion of cash flow from operations at $60 per barrel by 2018. New projectstart-ups and ramp-ups are expected to generate an additional $5 billion cash flow fromoperations by 2020, assuming $60 per barrel real terms 2016 and mid-cycle Downstreamindustry conditions. We will remain highly selective on new investment decisionsthroughout 2018 and beyond.
Strategy and outlook
STRATEGIC REPORT SHELL ANNUAL REPORT AND FORM 20-F 2017 08
We fully support the Paris Agreement, and its goal of keeping the rise in globaltemperatures to below two degrees Celsius. After having carefully listened to our critics,supporters and shareholders, in step with society’s drive to align with the ParisAgreement, we have set a long-term ambition to reduce the net carbon footprint of ourenergy products, measured in grams of carbon-dioxide equivalent per megajouleconsumed, by around 20% by 2035 and by around 50% by 2050. This demonstratesleadership in the industry climate change debate. The statements in this “Strategy and outlook” section, including those related to ourgrowth strategies and our expected or potential future cash flow from operations, freecash flow, operating expenses, capital investment, divestments, production and net carbonfootprint are based on management’s current expectations and certain materialassumptions and, accordingly, involve risks and uncertainties that could cause actualresults, performance or events to differ materially from those expressed or implied herein.See “About this Report” on page 05 and “Risk factors” on pages 12-16.
STRATEGIC REPORT SHELL ANNUAL REPORT AND FORM 20-F 2017 09

HISTORYFrom 1907 until 2005, Royal Dutch Petroleum Company and The “Shell” Transport andTrading Company, p.l.c. were the two public parent companies of a group of companiesknown collectively as the “Royal Dutch/Shell Group”. Operating activities wereconducted through the subsidiaries of these parent companies. In 2005, Royal DutchShell plc became the single parent company of Royal Dutch Petroleum Company and ofThe “Shell” Transport and Trading Company, p.l.c., now The Shell Transport andTrading Company Limited. Royal Dutch Shell plc (the Company) is a public limited company registered in Englandand Wales and headquartered in The Hague, the Netherlands. BUSINESS MODELShell is an international energy company with expertise in the exploration, development,production, refining and marketing of oil and natural gas, as well as in the manufacturingand marketing of chemicals. We are one of the world’s largest independent energycompanies in terms of market capitalisation, cash flow from operating activities, andproduction levels. We seek to create shareholder value through the following activities: ■ We explore for crude oil and natural gas worldwide, both in conventional fields and
from sources such as tight rock, shale and coal formations. We work to develop newcrude oil and natural gas supplies from major fields. Also, bitumen extracted from oilsands is converted into synthetic crude oil.
■ We cool natural gas to produce liquefied natural gas (LNG) that can be safely shippedto markets around the world, and we convert gas to liquids (GTL).
■ We have a portfolio of refineries and chemical plants which enables us to capture valuefrom oil and gas production, turning them into a range of refined and petrochemicalproducts which are moved and marketed around the world for domestic, industrial andtransport use. The products we sell include gasoline, diesel, heating oil, aviation fuel,marine fuel, LNG for transport, lubricants, bitumen and sulphur. We also produce andsell ethanol from sugar cane in Brazil, through our Raízen joint venture.
■ We invest in low-carbon energy solutions such as biofuels, hydrogen, wind and solarpower, and in other commercial opportunities linked to the energy transition.
The integration of our businesses is one of our competitive advantages, allowing foroptimisations across our global portfolio. Our key strengths include the development andapplication of innovation and technology, the financial and project management skillsthat allow us to safely develop large and complex projects, the management of integratedvalue chains and the marketing of energy products. The distinctive Shell pecten, atrademark in use since the early part of the 20th century, and trademarks in which theword Shell appears, help raise the profile of our brand globally.
Business overview
STRATEGIC REPORT SHELL ANNUAL REPORT AND FORM 20-F 2017 10

ORGANISATIONWe describe below how our activities are organised. Integrated Gas, Upstream andDownstream focus on our seven strategic themes (see “Strategy and outlook” on page08). Our Projects & Technology organisation manages the delivery of Shell’s majorprojects and drives research and innovation to develop new technology solutions. INTEGRATED GAS (INCLUDING NEW ENERGIES)This organisation covers two strategic themes: Integrated Gas, which is a cash engine; andNew Energies, which is an emerging opportunity. Integrated Gas manages LNG activities and the conversion of natural gas into GTL fuelsand other products. It includes natural gas exploration and extraction, when contractuallylinked to the production and transportation of LNG, and the operation of the upstreamand midstream infrastructure necessary to deliver gas to market. It markets and tradesnatural gas, LNG, crude oil, electricity and carbon-emission rights and also markets andsells LNG as a fuel for heavy-duty vehicles and marine vessels. In New Energies, we are exploring emerging opportunities and are already investing inopportunities where we believe sufficient commercial value is available. We focus on newfuels for transport, such as advanced biofuels, hydrogen and charging for battery-electricvehicles; and power, including from low-carbon sources such as wind and solar as well asnatural gas. UPSTREAMOur Upstream organisation covers three strategic themes: Conventional Oil and Gas,which is a cash engine; Deep water, which is a growth priority; and Shales, which is anemerging opportunity. It manages the exploration for and extraction of crude oil, natural gas and natural gasliquids. It also markets and transports oil and gas, and operates the infrastructurenecessary to deliver them to market. DOWNSTREAMOur Downstream organisation comprises two strategic themes: Oil Products, which is acash engine; and Chemicals, which is a growth priority. It manages different Oil Products and Chemicals activities as part of an integrated valuechain, including trading activities, that turns crude oil and other feedstocks into a range ofproducts which are moved and marketed around the world for domestic, industrial andtransport use. The products we sell include gasoline, diesel, heating oil, aviation fuel,marine fuel, biofuel, lubricants, bitumen and sulphur. In addition, we produce and sellpetrochemicals for industrial use worldwide. Our Downstream organisation also managesOil Sands activities (the extraction of bitumen from mined oil sands and its conversioninto synthetic crude oil). PROJECTS & TECHNOLOGYOur Projects & Technology organisation manages the delivery of our major projects anddrives research and innovation to develop new technology solutions. It provides technicalservices and technology capability for our Integrated Gas, Upstream and Downstreamactivities. It is also responsible for providing functional leadership across Shell in theareas of safety and environment, contracting and procurement, wells activities andgreenhouse gas management. Our future hydrocarbon production depends on the delivery of large and integratedprojects (see “Risk factors” on page 12). Systematic management of lifecycle technicaland non-technical risks is in place for each opportunity, with assurance and controlactivities embedded throughout the project life cycle. We focus on the cost-effectivedelivery of projects through quality commercial agreements, supply-chain management,and construction and engineering productivity through effective planning andsimplification of delivery processes. Development of our employees’ project managementcompetencies is underpinned by project principles, standards and processes. A dedicatedcompetence framework, training, standards and processes exist for various technicaldisciplines. In addition, we provide governance support for our non-Shell-operatedventures or projects.
SEGMENTAL REPORTINGOur reporting segments are Integrated Gas, Upstream, Downstream and Corporate.Upstream combines the operating segments Upstream (managed by our Upstreamorganisation) and Oil Sands (managed by our Downstream organisation), which havesimilar economic characteristics. Integrated Gas, Upstream and Downstream include theirrespective elements of our Projects & Technology organisation. The Corporate segmentcomprises our holdings and treasury organisation, self-insurance activities, andheadquarters and central functions. See Note 4 to the “Consolidated Financial Statements”on pages 149-150.
Revenue by business segment(including inter-segment sales) $ million
2017 2016 2015 Integrated Gas Third parties 32,674 25,282 21,741 Inter-segment 3,978 3,908 4,248 Total 36,652 29,190 25,989 Upstream Third parties 7,723 6,412 6,739 Inter-segment 32,469 26,524 26,824 Total 40,192 32,936 33,563 Downstream Third parties 264,731 201,823 236,384 Inter-segment 4,248 1,727 1,362 Total 268,979 203,550 237,746 Corporate Third parties 51 74 96 Total 51 74 96
Revenue by geographical area(excluding inter-segment sales) $ million
2017 2016 2015 Europe 100,609 81,573 95,223 Asia, Oceania, Africa 114,683 87,635 [A] 95,892 USA 66,854 44,615 [A] 50,666 Other Americas 23,033 19,768 23,179 Total 305,179 233,591 264,960[A] As revised, see Note 4 to the “Consolidated Financial Statements” on page 150. TECHNOLOGY AND INNOVATIONTechnology and innovation are essential to our efforts to meet the world’s energy needsin a competitive way. If we do not develop the right technology, do not have access to itor do not deploy it effectively, this could have a material adverse effect on the delivery ofour strategy and our licence to operate (see “Risk factors” on page 14). We continuouslylook for technologies and innovations of potential relevance to our business. Our ChiefTechnology Officer oversees the development and deployment of new and differentiatingtechnologies and innovations across Shell, seeking to align business and technologyrequirements throughout our technology maturation process. In 2017, research and development expenses were $922 million, compared with $1,014million in 2016, and $1,093 million in 2015. Our main technology centres are in India,the Netherlands and the USA, with other centres in Brazil, China, Germany, Oman andQatar. A strong patent portfolio underlies the technology that we employ in our variousbusinesses. In total, we have around 10,450 granted patents and pending patentapplications.
STRATEGIC REPORT SHELL ANNUAL REPORT AND FORM 20-F 2017 11

The risks discussed below could have a material adverse effect separately, or incombination, on our earnings, cash flows and financial condition. Accordingly,investors should carefully consider these risks.Measures that we use to manage or mitigate our various risks are set out in the relevantsections of this Report, indicated by way of cross references under each risk factor. TheBoard’s responsibility for identifying, evaluating and managing our significant risks isdiscussed in “Corporate governance” on page 82. We are exposed to fluctuating prices of crude oil, natural gas, oil products andchemicals.The prices of crude oil, natural gas, oil products and chemicals are affected by supply anddemand, both globally and regionally. Moreover, prices for oil and gas can moveindependently of each other. Factors that influence supply and demand includeoperational issues, natural disasters, weather, political instability, conflicts, economicconditions and actions by major oil and gas producing countries. Additionally, in a lowoil and gas price environment, we would generate less revenue from our Upstream andIntegrated Gas businesses, and, as a result, parts of those businesses could become lessprofitable, or could incur losses. Additionally, low oil and gas prices have resulted, andcould continue to result, in the debooking of proved oil or gas reserves, if they becomeuneconomic in this type of price environment. Prolonged periods of low oil and gasprices, or rising costs, can result in projects being delayed or cancelled. In addition, assetshave been impaired in the past, and there could be impairments in the future. Low oil andgas prices could also affect our ability to maintain our long-term capital investmentprogramme and dividend payments. Prolonged periods of low oil and gas prices couldaffect the financial, fiscal, legal, political and social stability of countries that relysignificantly on oil and gas revenue. In a high oil and gas price environment, we couldexperience sharp increases in costs, and, under some production-sharing contracts, ourentitlement to proved reserves would be reduced. Higher prices could also reducedemand for our products, which could result in lower profitability, particularly in ourDownstream business. Accordingly, price fluctuations could have a material adverseeffect on our earnings, cash flows and financial condition. See “Market overview” on page 17. Our ability to deliver competitive returns and pursue commercial opportunitiesdepends in part on the accuracy of our price assumptions.We use a range of oil and gas price assumptions, which we review on a periodic basis, toevaluate projects and commercial opportunities. If our assumptions prove to be incorrect,it could have a material adverse effect on our earnings, cash flows and financialcondition. See “Market overview” on page 18. Our ability to achieve strategic objectives depends on how we react to competitiveforces.We face competition in each of our businesses. We seek to differentiate our products;however, many of them are competing in commodity-type markets. Accordingly, failureto manage our costs as well as our operational performance could result in a materialadverse effect on our earnings, cash flows and financial condition. We also compete withstate-owned oil and gas entities with vast access to financial resources. State-ownedentities could be motivated by political or other factors in making their business decisions.Accordingly, when bidding on new leases or projects, we could find ourselves at acompetitive disadvantage as these state-owned entities may not require a competitivereturn. If we are unable to obtain competitive returns when bidding on new leases orprojects, it could have a material adverse effect on our earnings, cash flows and financialcondition. See “Strategy and outlook” on page 08.
We seek to execute divestments in the pursuit of our strategy. We may not be able tosuccessfully divest these assets in line with our strategy.We may not be able to successfully divest assets at acceptable prices or within the timelineenvisaged due to market conditions or credit risk, resulting in increased pressure on ourcash position and potential impairments. We may be held liable for past acts, failures toact or liabilities that are different from those foreseen. We may also face liabilities if apurchaser fails to honour all of its commitments. Accordingly, if we are unable to divestassets at acceptable prices or within our envisaged timeframe, this could have a materialadverse effect on our earnings, cash flows and financial condition. See “Strategy and outlook” on page 08-09. Our future hydrocarbon production depends on the delivery of large and integratedprojects, as well as on our ability to replace proved oil and gas reserves.We face numerous challenges in developing capital projects, especially those which arelarge and integrated. Challenges include uncertain geology, frontier conditions, theexistence and availability of necessary technology and engineering resources, theavailability of skilled labour, the existence of transportation infrastructure, project delays,the expiration of licences and potential cost overruns, as well as technical, fiscal,regulatory, political and other conditions. These challenges are particularly relevant incertain developing and emerging-market countries, in frontier areas and in deep-waterfields, such as off the coast of Brazil. We may fail to assess or manage these and otherrisks properly. Such potential obstacles could impair our delivery of these projects, ourability to fulfil the value potential at the time of the project investment approval, and/orour ability to fulfil related contractual commitments. These could lead to impairments andcould have a material adverse effect on our earnings, cash flows and financial condition. Future oil and gas production will depend on our access to new proved reserves throughexploration, negotiations with governments and other owners of proved reserves andacquisitions, as well as on developing and applying new technologies and recoveryprocesses to existing fields. Failure to replace proved reserves could result in lower futureproduction, potentially having a material adverse effect on our earnings, cash flows andfinancial condition. See “Business overview” on page 11.
Oil and gas production available for sale Million boe [A] 2017 2016 2015
Shell subsidiaries 1,168 1,158 880 Shell share of joint ventures and associates 170 184 198 Total 1,338 1,342 1,078[A] Natural gas volumes are converted into oil equivalent using a factor of 5,800 scf per barrel.
Proved developed and undeveloped oil and gas reserves [A][B] (at December 31) Million boe [C]
2017 2016 2015 Shell subsidiaries 10,177 11,040 9,117 Shell share of joint ventures and associates 2,056 2,208 2,630 Total 12,233 13,248 11,747 Attributable to non-controlling interest in Shell subsidiaries 325 5 8[A] We manage our total proved reserves base without distinguishing between proved reserves from subsidiaries and thosefrom joint ventures and associates.[B] Includes proved reserves associated with future production that will be consumed in operations.[C] Natural gas volumes are converted into oil equivalent using a factor of 5,800 scf per barrel.
Risk factors
STRATEGIC REPORT SHELL ANNUAL REPORT AND FORM 20-F 2017 12

The estimation of proved oil and gas reserves involves subjective judgements based onavailable information and the application of complex rules; therefore, subsequentdownward adjustments are possible.The estimation of proved oil and gas reserves involves subjective judgements anddeterminations based on available geological, technical, contractual and economicinformation. Estimates could change because of new information from production ordrilling activities, or changes in economic factors, including changes in the price of oil orgas and changes in the regulatory policies of host governments, or other events. Estimatescould also be altered by acquisitions and divestments, new discoveries, and extensions ofexisting fields and mines, as well as the application of improved recovery techniques.Published proved oil and gas reserves estimates could also be subject to correction due toerrors in the application of published rules and changes in guidance. Downwardadjustments could indicate lower future production volumes and could also lead toimpairment of assets. This could have a material adverse effect on our earnings, cashflows and financial condition. See “Supplementary information – oil and gas (unaudited)” on page 179. Rising climate change concerns have led and could lead to additional legal and/orregulatory measures which could result in project delays or cancellations, a decreasein demand for fossil fuels, potential litigation and additional compliance obligations.In December 2015, 195 nations adopted the Paris Agreement, which we fully support.The Paris Agreement aims to limit increases in global temperatures to well below twodegrees Celsius. As a result, we expect continued and increased attention to climatechange from all sectors of society. This attention has led, and we expect it to continue tolead, to additional regulations designed to reduce greenhouse gas (GHG) emissions. We expect that a growing share of our GHG emissions will be subject to regulation,resulting in increased compliance costs and operational restrictions. If our GHG emissionsrise alongside our ambitions to increase the scale of our business, our regulatory burdenwill increase proportionally. We also expect that GHG regulation will focus more onsuppressing demand for fossil fuels, either through taxes, fees, incentives to promote thesale of electric vehicles or even through the future prohibition of sales of new diesel orgasoline vehicles. This could result in lower revenue and, in the long term, potentialimpairment of certain assets. Additionally, some groups are pressuring certain investors to divest their investments infossil fuel companies. If this were to continue, it could have a material adverse effect onthe price of our securities and our ability to access equity capital markets. The WorldBank has also announced plans to stop financing upstream oil and gas projects in 2019.Similarly, according to press reports, other financial institutions also appear to beconsidering limiting their exposure to certain fossil fuel projects. Accordingly, our abilityto use financing for future projects may be adversely impacted. This could also adverselyimpact our potential partners’ ability to finance their portion of costs, either throughequity or debt. Further, in some countries, governments and regulators have filed lawsuits seeking tohold fossil fuel companies liable for costs associated with climate change. While webelieve these lawsuits to be without merit, losing any of these lawsuits could have amaterial adverse effect on our earnings, cash flows and financial condition.
If we are unable to find economically viable, as well as publicly acceptable, solutions thatreduce our GHG emissions and/or GHG intensity for new and existing projects or for theproducts we sell, we could experience additional costs or financial penalties, delayed orcancelled projects, and/or reduced production and reduced demand for hydrocarbons,which could have a material adverse effect on our earnings, cash flows and financialcondition. See “Climate change and energy transition” on pages 63-64. Our operations expose us to social instability, criminality, civil unrest, terrorism,piracy, cyber-disruption, acts of war and risks of pandemic diseases that could have amaterial adverse effect on our business.As seen in recent years in Nigeria, North Africa, the Middle East, South America andSouth-East Asia, social and civil unrest, both in the countries in which we operate andelsewhere, can and do affect us. Such potential developments that could have a materialadverse effect on our earnings, cash flows and financial condition include: acts ofpolitical or economic terrorism; acts of maritime piracy; cyber-espionage or disruptivecyber-attacks; conflicts including war and civil unrest (including disruptions by non-governmental and political organisations); and local security concerns that threaten thesafe operation of our facilities, transport of our products and the well-being of ourpeople. Pandemic diseases can also affect our operations directly and indirectly. If suchrisks materialise, they could result in injuries, loss of life, environmental harm anddisruption to business activities, which in turn could have a material adverse effect on ourearnings, cash flows and financial condition. See “Environment and society” on page 61. We operate in more than 70 countries that have differing degrees of political, legaland fiscal stability. This exposes us to a wide range of political developments thatcould result in changes to contractual terms, laws and regulations. In addition, we andour joint arrangements and associates face the risk of litigation and disputesworldwide.Developments in politics, laws and regulations can and do affect our operations. Potentialimpacts include: forced divestment of assets; expropriation of property; cancellation orforced renegotiation of contract rights; additional taxes including windfall taxes,restrictions on deductions and retroactive tax claims; antitrust claims; changes to tradecompliance regulations; price controls; local content requirements; foreign exchangecontrols; changes to environmental regulations; changes to regulatory interpretations andenforcement; and changes to disclosure requirements. Any of these, individually or inaggregate, could have a material adverse effect on our earnings, cash flows and financialcondition. From time to time, social and political factors play a role in unprecedented andunanticipated judicial outcomes that could adversely affect Shell. Non-compliance withpolicies and regulations could result in regulatory investigations, litigation and,ultimately, sanctions. Certain governments and regulatory bodies have, in Shell’s opinion,exceeded their constitutional authority by: attempting unilaterally to amend or cancelexisting agreements or arrangements; failing to honour existing contractual commitments;and seeking to adjudicate disputes between private litigants. Additionally, certaingovernments have adopted laws and regulations that could potentially force us to violateother countries’ laws and regulations, therefore potentially subjecting us to both criminaland civil sanctions. Such developments and outcomes could have a material adverseeffect on our earnings, cash flows and financial condition. See “Corporate governance” on page 82.
STRATEGIC REPORT SHELL ANNUAL REPORT AND FORM 20-F 2017 13

The nature of our operations exposes us, and the communities in which we work, to awide range of health, safety, security and environment risks.The health, safety, security and environment (HSSE) risks to which we, and thecommunities in which we work, are potentially exposed cover a wide spectrum, given thegeographic range, operational diversity and technical complexity of our operations.These risks include the effects of natural disasters (including weather events),earthquakes, social unrest, personal health and safety lapses, and crime. If a major HSSErisk materialises, such as an explosion or hydrocarbon spill, this could result in injuries,loss of life, environmental harm, disruption of business activities, and loss or suspensionof our licence to operate or ability to bid on mineral rights. Accordingly, this would havea material adverse effect on our earnings, cash flows and financial condition. Our operations are subject to extensive HSSE regulatory requirements that often changeand are likely to become more stringent over time. Operators could be asked to adjusttheir future production plans, as the government of the Netherlands has done, affectingproduction and costs. We could incur significant additional costs in the future due tocompliance with HSSE requirements or as a result of violations of, or liabilities under,laws and regulations, such as fines, penalties, clean-up costs and third-party claims.Therefore, HSSE risks, should they materialise, could have a material adverse effect onour earnings, cash flows and financial condition. See “Environment and society” on page 58. A further erosion of the business and operating environment in Nigeria could have amaterial adverse effect on us.In our Nigerian operations, we face various risks and adverse conditions. These include:security issues surrounding the safety of our people, host communities and operations;sabotage and theft; our ability to enforce existing contractual rights; litigation; limitedinfrastructure; potential legislation that could increase our taxes or costs of operations; theeffect of lower oil and gas prices on the government budget; and regional instabilitycreated by militant activities. Any of these risks or adverse conditions could have amaterial adverse effect on our earnings, cash flows and financial condition. See “Upstream” on page 35. Production from the Groningen field in the Netherlands causes earthquakes thataffect local communities.Shell and ExxonMobil are 50:50 shareholders in Nederlandse Aardolie Maatschappij B.V.(NAM). An important part of NAM’s gas production comes from the onshore Groningengas field, in which EBN, a Dutch government entity, has a 40% interest and NAM a 60%interest. Since 1995, production from the Groningen field has caused earthquakes. Someof these earthquakes have caused damage to houses and other structures in the region,resulting in complaints and lawsuits from the local community. Since 2013, the Minister of Economic Affairs has imposed curtailments on productionfrom the Groningen field in order to mitigate the seismicity risks. In January 2018, therewas another earthquake and a further curtailment of production is likely. Additionalearthquakes, lawsuits and further significant curtailments of production could have amaterial adverse effect on NAM and therefore could impact our earnings, cash flows andfinancial condition. See “Upstream” on page 33.
Our future performance depends on the successful development and deployment ofnew technologies and new products.Technology and innovation are essential to our efforts to meet the world’s energydemands in a competitive way. If we do not develop the right technology and products,do not have access to such technology and products or do not deploy these effectively,there could be a material adverse effect on the delivery of our strategy and our licence tooperate. We operate in environments where advanced technologies are utilised. While wetake measures to ensure that such technologies and products are safe for the environmentand public health based on today’s knowledge, there is always the possibility of unknownor unforeseeable technological failures or environmental and health effects that couldharm our reputation and licence to operate or expose us to litigation or sanctions. Theassociated costs of new technology are sometimes underestimated or delays occur. If weare unable to develop the right technologies and products in a timely and cost-effectivemanner, or if we develop technologies and products that adversely impact theenvironment or health of individuals, there could be a material adverse effect on ourearnings, cash flows and financial condition. See “Business overview” on page 11. We are exposed to treasury and trading risks, including liquidity risk, interest raterisk, foreign exchange risk, commodity price risk and credit risk. We are affected bythe global macroeconomic environment as well as financial and commodity marketconditions.Our subsidiaries, joint arrangements and associates are subject to differing economic andfinancial market conditions around the world. Political or economic instability affectssuch markets. We use debt instruments, such as bonds and commercial paper, to raise significantamounts of capital. Should our access to debt markets become more difficult, thepotential impact on our liquidity could have a material adverse effect on our operations.Our financing costs could also be affected by interest rate fluctuations or any credit ratingdeterioration. We are exposed to changes in currency values and to exchange controls as a result of oursubstantial international operations. Our reporting currency is the dollar. However, to amaterial extent, we hold assets and are exposed to liabilities in other currencies.Commodity trading is an important component of our Upstream, Integrated Gas andDownstream businesses and is integrated with our supply business. While we undertakesome foreign exchange and commodity hedging, we do not do so for all of our activities.Furthermore, even where hedging is in place, it may not function as expected. We are exposed to credit risk; our counterparties could fail or could be unable to meettheir payment and/or performance obligations under contractual arrangements. Althoughwe do not have significant direct exposure to sovereign debt, it is possible that ourpartners and customers may have exposure which could impair their ability to meet theirobligations. In addition, our pension plans may invest in government bonds, andtherefore could be affected by a sovereign debt downgrade or other default. If any of the risks set out above materialise, they could have a material adverse effect onour earnings, cash flows and financial condition. See “Liquidity and capital resources” on page 54 and Note 19 to the “ConsolidatedFinancial Statements” on pages 167-172.
STRATEGIC REPORT SHELL ANNUAL REPORT AND FORM 20-F 2017 14

We have substantial pension commitments, funding of which is subject to capitalmarket risks.Liabilities associated with defined benefit pension plans can be significant, as can the cashfunding requirement of such plans; both depend on various assumptions. Volatility incapital markets or government policies, and the resulting consequences for investmentperformance and interest rates, as well as changes in assumptions for mortality, retirementage or pensionable remuneration at retirement, could result in significant changes to thefunding level of future liabilities. We operate a number of defined benefit pension plansand, in case of a shortfall, we could be required to make substantial cash contributions(depending on the applicable local regulations) resulting in a material adverse effect onour earnings, cash flows and financial condition. See “Liquidity and capital resources” on page 54. We mainly self-insure our risk exposure. We could incur significant losses fromdifferent types of risks that are not covered by insurance from third-party insurers.Our insurance subsidiaries provide hazard insurance coverage to other Shell entities andonly reinsure a portion of their risk exposures. Such reinsurance would not provide anymaterial coverage in the event of a large-scale safety and environmental incident.Similarly, in the event of a material safety and environmental incident, there would be nomaterial proceeds available from third-party insurance companies to meet our obligations.Therefore, we may incur significant losses from different types of risks that are notcovered by insurance from third-party insurers, potentially resulting in a material adverseeffect on our earnings, cash flows and financial condition. See “Corporate” on page 53. An erosion of our business reputation could have a material adverse effect on ourbrand, our ability to secure new resources and our licence to operate.Our reputation is an important asset. The Shell General Business Principles (Principles)govern how Shell and its individual companies conduct their affairs, and the Shell Codeof Conduct instructs employees and contract staff on how to behave in line with thePrinciples. Our challenge is to ensure that all employees and contract staff, more than100,000 in total, comply with the Principles and the Code of Conduct. Real or perceivedfailures of governance or regulatory compliance could harm our reputation. This couldimpact our licence to operate, damage our brand, reduce consumer demand for ourbranded products, harm our ability to secure new resources and contracts, and limit ourability to access capital markets. Many other factors, including the materialisation of therisks discussed in several of the other risk factors, could impact our reputation and couldhave a material adverse effect on our earnings, cash flows and financial condition. See “Corporate governance” on page 77.
Many of our major projects and operations are conducted in joint arrangements orassociates. This could reduce our degree of control, as well as our ability to identifyand manage risks.In cases where we are not the operator, we have limited influence over, and control of,the behaviour, performance and costs of operation of such joint arrangements orassociates. Despite not having control, we could still be exposed to the risks associatedwith these operations, including reputational, litigation (where joint and several liabilitycould apply) and government sanction risks. For example, our partners or members of ajoint arrangement or an associate (particularly local partners in developing countries) maynot be able to meet their financial or other obligations to the projects, threatening theviability of a given project. Where we are the operator of a joint arrangement, the otherpartner(s) could still be able to veto or block certain decisions, which could be to ouroverall detriment. Accordingly, where we have limited influence, we are exposed tooperational risks that could have a material adverse effect on our earnings, cash flows andfinancial condition. See “Corporate governance” on page 82. We rely heavily on information technology systems for our operations.The operation of many of our business processes depends on reliable informationtechnology (IT) systems. Our IT systems are increasingly concentrated in terms ofgeography, number of systems, and key contractors supporting the delivery of ITservices. Shell, like many other multinational companies, is the target of attempts to gainunauthorised access to our IT systems and our data through various channels, includingmore sophisticated and coordinated attempts often referred to as advanced persistentthreats. While our IT systems have been breached in the past, we believe that to date, nosignificant breach has occurred. Timely detection is becoming increasingly complex butwe seek to detect and investigate all such security incidents, aiming to prevent theirrecurrence. Disruption of critical IT services, or breaches of information security, couldharm our reputation and have a material adverse effect on our earnings, cash flows andfinancial condition. See “Corporate” on page 53. Violations of antitrust and competition laws carry fines and expose us and/or ouremployees to criminal sanctions and civil suits.Antitrust and competition laws apply to Shell and its joint ventures and associates in thevast majority of countries in which we do business. Shell and its joint ventures andassociates have been fined for violations of antitrust and competition laws. These includea number of fines in the past by the European Commission Directorate-General forCompetition (DG COMP). Due to the DG COMP’s fining guidelines, any futureconviction of Shell or any of its joint ventures or associates for violation of EuropeanUnion (EU) competition law could result in significantly larger fines and have a materialadverse effect on us. Violation of antitrust laws is a criminal offence in many countries,and individuals can be imprisoned or fined. Furthermore, it is now common for personsor corporations allegedly injured by antitrust violations to sue for damages. Any violationof these laws or harm to our reputation could have a material adverse effect on ourearnings, cash flows and financial condition. See “Corporate governance” on page 77.
STRATEGIC REPORT SHELL ANNUAL REPORT AND FORM 20-F 2017 15

Violations of anti-bribery, anti-corruption and anti-money laundering laws carryfines and expose us and/or our employees to criminal sanctions, civil suits andancillary consequences (such as debarment and the revocation of licences).Anti-bribery, anti-corruption and anti-money laundering laws apply to Shell, its jointventures and associates in all countries in which we do business. Shell and its jointventures and associates in the past have been fined for violations of the US ForeignCorrupt Practices Act. Any future violation of anti-bribery, anti-corruption or anti-moneylaundering laws could have a material adverse effect on our earnings, cash flows andfinancial condition. See “Our people” on pages 67-68, “Corporate governance” on page 77 and Note 25 tothe “Consolidated Financial Statements” on pages 175-176. Violations of data protection laws carry fines and expose us and/or our employees tocriminal sanctions and civil suits.Data protection laws apply to Shell and its joint ventures and associates in the vastmajority of countries in which we do business. Over 100 countries have data protectionlaws and regulations. Additionally, the EU General Data Protection Regulation (GDPR),which will be applicable from May 2018, increases penalties up to a maximum of 4% ofglobal annual turnover for breach of the regulation. The GDPR requires mandatorybreach notification, the standard for which is also followed outside the EU (particularly inAsia). Non-compliance with data protection laws could expose us to regulatoryinvestigations, which could result in fines and penalties. In addition to imposing fines,regulators may also issue orders to stop processing personal data, which could disruptoperations. We could also be subject to litigation from persons or corporations allegedlyaffected by data protection violations. Violation of data protection laws is a criminaloffence in some countries, and individuals can be imprisoned or fined. Any violation ofthese laws or harm to our reputation could have a material adverse effect on our earnings,cash flows and financial condition. See “Corporate governance” on page 77. Violations of trade compliance laws and regulations, including sanctions, carry finesand expose us and our employees to criminal sanctions and civil suits.We use “trade compliance” as an umbrella term for various national and internationallaws designed to regulate the movement of items across national boundaries and restrictor prohibit trade and other dealings with certain parties. The number and breadth of suchlaws continue to expand. For example, the EU and the USA continue to imposerestrictions and prohibitions on certain transactions involving Syria. In addition, the USAcontinues to have comprehensive sanctions in place against Iran, while the EU and othernations continue to maintain targeted sanctions. Additional restrictions and controlsdirected at defined oil and gas activities in Russia, which were imposed by the EU and theUSA in 2014, are still in force. Further restrictions regarding Russia were introduced bythe USA in 2017. The USA also introduced sectorial sanctions against Venezuela in 2017targeting the government of Venezuela and the oil industry. In addition to the significanttrade-control programmes administered by the EU and the USA, many other nations arealso adopting such programmes. This expansion of sanctions, including the frequentadditions of prohibited parties, combined with the number of markets in which weoperate and the large number of transactions we process, makes ensuring compliance withall sanctions complex and at times challenging. Any violation of one or more of theseregimes could lead to loss of import or export privileges, significant penalties on orprosecution of Shell or its employees, and could harm our reputation and have a materialadverse effect on our earnings, cash flows and financial condition. See “Corporate governance” on page 77.
Investors should also consider the following, which could limit shareholder remedies. The Company’s Articles of Association determine the jurisdiction for shareholderdisputes. This could limit shareholder remedies.Our Articles of Association generally require that all disputes between our shareholders insuch capacity and the Company or our subsidiaries (or our Directors or former Directors),or between the Company and our Directors or former Directors, be exclusively resolvedby arbitration in The Hague, the Netherlands, under the Rules of Arbitration of theInternational Chamber of Commerce. Our Articles of Association also provide that, if thisprovision is to be determined invalid or unenforceable for any reason, the dispute couldonly be brought before the courts of England and Wales. Accordingly, the ability ofshareholders to obtain monetary or other relief, including in respect of securities lawclaims, could be determined in accordance with these provisions.
STRATEGIC REPORT SHELL ANNUAL REPORT AND FORM 20-F 2017 16

We maintain a large business portfolio across an integrated value chain and are exposedto crude oil, natural gas, oil product and chemical prices (see “Risk factors” on page 12).This diversified portfolio helps us mitigate the impact of price volatility. Our annualplanning cycle and periodic portfolio reviews aim to ensure that our levels of capitalinvestment and operating expenses are affordable in the context of a volatile priceenvironment. We test the resilience of our projects and other opportunities against a rangeof crude oil, natural gas, oil product and chemical prices and costs. We also aim tomaintain a strong balance sheet to provide resilience against weak market prices. GLOBAL ECONOMIC GROWTHOne of the key drivers of oil, natural gas and oil product demand is economic activity.According to the World Economic Outlook released by the International Monetary Fund(IMF) in January 2018, global economic growth increased from 3.2% in 2016 to 3.7% in2017. Economic activity has picked up momentum in most countries and regionsreflecting firmer domestic demand growth in advanced economies on the back ofsupportive monetary policies and benign financing conditions, and improvedperformance in several large emerging-market economies. According to the IMF’s latest estimate, growth accelerated in the USA from 1.5% in 2016to 2.3% in 2017. Growth in the eurozone increased to 2.4% from 1.8% in 2016. Growthin most other advanced economies also increased. In China, growth was 6.8% in 2017, upfrom 6.7% in 2016. In contrast, growth slowed in India, in part due to uncertainty aroundnew policies (such as the introduction of a goods and services tax). Recovering exportand domestic demand supported recoveries in Brazil, Russia and Turkey. For 2018 and2019, the IMF expects global economic growth to increase marginally, reaching 3.9% ineach year. GLOBAL PRICES, DEMAND AND SUPPLYThe following table provides an overview of the main crude oil and natural gas pricemarkers that we are exposed to:
Oil and gas average industry prices [A] 2017 2016 2015
Brent ($/b) 54 44 52 West Texas Intermediate ($/b) 51 43 49 Henry Hub ($/MMBtu) 3.0 2.5 2.6 UK National Balancing Point (pence/therm) 45 35 43 Japan Customs-cleared Crude ($/b) 54 42 55[A] Yearly average prices are based on daily spot prices. The 2017 average price for Japan Customs-cleared Crude excludesDecember data. CRUDE OILBrent crude oil, an international benchmark, traded between $45 per barrel (/b) and$67/b in 2017, ending the year at $66/b. It averaged $54/b for the year, $10/b higherthan in 2016 when the price was at its lowest average level since 2004. On a yearly average basis, West Texas Intermediate crude oil traded at a $3/b discount toBrent in 2017, compared with $0.4/b in 2016. The discount widened in the second halfof the year as crude oil demand from refineries on the US Gulf Coast slowed due toshutdowns related to the hurricane season. Increasing US oil exports helped to limitfurther widening of the price differential. Reflecting the economic conditions described above, global oil demand grew by 1.5million barrels per day (b/d), or 1.6%, to 97.8 million b/d, according to the InternationalEnergy Agency’s (IEA) Oil Market Report published in January 2018 (Oil MarketReport). This growth was driven by
emerging economies, where demand grew by 1.2 million b/d. In advanced economiesdemand grew by 0.3 million b/d. Oil demand growth in 2017 was 0.2 million b/d higherthan in 2016, when it rose by 1.3 million b/d. Oil supply in 2017 is estimated in the Oil Market Report at 97.3 million b/d, an increaseof 0.4 million b/d compared with 2016. Because growth in oil demand outpaced growthin supply, global crude oil and oil products inventory levels decreased during the yearbut remained well above the average of the last five years. Average commercial andgovernment-controlled inventory levels for OECD countries in November 2017 wereestimated at 2,910 million barrels in the Oil Market Report, some 125 million barrels lessthan in November 2016, but still about 200 million barrels above the year average levelsseen in 2014, before the Brent price started to fall. This partial oil market rebalancingsupported oil prices, particularly in the second half of the year. On the non-OPEC supply side, the US Energy Information Administration reported acontinuation of supply growth that began in the third quarter of 2016. US productionaveraged 9.3 million b/d in 2017, 0.5 million b/d higher than in 2016. Higher oil pricesin 2017 reflected an attractive environment for US production to grow and for drillingactivity to increase, as indicated by a higher onshore oil rig count for the year. Productionfrom other non-OPEC countries increased by 0.4 million b/d and averaged 55.7 millionb/d. In order to support oil prices, OPEC members agreed in November 2016 to reduce theiroverall production by 1.2 million b/d, compared with October 2016, during the first halfof 2017. In May 2017, they extended their agreement to early 2018. In November 2017,they extended it to the end of 2018. OPEC production averaged 32.3 million b/d in 2017,about 0.5 million b/d less than in 2016. Other, non-OPEC, resource holders, most notablyRussia, continued to partner with OPEC in the attempt to limit oversupply – reducingtheir output by a total of 0.6 million b/d. Looking ahead, higher global economic activity as indicated by the IMF’s globaleconomic outlook and moderate oil price levels at the beginning of 2018 could createaround 1.3 million b/d of additional demand growth in 2018, according to the IEA. IfOPEC members and co-operating non-OPEC resource holders continue to limitproduction to 2017 levels, demand growth would have to be balanced by productiongrowth from non-OPEC countries, mostly from the USA, and withdrawals from storage.A continuation of market rebalancing, as indicated by storage withdrawals, would supportprices. Postponements and cancellations of new supply projects over the last few yearscould lead to further market tightening in the next few years. In such a scenario, webelieve that the average Brent crude oil price may be 10% to 50% higher in 2021 than the2017 average. On the other hand, we believe that the price environment could weaken if OPEC and thenon-OPEC resource holders abandon their production cuts, the global economyaccelerates less quickly, or if other non-OPEC producers, such as US shale producers,effectively manage costs and deliver cheaper oil to the market. NATURAL GASGlobal gas demand grew by about 2.4% in 2017, which is higher than the average annualgrowth of 2.3% in the past decade. A combination of weather conditions and increasedglobal economic growth led to an increase in demand growth in most regions. The global liquefied natural gas (LNG) market grew by 29 million tonnes (11.2%) yearon year. Supply growth was primarily driven by the start-up of new projects in Australiaand the USA. The majority of additional LNG supply was absorbed by North Asia andSouthern Europe, offsetting a decline in imports by the Middle East and North Africa.LNG demand growth was supported by policy developments (China, South Korea andTaiwan), warmer weather (Southern Europe) and delays in nuclear power station restarts(Japan).
Market overview
STRATEGIC REPORT SHELL ANNUAL REPORT AND FORM 20-F 2017 17

Unlike crude oil pricing, which is global in nature, natural gas prices can vary fromregion to region. In the USA, the natural gas price at the Henry Hub averaged $3.0 per million Britishthermal units (MMBtu) in 2017, 20% higher than in 2016, and traded in a range of $2.4-3.4/MMBtu. One important factor is how much natural gas is available in storage duringthe winter. At the end of March 2017, prices were supported by a tighter than normalbalance between supply and demand, which led to around 0.5 trillion cubic feet less gasbeing held in storage compared with the year-ago level. Mild weather and higher pricesled to lower than normal demand for gas from US power generation. But both LNGexports and pipeline exports to Mexico increased substantially as new liquefactionterminals and cross-border pipelines came online. Higher oil and gas prices comparedwith 2016, combined with new gas pipeline capacity, helped to increase overall gasproduction, which met demand but led to around 0.3 trillion cubic feet less gas held instorage in November 2017, compared with the year-ago level. In Europe, natural gas prices were higher than in 2016. The average price at the UKNational Balancing Point (NBP) was 28% higher in 2017. At the main continentalEuropean gas trading hubs – in the Netherlands, Belgium and Germany – prices were alsostronger, as reflected by stronger Dutch Title Transfer Facility (TTF) prices. The closureof the Rough gas storage facility in the UK created a winter premium and summerdiscount for NBP prices relative to TTF prices. This reduction in storage space increasedwinter supply concerns in the UK, while removing an important source of demand insummer, when suppliers have typically restocked the facility in preparation for thefollowing winter. Higher prices reflected the combined effect of reduced domesticproduction, lower nuclear power generation, increased coal prices, and growth in demandfrom power generation and other industrial sectors. We also produce and sell natural gas in regions where supply, demand and regulatorycircumstances differ markedly from those in the USA or Europe. Long-term contractedLNG prices in the Asia-Pacific region generally increased in 2017 as they arepredominantly indexed to the price of Japan Customs-cleared Crude, which has increasedin line with global oil prices. North Asia spot prices (reflected by the Japan KoreaMarker) also increased due to relatively strong demand, particularly from China. Looking ahead, we expect gas markets in North America, Europe and Asia Pacific to bewell supplied over the next few years, despite our expectation of LNG demand growth inthe Middle East and Asia. Price developments are very uncertain and dependent on manyfactors. In the USA, Henry Hub gas prices may increase over the next few years due to increasingdemand from LNG exports, pipeline exports to Mexico and the US residential/industrialsectors. On the other hand, increasing availability of low-cost natural gas and oil,combined with technological improvements, could continue to place pressure on naturalgas prices. We believe that Henry Hub gas prices could average up to 30% higher by2021 than in 2017. In Europe, we believe gas prices will be increasingly driven by thevolume of LNG imports from the USA. In the Asia Pacific region, gas prices are expectedto continue to be strongly influenced by oil prices, but also increasingly by Henry Hubgas prices. We believe that the price at the UK NBP by 2021 could average as much as30% higher than in 2017. By 2021, we believe that the average price of LNG deliveredunder contract to the Asia-Pacific market could be up to 30% higher than in 2017. CRUDE OIL AND NATURAL GAS PRICE ASSUMPTIONSOur ability to deliver competitive returns and pursue commercial opportunities ultimatelydepends on the accuracy of our price assumptions (see “Risk factors” on page 12). Therange of possible future crude oil and natural gas prices used in project and portfolioevaluations is determined after a rigorous assessment of short-, medium- and long-termmarket drivers. Historical analyses, trends and statistical volatility are considered in thisassessment, as
are analyses of market fundamentals such as possible future economic conditions,geopolitics, actions by OPEC and other major resource holders, production costs and thebalance of supply and demand. Sensitivity analyses are used to test the impact of low-price drivers, such as economic weakness, and high-price drivers, such as strongeconomic growth and low investment in new production capacity. Short-term events,such as relatively warm winters or cool summers, affect demand. Supply disruptions, dueto weather or political instability, contribute to price volatility.
REFINING MARGINS
Refining marker average industry gross margins $/b 2017 2016 2015
US West Coast 14.0 12.9 19.4 US Gulf Coast Coking 9.9 9.1 10.6 Rotterdam Complex 4.3 2.5 4.7 Singapore 3.6 2.8 4.7 Industry gross refining margins were higher on average in 2017 than in 2016 in each ofthe key refining hubs of Europe, Singapore and the USA. Oil products demand growthwas stronger globally, with an increase of 1.5 million b/d compared with 2016 accordingto the Oil Market Report, driven in part by a continued low-price crude oil environmentand industrial demand growth. Demand growth and refinery outages, notably in LatinAmerica, reduced overcapacity despite new refinery capacity additions in 2017 in China. In 2018, we expect demand for products such as gasoline and middle distillates tocontinue to grow and support margins, driven by a further increase in economic activityas well as demand from freight and passenger transport. However, ample refiningcapacity and potentially strengthening feedstock prices could narrow margins. Overall,we believe margins could be similar to 2017, but demand and supply-side uncertaintymay drive significant volatility.
PETROCHEMICAL MARGINS
Cracker industry margins $/tonne 2017 2016 2015
North East/South East Asia naphtha 688 672 463 Western Europe naphtha 727 598 617 US ethane 471 450 498 Asian naphtha cracker margins rose for the third consecutive year, although only slightlyin 2017, driven by continued strong demand, periods of reduced cracker capacityavailability and higher naphtha cracker utilisation. European naphtha cracker marginsincreased, supported by tight ethylene markets and high global utilisation. US ethanecracker margins increased slightly but remained lower than margins in Asia and Europeas continued low crude oil prices reduced the margin available in the ethane topolyethylene value chain. The outlook for petrochemical margins in 2018 depends on supply and demand balancesand feedstock costs. Demand for petrochemicals is closely linked to economic growth aswell as product prices. Product prices reflect prices of raw materials, which are closelylinked to crude oil and natural gas prices. The balance of these factors will drive margins. The statements in this “Market overview” section, including those related to our priceforecasts, are forward-looking statements based on management’s current expectationsand certain material assumptions and, accordingly, involve risks and uncertainties thatcould cause actual results, performance or events to differ materially from thoseexpressed or implied herein. See “About this Report” on page 05 and “Risk factors” onpages 12-16.
STRATEGIC REPORT SHELL ANNUAL REPORT AND FORM 20-F 2017 18

EARNINGS 2017-2016Income for the period was $13,435 million in 2017, compared with $4,777 million in2016. After current cost of supplies adjustment, total segment earnings were $12,471million in 2017, compared with $3,692 million in 2016. Earnings on a current cost of supplies basis (CCS earnings) exclude the effect of changesin the oil price on inventory carrying amounts, after making allowance for the tax effect.The purchase price of volumes sold in the period is based on the current cost of suppliesduring the same period, rather than on the historic cost calculated on a first-in, first-out(FIFO) basis. Therefore, when oil prices are decreasing, CCS earnings are likely to behigher than earnings calculated on a FIFO basis and, when prices are increasing, CCSearnings are likely to be lower than earnings calculated on a FIFO basis. Integrated Gas earnings in 2017 were $5,078 million, compared with $2,529 million in2016. The increase was mainly driven by higher realised oil, gas, and liquefied naturalgas (LNG) prices, as well as the impact of the strengthening Australian dollar on adeferred tax position, and lower impairment charges. These effects were partly offset bythe impacts in 2017 of a charge for fair value accounting of commodity derivatives, acharge as a result of US tax reform legislation, and by lower liquids production partiallyoffset by higher LNG liquefaction volumes. See “Integrated Gas” on pages 24-25. Upstream earnings in 2017 were $1,551 million, compared with a loss of $3,674 millionin 2016. The improvement was mainly driven by higher realised oil and gas prices.Higher gains on divestments and lower depreciation charges were partly offset by higherimpairment charges. Overall, there were higher taxation charges. Beneficial movements indeferred tax positions were more than offset by a charge in 2017 as a result of US taxreform legislation and the absence of a gain related to the impact of a strengtheningBrazilian real on a deferred tax position in 2016. See “Upstream” on pages 31-32.
Downstream earnings in 2017 were $8,258 million, compared with $6,588 million in2016. The increase was mainly driven by improved refining and chemicals industryconditions, the impact of fair value accounting of commodity derivatives, and lowertaxation, redundancy and impairment charges. This was partly offset by lower gains ondivestments and higher depreciation charges. See “Downstream” on pages 46-47. Corporate earnings in 2017 were a loss of $2,416 million, compared with a loss of$1,751 million in 2016. The higher loss was mainly driven by higher interest expenseand net foreign exchange losses, partly offset by lower operating expenses. There wasalso a charge in 2017 as a result of US tax reform legislation. See “Corporate” on page53. EARNINGS 2016-2015Income for the period was $4,777 million in 2016, compared with $2,200 million in2015. After current cost of supplies adjustment, total segment earnings were $3,692million in 2016, compared with $4,155 million in 2015. BG Group plc (BG) wasconsolidated within Shell’s results with effect from February 2016 following itsacquisition. Integrated Gas earnings in 2016 were $2,529 million, compared with $3,170 million in2015. The decrease was mainly driven by higher operating expenses and depreciation,lower oil and LNG prices, and higher taxation. These impacts were partly offset by higherproduction and LNG liquefaction volumes, lower impairment charges and well write-offs. Upstream earnings in 2016 were a loss of $3,674 million, compared with a loss of $8,833million in 2015. The lower loss in 2016 was partly explained by the significant charges in2015 associated with the decision to cease Alaska drilling activities and the Carmon Creekproject in Canada and other impairments. In addition, earnings in 2016 benefited fromhigher production volumes and lower operating expenses, partly offset by lower oil andgas prices, higher depreciation, and lower gains on divestments. Downstream earnings in 2016 were $6,588 million, compared with $10,243 million in2015. The decrease was mainly due to lower realised refining and trading margins and ahigher effective tax rate. There was a partial offset from stronger marketing margins, inturn partly offset by the impact of divestments and unfavourable exchange rate effectsand fair value accounting of commodity derivatives.
Summary of results
Key statistics $ million, except where indicated 2017 2016 2015
Income for the period 13,435 4,777 2,200 Current cost of supplies adjustment (964 ) (1,085 ) 1,955 Total segment earnings [A][B], of which: 12,471 3,692 4,155
Integrated Gas 5,078 2,529 3,170 Upstream 1,551 (3,674 ) (8,833 )Downstream 8,258 6,588 10,243 Corporate (2,416 ) (1,751 ) (425 )
Capital investment [B] 24,006 79,877 28,861 Divestments [B] 17,340 4,984 5,540 Operating expenses [B] 38,083 41,549 41,144 Return on average capital employed [B] 5.8% 3.0% 1.9% Gearing at December 31 [C] 24.8% 28.0% 14.0% Oil and gas production (thousand boe/d) 3,664 3,668 2,954 Proved oil and gas reserves at December 31 (million boe) 12,233 13,248 11,747[A] Segment earnings are presented on a current cost of supplies basis. See Note 4 to the “Consolidated Financial Statements” on pages 149-150. [B] See “Non-GAAP measures reconciliations” on pages 225-226.[C] See Note 14 to the “Consolidated Financial Statements” on page 158.
STRATEGIC REPORT SHELL ANNUAL REPORT AND FORM 20-F 2017 19

Corporate earnings in 2016 were a loss of $1,751 million, compared with a loss of $425million in 2015. Interest expense was significantly higher in 2016, due to additional debtfor the BG acquisition and debt assumed on the acquisition, partly offset by lower foreignexchange losses. There were also BG acquisition costs and lower tax credits in 2016, anda gain in 2015 on the sale of an office building. PRODUCTION AVAILABLE FOR SALEOil and gas production available for sale in 2017 was 1,338 million barrels of oilequivalent (boe), or 3,664 thousand boe per day (boe/d), compared with 1,342 millionboe, or 3,668 thousand boe/d, in 2016. In 2017, production from new fields offset theimpact of field declines and divestments.
Oil and gas productionavailable for sale [A] thousand boe/d
2017 2016 2015 Crude oil and natural gas liquids 1,730 1,679 1,358 Synthetic crude oil 91 146 137 Bitumen 4 13 14 Natural gas [B] 1,839 1,830 1,445 Total 3,664 3,668 2,954 Of which:
Integrated Gas 887 884 631 Upstream 2,777 2,784 2,323
[A] See “Oil and gas information” on pages 42-43.[B] Natural gas volumes are converted into oil equivalent using a factor of 5,800 scf per barrel. PROVED RESERVESThe proved oil and gas reserves of Shell subsidiaries and the Shell share of the proved oiland gas reserves of joint ventures and associates are summarised in “Oil and gasinformation” on pages 38-40 and set out in more detail in “Supplementary information –oil and gas (unaudited)” on pages 179-188. Before taking production into account, our proved reserves increased by 368 million boein 2017. This comprised increases of 343 million boe from Shell subsidiaries and 25million boe from the Shell share of joint ventures and associates. The increase from Shellsubsidiaries included 927 million boe from revisions and reclassifications, 706 millionboe from extensions and discoveries, and 97 million boe from improved recovery, partlyoffset by net sales of minerals in place of 1,387 million boe mainly related to syntheticcrude oil in Canada. In 2017, total oil and gas production was 1,383 million boe, of which 1,338 million boewas available for sale and 45 million boe was consumed in operations. Productionavailable for sale from subsidiaries was 1,168 million boe and 38 million boe wasconsumed in operations. The Shell share of the production available for sale of jointventures and associates was 170 million boe and 7 million boe was consumed inoperations. Accordingly, after taking production into account, our proved reserves decreased by1,015 million boe in 2017, to 12,233 million boe at December 31, 2017, with a decreaseof 863 million boe from subsidiaries and a decrease of 152 million boe from the Shellshare of joint ventures and associates. CAPITAL INVESTMENT AND OTHER INFORMATIONCapital investment was $24.0 billion in 2017, compared with $79.9 billion in 2016,which included $52.9 billion related to the BG acquisition. Divestments were $17.3 billion in 2017, compared with $5.0 billion in 2016.
Operating expenses decreased by $3 billion in 2017, to $38 billion. In 2016, operatingexpenses included redundancy and restructuring charges of $2 billion. Our return on average capital employed (ROACE) increased to 5.8%, compared with3.0% in 2016, mainly driven by a higher income in 2017. Gearing was 24.8% at the end of 2017, compared with 28.0% at the end of 2016, drivenby debt repayments in 2017. SIGNIFICANT ACCOUNTING ESTIMATES AND JUDGEMENTSSee Note 2 to the “Consolidated Financial Statements” on pages 142-148. LEGAL PROCEEDINGSSee Note 25 to the “Consolidated Financial Statements” on pages 175-176.
STRATEGIC REPORT SHELL ANNUAL REPORT AND FORM 20-F 2017 20

SELECTED FINANCIAL DATAThe selected financial data set out below are derived, in part, from the “Consolidated Financial Statements”. This data should be read in conjunction with the “Consolidated FinancialStatements” and related Notes, as well as with this Strategic Report.
Consolidated Statement of Income and of Comprehensive Income data $ million 2017 2016 2015 2014 2013
Revenue 305,179 233,591 264,960 421,105 451,235 Income for the period 13,435 4,777 2,200 14,730 16,526 Income/(loss) attributable to non-controlling interest 458 202 261 (144 ) 155 Income attributable to Royal Dutch Shell plc shareholders 12,977 4,575 1,939 14,874 16,371 Comprehensive income/(loss) attributable to Royal Dutch Shell plc shareholders 18,828 (1,374 ) (811 ) 2,692 18,243
Consolidated Balance Sheet data $ million 2017 2016 2015 2014 2013
Total assets 407,097 411,275 340,157 353,116 357,512 Total debt 85,665 92,476 58,379 45,540 44,562 Share capital 696 683 546 540 542 Equity attributable to Royal Dutch Shell plc shareholders 194,356 186,646 162,876 171,966 180,047 Non-controlling interest 3,456 1,865 1,245 820 1,101
Earnings per share $ 2017 2016 2015 2014 2013
Basic earnings per €0.07 ordinary share 1.58 0.58 0.31 2.36 2.60 Diluted earnings per €0.07 ordinary share 1.56 0.58 0.30 2.36 2.60
Shares Million 2017 2016 2015 2014 2013
Basic weighted average number of A and B shares 8,223.4 7,833.7 6,320.3 6,311.5 6,291.1 Diluted weighted average number of A and B shares 8,299.0 7,891.7 6,393.8 6,311.6 6,293.4
STRATEGIC REPORT SHELL ANNUAL REPORT AND FORM 20-F 2017 21
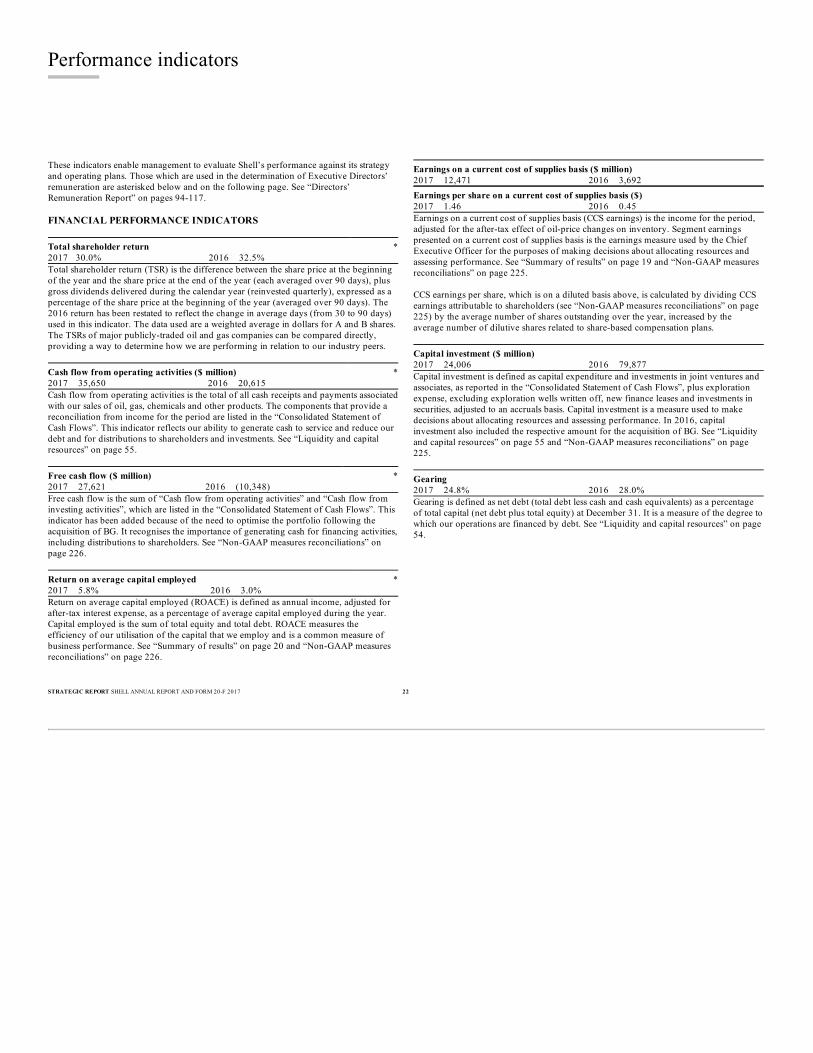
These indicators enable management to evaluate Shell’s performance against its strategyand operating plans. Those which are used in the determination of Executive Directors’remuneration are asterisked below and on the following page. See “Directors’Remuneration Report” on pages 94-117. FINANCIAL PERFORMANCE INDICATORS Total shareholder return *2017 30.0% 2016 32.5%Total shareholder return (TSR) is the difference between the share price at the beginningof the year and the share price at the end of the year (each averaged over 90 days), plusgross dividends delivered during the calendar year (reinvested quarterly), expressed as apercentage of the share price at the beginning of the year (averaged over 90 days). The2016 return has been restated to reflect the change in average days (from 30 to 90 days)used in this indicator. The data used are a weighted average in dollars for A and B shares.The TSRs of major publicly-traded oil and gas companies can be compared directly,providing a way to determine how we are performing in relation to our industry peers. Cash flow from operating activities ($ million) *2017 35,650 2016 20,615Cash flow from operating activities is the total of all cash receipts and payments associatedwith our sales of oil, gas, chemicals and other products. The components that provide areconciliation from income for the period are listed in the “Consolidated Statement ofCash Flows”. This indicator reflects our ability to generate cash to service and reduce ourdebt and for distributions to shareholders and investments. See “Liquidity and capitalresources” on page 55. Free cash flow ($ million) *2017 27,621 2016 (10,348)Free cash flow is the sum of “Cash flow from operating activities” and “Cash flow frominvesting activities”, which are listed in the “Consolidated Statement of Cash Flows”. Thisindicator has been added because of the need to optimise the portfolio following theacquisition of BG. It recognises the importance of generating cash for financing activities,including distributions to shareholders. See “Non-GAAP measures reconciliations” onpage 226. Return on average capital employed *2017 5.8% 2016 3.0%Return on average capital employed (ROACE) is defined as annual income, adjusted forafter-tax interest expense, as a percentage of average capital employed during the year.Capital employed is the sum of total equity and total debt. ROACE measures theefficiency of our utilisation of the capital that we employ and is a common measure ofbusiness performance. See “Summary of results” on page 20 and “Non-GAAP measuresreconciliations” on page 226.
Earnings on a current cost of supplies basis ($ million)2017 12,471 2016 3,692Earnings per share on a current cost of supplies basis ($)2017 1.46 2016 0.45Earnings on a current cost of supplies basis (CCS earnings) is the income for the period,adjusted for the after-tax effect of oil-price changes on inventory. Segment earningspresented on a current cost of supplies basis is the earnings measure used by the ChiefExecutive Officer for the purposes of making decisions about allocating resources andassessing performance. See “Summary of results” on page 19 and “Non-GAAP measuresreconciliations” on page 225. CCS earnings per share, which is on a diluted basis above, is calculated by dividing CCSearnings attributable to shareholders (see “Non-GAAP measures reconciliations” on page225) by the average number of shares outstanding over the year, increased by theaverage number of dilutive shares related to share-based compensation plans. Capital investment ($ million)2017 24,006 2016 79,877Capital investment is defined as capital expenditure and investments in joint ventures andassociates, as reported in the “Consolidated Statement of Cash Flows”, plus explorationexpense, excluding exploration wells written off, new finance leases and investments insecurities, adjusted to an accruals basis. Capital investment is a measure used to makedecisions about allocating resources and assessing performance. In 2016, capitalinvestment also included the respective amount for the acquisition of BG. See “Liquidityand capital resources” on page 55 and “Non-GAAP measures reconciliations” on page225. Gearing2017 24.8% 2016 28.0%Gearing is defined as net debt (total debt less cash and cash equivalents) as a percentageof total capital (net debt plus total equity) at December 31. It is a measure of the degree towhich our operations are financed by debt. See “Liquidity and capital resources” on page54.
Performance indicators
STRATEGIC REPORT SHELL ANNUAL REPORT AND FORM 20-F 2017 22

OTHER PERFORMANCE INDICATORSA number of changes have been made in 2017, including adding new indicators forgreenhouse gas (GHG) emissions and incorporating Tier 2 process safety events, in orderto provide more focus on Shell’s performance in these areas. Production available for sale (thousand boe/d) *2017 3,664 2016 3,668Production is the sum of all average daily volumes of unrefined oil and natural gasproduced for sale by Shell subsidiaries and Shell’s share of those produced for sale byjoint ventures and associates. The unrefined oil comprises crude oil, natural gas liquids,synthetic crude oil and bitumen. The gas volume is converted into equivalent barrels ofoil to make the summation possible. Changes in production have a significant impact onour cash flow. See “Summary of results” on page 20. LNG liquefaction volumes (million tonnes) *2017 33.2 2016 30.9Liquefied natural gas (LNG) liquefaction volumes is a measure of the operationalperformance of our Integrated Gas business and LNG market demand. See “IntegratedGas” on page 24. Refinery and chemical plant availability *2017 90.7% 2016 90.3%Refinery and chemical plant availability is the weighted average of the actual uptime ofplants as a percentage of their maximum possible uptime. The weighting is based on thecapital employed, adjusted for cash and non-current liabilities. This indicator is a measureof the operational excellence of our Downstream manufacturing facilities. See“Downstream” on page 46. Project delivery on schedule *2017 86% 2016 88%
Project delivery on budget *2017 93% 2016 92%Project delivery reflects our capability to complete major projects on time and withinbudget on the basis of targets set in our annual Business Plan. Project delivery onschedule measures the percentage of projects delivered on schedule. Project delivery onbudget reflects the aggregate cost against the aggregate budget for those projects. From2017, each measure is shown separately. In 2016, the indicators covered at least 20 Shell-operated capital projects in the execution phase (post final investment decision). In 2017,we also included non-Shell-operated projects, expanding coverage to at least 35 projects. Total recordable case frequency (injuries per million working hours) *2017 0.8 2016 1.0Total recordable case frequency (TRCF) is the number of employees and contract staffinjuries requiring medical treatment or time off for every million hours worked. It is astandard measure of occupational safety. See “Environment and society” on page 59.
Number of operational Tier 1 and 2 process safety events *2017 166 2016 146A Tier 1 process safety event is an unplanned or uncontrolled release of any material,including non-toxic and non-flammable materials, from a process with the greatest actualconsequence resulting in harm to employees and contract staff, or a neighbouringcommunity, damage to equipment, or exceeding a threshold quantity as defined by theAPI Recommended Practice 754 and IOGP Standard 456. A Tier 2 process safety event isa release of lesser consequence. See “Environment and society” on page 59. Refining greenhouse gas intensity (tonnes of CO2 equivalent/UEDCTM) *2017 1.14 2016 1.18Refining greenhouse gas (GHG) intensity is a measure of GHG emissions (direct andindirect GHG emissions associated with imported energy, excluding emissions fromexported energy), expressed in metric tonnes of carbon dioxide (CO2) equivalent, emittedto the atmosphere per unit of Utilized Equivalent Distillation Capacity (UEDCTM).UEDCTM is a proprietary metric of Solomon Associates. It is a complexity-weightednormalisation parameter that reflects the operating cost intensity of a refinery based onsize and configuration of its particular mix of process and non-process facilities. See“Climate change and energy transition” on page 66. Chemicals greenhouse gas intensity(tonnes of CO2 equivalent/tonne petrochemicals produced) *2017 0.46 2016 0.44Chemicals greenhouse gas intensity is a measure of GHG emissions (direct and indirectGHG emissions associated with imported energy, excluding emissions from exportedenergy), expressed in metric tonnes of CO2 equivalent, emitted to the atmosphere permetric tonne of petrochemicals production. See “Climate change and energy transition”on page 66. Proved oil and gas reserves (million boe)2017 12,233 2016 13,248Proved oil and gas reserves are the total estimated quantities of oil and gas from Shellsubsidiaries and Shell’s share from joint ventures and associates that geoscience andengineering data demonstrate, with reasonable certainty, to be recoverable in future yearsfrom known reservoirs, at December 31, under existing economic conditions, operatingmethods and government regulations. Gas volumes are converted into barrels of oilequivalent (boe) using a factor of 5,800 standard cubic feet per barrel. Reserves arecrucial to an oil and gas company, since they constitute the source of future production.Reserves estimates are subject to change due to a wide variety of factors, some of whichare unpredictable. See “Risk factors” on pages 12-13, “Summary of results” on page 20,“Oil and gas information” on pages 38-41 and “Supplementary information – oil and gas(unaudited)” on pages 179-188. Number of operational spills of more than 100 kilograms2017 99 2016 72The operational spills indicator is the number of incidents in respect of activities where weare the operator in which 100 kilograms or more of oil or oil products were spilled as aresult of those activities and reached the environment. The 2016 number has beenrevised. See “Environment and society” on page 59. Direct greenhouse gas emissions (million tonnes of CO2 equivalent)2017 73 2016 70Direct GHG emissions from facilities operated by Shell, expressed in CO2 equivalent. See“Climate change and energy transition” on page 66.
STRATEGIC REPORT SHELL ANNUAL REPORT AND FORM 20-F 2017 23

OVERVIEWOur Integrated Gas and New Energies business manages liquefied natural gas (LNG)activities and the conversion of natural gas into gas-to-liquids (GTL) fuels and otherproducts, as well as our New Energies portfolio. It includes natural gas exploration andextraction, when contractually linked to the production and transportation of LNG, andthe operation of the upstream and midstream infrastructure necessary to deliver gas tomarket. It markets and trades natural gas, LNG, crude oil, electricity and carbon-emissionrights and also markets and sells LNG as a fuel for heavy-duty vehicles and marinevessels. BUSINESS CONDITIONSGlobal oil demand grew by 1.6% in 2017, according to the International EnergyAgency’s Oil Market Report published in January 2018, with the Brent crude oil priceaveraging $54 per barrel (/b), up $10/b from 2016. Global gas demand grew by about 2.4% in 2017. A combination of weather conditionsand increased global economic growth led to an increase in demand in most regions. The global LNG market grew by 29 million tonnes (11.2%) year on year. Supply growthwas primarily driven by the start-up of new projects in Australia and the USA. Themajority of additional LNG supply was absorbed by North Asia and Southern Europe,offsetting a decline in imports by the Middle East and North Africa. LNG demand growthwas supported by policy developments (China, South Korea and Taiwan), warmerweather in the summer months (Southern Europe) and delays in nuclear power stationrestarts (Japan). Unlike crude oil pricing, which is global in nature, natural gas prices can vary fromregion to region. In the USA, the natural gas price at the Henry Hub averaged $3.0 per million Britishthermal units (MMBtu) in 2017, 20% higher than in 2016, and traded in a range of $2.4-3.4/MMBtu. In Europe, natural gas prices were higher than in 2016. The average price at the UKNational Balancing Point (NBP) was $5.8/MMBtu, compared with $4.3/MMBtu in 2016.At the main continental European gas trading hubs –
in the Netherlands, Belgium and Germany – prices were also stronger, as reflected bystronger Dutch Title Transfer Facility prices. Long-term contracted LNG prices in the Asia-Pacific region generally increased in 2017as they are predominantly indexed to the price of Japan Customs-cleared Crude, whichhas increased in line with global oil prices. North Asia spot prices (reflected by the JapanKorea Marker) also increased due to relatively strong demand, particularly from China. See “Market overview” on pages 17-18. PRODUCTION AVAILABLE FOR SALEIn 2017, production was 324 million barrels of oil equivalent (boe), or 887 thousand boeper day (boe/d), compared with 323 million boe, or 884 thousand boe/d in 2016. Liquidsproduction decreased by 9%, mainly due to a shutdown at our Pearl GTL plant in Qatar.Natural gas production increased by 4% compared with 2016, mainly due to the start-upof Gorgon train 3 in Australia, partly offset by lower gas production at Pearl. LNG LIQUEFACTION VOLUMESLNG liquefaction volumes of 33.2 million tonnes in 2017 were 7% higher than in 2016,mainly reflecting the additional month’s contribution of assets acquired with BG and ourstrong operational performance. There were also incremental volumes from the start-upof Gorgon train 3. These impacts were partly offset by a higher level of unplannedmaintenance activity and lower feedgas availability at Queensland Curtis LNG (QCLNG)in Australia and Atlantic LNG in Trinidad and Tobago. LNG sales volumes of 66.0 million tonnes in 2017 were 16% higher than in 2016, mainlyreflecting higher purchased volumes from third parties and higher offtake from Gorgon,Nigeria LNG and Brunei LNG. EARNINGS 2017-2016Segment earnings in 2017 were $5,078 million, which included a net charge of $190million. The net charge mainly reflected a charge of $445 million on fair valueaccounting of commodity derivatives and a charge of $412 million as a result of US taxreform legislation, partly offset by a gain of $636 million from the strengtheningAustralian dollar on a deferred tax position.
Integrated Gas
Key statistics $ million, except where indicated 2017 2016 2015
Segment earnings 5,078 2,529 3,170 Including:
Revenue (including inter-segment sales) 36,652 29,190 25,989 Share of profit of joint ventures and associates 1,714 1,116 1,471 Interest and other income 687 765 537 Operating expenses [A] 5,471 6,479 4,088 Exploration 141 494 1,290 Depreciation, depletion and amortisation 4,965 4,509 2,597 Taxation charge 790 1,254 937
Capital investment [A] 3,827 26,214 5,178 Divestments [A] 3,077 352 269 Oil and gas production available for sale (thousand boe/d) 887 884 631 LNG liquefaction volumes (million tonnes) 33.2 30.9 22.6[A] See “Non-GAAP measures reconciliations” on pages 225-226.
STRATEGIC REPORT SHELL ANNUAL REPORT AND FORM 20-F 2017 24

Segment earnings in 2016 were $2,529 million, which included a net charge of $1,171million. The net charge included impairments of $451 million, reported mainly in shareof profit of joint ventures and associates, the reassessment of a deferred tax asset inAustralia of $533 million, onerous contract provisions in Europe and the USA of $390million, and redundancy and restructuring charges of $245 million, partly offset by gainson divestments of $212 million and on the accounting reclassification of Shell’s interestin Woodside Petroleum Limited (Woodside) in Australia of $479 million (both reportedin interest and other income). Excluding the net charges described above, segment earnings were $5,268 million in2017 compared with $3,700 million in 2016. Earnings were positively impacted byhigher realised oil, gas and LNG prices (around $1,620 million), lower operatingexpenses (around $110 million), lower exploration charges (around $170 million), andlower well write-offs (around $100 million). Earnings were negatively impacted by atotal of around $230 million from lower liquids production, mainly as a result of theshutdown at Pearl, partially offset by higher LNG liquefaction volumes across theportfolio. Other items, which included lower contributions from trading and highertaxation, had a net negative impact of around $200 million. As a result of the change in the fiscal functional currency of a number of Shell entities inAustralia to the US dollar, the impact of exchange rate movements of the Australiandollar on deferred tax balances will be significantly reduced in 2018. EARNINGS 2016-2015BG was consolidated within Shell’s results with effect from February 2016, following itsacquisition. Segment earnings in 2016 were $2,529 million, which included a net charge of $1,171million as described above. Segment earnings in 2015 were $3,170 million, whichincluded a net charge of $1,887 million, including impairments of $1,109 million and theimpact of the weakening of the Australian dollar on deferred tax positions of $560million. Excluding the net charges described above, segment earnings were $3,700 million in2016 compared with $5,057 million in 2015. Earnings were impacted by higheroperating expenses and depreciation mainly due to the consolidation of BG (around$1,860 million), lower oil and LNG prices (around $1,730 million), higher taxation(around $570 million), and other net negative impacts of around $120 million. Theseimpacts were partly offset by higher oil and gas production and LNG liquefactionvolumes (around $2,260 million), mainly as a result of the BG acquisition, and lower wellwrite-offs (around $660 million). CAPITAL INVESTMENT AND DIVESTMENTSCapital investment in 2017 was $3.8 billion, compared with $26.2 billion in 2016, ofwhich $21.8 billion related to the acquisition of BG. Divestments in 2017 were $3.1 billion, compared with $0.4 billion in 2016, mainly dueto the divestment of our interest in Woodside. PORTFOLIO AND BUSINESS DEVELOPMENTKey portfolio events in 2017 included the following: ■ In April, we signed an agreement with Nord Stream 2 AG to provide a long-term
funding facility of €285 million and funds of up to €665 million to cover acombination of short- and long-term funding and guarantees for a pipeline project torun from Russia to Germany.
■ In May, we acquired Centrica’s interest in the North Coast Marine Area (NCMA) blockoffshore Trinidad and Tobago, increasing our interest from 45.88% to 63.19%. InAugust, we acquired Chevron’s interests in Trinidad and Tobago, which includedincreasing our interest in the Shell-operated East Coast Marine Area (ECMA) block from50% to 100%.
■ In July, Shell Energy Australia began selling gas in the Australian domestic market.■ In September, we acquired MP2 Energy LLC (MP2), which provides market-based
solutions to commercial and industrial customers for managing energy supply, load,and generation throughout the eastern USA.
■ In October, we acquired NewMotion, one of Europe’s largest electric vehicle (EV)charging providers.
■ In December, we signed an agreement to buy First Utility, a leading independent UKhousehold energy and broadband provider. The transaction was completed in February2018.
■ In December, we signed a gas sales agreement between Arrow Energy Holdings PtyLimited (Arrow) and QCLNG, both joint ventures in Australia in which we participate.Under the agreement, uncontracted gas from Arrow’s Surat Basin fields would flow tothe QCLNG venture, which would then both sell gas to local customers and export itthrough its gas plant on Curtis Island.
In January 2018, we announced an agreement to acquire a 43.83% interest in SiliconRanch Corporation, a leading US developer, owner, and operator of solar assets. Thetransaction was completed in March 2018. The following major operational milestones were reached in 2017: ■ In March, Gorgon train 3 started up.■ In June, our Prelude floating liquefied natural gas (FLNG) facility left the Samsung
Heavy Industries shipyard in South Korea, marking a significant milestone for theproject. Prelude FLNG arrived in Australian waters in July.
The Pearl GTL plant (Shell interest 100%) operated at a reduced rate of production fromDecember 2016, due to unforeseen maintenance required on the gasifier units, until acontrolled shutdown in February 2017. The plant resumed full production in July afterrepairs to the gasifier units were completed. We continued to divest selected assets during 2017, including: ■ In Australia, we sold our 13.3% interest in Woodside.■ In New Zealand, we sold our 50% interest in the Kapuni gas field.■ In Brazil, we executed an existing put option agreement to sell our 16.8% interest in
Companhia de Gas de São Paulo (Comgás) to Cosan S.A. Indústria e Comércio (Cosan).We exchanged our common shares in Comgás for Cosan shares plus cash.
In September, Shell and KUFPEC agreed to cancel the January sale and purchaseagreement for the sale of our 22.2% interest in the Bongkot field and adjoining acreageoffshore Thailand. Subsequently, in January 2018, we agreed to sell our interest to PTTExploration & Production Public Company Limited (PTTEP). The transaction is pendingregulatory and other approvals, and expected to close in the second quarter of 2018. In January 2018, Partners Group signed an agreement to join the Borssele III and IVoffshore wind farm projects in the Netherlands, diluting our interest in the consortiumfrom 40% to 20%.
STRATEGIC REPORT SHELL ANNUAL REPORT AND FORM 20-F 2017 25

BUSINESS AND PROPERTYOur Integrated Gas business is described below by country. EUROPEGreeceIn January 2017, Attiki Gas Supply Company S.A. was unbundled into separate supplyand distribution companies, in line with Greek legislation. As a result, we have a 49%interest in both Attiki Gas Supply Company S.A. and Attiki Natural Gas DistributionCompany S.A. NetherlandsWe have access to import and storage capacity at the GATE LNG terminal in theNetherlands (Shell capacity rights 1.4 million tonnes per annum, mtpa), enabling us tosupply LNG to marine and road transport customers in northwest Europe. We are alsousing the terminal to supply LNG to our growing truck-refuelling network in theNetherlands. In August 2017, we took delivery of the Cardissa LNG bunker vessel, apurpose-built vessel which supplies LNG to marine and industrial customers. NorwayGasnor AS (Shell interest 100%) provides LNG fuel for ships and industrial customersand has a natural gas pipeline network. UKWe have a 50% interest in the Dragon LNG regasification terminal, with long-termarrangements in place governing the use of capacity rights. ASIA (INCLUDING THE MIDDLE EAST AND RUSSIA)BruneiWe have a 25% interest in Brunei LNG Sendirian Berhad, which sells most of its LNG onlong-term contracts to customers in Asia. ChinaWe jointly develop and produce from the onshore Changbei tight-gas field under aproduction-sharing contract (PSC) with China National Petroleum Corporation (CNPC).In 2016, we completed the Changbei I development programme under the PSC andsubsequently handed over the production operatorship to CNPC. In December 2017, wetook the final investment decision on the Changbei II Phase 1 project, and projectexecution began that month. Shell remains the operator of Changbei II. In 2016, we handed back the Zitong and Fushun blocks in Sichuan to CNPC, and expectto complete the handover of the Jinqiu block to CNPC in 2018. IndiaWe have a 30% interest in the producing oil and gas field Panna/Mukta. We also have a30% interest in the Mid Tapti and South Tapti fields, which ceased production in the firstquarter of 2016. We have a 32.5% interest in MGL, a natural gas distribution company in Mumbai. We have a 74% interest in the Hazira regasification terminal in the state of Gujarat on thewest coast. IndonesiaWe have a 35% interest in the INPEX Masela Ltd joint venture which owns and operatesthe offshore Masela block. In April 2016, the joint venture received a notification fromthe Indonesian government authorities instructing it to re-propose a plan for the Abadigas field based on an onshore LNG project. The partners are committed to workingtogether with the Indonesian government to move the project forward.
IranShell transactions with Iran are disclosed separately. See “Section 13(r) of the USSecurities Exchange Act of 1934 Disclosure” on page 224.
MalaysiaWe have a 15% interest in Malaysia LNG Tiga located in Bintulu. We also operate a GTLplant, Shell MDS (Shell interest 72%), adjacent to the Malaysia LNG facilities. Using Shelltechnology, the plant converts gas into high-quality middle distillates, drilling fluids,waxes and specialty products. OmanWe have a 30% interest in Oman LNG LLC, which mainly supplies Asian markets underlong-term contracts. We also have an 11% interest in Qalhat LNG, which is part of theOman LNG complex. QatarWe operate the Pearl GTL plant (Shell interest 100%) in Qatar under a development andproduction-sharing contract with the government. The fully-integrated facility hascapacity for production, processing and transportation of 1.6 billion standard cubic feetper day (scf/d) of gas from Qatar’s North Field. It has an installed capacity of about 140thousand boe/d of high-quality liquid hydrocarbon products and 120 thousand boe/d ofnatural gas liquids (NGL) and ethane. Due to unforeseen maintenance required on the gasifier units, Pearl GTL operated at areduced rate of production from December 2016 until a controlled shutdown in February2017. The plant resumed full production in July 2017 after the gasifier unit repairs werecompleted. In 2017, Pearl GTL produced around 3.5 million tonnes of GTL products. We have a 30% interest in Qatargas 4, which comprises integrated facilities to produceabout 1.4 billion scf/d of gas from Qatar’s North Field, an onshore gas-processing facilityand one LNG train with a collective production capacity of 7.8 mtpa of LNG and 70thousand boe/d of condensate and NGL. RussiaWe have a 27.5% interest in Sakhalin-2, an integrated oil and gas project located in asubarctic environment. We have a 50% interest in the Salym fields in western Siberia, Khanty MansiyskAutonomous District, where production was approximately 120 thousand boe/d in 2017. We have a 50% interest in Khanty-Mansiysk Petroleum Alliance. We have a 100% interest in the North Vorkutinsky 1, North Vorkutinsky 2 and Syriagaexploration and production licences in Komi Republic (Timan Pechora). As a result of European Union and US sanctions prohibiting certain defined oil and gasactivities in Russia, we suspended our support to Salym and Khanty-Mansiysk PetroleumAlliance in relation to shale oil activities in 2014. Salym and Khanty-Mansiysk PetroleumAlliance also suspended any shale oil related activities in 2014. SingaporeWe have a 50% interest in a joint venture with KS Investments (the investment arm ofKeppel Group) that holds a licence to supply LNG fuel for vessels in the Port ofSingapore. We currently have the first aggregator licence to import LNG into Singapore.The exclusivity period has ended with the issuance of the second import licence inOctober 2017 to both Shell Eastern Trading (Pte) Ltd (Shell interest 100%) and PavilionGas Pte Ltd.
STRATEGIC REPORT SHELL ANNUAL REPORT AND FORM 20-F 2017 26

ThailandWe have a 22.2% interest in the Bongkot and G12/48 fields in the Gulf of Thailand and a66.7% interest in exploration Blocks 7 and 8 where activity is currently suspended due tooverlapping claims by Thailand and Cambodia. We have an agreement over Block 9aunder which we receive royalties. Production from the Bongkot field supplies around20% of the country’s gas demand. In September, Shell and KUFPEC agreed to cancel the January sale and purchaseagreement for the sale of our 22.2% interest in the Bongkot field and adjoining acreageoffshore Thailand. Subsequently, in January 2018, we agreed to sell our interest toPTTEP. The transaction is pending regulatory and other approvals, and is expected toclose in the second quarter of 2018. OCEANIAAustraliaWe have interests in offshore production and exploration licences in the North West Shelf(NWS) and Greater Gorgon areas of the Carnarvon Basin, as well as in the Browse Basinand Timor Sea. Woodside (of which Shell’s 13.3% interest was sold in 2017) is theoperator on behalf of the NWS joint venture, which produced more than 450 thousandboe/d of gas and condensates in 2017. We have a 25% interest in the Gorgon LNG project, which involves the development ofsome of the largest gas discoveries to date in Australia, beginning with the offshoreGorgon and Jansz-lo fields. Gorgon LNG began production in March 2016. The thirdand final train began operation in March 2017. We are the operator of a permit in the Browse Basin in which two separate gas fields werefound: Prelude and Concerto (Shell interest 67.5% in each). Our development concept forthese fields is based on our FLNG technology. The Prelude FLNG project is expected toproduce about 110 thousand boe/d of gas and NGL, 3.6 mtpa of LNG, 1.3 mtpa ofcondensate and 0.4 mtpa of liquefied petroleum gas. Major milestones during 2017 werethe sail away of the facility from the construction yard in South Korea and the start ofhook-up and commissioning activities on site. Our other interests in the basin include ajoint arrangement, with Shell as the operator, for the undeveloped Crux gas andcondensate field (Shell interest 82%). We are also a partner in the Browse joint arrangement (Shell interest 27%) covering theBrecknock, Calliance and Torosa gas fields, and the undeveloped Sunrise gas field in theTimor Sea (Shell interest 26.6%), both of which are operated by Woodside. We are apartner in both Shell-operated and other exploration joint arrangements in multiplebasins, including Bonaparte, Browse, Exmouth Plateau, Greater Gorgon and OuterCanning. We have a 50% interest in Arrow, a Queensland-based joint venture with CNPC. Arrowowns coal-bed methane assets and a domestic power business. We have a 50% interest in train one and a 97.5% interest in train two of the Shell-operated QCLNG venture. The two-train liquefaction plant has an installed capacity of8.5 mtpa. Our production of onshore natural gas from the Surat Basin supplies both thisplant and the domestic market. In December 2017, we signed a gas sales agreement between Arrow and QCLNG, underwhich uncontracted gas from Arrow’s Surat Basin fields would flow to the QCLNGventure, that would then both sell gas to local customers and export it through its gasplant on Curtis Island.
New ZealandOur interests include the Maui (83.75%) and Pohokura (48%) natural gas fields. We arean operator with an approximate 61% interest in an exploration licence in the Great SouthBasin. The business is under strategic review. During 2017, we sold our 50% interest in theKapuni gas field. We are currently in discussions to sell our remaining interests. AFRICAEgyptWe have interests of 35.5% and 38%, respectively, in trains one and two of the EgyptianLNG (ELNG) plant. In January 2014, force majeure notices were issued under the LNGagreements as a result of domestic gas diversions severely restricting volumes available toELNG. These notices remain in place. See “Oil and gas information” on page 39. MozambiqueIn 2014, we signed a memorandum of understanding (MOU) with Mozambique nationaloil and gas company Empresa Nacional de Hidrocarbonetos to formalise a partnership toconduct a full feasibility study for a potential GTL project. Following the outcome of theMozambique domestic gas allocation public tender process in January 2017, where wewere announced as one of three winners, we signed a MOU with the government for theproject development work programme. NigeriaWe have a 25.6% interest in Nigeria LNG Ltd, which operates six LNG trains. TanzaniaWe have a 60% interest in, and are the operator of, Blocks 1 and 4 offshore southernTanzania. The blocks cover approximately 4,000 square kilometres of the Mafia DeepOffshore Basin and the northern part of the Rovuma Basin. In 2016, we completeddrilling on all remaining wells. We continue to develop a potential LNG project withpartners in Block 2 in line with the Block 1 and 4 appraisal programme agreed with theTanzanian government. This includes discussion between the government and thepartners in Blocks 1, 2 and 4 to agree the investment framework for the potential project.To enable the agreed appraisal programme to be carried out and progress thedevelopment of the project, the Block 1 licence was extended and we are engaging withthe government to extend the Block 4 licence. The government has confirmed that theBlock 4 licence, due to initially expire on October 31, 2017, remains in full forcepending the grant of the licence extension. Rest of AfricaWe have a 17.9% share in the West African Gas Pipeline Company. NORTH AMERICACanadaIn 2014, we entered into a joint venture (Shell interest 50%) to evaluate an investment inan LNG export facility in Kitimat on the west coast of Canada. Together with ourpartners, our evaluation continues to progress. USAWe have offtake rights to 100% of the capacity (2.5 mtpa) of the Kinder Morgan-ownedElba Island liquefaction plant, which is under construction. Elba Island also has aregasification terminal in which we have contracted capacity of 11.6 mtpa. We have 13.1 mtpa of contracted capacity in the Lake Charles regasification terminal inLouisiana. We are also evaluating a project to convert the existing regasification facilityowned by Energy Transfer into a liquefaction plant in which we would have capacityrights.
STRATEGIC REPORT SHELL ANNUAL REPORT AND FORM 20-F 2017 27

SOUTH AMERICABoliviaWe have a 100% interest in the La Vertiente, Los Suris and Tarija XX East blocks and theLa Vertiente gas processing plant. We have a 37.5% interest in the Caipipendi blockwhere we mainly produce from the Margarita field and we are also drilling an explorationwell. We also have a 25% interest in the Tarija XX West block where we produce fromthe Itaú field. We have the rights to explore and further develop the onshore Huacaretablock (Shell interest 100%), and plan to drill an exploration well in 2018. PeruWe have a 20% interest in an LNG liquefaction plant. Trinidad and TobagoWe are the largest shareholder in all four trains at Atlantic LNG. We also have an interestin three concessions with producing fields – Central Block, ECMA and NCMA blocks. InMay 2017, we acquired Centrica’s interest in the NCMA block, increasing our interestfrom 45.88% to 63.19% and in August, we acquired Chevron’s interests in Trinidad andTobago, which included increasing our interest in the Shell-operated ECMA block from50% to 100%. We also have interests ranging from 35% to 100% in exploration activitiesin blocks 5(c), 5(d), 6(d), and Atlantic Area blocks 3, 5, 6 and 7. Rest of South AmericaWe have interests in a gas pipeline connecting Uruguay to Argentina. In December 2017, we sold our interest in Comgás, a natural gas distribution company inBrazil, to Cosan. We exchanged our common shares in Comgás for Cosan shares pluscash. TRADING AND SUPPLYThrough our Shell Energy organisation, we market a portion of our share of equityproduction of LNG and trade LNG volumes around the world through our hubs in theUK, Dubai and Singapore. It also markets and trades natural gas, power and carbon-emission rights mainly in North America and Europe, of which a portion includes equityvolumes from our upstream operations. In September 2017, we acquired MP2, which provides market-based solutions tocommercial and industrial customers for managing energy supply, load, and generationthroughout the eastern USA. During 2017, we started marketing gas in Australia and Mexico, and power in Brazil. NEW ENERGIESIn 2016, we formed a New Energies business. We pursue two main areas of opportunities:new fuels for transport, such as advanced biofuels, hydrogen, and charging for battery-electric vehicles; and power, including from low-carbon sources such as wind and solar aswell as natural gas. Digital technologies complement our activities in both new fuels andpower. The New Energies portfolio is largely being built through acquiring establishedcompanies or through start-up companies. Most of these opportunities are in businesssectors that are different from Shell’s existing oil and gas businesses, but have somesimilarities and/or adjacencies to our Downstream and gas and power trading businesses.New Energies companies are subject to Shell’s control framework. However, some of themore recently acquired, smaller companies are not yet in compliance. We are working tobring them into compliance with Shell’s control framework in a fit-for-purpose manner.
New fuelsBiofuelsWe continue to invest in new ways to produce biofuels from sustainable feedstocks suchas waste and cellulosic biomass from non-food plants. In 2017, we completedconstruction of a demonstration plant at the Shell Technology Centre Bangalore, India.This plant will demonstrate a technology called IH2 (a trademark of the Gas TechnologyInstitute) that turns waste into transport fuel. In addition, we continue to look foropportunities to invest in third-party technologies and to collaborate in scaling these upfor commercialisation. Hydrogen electricShell is taking part in several initiatives to encourage the adoption of hydrogen-electricenergy as a transport fuel. In Germany, the government is supporting the deployment ofa national network of hydrogen-electric fuelling stations across the country by 2023. Weare working on this project with our joint-venture partners in H2 Mobility Germany – AirLiquide, Daimler, Linde, OMV and Total. At the end of 2017, Shell already had ninehydrogen filling stations at its retail sites in Germany. In the UK, we are partnering with ITM Power to make hydrogen fuel available at threeretail sites in the south east of the country. The first station was inaugurated in February2017 at our Cobham retail site. In the USA, we also have two hydrogen stations in LosAngeles, California. In 2017, we began working with Honda and Toyota, and with thesupport of the California state government, to build seven new stations in NorthernCalifornia. We are assessing the potential for similar projects in Austria, Belgium, France,Luxembourg, the Netherlands, Switzerland and the USA. Charging for battery-electric vehiclesIn 2017, we acquired Netherlands-based NewMotion, a company with one of Europe’sbiggest networks of EV charging points. It operates more than 30,000 private electriccharge points in the Netherlands, Germany, France and the UK. It also provides 100,000registered charge-card users access to over 50,000 public charge points in 25 Europeancountries. In 2017, we also signed an agreement with charging operator IONITY to offer high-powered charging points in 10 European countries, starting with 80 of its biggesthighway stations, which will allow EV drivers to travel long distances. IONITY is a jointventure between BMW, Daimler, Ford and Volkswagen, which was formed to create anetwork of 350-kilowatt chargers next to major highways in Europe. PowerOur share of capacity from wind power projects in the USA is more than 400 megawatts(MW). In the Netherlands, we have an interest in the consortium that was awarded the concessionby the Dutch government in December 2016 to develop the Borssele III and IV offshorewind farm projects, which are to be located 20 kilometres off the Dutch coast. In January2018, Partners Group signed an agreement to join the projects, diluting our interest in theconsortium from 40% to 20%. Also in the Netherlands, we have a 50% interest in the Noordzeewind joint venture withNuon, which has been set up for the development, construction and management of theEgmond aan Zee offshore wind farm. The farm comprises 36 wind turbines, each with acapacity of 3 MW. We are exploring ways to deploy solar technologies to lower the carbon intensity of ouroperations. We are also looking at how best to combine wind and solar power with our existingbusiness and capabilities.
STRATEGIC REPORT SHELL ANNUAL REPORT AND FORM 20-F 2017 28

We are developing a solar power plant at our Moerdijk chemicals site in the Netherlands,with construction planned to begin in 2018. The plant is expected to provide anapproximate peak capacity of 20 MW of renewable power. The power produced will beused by the Shell Moerdijk site. In December 2017, we signed an agreement to buy First Utility, a leading independentUK household energy and broadband provider. The transaction was completed inFebruary 2018. In January 2018, we announced an agreement to acquire a 43.83% interest in SiliconRanch Corporation, a leading US developer, owner, and operator of solar assets. Thetransaction was completed in March 2018. Digital technologiesDigital technologies complement our activities in new fuels and power. In the Netherlands, we have developed a fill-up-and-go system which allows drivers topay online for fuel from their vehicles. This secure payment system saves drivers time. In the USA, the Fitcar™ app transforms a regular car into a “connected car” and providesmaintenance alerts and information on the engine, the location of nearby services andtracks users’ driving style, helping drivers save money, stay safe and take care of theirvehicle. We have developed an app, called Farepilot, that helps self-employed drivers to identifyhigh demand areas to swiftly find their next fare and potentially save them fuel. We haveinvested through Shell Technology Ventures in tiramizoo, a German start-up whoseonline technology connects retailers with customers. We are collaborating on an onlinetool that efficiently schedules local deliveries in over 150 towns and cities in Germanyand Austria. This approach improves customer service, lowers costs and, if widelyadopted, could reduce urban traffic and, in turn, help improve local air quality. Going forward, we are exploring services we could offer to home energy users. We havealready developed a digital programme which helps customers in the UK bring all theirenergy bills together in one place and finds ways for them to save money. Our approach to digital ventures involves exploring a range of options, and moving onswiftly if we conclude that a venture is not commercially viable. INTEGRATED GAS DATA TABLE
LNG liquefaction volumes Million tonnes 2017 2016 2015
Australia 11.1 9.5 3.4 Brunei 1.6 1.6 1.6 Egypt 0.2 0.2 — Malaysia 1.3 1.3 1.8 Nigeria 5.2 4.5 5.0 Norway 0.1 0.1 — Oman 2.0 2.0 1.9 Peru 0.9 0.9 0.7 Qatar 2.4 2.4 2.4 Russia 3.1 3.0 2.9 Trinidad and Tobago 5.3 5.4 2.9 Total 33.2 30.9 22.6
STRATEGIC REPORT SHELL ANNUAL REPORT AND FORM 20-F 2017 29

LNG AND GTL PLANTS AT DECEMBER 31, 2017
LNG liquefaction plants in operation
Asset Location Shell interest (%) 100% capacity (mtpa)[A] Europe
Norway Gasnor Bergen 100.0 0.3 Asia
Brunei Brunei LNG Lumut 25.0 7.8 Malaysia Malaysia LNG Tiga Bintulu 15.0 7.7 Oman Oman LNG Sur 30.0 7.1
Qalhat LNG Sur 11.0 [B] 3.7 Qatar Qatargas 4 Ras Laffan 30.0 7.8 Russia Sakhalin LNG Prigorodnoye 27.5 9.6
Oceania Australia Australia North West Shelf Karratha 16.7 16.9
Gorgon LNG T1 Barrow Island 25.0 5.2 Gorgon LNG T2 Barrow Island 25.0 5.2 Gorgon LNG T3 Barrow Island 25.0 5.2 Queensland Curtis LNG T1 Curtis Island 50.0 4.3 Queensland Curtis LNG T2 Curtis Island 97.5 4.3 Africa
Egypt Egyptian LNG T1 Idku 35.5 3.6 Egyptian LNG T2 Idku 38.0 3.6
Nigeria Nigeria LNG Bonny 25.6 22.0 South America
Peru Peru LNG Pampa Melchorita 20.0 4.5 Trinidad and Tobago Atlantic LNG T1 Point Fortin 46.0 3.1 Atlantic LNG T2/T3 Point Fortin 57.5 6.6 Atlantic LNG T4 Point Fortin 51.1 5.2
[A] As reported by the operator. [B] Interest, or part of the interest, is held via indirect shareholding.
LNG liquefaction plants under construction
Asset Location Shell interest (%) 100% capacity (mtpa) Oceania
Australia Prelude Browse Basin 67.5 3.6
GTL plants in operation Asset Location Shell interest (%) 100% capacity (b/d)
Asia Malaysia Shell MDS Bintulu 72.0 14,700 Qatar Pearl Ras Laffan 100.0 140,000
STRATEGIC REPORT SHELL ANNUAL REPORT AND FORM 20-F 2017 30

OVERVIEWOur Upstream business explores for and extracts crude oil, natural gas and natural gasliquids. It also markets and transports oil and gas, and operates the infrastructurenecessary to deliver them to market. We are also involved in the extraction of bitumenfrom mined oil sands and its conversion into synthetic crude oil. BUSINESS CONDITIONSGlobal oil demand grew by 1.5 million barrels per day (b/d), or 1.6%, to 97.8 million b/din 2017, according to the International Energy Agency’s Oil Market Report published inJanuary 2018. The Brent crude oil price, an international benchmark, averaged $54/b,$10/b higher than in 2016 when the price was at its lowest average level since 2004. Ittraded between $45/b and $67/b in 2017, ending the year at $66/b. On a yearly average basis, West Texas Intermediate crude oil traded at a $3/b discount toBrent in 2017, compared with $0.4/b in 2016. The discount widened in the second halfof the year as crude oil demand from refineries on the US Gulf Coast slowed due toshutdowns related to the hurricane season. Increasing US oil exports helped to limitfurther widening of the price differential. Global gas demand grew by about 2.4% in 2017, which is higher than the average annualgrowth of 2.3% in the past decade. A combination of weather conditions and increasedglobal economic growth led to an increase in demand growth in most regions. In the USA, the natural gas price at the Henry Hub averaged $3.0 per million Britishthermal units (MMBtu) in 2017, 20% higher than in 2016, and traded in a range of $2.4-3.4/MMBtu. One important factor is how much natural gas is available in storage duringthe winter. At the end of March 2017, prices were supported by a tighter than normalbalance between supply and demand, which led to around 0.5 trillion cubic feet less gasbeing held in storage compared with the year-ago level. Mild weather and higher pricesled to lower than normal demand for gas from US power generation. But both LNGexports and pipeline exports to Mexico increased substantially as new liquefactionterminals and cross-border pipelines came online. Higher oil and gas prices comparedwith 2016, combined with new gas pipeline capacity, helped to increase overall gasproduction, which met demand but led to around 0.3 trillion cubic feet less gas held instorage in November 2017, compared with the year-ago level.
In Europe, natural gas prices were higher than in 2016. The average price at the UKNational Balancing Point (NBP) was 28% higher in 2017. At the main continentalEuropean gas trading hubs – in the Netherlands, Belgium and Germany – prices were alsostronger, as reflected by stronger Dutch Title Transfer Facility prices. Higher pricesreflected the combined effect of reduced domestic production, lower nuclear powergeneration, increased coal prices, and growth in demand from power generation andother industrial sectors. See “Market overview” on pages 17-18. PRODUCTION AVAILABLE FOR SALEIn 2017, production was 1,014 million barrels of oil equivalent (boe), or 2,777 thousandboe per day (boe/d), compared with 1,019 million boe, or 2,784 thousand boe/d in 2016.Liquids production was flat and natural gas production decreased by 1% compared with2016. Production in 2017 decreased slightly compared with 2016. Decreases were mainly dueto divestments (around 135 thousand boe/d) and field declines (around 80 thousandboe/d). Increases were mainly from new field start-ups and the continuing ramp-up ofexisting fields (around 195 thousand boe/d), in particular Lula Central, Lula Alto, LulaSouth and Lapa in the Santos Basin in Brazil, Kashagan in Kazakhstan, Kebabangan andMalikai in Malaysia and Stones in the US Gulf of Mexico and stronger operationalperformance and acquisitions, which contributed additional volumes of around 105thousand boe/d. Other items had a net negative impact of around 90 thousand boe/d. EARNINGS 2017-2016Segment earnings in 2017 were $1,551 million, which included a net charge of $1,540million. The net charge included impairment charges of $2,557 million (reported indepreciation), mainly related to divestments of our oil sands interests in Canada, onshoreassets in Gabon and our interest in the Corrib gas project in Ireland, a charge of $1,089million related to US tax reform legislation, and redundancy and restructuring charges of$163 million. These charges were partly offset by gains on divestments of $1,463million, reported in interest and other income, mainly related to a package of assets in theUK North Sea, a credit of $772 million mainly reflecting the release of tax liabilities, andother items with a net positive impact of $34 million. Segment earnings in 2016 were a loss of $3,674 million, which included a net charge of$970 million. The net charge included impairment charges of $1,147 million (reported indepreciation), primarily related to shale and deep-water properties in North and SouthAmerica; redundancy and
Upstream
Key statistics $ million, except where indicated 2017 2016 2015
Segment earnings 1,551 (3,674 ) (8,833 )Including:
Revenue (including inter-segment sales) 40,192 32,936 33,563 Share of profit of joint ventures and associates 623 222 491 Interest and other income 1,188 839 1,819 Operating expenses [A] 12,656 14,501 15,740 Exploration 1,804 1,614 4,429 Depreciation, depletion and amortisation 17,303 16,779 20,404 Taxation charge/(credit) 2,409 (938 ) (927 )
Capital investment [A] 13,648 47,507 18,349 Divestments [A] 11,542 1,726 2,478 Oil and gas production available for sale (thousand boe/d) 2,777 2,784 2,323[A] See “Non-GAAP measures reconciliations” on pages 225-226.
STRATEGIC REPORT SHELL ANNUAL REPORT AND FORM 20-F 2017 31

restructuring charges of $654 million; a $235 million provision for onerous drilling rigcontracts; $198 million related to the reassessment of deferred tax positions in Malaysia;and a net charge on fair value accounting of certain commodity derivatives and gascontracts of $145 million. These charges were partly offset by a gain of $661 millionrelated to the impact of a strengthening Brazilian real on a deferred tax position,divestment gains of $645 million, reported in interest and other income, and a credit of$103 million reflecting a statutory tax rate reduction in the UK. Excluding the net charges described above, segment earnings in 2017 were $3,091million compared with a loss of $2,704 million in 2016. Earnings benefited from higherrealised oil and gas prices (around $3,700 million), lower taxes (around $1,480 million),mainly related to the movements in various deferred tax positions, and lower depreciation(around $800 million), mainly related to assets classified as held for sale and divestments.These impacts were partly offset by lower production volumes mainly due to divestments(around $140 million) and higher well write-offs (around $100 million). EARNINGS 2016-2015BG was consolidated within Shell’s results with effect from February 2016, following itsacquisition. Segment earnings in 2016 were a loss of $3,674 million, which included a net charge of$970 million as described on page 31 and above. Segment earnings in 2015 were a loss of $8,833 million, which included a net charge of$6,578 million. The net charge included $4,616 million related to impairments,redundancy and restructuring, and other items associated with the decision to ceaseAlaska drilling activities and the Carmon Creek project in Canada. The net charge alsoreflected other impairment charges of $3,466 million and a charge of $463 millionrelated to the impact of a weakening Brazilian real on a deferred tax position. Thesecharges were partly offset by gains on divestments of $1,603 million and a credit of $604million, reflecting a statutory tax rate reduction in the UK. Excluding these net charges, segment earnings in 2016 were a loss of $2,704 millioncompared with a loss of $2,255 million in 2015, principally as a result of lower oil andgas prices, and higher depreciation partly offset by higher production volumes, mainlydue to the acquisition of BG. CAPITAL INVESTMENTCapital investment in 2017 was $13.6 billion, compared with $47.5 billion in 2016.Capital investment in 2017 included $1.5 billion related to the acquisition of a 50%interest in Marathon Oil Canada Corporation (MOCC), while 2016 included $31.1 billionrelated to the acquisition of BG. Organic capital investment was $4.1 billion lower than in2016, reflecting our continuing efforts to curtail spending by reducing the number ofnew investment decisions and pursuing lower-cost development solutions. DIVESTMENTSDivestments in 2017 were $11.5 billion, compared with $1.7 billion in 2016. Divestmentsin 2017 were mainly the sale of our oil sands and in-situ interests in Canada, a package ofUK North Sea assets, our onshore assets in Gabon, and assets in the Delaware PermianBasin in the USA. PORTFOLIO AND BUSINESS DEVELOPMENTWe took the following key portfolio decisions: ■ In February 2017, we took the final investment decision (FID) to execute Phase 1 of
the Kaikias deep-water project in the USA, and Phase 2 was approved in April 2017.Kaikias (Shell interest 80%) is a subsea tie-back to the Shell-operated Ursa platform.Phase 1 will include three wells and Phase 2 will add an additional well, whichcollectively are expected to
reach a peak production of approximately 40 thousand boe/d. First oil is expected inJune 2018 for both Kaikias Phase 1 and Phase 2.
■ In December, Maersk Oil, as operator, announced FID for the redevelopment of theTyra gas field (Shell interest 36.8%) in Denmark. When completed in 2022, peakproduction is expected to be around 60 thousand boe/d.
■ In January 2018, we announced the FID for the redevelopment of the Penguins oil andgas field (Shell interest 50%) in the UK North Sea. The decision authorises theconstruction of a floating production, storage and offloading (FPSO) vessel, which isexpected to have a peak production (100%) of around 45 thousand boe/d.
We achieved the following operational milestones in 2017: ■ In Brazil, we announced first production at the Lula South deep-water development
(Shell interest 100%) via FPSO P66 in the Brazilian pre-salt block of the Santos Basin.■ Also in Brazil, together with our partners, we won 35-year production-sharing contracts
for three pre-salt exploration blocks in the Santos Basin. Two blocks are adjacent to theGato do Mato field (Shell interest 80% as operator) and the non-Shell-operatedSapinhoá field (Shell interest 30%), where Shell is already present, and the third is AltoCabo Frio West (Shell interest 55% as operator).
■ Also in Brazil, together with our partners, we announced the start of production testingat the Libra field FPSO in the Santos Basin. Petrobras, the operator, announced that theLibra consortium (Shell interest 20%) had submitted the declaration of commercialityand signed a contract to charter the first production FPSO of the north-west block ofLibra, now called Mero. The FPSO is expected to have a capacity of 180 thousandboe/d and production is scheduled to start in 2021.
■ In Nigeria, we announced first production at Phase 2 of the Gbaran-Ubie integrated oiland gas development (Shell interest 30%) in the Niger Delta region. Expected peakproduction is around 175 thousand boe/d.
■ In the UK, the non-Shell-operated Schiehallion redevelopment (Shell interestapproximately 45%) reached first production.
■ In the USA, we purchased the Turritella FPSO for the Stones deep-water developmentin the Gulf of Mexico. The FPSO has a daily production capacity of approximately 60thousand barrels of oil and 15 million standard cubic feet of natural gas.
In January 2018, we won nine exploration blocks in the deep-water bid round in Mexico;four blocks on our own, four with our partner Qatar Petroleum International Limited, andone with our partner Pemex Exploración y Producción. The total area of these nineblocks is 18,996 square kilometres. We will be the operator of all nine blocks. Also in January 2018, we announced one of our largest US Gulf of Mexico explorationfinds in the past decade from the Whale deep-water well. Whale is operated by Shell(60%) and co-owned by Chevron U.S.A. Inc. (40%). It was discovered in the AlaminosCanyon Block 772, adjacent to the Shell-operated Silvertip field and approximately 16kilometres from the Shell-operated Perdido platform. Evaluation of the discovery isongoing. We continued to divest selected assets during 2017, including: ■ In Canada, we sold all of our in-situ and undeveloped oil sands interests and our 60%
interest in the Athabasca Oil Sands Project (AOSP). Separately we acquired a 50%interest in MOCC, which holds a 20% interest in the AOSP.
■ In the UK, we sold a package of North Sea assets in November. This consisted of ourinterests in the Buzzard, Beryl, Bressay, Elgin-Franklin, J-Area, Everest, Lomond andErskine fields and the Greater Armada cluster, and a 10% interest in the Schiehallionfield.
STRATEGIC REPORT SHELL ANNUAL REPORT AND FORM 20-F 2017 32

■ In Gabon, we sold all of our onshore oil and gas operations and related infrastructure:five Shell-operated fields (Rabi, Toucan/Robin, Gamba/Ivinga, Koula/Damier, andBende/M’Bassou/Totou), non-Shell-operated interests in the Atora, Avocette, Coucal,and Tsiengui West fields, and the associated infrastructure of the onshore pipelinesystem from Rabi to Gamba and the Gamba Southern export terminal.
■ In the USA, we sold approximately 5,300 acres and associated producing assets in theEast Haley area of the Delaware Permian Basin in West Texas.
In Ireland, we reached an agreement with CPP Investment Board Europe S.A.R.L., asubsidiary of Canada Pension Plan Investment Board, to sell our 45% interest in theCorrib gas project. The transaction, which represents Shell’s exit from the upstreambusiness in Ireland, is subject to partner and regulatory approval and is expected toconclude in the second quarter of 2018. BUSINESS AND PROPERTYOur subsidiaries, joint ventures and associates are involved in all aspects of upstreamactivities, including matters such as land tenure, entitlement to produced hydrocarbons,production rates, royalties, pricing, environmental protection, social impact, exports,taxes and foreign exchange. The conditions of the leases, licences and contracts under which oil and gas interests areheld vary from country to country. In almost all cases outside North America, the legalagreements are generally granted by, or entered into with, a government, state-ownedcompany or government-run oil and gas company, and the exploration risk usually restswith the independent oil and gas company. In North America, these agreements may alsobe with private parties that own mineral rights. Of these agreements, the following aremost relevant to our interests: ■ Licences (or concessions), which entitle the holder to explore for hydrocarbons and
exploit any commercial discoveries. Under a licence, the holder bears the risk ofexploration, development and production activities, and is responsible for financingthese activities. In principle, the licence holder is entitled to the totality of productionless any royalties in kind. The government, state-owned company or government-runoil and gas company may sometimes enter into a joint arrangement as a participantsharing the rights and obligations of the licence but usually without sharing theexploration risk. In a few cases, the state-owned company, government-run oil and gascompany or agency has an option to purchase a certain share of production.
■ Lease agreements, which are typically used in North America and are usually governedby terms similar to licences. Participants may include governments or private entities,and royalties are either paid in cash or in kind.
■ Production-sharing contracts (PSCs) entered into with a government, state-ownedcompany or government-run oil and gas company. PSCs generally oblige theindependent oil and gas company, as contractor, to provide all the financing and bearthe risk of exploration, development and production activities in exchange for a shareof the production. Usually, this share consists of a fixed or variable part that is reservedfor the recovery of the contractor’s cost (cost oil). The remaining production is splitwith the government, state-owned company or government-run oil and gas companyon a fixed or volume/revenue-dependent basis. In some cases, the government, state-owned company or government-run oil and gas company will participate in the rightsand obligations of the contractor and will share in the costs of development andproduction. Such participation can be across the venture or on a field-by-field basis.Additionally, as the price of oil or gas increases above certain predetermined levels, theindependent oil and gas company’s entitlement share of production
normally decreases, and vice versa. Accordingly, its interest in a project may not be thesame as its entitlement.
EUROPEDenmarkWe have a non-operating interest in a producing concession in Denmark (Shell interest36.8%), which was granted in 1962 and expires in 2042. The Danish government is oneof our partners with a 20% interest. In December 2017, the FID for the Tyra redevelopment project was taken to ensurecontinued production from Denmark’s largest gas field. IrelandIn July 2017, we agreed to sell our 45% interest in the Corrib gas project. The transactionis expected to be completed in the second quarter of 2018. ItalyWe have a 39.23% interest in the Val d’Agri producing concession, operated by ENI. We also have a 25% interest in the Tempa Rossa concession operated by Total. TheTempa Rossa field is under development and first oil is expected in 2018. NetherlandsShell and ExxonMobil are 50:50 shareholders in Nederlandse Aardolie Maatschappij B.V.(NAM). An important part of NAM’s gas production comes from the onshore Groningengas field, in which EBN, a Dutch government entity, has a 40% interest and NAM a 60%interest. Production from the Groningen field induces earthquakes that cause damage to housesand other structures in the region leading to complaints from the local community. NAMis working with the Dutch government and stakeholders to fulfil its commitments to theresidents of the area, including the payment of all earthquake related cost. In addition,since 2013, the Dutch Minister of Economic Affairs and Climate Policy (the Minister) hasset an annual production level for the Groningen field taking into account all interests,including that of the safety of the residents, the security of supply of the domestic gasmarket and the supply commitments to offtakers in EU member states. Production iscapped at 21.6 billion cubic metres for the current gas year ending September 2018. In January 2018, an earthquake occurred that triggered the need for additional measures.The Dutch Mining Regulator has advised the Minister to further reduce the annualproduction from the Groningen field to a level of approximately 12 billion cubic metres.Before the end of September 2018, the Minister will take a decision on the productionlevel for the next gas year based on all interests at stake. The level for the gas year endingSeptember 2019 is expected to be lower than the current level. Apart from production reductions, a variety of measures have been taken by NAM, theMinister and the government, including an in-depth study and measuring programme(both sub-surface and above surface), the issuance of specific building regulations andthe establishment of a damage claims handling process under government supervision. The Dutch government and the shareholders in NAM are in discussions regarding thefuture of their cooperation in production from the Groningen field. See “Risk factors” onpage 14. NAM also has a 60% interest in the Schoonebeek oil field, and operates a significantnumber of other onshore gas fields and offshore gas fields in the North Sea.
STRATEGIC REPORT SHELL ANNUAL REPORT AND FORM 20-F 2017 33

NorwayWe are a partner in 38 production licences on the Norwegian continental shelf. We are theoperator in 17 of these, of which four are producing: the Draugen oil field (Shell interest44.6%), the Gaupe field (Shell interest 60%), the Knarr field (Shell interest 45%), and theOrmen Lange gas field (Shell interest 17.8%). We have interests in the producing fieldsTroll, Gjøa, Kvitebjørn, Sindre and Valemon, where we are not the operator. UKWe operate a significant number of our interests on the UK continental shelf on behalf ofa 50:50 joint arrangement with ExxonMobil. In addition to our oil and gas productionfrom North Sea fields, we have various interests in the Atlantic Margin area where we arenot the operator, principally in the West of Shetland area (Clair, Shell interestapproximately 28%, and Schiehallion, Shell interest approximately 45%). In November 2017, we sold our interests in the UK North Sea assets Buzzard, Beryl,Bressay, Elgin-Franklin, J-Area, Everest, Lomond and Erskine fields and the GreaterArmada cluster, as well as a 10% interest in Schiehallion. In January 2018, we announced the FID for the redevelopment of the Penguins oil andgas field (Shell interest 50%) in the UK North Sea. Discovered in 1974, the field was firstdeveloped in 2002. The decision authorises the construction of an FPSO, the first newmanned installation for Shell in the northern North Sea in almost 30 years. The FPSO isexpected to have a peak production (100%) of around 45 thousand boe/d. The field is in165 metres of water, approximately 240 kilometres north east of the Shetland Islands. Rest of EuropeWe also have interests in Albania, Bulgaria, Cyprus, Germany and Greenland. ASIA (INCLUDING THE MIDDLE EAST AND RUSSIA)BruneiShell and the Brunei government are 50:50 shareholders in Brunei Shell PetroleumCompany Sendirian Berhad (BSP). BSP has long-term oil and gas concession rightsonshore and offshore Brunei, and sells most of its gas production to Brunei LNGSendirian Berhad (see “Integrated Gas” on page 26), with the remainder (approximately13% in 2017) sold in the domestic market. In April 2017, BSP and the government of Brunei announced an exploration success inthe Lumut area, with the Layang-Layang well discovery. In addition to our interest in BSP, we are the operator of the Block A concession (Shellinterest 53.9%), which is under exploration and development, and the operator ofexploration Block Q (Shell interest 50%). We have a 35% non-operating interest in theBlock B concession, where gas and condensate are produced from the Maharaja Lelafield. We also have non-operating interests in deep-water exploration Block CA-2 (Shell interest12.5%) and in exploration Block N (Shell interest 50%), both under PSCs. IranShell transactions with Iran are disclosed separately. See “Section 13(r) of the USSecurities Exchange Act of 1934 Disclosure” on page 224.
IraqWe have a 20% interest in the development and production services contract for the WestQurna 1 field, which is operated by ExxonMobil. This interest is subject to an ongoingsales process.
We also have a 44% interest in the Basrah Gas Company, which gathers, treats andprocesses associated gas produced from the Rumaila, West Qurna 1 and Zubair fields thatwas previously being flared. The processed gas and associated products, such ascondensate and liquefied petroleum gas (LPG), are sold mainly to the domestic marketand surplus condensate and LPG are exported. In 2017, Basrah Gas processed on averagearound 700 million standard cubic feet per day of associated gas into dry gas, condensateand LPG. We have a 45% interest in the Majnoon oil field that we operate under a development andproduction services contract. In September 2017, the Iraqi government and Shellannounced that we will exit the Majnoon development and production services contractand hand over the operations to the Iraqi government or its nominee. KazakhstanWe are the joint operator of the onshore Karachaganak oil and condensate field (Shellinterest 29.25%), where we have a licence to the end of 2037. Karachaganak producedaround 393 thousand boe/d, on a 100% basis, in 2017. We have a 16.8% interest in the North Caspian Sea Production Sharing Agreement whichcovers, among others, the Kashagan field in the Kazakh sector of the Caspian Sea. TheNorth Caspian Operating Company is the operator. This shallow-water field covers anarea of approximately 3,400 square kilometres. Phase 1 development of the field isexpected to lead to plateau oil production capacity of about 370 thousand b/d by 2019,on a 100% basis, with the possibility of increases with additional phases of development.Production started in 2016.
We also have an interest of 55% in the Pearls PSC in the Kazakh sector of the CaspianSea. It includes two oil discoveries, Auezov and Khazar. The Pearls PSC acreagedecreased from around 900 square kilometres to around 520 in 2017, due torelinquishment of the Naryn and Tulpar licences, which were no longer deemedeconomically viable. We also have a 7.43% interest in Caspian Pipeline Consortium, which owns and operatesan oil pipeline running from the Caspian Sea to the Black Sea across parts of Kazakhstanand Russia.
MalaysiaWe explore for and produce oil and gas offshore Sabah and Sarawak under 17 PSCs, inwhich our interests range from 20% to 75%. This includes the SK319 PSC which expiredat the end of 2017 and for which we have applied for an extension of the explorationperiod. Offshore Sabah, we operate five producing oil fields (Shell interests ranging from 29% to50%). These include the Gumusut-Kakap deep-water field (Shell interest 29%), whereproduction is via a dedicated floating production system, and the Malikai deep-water field(Shell interest 35%). We also have a 21% interest in the Siakap North-Petai deep-waterfield and a 30% interest in the Kebabangan field, both operated by third parties. In 2017, we acquired a 25.1% non-operating interest in Block N. In 2016, we agreed to sell our 50% interest in the 2011 North Sabah EOR ProductionSharing Contract. This transaction is expected to complete by the end of March 2018.
STRATEGIC REPORT SHELL ANNUAL REPORT AND FORM 20-F 2017 34

Offshore Sarawak, we are the operator of 12 producing gas fields (Shell interests rangingfrom 37.5% to 50%). The M3S field (Shell interest 70%) has reached the end of its lifeand will be abandoned. Nearly all of the gas produced offshore Sarawak is supplied toMalaysia LNG in Bintulu and to our gas-to-liquids plant in Bintulu. See “Integrated Gas”on page 26. We also have a 40% interest in the 2011 Baram Delta EOR PSC and a 50% interest inBlock SK-307. Additionally, we have interests in four exploration and developmentPSCs: SK318, SK319, SK320 and SK408. OmanWe have a 34% interest in Petroleum Development Oman (PDO); the Omani governmenthas a 60% interest. PDO is the operator of more than 160 oil fields, mainly located incentral and southern Oman, over an area of 85,823 square kilometres. The concessionexpires in 2044. We also have a 17% interest in the Mukhaizna oil field. United Arab EmiratesIn Abu Dhabi, we have a 15% interest in the licence of ADNOC Gas Processing(previously named Abu Dhabi Gas Industries Limited, or GASCO), which expires in2028. ADNOC Gas Processing exports propane, butane and heavier-liquid hydrocarbons,which it extracts from the wet gas associated with the oil produced by ADNOC Onshore(previously named Abu Dhabi Company for Onshore Oil Operations, or ADCO). Rest of AsiaWe also have interests in Jordan, Kuwait, Mongolia, Myanmar, the Philippines, State ofPalestine and Turkey. AFRICAEgyptWe have a 50% interest in the Badr Petroleum Company (BAPETCO), a self-operatedjoint venture between Shell and the Egyptian General Petroleum Corporation (EGPC).BAPETCO onshore operations are in the Western Desert where we have an interest in nineoil and gas producing development leases, as well as four exploration concessions (NorthEast Obaiyed, North Matrouh, North East Alam El Shawish and North Umbaraka). We have interests in two gas-producing areas offshore the Nile Delta. We have a 40%interest in the Rashid Petroleum Company, a self-operated joint venture between Shell,EGPC and Edison, which operates the Rosetta concession (Shell interest 80%). We also have a 25% interest in the Burullus Gas Company (Burullus), a self-operated jointventure between Shell, EGPC and PETRONAS. Burullus operates the West Delta DeepMarine concession (Shell interest 50%), which supplies gas to both the domestic marketand the Egyptian LNG plant (see “Integrated Gas” on page 27). We also have a 60% interest in the development rights over the Harmattan Deepdiscovery and in the Notus discovery offshore the Nile Delta. GabonIn October 2017, we sold our interests in eight onshore mining concessions and relatedinfrastructure. We continue to hold 75% interests in Shell-operated Gabon deep-waterexploration licences. NigeriaOur share of production, onshore and offshore, in Nigeria was 266 thousand boe/d in2017, compared with 258 thousand boe/d in 2016. Security issues, sabotage and crude oiltheft in the Niger Delta continued to be significant challenges in 2017.
OnshoreThe Shell Petroleum Development Company of Nigeria Limited (SPDC) is the operator ofa joint arrangement (Shell interest 30%) that has 17 Niger Delta onshore oil mining leases(OML), which expire in 2019; the renewal application process has commenced. Of theNigeria onshore proved reserves, 89 million boe are expected to be produced before theexpiry of the current licences, and 450 million boe beyond. To provide funding,modified carry agreements and alternative funding arrangements are in place for certainkey projects and are being successfully implemented. In 2017, we announced first production at Phase 2 of the Gbaran-Ubie integrated oil andgas development (Shell interest 30%) in the Niger Delta region. Expected peakproduction is around 175 thousand boe/d. SPDC supplies gas to Nigeria LNG Ltd (see “Integrated Gas” on page 27) mainly throughits Gbaran-Ubie and Soku projects. OffshoreOur main offshore deep-water activities are carried out by Shell Nigeria Exploration andProduction Company Limited (SNEPCO, Shell interest 100%), which has interests in fourdeep-water blocks, under PSC terms, in which production is via two FPSOs – Bonga andErha. SNEPCO operates OMLs 118 (including the Bonga field FPSO, Shell interest 55%)and 135 (Bolia and Doro, Shell interest 55%) and has a 43.75% non-operating interest inOML 133 (including the Erha FPSO) and a 50% non-operating interest in oil prospectinglicence (OPL) 245 (Zabazaba, Etan). Authorities in various countries are investigating our investment in Nigerian oil blockOPL 245 and the 2011 settlement of litigation pertaining to that block. See Note 25 tothe “Consolidated Financial Statements” on pages 175-176. SNEPCO also has an approximate 43% interest in the Bonga South West/Aparodevelopment via its 55% interest in OML 118. Following the decision to delay the BongaSouth West/Aparo project, a reframing exercise is under way to make this projecteconomically viable in the current business environment. FID is not expected before2019. SPDC also has three shallow-water licences (OMLs 74, 77 and 79) and a 40% interest inthe non-Shell-operated Sunlink joint venture that has one shallow-water licence (OML144); all four OMLs expire in 2034. In our Nigerian operations, we face various risks and adverse conditions which couldhave a material adverse effect on our operational performance, earnings, cash flows andfinancial condition (see “Risk factors” on page 14). There are limitations to the extent towhich we can mitigate these risks. We carry out regular portfolio assessments to remain acompetitive player in Nigeria for the long term. We support the Nigerian government’sefforts to improve the efficiency, functionality and domestic benefits of Nigeria’s oil andgas industry, and we monitor legislative developments. We monitor the security situationand liaise with host communities, governmental and non-governmental organisations tohelp promote peace and safe operations. We continue to provide transparency of spillsmanagement and reporting, along with our deployment of oil-spill response capabilityand technology. We execute a maintenance strategy to support sustainable equipmentreliability, and have implemented a multi-year programme to reduce routine flaring ofassociated gas. See “Climate change and energy transition” on page 66. Rest of AfricaWe also have interests in Algeria, Kenya, Namibia, South Africa, Tanzania and Tunisia.
STRATEGIC REPORT SHELL ANNUAL REPORT AND FORM 20-F 2017 35

NORTH AMERICACanadaWe have approximately 1,500 mineral leases in Canada, mainly in Alberta and BritishColumbia. We produce and market natural gas, natural gas liquids, synthetic crude oil andbitumen. In addition, we have significant exploration acreage offshore. ShalesWe have approximately 1,200 mineral leases with over 2.6 million net mineral acres. Ourposition is primarily in the Duvernay play in Alberta and the Montney play in BritishColumbia. Activity includes drill-to-fill of our existing infrastructure and an investmentfocus on our liquid-rich shale acreage. As part of our shales focus, we sold all of our in-situ assets in May 2017. Our share of shales production averaged 129 thousand boe/d in2017. In 2017, we drilled 86 wells. We have interests in 882 productive wells. We operate fournatural gas processing and sulphur-extraction plants in Alberta and four natural gasprocessing plants in British Columbia. Bitumen and synthetic crude oilSynthetic crude oil is produced by mining bitumen-saturated sands, extracting thebitumen from the sands and transporting it to a processing facility where hydrogen isadded to produce a wide range of feedstocks for refineries. In May 2017, we sold all ofour in-situ and undeveloped oil sands interests and our share in the Athabasca Oil SandsProject (AOSP). Separately we acquired a 50% interest in MOCC, which holds a 20%interest in the AOSP. Carbon capture and storage (CCS)We operate the Quest CCS project, which captured and safely stored more than 1 milliontonnes of carbon dioxide in 2017. OffshoreWe have a 31.3% interest in the Sable Offshore Energy project, a natural-gas complex offthe east coast of Canada, and other acreages in deep-water offshore Nova Scotia andNewfoundland. We have relinquished all licences for the Shelburne exploration projectoffshore Nova Scotia. We have a number of exploration licences off the west coast ofBritish Columbia and in the Mackenzie Delta in the Northwest Territories. USAWe have nearly 32,000 mineral leases in the USA. We produce oil and gas in deep waterin the Gulf of Mexico, heavy oil in California and oil and gas from shale in Pennsylvania,Texas and Louisiana. The majority of our oil and gas production interests are acquiredunder leases granted by the owner of the minerals underlying the relevant acreage,including many leases for federal onshore and offshore tracts. Such leases usually run onan initial fixed term that is automatically extended by the establishment of production foras long as production continues, subject to compliance with the terms of the lease(including, in the case of federal leases, extensive regulations imposed by federal law). Gulf of MexicoThe Gulf of Mexico is our major production area in the USA and accounts for around57% of our oil and gas production in North America. We have an interest inapproximately 180 federal offshore production leases and our share of productionaveraged 247 thousand boe/d in 2017. In January 2018, we announced one of our largest US Gulf of Mexico exploration findsin the past decade from the Whale deep-water well. Whale is operated by Shell (60%) andco-owned by Chevron U.S.A. Inc. (40%). It was discovered in the Alaminos CanyonBlock 772, adjacent to the Shell-operated Silvertip field and approximately 16 kilometresfrom the Shell-operated Perdido platform. Evaluation of the discovery is ongoing.
We are the operator of eight production hubs – Mars A, Mars B, Auger, Perdido, Ursa,Enchilada/Salsa, Ram Powell and Stones – as well as the West Delta 143 ProcessingFacilities (Shell interests ranging from 38% to 100%). We also have non-operatinginterests in Nakika (Shell interest 50%) and Caesar Tonga (Shell interest 22.5%). Ouroperated interest in Coulomb (Shell interest 100%) is tied into Nakika. We continue with development of the Appomattox project, with first oil expected in2019. We purchased the Turritella FPSO for the Stones deep-water development. TheFPSO has a daily production capacity of approximately 60 thousand barrels of oil and15 million standard cubic feet of natural gas. Kaikias (Shell interest 80%) is a subsea tie-back to the Shell-operated Ursa platform. In2016, we commenced the drilling campaign for Kaikias Phase 1. In February 2017, wefully sanctioned Phase 1 of the Kaikias deep-water project and Phase 2 was approved inApril 2017. Phase 1 will include three wells and Phase 2 will add an additional well,which collectively will be system constrained at the peak production of approximately40 thousand boe/d. First oil is expected in June 2018 for both Kaikias Phase 1 andPhase 2. ShalesWe have approximately 30,000 mineral leases with nearly 1.5 million net mineral acres.Our activity is focused in the Permian Basin in West Texas and the Marcellus and Uticaplays in Pennsylvania. We also have a non-Shell-operated interest in the Haynesville shalegas formation in Northern Louisiana. In 2017, we drilled 153 wells. We have interests in more than 2,300 productive wells andoperate four central processing facilities. The USA represents nearly 70% of our shalesproved reserves and 88% of our shales liquids proved reserves. Our share of shalesproduction averaged 137 thousand boe/d in 2017. CaliforniaWe have a 51.8% interest in Aera Energy LLC which operates approximately 15,000wells in the San Joaquin Valley in California, mostly producing heavy oil and associatedgas. AlaskaIn 2017, we relinquished our last remaining federal lease in the Chukchi Sea and have nofurther plans for frontier exploration offshore Alaska. With the exception of tworemaining positions in the long-established North Slope area, we have exited all otherleases. We retain a non-operating interest in 13 federal leases, operated by ENI, whichwas increased from 40% to 50% at zero cost. An exploratory drilling operation for thisjoint venture was permitted by ENI and is under way. We continue to evaluate our 18state leases at nearby Western Harrison Bay, which have geologic affinity with recentdiscoveries announced by other North Slope operators. Rest of North AmericaWe also have interests in Honduras and Mexico. SOUTH AMERICAArgentinaShalesWe have more than 260,000 net mineral acres in the Vaca Muerta basin, a liquids and gasrich play located in the Neuquén Province. We have interests in 29 productive wells. Wedrilled 10 wells in 2017 in our core operated acreage. We have 90% ownership in ouroperated Sierras Blancas/Cruz de Lorena central processing facility.
STRATEGIC REPORT SHELL ANNUAL REPORT AND FORM 20-F 2017 36

BrazilWe operate several producing fields in the Campos Basin, offshore Brazil. They consist ofthe Bijupirá and Salema fields (Shell interest 80%) and the BC-10 field (Shell interest50%). In the Santos Basin, we have a 30% interest in the BM-S-9 concession that operates in theSapinhoa and Lapa fields, as well as 25% interests in the BM-S-11 concession thatoperates in the Lula, Iracema, Berbigão, Sururu and Atapú West fields. The Lula,Sapinhoa, Berbigão, Sururu and Atapú West field accumulations are subject to unitisationagreements. Within these fields we have 10 producing FPSOs, of which the tenth (P66)reached first oil in 2017 and is expected to ramp up to full production capacity in 2018.Four FPSOs are expected to be brought online over the period 2018-2020 (Lula North,Lula Extreme South, Berbigão and Atapú). A 15th FPSO has been sanctioned, potentialoptions for its deployment are being matured and discussed with the operator. We have further development and exploration leases in the Santos Basin within the Libra(Shell interest 20%) and Gato-do-Mato BM-S-54 (Shell interest 80%) fields and have afurther 20% non-Shell-operated interest in the Sagitario BM-S-50 offshore explorationblock also in the Santos Basin. In 2017, together with our partners, we announced thestart of production testing at the Libra field FPSO. A contract was signed to charter thefirst production FPSO, which is expected to have a capacity of 180 thousand boe/d and isscheduled to start production in 2021. We operate 10 offshore exploration blocks in the Barreirinhas Basin (Shell interestsranging from 50% to 100%). Together with our partners, we won three 35-year production-sharing contracts for pre-salt blocks located in the Santos Basin. Two blocks are adjacent to the Gato do Mato field(Shell interest 80% as operator) and the non-Shell-operated Sapinhoá field (Shell interest30%), where Shell is already present, and the third is Alto Cabo Frio West (Shell interest55% as operator). Rest of South AmericaWe also have interests in Colombia and Uruguay. TRADING AND SUPPLYWe market and trade crude oil from some of our Upstream operations.
STRATEGIC REPORT SHELL ANNUAL REPORT AND FORM 20-F 2017 37

PROVED RESERVESThe proved oil and gas reserves of Shell subsidiaries and the Shell share of the proved oiland gas reserves of joint ventures and associates are set out in more detail in“Supplementary information – oil and gas (unaudited)” on pages 179-188. Before taking production into account, our proved reserves increased by 368 million boein 2017. This comprised increases of 343 million boe from Shell subsidiaries and 25million boe from the Shell share of joint ventures and associates. After taking production into account, our proved reserves decreased by 1,015 millionboe in 2017 to 12,233 million boe at December 31, 2017. In order to illustrate the potential impact of increasing commodity prices on our 2016proved reserves base, we replaced the 2016 yearly average price with the 2017 yearlyaverage price in the analysis below, holding all other variables, such as 2016 costsestimates, constant. Applying this methodology, 487 million boe of proved reserveswould have been included in our SEC proved reserves at December 31, 2016, if the 2017yearly average price had been used. This positive price effect of 487 million boe was thecombined effect of an increase of 404 million boe due to a later economic cut-off, anincrease of 212 million boe due to proved undeveloped
reserves (PUD) becoming economic, and a decrease of 129 million boe due to a lowerentitlement share as a result of the higher yearly average price. SHELL SUBSIDIARIESBefore taking production into account, Shell subsidiaries’ proved reserves increased by343 million boe in 2017. This comprised increases of 916 million barrels of oil andnatural gas liquids and 758 million boe of natural gas, partly offset by a decrease of1,331 million barrels of synthetic crude oil. The 343 million boe increase is the net effectof a net increase of 927 million boe from revisions and reclassifications (which included adecrease of 170 million boe from a decreased entitlement share in production-sharing andtax/variable royalty contracts due to the higher yearly average price); an increase of 97million boe from improved recovery; an increase of 706 million boe from extensions anddiscoveries; and a net decrease of 1,387 million boe related to purchases and sales. After taking into account production of 1,206 million boe (of which 38 million boe wereconsumed in operations), Shell subsidiaries’ proved reserves decreased by 863 millionboe in 2017 to 10,177 million boe. Shell subsidiaries’ proved developed reserves (PD)increased by 103 million boe to 8,180 million boe, and PUD decreased by 966 millionboe to 1,997 million boe.
Oil and gas information
Proved developed and undeveloped reserves of Shell subsidiaries and Shell share of joint ventures and associates
Crude oil andnatural gas liquids
(million barrels) Natural gas
(thousand million scf) Synthetic crude oil
(million barrels) Bitumen
(million barrels) Total
(million boe)[A] Shell subsidiaries Increase/(decrease) in 2017:
Revisions and reclassifications 531 2,304 (3 ) 2 927 Improved recovery 73 140 — — 97 Extensions and discoveries 374 1,925 — — 706 Purchases and sales of minerals in place (62 ) 29 (1,328 ) (2 ) (1,387 )Total before taking production into account 916 4,398 (1,331 ) — 343 Production [B] (595 ) (3,333 ) (34 ) (2 ) (1,206 )Total 321 1,065 (1,365 ) (2 ) (863 )
At January 1, 2017 3,979 29,259 2,014 2 11,040 At December 31, 2017 4,300 30,324 649 — 10,177 Shell share of joint ventures and associates Increase/(decrease) in 2017:
Revisions and reclassifications 82 (366 ) — — 19 Improved recovery 3 1 — — 3 Extensions and discoveries 1 11 — — 3 Total before taking production into account 86 (354 ) — — 25 Production [C] (36 ) (820 ) — — (177 )Total 50 (1,174 ) — — (152 )
At January 1, 2017 263 11,282 — — 2,208 At December 31, 2017 313 10,108 — — 2,056 Total
Increase/(decrease) before taking production into account 1,002 4,044 (1,331 ) — 368 Production (631 ) (4,153 ) (34 ) (2 ) (1,383 )Increase/(decrease) 371 (109 ) (1,365 ) (2 ) (1,015 )
At January 1, 2017 4,242 40,541 2,014 2 13,248 At December 31, 2017 4,613 40,432 649 — 12,233 Reserves attributable to non-controlling interest in Shell subsidiaries at December 31, 2017 — 2 325 — 325[A] Natural gas volumes are converted into oil equivalent using a factor of 5,800 standard cubic feet (scf) per barrel.[B] Included 38 million barrels of oil equivalent (boe) consumed in operations (natural gas: 215 thousand million scf; synthetic crude oil: 1 million barrels).[C] Included 7 million boe consumed in operations (natural gas: 41 thousand million scf).
STRATEGIC REPORT SHELL ANNUAL REPORT AND FORM 20-F 2017 38

Synthetic crude oilThe 343 million boe increase in Shell subsidiaries’ proved reserves before takingproduction into account in 2017 included a decrease of 1,331 million barrels of syntheticcrude oil. This was mainly due to sales and purchases of minerals in place. In 2017,synthetic crude oil production was 34 million barrels, of which 1 million barrels wereconsumed in operations. At December 31, 2017, synthetic crude oil proved reserves were 649 million barrels, allof which were PD. BitumenBitumen activities were sold in 2017. Prior to sale, bitumen crude oil production was 2million barrels with minimal volumes consumed in operations. SHELL SHARE OF JOINT VENTURES AND ASSOCIATESBefore taking production into account, the Shell share of joint ventures and associates’proved reserves increased by 25 million boe in 2017. This comprised an increase of 86million barrels of crude oil and natural gas liquids and a decrease of 61 million boe (354thousand million scf) of natural gas. The 25 million boe increase comprises a net increaseof 19 million boe from revisions and reclassifications (which included a decrease of 2million boe from a decreased entitlement share in production sharing and tax/variableroyalty contracts due to the higher yearly average price), and increases of 3 million boefrom improved recovery and 3 million boe from extensions and discoveries. After taking into account production of 177 million boe (of which 7 million boe wereconsumed in operations), the Shell share of joint ventures and associates’ proved reservesdecreased by 152 million boe to 2,056 million boe at December 31, 2017. The Shell share of joint ventures and associates’ PD increased by 40 million boe to 1,876million boe, and PUD decreased by 192 million boe to 180 million boe. PROVED UNDEVELOPED RESERVESIn 2017, Shell subsidiaries and the Shell share of joint ventures and associates PUDdecreased by 1,158 million boe to 2,177 million boe.There were decreases of 627 million boe in Muskeg River Mine (Canada) mainly due todivestment, 519 million boe across Gorgon (Australia), Lula (Brazil) and Kashagan(Kazakhstan) mainly due to maturation to PD, and 201 million boe in Groningen (theNetherlands) mainly due to a negative revision of compression volumes. These werepartly offset by an increase of 117 million boe in the Permian (USA) mainly due toextensions and discoveries and a net increase of 72 million boe spread across other fields. 1,566 million boe PUD volumes were matured to PD. This included 297 million boe thatwere matured to PD from contingent resources through PUD as a result of projectexecution during the year. PUD held for five years or more (PUD5+) at December 31, 2017, amounted to 552million boe, a decrease of 942 million boe compared with the end of 2016. These PUD5+remain undeveloped because development either: requires the installation of compressionequipment and the drilling of additional wells, which will be executed when required tosupport existing gas delivery commitments (Russia), or will take longer than five yearsbecause of the complexity and scale of the project (Australia and Kazakhstan). The decrease in PUD5+ during 2017 was driven mainly by changes in Muskeg RiverMine, Gorgon, Groningen, and Kashagan as mentioned above. The fields with the largest PUD5+ at December 31, 2017, were Prelude, Gorgon andJansz-Io (Australia), Clair (UK) and Lunskoye (Russia).
During 2017, we spent $8.8 billion on development activities related to PUD maturation. DELIVERY COMMITMENTSWe sell crude oil and natural gas from our producing operations under a variety ofcontractual obligations. Most contracts generally commit us to sell quantities based onproduction from specified properties, although some natural gas sales contracts specifydelivery of fixed and determinable quantities, as discussed below. In the past three years, we met our contractual delivery commitments, with the notableexceptions of Brunei, Egypt and Trinidad and Tobago. In the period 2018-2020, we arecontractually committed to deliver to third parties and joint ventures and associates a totalof approximately 7,250 thousand million scf of natural gas from our subsidiaries, jointventures and associates. The sales contracts contain a mixture of fixed and variablepricing formulae that are generally referenced to the prevailing market price for crudeoil, natural gas or other petroleum products at the time of delivery. In the period 2018-2020, we expect to meet our delivery commitments for almost all ofour companies in the different countries in which we operate, with an estimated 80%coming from PD, 8% through the delivery of gas that comes available to us from payingroyalties in cash, and 12% from the development of PUD as well as other new projectsand purchases. The key exceptions are: ■ Egypt (with a shortfall of 445 thousand million scf of natural gas), where the diversion
of gas from the offshore West Delta Deep Marine fields to domestic use is expected tocontinue in the near future, leaving our commitment to deliver liquefied natural gasunder force majeure; and
■ Trinidad and Tobago where PD for most fields fail the economic test at the yearlyaverage price for natural gas at the end of 2017. However, we expect to cover 77% ofour delivery commitments from existing developed resource volumes, resulting in anexpected true shortfall of some 130 thousand million scf.
STRATEGIC REPORT SHELL ANNUAL REPORT AND FORM 20-F 2017 39

EXPLORATIONIn 2017, we made a notable discovery in the US Gulf of Mexico, which is beingevaluated further in order to establish the extent of commercially producible volumes (see“Upstream” on page 32). In Brazil, together with our partners we won 35-yearproduction-sharing contracts for three pre-salt exploration blocks in the Santos Basin,including the new exploration block Alto Cabo Frio West (Shell interest 55% as operator).Brunei Shell Petroleum Company and the government of Brunei also announcedexploration success with the Layang-Layang well discovery in the Lumut area. In 2017, we participated in 67 productive exploratory wells with proved reservesallocated (Shell share: 52 wells). For further information, see ‘’SupplementaryInformation – oil and gas (unaudited)’’ on page 197.
In total, the net undeveloped acreage in our exploration portfolio decreased by around 54million acres in 2017. The largest contributions were acreage divestments in Mongoliaand South Africa. In January 2018, we won nine exploration blocks in the deep-water bid round in Mexico.The total area of these nine blocks (all of which we will operate) is 18,996 squarekilometres.
Summary of proved oil and gas reserves of Shell subsidiaries and Shell share of joint ventures and associates (at December 31, 2017)
Based on average prices for 2017
Crude oil andnatural gas liquids
(million barrels) Natural gas
(thousand million scf) Synthetic crude oil
(million barrels) Total
(million boe)[A] Proved developed Europe 261 8,033 — 1,646 Asia 1,617 15,735 — 4,330 Oceania 46 5,045 — 916 Africa 373 1,493 — 630 North America
USA 569 1,652 — 854 Canada 21 859 649 818
South America 651 1,225 — 862 Total proved developed 3,538 34,042 649 10,056 Proved undeveloped Europe 107 192 — 140 Asia 166 1,051 — 347 Oceania 86 2,952 — 595 Africa 90 589 — 192 North America
USA 330 917 — 488 Canada 1 413 — 72
South America 295 276 — 343 Total proved undeveloped 1,075 6,390 — 2,177 Total proved developed and undeveloped Europe 368 8,225 — 1,786 Asia 1,783 16,786 — 4,677 Oceania 132 7,997 — 1,511 Africa 463 2,082 — 822 North America
USA 899 2,569 — 1,342 Canada 22 1,272 649 890
South America 946 1,501 — 1,205 Total 4,613 40,432 649 12,233 Reserves attributable to non-controlling interest in Shell subsidiaries — 2 325 325[A] Natural gas volumes are converted into oil equivalent using a factor of 5,800 scf per barrel.
STRATEGIC REPORT SHELL ANNUAL REPORT AND FORM 20-F 2017 40

LOCATION OF OIL AND GAS EXPLORATION AND PRODUCTION ACTIVITIES
Location of oil and gas exploration and production activities [A] (at December 31, 2017)
Exploration
Developmentand/or
production Shell operator[B]Europe
Albania ■ ■ Bulgaria ■ ■ Cyprus ■ ■ Denmark ■ ■ Germany ■ ■ Greenland ■ ■ Ireland ■ ■ ■ Italy ■ ■ Netherlands ■ ■ ■ Norway ■ ■ ■ UK ■ ■ ■
Asia Brunei ■ ■ ■ China ■ ■ ■ India ■ ■ Indonesia ■ ■ ■ Iraq ■ Jordan ■ ■ Kazakhstan ■ ■ Malaysia ■ ■ ■ Myanmar ■ ■ Oman ■ ■ Philippines ■ ■ ■ Qatar ■ ■ Russia ■ ■ ■ State of Palestine ■ ■ Thailand ■ Turkey ■ ■
Oceania Australia ■ ■ ■ New Zealand ■ ■ ■
Africa Algeria ■ Egypt ■ ■ ■ Gabon ■ ■ Kenya ■ ■ Namibia ■ ■ Nigeria ■ ■ ■ Tanzania ■ ■ ■ Tunisia ■ ■
North America Canada ■ ■ ■ Mexico ■ USA ■ ■ ■
South America Argentina ■ ■ ■ Bolivia ■ ■ ■ Brazil ■ ■ ■ Colombia ■ ■ Trinidad and Tobago ■ ■ ■ Uruguay ■ ■
[A] Includes joint ventures and associates. Where a joint venture or an associate has properties outside its base country, those properties are not shown in this table. [B] In several countries where “Shell operator” is indicated, Shell is the operator of some but not all exploration and/or production ventures.
STRATEGIC REPORT SHELL ANNUAL REPORT AND FORM 20-F 2017 41

OIL AND GAS PRODUCTION AVAILABLE FOR SALE
Crude oil and natural gas liquids [A] Thousand barrels 2017 2016 2015
Shell
subsidiaries
Shell share ofjoint venturesand associates
Shellsubsidiaries
Shell share ofjoint venturesand associates
Shellsubsidiaries
Shell share ofjoint venturesand associates
Europe Denmark 15,467 — 15,423 — 17,396 — Italy 8,733 — 6,818 — 11,179 — Norway 19,529 — 21,656 — 14,337 — UK 45,020 — 41,426 — 20,762 — Other [B] 860 1,272 877 872 874 1,311
Total Europe 89,609 1,272 86,200 872 64,548 1,311 Asia
Brunei 1,138 15,831 952 17,402 823 18,663 Kazakhstan 29,491 — 21,330 — — — Malaysia 26,574 — 27,241 — 22,980 — Oman 77,687 — 80,567 — 78,404 — Russia 22,049 10,899 22,134 10,966 22,016 10,273 Other [B] 30,180 7,859 49,128 7,850 44,489 7,923
Total Asia 187,119 34,589 201,352 36,218 168,712 36,859 Total Oceania [B] 9,098 — 8,524 1,268 7,858 3,050 Africa
Gabon 9,750 — 12,838 — 12,472 — Nigeria 56,337 — 62,739 — 67,832 — Other [B] 9,003 — 9,427 — 6,159 —
Total Africa 75,090 — 85,004 — 86,463 — North America
USA 109,430 — 102,795 — 104,263 — Canada 10,775 — 10,883 — 8,599 —
Total North America 120,205 — 113,678 — 112,862 — South America
Brazil 111,093 — 78,477 — 13,307 — Other [B] 3,325 — 2,935 — 576 —
Total South America 114,418 — 81,412 — 13,883 — Total 595,539 35,861 576,170 38,358 454,326 41,220[A] Reflects 100% of production of subsidiaries except in respect of production-sharing contracts (PSCs), where the figures shown represent the entitlement of the subsidiaries concerned under those contracts. [B] Comprises countries where 2017 production was lower than 7,300 thousand barrels or where specific disclosures are prohibited.
Synthetic crude oil Thousand barrels 2017 2016 2015
Shell
subsidiaries Shell
subsidiaries Shell
subsidiaries North America – Canada 33,183 53,603 49,891
Bitumen Thousand barrels 2017 2016 2015
Shell
subsidiaries Shell
subsidiaries Shell
subsidiaries North America – Canada 1,681 4,606 5,258
STRATEGIC REPORT SHELL ANNUAL REPORT AND FORM 20-F 2017 42

Natural gas [A] Million standard cubic feet 2017 2016 2015
Shell
subsidiaries
Shell share ofjoint venturesand associates
Shellsubsidiaries
Shell share ofjoint venturesand associates
Shellsubsidiaries
Shell share ofjoint venturesand associates
Europe Denmark 52,105 — 47,143 — 48,211 — Germany 48,002 — 51,483 — 58,230 — Ireland 52,515 — 44,660 — 27 — Netherlands — 343,126 — 402,759 — 429,626 Norway 243,352 — 242,736 — 253,108 — UK 174,478 — 190,185 — 101,276 — Other [B] 13,125 — 10,076 — 15,865 —
Total Europe 583,577 343,126 586,283 402,759 476,717 429,626 Asia
Brunei 29,880 158,877 26,918 155,881 21,337 162,862 China 43,899 — 43,699 — 46,481 — Kazakhstan 80,623 — 77,122 — — — Malaysia 221,590 — 221,661 — 254,523 — Philippines 42,958 — 45,070 — 41,430 — Russia 4,052 137,890 4,141 133,396 3,887 131,697 Thailand 60,742 — 59,774 — Other [B] 288,728 118,352 383,763 118,366 345,020 118,421
Total Asia 772,472 415,119 862,148 407,643 712,678 412,980 Oceania
Australia 591,860 18,708 418,793 36,704 132,209 67,382 New Zealand 51,943 — 58,239 — 55,906 —
Total Oceania 643,803 18,708 477,032 36,704 188,115 67,382 Africa
Egypt 122,439 — 145,198 — 65,002 — Nigeria 236,370 — 184,188 — 195,064 — Other [B] 36,187 — 34,901 — — —
Total Africa 394,996 — 364,287 — 260,066 — North America
USA 286,529 — 309,298 — 264,351 — Canada 224,529 — 253,509 — 234,055 —
Total North America 511,058 — 562,807 — 498,406 — South America
Bolivia 59,673 — 67,191 — — — Brazil 70,100 — 31,020 — 3,029 — Trinidad and Tobago 73,000 — 78,433 — — — Other [B] 8,370 — 7,960 — 9,824 —
Total South America 211,143 — 184,604 — 12,853 — Total 3,117,049 776,953 3,037,161 847,106 2,148,835 909,988[A] Reflects 100% of production of subsidiaries except in respect of PSCs, where the figures shown represent the entitlement of the subsidiaries concerned under those contracts. [B] Comprises countries where 2017 production was lower than 41,795 million scf or where specific disclosures are prohibited.
STRATEGIC REPORT SHELL ANNUAL REPORT AND FORM 20-F 2017 43
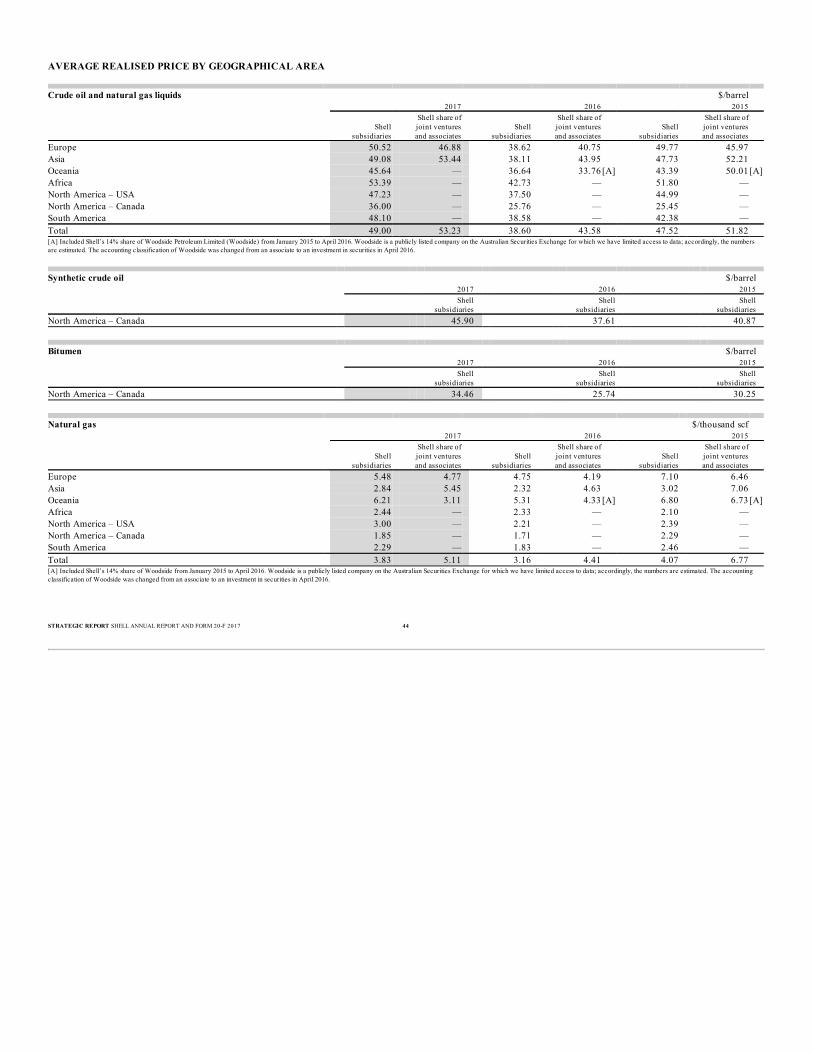
AVERAGE REALISED PRICE BY GEOGRAPHICAL AREA
Crude oil and natural gas liquids $/barrel 2017 2016 2015
Shell
subsidiaries
Shell share ofjoint venturesand associates
Shellsubsidiaries
Shell share ofjoint venturesand associates
Shellsubsidiaries
Shell share ofjoint venturesand associates
Europe 50.52 46.88 38.62 40.75 49.77 45.97 Asia 49.08 53.44 38.11 43.95 47.73 52.21 Oceania 45.64 — 36.64 33.76 [A] 43.39 50.01 [A]Africa 53.39 — 42.73 — 51.80 — North America – USA 47.23 — 37.50 — 44.99 — North America – Canada 36.00 — 25.76 — 25.45 — South America 48.10 — 38.58 — 42.38 — Total 49.00 53.23 38.60 43.58 47.52 51.82 [A] Included Shell’s 14% share of Woodside Petroleum Limited (Woodside) from January 2015 to April 2016. Woodside is a publicly listed company on the Australian Securities Exchange for which we have limited access to data; accordingly, the numbersare estimated. The accounting classification of Woodside was changed from an associate to an investment in securities in April 2016.
Synthetic crude oil $/barrel 2017 2016 2015
Shell
subsidiaries Shell
subsidiaries Shell
subsidiaries North America – Canada 45.90 37.61 40.87
Bitumen $/barrel 2017 2016 2015
Shell
subsidiaries Shell
subsidiaries Shell
subsidiaries North America – Canada 34.46 25.74 30.25
Natural gas $/thousand scf 2017 2016 2015
Shell
subsidiaries
Shell share ofjoint venturesand associates
Shellsubsidiaries
Shell share ofjoint venturesand associates
Shellsubsidiaries
Shell share ofjoint venturesand associates
Europe 5.48 4.77 4.75 4.19 7.10 6.46 Asia 2.84 5.45 2.32 4.63 3.02 7.06 Oceania 6.21 3.11 5.31 4.33 [A] 6.80 6.73 [A]Africa 2.44 — 2.33 — 2.10 — North America – USA 3.00 — 2.21 — 2.39 — North America – Canada 1.85 — 1.71 — 2.29 — South America 2.29 — 1.83 — 2.46 — Total 3.83 5.11 3.16 4.41 4.07 6.77 [A] Included Shell’s 14% share of Woodside from January 2015 to April 2016. Woodside is a publicly listed company on the Australian Securities Exchange for which we have limited access to data; accordingly, the numbers are estimated. The accountingclassification of Woodside was changed from an associate to an investment in securities in April 2016.
STRATEGIC REPORT SHELL ANNUAL REPORT AND FORM 20-F 2017 44

AVERAGE PRODUCTION COST BY GEOGRAPHICAL AREA
Crude oil, natural gas liquids and natural gas [A] $/boe 2017 2016 2015
Shell
subsidiaries
Shell share ofjoint venturesand associates
Shellsubsidiaries
Shell share ofjoint venturesand associates
Shellsubsidiaries
Shell share ofjoint venturesand associates
Europe 13.19 5.58 13.70 5.45 [B] 16.97 5.49 [B]Asia 7.71 6.87 6.32 6.62 7.42 6.89 Oceania 9.24 28.83 8.87 16.19 [C] 13.43 14.66 [C]Africa 9.53 — 9.93 — 11.96 — North America – USA 16.11 — 21.44 — 20.28 — North America – Canada 14.53 — 13.59 — 18.85 — South America 8.08 — 7.64 — 21.31 — Total 10.55 6.82 10.92 6.57 [B] 13.42 6.93 [B][A] Natural gas volumes are converted into oil equivalent using a factor of 5,800 scf per barrel.[B] As revised following a reassessment.[C] Included Shell’s 14% share of Woodside from January 2015 to April 2016. Woodside is a publicly listed company on the Australian Securities Exchange for which we have limited access to data; accordingly, the numbers are estimated. The accountingclassification of Woodside was changed from an associate to an investment in securities in April 2016.
Synthetic crude oil $/barrel 2017 2016 2015
Shell
subsidiaries Shell
subsidiaries Shell
subsidiaries North America – Canada 23.77 26.14 31.50
Bitumen $/barrel 2017 2016 2015
Shell
subsidiaries Shell
subsidiaries Shell
subsidiaries North America – Canada 16.19 14.19 18.58
STRATEGIC REPORT SHELL ANNUAL REPORT AND FORM 20-F 2017 45

OVERVIEWOur Downstream business is made up of a number of different Oil Products andChemicals activities, part of an integrated value chain, including trading activities, thatturns crude oil and other feedstocks into a range of products which are moved andmarketed around the world for domestic, industrial and transport use. The products wesell include gasoline, diesel, heating oil, aviation fuel, marine fuel, biofuel, lubricants,bitumen and sulphur. In addition, we produce and sell petrochemicals for industrial useworldwide. Our Oil Products activities comprise Refining and Trading, and Marketing, referred to asclasses of business. Marketing includes Retail, Lubricants, Business to Business (B2B),Pipelines and Biofuels. Chemicals has major manufacturing plants, located close torefineries, and its own marketing network. In Trading and Supply, we trade crude oil, oilproducts and petrochemicals, to optimise feedstocks for Refining and Chemicals, tosupply our Marketing businesses and third parties, and for our own profit. BUSINESS CONDITIONSIndustry gross refining margins were higher on average in 2017 than in 2016 in each ofthe key refining hubs of Europe, Singapore and the USA. Oil products demand growthwas stronger globally, with an increase of 1.5 million b/d compared with 2016, accordingto the International Energy Agency’s Oil Market Report published in January 2018,driven in part by a continued low-price crude oil environment and industrial demandgrowth. Demand growth and refinery outages, notably in Latin America, reducedovercapacity despite new refinery capacity additions in 2017 in China. Asian naphtha cracker margins rose for the third consecutive year, although only slightlyin 2017, driven by continued strong demand, periods of reduced cracker capacityavailability and higher naphtha cracker utilisation. European naphtha cracker marginsincreased, supported by tight ethylene markets and high global utilisation. US ethanecracker margins increased slightly but remained lower than margins in Asia and Europeas continued low crude oil prices reduced the margin available in the ethane topolyethylene value chain. See “Market overview” on page 18.
REFINERY AND CHEMICAL PLANT AVAILABILITYRefinery availability was 91% in 2017, compared with 90% in 2016. Chemicals plant availability was 92% in 2017, compared with 90% in 2016, mainlyreflecting recovery at the Bukom site in Singapore, which suffered unit shutdowns in2016. OIL PRODUCTS AND CHEMICALS SALESOil products sales volumes increased by 2% in 2017 compared with 2016, reflectinghigher trading volumes partly offset by lower marketing volumes mainly as a result of theMotiva transaction (see “Portfolio and business developments” on page 47). Chemicals sales volumes increased by 5% in 2017 compared with 2016, principally dueto improved asset availability and utilisation. In 2016, sales volumes were negativelyimpacted by outages at Bukom. EARNINGS 2017-2016Segment earnings are presented on a current cost of supplies basis (see “Summary ofresults” on page 19), which were $964 million lower in 2017 than on a first-in, first-outbasis (2016: $1,085 million lower), as shown in “Non-GAAP measures reconciliations”on page 225. Segment earnings in 2017 of $8,258 million were 25% higher than in 2016. Earnings in2017 included a net charge of $824 million, compared with a net charge in 2016 of $655million, described at the end of this section. Excluding the impact of these items, earnings in 2017 were $9,082 million, comparedwith $7,243 million in 2016. Refining and Trading accounted for 27% of these 2017earnings, Marketing for 44% and Chemicals for 29%. The Motiva transaction, described in “Portfolio and business developments” on page 47,impacted Shell’s ongoing reporting and therefore the comparison with 2016. With effectfrom May 2017, Shell reports revenue and costs from assets which were previously partof the Motiva joint venture, instead of reporting a share of joint venture profit.
Downstream
Key statistics $ million, except where indicated 2017 2016 2015
Segment earnings [A] 8,258 6,588 10,243 Including:
Revenue (including inter-segment sales) 268,979 203,550 237,746 Share of profit of joint ventures and associates [A] 1,956 2,244 2,215 Interest and other income 154 851 1,156 Operating expenses [B] 19,583 19,681 20,816 Depreciation, depletion and amortisation 3,877 3,681 3,667 Taxation charge [A] 1,783 1,008 1,639
Capital investment [B] 6,416 6,057 5,119 Divestments [B] 2,703 2,889 2,282 Refinery availability (%) [C] 91 90 90 Chemical plant availability (%) [C] 92 90 85 Refinery processing intake (thousand b/d) 2,572 2,701 2,805 Oil products sales volumes (thousand b/d) 6,599 6,483 6,432 Chemicals sales volumes (thousand tonnes) 18,239 17,292 17,148[A] See Note 4 to the “Consolidated Financial Statements” on pages 149-150. Segment earnings are presented on a current cost of supplies basis. [B] See “Non-GAAP measures reconciliations” on pages 225-226. [C] The basis of calculation differs from that used for the “Refinery and chemical plant availability” measure in “Performance indicators” on page 23, which excludes downtime due to uncontrollable factors and, in 2017, excludes assets which were not part ofShell’s operational performance metrics because of portfolio activity (Fredericia and former Motiva sites).
STRATEGIC REPORT SHELL ANNUAL REPORT AND FORM 20-F 2017 46

The increase in Downstream earnings, excluding the net charges, of $1,839 million(25%) compared with 2016 was driven by higher realised refining and trading margins(around $1,230 million), improved chemical margins (around $870 million), a lowereffective tax rate (around $380 million) and other net negative impacts (around $640million). Refining and trading margins were higher in part following the Motivatransaction. Chemicals margins were helped by improved operating performance and thelower effective tax rate resulted from one-off impacts and a change in the geographicalsplit of earnings. The other net negative impacts included higher depreciation charges andcosts, following the Motiva transaction, and lower marketing margins, impacted by ashortage of feedstock from our Pearl gas-to-liquids (GTL) plant in Qatar to ourLubricants business. The increase in earnings of $1,839 million analysed by class of business was as follows: ■ Refining and Trading earnings were $993 million higher than in 2016. Realised
refining margins were higher, reflecting improving global economic activity, andimproved operational efficiency globally, most notably at our Bukom refinery. In theUSA, the integration of the Convent and Norco refineries, following the Motivatransaction, enabled us to capitalise on improved market margins although Deer Parksuffered continuing operational issues on top of industry shutdowns due to HurricaneHarvey. In Canada, there were significantly higher margins at Scotford, following amajor turnaround in 2016. In Europe, we benefited from a stronger marginenvironment. However, operations at the Pernis refinery in the Netherlands wereimpacted by a shutdown lasting almost a month due to a substation fire. In Asia,earnings benefited from improved operations at Bukom and a higher marginenvironment. Trading margins were lower than in 2016 mainly due to lower marketvolatility and challenging market conditions.
■ Marketing earnings were $93 million lower than in 2016. Lubricants margins werenegatively impacted by a shortage of feedstock from our Pearl GTL plant. Earningsfrom our Raízen joint venture (Shell interest 50%) in Brazil decreased, impacted bylower sugar prices, lower demand and weather-related delays to sugar cane crushing.Partly offsetting these impacts were improved results from our Retail business, with astrong performance from our joint ventures in China.
■ Chemicals earnings were $939 million higher than in 2016. Earnings in 2017 benefitedfrom shorter unit shutdowns at Bukom than during 2016, improved market conditionsand strong asset performance in Europe, and improved margins in the Americas,mainly due to higher demand for glycols.
Segment earnings in 2017 included a net charge of $824 million, reflecting impairmentcharges of $315 million reported in depreciation (mainly expenditure at Bukom andcharges in relation to the Phenol 3 unit at the Chemicals cracker at Deer Park),redundancy and restructuring charges of $200 million, charges of $142 million related toUS tax reform legislation and a tax rate change in France and other net charges of $231million (mainly onerous contract provisions in Refining and Trading and a legalprovision in Chemicals). Partly offsetting these impacts were divestment gains of $39million (including a $546 million net charge from the Motiva transaction, mainly relatedto tax, which were more than offset by gains on the sale of assets in Saudi Arabia, Africa,Australia, Hong Kong and Macau) and a net gain from fair value accounting ofcommodity derivatives of $25 million. Segment earnings in 2016 included a net charge of $655 million, reflecting redundancyand restructuring charges of $523 million, impairments of $506 million (mainly inrespect of the Port Dickson refinery in Malaysia, the Fredericia refinery in Denmark andexpenditure at the Bukom refinery), a net charge from fair value accounting ofcommodity derivatives of $373 million and other net charges of $25 million. These werepartly offset by net gains
on divestments of $772 million (mainly in respect of Showa Shell in Japan and ourMarketing business in Denmark) reported in interest and other income. EARNINGS 2016-2015Segment earnings were presented on a current cost of supplies basis, which were $1,085million lower in 2016 than on a first-in, first-out basis (2015: $1,955 million higher). Segment earnings in 2016 of $6,588 million were 36% lower than in 2015. Earnings in2016 included a net charge of $655 million described above. Earnings in 2015 includeda net gain of $495 million, reflecting net gains on divestments of $1,095 million(primarily in China, France and Norway), partly offset by impairment charges of $505million (mainly related to the Westward Ho pipeline in the USA and to expenditure at theBukom refinery) and other net charges of $95 million. Excluding the impact of these items, earnings in 2016 were $7,243 million, comparedwith $9,748 million in 2015. Refining and Trading accounted for 20% of these 2016earnings, Marketing for 57% and Chemicals for 23%. The decrease in these earnings of $2,505 million (26%) compared with 2015 was mainlydriven by lower realised refining and trading margins (around $2,710 million); a highereffective tax rate (around $540 million), mainly due to one-off impacts and thegeographical split of earnings; and other net negative impacts (around $250 million).There was a partial offset from lower operating expenses and stronger marketing margins(around $500 million each) excluding the effect of divestments and exchange rates. CAPITAL INVESTMENTCapital investment was $6.4 billion in 2017, compared with $6.1 billion in 2016. Capitalinvestment related to our former Motiva assets was $0.6 billion (2016: $nil, when Motivawas a joint venture). Excluding this, capital investment in Refining decreased by $0.4billion to $1.8 billion, in Marketing it increased by $0.1 billion to $1.5 billion andChemicals capital investment was in line with 2016 at $2.5 billion. DIVESTMENTSDivestments were $2.7 billion in 2017, compared with $2.9 billion in 2016. The principaldivestments in 2017 were the Motiva transaction in the USA, the sale of our interest in theSADAF joint venture in Saudi Arabia, our interest in Vivo Energy in Africa, our aviationbusiness in Australia, our LPG marketing businesses in Hong Kong and Macau (firstphase) and the sale of an interest in Shell Midstream Partners, L.P. in the USA. PORTFOLIO AND BUSINESS DEVELOPMENTSWe continued to divest selected assets and restructure parts of our portfolio. In 2017, thisincluded: ■ In the USA, the separation of assets, liabilities and businesses of the Motiva Enterprises
LLC (Motiva) joint venture, in which Shell held a 50% interest, took place (Motivatransaction). Shell assumed sole ownership of the Norco and Convent refineries inLouisiana, 11 distribution terminals and Shell-branded markets in Alabama, Mississippi,Tennessee, Louisiana, a portion of the Florida panhandle, and the north-eastern regionof the USA, and received cash which was reported in divestments. See Note 29 to the“Consolidated Financial Statements” on page 178.
■ In the USA, we issued 10.46 million new common units in Shell Midstream Partners,L.P., bringing the total common units issued and outstanding to 187.78 million.
■ In Saudi Arabia, we sold our 50% share in the SADAF petrochemicals joint venturelocated in Al Jubail. The joint venture encompassed six petrochemical plants with atotal output of more than 4 million tonnes per year. The sale marked an earlytermination of the joint venture agreement
STRATEGIC REPORT SHELL ANNUAL REPORT AND FORM 20-F 2017 47

which was due to expire in 2020. Shell’s other activities in the country are not impacted.■ We sold our 20% interest in Vivo Energy to Vitol Africa B.V. (Vitol). As part of the
transaction, a long-term brand licence agreement was renewed with Vitol to ensure thatthe Shell brand will remain visible in more than 16 countries across Africa.
■ In Australia, we sold our aviation fuel business.■ In Hong Kong and Macau, we completed the first phase of the sale of our LPG
marketing businesses to DCC Energy. The previously agreed sale of A/S Dansk Shell, which includes the Fredericia refinery andlocal trading and supply activities in Denmark, was cancelled. We continue to look for the right opportunities to grow our Downstream business. InSeptember 2017, we opened our first Mexican retail service station on the outskirts ofMexico City. Assuming market conditions continue to develop at their current rate, weplan to open more sites in Mexico over the next few years. BUSINESS AND PROPERTYREFINING AND TRADINGRefiningWe have interests in 21 refineries worldwide with the capacity to process a total of 2.9million barrels of crude oil per day (Shell share). Our refining capacity is 36% in Europeand Africa, 40% in the Americas and 24% in Asia and Oceania. Trading and SupplyTrading and Supply trades in physical and financial contracts, lease storage andtransportation capacities, and manages shipping and wholesale commercial fuel activitiesglobally. This includes supplying feedstocks for our refineries and chemical plants andfinished products such as gasoline, diesel and aviation fuel to our Marketing businessesand customers. Operating in around 25 countries, with more than 125 Shell and joint venture terminals,we believe our supply and distribution infrastructure is well positioned to make deliveriesaround the world. Shell Wholesale Commercial Fuels provides transport, industrial and heating fuels. Ourrange of products, from reliable main-grade fuels to premium products, is designed toprovide tangible vehicle and business benefits. MARKETINGRetailThere were more than 44,000 Shell-branded retail stations operating in over 70 countriesat the end of 2017. Every day, more than 30 million customers pass through these sites tobuy fuel and convenience items, including beverages and snacks. We have more than 100 years’ experience in fuel development. In recent years, aided byour innovative partnership with Scuderia Ferrari, we have concentrated on developingfuels with special formulations designed to clean engines and improve performance. Wesold such fuels under the Shell V-Power brand in more than 60 countries as at the end of2017. We have also launched a new, improved formulation across our portfolio of Shellgasoline and diesel products in 24 markets and introduced electric vehicle charging atShell stations in key European markets. LubricantsAcross more than 100 countries, we produce, market and sell technically advancedlubricants for passenger cars, motorcycles, trucks, coaches, and machinery used in themanufacturing, mining, power generation, agriculture and construction sectors.
We also manufacture premium lubricants from natural gas using GTL base oils producedat our Pearl GTL plant in Qatar (see “Integrated Gas” page 26).
We have a global lubricants supply chain with a network of five base oil manufacturingplants, 40 lubricant blending plants, 10 grease plants and four GTL base oil storage hubs. Through our marine activities, we primarily provide lubricants, but also fuels and relatedtechnical services, to the shipping and maritime sectors. We supply around 90 grades oflubricants and nine types of fuel to vessels worldwide, ranging from large ocean-goingtankers to small fishing boats. Business to BusinessOur Business-to-Business (B2B) activities encompass the sale of fuels and specialityproducts and services to a broad range of commercial customers. Shell Aviation has a presence at about 850 airports in around 30 countries and refuels anaircraft every 14 seconds, on average. Shell Bitumen supplies over 1,600 customers across 30 countries and provides enoughbitumen to resurface 450 kilometres of road lanes every day. It also invests in technologyresearch and development to create innovative products. Shell Sulphur Solutions is a business that manages the complete value chain of sulphur,from refining to marketing. The business provides sulphur for industries such as miningand textiles and also develops new products that incorporate sulphur, such as fertilisers. PipelinesShell Pipeline Company LP (Shell interest 100%) owns and operates seven tank farmsacross the USA and transports more than 1.5 billion barrels of crude oil and refinedproducts a year through about 6,000 kilometres of pipelines in the Gulf of Mexico andfive US states. Our various non-Shell-operated ownership interests provide about afurther 13,000 pipeline kilometres. We carry more than 40 types of crude oil and more than 20 grades of gasoline, as well asdiesel, aviation fuel, chemicals and ethylene. Shell Midstream Partners, L.P., a midstream limited partnership, owns, operates, developsand acquires pipelines and other midstream assets. Its assets consist of interests in entitiesthat own pipeline systems and related assets that serve as key infrastructure to storeonshore and offshore crude oil production, transport it to refining markets and deliverrefined products to major demand centres. Shell controls the general partner. BiofuelsRaízen, our joint venture in Brazil (Shell interest 50%), produces ethanol from sugarcane, with an annual production capacity of more than 2 billion litres; exports sugar, withan annual production of about 4.2 million tonnes; and manages a retail network. Raízenopened its first cellulosic ethanol plant at its Costa Pinto mill in Brazil in 2015, whichproduced almost 10 million litres in 2017. When fully operational, the mill is expected toproduce around 40 million litres a year of advanced biofuels from sugar-cane residues. With effect from 2017, our biofuel development and hydrogen activities are reportedwithin Integrated Gas as part of our New Energies business. Raízen remains withinDownstream.
STRATEGIC REPORT SHELL ANNUAL REPORT AND FORM 20-F 2017 48

CHEMICALSManufacturingOur plants produce a range of base chemicals, including ethylene, propylene andaromatics, as well as intermediate chemicals such as styrene monomer, propylene oxide,solvents, detergent alcohols, ethylene oxide and ethylene glycol. We have the capacity toproduce about 6 million tonnes of ethylene a year. MarketingEach year, we supply more than 18 million tonnes of petrochemicals to around 1,000major industrial customers worldwide. Our products are used to make numerouseveryday items, from clothing and cars to detergents and bicycle helmets. DOWNSTREAM BUSINESS ACTIVITIES WITH IRAN, SUDAN ANDSYRIAIRANShell transactions with Iran are disclosed separately. See “Section 13(r) of the USSecurities Exchange Act of 1934 Disclosure” on page 224. SUDANWe ceased all operational activities in Sudan in 2008. SYRIAWe supply limited quantities of polyols via a Netherlands-based distributor to privatesector customers in Syria. Polyols are commonly used for the production of foam inmattresses and soft furnishings. DOWNSTREAM DATA TABLESThe tables below reflect Shell subsidiaries and instances where Shell owns the crude oil orfeedstocks processed by a refinery. In addition, it reflects the 50% interest in the Motivajoint venture in the USA. Other joint ventures and associates are only included whereexplicitly stated. Following the Motiva transaction in May 2017, the data in respect ofassets assumed by Shell, such as the Norco and Convent refineries, are included on a100% basis.
Oil products – cost of crude oilprocessed or consumed [A]
$ per barrel
2017 2016 2015 Total 46.78 34.47 40.91[A] Includes Upstream margin on crude oil supplied by Shell subsidiaries, joint ventures and associates.
Crude distillation capacity [A] Thousand b/calendar day [B] 2017 2016 2015
Europe 970 973 1,037 Asia 704 808 816 Oceania — — — Africa 82 82 82 Americas 1,176 1,223 1,219 Total 2,932 3,086 3,154[A] Average operating capacity for the year, excluding mothballed capacity. [B] Calendar day capacity is the maximum sustainable capacity adjusted for normal unit downtime.
Ethylene capacity [A] Thousand tonnes/year 2017 2016 2015
Europe 1,702 1,702 1,702 Asia 1,904 2,222 2,222 Oceania — — — Africa — — — Americas 2,267 2,235 2,235 Total 5,873 6,159 6,159[A] Includes the Shell share of capacity entitlement (offtake rights) of joint ventures and associates, which may be differentfrom nominal equity interest. Nominal capacity is quoted at December 31.
Oil products – crude oil processed [A] Thousand b/d 2017 2016 2015
Europe 892 898 870 Asia 528 563 685 Oceania — — — Africa 54 68 56 Americas 997 1,088 1,150 Total 2,471 2,617 2,761[A] Includes natural gas liquids, share of joint ventures and associates and processing for others.
Refinery processing intake [A] Thousand b/d 2017 2016 2015
Crude oil 2,364 2,317 2,596 Feedstocks 208 384 209 Total 2,572 2,701 2,805 Europe 892 896 903 Asia 539 568 627 Oceania — — — Africa 54 67 56 Americas 1,087 1,170 1,219 Total 2,572 2,701 2,805[A] Includes crude oil, natural gas liquids and feedstocks processed in crude distillation units and in secondary conversionunits.
Refinery processing outturn [A] Thousand b/d 2017 2016 2015
Gasolines 955 1,021 1,012 Kerosines 290 326 316 Gas/Diesel oils 925 942 972 Fuel oil 265 277 290 Other 334 386 449 Total 2,769 2,952 3,039[A] Excludes own use and products acquired for blending purposes.
STRATEGIC REPORT SHELL ANNUAL REPORT AND FORM 20-F 2017 49

Oil product sales volumes [A][B] Thousand b/d 2017 2016 2015
Europe Gasolines 317 309 403 Kerosines 272 258 251 Gas/Diesel oils 758 765 779 Fuel oil 170 183 186 Other products 362 287 240
Total 1,879 1,802 1,859 Asia
Gasolines 399 388 379 Kerosines 216 195 214 Gas/Diesel oils 516 519 533 Fuel oil 349 354 340 Other products 536 593 489
Total 2,016 2,049 1,955 Oceania
Gasolines — — — Kerosines 23 55 51 Gas/Diesel oils — — — Fuel oil — — — Other products — — —
Total 23 55 51 Africa
Gasolines 43 41 37 Kerosines 13 10 9 Gas/Diesel oils 78 66 57 Fuel oil 2 1 1 Other products 6 7 15
Total 142 125 119 Americas
Gasolines 1,415 1,331 1,325 Kerosines 212 205 204 Gas/Diesel oils 545 540 584 Fuel oil 92 69 86 Other products 275 307 249
Total 2,539 2,452 2,448 Total product sales [C]
Gasolines 2,174 2,069 2,144 Kerosines 736 723 729 Gas/Diesel oils 1,897 1,890 1,953 Fuel oil 613 607 613 Other products 1,179 1,194 993
Total 6,599 6,483 6,432[A] Excludes deliveries to other companies under reciprocal sale and purchase arrangements, which are in the nature ofexchanges. Sales of condensate and natural gas liquids are included. [B] Includes the Shell share of Raízen’s sales volumes [C] Certain contracts are held for trading purposes and reported net rather than gross. The effect in 2017 was a reduction in oilproduct sales of approximately 596,000 b/d (2016: 839,000 b/d; 2015: 1,158,000 b/d).
Chemicals sales volumes [A] Thousand tonnes 2017 2016 2015
Europe Base chemicals 4,059 3,670 3,000 Intermediates and others 2,056 2,073 1,936
Total 6,115 5,743 4,936 Asia
Base chemicals 2,515 2,200 2,319 Intermediates and others 3,243 2,927 3,576
Total 5,758 5,127 5,895 Oceania
Base chemicals — — — Intermediates and others — — —
Total — — — Africa
Base chemicals — — — Intermediates and others — 22 37
Total — 22 37 Americas
Base chemicals 3,839 4,041 3,036 Intermediates and others 2,527 2,359 3,244
Total 6,366 6,400 6,280 Total product sales
Base chemicals 10,413 9,911 8,355 Intermediates and others 7,826 7,381 8,793
Total 18,239 17,292 17,148[A] Excludes feedstock trading and by-products.
STRATEGIC REPORT SHELL ANNUAL REPORT AND FORM 20-F 2017 50

MANUFACTURING PLANTS AT DECEMBER 31, 2017
Refineries in operation Thousand barrels/calendar day, 100% capacity [B]
Location Asset class Shell interest (%)
[A]
Crudedistillation
capacity
Thermalcracking/
visbreaking/coking
Catalyticcracking
Hydro-cracking
Europe Denmark Fredericia [C] ● 100 67 25 — — Germany Miro [D] 32 287 34 87 —
Rheinland ■● 100 325 44 — 80 Schwedt [D] 38 214 40 52 —
Netherlands Pernis ■● 100 404 45 48 83 Asia
Japan Mizue (Toa) [D] ●◆ 2 64 24 38 — Yamaguchi [D] ◆ 1 110 — 25 — Yokkaichi [D] ●◆ 3 234 — 55 —
Pakistan Karachi [D] 32 43 — — — Philippines Tabangao 55 96 31 — — Saudi Arabia Al Jubail [D] ●◆ 50 292 62 — 45 Singapore Pulau Bukom ■● 100 463 72 34 55
Africa South Africa Durban [D] ◆ 36 165 23 34 —
Americas Argentina Buenos Aires ●◆ 100 100 18 20 — Canada
Alberta Scotford ◆ 100 92 — — 74 Ontario Sarnia ◆ 100 73 4 19 9
USA California Martinez ● 100 145 43 65 38 Louisiana Convent [E] ◆ 100 223 — 79 30
Norco [E] ■ 100 229 25 107 39 Texas Deer Park ■● 50 312 78 63 53 Washington Puget Sound ●◆ 100 137 23 52 —
[A] Shell interest is rounded to the nearest whole percentage point; Shell share of production capacity may differ. [B] Calendar day capacity is the maximum sustainable capacity adjusted for normal unit downtime. [C] The previously agreed sale of our Fredericia refinery has been cancelled.[D] Not operated by Shell. [E] In 2017, we assumed 100% ownership as a result of the Motiva transaction. ■ Integrated refinery and chemical complex.● Refinery complex with cogeneration capacity.◆Refinery complex with chemical unit(s).
STRATEGIC REPORT SHELL ANNUAL REPORT AND FORM 20-F 2017 51

Major chemical plants in operation [A] Thousand tonnes/year, Shell share capacity [B]
Location Ethylene Styrene
monomer Ethylene
glycol Higher olefins
[C] Additional
productsEurope
Germany Rheinland 315 — — — ANetherlands Moerdijk 972 816 153 — A, IUK Mossmorran [D] 415 — — — —
Stanlow [D] — — — 315 IAsia
China Nanhai [D] 475 320 175 — A, I, PSingapore Jurong Island 281 1,069 1,158 — A, I, P, O
Pulau Bukom 1,148 — — — A, IAmericas
Canada Scotford — 485 520 — A, IUSA Deer Park 836 — — — A, I
Geismar — — 400 965 I Norco 1,431 — — — ATotal 5,873 2,690 2,406 1,280 [A] Major chemical plants are large integrated chemical facilities, typically producing a range of chemical products from an array of feedstocks, and are a core part of our global Chemicals business. [B] Shell share of capacity of subsidiaries, joint arrangements and associates (Shell and non-Shell-operated), excluding capacity of the Infineum additives joint ventures. [C] Higher olefins are linear alpha and internal olefins (products range from C6-C2024). [D] Not operated by Shell.
A Aromatics, lower olefins. I Intermediates. P Polyethylene, polypropylene. O Other.
Other chemical locations [A] Location Products
Europe Germany Karlsruhe A
Schwedt ANetherlands Pernis A, I, O
Americas Argentina Buenos Aires ICanada Sarnia A, IUSA Martinez O
Mobile A Puget Sound I[A] Other chemical locations reflect locations with smaller chemical units, typically serving more local markets.
A Aromatics, lower olefins. I Intermediates. O Other.
STRATEGIC REPORT SHELL ANNUAL REPORT AND FORM 20-F 2017 52

OVERVIEWThe Corporate segment covers the non-operating activities supporting Shell. It comprisesShell’s holdings and treasury organisation, its self-insurance activities and its headquartersand central functions. All finance expense and income as well as related taxes areincluded in the Corporate segment earnings rather than in the earnings of the businesssegments. The holdings and treasury organisation manages many of the Corporate entities and is thepoint of contact between Shell and external capital markets. It conducts a broad range oftransactions – from raising debt instruments to transacting foreign exchange. Treasurycentres in London and Singapore support these activities. Headquarters and central functions provide business support in the areas ofcommunications, finance, health, human resources, information technology, legalservices, real estate and security. They also provide support for the shareholder-relatedactivities of the Company. The central functions are supported by business service centreslocated around the world, which process transactions, manage data and produce statutoryreturns, among other services. The majority of the headquarters and central-function costsare recovered from the business segments. Those costs that are not recovered are retainedin Corporate. EARNINGS 2017-2015Segment earnings in 2017 were a loss of $2,416 million, compared with a loss of $1,751million in 2016 and a loss of $425 million in 2015. Net interest and investment expense increased by $589 million between 2016 and 2017.Interest expense increased due to the inclusion of a full year of interest on debt assumedon the BG acquisition in 2016, finance leases entered into during 2017 and higher interestrates (see Note 14 to the “Consolidated Financial Statements” on pages 157-159). In2016, net interest and investment expense increased by $829 million compared with2015. Interest expense was higher, driven by additional bond issuances for the BGacquisition and additional debt, including finance leases, assumed on the acquisition. Net foreign exchange gains/(losses) generally relate to the impact of changes in exchangerates on non-functional currency loans and cash balances in operating units. In 2017,they included a charge of $545 million from the release of cumulative currencytranslation differences following the restructuring of funding for our North Americabusinesses. Taxation and other earnings increased by $219 million in 2017, compared with 2016.Lower costs in 2017, mainly due to 2016 costs incurred in connection with the BGacquisition and integration, were partly offset by a charge in 2017 due to US tax reformlegislation. Other earnings in 2015 included a gain on the sale of an office building in theUK.
SELF-INSURANCEWe mainly rely on self-insurance for many of our risk exposures and capital is set aside tomeet self-insurance obligations (see “Risk factors” on page 15). We seek to ensure that thecapital held to support the self-insurance obligations is at a level at least equivalent towhat would be held in the third-party insurance market. Periodically, surveys of keyassets are undertaken that provide risk-engineering knowledge and best practices to Shellsubsidiaries with the aim to reduce their exposure to hazard risks. Actions identifiedduring these surveys are monitored to completion. INFORMATION TECHNOLOGY AND CYBER SECURITYGiven our reliance on information technology (IT) systems for our operations, wecontinuously monitor external developments and share information on threats andsecurity incidents. Shell employees and contract staff are subject to mandatory coursesand regular awareness campaigns, aimed at protecting us against cyber threats. Weperiodically review and adapt our disaster recovery plans and security response processes,and seek to enhance our security monitoring capability. Given our dependency on IT systems for our operations and the increasing role of digitaltechnologies across our business, we are aware that cyber security attacks can causesignificant harm to Shell in the form of loss of productivity, loss of intellectual property,regulatory fines and/or reputational damage. As a result, we continuously measure and,where required, further improve our cyber-security capabilities to reduce the likelihoodof successful cyber-attacks. Our cyber-security capabilities are embedded into our ITsystems and our IT landscape is protected by various detective and protectivetechnologies. The identification and assessment capabilities are built into our supportprocesses and the Shell workforce behaviour is influenced through mandatoryinformation security training and awareness campaigns. The security of IT services,operated by external IT security companies, is managed through contractual securityrequirements and assurance reports. Shell is frequently subject to cyber-security attacks. In 2017, none of these events led tobreaches of our business-critical IT landscape and, as such, did not result in any materialbusiness impact. When significant incidents occur, they are followed up with a thoroughroot-cause analysis and, if needed, will result in taking appropriate follow-up actions. See “Risk factors” on page 15.
Corporate
Earnings $ million 2017 2016 2015
Segment earnings (2,416 ) (1,751 ) (425 )Comprising:
Net interest and investment expense [A] (2,413 ) (1,824 ) (995 )Net foreign exchange gains/(losses) [B] (292 ) 3 (731 )Taxation and other [C] 289 70 1,301
[A] Mainly Shell’s interest expense (excluding accretion expense) and interest income, together with the Shell share of joint ventures and associates’ net interest expense, and net gains on sales from Shell insurance entities’ portfolio of debt securities.[B] On Shell’s financing activities, together with the Shell share of joint ventures and associates’ net foreign exchange gains/(losses) on financing activities.[C] Other earnings mainly comprise headquarters and central functions’ costs not recovered from business segments, and net gains on sale of properties.
STRATEGIC REPORT SHELL ANNUAL REPORT AND FORM 20-F 2017 53

We manage our businesses to deliver strong cash flows to fund investment for profitablegrowth. Our aim is that, across the business cycle, “cash in” (including cash fromoperations and divestments) at least equals “cash out” (including capital expenditure,interest and dividends), while maintaining a strong balance sheet. Our priorities forapplying our cash are the servicing and reduction of debt commitments, payment ofdividends, followed by a balance of capital investment and share buybacks. FINANCIAL CONDITION AND LIQUIDITYStrong operational performance in 2017, together with improved market conditions andproceeds from our divestment programme, supported a reduction in gearing to 24.8% atDecember 31, 2017 (2016: 28.0%). The acquisition of BG Group plc (BG) in 2016 hadincreased gearing by 9.7%. Gearing, defined as net debt (total debt less cash and cashequivalents) as a percentage of total capital (net debt plus total equity), is a key measureof our capital structure. Across the business cycle, we aim to manage gearing within arange of 0-30%. Note 14 to the “Consolidated Financial Statements” on pages 157-159provides information on our debt arrangements, including gearing. We are affected by the global macroeconomic environment as well as financial andcommodity market conditions. This exposes us to treasury and trading risks, includingliquidity risk, market risk (interest rate risk, foreign exchange risk and commodity pricerisk) and credit risk. See “Risk factors” on page 14 and Note 19 to the “ConsolidatedFinancial Statements” on pages 167-172. The size and scope of our businesses require arobust financial control framework and effective management of our various riskexposures. LIQUIDITYWe satisfy our funding and working capital requirements from the cash generated fromour operations, the issuance of debt and divestments. In 2017, access to the internationaldebt capital markets remained strong, with our debt principally financed from thesemarkets through central debt programmes consisting of: ■ a $10 billion global commercial paper (CP) programme, with maturities not exceeding
270 days;■ a $10 billion US CP programme, with maturities not exceeding 397 days;■ an unlimited Euro medium-term note (EMTN) programme (also referred to as the
Multi-Currency Debt Securities Programme); and■ an unlimited US universal shelf (US shelf) registration. All these CP, EMTN and US shelf issuances are issued by Shell International FinanceB.V., the issuance company for Shell, with its debt being guaranteed by Royal DutchShell plc (the Company). We also maintain a committed credit facility, which was increased in February 2017 to$8.5 billion from $7.5 billion and expires in 2020. It remained undrawn at December 31,2017. This facility and internally available liquidity provide back-up coverage for our CPprogrammes. Other than certain borrowing by local subsidiaries, we do not have anyother committed credit facilities. Our total debt decreased by $6.8 billion in 2017 to $85.7 billion at December 31, 2017.The amount excluding finance leases will mature as follows: 15% in 2018; 12% in 2019;9% in 2020; 7% in 2021; and 57% in 2022 and beyond. The portion of debt maturing in2018 is expected to be repaid from a combination of cash balances, cash generated fromoperations, divestments and the issuance of new debt. In 2017, we did not issue any bonds under our US shelf registration or EMTNprogramme. Periodically, we did issue CP. We believe our current working capital issufficient for our present requirements.
While our subsidiaries are subject to restrictions, such as foreign withholding taxes on thetransfer of funds in the form of cash dividends, loans or advances, such restrictions arenot expected to have a material impact on our ability to meet our cash obligations. MARKET RISK AND CREDIT RISKIn the normal course of business, financial instruments of various kinds are used for thepurposes of managing exposure to commodity price, foreign exchange and interest ratemovements. Our treasury and trading operations are highly centralised, and seek tomanage credit exposures associated with our substantial cash, commodity, foreignexchange and interest rate positions. Our portfolio of cash investments is diversified toavoid concentrating risk in any one instrument, country, or counterparty. We monitor ourinvestments and adjust them in light of new market information. Exposure to failedfinancial and trading counterparties was not material in 2017. Treasury standards areapplicable to all our subsidiaries, and each subsidiary is required to adopt a treasurypolicy consistent with these standards. Other than in exceptional cases, the use of externalderivative instruments is confined to specialist trading and central treasury organisationsthat have appropriate skills, experience, supervision, control and reporting systems. PENSION COMMITMENTSWe have substantial pension commitments, whose funding is subject to capital marketrisks (see “Risk factors” on page 15). We address key pension risks in a number of ways.Principal among these is the Pensions Forum, chaired by the Chief Financial Officer,which provides guidance on Shell’s input to pension strategy, policy and operation. Theforum is supported by a risk committee in reviewing the results of assurance processeswith respect to pension risks. In general, local trustees manage the funded defined benefitpension plans and set the required contributions based on independent actuarialvaluations in accordance with local regulations. Our total employer contributions todefined benefit pension plans were $1.8 billion in 2017 and are estimated to be $1.0billion in 2018.
Capitalisation table $ million Dec 31, 2017 Dec 31, 2016
Equity attributable to Royal Dutch Shell plc shareholders 194,356 186,646 Current debt 11,795 9,484 Non-current debt 73,870 82,992 Total debt [A] 85,665 92,476 Total capitalisation 280,021 279,122[A] Of total debt, $70.1 billion (2016: $77.7 billion) was unsecured and $15.6 billion (2016: $14.8 billion) was secured. SeeNote 14 to the “Consolidated Financial Statements” on pages 157-159 for further disclosure on debt. The consolidated ratio of earnings to fixed charges of Shell for each of the five yearsended December 31, 2013-2017, is as follows:
Ratio of earnings to fixed charges [A] 2017 2016 2015 2014 2013
Ratio of earnings to fixed charges 5.28 2.47 1.93 14.41 20.11[A] See “Exhibit 7.1” on page E1 for the calculation of the ratio of earnings to fixed charges.
Liquidity and capital resources
STRATEGIC REPORT SHELL ANNUAL REPORT AND FORM 20-F 2017 54

STATEMENT OF CASH FLOWSCash flow from operating activities in 2017 was an inflow of $35.7 billion. The increasefrom $20.6 billion in 2016 was mainly due to higher earnings. The decrease in cash flowfrom operating activities in 2016 compared with $29.8 billion in 2015 mainly reflectedunfavourable working capital impacts.
Cash flow from investing activities in 2017 was an outflow of $8.0 billion, comparedwith $31.0 billion in 2016. The decrease was mainly due to the acquisition of BG in 2016and higher proceeds from the sale of assets in 2017 compared with 2016. The increasedcash outflow in 2016 compared with $22.4 billion in 2015 was mainly due to theacquisition of BG. Cash flow from financing activities in 2017 was an outflow of $27.1 billion comparedwith an outflow of $0.8 billion in 2016 and an inflow of $3.8 billion in 2015. In 2017,this included net repayment of debt of $11.8 billion (2016: $11.1 billion net issuance ofdebt; 2015: $14.9 billion net issuance of debt), payment of dividends to Royal DutchShell plc shareholders of $10.9 billion (2016: $9.7 billion; 2015: $9.4 billion) andinterest paid of $3.6 billion (2016: $2.9 billion; 2015: $1.7 billion). Cash and cash equivalents were $20.3 billion at December 31, 2017 (2016: $19.1 billion;2015: $31.8 billion). CASH FLOW FROM OPERATING ACTIVITIESThe most significant factors affecting our cash flow from operating activities are earnings,which are mainly impacted by: realised prices for crude oil, natural gas and liquefiednatural gas (LNG); production levels of crude oil, natural gas and LNG; refining andmarketing margins; and movements in working capital. The impact on earnings from changes in market prices depends on: the extent to whichcontractual arrangements are tied to market prices; the dynamics of production-sharingcontracts; the existence of agreements with governments or state-owned oil and gascompanies that have limited sensitivity to crude oil and natural gas prices; tax impacts;and the extent to which changes in commodity prices flow through into operating costs.Changes in benchmark
prices of crude oil and natural gas in any particular period therefore provide only a broadindicator of changes in our Integrated Gas and Upstream earnings in that period. In thelonger term, replacement of proved oil and gas reserves will affect our ability to maintainor increase production levels, which in turn will affect our earnings and cash flows.Changes in any one of a range of factors derived from either within the industry or thebroader economic environment can influence refining and marketing margins. Theprecise impact of any such changes depends on how the oil markets respond to them. Themarket response is affected by factors such as: whether the change affects all crude oiltypes or only a specific grade; regional and global crude-oil and refined-productsinventories; and the collective speed of response of refiners and product marketers inadjusting their operations. As a result, margins fluctuate from region to region and fromperiod to period. CAPITAL INVESTMENTThe reduction in organic capital investment in 2017 compared with 2016, and in 2016compared with 2015, reflects our decision to curtail spending by reducing the number ofnew investments and implementing lower-cost development solutions. The decrease ininorganic capital investment in 2017 compared with 2016 was mainly due to the BGacquisition in 2016.
Capital investment [A] $ million 2017 2016 2015
Integrated Gas 3,827 26,214 5,178 Upstream 13,648 47,507 18,349 Downstream 6,416 6,057 5,119 Corporate 115 99 215 Total capital investment 24,006 79,877 28,861 Of which:
Organic capital investment 22,177 26,913 28,403 Inorganic capital investment 1,829 52,964 458
[A] See “Non-GAAP measures reconciliations” on page 225.
Cash flow information [A] $ billion 2017 2016 2015
Cash flow from operating activities excluding working capital movements Integrated Gas 8.6 6.3 8.2 Upstream 16.8 10.5 5.0 Downstream 12.8 9.8 10.6 Corporate 0.6 0.3 0.5
Total 38.8 26.9 24.3 (Increase)/decrease in inventories (2.0 ) (5.6 ) 2.8 (Increase)/decrease in current receivables (1.7 ) 2.0 9.9 Increase/(decrease) in current payables 0.6 (2.7 ) (7.2 )(Increase)/decrease in working capital (3.1 ) (6.3 ) 5.5 Cash flow from operating activities 35.7 20.6 29.8 Cash flow from investing activities (8.0 ) (31.0 ) (22.4 )Cash flow from financing activities (27.1 ) (0.8 ) 3.8 Currency translation differences relating to cash and cash equivalents 0.6 (1.5 ) (1.0 )Increase/(decrease) in cash and cash equivalents 1.2 (12.7 ) 10.2 Cash and cash equivalents at the beginning of the year 19.1 31.8 21.6 Cash and cash equivalents at the end of the year 20.3 19.1 31.8[A] See the “Consolidated Statement of Cash Flows” on page 141.
STRATEGIC REPORT SHELL ANNUAL REPORT AND FORM 20-F 2017 55

DIVESTMENTSIn 2017, we continued to divest assets that fail to deliver competitive performance or nolonger meet our longer-term strategic objectives, including assets in Canada, the UK,Australia, the USA and Saudi Arabia. We also sold part of our interest in Shell MidstreamPartners, L.P., while retaining control.
Divestments [A] $ million 2017 2016[B] 2015
Integrated Gas 3,077 352 269 Upstream 11,542 1,726 2,478 Downstream 2,703 2,889 2,282 Corporate 18 17 511 Total 17,340 4,984 5,540 [A] See “Non-GAAP measures reconciliations” on page 225.[B] As adjusted, see “Non-GAAP measures reconciliations” on page 225. DIVIDENDSOur policy is to grow the dollar dividend through time, in line with our view of ourunderlying earnings and cash flow. When setting the dividend, the Board of Directorslooks at a range of factors, including the macroeconomic environment, the currentbalance sheet and future investment plans. We returned $15.6 billion to our shareholders through dividends in 2017. Some of thosedividends were paid out in 168.2 million shares issued to shareholders who had elected toreceive new shares instead of cash, under our Scrip Dividend Programme. The ScripDividend Programme has been cancelled with effect from the fourth quarter 2017 interimdividend.
The fourth quarter 2017 interim dividend of $0.47 per share will be payable toshareholders on the register at February 16, 2018. See Note 23 to the “ConsolidatedFinancial Statements” on page 175. The Board expects that the first quarter 2018 interimdividend will be $0.47 per share, equal to the US dollar dividend for the same quarter in2017. PURCHASES OF SECURITIESAt the 2017 Annual General Meeting (AGM), shareholders granted an authority, whichexpires at the end of the 2018 AGM, for the Company to repurchase up to a maximum of817 million of its shares (excluding purchases for employee share plans). While no sharerepurchases for cancellation were made during 2017, the Board continues to regard theability to repurchase issued shares in suitable circumstances as an important part of Shell’sfinancial management. At Management Day in November 2017, we confirmed ourintention to undertake a share buyback programme of at least $25 billion in the period2017 to 2020, subject to progress with debt reduction and recovery in oil prices. Aresolution will be proposed at the 2018 AGM to renew the authority for the Company topurchase its own share capital, up to specified limits, for a further year. This proposal willbe described in more detail in the Notice of Annual General Meeting. Shares are also purchased by the employee share ownership trusts and trust-like entities(see the “Directors’ Report” on page 75) to meet delivery commitments under employeeshare plans. All share purchases are made in open-market transactions. The table below provides information on purchases of shares in 2017 by the issuer andaffiliated purchasers. Purchases in euros and sterling are converted into dollars using theexchange rate on each transaction date.
Purchases of equity securities by issuer and affiliated purchasers in 2017 [A] A shares B shares A ADSs[B]
Purchase period
Numberpurchased
for employeeshare plans
Weightedaverage
price ($)[C]
Numberpurchased
for employeeshare plans
Weightedaverage
price ($)[C]
Numberpurchased
for employeeshare plans
Weightedaverage
price ($)[C] January — — — — 1,142,102 55.62 February — — — — — — March 2,612,020 26.39 103,495 27.49 — — April — — — — — — May — — — — — — June — — 51,807 27.63 — — July — — — — — — August — — — — — — September 7,404,400 29.59 50,058 29.85 — — October 2,908,530 30.06 — — — — November — — — — — — December — — 40,255 33.42 4,237,129 65.14 Total 2017 12,924,950 29.05 245,615 28.97 5,379,231 63.12[A] Excludes shares issued to affiliated purchasers pursuant to the Scrip Dividend Programme. [B] American Depository Shares.[C] Includes stamp duty and brokers’ commission.
STRATEGIC REPORT SHELL ANNUAL REPORT AND FORM 20-F 2017 56

CONTRACTUAL OBLIGATIONSThe table below summarises our principal contractual obligations at December 31, 2017,by expected settlement period. The amounts presented have not been offset by anycommitted third-party revenue in relation to these obligations.
Contractual obligations $ billion
Less than
1 year
Between1 and 3
years
Between3 and 5
years 5 years
and later Total Debt [A] 10.7 14.4 9.9 35.0 70.0 Finance leases [A] 2.3 4.2 4.0 15.1 25.6 Operating leases [A] 4.8 7.2 5.8 5.7 23.5 Purchase obligations [B] 135.4 83.5 45.5 131.4 395.8 Other long-term contractual liabilities [C] — 0.7 0.3 1.0 2.0 Total 153.2 110.0 65.5 188.2 516.9[A] See Note 14 to the “Consolidated Financial Statements” on pages 157-159. Debt contractual obligations exclude interest,which is estimated to be $2.0 billion payable in less than one year, $3.1 billion between one and three years, $2.5 billionbetween three and five years, and $15.3 billion in five years and later. For this purpose, we assume that interest rates withrespect to variable interest rate debt remain constant at the rates in effect at December 31, 2017, and that there is no change inthe aggregate principal amount of debt other than repayment at scheduled maturity as reflected in the table. Finance leasecontractual obligations include interest. [B] A purchase obligation is an agreement to purchase goods or services that is enforceable and legally binding and specifiesterms such as: fixed or minimum quantities to be purchased; fixed, minimum or variable price provisions; and the approximatetiming of the transaction. [C] Includes all obligations included in “Trade and other payables” in “Non-current liabilities” in the “Consolidated BalanceSheet” that are contractually fixed as to timing and amount. In addition to these amounts, Shell has certain obligations that arenot contractually fixed as to timing and amount, including contributions to defined benefit pension plans (see Note 17 to the“Consolidated Financial Statements” on pages 163-165) and obligations associated with decommissioning and restoration (seeNote 18 to the “Consolidated Financial Statements” on page 166). GUARANTEES AND OTHER OFF-BALANCE SHEET ARRANGEMENTSThere were no off-balance sheet arrangements at December 31, 2017, or 2016,reasonably likely to have a material effect on Shell. FINANCIAL INFORMATION RELATING TO THE ROYAL DUTCH SHELLDIVIDEND ACCESS TRUSTThe results of operations and financial position of the Royal Dutch Shell Dividend AccessTrust (the Trust) are included in the consolidated results of operations and financialposition of Shell. Certain condensed financial information in respect of the Trust is givenbelow. See “Royal Dutch Shell Dividend Access Trust Financial Statements” on pages213-216. The Shell Transport and Trading Company Limited and BG Group Limited have eachissued a dividend access share to Computershare Trustees (Jersey) Limited (the Trustee).For the years 2017, 2016 and 2015, the Trust recorded income before tax of £4,567million, £3,879 million, and £2,726 million respectively. In each period, this reflected theamount of dividends received on the dividend access shares. At December 31, 2017, the Trust had total equity of £nil (2016: £nil; 2015: £nil),reflecting cash of £2 million (2016: £2 million; 2015: £2 million) and unclaimeddividends of £2 million (2016: £2 million; 2015: £2 million). The Trust only records aliability for an unclaimed dividend, and a corresponding amount of cash, to the extentthat dividend cheque payments have not been presented within 12 months, have expiredor have been returned unpresented.
STRATEGIC REPORT SHELL ANNUAL REPORT AND FORM 20-F 2017 57

Our success in business depends on our ability to meet a range of environmental andsocial challenges. We must operate safely and manage the effect our activities can have onneighbouring communities and wider society. If we fail to do this, we may incur liabilitiesor sanctions, lose business opportunities, harm our reputation, or our licence to operatemay be impacted (see “Risk factors” on page 14). Data in this section are reported on a 100% basis in respect of activities where we are theoperator. Reporting on this operational control basis differs from that applied forfinancial reporting purposes in the “Consolidated Financial Statements” on pages 137-178. Detailed data and information on our 2017 environmental and social performancewill be published in the Shell Sustainability Report in April 2018. CONTROL FRAMEWORKThe Shell General Business Principles set out our responsibilities to shareholders,customers, employees, business partners and society. They set the standards for the waywe conduct business, with integrity and respect for people, the environment andcommunities. All ventures that we operate must conduct their activities in line with ourbusiness principles. We aim to minimise the environmental impact of new projects and existing operationsand we engage with local communities and non-governmental organisations tounderstand and respond to their concerns. Shell conducts an environmental, social andhealth impact assessment for every major project. This helps us to understand and managethe effects our projects could have on the surrounding environment and localcommunities. We have standards and a clear governance structure in place to helpmanage potential impacts. Our standards are defined in our Health, Safety, Security,Environment and Social Performance (HSSE & SP) Control Framework (ControlFramework), in line with our Commitment and Policy and the Shell Code of Conduct,and are supported by a number of guidance documents. They apply to every Shell entity,including all employees and contract staff, and to Shell-operated ventures. The ControlFramework defines standards and accountabilities at each level of the organisation, andsets out the procedures and processes people are required to follow. We manage HSSE &SP risks to as low as reasonably practicable, which is a business responsibility supportedby the HSSE & SP function. The process safety and HSSE & SP assurance team providesassurance on the effectiveness of HSSE & SP controls.
BG HSSE & SP requirements for all former BG assets were reviewed against the ControlFramework, and now comply with it or have risk-based plans in place to close gaps byearly 2019. Our three Golden Rules require our employees and contract staff to comply with laws andregulations as well as our standards and procedures, to intervene in unsafe or non-compliant situations, and to respect our neighbours. In ventures not operated by us, Shell-appointed representatives encourage our partners toapply standards and principles similar to our own. We support these ventures in theirimplementation of our HSSE & SP Control Framework, or of a similar framework, andoffer to review the effectiveness of their implementation. Even if such a review is notcarried out, we periodically evaluate HSSE & SP risks faced by our ventures which we donot operate. If one of these ventures falls below expectations, we work to put plans inplace, in agreement with our partners, to improve performance. SAFETYSafety is central to the responsible delivery of energy. We develop and operate ourfacilities with the aim of preventing any incidents that may harm our employees, contractstaff or nearby communities, or cause damage to our assets or adversely impact theenvironment. We manage safety risks across our businesses through clear standards,controls and compliance systems, combined with a safety-focused culture. We focus onthe three areas of safety with the highest risks associated with our activities: personal,process, and transport. We ensure that people responsible for tasks involving a significantsafety hazard have the necessary training and skills. Safety performance is included in ourannual bonus scorecard for all our employees. Also see “Directors’ Remuneration Report”on page 102.
We continue to strengthen the safety culture and leadership among our employees andcontract staff, with the focus on caring for people. Our safety goal is to achieve no harmand no leaks across all of our operations. We refer to this as our Goal Zero ambition.
We expect everyone working for us to intervene and stop work that may appear to beunsafe. In addition to our ongoing safety awareness programmes, we hold an annualglobal safety day to give employees and contract staff time to reflect on how to preventincidents. We expect everyone working for us to comply with our 12 mandatory Life-Saving Rules. If employees break these rules, they face disciplinary action up to andincluding termination of employment. If contract staff break the Life-Saving Rules, theycan be removed from the worksite.
Process safety management is about keeping hazardous substances inside pipes, tanks andvessels so they do not cause any harm to people or the environment. It starts at the designand construction stage of our projects and is implemented throughout the life cycle ofthese facilities to ensure they are operated safely, well-maintained and regularly inspected.Our global standards and operating procedures define the controls and physical barrierswe require to prevent incidents. For example, our offshore wells are designed with at leasttwo independent barriers in the direction of flow to mitigate the risk of an uncontrolledrelease of hydrocarbons. We regularly inspect, test and maintain these barriers to ensurethey meet our standards. In the event of a loss of containment such as a spill or a leak, weemploy independent recovery measures to prevent the release from becomingcatastrophic. This system of barriers and recovery measures is known as a “bow-tie”, amodel that visually represents a system where process safety hazards are managedthrough prevention and response barriers. Since 2016, we have been working onstrengthening barriers that involve critical safety tasks carried out by frontline staff. Wehave developed a set of process safety fundamentals, providing clear guidelines for goodoperating practice to prevent unplanned releases.
Environment and society
STRATEGIC REPORT SHELL ANNUAL REPORT AND FORM 20-F 2017 58

We also routinely prepare and practise our emergency response to potential incidents suchas a spill or a fire. This involves working closely with local services and regulatoryagencies to jointly test our plans and procedures. These tests continually improve ourreadiness to respond. If an incident does occur, we have procedures in place to reduce theimpact on people and the environment. Moving large numbers of people, products and equipment by road, rail, sea and air posessafety risks. We develop best-practice standards within Shell to find ways of reducingtransport safety risks, and work with specialist contractors, industry bodies, non-governmental organisations and governments.
While we continually work to minimise the likelihood of incidents, some do occur. Forexample, in 2017, there were fires at the Shell-operated Enchilada platform in the USGulf of Mexico and at our Bukom manufacturing site in Singapore. We investigate all incidents to understand the underlying causes and seek to translate theseinto improvements in standards or ways of working that can be applied broadly acrosssimilar facilities in Shell. As set out in “Performance indicators” on page 23, our totalrecordable case frequency (injuries per million working hours) was 0.8 in 2017,compared with 1.0 in 2016, and there were 166 operational Tier 1 and 2 process safetyevents in 2017, compared with 146 in 2016. Detailed information on our 2017 safetyperformance will be published in the Shell Sustainability Report in April 2018. Our performance indicators report on personal and process safety in line with industrystandards. Not reflected in these indicators is a devastating road-tanker incident thatoccurred in Pakistan in June 2017. A tanker, operated by a contractor, was transportingfuel from the Shell Pakistan Limited oil terminal in Karachi to Vehari when it overturnedin the central Punjab province resulting in a fuel spill. Following the accident, peoplefrom a nearby village approached the site to collect the fuel spilling from the tanker.Tragically, the fuel ignited and more than 200 people died and more were injured. ShellPakistan Limited is implementing a long-term relief plan for those impacted. ENVIRONMENTWe carefully consider the potential environmental impact of our activities and how localcommunities might be affected during the lifetime of our projects and operations. Weseek to comply with environmental regulations, to continually improve our performance,and to prepare to respond to future challenges and opportunities. We use externalstandards and guidelines, such as those developed by the World Bank and InternationalFinance Corporation, to inform our approach. We have global environmental standards,which we believe meet all regulatory requirements and often exceed them. Our standardscover our environmental performance, including managing emissions of greenhousegases (GHG), using energy more efficiently, flaring less gas during oil production,preventing spills and leaks of hazardous materials, using less fresh water and conservingbiodiversity wherever we operate.
For example, the availability of fresh water is a growing challenge in some parts of theworld. A combination of increasing demand for water resources, growing stakeholderexpectations and concerns, and water-related legislation may drive actions that affect ourability to secure access to fresh water and to discharge water from our operations. Wemanage our water use carefully, and we tailor our use of fresh water to local conditionsbecause water constraints affect people at the local or regional level. In some cases, weuse alternatives to fresh water in our operations; these include recycled water, processedsewage water and desalinated water. For example, at our gas-to-liquids plant in the Qataridesert, we clean and reuse industrial process water. This means that we avoid using thecountry’s scarce natural water resources. An assessment of risks to water availability isrequired to be undertaken for each of our assets and projects and, in areas of waterscarcity, we develop water-management action plans that identify ways to use less freshwater, recycle water and closely monitor its use.
See “Climate change and energy transition” on pages 62-66 for more information on howwe manage our GHG emissions. SPILLSLarge spills of crude oil, oil products and chemicals associated with our operations canadversely impact the environment and result in major clean-up costs as well as fines andother damages. They can also affect our licence to operate and harm our reputation. Wehave clear requirements and procedures designed to prevent spills, and our asset integrityprogrammes include the design, maintenance and operation of spill containment facilities. Our business units are responsible for organising and executing oil-spill responses in linewith Shell guidelines as well as with relevant legal and regulatory requirements. All ouroffshore installations have plans in place to respond to spills. These plans detail responsestrategies and techniques, available equipment, and trained personnel and contracts. Weare able to call upon significant resources such as containment booms, collection vesselsand aircraft. We are also able to draw upon the contracted services of oil-spill responseorganisations, if required. We conduct regular exercises that seek to ensure these plansremain effective. We have further developed our capability to respond to spills to water,and maintain a Global Response Support Network to support our worldwide responsecapability. This is also supported by our global Oil Spill Expertise Centre, which testslocal capability and maintains our capability globally to respond to a significant incident. We are a founding member of the Marine Well Containment Company, a non-profitindustry consortium providing a well-containment response system for the Gulf ofMexico. In addition, we were a founding member of the Subsea Well Response Project,an industry cooperative effort to enhance global well-containment capabilities. Theadditional well-containment capability developed by this project is managed by anindustry consortium via Oil Spill Response Limited.
We also maintain site-specific emergency response plans in the event of an onshore spill.Like the offshore response plans, these are designed to meet Shell guidelines as well asrelevant legal and regulatory requirements. They also provide for the initial assessment ofincidents and the mobilisation of resources needed to manage them. In 2017, the number of operational spills of more than 100 kilograms increased to 99from 72 in 2016 (see “Performance indicators” on page 23). The number for 2016 wasupdated from 71 to reflect the completion of investigations into spills. At the time ofpublication of this Report, there were three spills under investigation in Nigeria that mayresult in adjustments.
STRATEGIC REPORT SHELL ANNUAL REPORT AND FORM 20-F 2017 59

Spills in NigeriaMost oil spills in the Niger Delta region of Nigeria continue to be caused by crude oiltheft or sabotage of facilities, as well as illegal oil refining. In 2017, close to 90% of thenumber of oil spills of more than 100 kilograms from The Shell Petroleum DevelopmentCompany of Nigeria Limited (SPDC) joint venture facilities was due to illegal activities bythird parties. However, there are instances where spills occur due to operational reasons.Irrespective of the cause, SPDC cleans up and remediates areas impacted by spillsoriginating from its facilities. In the case of operational spills, SPDC also payscompensation to people and communities impacted by the spill. Once clean-up andremediation work are completed, the work is inspected and, if satisfactory, approved andcertified by Nigerian regulators. To reduce the number of operational spills, SPDC is focused on implementing its ongoingwork programme to appraise, maintain and replace key sections of pipelines and flowlines. Over the last six years, more than 1,200 kilometres of pipelines and flow lines havebeen replaced. SPDC continues to undertake initiatives to prevent and minimise spills caused by theft andsabotage of its facilities in the Niger Delta. In 2017, SPDC continued on-groundsurveillance efforts on the SPDC joint venture’s areas of operations, including its pipelinenetwork, to mitigate incidences of third-party interference and ensure that spills aredetected and responded to as quickly as possible. There are also daily overflights of thepipeline network to identify any new spill incidents or illegal activities. SPDC has alsoimplemented anti-theft protection mechanisms on key infrastructure. Since 2012, SPDC has worked with the International Union for Conservation of Nature toenhance remediation techniques and to protect biodiversity at sites affected by oil spills inSPDC’s areas of operation in the Niger Delta. Based on this partnership, SPDC haslaunched further remediation improvement initiatives to help strengthen its remediationand rehabilitation efforts. SPDC also works with a range of stakeholders in the Niger Delta to build greater trust inspill response and clean-up processes. Wherever possible, local communities take part inthe remediation work. In certain instances, some non-governmental organisations havealso participated in joint investigation visits along with government regulators, SPDC andimpacted communities, to establish the cause and volume of oil spilled. In addition, SPDC has implemented several initiatives and partnerships to raise awarenesson the negative impact of crude oil theft and illegal oil refining. Examples includecommunity-based pipeline surveillance and the promotion of alternative livelihoodsthrough Shell’s flagship youth entrepreneurship programme, Shell LiveWIRE. In 2015, SPDC, on behalf of the SPDC joint venture and the Bodo community, signed amemorandum of understanding (MOU) granting access to SPDC to begin the clean-up ofareas affected by two operational spills in 2008. The MOU also provided for the selectionof two contractors to conduct the clean-up and to be overseen by an independent projectdirector. The clean-up project suffered a delay in 2016 and most of 2017 due to accesschallenges from the community. After significant engagement with the communities andother stakeholders managed by the Bodo Mediation Initiative, the clean-up andremediation activities of Bodo started in September 2017. The clean-up will consist offour phases: clean-up of free-phase surface oil, remediation of soil, restoration ofmangroves, and monitoring. Should activities continue uninterrupted, the process isexpected to take around three years. However, for it to be successful, the repeated re-contamination of remediated sites due to crude oil theft and illegal refining must end. SPDC remains committed to the implementation of the 2011 United NationsEnvironmental Programme (UNEP) Report on Ogoniland. Throughout 2017,
SPDC representatives continued to actively support the clean-up process within thegovernance framework established in August 2016 by the Nigerian government tooversee the process. The UNEP report recommended the creation of an Ogoni RestorationFund (ORF) with capital of $1 billion, to be co-funded by the Nigerian government andthe SPDC joint venture, as well as other operators in the area. SPDC remains fullycommitted to supporting and contributing its share to the ORF and on behalf of the SPDCjoint venture made available $10 million in early 2017 to help set up the HydrocarbonPollution and Remediation Project, a government-led body to clean up contaminatedsites. Over the last six years, SPDC has taken action on all the UNEP recommendationsaddressed specifically to it as operator of the joint venture and has carried out themajority of these recommendations. HYDRAULIC FRACTURINGTight and shale oil and gas continue to play an important role in meeting global energydemand. Over the last decade, we have expanded our onshore oil and gas portfolio usingadvances in technology to access previously uneconomic tight-oil and tight-gas resources,including those locked in shale formations. One of the key technologies applied in tight-oil and tight-gas fields is known as hydraulicfracturing, a technique used since the 1950s. It involves pumping fluids that are typically99% water and sand and around 1% chemical additives into tight sand or shale rock athigh pressure. This creates thread-like fissures, through which oil and gas can flow. Shell developed and publicly shares a set of five global operating principles that governthe onshore tight/shale oil and gas activities where hydraulic fracturing is used. Theprinciples cover safety, air quality, water protection and use, operational footprint, andengagement with local communities. We support the development of regulationsconsistent with these principles, which are designed to reduce risks to the environmentand seek to ensure the safety of those living near our operations. As new technologies,challenges and regulatory requirements emerge, we review and update our operatingprinciples. Each of our projects takes into account the local context, including the geology of thearea, and we then design our activities with the aim to suit local conditions. Before wedrill, conduct exploratory field work, or develop a field, we conduct a hazard assessment.Throughout our operations, we take measures to protect both ground and surface water,and ensure environmentally responsible water sourcing, use, storage and disposal. Werecycle or reuse water to the extent that it is reasonably practicable. To protect and isolate potable groundwater from hydraulic-fracturing fluids in thewellbore, we line all our wells with steel casing and cement. All of our wells are expectedto have two or more subsurface barriers to protect groundwater. We monitor a wellbore’sintegrity before, during and after hydraulic fracturing. When we acquire assets, weevaluate the assets’ wells for conformity with our safety and operating principles, and putin place a plan with a timeline for rectifying any inconsistencies as far as reasonablypracticable.
To the extent allowed by our suppliers, we support full disclosure of the chemicals usedin hydraulic-fracturing fluids for Shell-operated wells. Material Safety Data Sheetinformation is available on site where wells are being hydraulically fractured. We supportregulation to require suppliers to release such information. The chemicals used inhydraulic fracturing will vary from well to well and from contractor to contractor, butsome can be toxic. For that reason, we have stringent procedures for handling hydraulic-fracturing chemicals. The formations into which hydraulic-fracturing chemicals may be injected are typicallymore than a kilometre below freshwater aquifers. Our procedures
STRATEGIC REPORT SHELL ANNUAL REPORT AND FORM 20-F 2017 60

require that potable groundwater must be isolated from well completion and productionactivities. Moreover, we only use air, water or a water-based liquid while drilling throughthe potable groundwater aquifer to a depth below the aquifer. The casing and cement arethen put in place before drilling is resumed and hydraulic fracturing is initiated. Aspermitted, we test potable groundwater that is being used for drinking, farming and otheractivities near our fracturing operations. Some jurisdictions are considering more stringent permitting, reduced freshwater use,well-construction and other regulations relating to fracturing, as well as local bans andother land use restrictions. Such regulations could subject our operations to delays,increased costs or prohibitions. We believe our current procedures meet or exceed theexisting regulatory requirements of the jurisdictions where we operate. We believe we cansafely and responsibly explore, develop and produce tight-oil and tight-gas wherehydraulic fracturing technology is used – and we support regulation, as long as it is fit-for-purpose and effective. SEISMICITYAs oil and gas fields mature, seismic activity may increase in certain circumstances basedon the unique geology of individual fields. For example, in recent years, public concernabout gas production in Groningen province in the Netherlands has grown as a result ofan increase in the number and severity of induced earthquakes in the area (see“Upstream” on page 33). The field is operated by Nederlandse Aardolie MaatschappijB.V. (NAM, Shell interest 50%) and is one of the largest onshore gas fields in Europe. Arange of actions have been taken to improve safety, liveability and economic prospects inthe region. NAM is working together with all relevant parties to fulfil commitments to theresidents of the area. There have also been some reports linking hydraulic fracturing and long-term waterdisposal to earth tremors. The vast majority of earthquakes are tectonic (natural) but,under some circumstances, seismicity can be induced by human activities. Some areas aremore seismically active than others. We analyse publicly available seismic, geologic andgeophysical data to determine historical seismicity in areas where we plan to operate. Ifwe detect high seismic activity or any such activity beyond historic levels, we willinvestigate and review our operations. We are supportive of local regulations that are fit-for-purpose, based on local geology and surface conditions, in managing the potential forinduced seismicity in our operating areas. In addition to adhering to local regulations, wehave our own guidelines on how to assess the potential and effects of induced seismicityin the area, as well as recommendations that outline monitoring, mitigation and responseprocedures. ENVIRONMENTAL COSTSWe are subject to a variety of environmental laws, regulations and reporting requirementsin the countries where we operate. Infringing any of these laws, regulations andrequirements could result in significant costs, including clean-up costs, fines, sanctionsand third-party claims, as well as harm our reputation and our ability to do business. Our ongoing operating expenses include the costs of avoiding unauthorised dischargesinto the air and water, and the safe disposal and handling of waste.
We place a premium on developing effective technologies that are also safe for theenvironment. However, when operating at the forefront of technology, there is always thepossibility that a new technology brings with it environmental impacts that have not beenassessed, foreseen or determined to be harmful when originally implemented. While webelieve we take all reasonable precautions to limit these risks, we are subject to additionalremedial environmental and litigation costs as a result of our operations’ unknown andunforeseen impacts on the environment. Although these costs have so far not beenmaterial to us, no assurance can be given that this will always be the case. SECURITYOur operations expose us to social instability, civil unrest, terrorism, piracy, acts of warand risks of pandemic diseases that could have a material adverse effect on our business(see “Risk factors” on page 13). We seek to obtain the best possible information to enableus to assess threats and risks. We conduct detailed assessments for all sites and activities,and implement appropriate risk mitigation measures to detect, deter and respond tosecurity threats. This includes building strong and open relationships with governmentsecurity agencies, the physical hardening of sites, journey management, and informationrisk management. We conduct training and awareness campaigns, including travel adviceand medical assistance before travel. The identities of our employees and contract staffand their access to our sites and activities, both physical and logical, are consistentlyverified and controlled. We manage and exercise crisis response and management plans. NEIGHBOURING COMMUNITIESEarning the trust of local communities is essential to the success of our projects andoperations. We have global requirements for social performance, which aim to ensure thatwe operate in a responsible way, deliver projects without delay and minimise the socialimpacts of our operations. Our requirements also help us to better share the benefits ofour activities, such as employment and contractual opportunities that help develop localeconomies. Specifically, the requirements set clear rules and expectations for how we engage withand respect communities that may be impacted by our operations. Shell-operated majorprojects and facilities are required to have a social performance plan and an effectivecommunity feedback mechanism. This helps the business to understand the social contextin which we plan to operate, identify potential negative and positive effects on thecommunity and manage impacts and opportunities. It also helps our neighbouringcommunities to communicate with our operations so that their concerns and wishes aremanaged in a timely manner. In addition, we have specific requirements intended tominimise our impact on indigenous peoples’ traditional lifestyles, cultural heritage and onhandling involuntary resettlement. HUMAN RIGHTSRespect for human rights is embedded in our Business Principles and in our Code ofConduct. Our approach is informed by the Universal Declaration of Human Rights, thecore conventions of the International Labour Organization and the United Nations’Guiding Principles on Business and Human Rights. We work closely with other companies and non-governmental organisations tocontinuously improve the way we apply these principles. Our focus is on four key areas:communities, security, labour rights, and supply chain. We have systems and processes inplace for managing projects, contracting and procurement, recruitment and employment,security and social performance. We require all our companies and our contractors torespect the human rights of our workforce and our neighbouring communities. OurModern Slavery Statement provides more details about the process we apply. It can befound at www.shell.com/uk-modern-slavery-act.html.
STRATEGIC REPORT SHELL ANNUAL REPORT AND FORM 20-F 2017 61

Shell has long recognised that greenhouse gas (GHG) emissions from the use of fossilfuels are contributing to the warming of the climate system. In December 2015, 195nations adopted the Paris Agreement. We welcomed the efforts made by governments toreach this global climate agreement, which entered into force in November 2016. Wefully support the Paris Agreement’s goal to keep the rise in global average temperaturethis century to well below two degrees Celsius (2°C) above pre-industrial levels and topursue efforts to limit the temperature increase even further to 1.5°C. In pursuit of thisgoal, we also support the vision of a transition towards a net-zero emissions energysystem. We also agree with the International Energy Agency (IEA) that meeting the goalof limiting the increase in global temperatures to well below 2°C will be extremelychallenging, but of vital importance to the sustained prosperity of future generations.
Society faces a dual challenge: how to transition to a low-carbon energy future to managethe risks of climate change, while also extending the economic and social benefits ofenergy to everyone on the planet. This is an ambition that requires changes in the wayenergy is produced, used and made accessible to more people while drastically cuttingemissions.
We believe that the need to reduce GHG emissions, which are largely caused by burningfossil fuels, will transform the energy system in this century. This transformation willgenerate both challenges and opportunities for our existing and future portfolio.
We welcome and support efforts, such as those led by the Task Force on Climate-relatedFinancial Disclosures (TCFD), to increase transparency and to promote investors’understanding of companies’ strategies to respond to the risks and opportunities presentedby climate change. We believe that companies should be clear about how they plan to beresilient in the energy transition. Therefore, we are working with the TCFD to developguidance on effective disclosures which, where commercially possible, will be mostrelevant and useful to investors. The Shell Sustainability Report (April 2018) and otherpublications aim to complement our 2017 Annual Report in responding to the TCFDrecommendations, including discussing the energy transition and Shell´s portfolioresilience.
OUR GOVERNANCE AND MANAGEMENT OF CLIMATE CHANGERISKS AND OPPORTUNITIESClimate change and risks resulting from GHG emissions have been identified as asignificant risk factor for Shell and are managed in accordance with other significant risksthrough the Board and Executive Committee. See “Corporate governance” on page 82.
Shell has a climate change risk management structure in place which is supported bystandards, policies and controls.
This includes the work of the Board, which discusses a number of regular agenda items,among them reporting on environmental topics. Throughout 2017, the Board heldstrategy sessions in the context of the changing global energy market, energy transitionand climate change, and considered risks and opportunities of the current and futureshape of Shell´s portfolio for different timescales. The top priorities identified for 2018 inthis area include the energy transition and implementation of our strategy for the NewEnergies business.
The Board committees (see “Corporate governance” on page 80) play an important rolein assisting the Board with regard to governance and management of climate change risksand opportunities.
The responsibilities of the Corporate and Social Responsibility Committee (CSRC) includethe review of the management of environmental and social impacts of projects andoperations. In 2017, among the key topics were the energy transition, GHG emissiontargets, and other carbon dioxide (CO2) and methane-related developments, such asShell’s net carbon footprint ambition and guiding principles on reducing methaneemissions.
The Remuneration Committee (REMCO) is responsible for setting the Directors’Remuneration Policy in alignment with strategy. In 2017, activities for REMCO includedsetting annual bonus performance measures and targets, for example, introducing GHGmetrics in the scorecard following recommendations by the CSRC, and embedding theenergy transition into the Chief Executive Officer´s (CEO) personal performance targets.See “Directors’ Remuneration Report” on pages 94-95. The Shell employee scorecardstructure for determining employees’ annual bonus in 2017 was consistent with theExecutive Directors’ scorecard.
The Audit Committee has key responsibilities in assisting the Board in fulfilling itsoversight responsibilities in relation to areas such as the effectiveness of the system of riskmanagement and internal control. Any concerns regarding improvement needed arepromptly reported to the Board.
The CEO is the most senior individual with accountability for climate change risk. Wehave set up several dedicated climate change and GHG-related forums at different levelsof the organisation where climate change issues are addressed, monitored and reviewed,and each Shell subsidiary has operational responsibility for implementing climate changepolicies and strategies.
A senior manager – the Executive Vice President for Safety and Environment – reportingdirectly to an Executive Director (the Projects & Technology Director) is accountable,among other things, for oversight of GHG issues. This manager´s department includes thededicated Group CO2 team, which is accountable for monitoring and examining thestrategic implications of climate change for Shell and the impact of developments ingovernmental policy and regulation. The Group CO2 team is responsible for preparingproposed policy positions based on analysis within Shell and external input. The teamalso ensures consistency in application of our core principles and policy tasks ininteractions with policy makers. Reporting to the same manager is the HSSE & SPAssurance and Reporting team, which is accountable for the delivery of Shell’s non-financial reporting and for auditing the businesses´ performance against our HSSE & SPControl Framework requirements, including climate change risk management. See“Environment and society” on page 58.
Group CO2 also has oversight of Shell’s GHG management programme and supports thedifferent lines of business in embedding GHG management strategies. The team includesGHG project managers to guide the largest projects, which represent around 80% of alladditional GHG emissions from new investments, in managing GHG-related content,from both a risk and an opportunity standpoint. Risk management at an asset or projectlevel is a structured process of identifying and assessing risks, planning and implementingresponses, monitoring, improving and closing out action items that have an impact onprojects and assets’ objectives. Group CO2 support is provided for each relevantmilestone and a formal sign-off process on abatement plans and targets is applied.
Further support for embedding GHG risk management is provided by a global expertiseteam for GHG and energy management. This team is a network of subject-matter expertsin GHG topics that works globally and across our lines of business. Team members areexperts in their relevant disciplines, defining improvement areas globally and capturingand sharing best practices.
Climate change and energy transition
STRATEGIC REPORT SHELL ANNUAL REPORT AND FORM 20-F 2017 62

The above-mentioned teams and experts have provided their input to shape a set ofmandatory manuals and complementary guidance documents which are ultimately basedon our HSSE & SP Control Framework. These documents provide guidance on how tomonitor, communicate and report changes in the risk environment, and how to review theeffectiveness of actions taken to manage the identified risks, including ways to: ■ ensure consistent assessment of climate risk across Shell;■ clarify expectations for risk management and reporting, including roles and
responsibilities;■ strengthen decision making through better visibility and understanding of the climate
risk by line of business; and■ enable integration of Shell’s reporting.
For more detail on our definition of risk categories and their relationship to different timehorizons, see page 65.
This structured approach supports the prioritisation of risks and opportunities. Weactively monitor the GHG footprint of all our assets, as well as our products, to quantifyfuture regulatory costs related to GHG or other climate-related policies. This allows us toeffectively prioritise areas of greater concern
and assess mitigation options and the most viable responses. Climate-related risks areanalysed in context of other identified material risks. See “Risk factors” on pages 12-16.
Our portfolio exposure is reviewed annually against changing GHG regulatory regimesand physical conditions to identify emerging risks. We test the resilience of our portfolioagainst externally published future pathways, including a low emissions pathway.
To test the resilience of new projects, we assess potential costs associated with GHGemissions when evaluating all new investments. Our approach generally applies a projectscreening value (PSV) of $40 (real terms) per tonne of GHG emissions to the total GHGemissions of each investment. This PSV is generally applied when evaluating our newprojects around the world to test their resilience across a range of future scenarios. Theproject development process features a number of checks that may require developmentof detailed GHG and energy management plans. High-emitting projects undergoadditional sensitivity testing, including more detailed economic analysis on local GHGcosts, demand sensitivity and the potential for later retrofitting of carbon capture andstorage (CCS) facilities. In certain countries, these estimated GHG costs can exceed$100/tonne (in real terms) in the post 2030 environment, reflecting our presumption thatgovernments will eventually take aggressive action to regulate GHG emissions inaccordance with their Paris Agreement ambitions. Projects in the most GHG-exposed assetclasses have GHG intensity targets that reflect standards sufficient to allow them tocompete and prosper in a more GHG-regulated future. These processes can lead toprojects being stopped, designs being changed, and potential GHG mitigation investmentsbeing identified, in preparation for when regulation would make these investmentscommercially compelling.
While monitoring emerging climate change plans, we consider the robustness of ouractivities against a range of scenarios, including the IEA scenarios. We believe ourbusiness strategy is resilient to the envisaged implementation of the Paris Agreement,which is now progressing through countries’ development of individual plans in theirNationally Determined Contributions (NDCs). The emissions resulting from energyconsumers using Shell products are for a large part covered by these NDCs. The ParisAgreement acknowledges that emissions will continue and even grow in some parts of theworld. It does not stipulate that emissions must fall in all sectors or countriessimultaneously, or that all actors within the system will reduce their emissions. What isimportant is that emissions fall overall.
OUR PORTFOLIO AND CLIMATE CHANGEWe are seeking cost-effective ways to manage GHG emissions and see potential businessopportunities in developing such solutions. We seek to contribute to reducing globalGHG emissions in a number of ways:
■ supplying more natural gas to replace coal for power generation;■ progressing CCS technologies;■ implementing energy-efficiency measures in our operations where reasonably practical;■ developing new fuels for transport such as advanced biofuels and hydrogen; and■ participating throughout the power value chain with a focus on natural gas and
renewable electricity.
To support this, we continue to advocate the introduction of effective government-ledcarbon pricing mechanisms.
While we aspire to reduce our GHG intensity, as energy demand increases and easilyaccessible oil and gas resources decline, we may develop resources that require moreenergy and advanced technologies to produce. If our production becomes more energyintensive, this could result in an associated increase in direct GHG emissions from ourupstream facilities.
STRATEGIC REPORT SHELL ANNUAL REPORT AND FORM 20-F 2017 63

Some governments have introduced carbon pricing mechanisms, which we believe can bean effective measure to reduce GHG emissions across the economy at lowest overall costto society, and we expect more governments to follow. However, we believe measurestaken by governments to control national energy transitions may also cause unintendedconsequences when prohibition of one technology supports others that could evenincrease GHG emissions.
See “Risk factors” on page 13.
NATURAL GASAccording to the IEA, more than 40% of global CO2 emissions in 2015 came fromelectricity and heat generation. For many countries, using more gas in power generationinstead of coal can make the largest contribution, at lowest cost, in meeting their GHGemission reduction objectives. We expect that, in combination with renewables and use ofCCS, natural gas will be essential for significantly lower GHG emissions. Natural gasmade up more than half of Shell’s proved reserves at the end of 2017. As one of theleaders in liquefied natural gas (LNG), our portfolio of conventional gas assets and ourtechnologies for recovering gas from tight-rock formations, we can supply natural gas toreplace coal for power generation. Natural gas can also act as a partner for intermittentrenewable energy, such as solar and wind, to maintain a steady supply of electricity,because gas-fired plants can start and stop relatively quickly.
Methane is a more potent GHG than CO2: it has 34 times the global warming potential ofCO2 on a 100-year timeframe, according to the Intergovernmental Panel on ClimateChange (IPCC) Fifth Assessment Report. Natural gas emits between 45% and 55% lessGHG emissions than coal when burnt at a power plant according to IEA data, butmethane leakage in the natural gas supply chain would reduce this benefit. We recognisethe importance of reducing methane emissions. Methane from the flaring and venting ofgas (including equipment venting) in our upstream oil and gas operations was the largestcontributor to our reported methane emissions in 2017. We are working to reducemethane emissions from these sources by reducing the overall level of flaring andventing. In addition, we continue to implement leak detection and repair programmesacross our sites to identify unintended losses (for example, small leaks sometimes calledfugitive emissions) and high-emission equipment, such as high-bleed pneumatic devices,so they can be replaced or repaired. We continue to work to confirm that we haveidentified all potential methane sources and that we have reported our emissions fromthese sources in line with regulations and industry standards. In 2017, we joined theClimate and Clean Air Coalition Oil & Gas Methane Partnership. It brings togetherindustry, governments and non-governmental organisations to improve understanding ofmethane emissions and work towards reducing them. In November 2017, Shell – alongwith seven other energy companies – signed guiding principles for reducing methaneemissions across the natural gas value chain. The principles focus on: continuallyreducing methane emissions; advancing strong performance across gas value chains;improving accuracy of methane emissions data; advocating sound policies andregulations on methane emissions; and increasing transparency.
Shell is also a member of the Oil and Gas Climate Initiative (OGCI), a CEO-led initiativeto lead the industry’s response to climate change. One of OGCI’s focus areas is methanemanagement. In 2017, OGCI’s CEOs committed to: establish a methodology to improvethe collection, verification and reporting of methane emission data; develop a baseline ofmethane emissions; and announce a methane target by the end of 2018. In 2017, OGCI´sinvestment arm, OGCI Climate Investments, made its first investments in innovativetechnologies that have the potential to significantly reduce GHG emissions.
Detailed information on our approach to managing methane emissions and performancewill be published in the Shell Sustainability Report in April 2018.
CARBON CAPTURE AND STORAGECCS is a technology used for capturing CO2 before it is emitted into the atmosphere, thentransporting it through pipelines and injecting it into a deep geological formation forlong-term storage. In the IEA 450 Scenario, CCS contributes around 12% of the CO2mitigation effort required by 2050, assuming that the use of CCS technology grows inaccordance with the IEA scenario. In November 2015, we launched our Quest CCSproject in Canada, which has captured and safely stored more than 2 million tonnes ofCO2 since it began operating. We are also involved in a CCS test centre in Mongstad,Norway, the development of the Gorgon CO2 injection project in Australia, and the QatarCarbonates and Carbon Storage Research Centre in the UK. We also have technology thatcan remove both CO2 and sulphur dioxide from industrial flue gases. It is being used atBoundary Dam, a third-party coal-fired power plant in Canada.
ENERGY EFFICIENCYWe continue to work on improving energy efficiency at our oil and gas productionfacilities, refineries and chemical plants. Measures include our GHG and energymanagement programme that focuses on the efficient operation of existing equipment.This means, for example, using monitoring systems which give us real-time informationthat we can use to make energy-saving changes and identify opportunities for energy-saving investments in the medium term. Shell’s scorecard now incorporates GHG metricsthat help create additional incentives for all our employees to reduce GHG emissions inour portfolio. Also see “Directors’ Remuneration Report” on page 102.
NEW ENERGIESIn 2016, we formed our New Energies business to explore lower-carbon energyopportunities with clear commercial value. New Energies is an emerging opportunity, inwhich we plan to invest on average $1-2 billion a year until 2020 as we look forcommercial investments that build on our strengths in new and fast-growing segments ofthe energy industry. It focuses on two main areas: new fuels for transport and power. Ouractivities in new fuels range from developing advanced biofuels to opening hydrogenstations. In power, we focus on meeting commercial, industrial and residential customers’needs supported by our activities in electricity generation, trading and supply. Digitaltechnologies complement our activities in both of these areas. See “Integrated Gas” onpages 28-29. New fuelsWe invest in a range of low-carbon technologies and fuels, including hydrogen andbattery-electric vehicle charging. Hydrogen has the potential to be an important low-carbon transport fuel. We are involved in several initiatives to encourage the adoption ofhydrogen-electric energy. See “Integrated Gas” on page 28. BiofuelsWe believe that low-carbon biofuels will continue to play a valuable part in reducing CO2emissions in the transport sector in the coming decades. Our Raízen joint venture (Shellinterest 50%) in Brazil has produced low-carbon biofuel from sugar cane since 2011. Weare also investing in research to help develop and commercialise advanced biofuels.
The international market for biofuels has grown over the past decade, driven largely bythe introduction of new energy policies in Europe and the USA that call for morerenewable, lower-carbon fuels for transport. They represent approximately 3% of globaltransport fuels today. According to the IEA, sustainable biofuels are expected to play abigger role in helping to meet customers’ fuel needs and reduce CO2 emissions.
From cultivation to use, some biofuels emit significantly less CO2 compared withconventional gasoline. But this depends on several factors, such as how the feedstock iscultivated and the way biofuels are produced. Other
STRATEGIC REPORT SHELL ANNUAL REPORT AND FORM 20-F 2017 64

challenges include concerns over land competing with food crops, labour rights, and thewater used in the production process.
In 2017, we used around 9 billion litres of biofuel in our gasoline and diesel blendsworldwide to comply with applicable mandates and targets in the markets where weoperate. Through our own long-established sustainability clauses in supply contracts, werequest that the biofuels we buy are produced in a way that is environmentally andsocially responsible across the life cycle of the production chain.
Where possible, we source biofuels that have been certified against internationallyrecognised sustainability standards. Shell supports the adoption of internationalsustainability standards, including the Round Table on Responsible Soy, the Roundtablefor Sustainable Palm Oil, and Bonsucro, a non-profit organisation for sugar cane. We alsosupport the Roundtable for Sustainable Biomaterials and the International Sustainabilityand Carbon Certification scheme, both of which can be used for any feedstocks. We alsocontinue to work with industry, governments and voluntary organisations towards thedevelopment and adoption of internationally recognised sustainability standards forbiofuels.
Through our Raízen joint venture, we produce one of the lowest CO2 biofuels availabletoday. Raízen produces approximately 2 billion litres of ethanol from sugar caneannually. Brazilian sugar-cane ethanol can reduce CO2 emissions by around 70% whencompared with conventional gasoline, from cultivation of the sugar cane to using theethanol as fuel.
In 2015, Raízen opened its first advanced biofuels plant at the Costa Pinto mill in Brazil.The technology was first developed from our funding of the Iogen Energy venture,which was subsequently transferred to Raízen. In 2017, the plant produced 10 millionlitres of cellulosic ethanol from sugar-cane residues. It is expected to produce 40 millionlitres a year once fully operational.
Outside Brazil, we continue to invest in new ways of producing biofuels from sustainablefeedstocks, such as biofuels made from waste products or cellulosic biomass. In 2017, wecompleted construction of a demonstration plant at the Shell Technology CentreBangalore, India. Currently, this plant demonstrates a technology called IH2 that turnswaste into transport fuel but it is not producing on a commercial scale. We continue tolook for opportunities to invest in third-party technologies and to collaborate in scalingthese up for commercialisation. For example, in 2017, Shell signed an agreement withSBI Bioenergy in Canada for exclusive technology development and licensing rights of atechnology that turns waste oils into drop-in fuels (fuels that can be added toconventional fuels and do not require modifications of distribution infrastructure orengines).
PowerPower is the fastest-growing segment of the energy system. We expect that people andcompanies around the world will use more electricity to power transport and industry,instead of coal and oil, as part of the drive to lower carbon emissions. To help meet thisdemand, Shell aims to become an integrated power player and grow, over time, a materialnew business. We are working to deliver more electricity generated by renewable energy,from developing wind and solar projects to selling electricity generated by renewablesources. See “Integrated Gas” on pages 28-29. OUR STRATEGY ON CLIMATE CHANGEOur strategy to assess and manage risks and opportunities resulting from climate changeincludes consideration of different time horizons and specific:
■ societal risk: the potential for a deteriorating relationship with the public, othercompanies, and governments in countries where Shell operates;
■ commercial risk: the potential for structural shifts in demand profiles for industryproducts;
■ regulatory risk: the potential for strengthening of existing and introduction of newregulations; and
■ physical risk: the potential impact on our facilities and the communities in which weoperate due to changing physical conditions.
This is how we describe the different time horizons and the relevance for theidentification of risks and the business planning:
■ Short term (up to three years): detailed financial projections are developed and used tomanage performance and expectations on a three-year cycle. This three-year plan isshared with the Board;
■ Medium term (three years up to around 10 years): the majority of production andearnings expected to be generated in this period come from our existing assets; and
■ Long term (beyond around 10 years): for this period, the current Shell portfolio is notrepresentative of our performance or the potential risks, and questions emerging on thethematic structure of the portfolio guide decision making and risk identification.
Shell has a rigorous approach to understanding, managing and mitigating climate risks toits facilities. Shell also requires each business and function to monitor, communicate andreport changes in the risk environment and the effectiveness of actions taken to manageidentified risks on an ongoing basis. This is outlined in a toolkit for risk managementincluding our Risk Management Manual and complementary guidance documents thatcover specific aspects such as climate risk.
Each Shell business unit needs to consider the acceptability of climate-related risks in theirportfolios. To ensure that informed judgements are made, businesses´ senior managerspresent their current assessments of the likelihood of the climate-related risks discussedabove materialising and their potential impact, along with summaries of currentmitigation efforts under way within their business unit. Each risk is then categorised aseither acceptable or as needing improvement.
We aim to reduce the GHG intensity of our portfolio and we continue to work onimproving the energy efficiency of our existing operations. In addition, and as a betterway to inform and drive our investment choices and adapt our business over time, inNovember 2017 we announced our ambition to reduce the net carbon footprint of ourenergy products in step with society’s drive to reduce GHG emissions. We aim to cut ourand our customers’ GHG emissions from energy products that Shell sells – expressed ingrams of CO2 equivalent per megajoule consumed – by around half by 2050. As aninterim step, by 2035, and predicated on societal progress, we aim for a reduction ofaround 20% compared with 2017 levels. Our approach to reducing the net carbonfootprint covers emissions directly from Shell operations (including from the extraction,transportation and processing of raw materials, and transportation of products), thosegenerated by third parties who supply energy to us for production, and our customers’emissions from their consumption of our energy products. Also included are emissionsfrom elements of this life cycle not owned by Shell, such as oil and gas processed byShell but not produced by Shell, or from oil products and electricity marketed by Shellthat have not been processed or generated at a Shell facility. Excluded are our emissionsor our customers’ emissions from our chemicals and lubricants products, which are notused to produce energy.
Our long-term ambition for 2050 is a stretching aspiration that aims to ensure that Shellcontinues to develop a resilient and relevant portfolio over the coming decades. Whilethis is a long-term aspiration that will need periodic recalibration in line with the pace ofchange in broader society and the wider energy system, it is intended to help ensure thatwe remain relevant and is competitively positioned in the energy transition. This meanssupplying energy products and services that our customers need, now and in the future,and developing a resilient portfolio in line with our purpose of providing more andcleaner energy to society.
STRATEGIC REPORT SHELL ANNUAL REPORT AND FORM 20-F 2017 65

In the period to 2035, we believe that all forms of GHG reduction measures must beaccelerated and increased in scale. Major improvements in energy efficiency and newsources of energy, such as renewables, combined with the use of cleaner fossil fuels, suchas replacing coal with natural gas, are needed to meet the growing global population’senergy needs while reducing GHG emissions. In addition, the world will need significantgrowth in CCS and sustained reductions in demand. The management of GHG emissionswill become increasingly important to our shareholders as concerns over climate changelead to tighter environmental regulations. Policies and regulations designed to limit theincrease in global temperatures to well below 2°C could have a material adverse effect onShell – through higher operating costs and reduced demand for some of our products.We actively monitor and assess these potential threats and are best able to manage themwhen local policies provide a stable and predictable regulatory foundation for our futureinvestments. At this stage, industry is still facing significant uncertainty about how localregulatory policies and consumer behaviour will shape the evolution of the energy systemand which technologies and business models will thrive.
OUR PERFORMANCEData in this section are reported on a 100% basis in respect of activities where we are theoperator. Reporting on this operational control basis differs from that applied forfinancial reporting purposes in the “Consolidated Financial Statements” on pages 137-178. Detailed data and information on our 2017 environmental and social performancewill be published in the Shell Sustainability Report in April 2018.
Our direct GHG emissions increased from 70 million tonnes of CO2 equivalent in 2016 to73 million tonnes of CO2 equivalent in 2017. The main contributors to this increase werethe inclusion of the assets previously operated by the Motiva Enterprises LLC jointventure in the USA in our data from May 2017 and the return to production ofpreviously shut-down units at the Bukom site in Singapore. The level of flaring in ourUpstream and Integrated Gas businesses combined increased by slightly less than 10% in2017, compared with 2016. These increases were partly offset by divestments (forexample in Canada, Gabon, Malaysia and the UK) and reduced production at our Pearlgas-to-liquids (GTL) plant in Qatar.
In 2015, we signed up to the World Bank’s “Zero Routine Flaring by 2030” initiative.This is an important initiative to ensure that all stakeholders, including governments andcompanies, work together to address routine flaring. Flaring, or burning off, of gas in ourUpstream and Integrated Gas businesses contributed around 11% of our overall directGHG emissions in 2017. Almost half of this flaring took place at facilities where there wasno infrastructure to capture the gas produced with oil, known as associated gas.
Our involvement in Basrah Gas Company (BGC), a non-Shell-operated joint venturebetween Shell, South Gas Company and Mitsubishi Corporation in the south of Iraq,continues to reduce flaring in the country. It is the largest gas company in Iraq’s historyand the world’s largest flaring reduction project. BGC captures associated gas that wouldotherwise be flared from three non-Shell-operated oil fields in southern Iraq (Rumaila,West Qurna 1 and Zubair). The gathered gas is processed into dry gas, liquefiedpetroleum gas (LPG) and condensate. Dry gas is supplied to the gas network in southernIraq and then used to generate electricity. LPG and condensate are delivered to South GasCompany for distribution in the domestic market and excess production is exported. In2017, BGC processed an average of 676 million standard cubic feet of gas per day.
Almost a quarter of flaring in our Upstream and Integrated Gas facilities in 2017 tookplace in assets operated by The Shell Petroleum Development Company of NigeriaLimited (SPDC). Flaring from SPDC-operated facilities fell by more than 40% between2013 and 2017. However, flaring intensity levels in SPDC increased in 2017 comparedwith 2016, partly due to the restart of facilities that were offline for most of 2016. Severalnew gas-gathering projects came on stream at the end of 2017. However, the plannedstart-up dates for two gas-
gathering projects have historically been delayed due to lack of adequate joint venturefunding. Nevertheless, with funding now restored, the projects are planned forcompletion in 2018-19.
GHG emissions data are provided below in accordance with UK regulations. GHGemissions comprise CO2, methane, nitrous oxide, hydrofluorocarbons, perfluorocarbons,sulphur hexafluoride and nitrogen trifluoride. The data are calculated using locallyregulated methods where they exist. Where there is no locally regulated method, the dataare calculated using the 2009 API Compendium, which is the recognised industrystandard under the GHG Protocol Corporate Accounting and Reporting Standard. Thereare inherent limitations to the accuracy of such data. Oil and gas industry guidelines(IPIECA/API/IOGP) indicate that a number of sources of uncertainty can contribute to theoverall uncertainty of a corporate emissions inventory.
Greenhouse gas emissions 2017 2016
Emissions (million tonnes of CO2 equivalent) Direct [A] 73 70 Energy indirect [B] 12 11
Intensity ratios (tonne/tonne) All facilities [C][D] 0.25 0.23
[A] Emissions from the combustion of fuel and the operation of facilities, calculated using global warming potentials from theIPCC’s Fourth Assessment Report. [B] Emissions from the purchase of electricity, heat, steam and cooling for our own use using a market-based method asdefined by the GHG Protocol Corporate Accounting and Reporting Standard. [C] In tonnes of total direct and energy indirect GHG emissions per tonne of crude oil and feedstocks processed andpetrochemicals produced in Downstream manufacturing, oil and gas available for sale, LNG and GTL production inIntegrated Gas and Upstream. Additional information by segment will be published on www.shell.com/ghg.[D] In 2017, we updated our methodology for calculating the intensity ratio. The 2016 ratio has been recalculated to reflect thechange in scope. Detailed information on our 2017 GHG emissions will be published in the ShellSustainability Report in April 2018 and on www.shell.com/ghg.
The statements in this “Climate change and energy transition” section, including thoserelated to net carbon footprint, are forward-looking statements based on management’scurrent expectations and certain material assumptions and, accordingly, involve risks anduncertainties that could cause actual results, performance or events to differ materiallyfrom those expressed or implied herein. See “About this Report” on page 05 and “Riskfactors” on page 12-16.
STRATEGIC REPORT SHELL ANNUAL REPORT AND FORM 20-F 2017 66

Performing competitively in the evolving energy landscape requires competent andempowered people working safely together across Shell. We recruit, train andrecompense people according to a strategy that aims to organise our businesseseffectively; accelerate development of our people; grow and strengthen our leadershipcapabilities; and enhance employee performance through strong engagement. Our peopleare essential to the successful delivery of the Shell strategy and to sustaining businessperformance over the long term. EMPLOYEE OVERVIEWThe employee numbers presented here are the full-time employee equivalents of the totalnumber of people on full-time or part-time employment contracts with Shell subsidiaries,including our share of employees of Shell-operated joint operations. It excludesemployees working for Shell’s joint ventures and associates. At December 31, 2017, we employed 84,000 people, compared with 89,000 at December31, 2016, and 90,000 at December 31, 2015. The reduction in 2017 was driven byportfolio activities and our continued effort to improve operational efficiency and toreduce costs following the BG acquisition in 2016. These impacts were partly offset bythe insourcing of specific skill sets into the organisation (predominantly into our businessservice centres) and other external recruitment to build our talent pipeline. We continue toleverage and expand capabilities to ensure a sustainable talent pool. During 2017, we employed an average of 86,000 people, shown by geographical area inthe table below and by business segment in Note 26 to the “Consolidated FinancialStatements” on page 176.
Average number of employees by geographical area Thousand 2017 2016 2015
Europe 24 25 25 Asia 29 28 29 Oceania 2 2 1 Africa 3 4 3 North America 24 29 31 South America 4 4 4 Total 86 92 93 EMPLOYEE COMMUNICATION AND INVOLVEMENTWe strive to maintain a healthy employee and industrial relations environment in whichdialogue between management and employees – both directly and, where appropriate,through employee representative bodies – is embedded in our work practices. On aquarterly basis, management briefs employees on our operational and financial resultsthrough various channels, including team meetings, face-to-face gatherings, an emailfrom the Chief Executive Officer, webcasts and online publications. Strong employee engagement is especially significant in maintaining strong businessdelivery in times of great change. The Shell People Survey is one of the principal toolsused to measure employee engagement, which aims to reflect the degree of employeeaffiliation and commitment to Shell. It provides insights into employees’ views and hashad a consistently high response rate. In 2017, Shell used an improved survey tool with anew scoring methodology that showed average indices, instead of the percentages infavour shown by the previous tool. Our average employee engagement score remainedstable at 76 points out of 100 (2016: 79% under the previous methodology). We promote safe reporting of views about our processes and practices. In addition tolocal channels, the Shell Global Helpline enables employees to report potential breachesof the Shell General Business Principles and Shell Code of Conduct, confidentially andanonymously, in a variety of languages.
The Shell Global Helpline is managed by an independent third party, and all allegationsconcerning bribery or corruption are investigated. See “Corporate governance” on page77.
DIVERSITY AND INCLUSIONOur intention is to sustain a diverse workforce and an inclusive environment that respectsand shows care for all our people and helps improve our business performance. Ourdiversity and inclusion (D&I) approach focuses on talent acquisition, progression andretention, leadership visibility, inclusive culture and on differentiating our externalreputation. Our leaders aim to be role models for D&I and assume accountability forcontinuous progress. We believe that diverse teams led by inclusive leaders are moreengaged, and therefore deliver better safety and business performance. By embeddingD&I into our operations, we have a better understanding of the needs of our employeesas well as the needs of our varied customers, partners and stakeholders throughout theworld. It also allows us to benefit from a wider external talent pool for recruitmentpurposes.
We provide equal opportunity in recruitment, career development, promotion, trainingand rewards for all employees, including those with disabilities. In 2017, we beganimplementation of a workplace accessibility service at our major locations to ensure thatall employees have access to reasonable adjustments so that they can work effectively. Inaddition, we introduced a global minimum standard for maternity leave of 16 weeks.
Our focus on workplace inclusion also continues in other areas. For example, in 2017, wewere ranked in the top category in the Workplace Pride global lesbian, gay, bisexual,transgender and intersexed (LGBTI) inclusive workplace benchmark and earned a 100%score in the Human Rights Campaign Foundation’s Corporate Equality Index. Weactively monitor representation of women and local nationals in senior leadershippositions, and have talent-development processes to support us in mitigating any biasesand delivering more diverse representation.
At the end of 2017, the proportion of women in senior leadership positions was 22%compared with 20% at the end of 2016. “Senior leadership position” is a Shell measurebased on senior salary group levels and is distinct from the term “senior manager” in thestatutory disclosures set out below.
Gender diversity data (at December 31, 2017) Number Men Women
Directors of the Company 7 64% 4 36%Senior managers [A] 751 75% 252 25%Employees (thousand) 57 68% 27 32%[A] Senior manager is defined in section 414C(9) of the Companies Act 2006 and accordingly the number disclosed comprisesthe Executive Committee members who were not Directors of the Company, as well as other directors of Shell subsidiaries. The local national coverage is the number of senior local nationals (both those working intheir respective base country and those expatriated) as a percentage of the number ofsenior leadership positions in their base country.
Local national coverage (at December 31) Number of selected key business countries 2017 2016 2015
Greater than 80% 10 10 12 Less than 80% 10 10 8 Total 20 20 20 CODE OF CONDUCTIn line with the UN Global Compact Principle 10 (Businesses should work againstcorruption in all its forms, including extortion and bribery), we maintain a global AntiBribery and Corruption (ABC) programme designed to prevent or detect, and remediateand learn from, potential violations. The programme is
Our people
STRATEGIC REPORT SHELL ANNUAL REPORT AND FORM 20-F 2017 67

underpinned by our anti-bribery commitment, a fundamental component of the ShellGeneral Business Principles and Code of Conduct. We do not tolerate the direct or indirect offer, payment, solicitation or acceptance ofbribes in any form. Facilitation payments are also prohibited. The Shell Code of Conductincludes specific guidance for Shell staff (which comprises employees and contract staff)on requirements to avoid or declare actual, potential or perceived conflicts of interest, andon offering or accepting gifts and hospitality. Communications from leaders emphasise both the importance of these commitments andcompliance with requirements. These are reinforced with both global and targetedcommunications, to ensure that Shell staff are frequently reminded of their obligations. Supporting the Code of Conduct, we have mandatory anti-bribery procedures andcontrols applicable to all Shell staff. The risk-based procedures and controls address arange of corruption-related risks and ensure we focus resources and attentionappropriately. By making a commitment to our core values – honesty, integrity andrespect – and following the Code of Conduct, we protect Shell’s reputation. As part of our commitment to ethics and compliance, we ensure that our anti-corruptionpolicies, standards and procedures are communicated to all Shell staff and, wherenecessary and appropriate, to agents and business partners. Particular areas of focus withthird parties include continued strengthening of our due diligence procedures, and clearlyarticulated requirements (for example, through the use of standard contract clauses). The Shell Ethics and Compliance Office assists the businesses and functions with the ABCprogramme implementation, and monitors and reports on progress. Legal counselprovides legal advice globally and supports the programme’s implementation. The ShellEthics and Compliance Office regularly reviews and revises the programme to ensure itremains up-to-date with applicable laws, regulations and best practices. This includesincorporating results from relevant internal audits, reviews and investigations. We have a duty to investigate all good faith allegations of breaches of or questions aboutthe Code of Conduct, however they are raised. We are committed to ensuring all suchincidents are investigated fairly by our Business Integrity Department. Violations of theCode of Conduct and/or its policies can result in disciplinary action, up to and includingdismissal. In some cases, we may report a violation to the relevant authorities, whichcould lead to legal action, fines or imprisonment. Internal investigations confirmed 261 substantiated breaches of the Code of Conductallegations in 2017. As a result, we dismissed or terminated the contracts of 73 employeesand contract staff. EMPLOYEE SHARE PLANSWe have a number of share plans designed to align employees’ interests with ourperformance through share ownership. For information on the share-based compensationplans for Executive Directors, see the “Directors’ Remuneration Report” on pages 94-117. PERFORMANCE SHARE PLAN, LONG-TERM INCENTIVE PLAN ANDEXCHANGED AWARDS UNDER THE BG LONG-TERM INCENTIVE PLANConditional awards of the Company’s shares are made under the terms of thePerformance Share Plan (PSP) to around 17,000 employees each year. Senior executivesreceive conditional awards of the Company’s shares under the terms of the Long-termIncentive Plan (LTIP) rather than under the terms of the PSP. The extent to which theawards vest under both plans is determined over a three-year performance period, but theperformance conditions applicable to each plan are different. Under the PSP, 50% of theaward is linked to certain of the indicators described in “Performance indicators” onpages 22-23, averaged over the period. From 2017 onwards, 12.5% of the award islinked to free
cash flow (FCF) and the remaining 37.5% is linked to a comparative performancecondition which involves a comparison with four of our main competitors over theperiod, based on three measures. Under the LTIP, from 2017, 25% of the award is linkedto the FCF measure and the remaining 75% is linked to the comparative performancecondition mentioned above. Prior to 2017, 50% of the PSP award and all of the LTIPaward were linked to a comparative performance condition based on four measures.
Separately, following the BG acquisition, certain employee share awards made in 2015under BG’s Long-Term Incentive Plan were automatically exchanged for equivalentawards over shares in the Company. These awards either do not have performanceconditions or have the same performance conditions applied as the Company’s LTIP.Awards take the form of either conditional awards or nil cost options. Under all plans, all shares that vest are increased by an amount equal to the notionaldividends accrued on those shares during the period from the award date to the vestingdate. In certain circumstances, awards may be adjusted before delivery or reclaimed afterdelivery. None of the awards results in beneficial ownership until the shares vest. See Note 21 to the “Consolidated Financial Statements” on pages 172-173. RESTRICTED SHARE PLANUnder the Restricted Share Plan, awards are made on a highly selective basis to seniorstaff. Shares are awarded subject to a three-year retention period. All shares that vest areincreased by an amount equal to the notional dividends accrued on those shares duringthe period from the award date to the vesting date. In certain circumstances, awards maybe adjusted before delivery or reclaimed after delivery. GLOBAL EMPLOYEE SHARE PURCHASE PLANEligible employees in participating countries may participate in the Global EmployeeShare Purchase Plan. This plan enables them to make contributions from net pay towardsthe purchase of the Company’s shares at a 15% discount to the market price, either at thestart or at the end of an annual cycle, whichever date offers the lower market price. UK SHELL ALL EMPLOYEE SHARE OWNERSHIP PLANEligible employees of participating Shell companies in the UK may participate in theShell All Employee Share Ownership Plan, under which monthly contributions fromgross pay are made towards the purchase of the Company’s shares. UK SHARESAVE SCHEMEEligible employees of participating Shell companies in the UK have been able toparticipate in the UK Sharesave Scheme. Options have been granted over the Company’sshares at market value on the invitation date. These options are normally exercisable aftercompletion of a three-year or five-year contractual savings period. No further grants willbe made under this plan. Separately, following the acquisition of BG, certain participants in the BG SharesaveScheme chose to roll over their outstanding BG share options into options over theCompany’s shares. The BG option price (at a discount of 20% to market value) wasconverted to an equivalent Company option price at a ratio agreed with Her Majesty’sRevenue and Customs. These options are normally exercisable after completion of athree-year contractual savings period. Strategic Report signed on behalf of the Board /s/ Linda M. Szymanski Linda M. SzymanskiCompany SecretaryMarch 14, 2018
STRATEGIC REPORT SHELL ANNUAL REPORT AND FORM 20-F 2017 68

CHARLES O. HOLLIDAYChairBorn March 9, 1948. A US national, appointed Chair of the Company with effect fromMay 2015, having previously served as a Non-executive Director since September 2010. He was Chief Executive Officer of DuPont from 1998 to 2009, and Chairman from 1999to 2009. He joined DuPont in 1970 after receiving a B.S. in industrial engineering fromthe University of Tennessee and held various manufacturing and business assignments,including a six-year, Tokyo-based posting as President of DuPont Asia/Pacific. He haspreviously served as Chairman of the Bank of America Corporation, The BusinessCouncil, Catalyst, the National Academy of Engineering, the Society of ChemicalIndustry - American Section and the World Business Council for SustainableDevelopment. He is a founding member of the International Business Council. He is a Director of HCA Holdings, Inc. [A] and Deere & Company and is a member ofthe Critical Resource’s Senior Advisory Panel and the Royal Academy of Engineering. Chair of the Nomination and Succession Committee[A] On February 22, 2018, the Board of HCA Holdings, Inc. approved the appointment of Charles O. Holliday as PresidingDirector with effect from April 26, 2018. HANS WIJERS [A]Deputy Chair and Senior Independent DirectorBorn January 11, 1951. A Dutch national, appointed a Non-executive Director of theCompany with effect from January 2009. He was Chief Executive Officer and Chairman of the Board of Management ofAkzoNobel N.V. from 2003 to 2012, having become a Board member in 2002. From1999 to 2002, he was Senior Partner at The Boston Consulting Group. He was Minister ofEconomic Affairs of the Netherlands from 1994 to 1998, and was previously ManagingPartner of The Boston Consulting Group. He obtained a PhD in economics from ErasmusUniversity Rotterdam while teaching there. From 2012 to 2016 he was Chairman of theSupervisory Board of AFC Ajax N.V. and from 2013 to 2016 he was a Non-executiveDirector of GlaxoSmithKline plc. He is Chairman of the Supervisory Board of Heineken N.V., a member of theSupervisory Board of HAL Holding N.V. and ING Group N.V., and a trustee of variouscharities. Chair of the Corporate and Social Responsibility Committee and member of theNomination and Succession Committee[A] Hans Wijers stands down as a Director of the Company at the close of business of the 2018 Annual General Meeting to beheld on May 22, 2018.
BEN VAN BEURDENChief Executive OfficerBorn April 23, 1958. A Dutch national, appointed Chief Executive Officer of theCompany with effect from January 2014. He was Downstream Director from January to September 2013. Before that, he wasExecutive Vice President Chemicals from 2006 to 2012. In this period, he also served onthe boards of a number of leading industry associations, including the InternationalCouncil of Chemicals Associations and the European Chemical Industry Council. Prior tothis, he held a number of operational and commercial roles in both Upstream andDownstream, including Vice President Manufacturing Excellence. He joined Shell in1983, after graduating with a Master’s Degree in Chemical Engineering from DelftUniversity of Technology, the Netherlands.
JESSICA UHLChief Financial OfficerBorn January 29, 1968. A US national, appointed Chief Financial Officer of theCompany with effect from March 9, 2017. She was Executive Vice President Finance for the Integrated Gas business from January2016 to March 2017. Previously, she was Executive Vice President Finance for UpstreamAmericas from 2014 to 2015, Vice President Finance for Upstream AmericasUnconventionals from 2013 to 2014, Vice President Controller for Upstream and Projects& Technology from 2010 to 2012, Vice President Finance for the global Lubricantsbusiness from 2009 to 2010, and Head of External Reporting from 2007 to 2009. Shejoined Shell in 2004 in finance and business development, supporting the Renewablesbusiness. Prior to joining Shell, she worked for Enron in the USA and Panama from 1997to 2003 and for Citibank in San Francisco, USA, from 1990 to 1996. She obtained anMBA at INSEAD in 1997. EULEEN GOHNon-executive DirectorBorn April 20, 1955. A Singaporean national, appointed a Non-executive Director of theCompany with effect from September 2014. She is a chartered accountant and also has professional qualifications in banking andtaxation. She held various senior management positions with Standard Chartered Bankand was Chief Executive Officer of Standard Chartered Bank, Singapore, from 2001 until2006. She has also held non-executive appointments on various boards including Aviva plc,MediaCorp Pte Limited, Singapore Airlines Limited, Singapore Exchange Limited,Standard Chartered Bank Malaysia Berhad and Standard Chartered Bank Thai pcl. Shewas previously Non-executive Chairman of the Singapore International Foundation andChairman of International Enterprise Singapore and the Accounting Standards Council,Singapore. She is Chairman of SATS Limited, a Non-executive Director of CapitaLand Limited, DBSBank Limited and DBS Group Holdings Limited, and a Trustee of the Singapore Instituteof International Affairs Endowment Fund and the Temasek Trust. She is also a memberof the Governing Council of the Singapore Institute of Management and a Non-executiveDirector of Singapore Health Services Pte Limited, both not-for-profit organisations. Chair of the Audit Committee
GovernanceThe Board of Royal Dutch Shell plc
GOVERNANCE SHELL ANNUAL REPORT AND FORM 20-F 2017 69
CATHERINE J. HUGHES Non-executive DirectorBorn September 13, 1962. A Canadian and French dual national, appointed a Non-executive Director of the Company with effect from June 1, 2017. She was Executive Vice President International at Nexen Inc. from January 2012 until herretirement in April 2013, where she was responsible for all oil and gas activities includingexploration, production, development and project activities outside Canada. She joinedNexen in 2009 as Vice President Operational Services, Technology and HumanResources. Prior to joining Nexen Inc. she was Vice President Oil Sands at Husky Oil from 2007 to2009 and Vice President Exploration & Production Services, from 2005 to 2007. Shestarted her career with Schlumberger in 1986 and held key positions in various countries,including Italy, Nigeria, the UK, the USA and France, and was President of SchlumbergerCanada Limited for five years, based in Calgary. She was a Non-executive Director ofStatoil from 2013 to 2015. She is a Non-executive Director of Precision Drilling Corp. and SNC-Lavalin Group Inc. Member of the Corporate and Social Responsibility Committee and member of theRemuneration Committee GERARD KLEISTERLEE [A]Non-executive DirectorBorn September 28, 1946. A Dutch national, appointed a Non-executive Director of theCompany with effect from November 2010. He was President/Chief Executive Officer and Chairman of the Board of Management ofKoninklijke Philips N.V. from 2001 to 2011. Having joined Philips in 1974, he heldseveral positions before being appointed as Chief Executive Officer of Philips’Components division in 1999 and Executive Vice-President of Philips in 2000. From2010 to 2013, he was a member of the board of Directors of Dell Inc., from 2009 to2014 he was a member of the Supervisory Board of Daimler AG, and from 2014 to 2016he was a Non-executive Director of IBEX Global Solutions plc. He is Chairman of Vodafone Group plc and Chairman of the Supervisory Board ofASML Holding N.V. Chair of the Remuneration Committee[A] On March 14, 2018, the Board appointed Gerard Kleisterlee as Deputy Chair and Senior Independent Director andmember of the Nomination and Succession Committee with effect from May 23, 2018.
ROBERTO SETUBALNon-executive DirectorBorn October 13, 1954. A Brazilian national, appointed a Non-executive Director of theCompany with effect from October 1, 2017. He was Chief Executive Officer and Vice Chairman of the Board of Directors of ItaúUnibanco Holding S.A. in Sao Paulo, Brazil, until April 2017. At that time, he retired asChief Executive Officer and currently serves as Co-Chairman of the Board of Directors.Following a brief period with Citibank in New York, he joined Banco Itaú in 1984 wherehe held a variety of senior roles in individual banking, consumer credit operations andretail banking before being appointed Chief Executive Officer in 1994. Following themerger of Banco Itaú and Unibanco, he was appointed to the position of President andChief Executive Officer of Itaú Unibanco Holding S.A. He is a member of the board of the International Monetary Conference (IMC), the boardof the Institute of International Finance (IIF), the International Advisory Committee ofthe Federal Reserve Bank of New York, the Economic and Social Development Councilof the Presidency of Brazil, and the International Business Council of the WorldEconomic Forum. Previously, he was a Non-executive Director of Petrobras S.A,President of the IMC, and Vice-Chairman of the IIF. He is also the President of the Fundação Itaú Social and a member of the ExecutiveCommittee of the Instituto Itaú Cultural.
Member of the Audit Committee SIR NIGEL SHEINWALD GCMG [A]Non-executive DirectorBorn June 26, 1953. A British national, appointed a Non-executive Director of theCompany with effect from July 2012. He was a senior British diplomat who served as British Ambassador to the USA from2007 to 2012, before retiring from the Diplomatic Service. Prior to this, he served asForeign Policy and Defence Adviser to the Prime Minister and Head of the Cabinet OfficeDefence and Overseas Secretariat. He served as British Ambassador and PermanentRepresentative to the European Union in Brussels from 2000 to 2003. He joined theDiplomatic Service in 1976 and served in Brussels, Washington, Moscow and in a widerange of policy roles in London. He is a Non-executive Director of Invesco Limited and Raytheon UK, a Senior Adviser tothe Universal Music Group and a Visiting Professor and Council Member of King’sCollege, London. Member of the Corporate and Social Responsibility Committee and member of theRemuneration Committee[A] On March 14, 2018, the Board appointed Sir Nigel Sheinwald as Chair of the Corporate and Social ResponsibilityCommittee with effect from May 23, 2018.
GOVERNANCE SHELL ANNUAL REPORT AND FORM 20-F 2017 70

LINDA G. STUNTZ [A]Non-executive DirectorBorn September 11, 1954. A US national, appointed a Non-executive Director of theCompany with effect from June 2011. She is a founding partner of the law firm of Stuntz, Davis & Staffier, P.C., based inWashington, DC. Her law practice includes energy and environmental regulation, as wellas matters relating to government support of technology development and transfer. Shewas a member of the US Secretary of Energy Advisory Board from 2015 to January2017, she chaired the Electricity Advisory Committee to the US Department of Energyfrom 2008 to 2009, and was a member of the board of Directors of SchlumbergerLimited from 1993 to 2010 and Raytheon Company from 2004 to 2015. From 1989 to1993, she held senior policy positions at the US Department of Energy, including DeputySecretary. She played a principal role in the development and enactment of the EnergyPolicy Act of 1992. From 1981 to 1987, she was an Associate Minority Counsel andMinority Counsel to the Energy and Commerce Committee of the US House ofRepresentatives. She is a Director of Edison International. Member of the Audit Committee and member of the Nomination and SuccessionCommittee[A] On March 14, 2018, the Board appointed Linda G. Stuntz as member of the Corporate and Social Responsibility Committeewith effect from May 23, 2018. She will stand down as a member of the Audit Committee on May 22, 2018. GERRIT ZALM [A]Non-executive DirectorBorn May 6, 1952. A Dutch national, appointed a Non-executive Director of theCompany with effect from January 2013. He was an adviser to PricewaterhouseCoopers during 2007, Chairman of the trustees ofthe International Accounting Standards Board from 2007 to 2010, an adviser to Permirafrom 2007 to 2008, Chief Economist from July 2007 to January 2008, and ChiefFinancial Officer from January 2008 to December 2008 of DSB Bank, and Chairman ofthe Managing Board of ABN AMRO Bank N.V. from 2010 to 2016. He was Minister ofFinance of the Netherlands twice, from 1994 to 2002 and from 2003 to 2007. Inbetween, he was Chairman of the parliamentary party of the VVD. Prior to 1994, he washead of the Netherlands Bureau for Economic Policy Analysis, a professor at VrijeUniversiteit Amsterdam and held various positions at the Ministry of Finance and theMinistry of Economic Affairs. He studied General Economics at Vrije UniversiteitAmsterdam and received an Honorary Doctorate in Economics from that university. Member of the Audit Committee and member of the Remuneration Committee[A] On February 16, 2018, Moody’s Corporation announced that Gerrit Zalm will be nominated for election as a Director at itsannual meeting of stockholders to be held in April 2018. LINDA M. SZYMANSKICompany SecretaryBorn April 7, 1967. A US national, appointed General Counsel Corporate with effectfrom August 2016 and Company Secretary with effect from January 1, 2017. Previously, she was General Counsel of the Upstream Americas business and Head ofLegal US based in the USA from 2014 to 2016, and was Group Chief Ethics &Compliance Officer based in the Netherlands from 2011 to 2014. She joined Shell in1995 and has held a variety of legal positions within Shell Oil Company in the USA,including Chemicals Legal Managing Counsel and other senior roles in employment,litigation, and commercial practice. BOARD COMMITTEE MEMBERSHIPOn March 14, 2018, the Board approved a number of changes to the membership of theBoard committees. These changes are set out in footnotes for the respective Directors.
GOVERNANCE SHELL ANNUAL REPORT AND FORM 20-F 2017 71

The Senior Management of the Company comprises the Executive Directors and thoselisted below. All are members of the Executive Committee (see “Corporate governance”on page 80). JOHN ABBOTTDownstream DirectorBorn March 24, 1960. A British national, appointed Downstream Director with effectfrom October 2013. Previously, he was Executive Vice President Manufacturing,responsible for oil refineries and petrochemicals plants worldwide. He joined Shell in1981, and has held various management positions in refining, chemicals and upstreamheavy oil, working in Canada, the Netherlands, Singapore, Thailand, the UK and theUSA. HARRY BREKELMANSProjects & Technology DirectorBorn June 11, 1965. A Dutch national, appointed Projects & Technology Director witheffect from October 2014. Previously, he was Executive Vice President for UpstreamInternational Operated based in the Netherlands. He joined Shell in 1990 and has heldvarious management positions in Exploration and Production, Internal Audit, and GroupStrategy and Planning. From 2011 to 2013, he was Country Chair – Russia and ExecutiveVice President for Russia and the Caspian region. ANDREW BROWNUpstream DirectorBorn January 29, 1962. A British national, appointed Upstream Director with effect fromJanuary 2016, having served on the Executive Committee as Upstream InternationalDirector from 2012. Previously, he was Executive Vice President for Shell’s activities inQatar and a member of the Upstream International Leadership Team. He was awarded theOrder of the British Empire in 2012 for his services to British-Qatari business relations. RONAN CASSIDYChief Human Resources & Corporate OfficerBorn February 10, 1967. A British national, appointed Chief Human Resources &Corporate Officer with effect from January 2016. Previously, he was Executive VicePresident Human Resources, Upstream International. He joined Shell in 1988 and hasheld various human resources positions in Upstream and Downstream. DONNY CHINGLegal DirectorBorn February 14, 1964. A Malaysian national, appointed Legal Director with effectfrom February 2014. Previously, he was General Counsel for Projects & Technologybased in the Netherlands. He joined Shell in 1988 based in Australia and then moved toHong Kong and later to London. In 2008, he was appointed Head of Legal at ShellSingapore, having served as Associate General Counsel for Gas & Power in Asia-Pacific. MAARTEN WETSELAARIntegrated Gas and New Energies DirectorBorn December 30, 1968. A Dutch national, appointed Integrated Gas Director witheffect from January 2016. Previously, he was Executive Vice President of Integrated Gasbased in Singapore. He joined Shell in 1995 and has held various financial, commercialand general management roles in Downstream, Trading and Upstream.
Senior Management
GOVERNANCE SHELL ANNUAL REPORT AND FORM 20-F 2017 72
MANAGEMENT REPORTThis Directors’ Report, together with the “Strategic Report” on pages 06-68, serves as theManagement Report for the purpose of Disclosure Guidance and TransparencyRule 4.1.8R. FINANCIAL STATEMENTS AND DIVIDENDSThe “Consolidated Statement of Income” and “Consolidated Balance Sheet” can be foundon pages 138 and 139 respectively. The table below sets out the dividends on each class of share and each class of AmericanDepositary Share (ADS [A]). The Company announces its dividends in dollars and, at alater date, announces the euro and sterling equivalent amounts using a market exchangerate. Dividends on Royal Dutch Shell plc A shares (A shares) are paid by default in euros,although holders may elect to receive dividends in sterling. Dividends on Royal DutchShell plc B shares (B shares) are paid by default in sterling, although holders may elect toreceive dividends in euros. Dividends on ADSs are paid in dollars.[A] ADSs are listed on the New York Stock Exchange under the symbols RDS.A and RDS.B. Each ADS represents two shares– two A shares in the case of RDS.A or two B shares in the case of RDS.B. The Company operated a Scrip Dividend Programme until the third quarter of 2017,which enabled shareholders to increase their shareholding by choosing to receive newshares instead of cash dividends (if approved by the Board). Only new A shares wereissued under the programme, including to shareholders who hold B shares. Moreinformation can be found at www.shell.com/scrip. The Directors have announced a fourth-quarter interim dividend as set out in the tablebelow, payable on March 26, 2018, to shareholders on the Register of Members at closeof business on February 16, 2018. The closing date for dividend currency elections wasMarch 2, 2018 [A] and the euro and sterling equivalents announcement date wasMarch 9, 2018.[A] A different dividend currency election date may apply to shareholders holding shares in a securities account with a bankor financial institution ultimately through Euroclear Nederland. This may also apply to other shareholders who do not hold theirshares either directly on the Register of Members or in the corporate sponsored nominee arrangement. Such shareholders cancontact their broker, financial intermediary, bank or financial institution for the election deadline that applies.
DIRECTORS’ RESPONSIBILITIES IN RESPECT OF THE PREPARATIONOF THE ANNUAL REPORT AND ACCOUNTSThe Directors are responsible for preparing the Annual Report, including the financialstatements, in accordance with applicable laws and regulations. Company law requires theDirectors to prepare financial statements for each financial year. Under that law, theDirectors have prepared the Consolidated and Parent Company Financial Statements inaccordance with International Financial Reporting Standards (IFRS) as adopted by theEuropean Union (EU). In preparing these financial statements, the Directors have alsoelected to comply with IFRS as issued by the International Accounting Standards Board(IASB). Under company law, the Directors must not approve the financial statementsunless they are satisfied that they give a true and fair view of the state of affairs of Shelland the Company and of the profit or loss of Shell and the Company for that period. Inpreparing these financial statements, the Directors are required to: ■ adopt the going concern basis unless it is inappropriate to do so;■ select suitable accounting policies and then apply them consistently;■ make judgements and accounting estimates that are reasonable and prudent; and■ state whether IFRS as adopted by the EU and IFRS as issued by the IASB have been
followed. The Directors are responsible for keeping adequate accounting records that are sufficientto show and explain the transactions of Shell and the Company and disclose withreasonable accuracy, at any time, the financial position of Shell and the Company and toenable them to ensure that the financial statements comply with the Companies Act 2006(the Act) and, as regards the Consolidated Financial Statements, with Article 4 of the IASRegulation and therefore are in accordance with IFRS as adopted by the EU. TheDirectors are also responsible for safeguarding the assets of Shell and the Company andhence for taking reasonable steps for the prevention and detection of fraud and otherirregularities. Each of the Directors, whose names and functions can be found on pages 69-71,confirms that, to the best of their knowledge: ■ the financial statements, which have been prepared in accordance with IFRS as adopted
by the EU and with IFRS as issued by the IASB give a true and fair view of the assets,liabilities, financial position and profit of Shell and the Company; and
■ the Management Report includes a fair review of the development and performance ofthe business and the position of Shell, together with a description of the principal risksand uncertainties that it faces.
Furthermore, so far as each of the Directors is aware, there is no relevant auditinformation of which the auditors are unaware, and each of the Directors has taken all thesteps that ought to have been taken in order to become aware of any relevant auditinformation and to establish that the auditors are aware of that information.
Directors’ Report
Dividends 2017 A shares B shares[A] A ADSs B ADSs $ € pence $ pence € $ $
Q1 0.47 0.4194 37.12 0.47 37.12 0.4194 0.94 0.94Q2 0.47 0.3949 36.28 0.47 36.28 0.3949 0.94 0.94Q3 0.47 0.3985 35.02 0.47 35.02 0.3985 0.94 0.94Q4 0.47 0.3818 33.91 0.47 33.91 0.3818 0.94 0.94Total announced in respect of the year 1.88 1.5946 142.33 1.88 142.33 1.5946 3.76 3.76Amount paid during the year 1.6548 147.06 147.06 1.6548 3.76 3.76[A] It is expected that holders of B shares will receive dividends through the dividend access mechanism applicable to such shares. The dividend access mechanism is described more fully on page 205.
GOVERNANCE SHELL ANNUAL REPORT AND FORM 20-F 2017 73

The Directors consider that the Annual Report, including the financial statements, taken asa whole, is fair, balanced and understandable and provides the information necessary forshareholders to assess Shell’s position and performance, business model and strategy. The Directors consider it appropriate to continue to adopt the going concern basis ofaccounting in preparing the financial statements. The Directors are responsible for the maintenance and integrity of the Shell website(www.shell.com). Legislation in the UK governing the preparation and dissemination offinancial statements may differ from legislation in other jurisdictions. VIABILITY STATEMENTThe “Strategic Report” includes information about Shell’s strategy, financial condition,cash flows and liquidity, as well as the factors, including the principal risks, likely toaffect Shell’s future development. The Directors assess Shell’s prospects both at anoperating and strategic level, each involving different time horizons. On an annual basisthe Directors approve a detailed three-year operating plan, which forecasts Shell’s cashflows and ability to service financing requirements, pay dividends and fund investingactivities during the period, having taken into consideration upward and downwardsensitivities. This period is considered appropriate for operating purposes because itallows for credible detailed forecasts. The Directors also receive regular updates onShell’s funding position and consider significant investment, divestment and financingproposals. At least biannually, the Directors discuss changes to Shell’s principal risks andassess the potential impact and any related mitigations. Taking account of Shell’s position and principal risks at December 31, 2017, theDirectors have a reasonable expectation that Shell will be able to continue in operationand meet its liabilities as they fall due over its three-year operating plan period. Annually,the Directors also review Shell’s strategic plan which takes account of longer-termforecasts including external environment factors and Shell’s business portfoliodevelopments and endorse any updates required. “Business overview” on page 10describes Shell’s business model, including competitive advantages and key strengths,and its sustainability and resilience. This aims to describe Shell’s long-term viability andability to meet longer-term commitments such as debt and contractual obligations whichcan extend over several decades. The Directors continually assess Shell’s portfolio andstrategy against a wide range of outlooks, including assessing the potential impacts ofvarious possible energy transition pathways and scenarios for changes in societalexpectations in relation to climate change. Shell recognises in its strategy that the world istransitioning to a lower-carbon energy system (see “Climate change and energytransition” on pages 62-66). REPURCHASES OF SHARESAt the 2017 Annual General Meeting (AGM), shareholders granted an authority, whichexpires at the end of the 2018 AGM, for the Company to repurchase up to a maximum of817 million of its shares (excluding purchases for employee share plans). While no sharerepurchases for cancellation were made during 2017, the Board continues to regard theability to repurchase issued shares in suitable circumstances as an important part of Shell’sfinancial management. A resolution will be proposed at the 2018 AGM to renew theauthority for the Company to purchase its own share capital, up to specified limits, for afurther year. This proposal will be described in more detail in the Notice of AnnualGeneral Meeting. BOARD OF DIRECTORSThe Directors during the year were Ben van Beurden, Guy Elliott (who stood down onOctober 18, 2017), Euleen Goh, Simon Henry (who stood down on March 9, 2017),Charles O. Holliday, Catherine J. Hughes (appointed with effect from June 1, 2017),Gerard Kleisterlee, Roberto Setubal (appointed with effect from October 1, 2017), SirNigel Sheinwald, Linda G. Stuntz, Jessica
Uhl (appointed with effect from March 9, 2017), Hans Wijers, Patricia A. Woertz (whostood down on May 23, 2017) and Gerrit Zalm [A].[A] At its meeting in July 2017, the Board authorised a matter declared by Gerrit Zalm, namely his temporary appointment bythe Dutch Second Chamber of Parliament to investigate the political support for a coalition government. The matter wasauthorised subject to certain conditions Gerrit Zalm requested during the term of the appointment, including that he did notparticipate in the making of decisions related to the Company (whether at meetings of the Directors or otherwise) and that hebe excluded from the receipt of information he would otherwise receive in his role as a Director of the Company. Suchconditions were revoked in October 2017 after the conclusion of his temporary appointment subject to certain furtherconditions designed to avoid any future actual or perceived conflicts of interest. RETIREMENT, REAPPOINTMENT AND APPOINTMENT OF DIRECTORSIn line with the UK Corporate Governance Code (Code), all Directors will retire at the2018 AGM and seek reappointment by shareholders, except for Hans Wijers who willstand down as a Director of the Company at the close of business of the AGM on May 22,2018. Shareholders will also be asked to vote on the appointment of Ann Godbehere witheffect from May 23, 2018. The biographies of all current Directors are given on pages 69-71 and biographies forthose seeking appointment or reappointment will also be included in the Notice of AnnualGeneral Meeting. Details of the Executive Directors’ contracts can be found on pages115-116 and copies are available for inspection from the Company Secretary.Furthermore, a copy of the form of these contracts has been filed with the US Securitiesand Exchange Commission as an exhibit. The terms and conditions of appointment of Non-executive Directors are set out in theirletters of appointment with the Company which, in accordance with the Code, areavailable for inspection from the Company Secretary. No Director is, or was, materially interested in any contract subsisting during or at the endof the year that was significant in relation to the Company’s business. See also “Relatedparty transactions” below. DIRECTORS’ INTERESTSThe interests (in shares of the Company or calculated equivalents) of the Directors inoffice at the end of the year, including any interests of a “connected person” [A], can befound in the “Directors’ Remuneration Report” on pages 104-105.[A] “Connected person” has the meaning given to “person closely associated” within the Market Abuse Regulation.
Changes in Directors’ share interests during the period from December 31, 2017, toMarch 14, 2018, can be found in the “Directors’ Remuneration Report” on page 105. QUALIFYING THIRD-PARTY INDEMNITIESThe Company has entered into a deed of indemnity with each Director who served duringthe year under identical terms. The deeds indemnify the Directors to the widest extentpermitted by the applicable laws of England against all liability incurred as a Director oremployee of the Company or of certain other entities. RELATED PARTY TRANSACTIONSOther than disclosures given in Notes 9 and 27 to the “Consolidated Financial Statements”on pages 155 and 177 respectively, there were no transactions or proposed transactionsthat were material to either the Company or any related party. Nor were there anytransactions with any related party that were unusual in their nature or conditions.
GOVERNANCE SHELL ANNUAL REPORT AND FORM 20-F 2017 74

POLITICAL CONTRIBUTIONSNo donations were made by the Company or any of its subsidiaries to political parties ororganisations during the year. Shell Oil Company administers the non-partisan Shell OilCompany Employees’ Political Awareness Committee (SEPAC), a political actioncommittee registered with the US Federal Election Commission. Eligible employees maymake voluntary personal contributions to the SEPAC. RECENT DEVELOPMENTS AND POST-BALANCE SHEET EVENTSThere are no material recent developments or post-balance sheet events to report. LIKELY FUTURE DEVELOPMENTSInformation relating to likely future developments can be found in the “Strategic Report”on pages 06-68. RESEARCH AND DEVELOPMENTInformation relating to Shell’s research and development, including expenditure, can befound in “Business overview” on page 11. DIVERSITY AND INCLUSIONInformation concerning diversity and inclusion can be found in “Our people” onpage 67. EMPLOYEE COMMUNICATION AND INVOLVEMENTInformation concerning employee communication and involvement can be found in“Our people” on page 67. CORPORATE SOCIAL RESPONSIBILITYA summary of Shell’s approach to corporate social responsibility can be found in“Environment and society” on pages 58-61 and “Our people” on pages 67-68. Furtherdetails will be available in the Shell Sustainability Report 2017. GREENHOUSE GAS EMISSIONSInformation relating to greenhouse gas emissions can be found in “Climate change andenergy transition” on pages 62-66. FINANCIAL RISK MANAGEMENT, OBJECTIVES AND POLICIESDescriptions of the use of financial instruments and Shell’s financial risk managementobjectives and policies, and exposure to market risk (including price risk), credit risk andliquidity risk can be found in Note 19 to the “Consolidated Financial Statements” onpages 167-172. SHARE CAPITALThe Company’s issued share capital on December 31, 2017, is set out in Note 8 to the“Parent Company Financial Statements” on pages 204-205. The percentage of the totalissued share capital represented by each class of share is given below.
Share capital percentage % Share class A ordinary 55.10 B ordinary 44.90 Sterling deferred de minimis
TRANSFER OF SECURITIESThere are no significant restrictions on the transfer of securities. SHARE OWNERSHIP TRUSTS AND TRUST-LIKE ENTITIESShell has three primary employee share ownership trusts and trust-like entities: a Dutchfoundation (stichting) and two US Rabbi Trusts. The shares held by the Dutch foundationare voted by its Board and the shares in the US Rabbi Trusts are voted by the VotingTrustee, Newport Trust Company. Both the Board of the Dutch foundation and theVoting Trustee are independent of Shell. The UK Shell All Employee Share Ownership Plan has a separate related share ownershiptrust. Shares held by the trust are voted by its trustee, Computershare Trustees Limited, asdirected by the participants.
SIGNIFICANT SHAREHOLDINGSInformation concerning significant shareholdings can be found on page 218. ARTICLES OF ASSOCIATIONInformation concerning the Articles of Association can be found on pages 83-89. LISTING RULE INFORMATION [A]Information concerning the amount of interest capitalised by Shell can be found in Note6 to the “Consolidated Financial Statements” on page 151.[A] This information is given in accordance with Listing Rule 9.8.4R.
AUDITORA resolution relating to the appointment of Ernst & Young LLP as auditor for thefinancial year 2018 will be proposed at the 2018 AGM. CORPORATE GOVERNANCEThe Company’s statement on corporate governance is included in the “Corporategovernance” report on pages 76-89 and is incorporated in this Directors’ Report by wayof reference. ANNUAL GENERAL MEETINGThe AGM will be held on May 22, 2018, at the Circustheater, Circusstraat 4, 2586 CW,The Hague, The Netherlands. The Notice of Annual General Meeting will include detailsof the business to be put to shareholders at the AGM. Signed on behalf of the Board /s/ Linda M. Szymanski Linda M. SzymanskiCompany SecretaryMarch 14, 2018
GOVERNANCE SHELL ANNUAL REPORT AND FORM 20-F 2017 75

Dear Shareholders,
I am pleased to introduce this report which describes the activities of your Board duringthe year along with our governance arrangements and how we have applied the mainprinciples and complied with the relevant provisions set out in the UK CorporateGovernance Code (the Code) issued by the Financial Reporting Council (FRC). The Codeis regularly reviewed and updated and this is the first time we are required to apply the2016 version, which incorporates changes relating to audit committee matters.
This year, the Board primarily focused on our three strategic aims: strengthening ourworld-class investment case including operational excellence and our financialframework, thriving through the energy transition and sustaining our societal licence tooperate. In November 2017, our executive team communicated our progress ondelivering these three aims and announced our net carbon footprint ambition. Moreinformation on Board meeting discussions can be found in the following pages, and ourStrategic Report provides more information on the strategic aims and our net carbonfootprint ambition.
Succession is another key topic that remains a Board priority, and 2017 brought severalchanges to the composition of the Board. In March, we saw the departure of SimonHenry as Chief Financial Officer (CFO). Two of our Non-executive Directors also stooddown: Patricia Woertz at the 2017 Annual General Meeting (AGM) in May and GuyElliott in October. I would like to again thank each of them for their commitment andlasting contributions to the Board.
We appointed Jessica Uhl in March as our CFO, succeeding Simon Henry, and wewelcomed Catherine Hughes and Roberto Setubal as Non-executive Directors in June andOctober respectively. All three appointments were overwhelmingly endorsed byshareholders at the 2017 AGM and we are delighted with the valuable contributionsalready being made by our new colleagues. Additionally, Linda Szymanski took up hernew role as Company Secretary in January 2017.
At the forthcoming AGM, Hans Wijers will stand down as a Non-executive Directorhaving served with distinction for nine years, including service as Senior IndependentDirector, Chair of the Remuneration Committee and Chair of the Corporate and SocialResponsibility Committee. Also at the AGM, shareholders will be asked to vote on theappointment of Ann Godbehere as a Non-executive Director with effect from May 23,2018.
We take the issue of diversity in the Boardroom very seriously and are mindful ofimportant recent developments in this area. In terms of gender diversity, for example, theHampton-Alexander Review recommended that a minimum of 33% of directors arewomen, and I am pleased to report that we meet this target, ranking in the top quartile ofFTSE100 companies. We are also committed to gender diversity in our other seniorleadership positions and you can read more about this in “Our people” on page 67.
Another important development in the area of diversity was the publication of the ParkerReview Committee’s report in October which focussed on ethnic and cultural diversity inthe boardroom. Your Board presently has a strong mix of diverse perspectives, and weare currently considering how best to apply the recommendations in the Parker Reviewgiven the complexity in some jurisdictions in obtaining ethnicity data. You can read moreabout our approach to diversity later in this report.
The changes to the composition of the Board in 2017 gave us the opportunity to refreshthe membership of the Board committees and you can review these changes and the workof Nomination and Succession Committee later in this report and, in the case of the AuditCommittee and the Remuneration Committee, in their separate reports to shareholders onpages 90-93 and pages 94-117 respectively.
The Nomination and Succession Committee had a very busy year. In addition to leadingthe process for the Board changes noted above, it also continued its focus on ongoingsuccession planning, monitored and reviewed corporate governance developments andmade related recommendations to the Board. There were numerous corporate governancedevelopments throughout the year, including the publication of a paper by the UKgovernment in August setting out its proposed corporate governance reforms and thepublication of a consultation paper by the FRC in December on amendments to the Code.
The government’s paper set out 12 key actions for reform, focussing on mattersincluding executive pay and strengthening the voice of employees and otherstakeholders. It is expected that the government will introduce legislation in time for thereforms to apply to accounting periods beginning on or after January 1, 2019. Regardingthe Code, the FRC consultation paper proposed both specific amendments suggested bythe government and a range of new requirements. The consultation ended in February2018 and the FRC is aiming to publish the final version of the new Code by earlysummer. The Nomination and Succession Committee will continue to monitor and reviewall these developments and make recommendations to the Board at the appropriate time.
In December, the Board conducted its annual performance evaluation. In 2016, we usedan external facilitator to conduct an in-depth process lasting from January through toJune, however in 2017 we conducted a more streamlined evaluation. It was led by theNomination and Succession Committee and involved Directors completing a series ofconfidential online questionnaires made available via a corporate advisory firm. While theprocess was less extensive than last year, it still proved to be a valuable exercisegenerating reflective discussions and planned actions. You can read more about theprocess later in this report.
Finally, I would like to thank my fellow Directors, past and present, for their support inachieving our high standards of corporate governance. We look forward to thepublication of the legislative and Code changes that are expected in 2018. We remaincommitted to our high standards of corporate governance which we believe to be acritical factor to the long-term success of the Company.
Chad HollidayChairMarch 14, 2018
STATEMENT OF COMPLIANCEThe Board confirms that throughout the year the Company has applied the mainprinciples and complied with the relevant provisions set out in the Code issued by theFRC in April 2016 [A]. In addition to complying with applicable corporate governancerequirements in the UK, the Company must follow the rules of Euronext Amsterdam aswell as Dutch securities laws because of its listing on that exchange. The Company mustlikewise follow US securities laws and the New York Stock Exchange (NYSE) rules andregulations because its securities are registered in the USA and listed on the NYSE.[A] A copy of the Code can be found on the FRC’s website (frc.org.uk).
NYSE GOVERNANCE STANDARDSIn accordance with the NYSE rules for foreign private issuers, the Company followshome-country practice in relation to corporate governance. However, foreign privateissuers are required to have an audit committee that satisfies the requirements of the USSecurities and Exchange Commission’s (SEC) Rule 10A-3. The Company’s AuditCommittee satisfies such requirements. The NYSE also requires a foreign private issuer toprovide certain written affirmations and notices to the NYSE, as well as a summary of thesignificant ways in which its corporate governance practices differ from those followedby domestic US companies under NYSE listing standards (see Section 303A.11 of theNYSE Listed Company Manual). The Company’s summary of
Corporate governance
GOVERNANCE SHELL ANNUAL REPORT AND FORM 20-F 2017 76

its corporate governance differences is given below and can be found atwww.shell.com/investor. NON-EXECUTIVE DIRECTOR INDEPENDENCEThe Board follows the provisions of the Code in determining Non-executive Directorindependence, which states that at least half of the Board, excluding the Chair, shouldcomprise Non-executive Directors determined by the Board to be independent. In thecase of the Company, the Board has determined that all the Non-executive Directors at theend of 2017 are wholly independent. NOMINATING/CORPORATE GOVERNANCE COMMITTEE AND COMPENSATIONCOMMITTEEThe NYSE listing standards require that a listed company maintain anominating/corporate governance committee and a compensation committee, bothcomposed entirely of independent directors and with certain specific responsibilities. TheCompany’s Nomination and Succession Committee and Remuneration Committee bothcomply with these requirements, except that the terms of reference of the Nomination andSuccession Committee require only a majority of the committee members to beindependent. AUDIT COMMITTEEAs required by NYSE listing standards, the Company maintains an Audit Committee forthe purpose of assisting the Board’s oversight of its financial statements, its internal auditfunction and its independent auditors. The Company’s Audit Committee is in fullcompliance with the SEC’s Rule 10A-3 and Section 303A.06 of the NYSE ListedCompany Manual. The Company’s Audit Committee is not directly responsible for the appointment ofindependent auditors. However, the Company’s Audit Committee makesrecommendations to the Board for it to put to shareholders for approval in generalmeeting. UK legislation provides that it is for shareholders to agree the appointment,reappointment and removal of the Company’s independent auditors. SHAREHOLDER APPROVAL OF SHARE-BASED COMPENSATION PLANSThe Company complies with the listing rules of the UK Listing Authority (UKLA), whichrequire shareholder approval for the adoption of share-based compensation plans whichare either long-term incentive plans in which one or more Directors can participate orplans which involve or may involve the issue of new shares or the transfer of treasuryshares. Under the UKLA rules, such plans cannot be changed to the advantage ofparticipants without shareholder approval, except for certain minor amendments, forexample to benefit the administration of the plan or to take account of tax benefits. Therules on the requirements to seek shareholder approval for share-based compensationplans, including those in respect of material revisions to such plans, may deviate from theNYSE listing standards. CODE OF BUSINESS CONDUCT AND ETHICSThe NYSE listing standards require that listed companies adopt a code of businessconduct and ethics for all directors, officers and employees and promptly disclose anywaivers of the code for directors or executive officers. The Company has adopted theShell General Business Principles (see below), which satisfy the NYSE requirements. TheCompany also has internal procedures in place by which any employee can raise inconfidence accounting, internal accounting controls and auditing concerns. Additionally,any employee can report concerns to management by telephone or over the internetwithout jeopardising their position (see below). SHELL GENERAL BUSINESS PRINCIPLES The Shell General Business Principles define how Shell subsidiaries are expected toconduct their affairs and are underpinned by the Shell core values of honesty, integrityand respect for people. These principles include, among other things, Shell’s commitmentto support fundamental human rights in line with the legitimate role of business and tocontribute to sustainable development. They are designed to mitigate the risk of damageto our business reputation and to prevent violations of local and international legislation.They can be found at www.shell.com/sgbp. See “Risk factors” on page 15.
SHELL CODE OF CONDUCTDirectors, officers, employees and contract staff are required to comply with the ShellCode of Conduct, which is intended to help them put Shell’s business principles intopractice. This code clarifies the basic rules and standards they are expected to follow andthe behaviour expected of them. These individuals must also complete mandatory Codeof Conduct training. Designated individuals are required to complete additionalmandatory training on antitrust and competition laws, anti-bribery, anti-corruption andanti-money laundering laws, data protection laws and trade compliance requirements (see“Risk factors” on pages 15-16). The Shell Code of Conduct can be found atwww.shell.com/codeofconduct. CODE OF ETHICSExecutive Directors and Senior Financial Officers of Shell must also comply with a Codeof Ethics. This code is specifically intended to meet the requirements of Section 406 ofthe Sarbanes-Oxley Act and the listing requirements of the NYSE (see above). It can befound at www.shell.com/codeofethics. SHELL GLOBAL HELPLINEEmployees, contract staff, third parties with whom Shell has a business relationship (suchas customers, suppliers and agents), and any member of the public (includingshareholders) may raise ethics and compliance concerns (anonymously if preferred)through the Shell Global Helpline. This is a worldwide confidential reporting mechanism,operated by an external third party, and is available 24 hours a day, seven days a week bytelephone and at www.shell.com or https://shell.alertline.eu. BOARD STRUCTURE AND COMPOSITIONDuring 2017, the Board comprised the Chair; two Executive Directors, namely the ChiefExecutive Officer (CEO) and the Chief Financial Officer (CFO) [A]; and Non-executiveDirectors, including the Deputy Chair and Senior Independent Director, as follows:
Period Number of Non-executive DirectorsJanuary 1 to May 23 8May 24 to May 31 7June 1 to September 30 8October 1 to October 18 9October 19 to December 31 8[A] With effect from March 9, 2017, Simon Henry stood down as CFO and was succeeded by Jessica Uhl. At its meeting in July 2017, the Board authorised a matter declared by Gerrit Zalm,namely his temporary appointment by the Dutch Second Chamber of Parliament toinvestigate the political support for a coalition government. The matter was authorisedsubject to certain conditions Gerrit Zalm requested during the term of the appointment,including that he did not participate in the making of decisions related to the Company(whether at meetings of the Directors or otherwise) and that he be excluded from thereceipt of information he would otherwise receive in his role as a Director of theCompany. Such conditions were revoked in October 2017 after the conclusion of histemporary appointment subject to certain further conditions designed to avoid any futureactual or perceived conflicts of interest. A list of current Directors, including their biographies, can be found on pages 69-71. The Board recognises its collective responsibility for the long-term success of theCompany. Generally, it meets eight times a year [A] and has a formal schedule of mattersreserved to it. This includes: overall strategy and management; corporate structure andcapital structure; financial reporting and control, including approval of the Annual Reportand Form 20-F, and interim dividends; oversight and review of risk management andinternal control; significant contracts; and succession planning and new Boardappointments. The full list of matters reserved to the Board for decision can be found atwww.shell.com/investor.[A] See page 79 for the number of meetings held in 2017.
GOVERNANCE SHELL ANNUAL REPORT AND FORM 20-F 2017 77
ROLE OF DIRECTORSThe roles of the Chair, a non-executive role, and the CEO are separate, and the Board hasagreed their respective responsibilities. The Chair is responsible for the leadership and management of the Board and forensuring that the Board and its committees function effectively. One way in which this isachieved is by ensuring Directors receive accurate, timely and clear information. He isalso responsible for agreeing and regularly reviewing the training and development needsof each Director (see “Induction and training” below) which he does with the assistanceof the Company Secretary. The CEO bears overall responsibility for the implementation of the strategy agreed by theBoard, the operational management of the Company and the business enterprisesconnected with it. He is supported in this by the Executive Committee which he chairs(see page 80). NON-EXECUTIVE DIRECTORSNon-executive Directors are appointed by the Board or by shareholders at generalmeetings and, in accordance with the Code, must seek re-election by shareholders on anannual basis. Their letter of appointment refers to a specific term of office, such termbeing subject to the provisions of the Code and the Company’s Articles of Association(the Articles). Upon appointment, Non-executive Directors confirm they are able toallocate sufficient time to meet the expectations of the role. Appointments are subject to aminimum of three months’ notice of termination, and there is no compensation provisionfor early termination. The Non-executive Directors bring a wide range and balance of skills and internationalbusiness experience to Shell. Through their contribution to Board meetings and to Boardcommittee meetings, they are expected to challenge and help develop proposals onstrategy and bring independent judgement on issues of performance and risk. Generally,prior to each meeting of the Board, the Chair and the Non-executive Directors meetwithout the Executive Directors to discuss, among other things, the performance ofindividual Executive Directors. A number of Non-executive Directors also meet majorshareholders from time to time. The role of the Senior Independent Director is to provide a sounding board for the Chairand to serve as an intermediary for the other Directors when necessary. The SeniorIndependent Director is available to shareholders if they have concerns which contactthrough the normal channels of Chair, CEO or CFO has failed to resolve or for whichsuch contact is inappropriate. All the Non-executive Directors are considered by the Board to be wholly independent.
CONFLICTS OF INTERESTCertain statutory duties with respect to directors’ conflicts of interest are in force underthe Companies Act 2006 (the Act). In accordance with the Act and the Articles, the Boardmay authorise any matter that otherwise may involve any of the Directors breaching theirduty to avoid conflicts of interest. The Board has adopted a procedure to address theserequirements. It includes the Directors completing detailed conflict of interestquestionnaires. The matters disclosed in the questionnaires are reviewed by the Boardand, if considered appropriate, authorised in accordance with the Act and the Articles.Conflicts of interest as well as any gifts and hospitality received by and provided byDirectors are kept under review by the Board. Further information relating to conflicts ofinterest can be found on pages 84-85. SIGNIFICANT COMMITMENTS OF THE CHAIRThe Chair’s other significant commitments are given in his biography on page 70.
INDEPENDENT PROFESSIONAL ADVICEAll Directors may seek independent professional advice in connection with their role as aDirector. All Directors have access to the advice and services of the Company Secretary.The Company has provided both indemnities and directors’ and officers’ insurance to theDirectors in connection with the performance of their responsibilities. Copies of theseindemnities and the directors’ and officers’ insurance policies are open to inspection. Acopy of the form of these indemnities has been previously filed with the SEC and isincorporated by reference as an exhibit to this Report. BOARD ACTIVITIES DURING THE YEARThe Board generally meets eight times a year, however in 2017 there were sevenmeetings, all of which were held in The Hague, the Netherlands. The agenda for each meeting included a number of regular items, including reports fromthe CEO, the CFO and other members of the Executive Committee, from each of theBoard committees and from the various functions, including finance (which includesinvestor relations), health and security, human resources, and legal (which includes theCompany Secretary). The Board also considered and approved the quarterly, half-yearand full-year financial results and dividend announcements and, at most meetings,considered a number of investment, divestment and financing proposals. At its meeting in February, the Board focused on strategic issues and laid the foundationsfor further strategy sessions throughout the year. The strategy sessions were held withinthe context of the changing global energy market, Shell’s strategy and its competitivepositioning. The Board considered risks and opportunities of the current and possiblefuture shape of Shell’s portfolio under various scenarios. During the year the Board alsofocused on the management of Shell’s financial framework and the levers available tomeet its strategic objectives. Along with the focus on strategic matters, the Board also received reports andpresentations on certain of Shell’s activities (including those in Australia, Canada,Kazakhstan, Nigeria and Saudi Arabia), and on the New Energies business, trading andsupply, marketing and the Chemicals business, and discussed ways to strengthen the ethicsand compliance culture. In addition, it received reports on ethics and compliance,litigation, risk management and internal control, safety and environmental performance,senior management succession and corporate governance developments. In June, the Board conducted site visits of various Shell operations and offices in the USA(see “Induction and training” below). The visits were designed to provide Directors withfirst-hand insights into some key US portfolio positions, and Directors held variousworkforce engagements in those locations as well as external stakeholder engagements insome locations. At its meeting in November, the Board established a committee to overseematters related to investigations and litigation against the Company regarding oilprospecting licence (OPL) 245, a deep-water block in Nigeria. The committee comprisesLinda G. Stuntz (Chair), Euleen Goh and Charles O. Holliday and met once during theyear. The remit of the committee is to review and consider matters related to theinvestigations and litigation and make recommendations to the Board. INDUCTION AND TRAININGFollowing appointment to the Board, Directors receive a comprehensive inductiontailored to their individual needs. This includes site visits and meetings with seniormanagement to enable them to build up a detailed understanding of Shell’s business andstrategy, and the key risks and issues which they face. For Catherine J. Hughes andRoberto Setubal, who were appointed to the Board with effect from June 1, 2017, andOctober 1, 2017, respectively, Director-specific briefing materials and induction sessionswere held with various businesses and functions and each participated in separate sitevisits.
GOVERNANCE SHELL ANNUAL REPORT AND FORM 20-F 2017 78
Throughout the year, regular updates on developments in legal matters, governance andaccounting are provided to all Directors. The Board regards site visits as an integral partof ongoing Director training, and during the year the locations visited by Directors,individually or in groups, included: the Moerdijk chemical complex and the Pernisrefinery in the Netherlands; the Bacton gas terminal in the UK; the Permian Basin inTexas, USA; the Pennsylvania Chemicals Complex in the USA; Gulf of Mexicooperations in Louisiana, USA; trading operations in the USA and in the Netherlands; andvarious Downstream retail sites in the Netherlands, Singapore and the UK. Additionaltraining is available so that Directors can update their skills and knowledge as appropriate.
ATTENDANCE AT BOARD AND BOARD COMMITTEE MEETINGSAttendance during 2017 for all Board and Board committee meetings is given in the table below.
Attendance at Board and Board committee meetings [A]
Board Audit
Committee
Corporate andSocial Responsibility
Committee
Nomination andSuccessionCommittee
RemunerationCommittee
Ben van Beurden 7/7 Guy Elliott 5/5 2/2 1/1 4/4 Euleen Goh 7/7 6/6 Simon Henry 2/2 Charles O. Holliday 7/7 6/6 Catherine J. Hughes [B] 4/4 1/2 2/2Gerard Kleisterlee 7/7 5/5 5/5Roberto Setubal 2/2 2/2 Sir Nigel Sheinwald 7/7 6/6 3/3Linda G. Stuntz 7/7 6/6 6/6 Jessica Uhl 5/5 Hans Wijers 7/7 6/6 6/6 Patricia A. Woertz 2/2 2/2 2/2Gerrit Zalm [C][D] 4/5 3/3 4/4[A] The first figure represents attendance and the second figure the possible number of meetings. For example, 7/7 signifies attendance at seven out of seven possible meetings. Where a Director stood down from the Board or a Board committee during theyear, or was appointed during the year, only meetings before standing down or after the date of appointment are shown.[B] Catherine J. Hughes was unable to attend the meeting of the Corporate and Social Responsibility Committee held in November 2017 due to an external business commitment made prior to her joining the Board.[C] Gerrit Zalm was unable to attend the meeting of the Board held in March 2017 due to illness.[D] At its meeting in July 2017, the Board authorised a matter declared by Gerrit Zalm subject to certain conditions, including that he did not participate in the making of decisions related to the Company and that he be excluded from the receipt of informationhe would otherwise receive in his role as a Director of the Company. Such conditions were revoked in October 2017 subject to certain further conditions designed to avoid any actual or perceived conflicts of interest. As a result of such arrangement, thepossible number of meetings that Gerrit Zalm was permitted to attend was five Board, three Audit Committee and four Remuneration Committee meetings. Further information can be found on page 77.
GOVERNANCE SHELL ANNUAL REPORT AND FORM 20-F 2017 79

BOARD EVALUATION During the year, the Board carried out its annual performance evaluation. As in previousyears, this was led by the Nomination and Succession Committee. On this occasion, itengaged Lintstock Limited, a London-based corporate advisory firm with no otherconnection to the Company, as an external facilitator to assist in the process. The process involved each Director completing a confidential online questionnairedesigned by the external facilitator and the Nomination and Succession Committee. Thecompleted questionnaires were only available to the facilitator, which prepared a reportfor the Chair, the Deputy Chair and the chairs of the Board committees. In December, the performance of the Board as a whole and the Board committees wasdiscussed by the Nomination and Succession Committee and subsequently by the fullBoard. The discussions were led by the Chair and focussed on issues such as: ■ Board composition, dynamics, expertise and support;■ the Board’s understanding of the views and requirements of major investors,
employees, governments, customers and communities;■ the management and focus of meetings; and■ the capacity of the organisation to deliver Shell’s strategy. The top priorities for the Board over the coming year were discussed and it was agreedthat they included financial performance, the energy transition and the strategy for NewEnergies, digitalisation and succession planning. The performance evaluation of the Chair was reviewed in a session led by the DeputyChair with attendance by all other Directors excluding the Chair. Directors had previouslyanswered questions which included matters related to his relationship andcommunications with the CEO and other Directors, his management of the input ofDirectors both inside and outside Board meetings, and his relationship with stakeholders,including shareholders. It was concluded that the Chair’s performance was very positive. EXECUTIVE COMMITTEEThe Executive Committee operates under the direction of the CEO in support of hisresponsibility for the overall management of Shell’s business. The CEO has finalauthority in all matters of management that are not within the duties and authorities of theBoard or of the shareholders’ general meeting. The current composition of the Executive Committee is as follows:
Executive CommitteeBen van Beurden CEO [A][B]Jessica Uhl CFO [A][B][C]John Abbott Downstream Director [B]Harry Brekelmans Projects & Technology Director [B]Andrew Brown Upstream Director [B]Ronan CassidyDonny Ching
Chief Human Resources & Corporate Officer [B]Legal Director [B]
Maarten Wetselaar Integrated Gas and New Energies Director [B][A] Director of the Company. [B] Designated an Executive Officer pursuant to US Exchange Act Rule 3b-7. Beneficially owns less than 1% of outstandingclasses of securities. [C] Jessica Uhl was appointed a Director of the Company and a member of the Executive Committee with effect from March9, 2017. She succeeded Simon Henry as CFO who stood down from that date.
BOARD COMMITTEESThere are four Board committees made up of Non-executive Directors. These are the: ■ Audit Committee;■ Corporate and Social Responsibility Committee;■ Nomination and Succession Committee; and■ Remuneration Committee.
Each of these Board committees has produced a report which has been approved by therelevant chair. A copy of each committee’s terms of reference is available from theCompany Secretary and can be found at www.shell.com/investor. AUDIT COMMITTEEThe Audit Committee Report, which sets out the composition and work of the AuditCommittee during 2017, is on pages 90-93. CORPORATE AND SOCIAL RESPONSIBILITY COMMITTEEThe members of the Corporate and Social Responsibility Committee are Hans Wijers(Chair of the Committee), Catherine J. Hughes (appointed with effect from November 1,2017) and Sir Nigel Sheinwald. Guy Elliott (appointed with effect from March 8, 2017)and Patricia A. Woertz stood down as members of the Committee on October 18, 2017and May 23, 2017, respectively. The Committee met six times during the year; theCommittee members’ attendances are shown on page 79. The Committee has a mandate to maintain a comprehensive overview of the policies andperformance of the subsidiaries of the Company with respect to the Shell GeneralBusiness Principles and the Shell Code of Conduct, as well as major issues of publicconcern. Conclusions and recommendations made by the Committee are reported directlyto executive management and the Board. The Committee fulfils its responsibilities by reviewing a wide range of areas, includingthe management of health, safety, security, environmental and social impacts of projectsand operations. It does this through a series of reviews of performance, audit findings andother specific areas, such as process safety. It also monitors major issues of public concernand Shell’s strategy to address them, especially in respect of environmental and socialissues, and matters regarding ethics and compliance. In addition, it provides input into theShell Sustainability Report and reviews a draft of the report before publication. The key topics discussed by the Committee in 2017 were the energy transition, net carbonfootprint ambition, carbon dioxide and methane related developments, induced seismicactivity in Groningen province, the Netherlands, Shell’s operations in Nigeria, humanrights, asset integrity and process safety. In addition to holding regular formal meetings, the Committee visits Shell locations andmeets with local staff and external stakeholders to hear their perspectives and observehow Shell’s standards regarding health, safety, security, the environment and socialperformance are being implemented. In 2017, the Committee visited the PennsylvaniaChemicals Complex in the USA, where it engaged with employees, contractors and localstakeholders. Individual Committee members visited the Pernis refinery in theNetherlands and the Bacton gas terminal in the UK.
GOVERNANCE SHELL ANNUAL REPORT AND FORM 20-F 2017 80

NOMINATION AND SUCCESSION COMMITTEEThe members of the Nomination and Succession Committee are Charles O. Holliday(Chair of the Committee), Linda G. Stuntz, and Hans Wijers. Guy Elliott stood down as amember of the Committee on October 18, 2017. The Committee met six times during theyear; the Committee members’ attendances are shown on page 79. The Committee continually reviews the leadership needs of the Company and identifiesand nominates suitable candidates for the Board’s approval to fill vacancies when theyarise. In addition, it makes recommendations on who should be appointed Chair of theAudit Committee, the Corporate and Social Responsibility Committee and theRemuneration Committee and, in consultation with the relevant chair, recommends whoshould sit on the Board committees. It also makes recommendations on corporategovernance guidelines, monitors compliance with corporate governance requirementsand makes recommendations on disclosures connected with corporate governance of itsappointment processes. During 2017, the Committee dealt with the appointment of two new Non-executiveDirectors, namely Catherine J. Hughes and Roberto Setubal. The appointment processinvolved the Committee agreeing on a candidate profile and, following an interview andbenchmarking process, making a recommendation to the Board. The Board then soughtshareholder approval for the appointments at the 2017 AGM held in May, proposing thatthe appointments be effective from June 1 and October 1, respectively. Bothappointments were overwhelmingly endorsed by shareholders, as was the reappointmentof Jessica Uhl (CFO) whose original appointment was effective from March 9, 2017, andhad been recommended by the Committee to the Board in December 2016. In addition to continuing its ongoing programme of succession planning for the non-executive Directors and in particular for the Deputy Chair and Senior IndependentDirector, the Committee also considered the senior management talent pipeline andscheduled a series of meetings with prospective candidates with future senior leadershipappointments in mind. It also reviewed Board committee membership and made anumber of recommendations to the Board, considered any potential conflicts of interestand the independence of the Non-executive Directors and led the Board evaluationprocess. The Committee also approved a more formal review process in relation to theacceptance by Directors of additional directorships or other appointments and indeedconsidered a number of such directorships and appointments in accordance with the newprocess. In accordance with its terms of reference, the Committee monitored and reviewedcorporate governance developments throughout the year. Such developments werenumerous, and included UK government proposals related to matters such as executivepay and the role of employees and other stakeholders, and a proposed wide-rangingreform of the Code by the FRC. The monitoring and review of these and other corporategovernance developments, as well as considering whether and how current Companygovernance matters should be strengthened, is likely to keep the Committee engaged forthe remainder of 2018 and beyond. The Board continues to take the issue of boardroom diversity seriously and believesmaintaining an appropriate level of diversity is key to its effective performance. It ismindful of external developments in this area, including the Hampton-Alexander Reviewwhich recommended that a minimum of 33% of directors are women and the publicationof the Parker Review Committee’s report in October, which focused on ethnic andcultural diversity in the boardroom. While the Board itself meets the gender diversitytarget, it is also keen to ensure gender diversity in other senior leadership positions acrossShell[A]. As regards ethnic and cultural diversity, the Board will look to see how it canbest apply the recommendations of the Parker Review report during the Boardappointment process.[A] More information on gender diversity is given in “Our people” on page 67.
As part of its annual programme of work, the Committee reviewed its terms of referenceand made certain amendments in relation to diversity to reflect changes to the FinancialConduct Authority’s Disclosure Guidance and Transparency Rules. The amendmentextends the list of aspects for consideration by the Board to include age, educational andprofessional background when applying its goal of becoming more diverse [A].[A] The terms of reference of the Nomination and Succession Committee can be found at www.shell.com/investor. The Committee was assisted during the year by Egon Zehnder and Russell Reynolds,external global search firms, whose main role was to propose suitable candidates. EgonZehnder and Russell Reynolds do not have any connection with the Company other thanthat of search consultants. REMUNERATION COMMITTEEThe Directors’ Remuneration Report, which sets out the composition and work of theRemuneration Committee, the Directors’ remuneration for 2017 and the Directors’Remuneration Policy which was approved by shareholders at the 2017 AGM, is on pages94-117. SHAREHOLDER COMMUNICATIONSThe Board recognises the importance of two-way communication with the Company’sshareholders. The Chair, the Deputy Chair and Senior Independent Director, the CEO, theCFO and the Executive Vice President Investor Relations each meet regularly with majorshareholders and report the views of such shareholders to the Board. As well as theCompany giving a balanced report of results and progress at each AGM, all shareholdershave an opportunity to ask questions in person. Shareholders are also free to contact theCompany directly at any time of the year via dedicated shareholder email addresses or viadedicated shareholder telephone numbers as given on the inside back cover of thisReport. Shell’s website at www.shell.com/investor has information for institutional andretail shareholders alike. The Company’s Registrar, Equiniti, operates an internet access facility for registeredshareholders, providing details of their shareholdings at www.shareview.co.uk. Facilitiesare also provided for shareholders to lodge proxy appointments electronically. TheCompany’s Corporate Nominee provides a facility for investors to hold their shares in theCompany in paperless form. RESULTS PRESENTATIONS AND ANALYSTS’ MEETINGSThe quarterly, half-yearly and annual results presentations, as well as all major analysts’meetings, are announced in advance on the Shell website and through a regulatoryrelease. Generally, presentations are broadcast live via webcast and teleconference. Othermeetings with analysts or investors are not normally announced in advance, nor can theybe followed remotely by webcast or any other means. Procedures are in place to ensurethat discussions in such meetings are always limited to non-material information orinformation already in the public domain. Results and meeting presentations can be found at www.shell.com/investor. This is in linewith the requirement to ensure that all shareholders and other parties in the financialmarket have equal and simultaneous access to information that may influence the price ofthe Company’s securities. NOTIFICATION OF MAJOR SHAREHOLDINGSInformation concerning notifications of major shareholdings can be found on page 218. RESPONSIBILITY FOR PREPARING THE ANNUAL REPORT ANDACCOUNTSInformation concerning the responsibility for preparing the Annual Report and Accountscan be found on page 73.
GOVERNANCE SHELL ANNUAL REPORT AND FORM 20-F 2017 81

CONTROLS AND PROCEDURES The Board is responsible for maintaining a sound system of risk management and internalcontrol, and for regularly reviewing its effectiveness. It has delegated authority to theAudit Committee to assist it in fulfilling its responsibilities in relation to internal controland financial reporting (see “Audit Committee Report” on pages 90-93). A single overall control framework is in place for the Company and its subsidiaries that isdesigned to manage rather than eliminate the risk of failure to achieve business objectives.It therefore only provides a reasonable and not an absolute assurance against materialmisstatement or loss. The diagram below illustrates the control framework’s key components: “Foundations”,“Management Processes” and “Organisation”. “Foundations” comprises the objectives,principles and rules that underpin and establish boundaries for Shell’s activities.“Management Processes” refers to the more material management processes, includinghow strategy, planning and appraisal are used to improve performance and how risks areto be managed through effective controls and assurance. “Organisation” sets out how thevarious legal entities relate to each other and how their business activities are organisedand managed, and how authority is delegated.
The system of risk management and internal control over financial reporting is an integralpart of the control framework. Regular reviews are performed to identify the significantrisks to financial reporting and the key controls designed to address them. These controlsare documented, responsibility is assigned, and they are monitored for design andoperating effectiveness. Controls found not to be effective are remediated. The principalrisks faced by Shell are set out in “Risk factors” on pages 12-16. The Board has conducted its annual review of the effectiveness of Shell’s system of riskmanagement and internal control, including financial, operational and compliancecontrols. Shell has a variety of processes for obtaining assurance on the adequacy of riskmanagement and internal control and implements a broad array of measures to manage itsvarious risks which are set out in the relevant sections of this Report. There are also risksthat Shell accepts or does not seek to fully mitigate. The Executive Committee and theBoard regularly consider group-level risks and associated control mechanisms.
A risk appetite framework has been defined with three different risk appetite lenses thathave been applied (Strategic Risk Appetite, Operational Risk Appetite and Conduct RiskAppetite). Risk appetite parameters have been identified and are being monitored. TheStrategic Risk Appetite lens supplements current and future portfolio considerations, withspecific focus on explicit articulation of key strategic beliefs. The Operational RiskAppetite lens promotes both a more granular assessment of risks that the organisationfaces and the purposeful assessment of risk appetite. The Conduct Risk Appetite lensbrings together a number of leading and lagging risk indicators, which help to provide amore holistic view of the culture of the organisation. Shell has a climate change risk management structure in place which is supported bystandards, policies and controls (see “Risk factors” on page 13 and “Climate change andenergy transition” on pages 62-63). Climate change and risks resulting from greenhousegas emissions have been identified as a significant risk factor for Shell and are managedin accordance with other significant risks through the Board and Executive Committee. Many of our major projects and operations are conducted in joint arrangements orassociates, which may reduce the degree of control and ability to identify and managerisks (see “Risk factors” on page 15). In each case, Shell appoints a representative tomanage its interests who seeks to ensure that such projects operate under equivalentstandards to Shell.
We operate in more than 70 countries that have differing degrees of political, legal andfiscal stability. This exposes us to a wide range of political developments that could resultin changes to contractual terms, laws and regulations. In addition, we and our jointarrangements and associates face the risk of litigation and disputes worldwide (see “Riskfactors” on page 13). We continuously monitor geopolitical developments and societalissues relevant to our interests. Employees who engage with government officials aresubject to specific training programmes, procedures and regular communications, inaddition to Shell General Business Principles and Shell Code of Conduct compliance. Weare prepared to exit a country if we believe we can no longer operate in that country inaccordance with our standards and applicable law, and we have done so in the past. The Board confirms that there is a robust process for identifying, evaluating andmanaging the principal risks to the achievement of Shell’s objectives. This has been inplace throughout 2017 and up to the date of this Report and is regularly reviewed by theBoard and accords with the Internal Control: Guidance to Directors (formerly known asthe Turnbull Guidance). MANAGEMENT’S EVALUATION OF DISCLOSURE CONTROLS ANDPROCEDURES OF SHELLAs indicated in the certifications in Exhibits 12.1 and 12.2 of this Report, Shell’s CEOand CFO have evaluated the effectiveness of Shell’s disclosure controls and procedures atDecember 31, 2017. Based on that evaluation, they concluded that Shell’s disclosurecontrols and procedures are effective. MANAGEMENT’S REPORT ON INTERNAL CONTROL OVER FINANCIALREPORTING OF SHELLManagement, including the CEO and CFO, is responsible for establishing and maintainingadequate internal control over Shell’s financial reporting and the preparation of the“Consolidated Financial Statements”. It conducted an evaluation of the effectiveness ofShell’s internal control over financial reporting and the preparation of the “ConsolidatedFinancial Statements” based on the Internal Control – Integrated Framework(2013) issued by the Committee of Sponsoring Organizations of the TreadwayCommission. On the basis of this evaluation, management concluded that, atDecember 31, 2017, the Company’s internal control over Shell’s financial reporting andthe preparation of the “Consolidated Financial Statements” was effective.
GOVERNANCE SHELL ANNUAL REPORT AND FORM 20-F 2017 82
Ernst & Young LLP, the independent registered public accounting firm that audited the“Consolidated Financial Statements”, has issued an attestation report on the Company’sinternal control over financial reporting, as stated in its report on page 135.
THE TRUSTEE’S AND MANAGEMENT’S EVALUATION OF DISCLOSURECONTROLS AND PROCEDURES FOR THE ROYAL DUTCH SHELL DIVIDENDACCESS TRUSTThe Trustee of the Royal Dutch Shell Dividend Access Trust (the Trustee) and Shell’sCEO and CFO have evaluated the effectiveness of the disclosure controls and proceduresin respect of the Dividend Access Trust (the Trust) at December 31, 2017. On the basis ofthis evaluation, these officers have concluded that the disclosure controls and proceduresof the Trust are effective. THE TRUSTEE’S AND MANAGEMENT’S REPORT ON INTERNAL CONTROL OVERFINANCIAL REPORTING OF THE ROYAL DUTCH SHELL DIVIDEND ACCESSTRUSTThe Trustee is responsible for establishing and maintaining adequate internal control overthe Trust’s financial reporting. The Trustee and the Company’s management conductedan evaluation of the effectiveness of internal control over financial reporting based on theInternal Control – Integrated Framework (2013) issued by the Committee of SponsoringOrganizations of the Treadway Commission. On the basis of this evaluation, the Trusteeand management concluded that, at December 31, 2017, the Trust’s internal control overfinancial reporting was effective. Ernst & Young LLP, the independent registered public accounting firm that audited theTrust’s financial statements, has issued an attestation report on the Trustee’s andmanagement’s internal control over financial reporting, as stated in its report on pages210-211.
CHANGES IN INTERNAL CONTROL OVER FINANCIAL REPORTINGThere has not been any change in the internal control over financial reporting of Shell orthe Trust that occurred during the period covered by this Report that has materiallyaffected, or is reasonably likely to materially affect, the internal control over financialreporting. Material financial information of the Trust is included in the “ConsolidatedFinancial Statements” and is therefore subject to the same disclosure controls andprocedures as Shell. See the “Royal Dutch Shell Dividend Access Trust FinancialStatements” on pages 213-216 for additional information. ARTICLES OF ASSOCIATIONThe following summarises certain provisions of the Articles [A] and of the applicablelegislation (the legislation). This summary is qualified in its entirety by reference to theArticles and the Act.[A] Copies of the Articles have been previously filed with the SEC and are incorporated by reference as exhibits to thisReport. They can be found at www.shell.com. MANAGEMENT AND DIRECTORSThe Company has a single tier Board of Directors headed by a Chair, with managementled by a CEO. See “Board structure and composition” on page 77. Number of DirectorsThe Articles provide that the Company must have a minimum of three and can have amaximum of 20 Directors (disregarding alternate directors), but these restrictions can bechanged by the Board. Directors’ shareholding qualificationThe Directors are not required to hold any shares in the Company [A].[A] While the Articles do not require Directors to hold shares in the Company, the Remuneration Committee believes thatExecutive Directors should align their interests with those of shareholders by holding shares in the Company. The CEO isexpected to build up a shareholding of seven times his base salary over five years from appointment and other ExecutiveDirectors are expected to build up a
shareholding of four times their base salary over the same period. Non-executive Directors are encouraged to hold shares witha value equivalent to 100% of their fixed annual fee and maintain that holding during their tenure. All Directors hold sharesand such interests can be found in the “Directors’ Remuneration Report” on pages 104-105. Appointment of DirectorsThe Company can, by passing an ordinary resolution, appoint any willing person to be aDirector. The Board can appoint any willing person to be a Director. Any Director appointed inthis way must retire from office at the first AGM after his appointment. A Director whoretires in this way is then eligible for reappointment. At the general meeting at which a Director retires, shareholders can pass an ordinaryresolution to reappoint the Director or to appoint some other eligible person in theirplace. The only people who can be appointed as Directors at a general meeting are thefollowing: (i) Directors retiring at the meeting; (ii) anyone recommended by a resolutionof the Board; and (iii) anyone nominated by a shareholder (not being a person to benominated), where the shareholder is entitled to vote at the meeting and delivers to theCompany’s registered office, not less than six but not more than 21 days before the dayof the meeting, a letter stating that he intends to nominate another person for appointmentas a Director and written confirmation from that person that he is willing to be appointed. Retirement of DirectorsUnder the Articles, at every AGM, the following Directors must retire from office: (i) anyDirector who has been appointed by the Board since the last AGM, (ii) any Director whoheld office at the time of the two preceding AGMs and who did not retire at either ofthem, and (iii) any Director who has been in office, other than as a Director holding anexecutive position, for a continuous period of nine years or more at the date of themeeting. Notwithstanding the Articles, the Company complies with the Code which contains,among other matters, provisions regarding the composition of the Board and re-electionof the Directors. As a result, the Company’s current policy is that Directors are subject toannual re-election by shareholders. Any Director who retires at an AGM may offer themselves for reappointment by theshareholders.
Removal of DirectorsIn addition to any power to remove Directors conferred by the legislation, the Companycan pass a special resolution to remove a Director from office, even though his time inoffice has not ended, and can appoint a person to replace a Director who has beenremoved in this way by passing an ordinary resolution. Vacation of office by DirectorsAny Director automatically stops being a Director if: (i) he gives the Company a writtennotice of resignation; (ii) he gives the Company a written notice in which he offers toresign and the Board decides to accept this offer; (iii) all of the other Directors (who mustcomprise at least three people) pass a resolution or sign a written notice requiring theDirector to resign; (iv) he is or has been suffering from mental or physical ill-health andthe Board passes a resolution removing the Director from office; (v) he has missedDirectors’ meetings (whether or not an alternate director appointed by him attends thosemeetings) for a continuous period of six months without permission from the Board andthe Board passes a resolution removing the Director from office; (vi) a bankruptcy orderis made against him or he makes any arrangement or composition with his creditorsgenerally; (vii) he is prohibited from being a Director under the legislation; or (viii) heceases to be a Director under the legislation or he is removed from office under theArticles. If a Director stops being a Director for any reason, he will also automaticallycease to be a member of any committee or sub-committee of the Board.
GOVERNANCE SHELL ANNUAL REPORT AND FORM 20-F 2017 83
Alternate directorsAny Director can appoint any person (including another Director) to act in his place as analternate director. That appointment requires the approval of the Board, unless previouslyapproved by the Board or unless the appointee is another Director. Proceedings of the BoardMeetings of the Board will usually be held in the Netherlands but the Board may decidein each case when and where to have meetings and how they will be conducted. TheBoard can also adjourn its meetings. If no other quorum is fixed by the Board, twoDirectors are a quorum. A Directors’ meeting at which a quorum is present can exerciseall the powers and discretions of the Board. All or any of the Directors can take part in a meeting of the Directors by way of aconference telephone or any communication equipment which allows everybody to takepart in the meeting by being able to hear each of the other people at the meeting and bybeing able to speak to all of them at the same time. A person taking part in this way willbe treated as being present at the meeting and will be entitled to vote and be counted inthe quorum. Any such meeting will be deemed to take place where the largest group ofDirectors participating is assembled or, if there is no such group, where the chairman ofthe meeting then is. The Board can appoint any Director as chairman or as deputy chairman and can removehim from that office at any time. Matters to be decided at a Directors’ meeting will bedecided by a majority vote. If votes are equal, the chairman of the meeting has a second,casting vote. The Board will manage the Company’s business. It can use all the Company’s powersexcept where the Articles or the legislation say that powers can only be used byshareholders voting to do so at a general meeting. The Board is, however, subject to theprovisions of the legislation, the requirements of the Articles and any regulations laiddown by the shareholders by passing a special resolution at a general meeting. The Board can exercise the Company’s powers: (i) to borrow money; (ii) to guarantee;(iii) to indemnify; (iv) to mortgage or charge all or any of the Company’s undertaking,property and assets (present and future) and uncalled capital; (v) to issue debentures andother securities; and (vi) to give security, either outright or as collateral security, for anydebt, liability or obligation of the Company or of any third party. The Board must limitthe borrowings of the Company and exercise all voting and other rights or powers ofcontrol exercisable by the Company in relation to its subsidiary undertakings so as toensure that no money is borrowed if the total amount of the group’s borrowings (asdefined in the Articles) then exceeds, or would as a result of such borrowing exceed, twotimes the Company’s adjusted capital and reserves (as defined in the Articles).Shareholders may pass an ordinary resolution allowing borrowings to exceed such limit. The Board can delegate any of its powers or discretions to committees of one or morepersons. Any committee must comply with any regulations laid down by the Board.These regulations can require or allow people who are not Directors to be members of thecommittee, and can give voting rights to such people but there must be more Directors ona committee than persons who are not Directors and a resolution of the committee is onlyeffective if a majority of the members of the committee present at the time of theresolution were Directors. FeesThe total fees paid to all of the Directors (excluding any payments made under any otherprovision of the Articles) must not exceed €4,000,000 a year or any higher sum decidedon by an ordinary resolution at a general meeting. It is for the Board to decide how muchto pay each Director by way of fees.
The Board, or any committee authorised by the Board, can award extra fees to anyDirector who, in its view, performs any special or extra services for the Company. Theextra fees can take the form of salary, commission, profit-sharing or other benefits (andcan be paid partly in one way and partly in another). The Company can pay the reasonable travel, hotel and incidental expenses of eachDirector incurred in attending and returning from general meetings, meetings of theBoard or committees of the Board or any other meetings which, as a Director, he isentitled to attend. The Company will pay all other expenses properly and reasonablyincurred by each Director in connection with the Company’s business or in theperformance of his duties as a Director. The Company can also fund a Director’s orformer Director’s expenditure and that of a Director or former Director of any holdingcompany of the Company for the purposes permitted by the legislation and can doanything to enable a Director or former Director of the Company or any holdingcompany of the Company to avoid incurring such expenditure all as provided in thelegislation. Pensions and gratuitiesThe Board or any committee authorised by the Board can decide whether to providepensions, annual payments or other benefits to any Director or former Director, or anyrelation or dependant of, or person connected to, such a person. The Board can alsodecide to contribute to a scheme or fund or to pay premiums to a third party for thesepurposes. The Company can only provide pensions and other benefits to people who areor were Directors but who have not been employed by or held an office or executiveposition in the Company or any of its subsidiary undertakings or former subsidiaryundertakings or any predecessor in business of the Company or any such other companyor to relations or dependants of, or persons connected to, these Directors or formerDirectors if the shareholders approve this by passing an ordinary resolution. Directors’ interestsConflicts of interest requiring authorisation by DirectorsThe Board may, subject to the relevant quorum and voting requirements, authorise anymatter which would otherwise involve a Director breaching his duty under the legislationto avoid conflicts of interest. A Director seeking authorisation in respect of such a conflictof interest must tell the Board the nature and extent of his interest in the conflict ofinterest as soon as possible. The Director must give the Board sufficient details of therelevant matter to enable it to decide how to address the conflict of interest, together withany additional information which it may request. Any Director (including the relevant Director) may propose that the relevant Director beauthorised in relation to any matter which is the subject of such a conflict of interest. Suchproposal and any authority given by the Board shall be effected in the same way as anyother matter may be proposed to and resolved upon by the Board except that: (i) therelevant Director and any other Director with a similar interest will not count in thequorum and will not vote on a resolution giving such authority; and (ii) the conflictedDirector and any other Director with a similar interest may, if the other members of theBoard so decide, be excluded from any meeting of the Board while the conflict of interestis under consideration. Where the Board gives authority in relation to a conflict of interest or where any of thesituations described in (i) to (v) of “Other conflicts of interest” on the next page applies inrelation to a Director: (i) the Board may (whether at the relevant time or subsequently)(a) require that the relevant Director is excluded from the receipt of information, theparticipation in discussion and/or the making of decisions related to the conflict or thesituation and (b) impose upon the relevant Director such other terms for the purpose ofdealing with the conflict or situation as they think fit; (ii) the relevant Director will beobliged to conduct himself in accordance with any terms imposed by the Board inrelation to the conflict or situation; (iii) the Board may also provide that, where therelevant Director obtains (other than through his position as a Director of
GOVERNANCE SHELL ANNUAL REPORT AND FORM 20-F 2017 84

the Company) information that is confidential to a third party, the Director will not beobliged to disclose that information to the Company, or to use or apply the information inrelation to the Company’s affairs, where to do so would amount to a breach of thatconfidence; (iv) the terms of the authority shall be recorded in writing (but the authorityshall be effective whether or not the terms are so recorded); and (v) the Board mayrevoke or vary such authority at any time but this will not affect anything done by therelevant Director prior to such revocation in accordance with the terms of such authority. Other conflicts of interestIf a Director knows that he is in any way directly or indirectly interested in a proposedcontract with the Company or a contract that has been entered into by the Company, hemust tell the other Directors of the nature and extent of that interest in accordance withthe legislation. If he has so disclosed the nature and extent of his interest, a Director cando one or more of the following: (i) have any kind of interest in a contract with orinvolving the Company or another company in which the Company has an interest;(ii) hold any other office or place of profit with the Company (except that of auditor) inconjunction with his office of Director for such period and upon such terms, including asto remuneration, as the Board may decide; (iii) alone, or through a firm with which he isassociated, do paid professional work for the Company or another company in which theCompany has an interest (other than as auditor); (iv) be or become a Director or otherofficer of, or employed by or otherwise be interested in, any holding company orsubsidiary company of the Company or any other company in which the Company hasan interest; and (v) be or become a Director of any other company in which the Companydoes not have an interest and which cannot reasonably be regarded as giving rise to aconflict of interest at the time of his appointment as a Director of that other company. BenefitsA Director does not have to hand over to the Company or its shareholders any benefit hereceives or profit that he makes as a result of any matter which would otherwise involve adirect breach of his duty under the legislation to avoid conflicts of interest but which hasbeen authorised or anything allowed under (i) to (v) of “Other conflicts of interest”above, nor is any type of contract so authorised or so allowed liable to be avoided. Quorum and voting requirementsSubject to certain exceptions, a Director cannot vote or be counted in the quorum on aresolution of the Board relating to appointing that Director to a position with theCompany or a company in which the Company has an interest or the terms or thetermination of the appointment and a Director cannot vote or be counted in the quorumon a resolution of the Board about a contract in which he has an interest and, if he doesvote, his vote will not be counted. The Company can, by ordinary resolution, suspend or relax the provisions of the relevantarticle in the Articles to any extent or ratify any contract which has not been properlyauthorised in accordance with that relevant article. Directors’ indemnitiesAs far as the legislation allows this, the Company can indemnify any Director or formerDirector of the Company, of any associated company or of any affiliate against anyliability and can purchase and maintain insurance against any liability for any Director orformer Director of the Company, of any associated company or of any affiliate. ADirector or former Director of the Company, of any associated company or of anyaffiliate will not be accountable to the Company or the shareholders for any benefit soprovided. Anyone receiving such a benefit will not be disqualified from being orbecoming a Director of the Company. RIGHTS ATTACHING TO SHARESThe Company can issue shares with any rights or restrictions attached to them as long asthis is not restricted by any rights attached to existing shares. These rights or restrictionscan be decided either by an ordinary resolution passed
by the shareholders or by the Board as long as there is no conflict with any resolutionpassed by the shareholders. DividendsCurrently, only A shares and B shares are entitled to a dividend. Under the legislation, dividends are payable only out of profits available for distribution,as determined in accordance with the Act and under IFRS. Subject to the Act, if the Directors consider that the Company’s financial position justifiesthe payment of a dividend, the Company can pay a fixed or other dividend on any classof shares on the dates prescribed for the payments of those dividends and pay interimdividends on shares of any class of any amounts and on any dates and for any periodswhich it decides. Shareholders can declare dividends in accordance with the rights ofshareholders by passing an ordinary resolution, although such dividends cannot exceedthe amount recommended by the Board. Dividends are payable to persons registered as the holder(s) of shares, or to anyoneentitled in any other way, at a particular time on a particular day selected by the Board.All dividends will be declared and paid in proportions based on the amounts paid up onthe relevant shares during any period for which that dividend is paid. Any dividend or other money payable in cash relating to a share can be paid by sending acheque, warrant or similar financial instrument payable to the shareholder entitled to thedividend by post to the shareholder’s registered address. Alternatively, it can be madepayable to someone else named in a written instruction from the shareholder (or all jointshareholders) and sent by post to the address specified in that instruction. A dividend canalso be paid by inter-bank transfer or by other electronic means (including paymentthrough CREST) directly to an account with a bank or other financial institution (oranother organisation operating deposit accounts if allowed by the Company) named in awritten instruction from the person entitled to receive the payment under the Articles.Such an account must be held at an institution based in the UK, unless the share on whichthe payment is to be made is held by Euroclear Nederland and is subject to the DutchSecurities Giro Act (“Wet giraal effectenverkeer”). Alternatively, a dividend can be paidin some other way if requested in writing by a shareholder (or all joint shareholders) andagreed with the Company. The Company will not be responsible for a payment which islost or delayed. Unless the rights attached to any shares, the terms of any shares or theArticles say otherwise, a dividend or any other money payable in respect of a share canbe declared and paid in whatever currency or currencies the Board decides using anexchange rate or exchange rates selected by the Board for any currency conversionsrequired. The Board can also decide how any costs relating to the choice of currency willbe met. The Board can offer shareholders the choice to receive dividends and othermoney payable in respect of their shares in alternative currencies on such terms andconditions as the Board may prescribe from time to time. Where any dividends or otheramounts payable on a share have not been claimed, the Board can invest them or usethem in any other way for the Company’s benefit until they are claimed. The Companywill not be a trustee of the money and will not be liable to pay interest on it. If a dividendor other money has not been claimed for 12 years after being declared or becoming duefor payment, it will be forfeited and go back to the Company, unless the Board decidesotherwise. The Company expects that dividends in respect of B shares will be paid under thedividend access mechanism described below. Currently, the Articles provide that if anyamount paid by way of dividend by a subsidiary of the Company is received by thedividend access trustee on behalf of any holder of B shares and paid by the dividendaccess trustee to such holder, the entitlement of such holder of B shares to be paid anydividend declared pursuant to the Articles will be reduced by the corresponding amountthat has been paid by the dividend access trustee to such holder. If a dividend is declaredpursuant to the Articles and the entitlement of any holder of B shares to be paid his prorata share of such dividend is not fully extinguished on the
GOVERNANCE SHELL ANNUAL REPORT AND FORM 20-F 2017 85

relevant payment date by virtue of a payment made by the dividend access trustee, theCompany has a full and unconditional obligation to make payment in respect of theoutstanding part of such dividend entitlement immediately. Where amounts are paid bythe dividend access trustee in one currency and a dividend is declared by the Company inanother currency, the amounts so paid by the dividend access trustee will, for thepurposes of the comparison required by the two immediately preceding sentences, beconverted into the currency in which the Company has declared the dividend at such rateas the Board shall consider appropriate. For the purposes of the provisions referred to inthis paragraph, the amount that the dividend access trustee has paid to any holder of Bshares in respect of any particular dividend paid by a subsidiary of the Company (a“specified dividend”) will be deemed to include: (i) any amount that the dividend accesstrustee may be compelled by law to withhold; (ii) a pro rata share of any tax that thesubsidiary paying the specified dividend is obliged to withhold or to deduct from thesame; and (iii) a pro rata share of any tax that is payable by the dividend access trustee inrespect of the specified dividend. The Board can offer shareholders of ordinary shares (excluding any shareholder holdingshares as treasury shares) the right to choose to receive extra ordinary shares, which arecredited as fully paid up, instead of some or all of their cash dividend. Before the Boardcan do this, shareholders must have passed an ordinary resolution authorising the Boardto make this offer. Dividend access mechanism for B sharesGeneralA and B shares are identical, except for the dividend access mechanism, which will onlyapply to B shares. Dividends paid on A shares have a Dutch source for tax purposes andare subject to Dutch withholding tax. It is the expectation and the intention, although there can be no certainty, that holders ofB shares will receive dividends through the dividend access mechanism. Any dividendspaid on the dividend access shares will have a UK source for UK and Dutch tax purposes.There will be no Dutch withholding tax on such dividends. For further details regardingthe tax treatment of dividends paid on the A and B shares and American DepositaryShares (ADSs), refer to “Shareholder information” on pages 222-223. Description of dividend access mechanismThe “Shell” Transport and Trading Company, p.l.c., now The Shell Transport andTrading Company Limited (Shell Transport), and BG Group plc, now BG Group Limited(BG), have each issued a dividend access share to Computershare Trustees (Jersey)Limited as Trustee. Pursuant to a declaration of trust, the Trustee will hold any dividendspaid in respect of the dividend access shares on trust for the holders of B shares and willarrange for prompt disbursement of such dividends to holders of B shares. Interest andother income earned on unclaimed dividends will be for the account of Shell Transportand BG and any dividends which are unclaimed after 12 years will revert to ShellTransport and BG, as appropriate. Holders of B shares will not have any interest in eitherdividend access share and will not have any rights against Shell Transport and BG asissuers of the dividend access shares. The only assets held on trust for the benefit of theholders of B shares will be dividends paid to the Trustee in respect of the dividend accessshares. The declaration and payment of dividends on the dividend access shares will requireboard action by Shell Transport and BG (as applicable) and will be subject to anyapplicable limitations in law or in the Shell Transport or BG (as appropriate) articles ofassociation in effect. In no event will the aggregate amount of the dividend paid by ShellTransport and BG under the dividend access mechanism for a particular period exceedthe aggregate of the dividend announced by the Board of the Company on B shares inrespect of the same period (after giving effect to currency conversions).
In particular, under their respective articles of association, Shell Transport and BG areeach only able to pay a dividend on their respective dividend access share whichrepresents a proportional amount of the aggregate of any dividend announced by theCompany on the B shares in respect of the relevant period, where such proportions arecalculated by reference to, in the case of Shell Transport, the number of B shares inexistence prior to completion of the Company’s acquisition of BG (the Acquisition) and,in the case of BG, the number of B shares issued as part of the Acquisition, in each case asagainst the total number of B shares in issue immediately following completion of theAcquisition. Operation of the dividend access mechanismIf, in connection with the announcement of a dividend by the Company on B shares, theBoard of Shell Transport and/or the Board of BG elects to declare and pay a dividend ontheir respective dividend access shares to the Trustee, the holders of B shares will bebeneficially entitled to receive their share of those dividends pursuant to the declarationof trust (and arrangements will be made to ensure that the dividend is paid in the samecurrency in which they would have received a dividend from the Company). If any amount is paid by Shell Transport or BG by way of a dividend on the dividendaccess shares and paid by the Trustee to any holder of B shares, the dividend which theCompany would otherwise pay on B shares will be reduced by an amount equal to theamount paid to such holders of B shares by the Trustee. The Company will have a full and unconditional obligation, in the event that the Trusteedoes not pay an amount to holders of B shares on a cash dividend payment date (even ifthat amount has been paid to the Trustee), to pay immediately the dividend announced onB shares. The right of holders of B shares to receive distributions from the Trustee will bereduced by an amount equal to the amount of any payment actually made by theCompany on account of any dividend on B shares.
If for any reason no dividend is paid on the dividend access shares, holders of B shareswill only receive dividends from the Company directly. Any payment by the Companywill be subject to Dutch withholding tax (unless an exemption is obtained under Dutchlaw or under the provisions of an applicable tax treaty). The Dutch tax treatment of dividends paid under the dividend access mechanism has beenconfirmed by the Dutch Revenue Service in an agreement (“vaststellingsovereenkomst”)with the Company and N.V. Koninklijke Nederlandsche Petroleum Maatschappij (RoyalDutch Petroleum Company) dated October 26, 2004, as supplemented and amended byan agreement between the same parties dated April 25, 2005, and a final settlementagreement in connection with the Acquisition dated November 9, 2015. The agreementsstate, among other things, that dividend distributions on the dividend access shares byShell Transport and/or BG will not be subject to Dutch withholding tax provided that thedividend access mechanism is structured and operated substantially as set out above. The Company may not extend the dividend access mechanism to any future issuances ofB shares without prior consultation with the Dutch Revenue Service. Accordingly, the Company would not expect to issue additional B shares unlessconfirmation from the Dutch Revenue Service was obtained or the Company were todetermine that the continued operation of the dividend access mechanism wasunnecessary. Any further issue of B shares is subject to advance consultation with theDutch Revenue Service. The dividend access mechanism may be suspended or terminated at any time by theCompany’s Directors or the Directors of Shell Transport or BG, for any
GOVERNANCE SHELL ANNUAL REPORT AND FORM 20-F 2017 86

reason and without financial recompense. This might, for instance, occur in response tochanges in relevant tax legislation.The daily operations of the Trust are administered on behalf of the Company by theTrustee. Material financial information of the Trust is included in the “ConsolidatedFinancial Statements” and is therefore subject to the same disclosure controls andprocedures as Shell.
Pre-emption rightsSubject to the Act and the Listing Rules, any equity securities allotted by the Company forcash must first be offered to shareholders in proportion to their holdings. The Act and theListing Rules allow for the disapplication of pre-emption rights which may be waived bya special resolution of the shareholders, either generally or specifically. VotingCurrently, only the A and B shares have voting rights. Changing the rights attached to the sharesThe Act provides that the Articles can be amended by a special resolution. The Articles provide that, if the legislation allows this, the rights attached to any class ofshares can be changed if this is approved either in writing by shareholders holding at leastthree-quarters of the issued shares of that class by amount (excluding any shares of thatclass held as treasury shares) or by a special resolution passed at a separate meeting of therelevant shareholders. At each such separate meeting, all of the provisions of the Articlesrelating to proceedings at a general meeting apply, except that: (i) a quorum will bepresent if at least one shareholder who is entitled to vote is present in person or by proxywho owns at least one-third in amount of the issued shares of the relevant class; (ii) anyshareholder who is present in person or by proxy and entitled to vote can demand a poll;and (iii) at an adjourned meeting, one person entitled to vote and who holds shares of theclass, or his proxy, will be a quorum. These provisions are not more restrictive thanrequired by law in England. If new shares are created or issued which rank equally with any other existing shares, therights of the existing shares will not be regarded as changed or abrogated unless the termsof the existing shares expressly say otherwise. Redemption provisionsThe Company’s shares are not subject to any redemption provisions. Rights attaching to the sterling deferred sharesThe sterling deferred shares are (unlike the A and B shares) not ordinary shares and,therefore, they have different rights and restrictions. The sterling deferred shares have the following rights and restrictions: (i) on a distributionof assets of the Company among its shareholders on a winding-up, the holders of thesterling deferred shares will be entitled (such entitlement ranking in priority to the rightsof holders of ordinary shares) to receive an amount equal to the aggregate of the capitalpaid up or credited as paid up on each sterling deferred share; (ii) save as provided in (i),the holders of the sterling deferred shares will not be entitled to any participation in theprofits or assets of the Company; (iii) the holders of sterling deferred shares will not beentitled to receive notice of or to attend and/or speak or vote (whether on a show ofhands or on a poll) at general meetings of the Company; (iv) the written consent of theholders of three-quarters in nominal value of the issued sterling deferred shares or thesanction of a special resolution passed at a separate general meeting of the holders of thesterling deferred shares is required if the special rights and privileges attaching to thesterling deferred shares are to be abrogated, or adversely varied or otherwise directlyadversely affected in any way (the creation, allotment or issue of shares or securitieswhich rank in priority to or equally with the sterling deferred shares,
or of any right to call for the allotment or issue of such shares or securities, is for thesepurposes deemed not to be an abrogation or variation or to have an effect on the rightsand privileges attaching to sterling deferred shares); (v) all provisions of the Articlesrelating to general meetings of the Company will apply, with necessary modifications, toevery general meeting of the holders of the sterling deferred shares; (vi) subject to thelegislation, the Company will have the right at any time to redeem any such sterlingdeferred shares (provided that it is credited as fully paid) at a price not exceeding £1 forall the sterling deferred shares redeemed at any one time (to be paid on such date as theBoard shall select as the date of redemption to such one of the holders, if more than one,as may be selected by lot) without the requirement to give notice to the holder(s) of thesterling deferred shares; (vii) if any holder of a sterling deferred share to be redeemedfails or refuses to surrender the share certificate(s) or indemnity for such sterling deferredshare or if the holder selected by lot to receive the redemption monies fails or refuses toaccept the redemption monies payable in respect of it, such sterling deferred share will,notwithstanding the foregoing, be redeemed and cancelled by the Company and, in theevent of a failure or refusal to accept the redemption monies, the Company will retainsuch money and hold it on trust for the selected holder without interest, and, in each case,the Company will have no further obligation whatsoever to the holder of such sterlingdeferred share; and (viii) no sterling deferred share will be redeemed otherwise than outof distributable profits or the proceeds of a fresh issue of shares made for the purposes ofthe redemption or out of capital to the extent permitted by the legislation. Calls on sharesThe Board can call on shareholders to pay any money which has not yet been paid to theCompany for their shares. This includes the nominal value of the shares and any premiumwhich may be payable on those shares. The Board can also make calls on people who areentitled to shares by law. Winding-up of the CompanyIf the Company is voluntarily wound up, the liquidator can distribute to shareholders anyassets remaining after the liquidator’s fees and expenses have been paid and all sums dueto prior-ranking creditors (as defined under the laws of England) have been paid. Sinking fund provisionsThe shares are not subject to any sinking fund provision under the Articles or as a matterof the laws of England. Discriminating provisionsThere are no provisions in the Articles discriminating against a shareholder because of hisownership of a particular number of shares. Limitations on rights to own sharesThere are no limitations imposed by the Articles or the legislation on the rights to ownshares, including the right of non-residents or foreign persons to hold or vote shares,other than limitations that would generally apply to all shareholders. Transfer of sharesThere are no significant restrictions on the transfer of shares. Except as set out below, any shareholder can transfer some or all of his certificated sharesto another person. A transfer of certificated shares must be made in writing and either inthe usual standard form or in any other form approved by the Board. Except as set out below, any shareholder can transfer some or all of his CREST shares toanother person. A transfer of CREST shares must be made through CREST and mustcomply with the uncertificated securities rules.
GOVERNANCE SHELL ANNUAL REPORT AND FORM 20-F 2017 87

The Board can refuse to register the transfer of any shares which are not fully paid.Further rights to decline registration are as follows: Certificated sharesA share transfer form cannot be used to transfer more than one class of share. Each classneeds a separate form. Transfers cannot be in favour of more than four joint holders. Theshare transfer form must be properly stamped to show payment of any applicable stampduty or certified or otherwise shown to the satisfaction of the Board to be exempt fromstamp duty and must be delivered to the Company’s registered office, or any other placedecided on by the Board. The transfer form must be accompanied by the share certificaterelating to the share being transferred, unless the transfer is being made by a person towhom the Company was not required to, and did not send, a certificate. The Board canalso ask (acting reasonably) for any other evidence to show that the person wishing totransfer the share is entitled to do so and, if the share transfer form is signed by anotherperson on behalf of the person making the transfer, evidence of the authority of thatperson to do so. CREST sharesRegistration of a transfer of CREST shares can be refused in the circumstances set out inthe uncertificated securities rules. Transfers cannot be in favour of more than four jointholders. Where a share has not yet been entered on the register, the Board can recognise arenunciation by that person of his right to the share in favour of some other person. Suchrenunciation will be treated as a transfer and the Board has the same powers of refusing togive effect to such a renunciation as if it were a transfer.
Partly paid sharesThe Articles provide that, if a shareholder fails to pay the Company any amount due onhis partly paid shares, the Board can enforce the Company’s lien by selling all or any ofthe partly paid shares in any way they decide (subject to certain conditions). Change of controlThere are no provisions in the Articles that would delay, defer or prevent a change ofcontrol. Capital changesThe conditions imposed by the Articles for changes in capital are not more stringent thanthose required by the applicable laws of England. Disputes between a shareholder or ADS holder and Royal Dutch Shell plc, any subsidiary,Director or professional service providerThe Articles generally require that, except as noted below, all disputes: (i) between ashareholder in such capacity and the Company and/or its Directors, arising out of or inconnection with the Articles or otherwise; (ii) so far as permitted by law, between theCompany and any of its Directors in their capacities as such or as the Company’semployees, including all claims made by the Company or on behalf of the Companyagainst any or all of its Directors; (iii) between a shareholder in such capacity and theCompany’s professional service providers (which could include the Company’s auditors,legal counsel, bankers and ADS depositaries); and/or (iv) between the Company and itsprofessional service providers arising in connection with any claim within the scope of(iii) above, shall be exclusively and finally resolved by arbitration under the Rules ofArbitration of the International Chamber of Commerce (ICC), as amended from time totime. This would include all disputes arising under UK, Dutch or US law (includingsecurities laws), or under any other law, between parties covered by the arbitrationprovision. Accordingly, the ability of shareholders to obtain monetary or other relief,including in respect of securities law claims, may be determined in accordance with theseprovisions, and the ability of shareholders to obtain monetary or other relief maytherefore be limited and their cost of seeking and obtaining recoveries in a dispute maybe higher than otherwise would be the case.
The tribunal shall consist of three arbitrators to be appointed in accordance with the ICCrules. The chairman of the tribunal must have at least 20 years’ experience as a lawyerqualified to practise in a common-law jurisdiction which is within the Commonwealth (asconstituted on May 12, 2005) and each other arbitrator must have at least 20 years’experience as a qualified lawyer. The place of arbitration must be The Hague, theNetherlands; and the language of the arbitration must be English. Pursuant to the exclusive jurisdiction provision in the Articles, if a court or othercompetent authority in any jurisdiction determines that the arbitration requirementdescribed above is invalid or unenforceable in relation to any particular dispute in thatjurisdiction, then that dispute may only be brought in the courts of England and Wales, asis the case with any derivative claim brought under the Act. The governing law of theArticles is the substantive law of England. Disputes relating to the Company’s failure or alleged failure to pay all or part of adividend which has been announced and which has fallen due for payment will not besubject to the arbitration and exclusive jurisdiction provisions of the Articles. Anyderivative claim brought under the Act will not be subject to the arbitration provisions ofthe Articles. Pursuant to the relevant depositary agreement, each holder of ADSs is bound by thearbitration and exclusive jurisdiction provisions of the Articles as described in this sectionas if that holder were a shareholder. GENERAL MEETINGSUnder the applicable laws of England, the Company is required in each year to hold anAGM of shareholders in addition to any other meeting of shareholders that may be held.Each AGM must be held in the period six months from the date following the Company’saccounting reference date. Additionally, shareholders may submit resolutions inaccordance with Section 338 of the Act. Directors have the power to convene a general meeting of shareholders at any time. Inaddition, Directors are required to call a general meeting once requests to do so have beenreceived by the Company from shareholders representing at least 5% of such paid-upcapital of the Company as carries voting rights at general meetings of the Company(excluding any paid-up capital held as treasury shares) pursuant to Section 303 of theAct. A request for a general meeting must state the general nature of the business to bedealt with at the meeting and must be authenticated by the requesting shareholders. IfDirectors fail to call such a meeting within 21 days from receipt of such requests, and ona date not more than 28 days after the date of the notice convening the meeting, theshareholders that requested the general meeting, or any of them representing more thanhalf of the total voting rights of all shareholders that requested the meeting, maythemselves convene a general meeting which must be called for a date not more thanthree months after the date upon which the Directors became subject to the requirement tocall a general meeting. Any such meeting must be convened in the same manner, asnearly as possible, as that in which meetings are required to be convened by the Directorsof the Company. Under the Act, the Company is required to give at least 21 clear days’ notice of any AGMor, except where the conditions in Section 307A of the Act apply, any other generalmeeting of the Company. In addition, the Company complies with the Code whichcurrently states that notices of AGMs should be sent to shareholders at least 20 workingdays before the meeting. The Articles require that, in addition to any requirements under the legislation, the noticefor any general meeting must state where the meeting is to be held (the principal meetingplace) and the location of any satellite meeting place, which shall be identified as such inthe notice as well as details of any arrangements made for those persons not entitled toattend a general meeting to be able to view and hear the proceedings (making it clear thatparticipation in those arrangements will not amount to attendance at the meeting to whichthe notice relates). At the same time that notice is given for any general meeting, anannouncement of the date, time and place of that meeting will, if practical, be publishedin a national newspaper in the Netherlands.
GOVERNANCE SHELL ANNUAL REPORT AND FORM 20-F 2017 88

A shareholder is entitled to appoint a proxy (who is not required to be anothershareholder) to represent and vote on behalf of the shareholder at any general meeting ofshareholders, including the AGM, if a duly completed form of proxy has been receivedby the Company within the relevant deadlines (in general, where a poll is not demanded,48 hours (or such shorter time as the Board decides) before the meeting). Before a general meeting starts to do business, there must be a quorum present. Save as inrelation to adjourned meetings, a quorum for all purposes is two people who are entitledto vote. They can be shareholders who are personally present, proxies for shareholders,or a combination of both. If a quorum is not present, a chairman of the meeting can stillbe chosen and this will not be treated as part of the business of the meeting. If a quorum is not present within five minutes of the time fixed for a general meeting tostart or within any longer period not exceeding one hour which the chairman of themeeting can decide, or if a quorum ceases to be present during a general meeting: (i) ifthe meeting was called by shareholders, it will be cancelled; (ii) any other meeting will beadjourned to a day (being not less than 10 days later, excluding the day on which it isadjourned and the day for which it is reconvened) with the time and place decided uponby the chairman of the meeting; and (iii) one shareholder present in person or by proxyand entitled to vote will constitute a quorum at any such adjourned general meeting andany notice of such an adjourned meeting will say this. Notice of cancellation of a proxy’s right to vote must be received at the Company’sregistered office (or other place specified by the Company for receipt) not later than thelast time at which a proxy form should have been received to be valid for use at themeeting or on the holding of the poll at which the vote was given or the poll taken. DEEMED DELIVERY OF DOCUMENTSUnder the Articles, if any notice, document or other information is given, sent or suppliedby the Company by inland post, it is treated as being received the day after it was postedif first class post (or a service similar to first class post) was used, or 72 hours after it wasposted if first class post (or a service similar to first class post) was not used. If a notice ordocument is sent by the Company by airmail, it is treated as being received 72 hours afterit was posted. Any notice, document or other information left at a shareholder’s registeredaddress or a postal address notified to the Company in accordance with the Articles by ashareholder or a person entitled to a share by law is treated as being received on the dayon which it was left. THRESHOLD FOR DISCLOSURE OF SHARE OWNERSHIPThe Disclosure Guidance and Transparency Rules of the UK’s Financial ConductAuthority impose an obligation on persons [A] to notify the Company of the percentageof voting rights held as a shareholder, or through the direct or indirect holding offinancial instruments, if the percentage of voting rights held in the Company reaches,exceeds or falls below 3% or any 1% threshold above 3%.[A] For this purpose “persons” includes companies, natural persons, legal persons and partnerships. As noted in the Articles, Section 793 of the Act governs the Company’s right toinvestigate who has an interest in its shares. Under that section, a public company maygive notice to any person it knows or has reasonable cause to believe is, or was at anytime in the preceding three years, interested in its shares in order to obtain certaininformation about that interest. The Articles provide that, when a person receives a statutory notice, he has 14 days tocomply with it. If he does not do so or if he makes a statement in response to the noticewhich is false or inadequate in some important way, the Company can decide to restrictthe rights relating to the identified shares and send out a further notice to the shareholder,known as a restriction notice, which will take effect when delivered. The restriction noticewill state that the identified shares no longer give the shareholder any right to attend orvote either personally or by proxy at a shareholders’ meeting or to exercise any right inrelation to shareholders’ meetings. Where the identified shares make
up 0.25% or more (in amount or in number) of the existing shares of a class at the date ofdelivery of the restriction notice, the restriction notice can also contain the followingfurther restrictions: (i) the Board can withhold any dividend or part of a dividend(including scrip dividend) or other money which would otherwise be payable in respectof the identified shares without any liability to pay interest when such money is finallypaid to the shareholder; and (ii) the Board can refuse to register a transfer of any of theidentified shares which are certificated shares unless the Board is satisfied that they havebeen sold outright to an independent third party (as specified in the Articles). Once arestriction notice has been given, the Board is free to cancel it or exclude any shares fromit at any time the Board thinks fit. In addition, the Board must cancel the restriction noticewithin seven days of being satisfied that all of the information requested in the statutorynotice has been given. Also, where any of the identified shares are sold and the Board issatisfied that they were sold outright to an independent third party, it must cancel therestriction notice within seven days of receipt of notification of the sale. The Articles donot restrict in any way the provision of the legislation which applies to failures to complywith notices under the legislation. The UK City Code on Takeovers and Mergers (the Takeover Code) imposes disclosureobligations on parties subject to the Takeover Code’s disclosure regime. The TakeoverCode requires that an opening position disclosure be made by: (i) an offeror companyafter the announcement that first identifies it as an offeror and after the announcementthat first identifies a competing securities exchange offeror; and (ii) an offeree companyafter the commencement of an offer period and, if later, after the announcement that firstidentifies any securities exchange offeror. An opening position disclosure must be madeby any person that is interested in 1% or more of any class of relevant securities of theofferee company or any securities exchange offeror. The Takeover Code also requiresany person who is, or becomes, interested in 1% or more of any class of relevantsecurities of an offeree company or any securities exchange offeror to make a dealingdisclosure if the person deals in any relevant securities of the offeree company or anysecurities exchange offeror during an offer period. Where two or more persons acttogether pursuant to an agreement or understanding, whether formal or informal, toacquire or control an interest in relevant securities, they will normally be deemed to be asingle person for the purpose of the relevant provisions of the Takeover Code. Rule 13d-1 of the US Securities Exchange Act of 1934 requires that a person or groupthat acquires beneficial ownership of more than 5% of equity securities registered underthe US Securities Exchange Act, and that is not eligible to file a short-form report,disclose such information to the SEC within 10 days after the acquisition. FURTHER INFORMATIONThe following information can be found at www.shell.com/investor: ■ the terms of reference of the Audit Committee, Corporate and Social Responsibility
Committee, Nomination and Succession Committee and Remuneration Committee(these documents explain the Committees’ roles and the authority the Board delegatesto them);
■ the full list of matters reserved to the Board for decision;■ Shell General Business Principles;■ Shell Code of Conduct;■ Code of Ethics for Executive Directors and Senior Financial Officers; and■ Articles of Association. Signed on behalf of the Board /s/ Linda M. Szymanski Linda M. SzymanskiCompany SecretaryMarch 14, 2018
GOVERNANCE SHELL ANNUAL REPORT AND FORM 20-F 2017 89

Dear Shareholders, I am pleased to present our annual Audit Committee Report which provides an insightinto our work, the issues handled and the focus of the Audit Committee’s (AC)deliberations during 2017. The AC assists the Board in fulfilling its oversightresponsibilities in areas such as the integrity of financial reporting, the effectiveness of therisk management and internal control system and related governance and compliancematters. We are also responsible for making a recommendation to the Board on theappointment or reappointment of the external auditor. At our meetings in 2017 we were briefed on and discussed a variety of topics includingspecial topics such as: key control matters relating to trading and supply; information riskmanagement; risks faced by Shell in the context of a changing tax landscape; thegovernance and management of retirement benefit arrangements; and the managementand governance of non-Shell-operated joint ventures. We received briefings from theChief Internal Auditor on the effectiveness of Shell’s risk management and internalcontrol system and on outcomes of significant audits and notable control weaknesses,including potential improvements and mitigating actions agreed with management.Specific attention was given to topics that we considered particularly significant,including issues and judgements relating to Shell’s 2017 Consolidated FinancialStatements, as discussed in more detail later in this report together with how we addressedthem. Shell’s independence policy regarding the provision of services by the external auditorwas updated with effect from January 1, 2017, in order to take account of changes inrelated standards and regulatory requirements, and the independence of the externalauditor was carefully monitored in line with this policy. We again carefully considered the appropriateness of the viability statement, includingwhether the three-year period selected by the Board for the review of Shell’s prospects, inline with the operating plan, remained suitable. We concluded that this remained the caseand was in line with prevailing market practice. The factors which we further consideredin support of the viability statement are discussed later in this report. As with the Board’s annual performance evaluation for 2017, the AC’s performanceevaluation was also facilitated by Lintstock Limited, a London-based corporate advisoryfirm. Each AC member completed a confidential questionnaire related to the AC’sperformance via a secure web-based system and our discussion of the outcomes wasassisted by a performance evaluation report produced by Lintstock. We concluded thatthe AC was effective and able to fulfil its role in accordance with its terms of reference,which can be found at www.shell.com/investor. As part of the evaluation the ACdiscussed the priorities, in addition to the standing items, for its 2018 agenda, including avisit to the trading and supply office in London and further discussions on Shell’sinsurance arrangements, IFRS 16 implementation, regulatory developments andinformation risk management. Finally, Guy Elliott and Gerard Kleisterlee stood down from the AC in March andNovember 2017, respectively. I would like to thank each of them for their outstandingcontributions to the Committee. We were delighted to welcome Gerrit Zalm and RobertoSetubal with effect from March and October, respectively; their respective expertise willbe valuable to the work of the committee. Euleen GohChair of the Audit CommitteeMarch 14, 2018
COMPOSITION OF THE AUDIT COMMITTEEDuring 2017, the members of the AC were Euleen Goh (Chair of the AC), Linda G.Stuntz, Guy Elliott (who stood down as a member on March 8, 2017), Gerard Kleisterlee(who stood down as a member on November 1, 2017), Gerrit Zalm (appointed as amember with effect from March 8, 2017) and Roberto Setubal (appointed as a memberwith effect from October 1, 2017), all of whom are financially literate, independent Non-executive Directors. In respect of the year ended December 31, 2017, for the purposes ofthe UK Corporate Governance Code, Euleen Goh qualifies as a person with “recent andrelevant financial experience” and competence in accounting and, for the purposes of USsecurities laws, an “audit committee financial expert”. The AC had six meetings duringthe year; the AC members’ attendances are shown on page 79. The experience of the ACmembers outlined on pages 69-71 demonstrates that the AC as a whole has competencerelevant to the sector in which Shell operates. The AC members have gained furtherknowledge and experience of the sector as a result of their Board membership andthrough various site visits since their respective appointments. RESPONSIBILITIESThe key responsibilities of the AC are to assist the Board in fulfilling its oversightresponsibilities in relation to: financial reporting; the effectiveness of the system of riskmanagement and internal control; compliance with applicable external legal andregulatory requirements; monitoring the qualifications, expertise, resources andindependence of both the internal and external auditors; and assessing the internal andexternal auditors’ performance and effectiveness each year. The AC keeps the Boardinformed of its activities and recommendations. Where the AC is not satisfied with, or if itconsiders that action or improvement is required concerning any aspect of financialreporting, risk management and internal control, compliance or audit-related activities, itpromptly reports these concerns to the Board. ACTIVITIESThe AC covers a variety of topics in its meetings. These include both standing items thatthe AC considers as a matter of course, typically in relation to the quarterly unauditedfinancial statements, control issues, accounting policies and judgements and reportingmatters, and a range of topics relevant to Shell’s control framework. The AC invites theChief Executive Officer, the Chief Financial Officer, the Legal Director, the Chief InternalAuditor, the Executive Vice President Controller, the Vice President Accounting andReporting and the external auditor to attend each meeting. The Chair of the Board alsoregularly attends the meetings as an observer. Other members of management attendwhen requested. At every meeting, the AC holds private sessions separately with theexternal auditor and the Chief Internal Auditor without members of management, exceptfor the Legal Director, being present. During 2017, the AC received comprehensive reports from management and the internaland external auditors. In particular, it discussed with the Chief Financial Officer, theExecutive Vice President Controller, the Vice President Accounting and Reporting andthe external auditor issues that arose on accounting policies, practices and reporting, andreviewed aggregated whistle-blowing reports, internal audit reports and analyses offinancial reporting matters. The AC assessed the robustness of information riskmanagement, including the monitoring of access controls, use of lightly managedapplications, and the management of cyber threats and information security incidentsgenerally. To inform its assessment, the AC received an update on the status ofinformation risk management from the Chief Information Officer to receive assurance onthe appropriate levels of controls and activities undertaken. The AC also reviewedassurances for: proved oil and gas reserves; discount rates used for financial reporting,particularly with respect to impairment testing; policy and procedures for the use of non-GAAP measures/alternative performance measures; changes related to the joint ventureNederlandse Aardolie Maatschappij B.V.’s earthquake-related
Audit Committee Report
GOVERNANCE SHELL ANNUAL REPORT AND FORM 20-F 2017 90

provisions, considering the latest hazard and risk assessment study; and the effectivenessof financial controls. The AC discussed with the Chief Ethics and Compliance Officer herannual report on compliance matters, including regulatory developments and compliancerisks. The AC discussed with management the Company’s responses to matters raised by the UKFinancial Reporting Council’s (FRC) Corporate Reporting Review team as a result of theFRC’s thematic review of companies’ disclosures of significant accounting judgementsand sources of estimation uncertainty. The responses, including how Shell is proposing touse the review to improve its disclosures, were welcomed by the FRC and enabled itsenquiries to be closed out. We note the inherent limitations of the FRC’s review. The FRCstated that the scope of its review was based on the Company’s 2016 Annual Report andAccounts and was conducted by staff of the FRC who have an understanding of therelevant legal and accounting framework. The review did not benefit from detailedknowledge of the Company’s business or an understanding of the underlying transactionsentered into. The FRC’s review only covered the specific disclosures relating to thisthematic review and did not provide assurance that the Company’s 2016 Annual Reportand Accounts are correct in all material respects. The AC also discussed the Company’s Annual Report and Accounts, half-year report andquarterly unaudited financial statements with management and the external auditor. TheAC reviewed, discussed and approved the internal audit function’s annual audit plan. Italso reviewed the internal audit’s performance self-assessment report focusing on impactof the audits, people, audit quality and compliance, and operational excellence. The ACassessed the performance of the internal audit function as effective. The AC alsoreviewed, considered and approved the external audit plan (including the audit scope andmateriality levels) and related remuneration to ensure that the level of fees would allow aneffective and high-quality audit to be conducted by the external auditor. In addition to the items discussed under significant issues on page 92, the AC alsorequested reports on matters that it deemed appropriate, for example: accounting forretirement benefits; the impact of new accounting standards not yet adopted (IFRS 9Financial Instruments, IFRS 15 Revenue from Contracts with Customers and IFRS 16Leases); ethics and compliance; litigation matters, including investigations by authoritiesin various countries relating to Shell’s investment in Nigerian oil block OPL 245 and the2011 settlement of litigation pertaining to that block (see “Corporate governance” onpage 78 and Note 25 to the “Consolidated Financial Statements” on pages 175-176); taxtransparency; and new and impending regulatory requirements.
As requested by the Board, the AC advised the Board of its view that the Annual Reportincluding the financial statements for the year ended December 31, 2017, taken as awhole, is fair, balanced and understandable and provides the information necessary forshareholders to assess Shell’s position and performance, business model and strategy (seethe “Directors’ Report” on pages 73-74). To arrive at this conclusion, the AC criticallyassessed drafts of the Annual Report including the financial statements and discussed withmanagement the process undertaken to ensure that these requirements were met. Thisprocess included: verifying that the contents of the Annual Report are consistent with theinformation shared with the Board and management during the year to support theirassessment of Shell’s position and performance; ensuring that consistent materialitythresholds are applied for favourable and unfavourable items; considering commentsfrom the external auditor; and receiving assurance from the Executive Committee (EC).The AC further reviewed and considered the Directors’ half-year and full-year statementswith respect to the going concern basis of accounting. As noted in the viability statement,the Board also reviews the strategic plan which takes account of longer-term forecasts.Factors considered included: external environment factors such as oil and gas prices; thefinancial framework; Shell’s business portfolio developments; and the project funnel tosupport future growth. The AC considered the viability statement and supported itsinclusion in the “Directors’ Report” on page 74. SYSTEM OF RISK MANAGEMENT AND INTERNAL CONTROLThe AC reviewed, discussed and briefed the Board on the regular reports on risks,controls and assurance, including the annual assessment of the system of risk managementand internal control, in order to monitor the effectiveness of the procedures for internalcontrol over financial reporting, compliance and operational matters. This included theCompany’s evaluation of the internal control over financial reporting as required underSection 404 of the Sarbanes-Oxley Act. SIGNIFICANT ISSUESThe AC assessed the following significant issues, including those related to Shell’s 2017Consolidated Financial Statements. The AC was satisfied with how each of the issuesbelow was addressed. As part of this assessment, the AC received reports, requested andreceived clarification from management, and sought assurance and received input fromthe internal and external auditors.
GOVERNANCE SHELL ANNUAL REPORT AND FORM 20-F 2017 91

Significant issuesSubject Issue How the AC addressed the issueDISPOSALSSee Notes 5 and 29 to the“Consolidated Financial Statements” onpages 151 and 178.
As part of the disposal programme for 2016-2018, severalsignificant disposals were completed in 2017. Prior to expecteddisposal, judgement is required in determining whether a sale ishighly probable and, if this is the case, the accounting consequenceis to change the status to asset held for sale, which may result in animpairment test.Judgement may also be required in the accounting on disposal, forexample in estimating the amount of any liabilities which have beenretained by Shell.The disposal of oil sands and in-situ assets in Canada resulted inimpairment and redundancy and restructuring charges.The separation of assets, liabilities and businesses of the MotivaEnterprises LLC (Motiva) joint venture was a complex transactionaccounted for as a disposal of Shell’s 50% interest in Motiva and asubsequent business acquisition.
The AC examined the accounting for assets held for sale andconsequential disposals, including: the sale of shares in Woodside inAustralia; Upstream assets in the UK North Sea, Ireland and Gabon;SADAF (the petrochemicals joint venture in Al Jubail, Saudi Arabia);as well as a number of smaller disposals. Particular attention was givento the accounting for any retained obligations, the assumptions used indetermining any resulting charges and the tax treatment.With respect to the disposal of oil sands and in-situ assets in Canada,the AC reviewed the accounting for the charges as well as of theutilisation of proceeds to repay inter-company loans.The AC scrutinised the accounting for the separation of the Motivajoint venture. The AC received information on the purchase priceallocation process and supported management’s conclusions on theamount of goodwill recognised as part of the transaction.
IMPAIRMENTSSee Notes 2 and 8 to the “ConsolidatedFinancial Statements” on pages 142-148 and 153-155.
The carrying amount of an asset should be tested for impairmentwhen there is a change in circumstances such as a reduction inperformance, other than short-term, or being classified as held forsale.
Although oil and gas prices were on average higher in 2017 than in2016, management decided to change Shell’s long-term priceforecasts downwards, following the downward revision of the short-term price outlook in 2016. The downward revision in forecasts wasa trigger for impairment testing.
The oil and gas price outlook was reviewed against marketdevelopments and benchmarks, and the potential impact of certainprice sensitivities were considered. The relevant discount rates utilisedwere also reviewed.
The AC reviewed the impairment testing of various assets and theimpairment charges in respect of certain Integrated Gas, Upstream andDownstream assets which were mainly triggered by asset disposals andthe changes in Shell’s oil and gas price outlook.
TAXATIONSee Notes 2 and 16 to the“Consolidated Financial Statements” onpages 142-148 and 160-162
The determination of tax assets and liabilities requires the applicationof judgement as to the ultimate outcome, which can change overtime depending on facts and circumstances. In particular, therecognition of deferred tax assets requires management to makeassumptions regarding future profitability and is therefore inherentlyuncertain.
The AC reviewed management updates and external auditorassessments on certain tax matters. The AC discussed the recoverabilityof deferred tax assets, particularly as part of the 2017 disposals, andaccepted the resulting assessments of the deferred tax positions. TheAC also considered the impact on the financial results arising from theUS tax law reform enacted at the end of 2017.
RECOVERABILITY OFGOVERNMENT RECEIVABLESSee Notes 2 and 11 to the“Consolidated Financial Statements” onpages 142-148 and 156.
Updates were provided to the AC on the agreements reached inrelation to material government receivables, notably in Egypt andNigeria. The receivables were in respect of various contestedexpenditures and associated interest, tax, royalty and cost recoverydisputes.
The AC reviewed and accepted management assessments of therecoverability of the material receivables.
DEPRECIATION, DEPLETION ANDAMORTISATIONSee Notes 2 and 8 to the “ConsolidatedFinancial Statements” on pages 142-148 and 153-155.
Upstream production assets are generally depreciated on a unit-of-production basis over proved developed reserves, which arecalculated in accordance with requirements based on yearly averageprices. In the current price environment, it was considered necessaryto apply other approaches for certain assets, in order that the periodicdepreciation charges more appropriately reflect the expectedutilisation of those assets.
Similar to the review carried out in 2016, the AC reviewed thejustification to use alternatives to determine the reserves base appliedin calculating unit-of-production depreciation for certain Upstreamassets, such as using management’s expectations of future oil and gasprices rather than yearly average prices. The AC accepted that thisprovides a more appropriate phasing of periodic depreciation charges.
DECOMMISSIONING ANDRESTORATION PROVISIONSSee Note 18 to the “ConsolidatedFinancial Statements” on page 166.
Management undertook a review of the methodology used tocalculate decommissioning and restoration provisions and confirmedthat it continues to be appropriate. It provided the AC with theoutcome of this review, including insights into alternativemethodologies.
The AC reviewed and accepted the methodology to arrive at thedecommissioning and restoration provisions.
IT CONTROL FRAMEWORK
Management has addressed improvements to the informationtechnology (IT) control framework. Additional attention wasprovided to the further migration of BG systems, standardisation ofIT processes and user access management.
The AC scrutinised actions taken to improve the IT controls, anddiscussed the challenges with management. The AC requested andwere provided with additional information from the internal andexternal auditors on IT controls.
CYBER-SECURITY Information on Shell’s management of cyber-security risks waspresented to the AC.
The AC discussed the measures in place to mitigate against these riskswith the Chief Information Officer.
GOVERNANCE SHELL ANNUAL REPORT AND FORM 20-F 2017 92

INTERNAL AUDITORThe internal audit function is an independent and objective assurance function whichaims to improve Shell’s overall control framework. The internal audit function assists inthe maintenance of a systematic and disciplined approach to evaluate and improve thedesign and effectiveness of Shell’s risk management, control and governance processes.The primary role of the internal audit function, through its assurance and investigationactivities, is to safeguard value by protecting Shell’s assets, reputation and sustainability inrelation to the organisation's defined goals and objectives. The AC defines theresponsibility and scope of the internal audit function and approves its annual plan. The Chief Internal Auditor periodically assesses whether the purpose, authority, andresponsibility of the internal audit function continue to enable it to accomplish itsobjectives. The result of this periodic assessment is communicated to the EC and AC. TheChief Internal Auditor maintains an internal quality assurance and improvementprogramme, covering all aspects of the internal audit activities, to evaluate theconformance of these activities with the standards of the Institute of Internal Auditors.The programme also assesses the efficiency and effectiveness of the internal auditactivities and identifies opportunities for improvement. The result of this annualassessment is communicated to the EC and AC, and includes a reconfirmation to the ACof the continued validity of the charter of the internal audit function, or it proposes anupdate. At least every five years, the effectiveness and quality of the internal auditfunction is assessed externally and the report shared with the AC. The next externalassessment is due to be conducted in 2018. EXTERNAL AUDITORAt the Annual General Meeting (AGM) in May 2016, the tender process [A] for theappointment of the external auditor for the financial year 2016, which had started in mid-2014, was concluded by shareholder approval for the appointment of Ernst & YoungLLP (EY) as the Company’s external auditor for the year ending December 31, 2016.This approval ratified the appointment of EY by the Board in April 2016 to fill the casualvacancy created by the resignation of PricewaterhouseCoopers LLP following thecompletion of its audit of the Company’s 2015 financial statements. The tender wascarried out in compliance with The Statutory Audit Services for Large Companies MarketInvestigation (Mandatory Use of Competitive Tender Processes and Audit CommitteeResponsibilities) Order 2014 effective January 1, 2015, as issued by the Competition &Markets Authority in the UK.[A] In October 2015, Shell published a disclosure on its website providing a detailed overview of the auditor tender process,which can be found on www.shell.com/investor. At the AGM in May 2017, a resolution to reappoint EY as external auditor until theconclusion of the next AGM was approved by shareholders. There are no current plans toretender the appointment. The current external audit partner is Allister Wilson, who hasheld this position since EY’s initial appointment as external auditor for 2016. During 2017, the Audit Quality Review (AQR) team of the FRC conducted a review ofEY’s audit of Shell’s Consolidated Financial Statements for the year ended December 31,2016. In December 2017, the AQR team provided their final report to the Chair of theAC. The AC is pleased to note that none of the AQR team’s findings were considered tobe of sufficient significance to be included in the AQR team’s report. Additionally, theAQR team’s report noted two particular areas where they considered EY’s audit work tobe of a high standard, as well as two specific examples of good audit practice. The ACwelcomes the positive outcome of this regulatory review, particularly given the fact thatthis was EY’s first audit of Shell. The AC evaluated the effectiveness of EY and theexternal audit process in its second year as auditor, taking into account the results of Shellmanagement’s internal survey relating to EY’s performance over the financial year 2017as well as views and recommendations from management and the Chief Internal Auditorand its own experiences with the external auditor. Key criteria of the evaluation
included: professionalism in areas including competence, integrity and objectivity;efficiency, covering aspects such as service level, cost efficiency and innovation in theaudit process; thought leadership and value added; and compliance with relevantlegislative, regulatory and professional requirements. The AC concluded that EY hadperformed effectively. Following due consideration, the AC will recommend to the Board to propose to the 2018AGM that EY be reappointed as the external auditor of the Company for the year endingDecember 31, 2018. There are no contractual obligations that restrict the AC’s ability tomake such a recommendation. As required under UK and US auditing standards, the AC received a letter from EYconfirming its independence. EY presented its views on the Annual Report including the financial statements for theyear ended December 31, 2017, to the AC and to the Board. NON-AUDIT SERVICESThe AC updated its independence policy in respect of the provision of services by theexternal auditor with effect from January 1, 2017, to accommodate changes in relatedstandard and regulatory requirements. This policy, designed to safeguard auditorobjectivity and independence, includes rules relating to the provision of audit services,audit-related services and other non-audit services, and stipulates which services requirespecific prior approval by the AC. The policy also defines prohibited services that are not to be provided by the auditor asthese represent a risk to external auditor independence. Prohibited services are any thatrelate to management decision taking or any other service that would compromise auditorindependence or the perception thereof. These prohibited services include all serviceslisted as prohibited in the UK and US auditor independence rules. For certain services that are not prohibited, because of the knowledge and experience ofthe external auditor and/or for reasons of confidentiality, it can be more efficient orprudent to engage the external auditor rather than another party. This is particularly thecase in relation to audit-related assurance services that are closely connected to the auditfunction where the external auditor has the benefit of experience gained from workalready performed as part of the audit. Under the policy, the AC will only approve services to be carried out by the externalauditor or its affiliates where such services do not present a conflict of interest risk in factor in appearance. The AC reviews quarterly reports from management on the audit andnon-audit services reported in accordance with the policy or for which specific priorapproval from the AC is being sought. To the extent that the fee value of an additionalaudit service contract does not individually exceed $500,000, then no prior approval ofthe AC is required. All non-audit services where the fee for each individual contractexceeds $50,000, including audit-related services, require individual prior approval bythe AC. In each case where the audit or non-audit service contract does not exceed therelevant threshold, the matter is subsequently reported to the next quarterly AC meeting. For UK reporting purposes, the scope of the non-audit services (those that are notprohibited) contracted with the external auditor in 2017 consisted mainly of interimreviews and other audit-related assurance services and the associated compensationamounted to 9% of total auditor’s remuneration. FEESNote 28 to the “Consolidated Financial Statements” on page 177 provides a specificationof the auditor’s remuneration.
GOVERNANCE SHELL ANNUAL REPORT AND FORM 20-F 2017 93

PRINCIPLESThe principles underpinning the Remuneration Committee’s approach to executiveremuneration serve as the foundation for everything we do, and are listed below. ■ Alignment with Shell’s strategy: the Executive Directors’ compensation package should
be strongly linked to the achievement of stretching targets that are seen as indicators ofthe execution of Shell’s strategy.
■ Pay for performance: the majority of the Executive Directors’ compensation (excludingbenefits and pensions) should be linked directly to Shell’s performance throughvariable pay instruments.
■ Competitiveness: remuneration levels should be determined by reference internallyagainst Shell’s Senior Management and externally against companies of comparablesize, complexity and global scope.
■ Long-term creation of shareholder value: Executive Directors should align theirinterests with those of shareholders by holding shares in Royal Dutch Shell plc (theCompany).
■ Consistency: the remuneration structure for Executive Directors should generally beconsistent with the remuneration structure for Shell’s Senior Management. Thisconsistency builds a culture of alignment with Shell’s purpose and a common approachto sharing in Shell’s success.
■ Compliance: decisions should be made in the context of the Shell General BusinessPrinciples and REMCO should ensure compliance with applicable laws and corporategovernance requirements when designing and implementing policies and plans.
■ Risk assessment: the remuneration structures and rewards should meet risk-assessmenttests to ensure that shareholder interests are safeguarded and that inappropriate actionsare avoided.
STATEMENT BY THE CHAIR OF THE REMUNERATION COMMITTEE Dear Shareholders, As Chair of REMCO, I am pleased to present the Directors’ Remuneration Report for theyear ended December 31, 2017. It sets out how we have implemented the policy that wasapproved by shareholders at the 2017 Annual General Meeting (AGM), in accordancewith the principles above. It was gratifying to note 92% of votes were cast in favour ofthe new policy. Your input, and voting outcomes in recent years, suggest that our policyand approach are appropriate. Since the AGM, much of the Committee’s work hascentred on overseeing the implementation of the policy and monitoring its performance. STRATEGIC AMBITION AND LINK TO REMUNERATIONAs REMCO, we believe that the direction of a company should be determined by firstagreeing on a strategic ambition and then setting a remuneration policy that aligns withdelivering on that ambition. To ensure alignment with Shell’s intent to be a world-classinvestment, a number of key changes were made with effect from January 1, 2017. Thisincluded (i) FCF, the sum of cash flow from operating activities and cash flow frominvesting activities, replacing EPS as a measure in the Long-term Incentive Plan, to reflectShell’s focus on strengthening its balance sheet; (ii) the re-balancing of operationalexcellence measures in the annual bonus scorecard to reflect Shell’s strategic themes; and(iii) the introduction of metrics for greenhouse gas management in the scorecard. We alsomoved to embed the energy transition into the CEO’s personal performance targets. The LTIP measures support the strategic intent to deliver competitive returns on capitalemployed and enhance FCF, while retaining total shareholder return (TSR) as animportant underpinning. We feel that it is too early to start including long-term energytransition metrics in remuneration in a meaningful way, not least because the NewEnergies business is not yet at scale. Shell’s total capital employed was $283 billion at theend of 2017. It will take time for our New Energies business to develop into a profitableand sizable
business for Shell. It is therefore included in the CEO’s individual performance targets,rather than Shell-wide incentives. As this new business evolves and matures, we may see itreflected in more specific performance measures. In my statement last year, I shared with you that FCF would initially be measured on anabsolute basis in the LTIP as, following the BG acquisition, Shell has a specific short-termpriority to restructure the recently enlarged portfolio, deliver a $30 billion divestmentprogramme and reduce net debt. I am pleased to see the focus on absolute FCFperformance and the good progress made with the programme and the debt reduction. Aswe have not completed the divestment programme, we have concluded that we willmaintain FCF on an absolute basis for the 2018 LTIP award. Shell’s strategy also underlines the importance of LNG, and, consequently, the weightingof the LNG measure in the scorecard was raised when the measures were re-balanced. Our discussions with you around what are appropriate GHG targets for a company to set,how to drive internal improvements, and how to inform and report to externalstakeholders on GHG-related matters, are evolving as understanding and methodologiesmature. We believe it is important to have measures that are clear and simple to explainand understand. In 2017, the GHG scorecard measures focused on three specific businessareas: refining and chemical plants in our Downstream business and flaring in ourIntegrated Gas and Upstream businesses, which covered approximately 60% of our directand energy indirect operated emissions. For 2018, the GHG metrics will evolve and coverclose to 90% of Shell’s operated portfolio emissions. This operational focus on GHGemissions intensity in the short term will help to ensure the continued portfolio resilienceto climate-related impacts as we prepare for a longer-term energy transition. LISTENING TO YOUR FEEDBACKIn a rapidly evolving remuneration landscape we attach great importance to a continuousdialogue with institutional investors and other relevant stakeholders and we spendconsiderable time reflecting on feedback received. We trust you see this reflected in ourupdated policy. We have considered existing and emerging views on alternativeremuneration designs, but decided against further change until broader investorconsensus is clear. We have clearly noted questions about the maximum quantum opportunity in our currentstructure. REMCO believes that most of the Executive Directors’ compensation should bedelivered through variable pay elements, whereby outcome levels are predictable butconditional on the achievement of stretching targets. We strongly believe that outcomesshould not reward poor performance and will use our discretion when necessary. Ourremuneration package is designed to achieve an average long-term payout at aroundtarget. This is 590% of base salary for the CEO and the 10-year average CEO payout hasbeen approximately 550% of base salary. The outcomes are proportional to Shell’sunderlying performance and reflect REMCO’s implementation of the policy. Indeed,during shareholder consultations, investors largely acknowledged that REMCO has atrack record of setting stretching targets and ensuring that payments are in line withperformance. Moreover, the base salary, bonus and LTIP opportunities for the CEO andChief Financial Officer (CFO) have remained at similar levels for the past decade. We have also noted questions on threshold vesting levels for the LTIP and we willcontinue to monitor evolving views on this topic. REMCO believes that Shell’s LTIPstructure is not directly comparable with that in many other companies, given theemphasis we place on relative performance against a small peer group of directcompetitors, against which median performance (third place in a group of five) is morechallenging and is seen as target rather than threshold performance. Outperforming theother oil majors across all relative metrics is seen to represent significant stretch. This canbe illustrated by our historical outcomes, with average vesting over the last decade of75% of the initial award, or 37.5% of the total maximum opportunity.
Directors’ Remuneration Report
GOVERNANCE SHELL ANNUAL REPORT AND FORM 20-F 2017 94

PAY IN THE WIDER CONTEXTREMCO believes in remuneration structures that are consistent with those of the widerworkforce, which provides for a shared culture and alignment with Shell’s purpose,strategy and values. We pay close attention to pay levels and conditions across Shell andmake sure our remuneration packages are both internally consistent and externallycompetitive. This ensures that the CEO’s pay is not only externally benchmarked, butinternally proportionate to that of the CFO, Senior Management and across Shell. Wehave reviewed Shell’s 2016 CEO pay ratio relative to FTSE 30 and FTSE 100 companiesand the various potential outcomes show that we were in line with our peers. Thecomparison with the FTSE 30 is illustrated below.
However, it is difficult to reflect the CEO’s remuneration meaningfully by reference to asingle pay ratio figure in relation to the UK workforce, given the global nature of Shell.As a company, we provide equal pay for work of equal value in the respective countriesin which we operate, not just because this is a legal requirement but because it is the rightthing to do. In this context, we also reviewed Shell’s UK gender pay gap outcomes andwelcome the actions being taken to address gender imbalance in our workforce. 2017 PERFORMANCE CONTEXT AND OUTCOMES2017 was a transformative year, one in which Shell delivered on a number of fronts. Itwas a year of strong financial delivery from each of the businesses – FCF was more than$27 billion, production from new projects more than offset the impact of divestments,and there were record LNG liquefaction and sales volumes. Cash flow from operating activities was around $36 billion, an above target scorecardoutcome, which illustrates the cash-generating capability of Shell’s portfolio, with each ofour businesses successfully following a strategy focused on cost savings, operationalexcellence and activities with high margins. The overall score for operational excellence was near target, with mixed performances onthe individual measures within this section. There was strong project deliveryperformance, reflecting the organisation’s continued focus on delivering projects withinbudget and on schedule, and outstanding performance in delivering LNG liquefactionvolumes. Production volumes were below target, with performance impacted by theshutdown at our Pearl gas-to-liquids plant. The combined refinery and chemicals plantavailability measure was below threshold, because of higher maintenance and unplanneddowntime. Sustainable development was near target overall. However, process safety wasdisappointing and scored below threshold, after five years of
improvements, primarily driven by a higher number of incidents reported inDownstream. The CEO has provided strong leadership on the development of Shell’s roadmap for theenergy transition. The CEO is leading the discussion on our ambition to reduce the netcarbon footprint of Shell’s energy products in line with society’s drive to align with theParis Agreement goals, an industry first. The New Energies strategic review wascomprehensive, including an assessment of financial information and differentiators, andextensively discussed by the Board. In the next few years, the New Energies business willbe strengthened so that it can become a growth priority in the 2020s, and position Shell asa key player in the world’s energy future. The New Energies strategy is ambitious andintegral to Shell’s strategic ambition to thrive in the energy transition. Our strategy onclimate change is discussed further in “Climate change and energy transition” on pages62-66. DECISIONS MADEAgainst the above-mentioned background, REMCO made the following decisionsregarding the remuneration of the Executive Directors. Annual bonusREMCO approved the annual bonus scorecard outcome of 1.13 and no discretion wasapplied. Individual performance factorThe Chair reviewed the CEO’s performance with REMCO, and the CEO discussed theCFO’s performance with REMCO. Having considered the very strong leadership the CEOhas provided with regard to Shell’s position on the energy transition, along with overallperformance, and the CFO’s successful transition into the role, REMCO determined toaward them an individual performance factor of 1.2 and 1.0, respectively. LTIP outcomeShell’s investment case is built on long-term sustainable performance and creating long-term shareholder value. In an industry with an evolving energy mix landscape, it isimportant that Shell’s reward arrangements for Executive Directors are aligned with thislong-term outlook in our strategic thinking and growth, rather than short-term decisionmaking. For this reason, we have long holding periods, significant shareholdingrequirements and the majority of our incentives are weighted towards the LTIP.Furthermore, the TSR underpin ensures the final LTIP payout always reflects theshareholder experience over the performance period. While 2017 was a year of strong financial performance for Shell, over the longer-termperformance relative to the other oil majors has been mixed. There was strong relativethree-year performance in cash flow from operating activities, median return on averagecapital employed (ROACE)and EPS performance, and the TSR outcome was disappointing. The 2015 LTIP awardvested below target at 70% (or 35% of maximum). Overall, this resulted in the variable part of remuneration (annual bonus plus LTIPvesting) paying out below target, in line with the pay for performance approachdescribed earlier, which balances operational performance with long-term competitivefinancial outcomes. LOOKING AHEADAs a committee, we recognise the agenda of the year ahead given the continued focus anddebate on executive pay, including evolving corporate governance perspectives and thelegislative introduction of CEO pay ratios disclosure in the UK. We will also begin toassess key areas for review in respect of the Directors’ Remuneration Policy in 2018,prior to putting it to a binding vote at the 2020 AGM, and will continue to useshareholder engagements as an opportunity to seek your input to ensure Shell’sremuneration policy is aligned with Shell’s long-term strategy and with your interests.
GOVERNANCE SHELL ANNUAL REPORT AND FORM 20-F 2017 95
THIS REPORTThis Directors’ Remuneration Report for 2017 has been prepared in accordance withrelevant UK corporate governance and legal requirements, in particular Schedule 8 ofThe Large and Medium-sized Companies and Groups (Accounts and Reports)Regulations 2008 (as amended). The Board has approved this report. This report consists of two further sections: ■ the Annual Report on Remuneration (describing 2017 remuneration as well as the
planned implementation of the Directors’ Remuneration Policy in 2018) which will besubject to an advisory vote at the 2018 AGM; and
■ the Directors’ Remuneration Policy which was approved by shareholders at the 2017AGM and is included for reference.
Gerard KleisterleeChair of REMCOMarch 14, 2018
GOVERNANCE SHELL ANNUAL REPORT AND FORM 20-F 2017 96

The Annual Report on Remuneration sets out: ■REMCO and its responsibilities and activities;■an illustration of Shell’s strategy and link to remuneration and a summary of
remuneration policy implementation in 2017 and 2018;■the statement of the planned implementation of policy in 2018; and■Directors’ remuneration for 2017. The base currency in this Annual Report on Remuneration is the euro, as this is thecurrency of the base salary of the Executive Directors. Where amounts are shown in othercurrencies, an average exchange rate for the relevant year is used, unless a specific date isstated, in which case the average exchange rate for the specific date is used. REMUNERATION COMMITTEEThe following Directors were members of REMCO during 2017: ■Gerard Kleisterlee (Chair of REMCO);■ Catherine J. Hughes with effect from July 26, 2017;■Sir Nigel Sheinwald with effect from May 24, 2017;■Patricia A. Woertz until she stood down on May 23, 2017; and■Gerrit Zalm. Biographies of the current members are given on pages 70-71; REMCO meetingattendance is given on page 79. REMCO’s key responsibilities in respect of Executive Directors include: ■setting the remuneration policy;■agreeing performance frameworks, setting targets and reviewing performance;■determining actual remuneration and benefits; and■determining contractual terms.
In addition, REMCO has the responsibility for determining the Chair of the Board’sremuneration and for recommending and monitoring the level and structure ofremuneration for Senior Management. REMCO operates within its terms of reference, which are regularly reviewed. They werelast updated on January 28, 2015, and are available at www.shell.com. Advice from within Shell on various subjects, including the Executive Directors’ annualbonus scorecard architecture and the remuneration of Senior Management, was providedby: ■Ben van Beurden, CEO;■Ronan Cassidy, Chief Human Resources & Corporate Officer and Secretary to REMCO;
and■Stephanie Boyde, Executive Vice President Remuneration, Benefits & Services. The Chair of the Board and the CEO were consulted on remuneration proposals affectingthe CFO. During 2017, REMCO met five times and its activities included: ■finalising the Directors’ Remuneration Policy;■approving the 2016 Directors’ Remuneration Report;■consulting with major shareholders;■setting annual bonus performance measures and targets;■deciding on base salaries for the CEO and the CFO;■determining the 2016 annual bonus outcomes;■determining vesting of the 2014 LTIP award for the CEO and the CFO; and■tracking external developments and assessing their impact on Shell’s remuneration
policy.
Annual Report on Remuneration
GOVERNANCE SHELL ANNUAL REPORT AND FORM 20-F 2017 97

GOVERNANCE SHELL ANNUAL REPORT AND FORM 20-F 2017 98

STATEMENT OF 2018 PLANNED IMPLEMENTATION OF POLICYThe Directors’ Remuneration Policy on pages 109-117 took effect from May 23, 2017,and will be effective until the 2020 AGM, unless a further policy is proposed by theCompany and approved by shareholders in the meantime. This section describes elementsthat apply for 2018, some of which have changed compared with 2017 within theboundaries of the policy. COMPARATOR GROUPThe 2018 benchmarking comparator group is unchanged from 2017 and consists of theother oil majors (BP, Chevron, ExxonMobil, and Total) as well as a selection of majorEurope-based companies.
2018 European comparator groupAllianz Daimler Rio TintoAstraZeneca Diageo RocheBAT GlaxoSmithKline SiemensBayer Nestle UnileverBHP Billiton Novartis Vodafone EXECUTIVE DIRECTORSSalariesEffective from January 1, 2018, the base salaries were set at €1,527,000 (+2.5%) for Benvan Beurden, CEO and at €995,000 (+1.5%) for Jessica Uhl, CFO. When determining base salaries, REMCO mainly considered: the external marketpositioning of the Executive Directors’ compensation packages; Senior Managementsalaries; the planned average increases for 2018 for other employees across three majorcountries (the Netherlands, the UK and the USA); the impact of the increase on otherelements of the package; the current economic conditions; and Shell’s own performance. Annual bonusThe 2018 performance measures remain aligned with a number of our performanceindicators set out on pages 22-23, and comprise of cash flow from operating activities,operational excellence and sustainable development measures. In 2017, the GHG metricscovered around 60% of Shell’s operated direct and energy indirect GHG emissions. TheGHG metrics in the 2018 scorecard have evolved and coverage has increased to close to90% of the operated portfolio emissions. The refining and chemicals metrics will beretained and emissions coverage in Integrated Gas and Upstream will be measured on anintensity basis and expanded beyond flaring. Annual bonus scorecard targets are not disclosed prospectively because to do so in ameaningful manner would require the disclosure of commercially sensitive information.As in previous years, scorecard targets will be disclosed in a subsequent Directors’Remuneration Report when they are no longer deemed to be commercially sensitive.Disclosure of detailed personal targets is inappropriate as these are deemed commerciallysensitive. However, the basis for the determination of the individual multiplier will bedisclosed. 50% of the annual bonus awarded for the 2018 performance year will be delivered incash and 50% will be delivered in shares subject to a three-year holding period whichremains in force beyond an Executive Director’s tenure.
Long-term Incentive PlanOn February 2, 2018, a conditional award of performance shares under the LTIP wasmade to the Executive Directors. The award had a face value of 340% of the base salaryfor the CEO and 270% of the base salary for the CFO, resulting in 190,001 Royal DutchShell plc A shares (A shares) being conditionally awarded to Ben van Beurden and49,857 Royal Dutch Shell plc A American Depositary Shares (A ADSs) to Jessica Uhl. For LTIP awards made in 2018, performance is assessed over a three-year period basedon four financial measures. FCF (25%) is based on absolute performance and relativeperformance is compared with the other oil majors on the following measures: ■TSR, calculated in dollars using a 90-day averaging period around the start and end of
the performance period (25%);■ROACE growth (25%). For this purpose, in order to facilitate the comparison, the
calculation of ROACE differs from that described in “Performance indicators” on page22 as there is no adjustment for after-tax interest expense; and
■Cash flow from operating activities growth (25%). The vesting schedule for the relative measures is unchanged from 2017. The target forFCF, along with the ranges for threshold and outstanding performance, will be set byreference to Shell’s operating plan, being the aggregate of our plan FCF targets over thethree-year performance period. As a result, FCF targets will only be disclosedretrospectively after the three-year period. 20% of the maximum available under thismeasure will be payable for threshold performance, rising to full vesting of that measurefor outstanding performance. A straight-line vesting schedule will apply for performancebetween threshold and outstanding. Vested LTIP shares are subject to a three-year holding period which remains in forcebeyond an Executive Director’s tenure. FCF progress to date on outstanding 2017 LTIP awardAt December 31, 2017, FCF performance, at more than $27 billion, is above target. Astwo years of FCF performance remain, and 75% of the award is subject to relativeperformance conditions, this does not reflect the potential vesting of the award. Adjustment (malus) and recovery (clawback)Variable pay elements are subject to adjustment (malus) and recovery (clawback)provisions, which may apply in case of direct responsibility or supervisory accountability. REMCO may adjust an award, for example by lapsing part or all of it, reducing thenumber of shares which would otherwise vest, by imposing additional conditions on it, orimposing a new holding period. Award adjustments may be made as a result of: Shellrestating the relevant year(s)’ financial statements due to material non-compliance withany financial reporting requirement; an individual’s misconduct or misconduct throughthe individual’s direction or non-direction, which influenced the metrics and outcomesused in determining the individual’s annual bonus or LTIP outcome; any material breachof health and safety or environment regulations; serious reputational damage to Shell;material failure of risk management; and other exceptional events at the discretion ofREMCO.
GOVERNANCE SHELL ANNUAL REPORT AND FORM 20-F 2017 99

Adjustment may also apply after employment ends if the individual: (a) breaches anyprovision of his/her employment contract which applies after cessation of employment orany provision of an agreement entered into on termination of employment; (b) is foundto have committed fraud or dishonesty with respect to Shell; (c) wilfully damaged theassets of or engaged in misconduct which, in any material respect, is or was injurious toShell; (d) wrongfully disclosed or used any proprietary or confidential information whichis related to the business, properties or affairs of Shell and the release of which isdetrimental, in any material respect, to the competitive position or goodwill of Shell; (e)engaged in any activity which, in any material respect, reasonably constituted a conflictwith the interests of Shell; or (f) breached any business principle or a term of any code ofconduct applicable to employees or former employees of Shell. Clawback applies in case of restatement of financial statements due to material non-compliance with any financial reporting requirement or as a result of the individual’smisconduct or misconduct through the individual’s direction or non-direction, whichinfluenced the metrics and outcomes used in determining his/her annual bonus or LTIPoutcome. PensionThe normal retirement age for the Dutch pension plans, in which the Ben van Beurden isa member, changed from 67 to 68, with effect from January 1, 2018. Ben van Beurden’spension arrangements comprise a defined benefit plan for which the maximumpensionable salary has increased to €94,446, and a net pay defined contribution pensionplan with an employer contribution of 23% of salary in excess of €94,446 until April 30,2018, and 27% with effect from May 1, 2018, when he enters the next age bracket forcontribution levels. There are no changes to the pension plans in which Jessica Uhlparticipates.
NON-EXECUTIVE DIRECTORS’ FEES
Non-executive Directors’ fees 2018 € Other fees
Chair of the Board 850,000 Non-executiveNon-executive Director 135,000 DirectorsSenior Independent Director 55,000 receive anAudit Committee additional fee
Chair [A] 60,000 of €5,000 forMember 25,000 any Board
Corporate and Social Responsibility Committee meeting involvingChair [A] 35,000 intercontinentalMember 17,250 travel – except
Nomination and Succession Committee for oneChair [A] 25,000 meetingMember 12,000 a year held in a
Remuneration Committee location otherChair [A] 40,000 than TheMember 17,250 Hague.
[A] The chair of a committee does not receive an additional fee for membership of that committee The Chair’s fee is determined by REMCO and the annual fee for Charles O. Holliday wasset at €850,000 upon appointment in 2015 and will remain unchanged for 2018. Theother Non-executive Directors receive a basic fee. There are additional fees for the Senior Independent Director, a Board committee chair ora Board committee membership for each committee. Non-executive Directors receive anadditional fee of €5,000 for any Board meeting involving intercontinental travel, exceptfor one meeting a year held in a location other than The Hague. Business expenses(including transport between home and office and occasional business-required spousetravel) and associated tax are paid or reimbursed by Shell. The Chair has use of Shell-provided accommodation in The Hague. The Board reviews Non-executive Directors’ fees periodically to ensure that they arealigned with those of other major listed companies. The last review was carried out in2016, and the changes made were effective from January 1, 2017. Non-executiveDirectors’ fees will remain unchanged for 2018.
GOVERNANCE SHELL ANNUAL REPORT AND FORM 20-F 2017 100

DIRECTORS’ REMUNERATION FOR 2017NON-EXECUTIVE DIRECTORS’ REMUNERATION FOR 2017
Single total figure of remuneration for Non-executive Directors (audited) € thousand Fees Taxable benefits[A] Total 2017 2016 2017 2016 2017 2016
Guy Elliott [B] 133 167 — — 133 167 Euleen Goh 225 225 — — 225 225 Charles O. Holliday 850 850 83 [C] 77 933 927 Catherine J. Hughes [D] 99 N/A — N/A 99 N/A Gerard Kleisterlee 196 190 — — 196 190 Roberto Setubal [E] 50 N/A 3 N/A 53 N/A Sir Nigel Sheinwald 163 147 6 — 169 147 Linda G. Stuntz 202 197 — — 202 197 Hans Wijers 237 232 7 — 244 232 Patricia A. Woertz [F] 72 195 — — 72 195 Gerrit Zalm [G] 117 147 — — 117 147 [A] UK regulations require the inclusion of benefits where these would be taxable in the UK, on the assumption that Directors are tax residents in the UK. On this premise, the taxable benefits include the cost of Non-executive Director’s occasional business-required spouse travel. Shell also pays for travel between home and the head office in The Hague, where Board and committee meetings are typically held, as well as related hotel and subsistence costs. For consistency, these business expenses are not reportedas taxable benefits as for most Non-executive Directors this is international travel and hence would not be taxable in the UK. [B] Stood down as a Director with effect from October 18, 2017. No payments for loss of office were made.[C] Including the use of an apartment (2017: €68,612; 2016: €70,157). [D] Appointed as a Director with effect from June 1, 2017.[E] Appointed as a Director with effect from October 1, 2017.[F] Stood down as a Director with effect from May 23, 2017. No payments for loss of office were made.[G] As a result of arrangements related to Gerrit Zalm’s attendance at Board and committee meetings detailed in “Corporate governance” on page 77, his fees have been pro-rated and exclude the period July 1, 2017 to October 24, 2017. EXECUTIVE DIRECTORS’ REMUNERATION FOR 2017
Single total figure of remuneration for Executive Directors (audited) € thousand Ben van Beurden Simon Henry [A] Jessica Uhl [A] 2017 2016 2017 2016 2017
Salaries 1,490 1,460 198 1,040 796 Taxable benefits 30 22 8 24 44 Total fixed remuneration 1,520 1,482 206 1,064 840 Annual bonus [B] 3,000 2,400 [C] 1,350 1,050 LTIP and Deferred Bonus Plan (DBP) [D] 4,021 4,381 — 2,644 623 Total variable remuneration 7,021 6,781 — 3,994 1,673 Total direct remuneration 8,541 8,263 206 5,058 2,513 Pension [E] 368 330 — 524 287 Tax equalisation [F] — — 68 374 194 Total remuneration including pension and tax equalisation 8,909 8,593 274 5,956 2,994
in dollars 10,067 9,515 310 6,595 3,383 in sterling 7,811 7,046 240 4,884 2,625
[A] Simon Henry stood down as an Executive Director with effect from March 9, 2017, and Jessica Uhl was appointed as an Executive Director with effect from that date. Their remuneration for 2017 is pro-rated accordingly. [B] The full value of the bonus, comprising both the cash and bonus delivered in shares. For 2017, 50% of the bonus was delivered in shares and the market price of A shares on February 22, 2018 (€25.75), was used to determine the number of sharesdelivered, resulting in 30,102 A shares for Ben van Beurden and 10,536 A shares for Jessica Uhl. [C] After standing down as CFO, Simon Henry was available to the incoming CFO and to the Board to assist with the transition and left employment with Shell on June 30, 2017. His performance bonus in relation to all service in 2017 was determined after heleft Shell. The details are set out on page 106 under the “Payments to past Directors” section, along with other remuneration arrangements during this period. [D] Remuneration for performance periods of more than one year, comprising the value of released LTIP awards and DBP performance matching shares (in respect of 2016). The original deferred bonus share awards, which are those represented by thedeferred bonus and dividend shares accrued on these shares, are not considered as long-term remuneration, as they relate to the short-term annual bonus value. The amounts reported for 2017 relate to the 2015 LTIP award, which vested on March 2, 2018, atthe market price of €25.37 and $63.09 for A shares and A ADSs respectively. The value in respect of the LTIP is calculated as the product of: the number of shares of the original award multiplied by the vesting percentage; plus accrued dividend shares; andthe market price of A shares or A ADSs at the vesting date. The market price of A ADSs is converted into euros using the exchange rate on the respective date. [E] The accrual for the period (net of inflation) multiplied by 20 in accordance with UK reporting regulations. [F] Includes tax equalisation of pension contributions to foreign pension plan(s), when they are taxable above a certain pensionable salary threshold or once a double tax treaty exemption ceases, under Dutch law. Tax equalisation is applied for the loss ofpension relief for members of a foreign pension plan(s) in their host country.
GOVERNANCE SHELL ANNUAL REPORT AND FORM 20-F 2017 101

NOTES TO THE SINGLE TOTAL FIGURE OF REMUNERATION FOR EXECUTIVEDIRECTORS TABLE (AUDITED)SalariesAs disclosed in the 2016 Directors’ Remuneration Report, REMCO set Ben van Beurden’sbase salary for 2017 at €1,490,000 (+2.1% compared with 2016) effective from January1, 2017, and Jessica Uhl’s base salary at €980,000 from March 9, 2017 (onappointment). For 2017, the base salary for Simon Henry was unchanged from 2016 at€1,040,000.
Taxable benefitsExecutive Directors received car allowances or lease cars, transport between home andoffice, occasional business-required spouse travel, as well as employer contributions tolife and medical insurance plans. Annual bonusThe scorecard measures are grouped into three sections: financial, operational excellenceand sustainable development. At the beginning of the year, REMCO sets a target rangeand weighting for each measure. The actual outcome for each measure results in a scoreof between zero and two, with a score of one representing “on target”. These scores aremultiplied by the respective weighting of each measure and aggregated, resulting in amathematical scorecard outcome of between zero and two. REMCO may then make anadjustment to the overall scorecard outcome in view of the wider business performancefor the year. An Executive Director’s individual performance is also taken into account in determiningtheir annual bonus through the application of a multiplier between zero and 1.2. 50% of the annual bonus is delivered in shares subject to a three-year holding period. Determination of the 2017 annual bonusThe mathematical scorecard outcome for 2017 was 1.13 and REMCO approved thisoutcome without exercising discretion. The outcome was based on strong cash flow fromoperating activities and project delivery and outstanding performance in LNGliquefaction volumes. The overall score for
operational excellence and sustainable development was near target, with mixedperformances on the individual measures within these sections. Production volumes werebelow target, as performance was impacted by the Pearl shutdown. The combinedrefinery and chemicals availability measure scored below threshold, because of highermaintenance and unplanned downtime. Personal safety performance was above target,driven by a significant reduction in the number of injuries in 2017 compared with 2016,and our lowest injury rate ever. Process safety was below threshold, after five years ofimprovements, primarily driven by a higher number of incidents reported inDownstream. On GHG emissions, our overall performance was broadly on target in 2017. The CEO delivered on a number of fronts; in particular he provided a clear vision forestablishing Shell’s net carbon footprint ambitions and gave strong leadership for theevolution of the strategy for New Energies, both of which are central to Shell’s aim tothrive in the energy transition. The CEO’s performance is discussed further in the Chair’sstatement on page 95. REMCO determined an individual performance factor of 1.2 for the CEO and determineda final bonus outcome of €3,000,000. The CFO successfully transitioned into her role. The divestment programme remains ontrack, with the finance team under her direction creating successful strategies in terms ofstructuring deals. Good progress was also made in terms of managing operating expenses,which required setting a clear ambition and alignment across the businesses and functions. REMCO determined an individual performance factor of 1.0 for the CFO and determineda final pro-rated bonus outcome of €1,050,000. Half of the bonus was delivered in cash and half was delivered in shares subject to athree-year holding period. The table below summarises the 2017 annual bonus scorecardmeasures including their weightings, targets and outcomes. Charts illustrating thecalculation of the final 2017 bonus payable to the CEO and CFO are also provided.
2017 annual bonus outcome (audited)
Measures Weight
(% of scorecard) Threshold Target
set Outstanding Result
achieved Score (0-2) Cash flow from operating activities ($ billion) [A] 30 % 28 34 40 36 1.32 Operational excellence 50 % 1.11 Production (kboe/d) 12.5 % 3,576 3,687 3,798 3,664 0.79 LNG liquefaction volumes (mtpa) 12.5 % 31.1 32.1 33.1 33.2 2.00 Refinery and chemical plant availability (%) 12.5 % 90.7 92.7 94.7 90.7 0.00 Project delivery on schedule (%) 6.25 % 60 80 100 86 1.30 Project delivery on budget (%) 6.25 % 105 100 95 93 2.00 Sustainable development 20 % 0.89 Total recordable case frequency (injuries/million hours) 5 % 1.1 0.9 0.7 0.8 1.50 Operational Tier 1 and 2 process safety events (number) 5 % 163 130 97 166 0.00 Refining GHG intensity (tonnes CO2 equivalent per Solomon’s Utilized Equivalent Distillation Capacity (UEDC™)) 4 % 1.21 1.15 1.09 1.14 1.17 Chemicals GHG intensity (tonnes CO2 equivalent per tonne of production) 3 % 0.50 0.45 0.40 0.46 0.80 Upstream flaring (million tonnes CO2 equivalent) 3 % 10.1 8.1 6.1 8.0 1.05 100 % Mathematical scorecard outcome 1.13[A] Excluding tax on divestments.
GOVERNANCE SHELL ANNUAL REPORT AND FORM 20-F 2017 102

LTIP vestingIn 2015, Ben van Beurden and Jessica Uhl were each granted a conditional award ofperformance shares under the LTIP. For Ben van Beurden, this award was based on 340%of his base salary, with a maximum vesting of 680%. Jessica Uhl was granted an award of13,800 A ADSs prior to her appointment as an Executive Director, with a maximumvesting of two times the original award. The LTIP vesting outcome at the end of the performance period (January 1, 2015, toDecember 31, 2017) is illustrated in the following LTIP vesting outcome table. REMCOalso considered the underlying financial performance of Shell and decided to vest 70% ofshares under the LTIP, using no discretion, resulting in 158,510 A shares for Ben vanBeurden and 12,117 A ADSs for Jessica Uhl. At vesting, these shares (including accrueddividend shares) had a value of €4,021,399 and €622,730 respectively.
PensionBen van Beurden’s pension arrangements comprise a defined benefit plan with amaximum pensionable salary of €92,885, and a net pay defined contribution pensionplan with a 2017 employer contribution of 24% of salary in excess of €92,885, with theoption to take cash as an alternative to pension contributions (in either case subject toincome tax). The CEO has elected to take his benefit in the form of contributionsthroughout 2017. Simon Henry’s pension is in the form of defined benefit plans. Jessica Uhl is a member of the Shell US retirement benefit arrangements, which includethe Shell Pension Plan, a defined benefit plan, and a defined contribution plan with anemployer contribution of 10% of salary. As for all other pre-2013 members of the ShellPension Plan, she has an annual choice of two accrual formulas with different forms ofbenefits, one in the form of a lifetime annuity and the other allows for a lump-sumpayment. She elected to accrue benefits for 2017 under the latter. She also has a deferredDutch defined benefit pension plan, as a result of a prior Shell assignment on local Dutchterms and conditions. See further details on pension arrangements on pages 107-108.
GOVERNANCE SHELL ANNUAL REPORT AND FORM 20-F 2017 103

The measures and weightings applying to LTIP awards made in 2017 were: FCF (25%);TSR (25%); ROACE growth (25%) and cash flow from operating activities growth(25%). The LTIP will vest on the basis of the absolute performance of FCF and the ranking ofthe three relative performance measures, as indicated in the table below.
If the TSR ranking is fourth or fifth, the level of the award that can vest on the basis ofthe three other measures will be capped at 50% of the maximum. To deliver the shares under the LTIP, market-purchased shares are used rather than theissuing of new shares.
STATEMENT OF DIRECTORS’ SHAREHOLDING AND SHAREINTERESTS (AUDITED)SHAREHOLDING GUIDELINESREMCO believes that Executive Directors should align their interests with those ofshareholders by holding shares in the Company. The CEO is expected to build ashareholding with a value of 700% of base salary, and other Executive Directors 400% ofbase salary. Only unfettered shares count. Unvested shares held under DBP and anyshares delivered but subject to holding requirements, also count towards the guidelines.Both Ben van Beurden and Jessica Uhl have not yet met the required shareholding level.Non-executive Directors are encouraged to hold shares with a value equivalent to 100%of their fixed annual fee and maintain that holding during their tenure.
Executive Directors’ shareholding (audited)
Shareholding guideline
(% of base salary)
Value of shares countingtowards guideline
(% of base salary atDecember 31, 2017)[A]
Ben van Beurden 700% 450% Simon Henry 400% 1,157%[B]Jessica Uhl 400% 101% [A] Representing the value of share interests and the estimated after-tax value of DBP shares (not subject to performanceconditions).[B] Based on shareholding at March 9, 2017, when he stood down as an Executive Director.
Scheme interests awarded to Executive Directors in 2017 (audited) € Potential amount vesting
Schemeinterest type
Type ofinterest awarded
End ofperformance period
Target award[A]
Minimumperformance(% of sharesawarded)[B]
Maximum performance(% of shares of the target award[A][C])
LTIP Performanceshares
December 31, 2019 Ben van Beurden: 198,900 A shares, equivalent to 3.4x base salary or €5,066,000. Jessica Uhl: 54,277 AADSs, equivalent to 2.7 x base salary or €2,646,000.
0% Maximum number of shares vesting is 200% of thenumber of shares awarded, equivalent to€10,132,000 for Ben van Beurden and €5,292,000for Jessica Uhl.
[A] The award for Ben van Beurden was based on the closing market price on February 3, 2017, for A shares of €25.47. The award for Jessica Uhl was made after her appointment as an Executive Director and based on the closing market price on March 10,2017, for A ADSs of $51.74.[B] Minimum performance relates to the lowest level of achievement, for which no reward is given.[C] The equivalent values exclude share price movements and accrued dividend shares.
GOVERNANCE SHELL ANNUAL REPORT AND FORM 20-F 2017 104

DIRECTORS’ SHARE INTERESTSThe interests (in shares of the Company or calculated equivalents) of the Directors inoffice during 2017, including any interests of their connected persons, are set out in thetable below.
Directors’ share interests [A] (audited) January 1, 2017 December 31, 2017 A shares B shares A shares B shares
Ben van Beurden 33,703 — 132,979 — Guy Elliott — 5,825 — 5,825 [B]Euleen Goh — 12,895 — 12,895 Simon Henry 54,368 305,959 54,368 [C] 314,107 [C]Charles O. Holliday — 50,000 [D] — 50,000 [D]Catherine J. Hughes 3,316 [E] 41,404 [E] 4,080 46,904 Gerard Kleisterlee 5,254 — 5,254 — Roberto Setubal —[F] —[F] 15,400 [G] — Sir Nigel Sheinwald — 1,124 — 1,124 Linda G. Stuntz — 12,400 [H] — 12,400 [H]Jessica Uhl
35,460[I][J] —[I] 35,460 [J] —
Hans Wijers 5,251 — 5,251 — Patricia A. Woertz
— 6,000 [K] —[L] 6,000[K][L]
Gerrit Zalm 2,026 — 2,026 —[A] Includes vested LTIP awards subject to holding conditions. Excludes unvested interests in shares awarded under the LTIPand DBP.[B] Interests at October 18, 2017, when he stood down as a Director. [C] Interests at March 9, 2017, when he stood down as a Director.[D] Held as 25,000 ADSs (RDS.B ADS). Each RDS.B ADS represents two B shares. [E] Interests at June 1, 2017, when she was appointed as a Director.[F] Interests at October 1, 2017, when he was appointed as a Director. [G] Held as 7,700 ADSs (RDS.A ADS). Each RDS.A ADS represents two A shares.[H] Held as 6,200 ADSs (RDS.B ADS). Each RDS.B ADS represents two B shares. [I] Interests at March 9, 2017, when she was appointed as a Director.[J] Held as 17,730 ADSs (RDS.A ADS). Each RDS.A ADS represents two A shares. [K] Held as 3,000 ADSs (RDS.B ADS). Each RDS.B ADS represents two B shares.[L] Interests at May 23, 2017, when she stood down as a Director.
The only changes in Directors’ share interests during the period from December 31,2017, to March 14, 2018, were that Ben van Beurden’s interests increased by 147,363 Ashares, as 50% of 2017 annual bonus was delivered in shares on February 22, 2018, andthe 2015 LTIP and DBP awards vested on March 2, 2018, and Jessica Uhl’s interestsincreased by 10,536 A shares, as 50% of 2017 annual bonus was delivered in shares onFebruary 22, 2018, and by 7,348 A ADSs as the 2015 LTIP award vested on March 2,2018. The value of shares counting towards the shareholding guideline (as a % of basesalary) for the CEO and CFO, were 586% and 157%, respectively, at March 2, 2018. At March 14, 2018, the Directors and Senior Management (pages 69-72) of the Companybeneficially owned, individually and in aggregate (including shares under option), lessthan 1% of the total shares of each class of the Company shares outstanding.
DIRECTORS’ SCHEME INTERESTSThe table below shows the aggregate position for Directors’ interests under share schemes at December 31. These are A shares for Ben van Beurden, B shares for Simon Henry, and AADSs for Jessica Uhl. During the period from December 31, 2017, to March 14, 2018, scheme interests have changed as a result of the vesting of the 2015 LTIP and DBP awards onMarch 2, 2018, and the 2018 LTIP awards made on February 2, 2018, as described on pages 103 and 99 respectively.
Directors’ scheme interests (audited) Share plan interests[A]
LTIP/PSP subject toperformance
conditions[B]
DBP not subject toperformance
conditions[C]
DBP subject toperformance
conditions[D] Total 2017 2016 2017 2016 2017 2016 2017 2016
Ben van Beurden 707,727 662,359 226,196 179,621 — 7,564 933,923 849,544Simon Henry 266,371 [E] 374,671 119,625 [E] 114,390 —[E] 10,052 385,996 [E] 499,113Jessica Uhl 89,901 42,011 — — — — 89,901 42,011[A] Includes unvested long-term incentive awards and notional dividend shares accrued at December 31. Interests are shown on the basis of the original awards. The shares subject to performance conditions can vest at between 0% and 200%. Dividendshares accumulate each year on an assumed notional LTIP/DBP award. Such dividend shares are disclosed and recorded on the basis of the number of shares conditionally awarded but, when an award vests, dividend shares will be awarded only in relation tovested shares as if the vested shares were held from the award date. Shares released during the year are included in the “Directors’ share interests” table.[B] Total number of unvested LTIP shares at December 31, including dividend shares accrued on the original LTIP award. [C] The number of shares deferred from the bonus (original DBP award) and the dividend shares accrued on these at December 31. Delivery of the original DBP award and the related accrued dividend shares is not subject to performance conditions.[D] The target number of performance matching shares, which corresponds to the original 2014 DBP award. The DBP did not attract performance matching shares with effect from 2015 awards. The actual number of performance matching shares for the2014 DBP award were determined at vesting on the same basis as the LTIP vesting and disclosed in the 2016 Directors’ Remuneration Report. There are no outstanding DBP awards subject to performance conditions. [E] Interests at March 9, 2017, when he stood down as a Director.
GOVERNANCE SHELL ANNUAL REPORT AND FORM 20-F 2017 105

DILUTIONIn any 10-year period, no more than 5% of the issued ordinary share capital of theCompany may be issued or issuable under executive (discretionary) share plans adoptedby the Company. To date, no shareholder dilution has resulted from these plans, althoughit is permitted under the rules of the plans subject to these limits. PAYMENTS FOR LOSS OF OFFICE (AUDITED)As disclosed in the 2016 Directors’ Remuneration Report, Simon Henry stood down fromthe Board and his role as CFO with effect from March 9, 2017. In accordance with thepolicy approved by shareholders at the 2014 AGM, he received a payment for loss ofoffice of €2,288,000, equivalent to one times annual pay (base salary plus target bonus).The payment was phased in six equal monthly instalments. No 2017 LTIP award was made and outstanding LTIP awards will not vest early and areprorated for service. Outstanding DBP awards will not vest early and are not prorated asthe deferred bonus has been earned. The applicable DBP holding periods remain in forcepost-leaving employment. The conditional LTIP awards and outstanding DBP awards aresubject to adjustments events (malus and clawback) and these provisions remain in force. PAYMENTS TO PAST DIRECTORS (AUDITED)After standing down as CFO, Simon Henry was available to the incoming CFO and to theBoard to assist with the transition and left employment with Shell on June 30, 2017. Hisremuneration during this period is set out below:■ Base salary: no changes to base salary or pensionable base salary during this period. ■ Annual bonus: a prorated annual bonus in relation to performance year 2017 of
€625,000 was determined by REMCO, for all service in 2017. 50% of the bonus wasdelivered in cash and 50% was delivered in shares subject to a three-year holding periodwhich remains in force post leaving employment.
■ Pension: continued participation in the UK defined benefit plans.■ Benefits: standard Shell benefits applied, such as cash in lieu of accrued leave,
relocation support and normal benefits for UK local employees. On March 2, 2018, Simon Henry’s 2015 LTIP award vested at 70%. The value at vestingof the LTIP shares was €1,853,995. Payments below €5,000 are not reported as they are considered de minimis. TSR PERFORMANCE AND CEO PAYPERFORMANCE GRAPHSThe graphs compare the TSR performance of the Company over the past nine financialyears with that of the companies comprising the Euronext 100 and the FTSE 100 shareindices. The Board regards these indices as appropriate broad market equity indices forcomparison, as they are the leading market indices in the Company’s home markets.
GOVERNANCE SHELL ANNUAL REPORT AND FORM 20-F 2017 106
CEO PAY OUTCOMESThe following table sets out the single total figure of remuneration, and the annual bonuspayout and long-term incentive (LTI) vesting rates compared with the respectivemaximum opportunity, for the CEO for the last nine years.
CEO pay outcomes
Year CEO
Single totalfigure of
remuneration(€000)
Annual bonuspayoutagainst
maximumopportunity
LTI vestingrates against
maximumopportunity
2017 Ben van Beurden 8,909 81% 35%2016 Ben van Beurden 8,593 66% 42%2015 Ben van Beurden 5,576 98% 8%2014 Ben van Beurden 24,198 94% 49%2013 Peter Voser 8,456 44% 30%2012 Peter Voser 18,246 83% 88%2011 Peter Voser 9,941 90% 30%2010 Peter Voser 10,611 100% 75%2009 Peter Voser 6,228 50% 0%2009 Jeroen van der Veer 3,748 66% 0% Peter Voser stood down on December 31, 2013, and was succeeded by Ben van Beurden.Ben van Beurden’s single figure for 2014 was impacted by the increase in pensionaccrual calculated under the UK reporting regulations and tax equalisation as a result ofhis promotion and prior assignment to the UK. Jeroen van der Veer stood down on July1, 2009, and Peter Voser took over from that date. Only remuneration relating to theirposition as CEO is included.
CHANGE IN REMUNERATION OF CEO AND EMPLOYEES FROM 2016TO 2017The CEO data compares the remuneration of Ben van Beurden for 2017 with 2016. Thecomparator group consists of local employees in the Netherlands, the UK and the USA.This is considered to be a suitable employee comparator group, because: these arecountries with a significant Shell employee base; a large proportion of senior managerscome from these countries; and REMCO considers remuneration levels in these countrieswhen setting base salaries for Executive Directors. Taxable benefits are those that align with the definition of taxable benefits applying in therespective country. In line with the “Single total figure of remuneration for ExecutiveDirectors” table, the annual bonus is included in the year in which it was earned.
Change in remuneration of CEO and employees CEO Employees
Salaries 2.1 % 1.4 %Taxable benefits 32.6 % 0.8 %Annual bonus 25.0 % -0.4 %
RELATIVE IMPORTANCE OF SPEND ON PAYDistributions to shareholders by way of dividends and share buybacks and remunerationpaid to or receivable by employees for the last five years are set out below, together withannual percentage changes.
Relative importance of spend on pay Dividends and share buybacks[A] Spend on pay (all employees)[B]
Year $ billion Annualchange $ billion
Annualchange
2017 15.6 4% 14.3 -9%2016 15.0 25% 15.7 -8%2015 12.0 -18% 17.1 5%2014 14.6 -14% 16.4 0%2013 17.1 35% 16.4 9%[A] Dividends paid, which includes the dividends settled in shares via our Scrip Dividend Programme, and repurchases ofshares as reported in the “Consolidated Statement of Changes in Equity”. [B] Employee costs, excluding redundancy costs, as reported in Note 26 to the “Consolidated Financial Statements”. Spend on pay can be compared with the major costs associated with generating incomeby referring to the “Consolidated Statement of Income”. Over the last five years, theaverage spend on pay was 5% of the major costs of generating income. These costs areconsidered to be the sum of: purchases; production and manufacturing expenses; selling,distribution and administrative expenses; research and development; exploration; anddepreciation, depletion and amortisation. TOTAL PENSION ENTITLEMENTS (AUDITED)During 2017, Ben van Beurden, Simon Henry and Jessica Uhl accrued retirement benefitsunder defined benefit plans. The pension accrued under these plans at December 31,2017, is set out below. The exchange rates used for conversion into euros and dollars areat December 31, 2017.
Accrued pension (audited) Thousand Local € $Ben van Beurden[A] €1,176 €1,176 $1,407Simon Henry [A][B] £498 €563 $673Jessica Uhl[C] $1,087 €908 $1,087[A] The accrued retirement benefits are disclosed on a per annum basis.[B] Accrued retirement benefits at March 9, 2017 when he stood down as a Director.[C] Jessica Uhl has an annual choice of two accrual formulas with different forms of benefits, one in the form of a lifetimeannuity and the other allows for a lump-sum payment. She elected to accrue benefits for 2017 under the latter and the eventuallump sum benefit is shown. She also has a deferred Dutch defined benefit pension plan, as a result of a prior Shell assignmenton local Dutch terms and conditions. The age at which Jessica Uhl can receive any pension benefit without an actuarialreduction under this plan is 60. The value of the deferred pension benefit is €3,252 per annum. The ages at which Ben van Beurden, Simon Henry and Jessica Uhl can receive anypension benefit without actuarial reduction are 68, 60 and 65 (in the US retirement plans)respectively. Any pension benefits on early retirement are reduced using actuarial factorsto reflect early payment. No payments were made in 2017 regarding early retirement orin lieu of retirement benefits. BEN VAN BEURDENBen van Beurden is a member of the “Stichting Shell Pensioenfonds”, the pension planfor Shell employees in the Netherlands who joined before July 2013 that providesbenefits in defined benefit form. Ben van Beurden is also a member of the Shell net paydefined contribution pension plan in the Netherlands with effect from January 1, 2015.
GOVERNANCE SHELL ANNUAL REPORT AND FORM 20-F 2017 107

SIMON HENRYSimon Henry is a member of the Shell Overseas Contributory Pension Fund (SOCPF) andthe Shell Contributory Pension Fund (SCPF), with both these funded pension plansproviding benefits in defined benefit form. The SOCPF provides benefits in respect of hisperiods of employment outside the UK, while the SCPF provides benefits in respect of hisperiods of employment in the UK. Simon Henry has elected to have his benefits from theSCPF restricted to the UK lifetime allowance with any excess provided from an unfundedarrangement, the Shell Supplementary Pension Plan. JESSICA UHLJessica Uhl is a member of the Shell US retirement benefit arrangements, which includethe Shell Pension Plan, a defined benefit plan, and the Shell Provident Fund, a definedcontribution plan. Unlike other US participants, Jessica Uhl’s pensionable compensationdoes not include the annual bonus. She also has a deferred Dutch defined benefit pensionplan, as a result of a prior Shell assignment on local Dutch terms and conditions. EXTERNAL APPOINTMENTSThe Board considers external appointments to be valuable in broadening ExecutiveDirectors’ knowledge and experience. The number of outside directorships is generallylimited to one. Exceptions to this are considered in the final year of employment. TheBoard must explicitly approve such appointments. Executive Directors are allowed toretain any cash or share-based compensation they receive from such external boarddirectorships. The Executive Directors currently do not hold any Non-executive Directorships. STATEMENT OF VOTING AT 2017 AGMThe Company’s 2017 AGM was held on May 23, 2017, in the Netherlands. The results ofthe polls in respect of Directors’ remuneration were as follows:
Approval of Directors’ Remuneration PolicyVotes Number PercentageFor 4,064,279,529 92.34%Against 337,361,835 7.66%Total cast 4,401,641,364 [A] 100.00%Withheld [B] 37,303,341 [A] Representing 53.53% of issued share capital. [B] A vote “withheld” is not a vote under English law and is not counted in the calculation of the proportion of the votes “for”and “against” a resolution.
Approval of Directors’ Remuneration ReportVotes Number PercentageFor 4,113,584,774 93.20%Against 299,920,969 6.80%Total cast 4,413,505,743 [A] 100.00%Withheld [B] 30,845,259 [A] Representing 53.68% of issued share capital.[B] A vote “withheld” is not a vote under English law and is not counted in the calculation of the proportion of the votes “for”and “against” a resolution.
DIRECTORS’ EMPLOYMENT ARRANGEMENTS AND LETTERS OFAPPOINTMENTExecutive Directors are employed for an indefinite period. Non-executive Directors,including the Chair, have letters of appointment. Details of Executive Directors’employment arrangements can be found in the Directors’ Remuneration Policy on page115. Further details of Non-executive Director terms of appointment can be found in the“Directors’ Report” on page 74 and the “Corporate governance” report on page 78. COMPENSATION OF DIRECTORS AND SENIOR MANAGEMENTDuring the year ended December 31, 2017, Shell paid and/or accrued compensationtotalling $46 million (2016: $43 million) to Directors and Senior Management forservices in all capacities while serving as a Director or member of Senior Management,including $3 million (2016: $3 million) accrued to provide pension, retirement andsimilar benefits. The amounts stated are those recognised in Shell’s income on an IFRSbasis. See Note 27 to the “Consolidated Financial Statements”. Personal loans orguarantees were not provided to Directors or Senior Management.
GOVERNANCE SHELL ANNUAL REPORT AND FORM 20-F 2017 108

This section describes the Directors’ Remuneration Policy (Policy) as published in the2016 Directors’ Remuneration Report which, following shareholder approval at the 2017Annual General Meeting (AGM), came into effect from May 23, 2017, and will beeffective until the 2020 AGM, unless a further policy is proposed by the Company andapproved by shareholders in the meantime. The Policy has evolved over time, to align with: Shell’s strategy, market practice andshareholders’ views. A consistent and competitive structure, which applies across theworkforce, is also a core principle. This consistency allows for a culture of sharedpurpose and performance.
The Executive Directors’ remuneration structure is made up of a fixed element of basicpay and the majority of the package is tied to two variable elements: the annual bonus(50% delivered in shares) and the Long-term Incentive Plan (LTIP). Variable payoutcomes are conditional on the successful execution of the operating plan in the shortterm and financial out-performance over the longer term. Furthermore, the award ofshares under the bonus and LTIP, along with significant shareholding requirements, isintended to ensure executives build up a sizeable shareholding stake in Royal Dutch Shellplc (the Company) and experience the same outcomes as shareholders.
Directors’ Remuneration Policy
EXECUTIVE DIRECTORS
Executive Directors’ remuneration policy tableElement Purpose and link to strategy Maximum opportunity Operation and performance measurementBase salary andpensionable basesalary
Provides a fixed level ofearnings to attract and retainExecutive Directors.
We have retained a maximumof €2,000,000, for both basesalary and pensionable basesalary, in the context ofcurrent peer group base salarylevels.
Base salary and pensionable base salary (where different) are reviewed annually with salaryadjustments effective from January 1 each year. In making salary determinations, the Remuneration Committee (REMCO) will consider:■ the market positioning of the Executive Directors’ compensation packages;■ comparison with Senior Management salaries;■ the employee context, and planned average salary increase for other employees across three
major countries – the Netherlands, the UK and the USA;■ the experience, skills and performance of the Executive Director, or any change in the
scope and responsibility of their role;■ general economic conditions, Shell’s financial performance, and governance trends; and■ the impact of salary increases on pension benefits and other elements of the package. For Executive Directors employed outside their base country, euro base salaries are translatedinto their home currencies for pension plan purposes. Pensionable base salaries are maintainedin line with euro base salaries taking into account exchange rate fluctuations and other factorsas determined by REMCO.
Benefits Provides benefits, in line withthose applicable to the widerworkforce, in order to attract andretain Executive Directors.
The maximum opportunity isthe cost to the Company ofproviding the relevant benefitas specified in Shell’s standardpolicies. These costs can vary.
Benefits that Executive Directors typically receive include car allowances and transport to andfrom home and office, risk benefits (for example ill-health, disability or death-in-service), aswell as employer contributions to insurance plans (such as medical). Precise benefits willdepend on the Executive Director’s specific circumstances such as nationality, country ofresidence, length of service, and family status. Post-retirement benefits such as healthcare maybe applicable under their country-specific policies. Shell’s mobility policies may apply, suchas for relocation and tax return preparation support, as may tax equalisation related toexpatriate employment prior to Board appointment, or in other limited circumstances to offsetdouble taxation. REMCO may adjust the range and scope of the benefits offered in the contextof developments for other employees in relevant countries. Personal loans or guarantees arenot provided to Executive Directors. In relation to the maximum opportunity, and by way of example, maximum relocation andtax equalisation settlement benefits will be the grossed-up cost of meeting the specificExecutive Director’s costs incurred as a result of appointment and any associated relocation (inline with Shell’s policy), and will depend on a variety of factors such as length of service,salary increase on appointment and the tax regime in place at the time.
GOVERNANCE SHELL ANNUAL REPORT AND FORM 20-F 2017 109

Executive Directors’ remuneration policy table (continued)Element Purpose and link to strategy Maximum opportunity Operation and performance measurementAnnual bonus Rewards the delivery of short-term
operational targets as derived fromShell’s operating plan as well asindividual contribution to Shell. To reinforce alignment with shareholderinterests, 50% is delivered in cash and50% is delivered in shares. Shares aresubject to a three-year holding period,which applies beyond an ExecutiveDirector’s tenure.
Maximum bonus (as apercentage of base salary):■ Chief Executive Officer
(CEO): 250%■ Other Executive Directors:
240% Target levels (as a percentageof base salary):■ CEO: 150%■ Other Executive Directors:
120%
■ The bonus is determined by reference to performance from January 1 to December31 each year.
■ Annual bonus = base salary x target bonus % x scorecard result (0–2); adjusted forindividual performance with a 0–1.2 multiplier.
■ Taking the Shell operating plan into consideration, REMCO sets stretching scorecardtargets and weightings which support the delivery of the strategy. Measures are relatedto financial performance, operational excellence and sustainable development.Indicative weightings are 30%, 50% and 20% respectively. This balance ensures thatthe achievement of short-term financial performance does not undermine futureshareholder value creation. Stretching individual targets are also set.
■ Scorecard targets will be disclosed in a subsequent Directors’ Remuneration Reportwhen they are no longer deemed to be commercially sensitive.
■ Individual performance is reflected by adjusting the bonus outcome. Upwardadjustment is capped at 20% and subject to the overall maximum bonus cap. TheCEO’s maximum bonus is asymmetrically capped at 250%. There is no limit todownward adjustment.
■ There are no prescribed thresholds or minimum levels of performance that equate to aprescribed payment under the Policy and this structure can result in no bonus beingawarded.
■ The annual bonus is subject to malus provisions before it is delivered and to clawbackprovisions thereafter.
■ REMCO retains the ability to adjust performance measure targets and weightings yearby year within the overall target and maximum payouts approved in the Policy.
LTIP Rewards longer-term value creationlinked to Shell’s strategy. The measurespredominantly focus on financialgrowth and increases in value comparedwith the other oil majors. To reinforce alignment with shareholderinterests, shares delivered from vestedLTIP awards are subject to a three-yearholding period, which applies beyondan Executive Director’s tenure.
Awards may be made up to avalue of 400% of base salary. 2017 Award levels:■ CEO: 340%■ Other Executive Directors:
270% Awards may vest at up to200% of the shares originallyawarded, plus dividends.
■ Award levels are determined annually by REMCO and are set within the maximumapproved in the Policy.
■ Awards may vest between 0% and 200% of the initial award level depending onShell’s performance on either an absolute basis, or on a relative basis against the otheroil majors.
■ For 2017, performance is assessed over a three-year period based on absolute freecash flow (FCF), which is the sum of cash flow from operating activities and cashflow from investing activities (25%), and the following relative performancemeasures: total shareholder return (TSR) (25%), return on average capital employed(ROACE) growth (25%) and cash flow from operating activities growth (25%). Eachmeasure can vest independently, but if the TSR measure does not result in vesting,then the total vesting level will be capped at 50% of the maximum payout.
■ Although it is possible for no LTIP shares to vest, on current measures andweightings, 5% of the maximum LTIP award would vest if there was a thresholdvesting outcome in respect of FCF and no vesting on the other measures.
■ Additional shares are released representing the value of dividends payable on thevested shares, as if these had been owned from the award date.
■ Following payment of taxes, delivered shares from LTIP awards must be held for afurther three years to align with Shell’s longer-term time horizon and strategy.
■ The LTIP award is subject to malus provisions before it is delivered and to clawbackprovisions thereafter.
■ REMCO may adjust or change the LTIP measures, targets and weightings to ensurecontinued alignment with Shell’s strategy.
GOVERNANCE SHELL ANNUAL REPORT AND FORM 20-F 2017 110

NOTES TO THE EXECUTIVE DIRECTORS’ REMUNERATION POLICY TABLEBenefitsBenefits for Executive Directors deemed taxable in the UK are included as taxablebenefits in the single total figure of remuneration table. These elements may includetransport to and from home and office, the provision of home security, and occasionalbusiness-required spouse travel, which are generally considered legitimate businessexpenses rather than components of remuneration. Annual bonusFor the 2017 performance year, the scorecard framework will consist of cash flow fromoperating activities (30% weight), operational excellence (50% weight) and sustainabledevelopment (20% weight). REMCO believes it is important for annual variable pay toremain balanced, with operational and environmental components, complementing theLTIP’s focus on longer-term financial outcomes. The same annual bonus scorecardapproach applies to Senior Management and other senior executives, supportingconsistency of remuneration and alignment of objectives.
Executive Directors’ remuneration policy table (continued)Element Purpose and link to strategy Maximum opportunity Operation and performance measurementPension Provides a competitive
retirement provision in line withthe individual’s base countrybenefits policy, to attract andretain Executive Directors.
By reference to pensionable base salary,pension accrual and contribution rates andother pensionable elements, as determined bythe rules of the base country pension plan ofwhich the Executive Director is a member.
Executive Directors’ retirement benefits are maintained in line with those of thewider workforce in their base country. Only base salary is pensionable, unlesscountry plan regulations specify otherwise. The rules of the relevant plans detailthe pension benefits which members can receive on retirement (including on ill-health), death or leaving service. REMCO retains the right to amend the form ofany Executive Director’s pension arrangements where appropriate, for examplein response to changes in legislation to ensure the original objective of thiselement of remuneration is preserved.
Shareholding Aligns interests ofExecutive Directors with those ofshareholders by creating aconnection between individualwealth and Shell’s long-termperformance.
Shareholding (% of base salary):■ CEO: 700%■ Other Executive Directors: 400%
Executive Directors are expected to build up their shareholding to the requiredlevel over a period of five years from appointment and, once reached, tomaintain this level for the full period of their appointment. The intention is forthe shareholding guideline to be reached through retention of vested sharesfrom share plans. REMCO will monitor individual progress and retains theability to adjust the guideline in special circumstances on an individual basis.
GOVERNANCE SHELL ANNUAL REPORT AND FORM 20-F 2017 111

For future years, the specific measures and weightings for the annual bonus scorecard willbe reviewed annually by REMCO and adjusted accordingly to evolve with Shell’sstrategy and circumstances. The annual review will also consider the scorecard target andoutcome history over a decade to ensure that the targets set remain stretching but realistic.REMCO retains the right to exercise its judgement to adjust the mathematical bonusscorecard outcome to ensure that the bonus scorecard outcome for Executive Directorsreflects other aspects of Shell’s performance which REMCO deems appropriate for thereported year. REMCO is aware that the simple application of arithmetic performancetargets may lead to anomalies between business performance and shareholder experienceand therefore careful consideration is given to formulaic outcomes. REMCO has a trackrecord of using its discretion to make downward adjustments where appropriate. REMCO strengthens the Executive Directors’ individual accountability by increasing ordecreasing their annual bonuses to take account of how well they have delivered againsttheir individual performance targets. Shell operates this approach for most of itsemployees. These individual targets typically relate to qualitative differentiators notalready covered by the scorecard. Examples for the Executive Directors have includedmanagement of transformative portfolio changes, portfolio development, andorganisational and financial leadership. This individual performance element preservesconsistency with the wider workforce and reinforces and drives a company-wide cultureof performance and behaviour. At the end of the one-year performance period, 50% of the annual bonus is delivered incash and 50% is delivered in shares. Shares are subject to a three-year holding period,which remains in force beyond an Executive Director’s tenure.
Long-term incentive planThe LTIP rewards longer-term performance linked to Shell’s strategy, which includescash generation and capital discipline, as well as value created for shareholders. The LTIP measures are predominantly based on relative outperformance compared withthe other oil majors, in line with our strategic intent to be a leader in the oil and gasindustry. For 2017, the measures will consist of absolute FCF and relative growthcompared with our peers based on the following: TSR, ROACE and cash flow fromoperating activities. REMCO will regularly review the measures, weightings andcomparator group, and retains the right to adjust these to ensure that the LTIP continuesto serve its intended purpose and level of challenge. FCF performance is measured by aggregating annual absolute FCF performance over thethree-year performance period and then comparing the outcome to the aggregate of ourplan FCF targets over three years. The outstanding (maximum), target and threshold(minimum) levels are declared at the end of the performance period and will be theaggregate respective annual outstanding, target and threshold levels for each year of theperformance period. A straight-line vesting schedule will apply for
performance between threshold and outstanding. The target, along with the ranges forthreshold and outstanding performance, is set by reference to our operating plan and is inline with our cash flow priorities, namely: to service and reduce debt, pay dividends, buyback shares and make future capital investments. For relative measures, we measure and rank growth based on the data points at the end ofthe performance period compared with those at the beginning of the period, usingpublicly reported data. When comparing performance against the other oil majors, therelative performance ranking is as indicated in the table below.
TSR underpinIf the TSR ranking is fourth or fifth, the level of the award that can vest on the basis ofthe three other measures will be capped at 50% of the maximum payout for the LTIP. Performance outcomesREMCO retains discretion to adjust the mathematical outcome if it believes that this isdistorted by circumstances which are unrelated to performance, for example, reportingchanges, ranking clustering, or corporate events in the comparator group. Upwardadjustment would only be considered after consultation with major shareholders. Anexplanation of any such adjustment would be set out in the relevant Directors’Remuneration Report.
GOVERNANCE SHELL ANNUAL REPORT AND FORM 20-F 2017 112

LTIP performance is assessed over a three-year period. Vested shares from the LTIP aresubject to a further three-year holding period post vesting, which remains in forcebeyond an Executive Director’s tenure. This time horizon has been extended and isdeemed to be suitable for incentive purposes, but is recognised as short relative to someof Shell’s operations. However REMCO believes that it provides for broad alignment withshareholder interests when coupled with significant shareholding requirements.
Treatment of outstanding awardsAwards granted prior to the approval and implementation of this Policy and/or prior to anindividual becoming an Executive Director will continue to vest and be delivered inaccordance with the terms of the original award even if this is not consistent with theterms of this Policy. As at March 8, 2017, this applies to Executive Directors Ben van Beurden and SimonHenry who each have outstanding awards under the LTIP and DBP. Jessica Uhl, who isappointed an Executive Director with effect from March 9, 2017, has outstanding awardsunder the LTIP. ShareholdingREMCO believes significant shareholding by Executive Directors is an important way ofensuring that shareholders and Executive Directors share the same priorities.Shareholding is one of Shell’s core remuneration principles as it creates a balancedconnection between individual wealth and Shell’s long-term performance. This willsupport effective governance and an ownership mindset. Significant shareholdingrequirements reflect the performance timescales of Shell and are aligned with absoluteshareholder return. The CEO is expected to build up a shareholding of seven times their base salary over fiveyears from appointment. Other Executive Directors are expected to build up ashareholding of four times their base salary over the same period. In the event of anincrease to the guideline multiple of salary, for every additional multiple of salaryrequired, the director will have one extra year to reach the increased guideline, subject toa maximum of five years from the date of the change. The holding periods for LTIP vested shares and shares delivered as part of the annualbonus continue to apply after Executive Directors leave employment. This is to ensuredeparting executives continue to have their interests aligned with those of shareholders. DIFFERENCES FOR EXECUTIVE DIRECTORS FROM OTHER EMPLOYEESThe remuneration structure and approach to setting remuneration levels is consistentacross Shell, with consideration given to location, seniority and responsibilities. However,a higher proportion of total remuneration is tied to variable pay for Executive Directorsand members of Senior Management. The salary for each Executive Director is determined based on the indicators in the“Executive Directors’ remuneration policy table”, which reflect the international nature ofthe Executive Directors’ labour market. The salary for other employees is normally set ona country basis.
Executive Directors are eligible to receive the standard benefits and allowances providedto other staff. The provisions which are not generally available for other employees aredescribed in “Benefits”. The methodology used for determining the annual bonus for Executive Directors isbroadly consistent with the approach for Shell employees generally. However, theindividual performance factor for Executive Directors is capped at 1.2 and the scorecardused for the majority of Shell staff may differ in the make-up and weighting of themetrics used. Like Executive Directors, members of Senior Management receive 50% oftheir annual bonus in shares. Executive Directors are not eligible to receive new awards under employee share plansother than the LTIP, although awards previously granted will continue to vest inaccordance with the terms of the original award. Selected employees participate in thePerformance Share Plan (PSP). The operation of the PSP is similar to the LTIP, butcurrently differs, for example, in some performance measures and their relativeweightings. As at March 2017, around 55,000 employees participate in one or more ofShell’s global share plans and/or incentive plans, further supporting alignment withshareholder interests. Executive Directors’ retirement benefits are maintained in line with those of the widerworkforce in their base country. There are no special pension arrangements exclusive toExecutive Directors. ILLUSTRATION OF POTENTIAL REMUNERATION OUTCOMESThe charts on page 114 represent estimates under three performance scenarios(“Minimum”, “On-target”, and “Maximum”) of the potential remuneration outcomes foreach Executive Director resulting from the application of 2017 base salaries to awards,expected to be made in 2017 in accordance with the Policy.
GOVERNANCE SHELL ANNUAL REPORT AND FORM 20-F 2017 113

The majority of Executive Directors’ remuneration is delivered through variable payelements, which are conditional on the achievement of stretching targets. The scenario charts are based on future Policy award levels and are combined withprojected single total figures of remuneration. The pay scenarios are forward-looking andonly serve to illustrate the future Policy.
For simplicity, the scenarios assume no share price movement and exclude dividendaccrual, for the portion of the bonus paid in shares and the LTIP, although dividendaccrual during the performance and holding period applies. The scenarios are based on the current CEO (Ben van Beurden) and incoming CFO(Jessica Uhl) roles.
MALUS AND CLAWBACKVariable pay awards may be made subject to adjustment events. At the discretion ofREMCO, such an award may be adjusted before delivery (malus) or reclaimed afterdelivery (clawback) if an adjustment event occurs. Adjustment events will be specified inaward documentation and it is intended that they will, for example, relate to restatementof financial results due to: non-compliance with a financial reporting requirement; ormisconduct by an Executive Director or misconduct through their direction or non-direction. REMCO retains the right to alter the list of adjustment events in respect offuture awards.
In addition, REMCO will retain discretion in assuring itself that there is satisfactoryunderlying performance before releasing any variable pay to Executive Directors andmay withhold all or some of the bonus or shares awarded if it considers that theunderlying performance (financial, environmental, safety or other) of Shell is inadequate.
NON-EXECUTIVE DIRECTORS
Non-executive Directors’ remuneration policy tableFee structure Approach to setting fees Other remunerationNon-executive Directors (NEDs) receive a fixed annual feefor their directorship. The size of the fee will differ basedon the position on the Board: Chair of the Board fee orstandard Non-executive Director fee. Additional annual fee(s) are payable to any director whoserves as Senior Independent Director, a Board committeechair, or a Board committee member. A NED receives either a chair or member fee for eachcommittee. This means that a chair of a committee does notreceive both fees. NEDs receive an additional fee for any Board meetinginvolving intercontinental travel – except for one meetinga year held in a location other than The Hague.
The Chair’s fee is determined by REMCO.The Board determines the fees payable toNEDs. The maximum aggregate annual feeswill be within the limit specified by theArticles of Association and in accordancewith the NEDs’ responsibilities and timecommitments.
The Board reviews NED fees periodically toensure that they are aligned with those ofother major listed companies.
Business expenses incurred in respect of the performance of their duties as aNED will be paid or reimbursed by Shell. Such expenses could includetransport between home and office and occasional business-required spousetravel. Where required, the Chair is offered Shell-provided accommodationin The Hague. REMCO has the discretion to offer other benefits to the Chairas appropriate to their circumstances. Where business expenses or benefitscreate a personal tax liability to the director, Shell may cover the associatedtax. The Chair and the other NEDs cannot receive awards under any incentiveor performance-based remuneration plans, and personal loans or guaranteesare not granted to them. NEDs do not accrue any retirement benefits as a result of their non-executive directorships with Shell. NEDs are encouraged to hold shares with a value equivalent to 100% oftheir fixed annual fee and maintain that holding during their tenure.
GOVERNANCE SHELL ANNUAL REPORT AND FORM 20-F 2017 114

RECRUITMENTEXECUTIVE DIRECTORSREMCO determines the remuneration package for new Executive Director appointments.These appointments may involve external or internal recruitment or reflect a change inrole of a current Executive Director.
When determining remuneration packages for new Executive Directors, REMCO willseek a balanced outcome which allows Shell to: ■ attract and motivate candidates of the right quality;■ take into account the individual’s current remuneration package and other contractual
entitlements;■ seek a competitive pay position relative to our comparator group, without overpaying;■ encourage relocation if required; and■ honour entitlements (for example, variable remuneration) of internal candidates before
their promotion to the Board.
NON-EXECUTIVE DIRECTORSREMCO’s approach to setting the remuneration package for NEDs is to offer fee levelsand specific benefits (where appropriate) in line with the “Non-executive Directors’remuneration policy table” and subject to the Articles of Association. NEDs are notoffered variable remuneration or retention awards. When determining the benefits for a new Chair, the individual circumstances of the futureChair will be taken into account.
DIRECTORS’ EMPLOYMENT ARRANGEMENTS AND LETTERS OFAPPOINTMENTExecutive Directors are employed for an indefinite period. Executive Directors with theNetherlands as their base country will be employed on the basis of a contract ofemployment governed by Dutch employment law. For Executive Directors with a basecountry other than the Netherlands, REMCO will determine their employmentarrangements based on a number of considerations, including Dutch immigrationrequirements and base country retirement benefits. NEDs, including the Chair, haveletters of appointment. Executive Directors’ employment arrangements and NEDs’ lettersof appointment are available for inspection at the AGM or on request. For further detailson appointment and re-appointment of Directors, see the “Directors’ Report” on page 74.
REMCO will follow the approach set out in the table below when determining the remuneration package for a new Executive Director.
Remuneration packageComponent Approach Maximum
Ongoing remuneration The salary, benefits, annual bonus, long-term incentives and pension benefits will bepositioned and delivered within the framework of the Executive Directors’ remunerationpolicy.
As stated in the “Executive Directors’remuneration policy table”.
Compensation for the forfeiture of anyawards under variable remunerationarrangements
To facilitate external recruitment, one-off compensation in consideration for forfeited awardsunder variable remuneration arrangements entered into with a previous employer may berequired. REMCO will use its judgement to determine the appropriate level of compensationby matching the value of any lost awards under variable remuneration arrangements with thecandidate’s previous employer. This compensation may take the form of a one-off cashpayment or an additional award under the LTIP. The compensation can alternatively be basedon a newly created long-term incentive plan arrangement where the only participant is thenew director.
An amount equal to the value of the forfeitedvariable remuneration awards, as assessed byREMCO. Consideration will be given toappropriate performance conditions,performance periods and clawbackarrangements.
Replacement of forfeited entitlementsother than any awards under variableremuneration arrangements
There may also be a need to compensate a new Executive Director in respect of forfeitedentitlements other than any awards under variable remuneration arrangements. This couldinclude, for example, pension or contractual entitlements, or other benefits. On recruitment,these entitlements may be replicated within the Executive Directors’ remuneration policy orvalued by REMCO and compensated in cash.
In cases of internal promotion to the Board, any commitments made which cannot beeffectively replaced within the Executive Directors’ remuneration policy may, at REMCO’sdiscretion, continue to be honoured.
An amount equal to the value of the forfeitedentitlements, as assessed by REMCO.
Exceptional recruitment incentive Apart from the ongoing annual remuneration package and any compensation in respect ofthe replacement of forfeited entitlements, there may be circumstances in which REMCO needsto offer a one-off recruitment incentive in the form of cash or shares to ensure the rightexternal candidate is attracted. REMCO recognises the importance of internal successionplanning but it must also have the ability to compete for talent with other global companies.The necessity and level of this incentive will depend on the individual’s circumstances.
One times the LTIP award level, subject tothe limits set out in the “Executive Directors’remuneration policy table”.
GOVERNANCE SHELL ANNUAL REPORT AND FORM 20-F 2017 115

END OF EMPLOYMENTEXECUTIVE DIRECTORSNotice periodEmployment arrangements of Executive Directors can generally end by either theemployee or the employer providing one month’s notice, or the applicable statutorynotice period. For example, under Dutch law, the statutory notice period for the employerwill vary in line with the length of service, with the maximum being four months’ notice.Under Dutch law, termination payments are not linked to the contract’s notice period. The Netherlands statutory end-of-employment compensationWith effect from July 1, 2015, new employment legislation in the Netherlands introducedstatutory end-of-employment compensation. Under this legislation, every termination(other than following retirement or for cause) of a Dutch employment contract that hascontinued for a minimum of two years will give rise to an obligation to pay the departingemployee transition compensation (“transitievergoeding”). The statutory compensation iscapped at one times the annual salary, which is deemed to include variable pay such
as the annual bonus. Executive Directors are expected not to claim transitioncompensation or any other applicable statutory compensation over and above the agreedcompensation for loss of office as set out in the “End of employment” table on page 116. Outstanding entitlementsIn cases of resignation or dismissal for cause, fixed remuneration (base salary, benefits,and employer pension contributions) will cease on the last day of employment, variableremuneration elements will generally lapse and the Executive Director is not eligible forcompensation for loss of office. The information, on page 116, generally applies to termination of employment by Shellgiving notice, by mutual agreement, or in situations where the employment terminatesbecause of retirement with Shell consent at a date other than the normal retirement date,redundancy or in other similar circumstances at REMCO’s discretion.
End of employmentProvision Policy
Compensation for loss of office For Executive Directors appointed prior to 2011, REMCO may offer a termination payment of up to one times annual pay (base salary plustarget bonus). For Executive Directors appointed between January 1, 2011 and December 31, 2016, employment contracts include a cap on terminationpayments of one times annual pay (base salary plus target bonus). Delivery of compensation is mitigated by a contractual obligation for theExecutive Director to seek alternative employment and the Company’s ability to implement phased payment terms. For Executive Directors appointed on or after January 1, 2017, REMCO may offer a termination payment of up to one times base salary(target bonus will not be included). However, REMCO may be obligated to pay statutory compensation over and above the compensationfor loss of office to a departing Executive Director who asserts a statutory claim thereto. Delivery of compensation is mitigated by acontractual obligation for the Executive Director to seek alternative employment and the Company’s ability to implement phased paymentterms. The reimbursement of standard end-of-employment benefits such as repatriation costs and outplacement support may also be included, asdeemed reasonable by REMCO. REMCO may adjust the termination payment for any situation where a full payment is inappropriate, taking into consideration applicablelaw, corporate governance provisions and the best interests of the Company and shareholders as a whole.
Annual bonus Any annual bonus in the year of departure is prorated based on service. Depending on the timing of the departure, REMCO may considerthe latest scorecard position or defer payment until the full-year scorecard result is known. DBP shares and bonus delivered in shares represent the bonus which a participant has already earned and carry no further performanceconditions; therefore these shares will be unrestricted at the conclusion of the normal deferral or holding period respectively and noproration will apply.
LTIP Outstanding awards are prorated on a monthly basis, by reference to the Executive Director’s service within the performance period. Theywill generally survive the end of employment and will remain subject to the same vesting performance conditions, and malus and clawbackprovisions, as if the Executive Director had remained in employment. The three-year holding period will also remain in force for anyawards made on or after January 1, 2017. If the participant dies before the end of the performance period, the award will vest at the targetlevel on the date of death. In case of death after the end of the performance period, the award will vest as described in this Policy.
GOVERNANCE SHELL ANNUAL REPORT AND FORM 20-F 2017 116

NON-EXECUTIVE DIRECTORSNo payments for loss of office will be made to NEDs. CONSIDERATION OF OVERALL PAY AND EMPLOYMENTCONDITIONSWhen setting the Policy, no specific employee groups were consulted. However, Shellseeks to promote and maintain good relations with employee representative bodies as partof its employee engagement strategy, and consults on matters affecting employees andbusiness performance as required. When determining Executive Directors’ remuneration structure and outcomes, REMCOreviews a set of information, including relevant reference points and trends, whichincludes internal data on employee remuneration (for example, employee relationsmatters in respect of remuneration and average salary increases applying in theNetherlands, UK and the USA). During the Policy review, pay and employmentconditions of the wider Shell employee population were taken into account by adheringto the same performance, rewards and benefits philosophy for the Executive Directors, aswell as overall benchmarking principles. Furthermore, any potential differences fromother employees (see “Differences for Executive Directors from other employees”) weretaken into account when providing REMCO with advice in the formation of this Policy. Dialogue between management and staff is important, with the annual Shell PeopleSurvey being one of the principal means of gathering employee views on a range ofmatters. The Shell People Survey includes questions inviting employees’ views on theirpay and benefit arrangements. The Company also encourages share ownership amongemployees, and many are shareholders who are able to participate in the vote on thePolicy at the AGM. REMCO is kept informed by the CEO, the Chief Human Resources & Corporate Officerand the Executive Vice President Remuneration, Benefits & Services on the bonusscorecard and any relevant remuneration matters affecting Senior Management and othersenior executives, extending to multiple levels below the Board.
CONSIDERATION OF SHAREHOLDER VIEWSREMCO engages with major shareholders on a regular basis throughout the year and thisallows it to hear views on Shell’s remuneration approach and test proposals whendeveloping or evolving the Policy. Recent examples of REMCO responding toshareholder views include introducing greenhouse gas management to variable pay andsetting FCF as an absolute measure in the LTIP performance conditions. REMCO will review the Policy regularly to ensure it continues to reinforce Shell’s long-term strategy and remains closely aligned with shareholders’ interests. ADDITIONAL POLICY STATEMENTREMCO reserves the right to make payments outside the Policy in limited exceptionalcircumstances, such as for regulatory, tax or administrative purposes or to take account ofa change in legislation or exchange controls, and only where REMCO considers suchpayments are necessary to give effect to the intent of the Policy. Signed on behalf of the Board /s/ Linda M. Szymanski Linda M. SzymanskiCompany SecretaryMarch 14, 2018
GOVERNANCE SHELL ANNUAL REPORT AND FORM 20-F 2017 117

Financial Statements and SupplementsIndependent Auditor’s Report to the members of Royal Dutch Shell plc
REPORT ON THE FINANCIAL STATEMENTS1. OUR OPINIONS AND CONCLUSIONS ARISING FROM OUR AUDIT1.1 Our opinion on the financial statements
In our opinion, the financial statements of Royal Dutch Shell plc (the Parent Company) and its subsidiaries (collectively, Shell):
■ give a true and fair view of the state of Shell’s and of the Parent Company’s affairs as at December 31, 2017, and of Shell’s and the Parent Company’s income for the year thenended;
■ have been properly prepared both in accordance with International Financial Reporting Standards (IFRS) as adopted by the European Union (EU) and IFRS as issued by theInternational Accounting Standards Board (IASB); and
■ have been prepared in accordance with the requirements of the Companies Act 2006, and, as regards Shell’s financial statements, Article 4 of the IAS Regulation.
1.2 Our opinion on other matters prescribed by the Companies Act 2006In our opinion:
■ the part of the Directors’ Remuneration Report to be audited has been properly prepared in accordance with the Companies Act 2006; and
■ based on the work undertaken in the course of our audit:
■ the information given in the Strategic Report and the Directors’ Report for the financial year for which the financial statements are prepared is consistent with the financialstatements; and
■ the Strategic Report and the Directors’ Report have been prepared in accordance with applicable legal requirements.
1.3 Matters on which we are required to report by exceptionOur confirmations that we have nothing to report by exception, in relation to those matters where we are required so to report, are set out in sections 9 and 10 below. 1.4 What we have auditedWe have audited Royal Dutch Shell plc’s financial statements for the year ended December 31, 2017, which are included in the Annual Report and Form 20-F (the Annual Report) andcomprise:
Shell Parent CompanyConsolidated Balance Sheet as at December 31, 2017 Balance Sheet as at December 31, 2017Consolidated Statement of Income for the year then ended Statement of Income for the year then endedConsolidated Statement of Comprehensive Income for the year then ended Statement of Comprehensive Income for the year then endedConsolidated Statement of Changes in Equity for the year then ended Statement of Changes in Equity for the year then endedConsolidated Statement of Cash Flows for the year then ended Statement of Cash Flows for the year then endedRelated Notes 1 to 29 to the Consolidated Financial Statements, including a summary of significant accounting policies
Related Notes 1 to 15 to the Parent Company Financial Statements
The financial reporting framework that has been applied in the preparation of the financial statements is applicable law and both IFRS as adopted by the EU and IFRS as issued by theIASB.
FINANCIAL STATEMENTS AND SUPPLEMENTS SHELL ANNUAL REPORT AND FORM 20-F 2017 118

2. BASIS FOR OUR OPINIONWe conducted our audit in accordance with International Standards on Auditing (UK) (ISA (UK)) and applicable law. Our responsibilities under those standards are further describedin the Auditor’s responsibilities for the audit of the financial statements section of our report below. We are independent of Shell and the Parent Company in accordance with the ethicalrequirements that are relevant to our audit of the financial statements in the UK, including the FRC’s Ethical Standard as applied to listed public interest entities, and we have fulfilledour other ethical responsibilities in accordance with these requirements. We believe that the audit evidence we have obtained during the planning, execution and conclusion of our audit is sufficient and appropriate to provide a suitable basis for ouropinion. 3. USE OF OUR REPORTThis report is made solely to the company’s members, as a body, in accordance with Chapter 3 of Part 16 of the Companies Act 2006. Our audit work has been undertaken so that wemight state to the company’s members those matters we are required to state to them in an auditor’s report and for no other purpose. To the fullest extent permitted by law, we do notaccept or assume responsibility to anyone other than the company and the company’s members as a body, for our audit work, for this report, or for the opinions we have formed. 4. OUR CONCLUSIONS RELATING TO PRINICIPAL RISKS, GOING CONCERN AND VIABILITY STATEMENTWe have nothing to report in respect of the following information in the Annual Report, in relation to which ISA(UK) requires us to report to you whether we have anything materialto add or draw attention to:
■ the disclosures in the Annual Report set out on pages 12 to 16 that describe the principal risks and cross refer to where there are explanations of how the risks are being managedor mitigated;
■ the Directors’ confirmation set out on page 82 in the Annual Report that they have carried out a robust assessment of the principal risks facing the entity, including those thatwould threaten its business model, future performance, solvency or liquidity;
■ the Directors’ statement set out on pages 73 to 75 in the financial statements about whether they considered it appropriate to adopt the going concern basis of accounting inpreparing them, and their identification of any material uncertainties to the entity’s ability to continue to do so over a period of at least twelve months from the date of approvalof the financial statements;
■ whether the Directors’ statement in relation to going concern required under the Listing Rules in accordance with Listing Rule 9.8.6R(3) is materially inconsistent with ourknowledge obtained in the audit; or
■ the Directors’ explanation set out on pages 73 to 75 in the Annual Report as to how they have assessed the prospects of the entity, over what period they have done so and whythey consider that period to be appropriate, and their statement as to whether they have a reasonable expectation that the entity will be able to continue in operation and meet itsliabilities as they fall due over the period of their assessment, including any related disclosures drawing attention to any necessary qualifications or assumptions.
FINANCIAL STATEMENTS AND SUPPLEMENTS SHELL ANNUAL REPORT AND FORM 20-F 2017 119

5. OVERVIEW OF OUR AUDIT APPROACH
FINANCIAL STATEMENTS AND SUPPLEMENTS SHELL ANNUAL REPORT AND FORM 20-F 2017 120

6. OUR APPLICATION OF MATERIALITYThe scope of our work is influenced by our view of materiality. As we develop our audit strategy, we determine materiality at the overall level and at the individual account level(referred to as our ‘performance materiality’).
Overall materiality
What we mean We apply the concept of materiality both in planning and performing our audit, and in evaluating the effect of identified misstatements (includingomissions) on our audit and in forming our audit opinion. For the purposes of determining whether Shell’s financial statements are free frommaterial misstatement (whether due to fraud or error), we define materiality as the magnitude of misstatements that, individually or in the aggregate,could reasonably be expected to influence the economic decisions of the users of these financial statements. We are required to establish a materialitylevel for the financial statements as a whole that is appropriate in the light of Shell’s particular circumstances.Our overall materiality provides a basis for identifying and assessing the risk of material misstatement and determining the nature and extent of auditprocedures. Our evaluation of materiality requires professional judgement and necessarily takes into account qualitative as well as quantitativeconsiderations. It also takes into account our assessment of the expectations of those charged with governance at Shell and users of Shell’s financialstatements.As required by auditing standards, we reassess materiality throughout the duration of the audit.
Level set Group materialityWe set our preliminary overall materiality for Shell’s Consolidated Financial Statements at $800 million (2016: $800 million). We kept this underreview throughout the year and reassessed the appropriateness of our original assessment in the light of Shell’s results and external marketconditions. On the basis of this review, we did not find it necessary to revise our level of overall materiality.Parent Company materialityWe determined materiality for the Parent Company to be $2.5 billion (2016: $800 million), which is 1% (2016: 0.3%) of equity. Equity is anappropriate basis to determine materiality for an investment holding company and 1% is a typical percentage of equity to use to determinemateriality. In our 2016 audit of the Parent Company we applied the same materiality of $800 million as the group as we did not consider itappropriate to set our materiality at a higher level than the materiality applied to the Consolidated Financial Statements in our first year as Shell’sauditor. Any balances in the Parent Company financial statements that were relevant to our audit of the consolidated group were audited using anallocation of group performance materiality.
Our basis for determiningmateriality for 2017
Our assessment of overall materiality is $800 million. This is derived from an average of Shell’s CCS earnings, excluding identified items reportedby Shell in its quarterly results announcements and adjusted for an effective tax rate. This average included both backward and forward-lookingelements. The $800 million was determined by applying a percentage to the calculated average CCS earnings. When using an earnings-relatedmeasure to determine overall materiality, the norm is to apply a benchmark percentage of 5% of the pre-tax measure. In the case of Shell, becauseour earnings estimate includes a forward-looking element, we have applied a more prudent rate that is below the 5% benchmark. Our overallmateriality is also less than 5% of the 2017 income before taxation.In determining materiality, auditing standards require us to use benchmark measures, such as pre-tax income, gross profit and total revenue.Nevertheless, we have to exercise considerable judgement, including the need to take account of the volatility of the benchmarks applied and toconsider which earnings, activity or capital based measure aligns best with the expectations of users of Shell’s financial statements and the AuditCommittee (AC).We considered Shell’s business updates, the levels of activity in the business and the associated financial performance of 2017 relative to historicperformance and expected future performance. We also considered current and forecast commodity prices for oil and natural gas, the impact ofShell’s disposal programme as well as the basis on which overall materiality was determined in the previous year.In our view, including a forward-looking element in the calculation of average earnings is more appropriate at this time, due to the low oil priceenvironment, which commenced part way through 2015.In determining the most appropriate benchmark on which to base our materiality assessment, we have applied a ‘reasonable investor perspective’.This reflects our understanding of the common financial information needs of the users of Shell’s financial statements as a group, which we believeis CCS earnings, excluding identified items. Shell’s results announcements feature CCS
FINANCIAL STATEMENTS AND SUPPLEMENTS SHELL ANNUAL REPORT AND FORM 20-F 2017 121
earnings excluding identified items as the primary measure for earnings.CCS earnings excluding identified items removes both the effects of changes in oil price on inventory carrying amounts and items disclosed asidentified items that can significantly distort Shell’s results in any one particular year. In our view, the useof CCS earnings excluding identified items allows investors to understand how management has performed in spite of the commodity priceenvironment, as opposed to because of it. Furthermore, analyst forecasts predominately feature CCS earnings, excluding identified items, as the basisfor earnings. The analyst consensus data supports our judgement that CCS earnings, excluding identified items, is the key indicator of performancefrom an analyst’s perspective.The identified items, reported by Shell in its quarterly results announcements, were: net divestment gains ($1.6 billion), impairments ($3.0 billioncharge), fair value accounting of commodity derivatives and certain gas contracts ($0.3 billion loss), redundancy and restructuring ($0.4 billioncharge), impact of exchange rate movements on tax balances ($0.6 billion gain), impact arising from the US tax reform legislation ($2.0 billioncharge) and the aggregate of other individually small items (net $0.2 billion charge).The identified items excluded in 2016 were: net divestment gains ($1.6 billion), impairments ($2.0 billion charge), fair value accounting ofcommodity derivatives and certain gas contracts ($0.6 billion loss), redundancy and restructuring ($1.4 billion charge); impact of exchange ratemovements on tax balances ($0.3 billion gain) and the aggregate of other individually small items (net $1.5 billion charge).On the basis of our analysis of these factors, we concluded that we should focus on Shell’s CCS earnings, excluding identified items reported byShell in its quarterly results announcements, and adjusted for an effective tax rate.
Performance materiality
What we mean Having established overall materiality, we determined ‘performance materiality’, which represents our tolerance for misstatement in an individualaccount. It is calculated as a fraction of overall materiality in order to reduce to an appropriately low level the probability that the aggregate ofuncorrected and undetected misstatements exceeds overall materiality of $800 million for Shell’s financial statements as a whole.Once we determined our audit scope, we then assigned performance materiality to our various in-scope operating units. They used this assignedperformance materiality in performing their group audit procedures. The performance materiality allocation is dependent on the size of the operatingunit, measured by its contribution of earnings to Shell, or other appropriate metric, and risk associated with the operating unit.
Level set On the basis of our risk assessment, our judgement was that performance materiality should be 50% (2016: 50%) of our overall materiality, namely$400 million (2016: $400 million).In 2017, the range of performance materiality allocated to operating units was $40 million to $260 million (2016: $40 million to $220 million). Thisis set out in more detail in section 7 below.
Audit difference reporting threshold
What we mean This is the amount below which identified misstatements are considered to be clearly trivial.The threshold is the level above which we collate and report audit differences to the AC. We also report differences below that threshold that, in ourview, warrant reporting on qualitative grounds. We evaluate any uncorrected misstatements against both the quantitative measures of materialitydiscussed above and in the light of other relevant qualitative considerations in forming our opinion.
Level set We agreed with the AC that we would report to the Committee all audit differences in excess of $40 million (2016: $40 million).
FINANCIAL STATEMENTS AND SUPPLEMENTS SHELL ANNUAL REPORT AND FORM 20-F 2017 122

7. OUR SCOPE OF THE AUDIT OF SHELL’S FINANCIAL STATEMENTS What we mean We are required to establish an overall audit strategy that sets the scope, timing and direction of our audit, and that guides the development of our
audit plan. Audit scope comprises the physical locations, operating units, activities and processes to be audited that, in aggregate, are expected toprovide sufficient coverage of the financial statements in order for us to express an audit opinion.
Criteria for determining our auditscope
Our assessment of audit risk and our evaluation of materiality determined our audit scope for each operating unit within Shell which, when takentogether, enabled us to form an opinion on the financial statements under ISA (UK). Our audit effort was focused towards higher risk areas, such asmanagement judgements and on operating units that are considered significant based upon size, complexity or risk.The factors that we considered when assessing the scope of the Shell audit, and the level of work to be performed at the operating units that are inscope for group reporting purposes, included the following:■ the financial significance of an operating unit to Shell’s earnings, total assets or total liabilities, including consideration of the financial
significance of specific account balances or transactions;■ the significance of specific risks relating to an operating unit, history of unusual or complex transactions, identification of significant audit
issues or the potential for, or a history of, material misstatements;■ the effectiveness of the control environment and monitoring activities, including entity-level controls;■ our assessment of locations that carry a higher than normal audit risk in relation to fraud, bribery or corruption; and■ the findings, observations and audit differences that we noted as a result of our 2016 audit.
Selection of in-scope operatingunits
We selected 67 operating units (2016: 85) across 12 countries (2016: 13) on the basis of their size or risk characteristics. We performed full scopeaudits of the complete financial information of 25 operating units (2016: 33). For the remaining 42 operating units (2016: 52) we performedspecific scope audit procedures on selected account balances within the operating unit based on the size of these individual account balances or theirrisk profiles. These 67 operating units (2016: 85) accounted for 60% of Shell’s CCS earnings* (2016: 63%) and 72% of Shell’s total assets (2016:69%).In addition to the 67 operating units (2016: 85) discussed above, we selected a further 47 operating units (2016: 32) where we performedprocedures at the operating unit level that were specified by the group audit team in response to specific risk factors. Also, we performed reviewprocedures at an additional four operating units (2016: 11).The remaining 688 operating units (2016: 601) together represented 27% of CCS earnings* (2016: 25%) and 16% of total assets (2016: 19%). Noneof these was individually greater than 1.3% (2016: 1.0%) of CCS earnings* or 0.5% (0.3%) of total assets. For these operating units, we performedsupplementary audit procedures, including process and controls testing at the business service centres (BSCs); testing of IT systems auditing theaccounting of specific one-off transactions, testing of consolidation journals and disaggregated analytical reviews. In addition to this testing, weutilised our Risk Scan analytics techniques, which consolidate internal and external data in order to identify potential risks of material misstatement.This allowed us to risk rate each of the 688 operating units. The internal and external data sources included transactional data, forensic risk metrics,historic control findings and results from our audit procedures and quarterly reviews. Through this analysis, our analytics tool identified 140operating units (together representing 8% of CCS earnings* and 4% of total assets) where we believed that it was appropriate to carry out targetedtesting, which included audit of manual journal entries and/or the testing of payments to third party vendors to ensure that these had been approvedin line with Shell’s policies and had an appropriate business rationale.We kept our audit scope under review throughout the year in order to reflect changes in Shell’s underlying business and risks.Our final coverage is summarised below:
FINANCIAL STATEMENTS AND SUPPLEMENTS SHELL ANNUAL REPORT AND FORM 20-F 2017 123

Allocation of performancemateriality to the in-scopeoperating units
The level of materiality that we applied in undertaking our audit work at the operating unit level was determined by applying a percentage of ourtotal performance materiality. This percentage is based on the significance of the operating unit relative to Shell as a whole and our assessment of therisk of material misstatement at that operating unit. In 2017, the range of materiality applied at the operating unit level was $40 million to $260million (2016: $40 million to $220 million). The operating units selected, together with the ranges of materiality applied, were:
Countries No. of operating units Range of materiality applied$ million
Full scope SegmentsIntegrated Gas Australia, Qatar 4 80-120Upstream Brazil, Nigeria, UK, USA 7 80-120Downstream Germany, Singapore, USA 4 80-120Corporate UK 1 80
Full scope FunctionTrading and supply UK, USA 9 80-260
Total full scope 25 Specific scope Segments
Upstream Canada, Kazakhstan, Malaysia, UK 7 60-80Downstream Canada, the Netherlands, Singapore, USA 10 80Corporate The Netherlands, UK, USA 12 40-80
Specific scope FunctionTrading and supply UK, USA 13 60-260
Total specific scope 42 Total full and specific scope 67
FINANCIAL STATEMENTS AND SUPPLEMENTS SHELL ANNUAL REPORT AND FORM 20-F 2017 124

Integrated group team structure
The overall audit strategy is determined by the Senior Statutory Auditor, Allister Wilson. During 2017 he visited five countries (in year of audittransition, 2016: nine countries) to meet with local Ernst & Young (EY) teams and Shell local management (in some cases more than once). TheSenior Statutory Auditor is supported by 26 segment and function partners and directors (2016: 24), who are based in the Netherlands and the UK.They are responsible for directing, supervising and reviewing the work of EY global network firms operating under our instruction (local EY teams)to evaluate whether:■ the work was performed and documented to a sufficiently high standard;■ the local EY audit team demonstrated that they had challenged management sufficiently and had executed their audit procedures with a
sufficient level of scepticism; and■ there is sufficient appropriate audit evidence to support the conclusions reached.
Involvement with local EY teams
Shell has centralised processes and controls over key areas within a number of BSCs. We have a central team who provide direct oversight, review,and coordination of our BSC audit teams. Our teams performed centralised testing in the BSCs for certain accounts, including revenue, cash andpayroll. In establishing our overall approach to the group audit we determined the type of work that needed to be undertaken at each of theoperating units or BSCs by the group audit team or by auditors from other local EY teams.
The group audit team performed procedures directly on 54 of the in-scope operating units (2016: 57). For the operating units where the work wasperformed by local EY auditors, we determined the appropriate level of involvement to enable us to determine that sufficient appropriate auditevidence had been obtained as a basis for our opinion on Shell as a whole.The group audit team interacted regularly with the local EY teams during each stage of the audit, were responsible for the scope and direction of theaudit process and reviewed key working papers. This, together with the additional procedures performed at the group level, gave us sufficientappropriate audit evidence for our opinion on Shell’s Consolidated Financial Statements. We maintained continuous and open dialogue with ourlocal EY teams in addition to holding formal meetings quarterly to ensure that we were fully aware of their progress and results of their procedures.Our local EY partners attended our global team meetings in November 2016 and 2017. Also during 2017, the Senior Statutory Auditor and othergroup audit partners and directors visited operating units across 10 countries and each of Shell’s BSCs. These visits included discussing the auditapproach with the local EY teams and any issues arising from their work, meetings with local management, attending planning and closing meetings,and reviewing key audit working papers on risk areas. The visits also promote deeper engagement with our local EY audit teams, ensuring that aconsistent and cohesive audit approach is adopted that drives a high-quality audit. The countries and the BSC locations visited were as follows:
Countries visited BSCs Australia Malaysia UK Chennai, India Kuala Lumpur, Malaysia Brazil The Netherlands USA Glasgow, UK Manila, Philippines Germany Nigeria Krakow, Poland Kazakhstan Qatar 8. OUR ASSESSMENT OF KEY AUDIT MATTERSAs Shell’s auditor, we are required to determine – from the matters communicated by us to the AC during the year – those matters that required significant attention from us inperforming our audit of Shell’s 2017 Consolidated Financial Statements. In making this determination we took the following into account:
■ the risks that we believed were significant to our audit and therefore required special audit consideration;
■ areas of higher assessed risk of material misstatement that influenced our audit focus;
■ significant audit judgements relating to areas in Shell’s Consolidated Financial Statements that involved significant management judgement, including accounting estimates thatwe identified as having high estimation uncertainty;
■ the effect on our audit of significant events or transactions that occurred during the period; and
■ those assessed risks of material misstatement that had the greatest effect on the allocation of resources in the audit and directing the efforts of the audit team.
On this basis, we have identified the following key audit matters that, in our professional judgement, were of most significance in our audit of Shell’s 2017 Consolidated FinancialStatements. These matters included those that had the greatest effect on: the overall strategy; the allocation of resources in the audit; and directing the efforts of the audit team. The keyaudit matters have been addressed in the context of the audit of Shell’s Consolidated Financial Statements as a whole, and in forming our opinion thereon, and we do not provide aseparate opinion on these matters.
FINANCIAL STATEMENTS AND SUPPLEMENTS SHELL ANNUAL REPORT AND FORM 20-F 2017 125
The table below describes the key audit matters, a summary of our procedures carried out and our key observations that we communicated to the AC. We presented to the May andDecember 2017 meetings of the AC the procedures that we planned to undertake in response to the risks that we identified.
Our key audit matters
Risk Our response to the riskKey observations communicated to the Shell Audit Committee
The estimation of oil and gas reserves, including reserves used in the calculation of depreciation, depletion and amortisation (DD&A)
At December 31, 2017, Shell reported 12,233 million barrelsof oil equivalent of proved developed and undevelopedreserves. (2016: 13,248 million barrels of oil equivalent).The estimation and measurement of oil and gas reserves impactsa number of material elements of the financial statementsincluding DD&A, impairments, and decommissioning andrestoration provisions. There is technical uncertainty in assessingreserve quantities and complex contractual arrangements thatdetermine Shell’s share of reserves.
Proved reserves estimates, calculated pursuant to SEC rules, havedeclined in recent years due to continued low prices. Their usagein determining DD&A for certain fields with phaseddevelopment or where volumes are not reflective of expectedfuture production would accelerate depreciation charges in away that would not be reflective of their useful life. In thesecases, Shell has used an alternative reserves base for DD&Apurposes so as to reflect better their expected useful life.
Our reserves team comprises auditors with substantial oil and gasreserves expertise, valuation experience and relevant qualifications inenergy economics.
We carried out the following procedures:■ confirmed our understanding of Shell’s oil and gas reserves
estimation process;■ tested significant controls in Shell’s reserves framework;■ confirmed that significant additions or reductions in SEC proved
reserves have been made in the period in which the new informationbecame available;
■ tested Shell’s internal certification process and controls for technicaland commercial experts responsible for reserves estimation;
■ tested the reasonableness of SEC proved undeveloped reservesrecognised. Where volumes recognised remain undeveloped formore than five years from the date they were booked, or wheredevelopment is not expected for at least five years, we ensured thatShell was still working towards development by corroborating withfuture development plans, including capital expenditure plans asappropriate; and
■ where SEC proved developed reserves were not used for DD&Apurposes, we challenged management’s basis and obtained sufficientand appropriate evidence to ensure that the reserves base used wasreasonable and better reflected the expected useful life of the field orfacilities.
Our procedures were led by the group audit team, with input from ourteams in Australia, Brazil, Canada, Kazakhstan, the Netherlands, Nigeria,Norway, Qatar, the UK and USA.
In January 2018, we communicated to theAC that, based on our testing performed,we had not identified any significanterrors in the oil and gas reserves estimatesand concluded that the inputs andassumptions used to estimate provedreserves were reasonable.
We also communicated our conclusionthat the changes in the estimates ofreserves used in the DD&A calculationsreflect better the expected useful life ofthe field or facilities.
Cross-reference: See the AC Report on page 92 for details on how the AC considered DD&A. Also, see Notes 2 and 8 to the “Consolidated Financial Statements”, and Supplementary information – oil and gas (unaudited) on page 179.
FINANCIAL STATEMENTS AND SUPPLEMENTS SHELL ANNUAL REPORT AND FORM 20-F 2017 126
Risk Our response to the riskKey observations communicated to the Shell Audit Committee
The recoverable amounts of exploration and production assets, and investments in joint ventures and associates in Upstream and Integrated Gas segments
At December 31, 2017, Shell recognised $172 billion ofexploration and production assets within property, plant andequipment (PP&E) (2016: $188 billion). Shell also recognisedinvestments in joint ventures and associates of $28 billion(2016: $33 billion), which includes joint ventures andassociates relating to Upstream and Integrated Gas segments.A sustained low oil and gas price environment could have asignificant impact on the recoverable amounts of Shell’sUpstream and Integrated Gas assets.
In view of the generally long-lived nature of Shell’s assets, themost critical assumption in forecasting future cash flows ismanagement’s view on the long-term oil and gas price outlook.
Other key inputs used in assessing recoverable amounts are thediscount rate used, future expected production volumes andcapital and operating expenditures. Shell uses a discount rate thatreflects the fact that cash flows are adjusted for risk.
We carried out procedures in all full and specific scope locations asnecessary, including testing for indicators of impairment and validatingthe appropriateness of the level at which the testing took place.
We confirmed that Shell’s asset impairment methodology wasappropriate. Our modelling experts tested the integrity of the modelsused.
For price assumptions, we corroborated future short and long-termcommodity prices to external forecasts and those adopted by otherinternational oil companies; we confirmed prices were used consistentlyacross Shell and that pricing differentials were reasonable andappropriate.
We engaged our oil and gas valuations team to test the reasonableness ofthe discount rate used for impairment testing.
For those assets impaired previously, we evaluated the actual resultsversus the assumptions made and whether or not reversals are required.For cash flow inputs where impairment tests were undertaken, we:■ confirmed that operating expenditure profiles and capital costs to
complete construction could be supported by approved operatorbudgets and management forecasts;
■ reconciled reserves volumes in the impairment models andconfirmed that the life-of-field assumptions were consistent withthose applied in the decommissioning and restoration provisionmodels; and
■ performed sensitivity analyses on certain key variables in the basecase cash flow models to understand the impact of changes in certainassumptions (including oil and gas prices, production and operatingexpenditure levels).
We assessed the reasonableness of the probability-weighting applied tothe scenario risk factors used in the models and the basis for the riskingof the cash flows applied to each individual asset. In so doing, weconsidered the stage of the life of the asset, country risk and ensuredconsistency across similar developments and fields.
Where impairment tests were undertaken, we stress tested the modelsusing risked discount rates that we considered reasonable when takingaccount of the nature of the asset, its location, its stage of developmentand associated risks.
The audit procedures over this risk area were performed by our groupaudit team as well as our local EY teams in Australia, Brazil, Canada,Kazakhstan, Malaysia, the Netherlands, Nigeria, Qatar, the UK and USA,which covered 79% of PP&E and investments in joint ventures andassociates in Upstream and Integrated Gas segments.
We also performed specified procedures over the recoverability ofPP&E balances in Kazakhstan, the Netherlands, Norway and the USAwhich covered an additional 6% of PP&E in Upstream and IntegratedGas segments.
We reported to the October 2017 andJanuary 2018 meetings of the AC that, onthe basis of our analysis of futurecommodity prices used in the impairmentmodels versus other international oilcompanies and consensus analysts’forecasts, there is strong external evidenceto support the reasonableness of Shell’scommodity price assumptions – both inthe short and long term.
We concluded that the impairmentsrecorded are appropriately determined.Where impairment tests were undertakenand no impairment was recorded, weperformed specific procedures includingmulti-dimensional sensitivity analysis onthe key assumptions that drive theimpairment analysis, and concluded that itis reasonable and supportable not torecord an impairment charge.
Where potential indicators of impairmentreversals were present, we were satisfiedthat the decisions not to reversepreviously recorded impairments weresupported by appropriate evidence.
Cross-reference: See the AC Report on page 92 for details on how the AC considered impairments. Also, see Notes 2 and 8 to the “Consolidated Financial Statements”.
FINANCIAL STATEMENTS AND SUPPLEMENTS SHELL ANNUAL REPORT AND FORM 20-F 2017 127

Risk Our response to the riskKey observations communicated to the Shell Audit Committee
Estimation of decommissioning and restoration (D&R) provisions
At December 31, 2017, Shell recognised D&R provisions of$21 billion (2016: $25 billion).D&R provisions are highly judgemental, as they are calculatedusing cost models based on assumptions that are impacted byfuture activities and the legislative environment in which Shelloperates.
D&R provisions are also affected by changes in the estimateddate on which production will cease.
The cost models are managed at a country level with certain keyassumptions derived centrally. Shell discounts future estimatedD&R costs at 4% (2016: 4%).
In auditing the D&R provisions we:■ identified the cost assumptions that have the most significant impact
on the provisions and tested the appropriateness of theseassumptions using third party evidence, including rig and vesselrates;
■ engaged our valuations experts to evaluate the reasonableness of thediscount rate applied to the provisions;
■ audited the integrity of the underlying models, engaging ourmodelling team or using a spreadsheet analyser tool whereappropriate;
■ verified the completeness of the cost estimate data by comparing itwith work performed on oil and gas reserves and testing of PP&E;
■ tested the consistency of, and rationale for, the contingent factorsapplied in the cost estimate model, which are derived from locationspecific analysis;
■ performed a review to ensure that all key movements wereunderstood, corroborated and recorded correctly;
■ agreed cost estimates for non-Shell-operated ventures to informationprovided by third parties. We investigated any significantdifferences between this information and the amount provided byShell;
■ tested contingent liabilities for D&R liabilities arising from assetspreviously disposed of; and
■ assessed whether D&R movements should be recorded in the incomestatement or capitalised by understanding the reason for the changeand by comparing the movement with the carrying amount of therelated asset.
Our full and specific scope audit procedures over D&R provision wereperformed by our local EY teams in Australia, Brazil, Canada,Kazakhstan, Malaysia, Nigeria, Qatar, the Netherlands, the UK and theUSA. These covered 64% of the decommissioning and other provisionsbalance. We also performed specified procedures over these balances inthe Netherlands, Norway, and the USA which covered 11% of thedecommissioning and other provisions balance.
In January 2018, we communicated to theAC that:■ on the basis of the audit work
performed, we had concluded thatthe D&R provisions recorded aresupported by appropriate auditevidence;
■ changes in D&R provisions duringthe year have been reflectedappropriately in the financialstatements; and
■ the discount rate applied bymanagement is supportable and lieswithin an acceptable range.
Cross-reference: See the AC Report on page 92 for details on how the AC considered D&R provisions. Also, see Note 18 to the “Consolidated Financial Statements”.
FINANCIAL STATEMENTS AND SUPPLEMENTS SHELL ANNUAL REPORT AND FORM 20-F 2017 128

Risk Our response to the riskKey observations communicated to the Shell Audit Committee
Accounting for assets under Shell’s disposal programme
At December 31, 2017, Shell disclosed $1.0 billion of assets asheld for sale (2016: $0.3 billion). During 2017, Shell receivedcash proceeds of $8.8 billion (2016: $2.1 billion) from the saleof PP&E and businesses.Shell’s divestment programme continues and there are a numberof assets for which sales and purchase agreements have beenreached and others where negotiations continue to progress.Shell actively monitors the progress of each material assetdisposal to assess whether or not the IFRS 5 criteria to beclassified as an Asset Held for Sale (AHFS) are met. This re-classification may have impairment and/or disclosureimplications. The risk relates to accounting for assets under Shell’s disposalprogramme given the rise in innovative deal structures, wherethe traditional approach of a clean break is no longer the norm.Examples include the retention of certain obligations, and theacquisition of new rights and interests. This introducesconsiderably more complexity in accounting for such deals, as isevident in the Canadian Oil Sands and Motiva transactions.
Our audit procedures for potential disposals focused on auditingmanagement’s assessment of the likelihood of a sale occurring within 12months from the year end. As at December 31, 2017, there were nomaterial disposals involving significant judgements as to whether or nota sale was ‘highly probable’.
The most significant complex disposals in 2017 related to thediscontinuation of the Motiva joint venture and subsequentredistribution of the assets, and the disposal of the Canadian Oil Sandsand concurrent joint acquisition of Marathon Oil Canada Corporation.
Our audit procedures on these complex transactions included asappropriate to each disposal:■ gaining an understanding of the transaction through enquiry and
review of contractual arrangements;■ testing the tax consequences of the transactions, including the impact
on deferred tax assets recognised;■ assessing whether the accounting treatment was appropriate,
including consideration of alternative views;■ testing the methodology and the integrity of models used in the fair
value of acquired assets and businesses;■ testing the appropriateness of the key assumptions, including price
assumptions and discount rates, used for the valuation of the re-acquired assets; testing the measurement of consideration on disposalof the asset, including deferred and contingent consideration; andthe release of cumulative currency translation differences that maybe triggered by the disposal; and
■ assessing how any retained D&R liabilities should be accounted for.
The audit procedures were carried out principally by the group auditteam, as well as our US and Canadian audit teams covering the mostsignificant and complex transactions that occurred during the year.
We communicated to the May and July2017 meetings of the AC that the disposaland business combination elements ofboth Canadian Oil Sands and Motivatransactions were appropriately accountedfor.
At the January 2018 AC meeting, weconfirmed that we had performed areview of all material transactions,whether or not complete, and we weresatisfied that assets disposal transactionscompleted during the year wereappropriately accounted for, and thatthere were no other material assets wherea sale was highly probable as at December31, 2017, that should be classified as heldfor sale and therefore tested forimpairment.
Cross-reference: See the AC Report on page 92 for details on how the AC reviewed matters in relation to disposals. Also see Notes 2 and 29 to the “Consolidated Financial Statements”.
FINANCIAL STATEMENTS AND SUPPLEMENTS SHELL ANNUAL REPORT AND FORM 20-F 2017 129

Risk Our response to the riskKey observations communicatedto the Shell Audit Committee
Recognition and measurement of deferred tax assets (DTAs)
At December 31, 2017, Shell recognised gross DTAs totalling$29 billion (2016: $34 billion), which are recognised withintwo balance sheet line items, deferred tax assets and as anoffset against deferred tax liabilities, depending on the overalltax position in a particular jurisdiction.A significant proportion of DTA balances are supported byforecast future taxable profits, which are derived from Shell’scommodity price assumptions and business plans.
Estimating DTAs therefore requires significant judgement,including the timing of reversals of deferred tax liabilities (DTL)and the availability of future profits against which tax deductionsrepresented by the DTAs can be offset.
In some cases, the DTA will be utilised in a period substantiallybeyond the period of the operating plan. Sustained lowcommodity prices increase the risk to the recoverability of theDTA due to the fact that sufficient future taxable profits may notbe achieved.
We considered the expected timing of utilisation of the DTA includingthe relevant country tax laws that apply to the utilisation of tax losses.This included the ability to carry tax losses forward or back and anyrestrictions arising from ring fencing tax losses to particular projects.
Our procedures depended on whether or not the DTAs were supportedby the unwinding of taxable temporary differences, forecast taxableprofits or tax planning opportunities that would be necessary to utilisetax losses.
We assessed whether the forecast timing of the unwinding of taxabletemporary differences were appropriate after considering the nature ofthe temporary difference and the relevant tax law.For DTAs that are supported by forecast taxable profits or tax planningopportunities, we:■ stress tested the commodity price and/or other key assumptions that
underpin Shell’s assessment of forecast probable taxable profits;■ determined the extent to which sufficient probable taxable profits
would arise in the period within which the related losses would beavailable for utilisation, considering for example limits on the lengthof time that losses can be carried forward (applicable to the USA, theNetherlands and China in particular) or if losses are ring fenced fortax purposes (including the UK and Nigeria); and
■ considered whether the tax balances were calculated usingappropriate, and substantively enacted, tax laws and rates.
For the tax planning strategies necessary to justify the recognition of theDTAs, we considered whether or not the planning was reasonable and inline with the current tax law, including satisfying ourselves thatsufficient profits would be available in the appropriate periods.
Our audit procedures over the recognition and valuation of DTAs wereperformed by our tax specialist teams in Australia, Brazil, Germany,Nigeria, Singapore, Qatar, the UK and USA, which covered 53% of thegross DTA balance. We also performed specified procedures over therecognition and valuation of DTAs in Canada, China, Denmark, France,Ireland, Kazakhstan, the Netherlands, New Zealand, Norway and theUK, which covered an additional 40% of the gross DTA balance.
We reported our conclusions to theJanuary 2018 meeting of the AC that wehad challenged the robustness of the keymanagement judgements and confirmedthat we were satisfied:■ as to the existence of DTLs available
for offset in the same jurisdiction asthe DTAs;
■ that where DTAs recognised arebased on income forecast to arisebeyond Shell’s planning horizon, weconsider that there was sufficientfuture taxable profit that is probableto support the DTAs; however, wenoted that a greater degree ofjudgement is required in recognisingDTAs beyond Shell’s planninghorizon; and
■ that tax planning strategies necessaryto justify the recognition of the DTAsare reasonable.
We also reported to the AC that the DTAswere appropriately recognised and valuedat the year end.
Cross-reference: See the AC Report on page 92 for details on how the AC reviewed certain tax matters, in particular the recoverability of deferred tax assets. Also see Notes 2 and 16 to the “Consolidated Financial Statements”.
FINANCIAL STATEMENTS AND SUPPLEMENTS SHELL ANNUAL REPORT AND FORM 20-F 2017 130

Risk Our response to the riskKey observations communicatedto the Shell Audit Committee
Impact of US tax reform
At December 31, 2017, the net impact of the US tax reform isas follows: $2.6 billion net reduction of DTA balance with a$2.0 billion charge to the 2017 income statement.
The US tax reform was signed into law on December 22,2017. Because the legislation was enacted prior to December 31,2017, its impact was required to be reflected in Shell’s 2017financial statements.
The tax reform significantly changes US corporate income taxlaw by reducing the corporate income tax rate from 35% to21%, creating a territorial tax system (with a one-time mandatorytax on previously deferred foreign earnings), broadening the taxbase and allowing for immediate expensing of certain qualifiedproperty.
A key area of judgement and estimation in the calculation relatedto the level of profits that are subject to the transition tax.
We audited the impact of the US tax reform and engaged our US taxspecialists to assist in interpreting the impact of the new legislation onShell.
Our audit procedures relating to US tax reform included:■ understanding the legislation and considering its application to
Shell’s circumstances as well as the judgements made;■ testing the completeness of Shell’s assessment of the tax accounting
impact;■ assessing the appropriateness of the key assumptions used for the
calculation of the impact, in particular the one-time transition tax;■ testing the methodology and integrity of the models used to
determine the accounting impact; and■ challenging the appropriateness of the split of the impact between the
income statement and other comprehensive income.
The audit procedures in relation to this risk were performed principallyby the group audit team and the full scope component team in the USA.
We reported to the January 2018 meetingof the AC that, based on our auditprocedures, we were satisfied withmanagement’s calculations of the impactof the US tax reform and the keyjudgements related thereto.
We further confirmed to the AC that weconsider the tax accounting treatmentadopted by management to be consistentwith the legislation on the basis of all theinformation that management couldreasonably have been expected to obtain.
We also highlighted to the AC that,because the interpretation and applicationof the legislation is untested, it is possiblethat changes to Shell’s assessment of theappropriate tax accounting treatmentcould be made as further legislativeguidance is issued.
Cross-reference: See the AC Report on page 92 for details on how the AC reviewed impact of the US tax reform. Also see Notes 2 and 16 to the “Consolidated Financial Statements”.
Revenue recognition relating to unrealised trading gains and losses
Shell’s trading and supply function is integrated within theDownstream, Integrated Gas and Upstream segments and isspread across multiple regions. It is inherently complex andexposes Shell to risks that are not normally associated with coreoil and gas activities. Whilst trading is not uncommon amongstinternational oil and gas companies, it does require a robustinternal control environment that is commensurate with that of afinancial institution.
In our audit, we have considered the risk of unrealised tradinggains and losses recognised as a result of unauthorised tradingactivity or deliberate misstatement of Shell’s trading positions.
The deliberate misstatement of Shell’s trading positions or mis-marking of positions could result in understated trading losses,overstated trading profits and/or individual bonuses beingmanipulated through inappropriate inter-period profit/lossallocations.
In order to address the specific risks associated with Shell’s trading andsupply function, our trading audit teams comprised individuals whohave significant experience of auditing both large commodity tradingorganisations and financial institutions.
Our audit procedures focused on:■ investigations as to whether or not there were any breakdowns of
trading controls or instances of rogue trading reported or known orsuspected frauds;
■ testing controls across the trading and supply function, including ITgeneral and IT application controls;
■ independently obtaining confirmation of a sample of open tradingpositions with brokers and counterparties, or performing alternativeprocedures as necessary;
■ performing valuation testing of derivative positions, includingconfirming the appropriateness of price curves used;
■ performing independent testing of valuation models, focusing onvalidating contract terms and key assumptions; and
■ testing the completeness of the amounts recorded in the financialstatements through procedures to detect unrecorded liabilities as wellas detailed cut-off procedures around sales, purchases, tradereceivables and trade payables.
The audit procedures to address this risk were performed principally bythe group audit team and the full scope component team in the USA.
We confirmed that:■ we tested the valuation of derivative
contracts as at December 31, 2017;■ our testing – through a combination
of controls testing and expandedsubstantive audit procedures –satisfied us that the models used tovalue contracts were appropriate forthe purposes of the valuationsincluded in Shell’s ConsolidatedFinancial Statements; and
■ the unrealised gains and losses hadbeen recorded appropriately.
Cross-reference: See Note 19 to the “Consolidated Financial Statements”.
FINANCIAL STATEMENTS AND SUPPLEMENTS SHELL ANNUAL REPORT AND FORM 20-F 2017 131

Risk Our response to the riskKey observations communicatedto the Shell Audit Committee
Enhancements to Shell’s system of IT general controls
Shell management continued to devote significant effort in 2017to enhancing Shell’s system of IT general controls (ITGCs)following further system integration and other changes to Shell’sfinance systems and global IT processes.
During any period of significant system change, there is anincreased risk to the internal financial control environment.Consequently, in addition to the inherent risks associated withauditing the IT systems of a complex global organisation such asShell, the audit team focused its procedures on the followingidentified risks:■ the ongoing migration of legacy BG ERP systems and
processes into Shell’s reporting structure and chart ofaccounts;
■ the migration of certain IT activities to an IT hub; and■ further standardisation of Shell’s User Access Management
process.
Our procedures focused on the key IT processes and controls over ITsystems critical to our audit. These included: management of changes tosystems and access to systems; and IT operations, such as problem andincident management, and back-up and restore.
We updated our understanding of Shell’s key IT applications and ITtransitions that impacted our financial statement audits by carrying outwalk-through tests. We identified 130 applications that were critical toour audit and therefore included in our audit scope. We also assessed therisk associated with any key business or IT changes and identified andtested application and IT dependent manual controls that we consideredkey to the business processes related to financial reporting.
Our audit approach involved central testing of ITGCs that we consideredimportant to the financial statements, including:■ management of changes to systems;■ management of access to systems; and■ management of IT operations.
Throughout 2017, we communicated tothe AC the progress of our testing ofinternal controls, including the centraltesting of ITGCs.
In January 2018, we confirmed that,through a combination of control testingand substantive audit procedures, wewere satisfied that we had obtainedsufficient and appropriate evidence overShell’s management of changes tosystems, access to systems and of IToperations for the purpose of ourfinancial statement audit.
Cross-reference: See the AC Report on page 92 for details on how the AC reviewed the enhancements to Shell’s system of IT general controls.
9. OTHER INFORMATIONThe other information comprises the information included in the Annual Report set out on pages 1 to 117, 179 to 198 and 208 to 226 including the Strategic Report, Governance andAdditional Information sections, other than the financial statements and our auditor’s report thereon. The Directors are responsible for the other information.
Our opinion on the financial statements does not cover the other information and, except to the extent otherwise explicitly stated in this report, we do not express any form of assuranceconclusion thereon.
In connection with our audit of the financial statements, our responsibility is to read the other information and, in doing so, consider whether the other information is materiallyinconsistent with the financial statements or our knowledge obtained in the audit or otherwise appears to be materially misstated. If we identify such material inconsistencies or apparentmaterial misstatements, we are required to determine whether there is a material misstatement in the financial statements or a material misstatement of the other information. If, based onthe work we have performed, we conclude that there is a material misstatement of the other information, we are required to report that fact.
We have nothing to report in this regard.
In this context, we also have nothing to report in regard to our responsibility to specifically address the following items in the other information and to report as uncorrected materialmisstatements of the other information where we conclude that those items meet the following conditions:
■ Fair, balanced and understandable set out on page 74 – the statement given by the Directors that they consider the Annual Report and financial statements taken as a whole isfair, balanced and understandable and provides the information necessary for shareholders to assess Shell’s performance, business model and strategy, is materially inconsistentwith our knowledge obtained in the audit; or
■ Audit Committee reporting set out on page 90 to 93 – the section describing the work of the AC does not appropriately address matters communicated by us to the AC; or
■ Directors’ statement of compliance with the UK Corporate Governance Code set out on page 76 – the parts of the Directors’ statement required under the Listing Rules relating toShell’s compliance with the UK Corporate Governance Code containing provisions specified for review by the auditor in accordance with Listing Rule 9.8.10R(2) do notproperly disclose a departure from a relevant provision of the UK Corporate Governance Code.
FINANCIAL STATEMENTS AND SUPPLEMENTS SHELL ANNUAL REPORT AND FORM 20-F 2017 132

10. MATTERS ON WHICH WE ARE REQUIRED TO REPORT BY EXCEPTIONIn the light of the knowledge and understanding of Shell and the Parent Company, and its environment obtained in the course of the audit, we have not identified materialmisstatements in the Strategic Report or the Directors’ Report.
We have nothing to report in respect of the following matters in relation to which the Companies Act 2006 requires us to report to you if, in our opinion:
■ adequate accounting records have not been kept by the Parent Company, or returns adequate for our audit have not been received from branches not visited by us; or
■ the Parent Company financial statements and the part of the Directors’ Remuneration Report to be audited are not in agreement with the accounting records and returns; or
■ certain disclosures of Directors’ remuneration specified by law are not made; or
■ we have not received all the information and explanations we require for our audit.
11. RESPONSIBILTIES OF DIRECTORSAs explained more fully in the statement of Directors’ responsibilities set out on page 73, the Directors are responsible for the preparation of the Consolidated Financial Statements andfor being satisfied that they give a true and fair view, and for such internal control as the Directors determine is necessary to enable the preparation of financial statements that are freefrom material misstatement, whether due to fraud or error.
In preparing the financial statements, the Directors are responsible for assessing Shell and the Parent Company’s ability to continue as a going concern, disclosing, as applicable, mattersrelated to going concern and using the going concern basis of accounting unless the Directors either intend to liquidate Shell or Parent Company or to cease operations, or have norealistic alternative but to do so.
12. AUDITOR’S RESPONSIBILITIES FOR THE AUDIT OF THE FINANCIAL STATEMENTSOur objectives are to obtain reasonable assurance about whether the financial statements as a whole are free from material misstatement, whether due to fraud or error, and to issue anauditor’s report that includes our opinion. Reasonable assurance is a high level of assurance, but is not a guarantee that an audit conducted in accordance with ISA (UK) will alwaysdetect a material misstatement when it exists. Misstatements can arise from fraud or error and are considered material if, individually or in the aggregate, they could reasonably beexpected to influence the economic decisions of users taken on the basis of these financial statements.
13. EXPLANATION AS TO WHAT EXTENT THE AUDIT WAS CONSIDERED CAPABLE OF DETECTING IRREGULARITIES, INCLUDING FRAUDThe objectives of our audit, in respect to fraud, are; to identify and assess the risks of material misstatement of the financial statements due to fraud; to obtain sufficient appropriateaudit evidence regarding the assessed risks of material misstatement due to fraud, through designing and implementing appropriate responses; and to respond appropriately to fraud orsuspected fraud identified during the audit. However, the primary responsibility for the prevention and detection of fraud rests with both those charged with governance of the entityand management.
Our approach was as follows:
■ We obtained an understanding of the legal and regulatory frameworks that are applicable to Shell and determined that the most significant are those that relate to the reportingframework (IFRS, Companies Act 2006, the UK Corporate Governance Code, the US Securities Exchange Act of 1934 and the Listing Rules of the UK Listing Authority) andthe relevant tax compliance regulations in the jurisdictions in which Shell operates. In addition, we concluded that there are certain significant laws and regulations that may havean effect on the determination of the amounts and disclosures in the financial statements and those laws and regulations relating to health and safety, employee matters,environmental, and bribery and corruption practices.
■ We understood how Shell is complying with those frameworks by making enquiries of management, internal audit, those responsible for legal and compliance procedures andthe Company Secretary. We corroborated our enquiries through our review of Board minutes, papers provided to the AC and correspondence received from regulatory bodiesand noted that there was no contradictory evidence.
■ We assessed the susceptibility of Shell’s Consolidated Financial Statements to material misstatement, including how fraud might occur, by embedding forensic specialists into ouraudit team. Our forensic specialists worked with the group audit team to identify the fraud risks across various parts of the business. In addition, we utilised internal and externalinformation to perform a fraud risk assessment for each of the countries of operation. We considered the risk of fraud through management override and, in response, weincorporated data analytics across manual journal entries into our audit approach. We also considered the possibility of fraudulent or corrupt payments made through thirdparties and conducted detailed analytical testing on third party vendors in high-risk jurisdictions. Where instances of risk behaviour patterns were identified through our dataanalytics, we performed additional audit procedures to address each identified risk. These procedures included testing of transactions back to source information and weredesigned to provide reasonable assurance that the financial statements were free from fraud or error. We also conducted specific audit procedures in relation to the risk of briberyand corruption across various countries of operation determined by a risk based process.
FINANCIAL STATEMENTS AND SUPPLEMENTS SHELL ANNUAL REPORT AND FORM 20-F 2017 133

■ Based on the results of our risk assessment we designed our audit procedures to identify non-compliance with such laws and regulations identified above. Our proceduresinvolved journal entry testing, with a focus on journals meeting our defined risk criteria based on our understanding of the business; enquiries of legal counsel, groupmanagement, internal audit and all full and specific scope management; review of the volume and nature of complaints received by the whistleblowing hotline during the yearand focused testing, as discussed in the key audit matters section 8 above.
■ If any instance of non-compliance with laws and regulations were identified, these were communicated to the relevant local EY teams who performed sufficient and appropriateaudit procedures supplemented by audit procedures performed at the group level. Where appropriate we consulted our forensic specialists.
A further description of our responsibilities for the audit of the financial statements is located on the Financial Reporting Council’s website athttps://www.frc.org.uk/auditorsresponsibilities. This description forms part of our auditor’s report.
14. OTHER MATTERS WE ARE REQUIRED TO ADDRESSFollowing the recommendation of the AC we were re-appointed by the Company’s Annual General Meeting (AGM) on May 23, 2017, as auditor of the Company to hold office untilthe conclusion of the next AGM of the Company, and signed an engagement letter on July 25, 2017. Our total uninterrupted period of engagement is two years covering periods fromour appointment through to the period ended December 31, 2017.
The non-audit services prohibited by the FRC’s Ethical Standard were not provided to Shell or the Parent Company and we remain independent of Shell and the Parent Company inconducting the audit.
Our audit opinion is consistent with our additional report to the AC explaining the results of our audit. /s/ Allister Wilson (Senior Statutory Auditor)for and on behalf of Ernst & Young LLP,Statutory AuditorLondonMarch 14, 2018 1. The maintenance and integrity of the Shell website are the responsibility of the Directors; the work carried out by the auditors does not involve consideration of these matters and, accordingly, the auditors accept no responsibility for any changes that
may have occurred to the financial statements since they were initially presented on the website.2. Legislation in the UK governing the preparation and dissemination of financial statements may differ from legislation in other jurisdictions.
The report set out above is included for the purposes of Royal Dutch Shell plc’s 2017 Annual Report and Accounts only and does not form part of Royal Dutch Shell plc’s AnnualReport on Form 20-F for 2017.
FINANCIAL STATEMENTS AND SUPPLEMENTS SHELL ANNUAL REPORT AND FORM 20-F 2017 134

Report of Independent Registered Public Accounting Firm
TO THE BOARD OF DIRECTORS AND SHAREHOLDERS OF ROYAL DUTCH SHELL PLCOpinion on the Financial StatementsWe have audited the accompanying consolidated balance sheets of Royal Dutch Shell plc (the Company) as of December 31, 2017 and 2016, the related consolidated statements ofincome, comprehensive income, changes in equity and cash flows for each of the two years in the period ended December 31, 2017, and the related notes (collectively referred to asthe Consolidated Financial Statements). In our opinion, the Consolidated Financial Statements present fairly, in all material respects, the consolidated financial position of the Companyat December 31, 2017 and 2016, and the results of its operations and its cash flows for each of the two years in the period ended December 31, 2017, in conformity with InternationalFinancial Reporting Standards (IFRS) as issued by the International Accounting Standards Board (IASB) and in conformity with IFRS as adopted by the European Union.
As discussed in Note 4 to the Consolidated Financial Statements, in 2016 Royal Dutch Shell plc elected to change the composition of its reportable segments. We also audited theadjustments to the 2015 Consolidated Financial Statements to retrospectively reflect the change in composition of reportable segments. In our opinion, such adjustments are appropriateand have been properly applied. We were not engaged to audit, review or apply any procedures to the 2015 Consolidated Financial Statements of the Company other than with respectto the adjustments and, accordingly, we do not express an opinion or any other form of assurance on the 2015 Consolidated Financial Statements taken as a whole.
We also have audited, in accordance with the standards of the Public Company Accounting Oversight Board (United States) (PCAOB), the Company's internal control over financialreporting as of December 31, 2017, based on criteria established in Internal Control-Integrated Framework issued by the Committee of Sponsoring Organizations of the TreadwayCommission (2013 framework), and our report dated March 14, 2018, expressed an unqualified opinion thereon.
Basis for OpinionThese financial statements are the responsibility of the company's management. Our responsibility is to express an opinion on the company’s financial statements based on our audits.We are a public accounting firm registered with the PCAOB and are required to be independent with respect to the company in accordance with the US federal securities laws and theapplicable rules and regulations of the Securities and Exchange Commission and the PCAOB.
We conducted our audits in accordance with the standards of the PCAOB. Those standards require that we plan and perform the audit to obtain reasonable assurance about whether thefinancial statements are free of material misstatement, whether due to error or fraud. Our audits included performing procedures to assess the risks of material misstatement of thefinancial statements, whether due to error or fraud, and performing procedures that respond to those risks. Such procedures included examining, on a test basis, evidence regarding theamounts and disclosures in the financial statements. Our audits also included evaluating the accounting principles used and significant estimates made by management, as well asevaluating the overall presentation of the financial statements. We believe that our audits provide a reasonable basis for our opinion.
/s/ Ernst & Young LLP We have served as the Company’s auditor since 2016.London, United KingdomMarch 14, 2018
TO THE BOARD OF DIRECTORS AND SHAREHOLDERS OF ROYAL DUTCH SHELL PLCOpinion on Internal Control over Financial ReportingWe have audited Royal Dutch Shell plc’s (the Company) internal control over financial reporting as of December 31, 2017, based on criteria established in Internal Control—Integrated Framework issued by the Committee of Sponsoring Organizations of the Treadway Commission (2013 framework) (the COSO criteria). In our opinion, the Companymaintained, in all material respects, effective internal control over financial reporting as of December 31, 2017, based on the COSO criteria.
We also have audited, in accordance with the standards of the Public Company Accounting Oversight Board (United States) (PCAOB), the Consolidated Financial Statements of theCompany, and our report dated March 14, 2018, expressed an unqualified opinion thereon.
Basis for OpinionThe company’s management is responsible for maintaining effective internal control over financial reporting and for its assessment of the effectiveness of internal control overfinancial reporting included in the accompanying Management’s Report on Internal Control over Financial Reporting as set out on page 82. Our responsibility is to express an opinionon the company’s internal control over financial reporting based on our audit. We are a public accounting firm registered with the PCAOB and are required to be independent withrespect to the company in accordance with the US federal securities laws and the applicable rules and regulations of the Securities and Exchange Commission and the PCAOB.
We conducted our audit in accordance with the standards of the PCAOB. Those standards require that we plan and perform the audit to obtain reasonable assurance about whethereffective internal control over financial reporting was maintained in all material respects. Our audit included obtaining an understanding of internal control over financial reporting,assessing the risk that a material weakness exists, testing and evaluating the design and operating effectiveness of internal control based on the assessed risk, and performing such otherprocedures as we considered necessary in the circumstances. We believe that our audit provides a reasonable basis for our opinion.
Definition and Limitations of Internal Control over Financial ReportingA company’s internal control over financial reporting is a process designed to provide reasonable assurance regarding the reliability of financial reporting and the preparation offinancial statements for external purposes in accordance with generally accepted accounting principles. A company’s internal control over financial reporting includes those policiesand procedures that (1) pertain to the maintenance of records that, in reasonable detail, accurately and fairly reflect the transactions and dispositions of the assets of the company; (2)provide reasonable assurance that transactions are recorded as necessary to permit preparation of financial statements in accordance with generally accepted accounting principles, andthat receipts and expenditures of the company are being made only in accordance with authorisations of management and directors of the company; and (3) provide reasonableassurance regarding prevention or timely detection of unauthorised acquisition, use, or disposition of the company’s assets that could have a material effect on the financial statements.
Because of its inherent limitations, internal control over financial reporting may not prevent or detect misstatements. Also, projections of any evaluation of effectiveness to futureperiods are subject to the risk that controls may become inadequate because of changes in conditions, or that the degree of compliance with the policies or procedures may deteriorate.
/s/ Ernst & Young LLPLondon, United KingdomMarch 14, 2018
1. The maintenance and integrity of the Shell website are the responsibility of the Directors; the work carried out by the auditors does not involve consideration of these matters and, accordingly, the auditors accept no responsibility for any changes thatmay have occurred to the financial statements since they were initially presented on the website.
2. Legislation in the UK governing the preparation and dissemination of financial statements may differ from legislation in other jurisdictions.
The reports set out above are included for the purposes of Royal Dutch Shell plc’s 2017 Annual Report on Form 20-F only and do not form part of Royal Dutch Shell plc’s AnnualReport on Accounts for 2017.
FINANCIAL STATEMENTS AND SUPPLEMENTS SHELL ANNUAL REPORT AND FORM 20-F 2017 135

Report of Independent Registered Public Accounting Firm
TO THE BOARD OF DIRECTORS AND ROYAL DUTCH SHELL PLC SHAREHOLDERSIn our opinion, the accompanying Consolidated Statement of Income, the Consolidated Statement of Comprehensive Income, the Consolidated Statement of Changes in Equity, theConsolidated Statement of Cash Flows and the related Notes to the Consolidated Financial Statements for the year ended December 31, 2015 before the effects of the adjustments toretrospectively reflect the change in the composition of reportable segments described in Note 4 present fairly, in all material respects, the results of operations and cash flows of RoyalDutch Shell plc (the Company) and its subsidiaries (collectively Shell), in conformity with International Financial Reporting Standards as issued by the International AccountingStandards Board and in conformity with International Financial Reporting Standards as adopted by the European Union (the 2015 financial statements before the effects of theadjustments discussed in Note 4 are not presented herein). These financial statements are the responsibility of the Company’s management. Our responsibility is to express an opinion on these financial statements based on our audit. Weconducted our audit of these financial statements, before the effects of the adjustments described above, in accordance with the standards of the Public Company Accounting OversightBoard (United States). Those standards require that we plan and perform the audit to obtain reasonable assurance about whether the financial statements are free of materialmisstatement. An audit includes examining, on a test basis, evidence supporting the amounts and disclosures in the financial statements, assessing the accounting principles used andsignificant estimates made by management, and evaluating the overall financial statement presentation. We believe that our audit provides a reasonable basis for our opinion. We were not engaged to audit, review, or apply any procedures to the adjustments to retrospectively reflect the change in the composition of reportable segments described in Note 4and accordingly, we do not express an opinion or any other form of assurance about whether such adjustments are appropriate and have been properly applied. Those adjustmentswere audited by other auditors. /s/ PricewaterhouseCoopers LLPLondon, United KingdomMarch 9, 2016 Note that the report set out above is included for the purposes of Royal Dutch Shell plc’s Annual Report on Form 20-F for 2017 only and does not form part of Royal Dutch Shellplc’s Annual Report and Accounts for 2017.
FINANCIAL STATEMENTS AND SUPPLEMENTS SHELL ANNUAL REPORT AND FORM 20-F 2017 136

Consolidated Financial Statements
138 Consolidated Statement of Income138 Consolidated Statement of Comprehensive Income139 Consolidated Balance Sheet140 Consolidated Statement of Changes in Equity141 Consolidated Statement of Cash Flows142 Notes to the Consolidated Financial Statements142 Note 1 Basis of preparation142 Note 2 Significant accounting policies, judgements and estimates148 Note 3 Changes to IFRS not yet adopted149 Note 4 Segment information151 Note 5 Interest and other income151 Note 6 Interest expense152 Note 7 Intangible assets153 Note 8 Property, plant and equipment155 Note 9 Joint ventures and associates156 Note 10 Investments in securities156 Note 11 Trade and other receivables157 Note 12 Inventories157 Note 13 Cash and cash equivalents157 Note 14 Debt and lease arrangements160 Note 15 Trade and other payables160 Note 16 Taxation163 Note 17 Retirement benefits166 Note 18 Decommissioning and other provisions167 Note 19 Financial instruments and other derivative contracts172 Note 20 Share capital172 Note 21 Share-based compensation plans and shares held in trust173 Note 22 Other reserves175 Note 23 Dividends175 Note 24 Earnings per share175 Note 25 Legal proceedings and other contingencies176 Note 26 Employees177 Note 27 Directors and Senior Management177 Note 28 Auditor’s remuneration178 Note 29 Business combinations
FINANCIAL STATEMENTS AND SUPPLEMENTS SHELL ANNUAL REPORT AND FORM 20-F 2017 137

Consolidated Statement of Income $ million Notes 2017 2016 2015
Revenue 4 305,179 233,591 264,960 Share of profit of joint ventures and associates 9 4,225 3,545 3,527 Interest and other income 5 2,466 2,897 3,669 Total revenue and other income 311,870 240,033 272,156 Purchases 223,447 162,574 194,644 Production and manufacturing expenses 26,652 28,434 28,095 Selling, distribution and administrative expenses 10,509 12,101 11,956 Research and development 922 1,014 1,093 Exploration 1,945 2,108 5,719 Depreciation, depletion and amortisation 4 26,223 24,993 26,714 Interest expense 6 4,042 3,203 1,888 Total expenditure 293,740 234,427 270,109 Income before taxation 18,130 5,606 2,047 Taxation charge/(credit) 16 4,695 829 (153 )Income for the period 4 13,435 4,777 2,200 Income attributable to non-controlling interest 458 202 261 Income attributable to Royal Dutch Shell plc shareholders 12,977 4,575 1,939 Basic earnings per share ($) 24 1.58 0.58 0.31 Diluted earnings per share ($) 24 1.56 0.58 0.30
Consolidated Statement of Comprehensive Income $ million Notes 2017 2016 2015
Income for the period 13,435 4,777 2,200 Other comprehensive income/(loss), net of tax 22
Items that may be reclassified to income in later periods: Currency translation differences 5,156 703 (7,121 )Unrealised gains/(losses) on securities 593 (214 ) (707 )Cash flow hedging (losses)/gains (552 ) (617 ) 61 Net investment hedging losses — (2,024 ) — Share of other comprehensive income/(loss) of joint ventures and associates 9 170 (28 ) (40 )
Total 5,367 (2,180 ) (7,807 )Items that are not reclassified to income in later periods:
Retirement benefits remeasurements 604 (3,817 ) 4,951 Other comprehensive income/(loss) for the period 5,971 (5,997 ) (2,856 )Comprehensive income/(loss) for the period 19,406 (1,220 ) (656 )Comprehensive income attributable to non-controlling interest 578 154 155 Comprehensive income/(loss) attributable to Royal Dutch Shell plc shareholders 18,828 (1,374 ) (811 )
FINANCIAL STATEMENTS AND SUPPLEMENTS SHELL ANNUAL REPORT AND FORM 20-F 2017 138
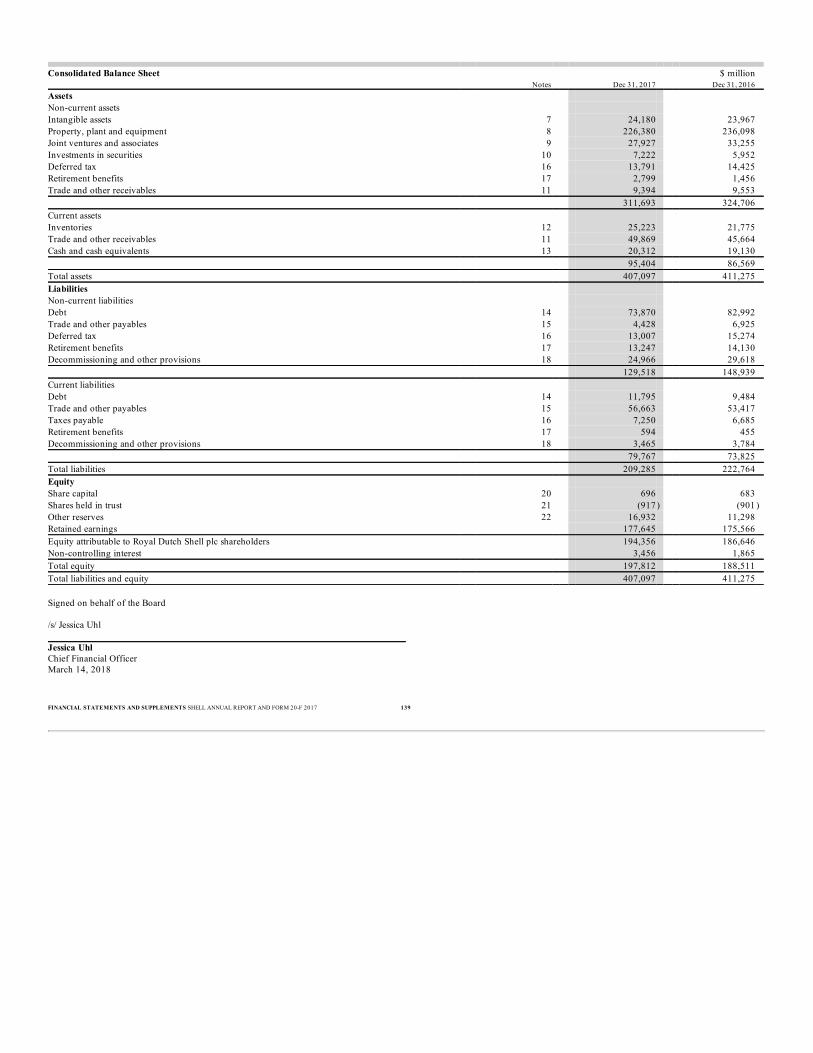
Consolidated Balance Sheet $ million Notes Dec 31, 2017 Dec 31, 2016
Assets Non-current assets Intangible assets 7 24,180 23,967 Property, plant and equipment 8 226,380 236,098 Joint ventures and associates 9 27,927 33,255 Investments in securities 10 7,222 5,952 Deferred tax 16 13,791 14,425 Retirement benefits 17 2,799 1,456 Trade and other receivables 11 9,394 9,553 311,693 324,706 Current assets Inventories 12 25,223 21,775 Trade and other receivables 11 49,869 45,664 Cash and cash equivalents 13 20,312 19,130 95,404 86,569 Total assets 407,097 411,275 Liabilities Non-current liabilities Debt 14 73,870 82,992 Trade and other payables 15 4,428 6,925 Deferred tax 16 13,007 15,274 Retirement benefits 17 13,247 14,130 Decommissioning and other provisions 18 24,966 29,618 129,518 148,939 Current liabilities Debt 14 11,795 9,484 Trade and other payables 15 56,663 53,417 Taxes payable 16 7,250 6,685 Retirement benefits 17 594 455 Decommissioning and other provisions 18 3,465 3,784 79,767 73,825 Total liabilities 209,285 222,764 Equity Share capital 20 696 683 Shares held in trust 21 (917 ) (901 )Other reserves 22 16,932 11,298 Retained earnings 177,645 175,566 Equity attributable to Royal Dutch Shell plc shareholders 194,356 186,646 Non-controlling interest 3,456 1,865 Total equity 197,812 188,511 Total liabilities and equity 407,097 411,275 Signed on behalf of the Board /s/ Jessica Uhl Jessica UhlChief Financial OfficerMarch 14, 2018
FINANCIAL STATEMENTS AND SUPPLEMENTS SHELL ANNUAL REPORT AND FORM 20-F 2017 139

Consolidated Statement of Changes in Equity $ million Equity attributable to Royal Dutch Shell plc shareholders
Share capital(see Note 20)
Sharesheld in trust
(see Note 21)
Otherreserves
(see Note 22) Retainedearnings Total
Non-controlling
interest Total
equity At January 1, 2017 683 (901 ) 11,298 175,566 186,646 1,865 188,511 Comprehensive income for the period — — 5,851 12,977 18,828 578 19,406 Dividends paid (see Note 23) — — — (15,628 ) (15,628 ) (406 ) (16,034 )Scrip dividends (see Note 23) 13 — (13 ) 4,751 4,751 — 4,751 Share-based compensation — (16 ) (204 ) (74 ) (294 ) — (294 )Other changes in non-controlling interest [A] — — — 53 53 1,419 1,472 At December 31, 2017 696 (917 ) 16,932 177,645 194,356 3,456 197,812 At January 1, 2016 546 (584 ) (17,186 ) 180,100 162,876 1,245 164,121 Comprehensive loss for the period — — (5,949 ) 4,575 (1,374 ) 154 (1,220 )Dividends paid (see Note 23) — — — (14,959 ) (14,959 ) (180 ) (15,139 )Scrip dividends (see Note 23) 17 — (17 ) 5,282 5,282 — 5,282 Shares issued 120 — 33,930 — 34,050 — 34,050 Share-based compensation [B] — (317 ) 520 141 344 — 344 Other changes in non-controlling interest [A] — — — 427 427 646 1,073 At December 31, 2016 683 (901 ) 11,298 175,566 186,646 1,865 188,511 At January 1, 2015 540 (1,190 ) (14,365 ) 186,981 171,966 820 172,786 Comprehensive loss for the period — — (2,750 ) 1,939 (811 ) 155 (656 )Dividends paid (see Note 23) — — — (11,972 ) (11,972 ) (117 ) (12,089 )Scrip dividends (see Note 23) 7 — (7 ) 2,602 2,602 — 2,602 Repurchases of shares (1 ) — 1 1 1 — 1 Share-based compensation — 606 (65 ) 48 589 — 589 Other changes in non-controlling interest [A] — — — 501 501 387 888 At December 31, 2015 546 (584 ) (17,186 ) 180,100 162,876 1,245 164,121[A] Includes in 2017 the non-controlling interest of $1,286 million arising on the acquisition of a 50% controlling interest in Marathon Oil Canada Corporation (see Note 8). The remainder in 2017, and the amounts in 2016 and 2015, mainly relate to publicofferings of limited partner units in Shell Midstream Partners, L.P. The difference between the proceeds after tax and the increase in non-controlling interest, measured by reference to the carrying amount of the entity’s net assets at the date of eachtransaction, was recognised in retained earnings.[B] Includes a reclassification of $534 million between shares held in trust and other reserves, with no impact on total equity, in order to appropriately reflect the carrying amount of shares held in trust at cost.
FINANCIAL STATEMENTS AND SUPPLEMENTS SHELL ANNUAL REPORT AND FORM 20-F 2017 140

Consolidated Statement of Cash Flows $ million Notes 2017 2016 2015
Income for the period 13,435 4,777 2,200Adjustment for:
Current tax 6,591 2,731 7,058Interest expense (net) 3,365 2,752 1,529Depreciation, depletion and amortisation 26,223 24,993 26,714Net gains on sale and revaluation of non-current assets and businesses (1,640) (2,141) (3,460)(Increase)/decrease in inventories (2,079) (5,658) 2,827(Increase)/decrease in current receivables (1,686) 2,038 9,852Increase/(decrease) in current payables 607 (2,669) (7,158)Share of profit of joint ventures and associates (4,225) (3,545) (3,527)Dividends received from joint ventures and associates 4,998 3,820 4,627Deferred tax, retirement benefits, decommissioning and other provisions (3,918) (823) (5,827)Other 286 (1,226) 2,648
Tax paid (6,307) (4,434) (7,673)Cash flow from operating activities 35,650 20,615 29,810Capital expenditure (20,845) (22,116) (26,131)Acquisition of BG Group plc, net of cash and cash equivalents acquired 29 — (11,421) —Investments in joint ventures and associates (595) (1,330) (896)Proceeds from sale of property, plant and equipment and businesses 8,808 2,072 4,720Proceeds from sale of joint ventures and associates 2,177 1,565 276Interest received 724 470 288Other 1,702 [A] (203) (664)Cash flow from investing activities (8,029) (30,963) (22,407)Net decrease in debt with maturity period within three months (869) (360) (586)Other debt:
New borrowings 760 18,144 21,500Repayments (11,720) (6,710) (6,023)
Interest paid (3,550) (2,938) (1,742)Change in non-controlling interest 293 1,110 598Cash dividends paid to:
Royal Dutch Shell plc shareholders 23 (10,877) (9,677) (9,370)Non-controlling interest (406) (180) (117)
Repurchases of shares — — (409)Shares held in trust: net purchases and dividends received (717) (160) (39)Cash flow from financing activities (27,086) (771) 3,812Currency translation differences relating to cash and cash equivalents 647 (1,503) (1,070)Increase/(decrease) in cash and cash equivalents 1,182 (12,622) 10,145Cash and cash equivalents at January 1 19,130 31,752 21,607Cash and cash equivalents at December 31 13 20,312 19,130 31,752[A] Includes $2,635 million from the sale of Shell’s interest in Woodside Petroleum Limited (see Note 10).
FINANCIAL STATEMENTS AND SUPPLEMENTS SHELL ANNUAL REPORT AND FORM 20-F 2017 141

Notes to the Consolidated Financial Statements
1 BASIS OF PREPARATIONThe Consolidated Financial Statements of Royal Dutch Shell plc (the Company) and its subsidiaries (collectively referred to as Shell) have been prepared in accordance with theprovisions of the Companies Act 2006 (the Act) and Article 4 of the IAS Regulation, and therefore in accordance with International Financial Reporting Standards (IFRS) as adoptedby the European Union. As applied to Shell, there are no material differences from IFRS as issued by the International Accounting Standards Board (IASB); therefore, the ConsolidatedFinancial Statements have been prepared in accordance with IFRS as issued by the IASB. As described in the accounting policies in Note 2, the Consolidated Financial Statements have been prepared under the historical cost convention except for certain items measured atfair value. Those accounting policies have been applied consistently in all periods. The Consolidated Financial Statements were approved and authorised for issue by the Board of Directors on March 14, 2018. 2 SIGNIFICANT ACCOUNTING POLICIES, JUDGEMENTS AND ESTIMATESThis Note describes Shell’s significant accounting policies, which are those relevant to an understanding of the Consolidated Financial Statements, and includes the measurement basesused in their preparation. It allows an understanding as to how transactions, other events and conditions are reported. It also describes: (a) judgements, apart from those involvingestimations, that management makes in applying the policies that have the most significant effect on the amounts recognised in the Consolidated Financial Statements; and (b)estimations, including assumptions about the future, that management makes in applying the policies. The sources of estimation uncertainty that have a significant risk of a materialadjustment to the carrying amounts of assets and liabilities within the next financial year are specifically identified as a significant estimate. NATURE OF THE CONSOLIDATED FINANCIAL STATEMENTSThe Consolidated Financial Statements are presented in US dollars (dollars) and comprise the financial statements of the Company and its subsidiaries, being those entities over whichthe Company has control, either directly or indirectly, through exposure or rights to their variable returns and the ability to affect those returns through its power over the entities.Information about subsidiaries at December 31, 2017, can be found in Exhibit 8. Subsidiaries are consolidated from the date on which control is obtained until the date that such control ceases, using consistent accounting policies. All inter-company balances andtransactions, including unrealised profits arising from such transactions, are eliminated. Unrealised losses are also eliminated unless the transaction provides evidence of an impairmentof the asset transferred. Non-controlling interest represents the proportion of income, other comprehensive income and net assets in subsidiaries that is not attributable to theCompany’s shareholders. CURRENCY TRANSLATIONForeign currency transactions are translated using the exchange rate at the dates of the transactions or valuation where items are re-measured. Foreign exchange gains and lossesresulting from the settlement of such transactions and from the translation at quarter-end exchange rates of monetary assets and liabilities denominated in foreign currencies (includingthose in respect of inter-company balances unless related to loans of a long-term investment nature) are recognised in income, except when recognised in other comprehensive incomein respect of cash flow or net investment hedges, and presented within interest and other income or within purchases where not related to financing. Share capital issued in currenciesother than the dollar is translated at the exchange rate at the date of issue. On consolidation, assets and liabilities of non-dollar entities are translated to dollars at year-end rates of exchange, while their statements of income, other comprehensive income andcash flows are translated at quarterly average rates. The resulting translation differences are recognised as currency translation differences within other comprehensive income. Uponsale of all or part of an interest in, or upon liquidation of, an entity, the appropriate portion of cumulative currency translation differences related to that entity are generally recognisedin income. REVENUE RECOGNITIONRevenue from sales of oil, natural gas, chemicals and other products is recognised at the fair value of consideration received or receivable, after deducting sales taxes, excise duties andsimilar levies, when the significant risks and rewards of ownership have been transferred, which is when title passes to the customer. For sales by Integrated Gas and Upstreamoperations, this generally occurs when product is physically transferred into a vessel, pipe or other delivery mechanism; for sales by refining operations, it is either when product isplaced onboard a vessel or offloaded from the vessel, depending on the contractually agreed terms; and for sales of oil products and chemicals, it is either at the point of delivery or thepoint of receipt, depending on contractual conditions. Revenue resulting from hydrocarbon production from properties in which Shell has an interest with partners in joint arrangements is recognised on the basis of Shell’s working interest(entitlement method). Revenue resulting from the production of oil and natural gas under production-sharing contracts (PSCs) is recognised for those amounts relating to Shell’s costrecoveries and Shell’s share of the remaining production. Gains and losses on derivative contracts and the revenue and costs associated with other contracts that are classified as held fortrading purposes are reported on a net basis in the Consolidated Statement of Income. Purchases and sales of hydrocarbons under exchange contracts that are necessary to obtain orreposition feedstocks for refinery operations are presented net in the Consolidated Statement of Income. RESEARCH AND DEVELOPMENTDevelopment costs that are expected to generate probable future economic benefits are capitalised as intangible assets. All other research and development expenditure is recognised inincome as incurred.
FINANCIAL STATEMENTS AND SUPPLEMENTS SHELL ANNUAL REPORT AND FORM 20-F 2017 142

EXPLORATION COSTSHydrocarbon exploration costs are accounted for under the successful efforts method: exploration costs are recognised in income when incurred, except that exploratory drilling costs,including in respect of operating leases, are included in property, plant and equipment pending determination of proved reserves. Exploration costs capitalised in respect of explorationwells that are more than 12 months old are written off unless: (a) proved reserves are booked; or (b) (i) they have found commercially producible quantities of reserves and (ii) theyare subject to further exploration or appraisal activity in that either drilling of additional exploratory wells is under way or firmly planned for the near future or other activities arebeing undertaken to sufficiently progress the assessing of reserves and the economic and operating viability of the project. PROPERTY, PLANT AND EQUIPMENT AND INTANGIBLE ASSETSRecognitionProperty, plant and equipment comprise assets owned by Shell, assets held by Shell under finance leases and assets operated by Shell as contractor in PSCs. They include rights andconcessions in respect of properties with proved reserves (proved properties) and with no proved reserves (unproved properties). Property, plant and equipment, including expenditureon major inspections, and intangible assets are initially recognised in the Consolidated Balance Sheet at cost where it is probable that they will generate future economic benefits. Thisincludes capitalisation of decommissioning and restoration costs associated with provisions for asset retirement (see “Provisions”), certain development costs (see “Research anddevelopment”) and the effects of associated cash flow hedges (see “Financial instruments and other derivative contracts”) as applicable. The accounting for exploration costs isdescribed separately (see “Exploration costs”). Intangible assets include goodwill, liquefied natural gas (LNG) off-take and sales contracts obtained through acquisition, software costsand trademarks. Interest is capitalised, as an increase in property, plant and equipment, on major capital projects during construction. Property, plant and equipment and intangible assets are subsequently carried at cost less accumulated depreciation, depletion and amortisation (including any impairment). Gains andlosses on sale are determined by comparing the proceeds with the carrying amounts of assets sold and are recognised in income, within interest and other income. An asset is classified as held for sale if its carrying amount will be recovered principally through sale rather than through continuing use, which is when the sale is highly probable andit is available for immediate sale. Assets classified as held for sale are measured at the lower of the carrying amount upon classification and the fair value less costs to sell. Depreciation, depletion and amortisationProperty, plant and equipment related to hydrocarbon production activities are in principle depreciated on a unit-of-production basis over the proved developed reserves of the fieldconcerned, other than assets whose useful lives differ from the lifetime of the field which are depreciated applying the straight-line method. However, for certain Upstream assets, theuse for this purpose of proved developed reserves, which are determined using the SEC-mandated yearly average oil and gas prices, would result in depreciation charges for theseassets which do not reflect the pattern in which their future economic benefits are expected to be consumed as, for example, it may result in assets with long-term expected lives beingdepreciated in full within one year. Therefore, in these instances, other approaches are applied to determine the reserves base for the purpose of calculating depreciation, such as usingmanagement’s expectations of future oil and gas prices rather than yearly average prices, to provide a phasing of periodic depreciation charges that more appropriately reflects theexpected utilisation of the assets concerned. Rights and concessions in respect of proved properties are depleted on the unit-of-production basis over the total proved reserves of the relevant area. Where individually insignificant,unproved properties may be grouped and depreciated based on factors such as the average concession term and past experience of recognising proved reserves. Property, plant and equipment held under finance leases and capitalised LNG off-take and sales contracts are depreciated or amortised over the term of the respective contract. Otherproperty, plant and equipment and intangible assets are depreciated or amortised on a straight-line basis over their estimated useful lives, except for goodwill, which is not amortised.They include refineries and chemical plants (for which the useful life is generally 20 years), retail service stations (15 years), upgraders (30 years) and major inspection costs, which aredepreciated over the estimated period before the next planned major inspection (three to five years). On classification of an asset as held for sale, depreciation ceases. Estimates of the useful lives and residual values of property, plant and equipment and intangible assets are reviewed annually and adjusted if appropriate. ImpairmentThe carrying amount of goodwill is tested for impairment annually; in addition, assets other than unproved properties (see “Exploration costs”) are tested for impairment wheneverevents or changes in circumstances indicate that the carrying amounts for those assets may not be recoverable. On classification as held for sale, the carrying amounts of property, plantand equipment and intangible assets are also reviewed. If assets are determined to be impaired, the carrying amounts of those assets are written down to their recoverable amount,which is the higher of fair value less costs to sell (see “Fair value measurements”) and value in use. Value in use is determined as the amount of estimated risk-adjusted discounted future cash flows. For this purpose, assets are grouped into cash-generating units based on separatelyidentifiable and largely independent cash inflows. Estimates of future cash flows used in the evaluation of impairment of assets are made using management’s forecasts of commodityprices, market supply and demand, product margins and, in the case of exploration and production assets, expected production volumes. The latter takes into account assessments offield and reservoir performance and includes expectations about both proved reserves and volumes that are expected to constitute proved reserves in the future (unproved volumes),which are risk-weighted utilising geological, production,
FINANCIAL STATEMENTS AND SUPPLEMENTS SHELL ANNUAL REPORT AND FORM 20-F 2017 143

recovery and economic projections. Cash flow estimates are risk-adjusted to reflect local conditions as appropriate and discounted at a rate based on Shell’s marginal cost of debt. Impairments, except those related to goodwill, are reversed as applicable to the extent that the events or circumstances that triggered the original impairment have changed. Impairment losses and reversals are reported within depreciation, depletion and amortisation. Judgements and estimatesProved oil and gas reservesUnit-of-production depreciation, depletion and amortisation charges are principally measured based on management’s estimates of proved developed oil and gas reserves. Also,exploration drilling costs are capitalised pending the results of further exploration or appraisal activity, which may take several years to complete and before any related provedreserves can be booked. Proved reserves are estimated by reference to available geological and engineering data and only include volumes for which access to market is assured with reasonable certainty.Yearly average oil and gas prices are applied in the determination of proved reserves. Estimates of proved reserves are inherently imprecise, require the application of judgement andare subject to regular revision, either upward or downward, based on new information such as from the drilling of additional wells, observation of long-term reservoir performanceunder producing conditions and changes in economic factors, including product prices, contract terms or development plans. Changes to estimates of proved developed reserves affect prospectively the amounts of depreciation, depletion and amortisation charged and, consequently, the carrying amounts ofexploration and production assets. It is expected, however, that in the normal course of business the diversity of the asset portfolio will limit the effect of such revisions. The outcomeof, or assessment of plans for, exploration or appraisal activity may result in the related capitalised exploration drilling costs being recognised in income in that period. Judgement is involved in determining when to use an alternative reserves base in order to appropriately reflect the expected utilisation of the assets concerned (see "Depreciation,depletion and amortisation"). Information about the carrying amounts of exploration and production assets and the amounts charged to income, including depreciation, depletion and amortisation and thequantitative impact of the use of an alternative reserve base, is presented in Note 8. ImpairmentFor the purposes of determining whether impairment of assets has occurred, and the extent of any impairment loss or its reversal, the key assumptions management uses in estimatingrisk-adjusted future cash flows for value-in-use measures are future oil and gas prices, expected production volumes and refining margins appropriate to the local circumstances andenvironment. These assumptions and the judgements of management that are based on them are subject to change as new information becomes available. Changes in economicconditions can also affect the rate used to discount future cash flow estimates. The determination of cash-generating units requires judgement. Changes in this determination could impact the calculation of value in use and therefore the conclusion on therecoverability of assets’ carrying amounts when performing an impairment test. Judgement, which is subject to change as new information becomes available, can be required in determining when an asset is classified as held for sale. A change in that judgementcould result in impairment charges affecting income, depending on whether classification requires a write down of the asset to its fair value less costs to sell. Significant estimateFuture price assumptions, presented in Note 8, tend to be stable because management does not consider short-term increases or decreases in prices as being indicative of long-termlevels, but they are nonetheless subject to change. Expected production volumes, which comprise proved reserves and unproved volumes, are used for impairment testing becausemanagement believes this to be the most appropriate indicator of expected future cash flows. As discussed in “Proved oil and gas reserves” above, reserves estimates are inherentlyimprecise. Furthermore, projections about unproved volumes are based on information that is necessarily less robust than that available for mature reservoirs. Due to the natureand geographical spread of the business activity in which those assets are used, it is typically not practicable to estimate the likelihood or extent of impairments under different sets ofassumptions for Shell overall. Changes in assumptions could affect the carrying amounts of assets, and any impairment losses and reversals will affect income. Information about the carrying amounts of assets and impairments is presented in Notes 7 and 8. LEASESAgreements under which payments are made to owners in return for the right to use an asset for a period are accounted for as leases. Leases that transfer substantially all the risks andrewards of ownership are recognised at the commencement of the lease term as finance leases within property, plant and equipment and debt at the fair value of the leased asset or, iflower, at the present value of the minimum lease payments. Finance lease payments are apportioned between interest expense and repayments of debt. All other leases are classified asoperating leases and the cost is recognised in income on a straight-line basis, except where capitalised as exploration drilling costs (see "Exploration costs").
FINANCIAL STATEMENTS AND SUPPLEMENTS SHELL ANNUAL REPORT AND FORM 20-F 2017 144

JOINT ARRANGEMENTS AND ASSOCIATESArrangements under which Shell has contractually agreed to share control (see “Nature of the Consolidated Financial Statements” for the definition of control) with another party orparties are joint ventures where the parties have rights to the net assets of the arrangement, or joint operations where the parties have rights to the assets and obligations for the liabilitiesrelating to the arrangement. Investments in entities over which Shell has the right to exercise significant influence but neither control nor joint control are classified as associates.Information about incorporated joint arrangements and associates at December 31, 2017, can be found in Exhibit 8. Investments in joint ventures and associates are accounted for using the equity method, under which the investment is initially recognised at cost and subsequently adjusted for the Shellshare of post-acquisition income less dividends received and the Shell share of other comprehensive income and other movements in equity, together with any loans of a long-terminvestment nature. Where necessary, adjustments are made to the financial statements of joint ventures and associates to bring the accounting policies used into line with those of Shell.In an exchange of assets and liabilities for an interest in a joint venture, the non-Shell share of any excess of the fair value of the assets and liabilities transferred over the pre-exchangecarrying amounts is recognised in income. Unrealised gains on other transactions between Shell and its joint ventures and associates are eliminated to the extent of Shell’s interest inthem; unrealised losses are treated similarly but may also result in an assessment of whether the asset transferred is impaired. Shell recognises its assets and liabilities relating to its interests in joint operations, including its share of assets held jointly and liabilities incurred jointly with other partners. INVENTORIESInventories are stated at cost or net realisable value, whichever is lower. Cost comprises direct purchase costs (including transportation), and associated costs incurred in bringinginventories to their present condition and location, and is determined using the first-in, first-out (FIFO) method for oil, gas and chemicals and by the weighted average cost method formaterials. TAXATIONThe charge for current tax is calculated based on the income reported by the Company and its subsidiaries, as adjusted for items that are non-taxable or disallowed and using rates thathave been enacted or substantively enacted by the balance sheet date. Deferred tax is determined, using the liability method, on temporary differences arising between the tax bases of assets and liabilities and their carrying amounts in the ConsolidatedBalance Sheet and on unused tax losses and credits carried forward. Deferred tax assets and liabilities are calculated using the enacted or substantively enacted rates that are expected to apply when an asset is realised or a liability is settled. They are notrecognised where they arise on the initial recognition of goodwill or of an asset or liability in a transaction (other than in a business combination) that, at the time of the transaction,affects neither accounting nor taxable profit, or in respect of taxable temporary differences associated with subsidiaries, joint ventures and associates where the reversal of the respectivetemporary difference can be controlled by Shell and it is probable that it will not reverse in the foreseeable future. Deferred tax assets are recognised to the extent that it is probable that future taxable profits will be available against which the deductible temporary differences, unused tax losses andcredits carried forward can be utilised. Income taxes are recognised in income except when they relate to items recognised in other comprehensive income, in which case the tax is recognised in other comprehensive income.Income tax assets and liabilities are presented separately in the Consolidated Balance Sheet except where there is a right of offset within fiscal jurisdictions and an intention to settle suchbalances on a net basis. Judgements and estimatesTax liabilities are recognised when it is considered probable that there will be a future outflow of funds to a taxing authority. In such cases, provision is made for the amount that isexpected to be settled, where this can be reasonably estimated. A change in estimate of the likelihood of a future outflow and/or in the expected amount to be settled would berecognised in income in the period in which the change occurs. This requires the application of judgement as to the ultimate outcome, which can change over time depending on factsand circumstances. Judgements mainly relate to transfer pricing, including inter-company financing, interpretation of PSCs, expenditure deductible for tax purposes and taxationarising on disposal. Deferred tax assets are recognised only to the extent it is considered probable that those assets will be recoverable. This involves an assessment of when those assets are likely to reverse,and a judgement as to whether or not there will be sufficient taxable profits available to offset the assets when they do reverse. This requires assumptions regarding future profitabilityand is therefore inherently uncertain. To the extent assumptions regarding future profitability change, there can be an increase or decrease in the amounts recognised in respect ofdeferred tax assets as well as in the amounts recognised in income in the period in which the change occurs. On December 22, 2017, the US Tax Cuts and Jobs Act (the Act) was enacted. The effects of the Act have been recognised in 2017, as presented in Note 16, based on currentinterpretation of the Act and related assumptions. These may be subject to change, for example in the event that further interpretative guidance on the Act is issued. Taxation information, including charges and deferred tax assets and liabilities, is presented in Note 16. Income taxes include taxes at higher rates levied on income from certainIntegrated Gas and Upstream activities.
FINANCIAL STATEMENTS AND SUPPLEMENTS SHELL ANNUAL REPORT AND FORM 20-F 2017 145

RETIREMENT BENEFITSBenefits in the form of retirement pensions and healthcare and life insurance are provided to certain employees and retirees under defined benefit and defined contribution plans. Obligations under defined benefit plans are calculated annually by independent actuaries using the projected unit credit method, which takes into account employees’ years of serviceand, for pensions, average or final pensionable remuneration, and are discounted to their present value using interest rates of high-quality corporate bonds denominated in the currencyin which the benefits will be paid and of a duration consistent with the plan obligations. Where plans are funded, payments are made to independently managed trusts; assets held bythose trusts are measured at fair value. Defined benefit plan surpluses are recognised as assets to the extent that they are considered recoverable, which is generally by way of a refundor lower future employer contributions. The amounts recognised in income in respect of defined benefit plans mainly comprise service cost and net interest. Service cost comprises principally the increase in the present valueof the obligation for benefits resulting from employee service during the period (current service cost) and also amounts relating to past service and settlements or amendments of plans.Plan amendments are changes to benefits and are generally recognised when all legal and regulatory approvals have been received and the effects have been communicated tomembers. Net interest is calculated using the net defined benefit liability or asset matched against the discount rate yield curve at the beginning of each year for each plan.Remeasurements of the net defined benefit liability or asset resulting from actuarial gains and losses and the return on plan assets excluding the amount recognised in income arerecognised in other comprehensive income. For defined contribution plans, pension expense represents the amount of employer contributions payable for the period. Significant judgements and estimatesDefined benefit obligations and plan assets, and the resulting liabilities and assets that are recognised, are subject to significant volatility as actuarial assumptions regarding futureoutcomes and market values change. Substantial judgement is required in determining the actuarial assumptions, which vary for the different plans to reflect local conditions but aredetermined under a common process in consultation with independent actuaries. The assumptions applied in respect of each plan are reviewed annually and adjusted where necessaryto reflect changes in experience and actuarial recommendations. Information about the amounts reported in respect of defined benefit pension plans, assumptions applicable to the principal plans and their sensitivity to changes are presented in Note17. PROVISIONSProvisions are recognised at the balance sheet date at management’s best estimate of the expenditure required to settle the present obligation. Non-current amounts are discounted at arate intended to reflect the time value of money. The carrying amounts of provisions are regularly reviewed and adjusted for new facts or changes in law or technology. Provisions for decommissioning and restoration costs, which arise principally in connection with hydrocarbon production facilities and pipelines, are measured on the basis of currentrequirements, technology and price levels; the present value is calculated using amounts discounted over the useful economic life of the assets. The liability is recognised (together witha corresponding amount as part of the related property, plant and equipment) once an obligation crystallises in the period when a reasonable estimate can be made. The effects ofchanges resulting from revisions to the timing or the amount of the original estimate of the provision are reflected on a prospective basis, generally by adjustment to the carryingamount of the related property, plant and equipment. However, where there is no related asset, or the change reduces the carrying amount to nil, the effect, or the amount in excess ofthe reduction in the related asset to nil, is recognised in income. Redundancy provisions are recognised when a detailed formal plan identifies the business or part of the business concerned, the location and number of employees affected, a detailedestimate of the associated costs and an appropriate timeline, and the employees affected have been notified of the plan's main features. Other provisions are recognised in income in the period in which an obligation arises and the amount can be reasonably estimated. Provisions are measured based on current legalrequirements and existing technology where applicable. Recognition of any joint and several liability is based on management’s best estimate of the final pro rata share of the liability.Provisions are determined independently of expected insurance recoveries. Recoveries are recognised when virtually certain of realisation. Significant estimatesEstimates of provisions for future decommissioning and restoration costs are recognised are based on current legal and constructive requirements, technology and price levels. Becauseactual outflows can differ from estimates due to changes in laws, regulations, public expectations, technology, prices and conditions, and can take place many years in the future, thecarrying amounts of provisions are regularly reviewed and adjusted to take account of such changes. The discount rate applied is reviewed annually. Information about decommissioning and restoration provisions is presented in Note 18.
FINANCIAL STATEMENTS AND SUPPLEMENTS SHELL ANNUAL REPORT AND FORM 20-F 2017 146

FINANCIAL INSTRUMENTS AND OTHER DERIVATIVE CONTRACTSFinancial assets and liabilities are presented separately in the Consolidated Balance Sheet except where there is a legally enforceable right of offset and Shell has the intention to settle ona net basis or realise the asset and settle the liability simultaneously. Financial assetsInvestments in securitiesInvestments in securities (also referred to as “securities”) comprise equity and debt securities classified on initial recognition as available-for-sale and are carried at fair value, exceptwhere their fair value cannot be measured reliably, in which case they are carried at cost, less any impairment. Unrealised holding gains and losses other than impairments arerecognised in other comprehensive income, except for translation differences arising on foreign currency debt securities, which are recognised in income. On maturity or sale, net gainsand losses previously deferred in accumulated other comprehensive income are recognised in income. Interest income on debt securities is recognised in income using the effective interest method. Dividends on equity securities are recognised in income when receivable. Cash and cash equivalentsCash and cash equivalents comprise cash at bank and in hand, including offsetting bank overdrafts, short-term bank deposits, money market funds, reverse repos and similarinstruments that have a maturity of three months or less at the date of purchase. Trade receivablesTrade receivables are recognised initially at fair value based on amounts exchanged and subsequently at amortised cost less any impairment.
Significant estimateReceivables from governments may be large and subject to disputes. Recoverability is subject to uncertainty as to the settlement of amounts including tax, royalty, cost recovery andassociated interest. Information about government receivables is presented in Note 11.
Financial liabilitiesDebt and trade payables are recognised initially at fair value based on amounts exchanged, net of transaction costs, and subsequently at amortised cost except for fixed rate debt subjectto fair value hedging which is remeasured for the hedged risk (see below). Interest expense on debt is accounted for using the effective interest method and, other than interestcapitalised, is recognised in income. Derivative contracts and hedgesDerivative contracts are used in the management of interest rate risk, foreign exchange risk and commodity price risk, and in the management of foreign currency cash balances. Thesecontracts are recognised at fair value. Certain derivative contracts qualify and are designated either as a “fair value” hedge of the change in fair value of a recognised asset or liability or an unrecognised firm commitmentor as a “cash flow” hedge of the change in cash flows to be received or paid relating to a recognised asset or liability or a highly probable forecast transaction. A change in the fair value of a hedging instrument designated as a fair value hedge is recognised in income, together with the consequential adjustment to the carrying amount of thehedged item. The effective portion of a change in fair value of a derivative contract designated as a cash flow hedge is recognised in other comprehensive income until the hedgedtransaction occurs; any ineffective portion is recognised in income. Where the hedged item is a non-financial asset or liability, the amount in accumulated other comprehensive incomeis transferred to the initial carrying amount of the asset or liability (reclassified to the balance sheet); for other hedged items, the amount in accumulated other comprehensive income isreclassified to income when the hedged transaction affects income. The effective portion of a change due to retranslation at quarter-end exchange rates in the carrying amount of debt and the principal amount of derivative contracts used to hedge netinvestments in foreign operations is recognised in other comprehensive income until the related investment is sold or liquidated; any ineffective portion is recognised in income. All relationships between hedging instruments and hedged items are documented, as well as risk management objectives and strategies for undertaking hedge transactions. Theeffectiveness of hedges is also continually assessed and hedge accounting is discontinued when a hedge ceases to be highly effective. Gains and losses on derivative contracts not qualifying and designated as hedges, including forward sale and purchase contracts for commodities in trading operations that may besettled by the physical delivery or receipt of the commodity, are recognised in income. Unless designated as hedging instruments, contracts to sell or purchase non-financial items that can be settled net as if the contracts were financial instruments and that do not meetexpected own use requirements (typically, forward sale and purchase contracts for commodities in trading operations), and contracts that are or contain written options, are recognisedat fair value; associated gains and losses are recognised in income. Derivatives embedded within contracts that are not already required to be recognised at fair value, and that are not closely related to the host contract in terms of economiccharacteristics and risks, are separated from their host contract and recognised at fair value; associated gains and losses are recognised in income.
FINANCIAL STATEMENTS AND SUPPLEMENTS SHELL ANNUAL REPORT AND FORM 20-F 2017 147

FAIR VALUE MEASUREMENTSFair value measurements are estimates of the amounts for which assets or liabilities could be transferred at the measurement date, based on the assumption that such transfers take placebetween participants in principal markets and, where applicable, taking highest and best use into account. Judgements and estimatesWhere available, fair value measurements are derived from prices quoted in active markets for identical assets or liabilities. In the absence of such information, other observable inputsare used to estimate fair value. Inputs derived from external sources are corroborated or otherwise verified, as appropriate. In the absence of publicly available information, fair valueis determined using estimation techniques that take into account market perspectives relevant to the asset or liability, in as far as they can reasonably be ascertained, based onpredominantly unobservable inputs. For derivative contracts where publicly available information is not available, fair value estimations are generally determined using models andother valuation methods, the key inputs for which include future prices, volatility, price correlation, counterparty credit risk and market liquidity, as appropriate; for other assets andliabilities, fair value estimations are generally based on the net present value of expected future cash flows. SHARE-BASED COMPENSATION PLANSThe fair value of share-based compensation expense arising from the Performance Share Plan (PSP) and the Long-term Incentive Plan (LTIP) – Shell’s main equity-settled plans – isestimated using a Monte Carlo option pricing model and is recognised in income from the date of grant over the vesting period with a corresponding increase directly in equity. Themodel projects and averages the results for a range of potential outcomes for the vesting conditions, the principal assumptions for which are the share price volatility and dividendyields for Shell and four of its main competitors over the last three years and the last 10 years. Changes in the fair value of share-based compensation for cash-settled plans arerecognised in income with a corresponding change in liabilities. SHARES HELD IN TRUSTShares in the Company, which are held by employee share ownership trusts and trust-like entities, are not included in assets but are reflected at cost as a deduction from equity as sharesheld in trust. ACQUISITIONS AND SALES OF INTERESTS IN A BUSINESSAssets acquired and liabilities assumed when control is obtained over a business, and, with effect from January 1, 2016, when an interest or an additional interest is acquired in a jointoperation which is a business, are recognised at their fair value at the date of the acquisition; the amount of the purchase consideration above this value is recognised as goodwill. Whencontrol is obtained, any non-controlling interest is recognised as the proportionate share of the identifiable net assets. The acquisition of a non-controlling interest in a subsidiary andthe sale of an interest while retaining control are accounted for as transactions within equity. The difference between the purchase consideration or sale proceeds after tax and therelevant proportion of the non-controlling interest, measured by reference to the carrying amount of the interest’s net assets at the date of acquisition or sale, is recognised in retainedearnings as a movement in equity attributable to Royal Dutch Shell plc shareholders. CONSOLIDATED STATEMENT OF INCOME PRESENTATIONPurchases reflect all costs related to the acquisition of inventories and the effects of the changes therein, and include associated costs incurred in conversion into finished or intermediateproducts. Production and manufacturing expenses are the costs of operating, maintaining and managing production and manufacturing assets. Selling, distribution and administrativeexpenses include direct and indirect costs of marketing and selling products. 3 CHANGES TO IFRS NOT YET ADOPTEDThe final version of IFRS 9 Financial Instruments was issued in 2014 and sets out the requirements for recognising and measuring financial assets, financial liabilities and certaincontracts to buy or sell non-financial items. It replaces IAS 39 Financial Instruments: Recognition and Measurement. The adoption of IFRS 9 in 2018 resulted in a decrease of $83million in equity at January 1, 2018, mainly representing the recognition of additional provisions for impairment of receivables under the expected loss model. On a prospective basis,IFRS 9 may facilitate further use of hedge accounting and also results in different income recognition upon the sale of certain investments in securities. IFRS 15 Revenue from Contracts with Customers was issued in 2014 and replaces IAS 18 Revenue. It provides a single model of accounting for revenue arising from contracts withcustomers based on the identification and satisfaction of performance obligations, and revenue from contracts with customers will be distinguished from other sources. Shell hasadopted IFRS 15 with effect from January 1, 2018, and has elected to apply the modified retrospective transition approach. Although IFRS 15 does not generally represent a changefrom Shell’s current practice, the accounting for certain contracts, such as those with provisional pricing or take-or-pay arrangements, and for underlifts and overlifts, have beenidentified as areas of potential change. However, these do not have a significant effect on Shell’s accounting or disclosures, and therefore no transition adjustment will be presented. IFRS 16 Leases was issued in 2016 to replace IAS 17 Leases and is required to be adopted by 2019. Under the new standard all lease contracts, with limited exceptions, are recognisedin financial statements by way of right of use assets and corresponding lease liabilities. Compared with the existing accounting for operating leases, it will also impact the classificationand timing of expenses and consequently the classification between cash flow from operating activities and cash flow from financing activities. It is expected that Shell will apply themodified retrospective approach, which would mean that the cumulative effect of initially applying the standard is recognised at the date of initial application and there is norestatement of comparative information. Shell will not early adopt IFRS 16. The impact of the adoption of the new standard at January 1, 2019, will be dependent on factors such asShell’s lease contracts at that date and the discount rate to be applied in accordance with IFRS 16, and therefore the impact cannot be determined from the disclosure of the minimumlease payments in accordance with IAS 17 in Note 14. A detailed review of Shell’s contracts is under way to determine the impact of the new standard.
FINANCIAL STATEMENTS AND SUPPLEMENTS SHELL ANNUAL REPORT AND FORM 20-F 2017 148

4 SEGMENT INFORMATIONShell is engaged in the principal aspects of the oil and gas industry in more than 70 countries and reports its business through four segments. Segmental reporting was changed witheffect from 2016, in line with a change in the way Shell’s businesses are managed. Since 2016, Shell reports its business through the segments Integrated Gas (previously part ofUpstream), Upstream, Downstream and Corporate. Comparative information was reclassified. Integrated Gas is engaged in the liquefaction and transportation of gas and the conversion of natural gas to liquids to provide fuels and other products, as well as projects with anintegrated activity – from producing to commercialising gas. Upstream combines the operating segments Upstream, which is engaged in the exploration for and extraction of crude oil,natural gas and natural gas liquids, and the marketing and transportation of oil and gas, and Oil Sands, which is engaged in the extraction of bitumen from mined oil sands andconversion into synthetic crude oil. These operating segments have similar economic characteristics because their earnings are significantly dependent on crude oil and natural gasprices and production volumes, and because their projects generally require significant investment, are complex and generate revenue for many years. Downstream is engaged in oilproducts and chemicals manufacturing and marketing activities. Corporate represents the key support functions, comprising Shell’s holdings and treasury organisation, its self-insurance activities and its headquarters and central functions. Integrated within the Integrated Gas, Upstream and Downstream segments are Shell’s trading activities, technical servicesand technology capability, and functions such as safety and environment. Sales between segments are based on prices generally equivalent to commercially available prices. Segment earnings are presented on a current cost of supplies basis (CCS earnings), which is the earnings measure used by the Chief Executive Officer for the purposes of makingdecisions about allocating resources and assessing performance. On this basis, the purchase price of volumes sold during the period is based on the current cost of supplies during thesame period after making allowance for the tax effect. CCS earnings therefore exclude the effect of changes in the oil price on inventory carrying amounts. Information by segment on a current cost of supplies basis is as follows:
2017 $ million Integrated Gas Upstream Downstream Corporate Total
CCS earnings 5,078 1,551 8,258 (2,416 ) 12,471 Revenue
Third party 32,674 7,723 264,731 51 305,179 Inter-segment 3,978 32,469 4,248 —
Share of profit/(loss) of joint ventures and associates 1,714 623 1,956 (129 ) 4,164 Interest and other income 687 1,188 154 437 2,466 Depreciation, depletion and amortisation charge, of which: 4,965 17,303 3,877 78 26,223
Impairment losses 302 4,118 385 — 4,805 Impairment reversals 10 605 — — 615
Interest expense 248 744 109 2,941 4,042 Taxation charge/(credit) 790 2,409 1,783 (636 ) 4,346
2016 $ million Integrated Gas Upstream Downstream Corporate Total
CCS earnings 2,529 (3,674 ) 6,588 (1,751 ) 3,692 Revenue
Third party 25,282 6,412 201,823 74 233,591 Inter-segment 3,908 26,524 1,727 —
Share of profit/(loss) of joint ventures and associates 1,116 222 2,244 (182 ) 3,400 Interest and other income 765 839 851 442 2,897 Depreciation, depletion and amortisation charge, of which: 4,509 16,779 3,681 24 24,993
Impairment losses 72 1,274 588 6 1,940 Impairment reversals — — 38 — 38
Interest expense 247 852 91 2,013 3,203 Taxation charge/(credit) 1,254 (938 ) 1,008 (839 ) 485
FINANCIAL STATEMENTS AND SUPPLEMENTS SHELL ANNUAL REPORT AND FORM 20-F 2017 149

2015 $ million Integrated Gas Upstream Downstream Corporate Total
CCS earnings 3,170 (8,833 ) 10,243 (425 ) 4,155 Revenue
Third party 21,741 6,739 236,384 96 264,960 Inter-segment 4,248 26,824 1,362 —
Share of profit/(loss) of joint ventures and associates 1,471 491 2,215 (327 ) 3,850 Interest and other income 537 1,819 1,156 157 3,669 Depreciation, depletion and amortisation charge, of which: 2,597 20,404 3,667 46 26,714
Impairment losses 210 8,536 556 27 9,329 Impairment reversals — — 3 — 3
Interest expense 106 775 51 956 1,888 Taxation charge/(credit) 937 (927 ) 1,639 (1,156 ) 493
Reconciliation of CCS earnings to income for the period $ million 2017 2016 2015
CCS earnings 12,471 3,692 4,155 Current cost of supplies adjustment:
Purchases 1,252 1,284 (2,278 )Taxation (349 ) (344 ) 646 Share of profit of joint ventures and associates 61 145 (323 ) 964 1,085 (1,955 )
Income for the period 13,435 4,777 2,200 Information by geographical area is as follows:
2017 $ million
Europe
Asia,Oceania,
Africa USA Other
Americas TotalThird-party revenue, by origin 100,609 114,683 [A] 66,854 23,033 305,179Intangible assets, property, plant and equipment, joint ventures and associates at December 31 43,020 122,345 54,294 58,828 278,487[A] includes $62,046 million that originated from Singapore.
2016 $ million
Europe
Asia,Oceania,
Africa USA Other
Americas TotalThird-party revenue, by origin
81,573 87,635[A][B] 44,615 [B] 19,768 233,591
Intangible assets, property, plant and equipment, joint ventures and associates at December 31 43,901 121,618 60,430 67,371 293,320[A] includes $42,533 million that originated from Singapore.[B] As revised, following reassessment of geographical allocation resulting in an increase of $4,532 million in Asia, Oceania, Africa and a corresponding decrease in USA.
2015 $ million
Europe
Asia,Oceania,
Africa USA Other
Americas TotalThird-party revenue, by origin 95,223 95,892 [A] 50,666 23,179 264,960Intangible assets, property, plant and equipment, joint ventures and associates at December 31 33,439 104,949 51,269 29,614 219,271[A] includes $46,551 million that originated from Singapore.
FINANCIAL STATEMENTS AND SUPPLEMENTS SHELL ANNUAL REPORT AND FORM 20-F 2017 150

5 INTEREST AND OTHER INCOME
$ million 2017 2016 2015
Interest income 677 451 359 Dividend income (from investments in securities) 375 264 456 Net gains on sale and revaluation of non-current assets and businesses 1,640 2,141 3,460 Net foreign exchange (losses)/gains on financing activities (453 ) 343 (649 )Other 227 (302 ) 43 Total 2,466 2,897 3,669
In 2017, net gains on sale of non-current assets and businesses arose mainly in respect of gains on the sale of Upstream assets in the UK and the USA as well as Downstream assets inAustralia and Saudi Arabia, partly offset by a loss on the Motiva transaction (see Note 29). Net foreign exchange losses on financing activities in 2017 includes a charge of $545million from the release of cumulative currency translation differences following the restructuring of funding for our North America businesses. In 2016, net gains on sale of non-current assets and businesses arose mainly in respect of Upstream assets in North America and Downstream assets in Denmark and Japan. In addition,in respect of a decrease in Shell’s interest in Woodside Petroleum Limited (Woodside), a revaluation gain of $293 million was recognised and a gain of $358 million on the relatedrelease of cumulative currency translation differences was recognised in net foreign exchange gains on financing activities. Other mainly relates to the write down of an investment insecurities. In 2015, net gains on sale of non-current assets and businesses arose mainly in respect of interests in Nigeria (Upstream), interests in France and Norway (Downstream) and an officebuilding in the UK (Corporate). Other net foreign exchange losses of $47 million in 2017 (2016: $49 million; 2015: $197 million) were included in purchases. 6 INTEREST EXPENSE
$ million 2017 2016 2015
Interest incurred and similar charges 3,448 2,732 1,832 Less: interest capitalised (622 ) (725 ) (839 )Other net losses/(gains) on fair value hedges of debt 114 4 (37 )Accretion expense 1,102 1,192 932 Total 4,042 3,203 1,888
The rate applied in determining the amount of interest capitalised in 2017 was 3% (2016: 3%; 2015: 3%).
FINANCIAL STATEMENTS AND SUPPLEMENTS SHELL ANNUAL REPORT AND FORM 20-F 2017 151

7 INTANGIBLE ASSETS
2017 $ million
Goodwill LNG off-take
and sales contracts Other Total Cost
At January 1 13,592 10,429 5,085 29,106 Additions 784 — 786 1,570 Sales, retirements and other movements (261 ) — 37 (224 )Currency translation differences 39 — 198 237
At December 31 14,154 10,429 6,106 30,689 Depreciation, depletion and amortisation, including impairments
At January 1 605 1,475 3,059 5,139 Charge for the year — 957 612 1,569 Sales, retirements and other movements (136 ) — (241 ) (377 )Currency translation differences 23 — 155 178
At December 31 492 2,432 3,585 6,509 Carrying amount at December 31 13,662 7,997 2,521 24,180
2016 $ million
Goodwill LNG off-take
and sales contracts Other Total Cost
At January 1 2,604 3,271 4,473 10,348 Additions on acquisition of BG 10,997 7,158 607 18,762 Other additions — — 130 130 Sales, retirements and other movements (3 ) — — (3 )Currency translation differences (6 ) — (125 ) (131 )
At December 31 13,592 10,429 5,085 29,106 Depreciation, depletion and amortisation, including impairments
At January 1 594 556 2,915 4,065 Charge for the year — 919 306 1,225 Sales, retirements and other movements — — (63 ) (63 )Currency translation differences 11 — (99 ) (88 )
At December 31 605 1,475 3,059 5,139 Carrying amount at December 31 12,987 8,954 2,026 23,967
Goodwill at December 31, 2017, principally related to the acquisition of BG Group plc (BG) in 2016 (see Note 29), allocated to Integrated Gas ($4,954 million) and Upstream ($6,013million) at the operating segment level, and to Pennzoil-Quaker State Company, a lubricants business in the Downstream segment based largely in North America. Information onannual impairment testing is included in Note 8.
FINANCIAL STATEMENTS AND SUPPLEMENTS SHELL ANNUAL REPORT AND FORM 20-F 2017 152

8 PROPERTY, PLANT AND EQUIPMENT
2017 $ million Exploration and production
Exploration
and evaluation Production
Manufacturing,supply and
distribution Other Total Cost
At January 1 25,376 302,532 77,286 20,063 425,257 Additions 2,319 15,347 8,148 1,352 27,166 Sales, retirements and other movements (4,586 ) (34,198 ) (1,427 ) (655 ) (40,866 )Currency translation differences 466 7,510 2,941 1,595 12,512
At December 31 23,575 291,191 86,948 22,355 424,069 Depreciation, depletion and amortisation, including impairments
At January 1 6,363 133,600 39,673 9,523 189,159 Charge for the year 778 19,155 3,705 1,016 24,654 Sales, retirements and other movements (2,300 ) (19,615 ) (763 ) (701 ) (23,379 )Currency translation differences 219 4,385 1,868 783 7,255
At December 31 5,060 137,525 44,483 10,621 197,689 Carrying amount at December 31 18,515 153,666 42,465 11,734 226,380
2016 $ million Exploration and production
Exploration
and evaluation Production
Manufacturing,supply and
distribution Other Total Cost
At January 1 27,728 239,559 73,648 20,988 361,923 Additions on acquisition of BG 916 54,775 314 62 56,067 Other additions 1,961 17,304 4,818 1,250 25,333 Sales, retirements and other movements (5,210 ) (3,557 ) (653 ) (1,545 ) (10,965 )Currency translation differences (19 ) (5,549 ) (841 ) (692 ) (7,101 )
At December 31 25,376 302,532 77,286 20,063 425,257 Depreciation, depletion and amortisation, including impairments
At January 1 8,095 122,586 38,158 10,246 179,085 Charge for the year 828 18,182 3,842 916 23,768 Sales, retirements and other movements (2,602 ) (3,326 ) (1,696 ) (1,354 ) (8,978 )Currency translation differences 42 (3,842 ) (631 ) (285 ) (4,716 )
At December 31 6,363 133,600 39,673 9,523 189,159 Carrying amount at December 31 19,013 168,932 37,613 10,540 236,098
Sales, retirements and other movements in 2017 include sales of interests in Canada, the UK and Gabon. In Canada, Shell sold its 60% interest in the Athabasca Oil Sands Project(AOSP) and its in-situ and undeveloped oil sands interests for a consideration in cash and shares in Canadian Natural Resources Limited, reported in investments in securities (see Note10). Separately, Shell acquired a 50% controlling interest in Marathon Oil Canada Corporation, which has a 20% interest in the AOSP. The carrying amount at December 31, 2017, included $42,121 million (2016: $45,396 million) of assets under construction. This amount excludes exploration and evaluation assets.The carrying amount at December 31, 2017, also included $986 million of assets classified as held for sale (2016: $282 million, as revised). The carrying amount of exploration and production assets at December 31, 2017, included rights and concessions in respect of proved and unproved properties of $14,839 million(2016: $15,610 million). Exploration and evaluation assets principally comprise rights and concessions in respect of unproved properties and capitalised exploration drilling costs. The carrying amount of assets at December 31, 2017, for which an alternative reserves base was applied in the calculation of the depreciation charge (see Note 2), was $18,115 million(2016: $14,784 million). If no alternative reserves base had been used, the pre-tax depreciation charge for the year ended December 31, 2017, would have been $5,558 million higher(2016: $9,181 million, 2015: $1,022 million).
FINANCIAL STATEMENTS AND SUPPLEMENTS SHELL ANNUAL REPORT AND FORM 20-F 2017 153

Contractual commitments for the purchase of property, plant and equipment at December 31, 2017, amounted to $4,504 million (2016: $4,825 million). In addition, Shell has othercommitments for future expenditure that, when incurred, are also expected to be recognised as additions to property, plant and equipment, such as the majority of operating leasepayments in respect of drilling and ancillary equipment (see Note 14).
Carrying amount of property, plant and equipment held under finance leases [A] $ million Dec 31, 2017 Dec 31, 2016
Exploration and production 8,399 7,930 Manufacturing, supply and distribution 3,151 3,108 Other 272 227 Total 11,822 11,265[A] See Note 14.
Impairments $ million 2017 2016 2015
Impairment losses [A] Exploration and production 4,187 1,324 8,387 Manufacturing, supply and distribution 376 567 458 Other 9 40 165
Total 4,572 1,931 9,010 Impairment reversals [A]
Exploration and production 615 — — Manufacturing, supply and distribution — 36 — Other — 2 3
Total 615 38 3[A] Presented by segment in Note 4, together with impairment losses and reversals in respect of intangible assets. Impairment losses in 2017 were mainly in Upstream, and principally related to the disposal of interests in Canada and interests in Ireland classified as held for sale. Impairment losses in2016 were mainly triggered by asset performance, disposals and project cancellations. They related primarily in Upstream to shale and deep-water properties in North and SouthAmerica and in Downstream to disposals and assets held for sale in the refining portfolio. Impairment losses in 2015 were principally in Upstream related to North American shaleproperties, following revisions to Shell’s long-term oil and gas price outlook, and to cancelled projects in Alaska and Carmon Creek in Canada. For impairment testing purposes, the respective carrying amounts of property, plant and equipment and intangible assets were compared with their value in use. Cash flow projectionsused in the determination of value in use were made using management’s forecasts of commodity prices, market supply and demand, product margins and expected productionvolumes (see Note 2). These cash flows were adjusted for the risks specific to the assets, and therefore these risks were not included in the determination of the discount rate applied.The nominal pre-tax rate applied in 2017 was 6% (2016: 6%; 2015: 6%). Oil and gas price assumptions applied for impairment testing are reviewed and, where necessary, adjusted on a periodic basis. Reviews include comparison with available market dataand forecasts that reflect developments in demand such as global economic growth, technology efficiency, policy measures and, in supply, consideration of investment and resourcepotential, cost of development of new supply, and behaviour of major resource holders. The near-term commodity price assumptions applied in impairment testing in 2017 were asfollows:
Commodity price assumptions [A] 2018 2019 2020
Brent crude oil ($/b) 50 60 65 Henry Hub natural gas ($/MMBtu) 3.00 3.00 3.25
[A] Money of the day. For periods after 2020, the real terms long-term price assumptions applied were $70 per barrel (/b) (2016: $80/b) for Brent crude oil and $3.50 per million British thermal units(/MMBtu) (2016: $4.00/MMBtu) for Henry Hub natural gas.
FINANCIAL STATEMENTS AND SUPPLEMENTS SHELL ANNUAL REPORT AND FORM 20-F 2017 154

Capitalised exploration drilling costs $ million 2017 2016 2015
At January 1 7,910 7,835 8,465 Additions pending determination of proved reserves 1,708 1,762 3,276 Amounts charged to expense (896 ) (834 ) (2,771 )Reclassifications to productive wells on determination of proved reserves (982 ) (1,187 ) (991 )Other movements 153 334 (144 )At December 31 7,893 7,910 7,835
Exploration drilling costs capitalised for periods greater than one year at December 31, 2017, analysed according to the most recent year of activity, are presented in the table below.They comprise $1,512 million relating to 21 projects where drilling activities were under way or firmly planned for the future and $5,068 million relating to 42 projects awaitingdevelopment concepts.
Projects Wells Number $ million Number $ million
Between 1 and 5 years 49 5,782 198 4,562 Between 6 and 10 years 11 688 122 1,647 Between 11 and 15 years 3 110 21 371 Total 63 6,580 341 6,580 9 JOINT VENTURES AND ASSOCIATES
Shell share of comprehensive income of joint ventures and associates $ million 2017 2016 2015
Joint
ventures Associates Total Joint
ventures Associates Total Joint
ventures Associates Total Income for the period 2,102 2,123 4,225 2,332 1,213 3,545 908 [A] 2,619 3,527 Other comprehensive income/(loss) for the period 164 6 170 78 (106 ) (28 ) (73 ) 33 (40 )Comprehensive income for the period 2,266 2,129 4,395 2,410 1,107 3,517 835 2,652 3,487[A] Includes an impairment loss of $837 million as a result of changes in the outlook of a joint venture in the Oceania region.
Carrying amount of interests in joint ventures and associates $ million Dec 31, 2017 Dec 31, 2016
Joint
ventures Associates Total Joint
ventures Associates Total Net assets 15,052 12,875 27,927 20,555 12,700 33,255
Shell’s interest in the Motiva Enterprises LLC (Motiva) joint venture was disposed of in 2017 (see Note 29). The carrying amount at December 31, 2016, was $5,132 million.
Transactions with joint ventures and associates $ million 2017 2016 2015
Sales and charges to joint ventures and associates 13,121 24,214 36,548 Purchases and charges from joint ventures and associates 10,680 13,859 26,440
These transactions principally comprise sales and purchases of goods and services in the ordinary course of business. Related balances outstanding at December 31, 2017, and 2016,are presented in Notes 11 and 15.
Other arrangements in respect of joint ventures and associates $ million Dec 31, 2017 Dec 31, 2016
Commitments to make purchases from joint ventures and associates 78,837 85,333 Commitments to provide debt or equity funding to joint ventures and associates 1,216 2,703
FINANCIAL STATEMENTS AND SUPPLEMENTS SHELL ANNUAL REPORT AND FORM 20-F 2017 155

10 INVESTMENTS IN SECURITIES
Investments in securities $ million Dec 31, 2017 Dec 31, 2016 Equity securities 5,976 4,784 Debt securities 1,246 1,168 Total 7,222 5,952 At fair value
Measured by reference to prices in active markets for identical assets 5,776 4,408 Measured using predominantly unobservable inputs 1,268 1,233 Total 7,044 5,641
At cost 178 311 Total 7,222 5,952 Equity securities at December 31, 2017, principally comprised an 8% interest in Canadian Natural Resources Limited (see Note 8) of $3,506 million and a 15% interest in MalaysiaLNG Tiga Sendirian Berhad (Tiga). Shell’s 13% interest in Woodside was disposed of in 2017. Its carrying amount at December 31, 2016, was $2,516 million. Debt securitiesprincipally comprised a portfolio required to be held by Shell’s insurance entities as security for their activities.
Investments in securities measured using predominantly unobservable inputs [A] $ million 2017 2016
At January 1 1,233 1,625 Losses recognised in other comprehensive income/(loss) (108 ) (333 )Other movements 143 (59 )At December 31 1,268 1,233[A] Based on expected dividend flows, adjusted for country and other risks as appropriate and discounted to their present value. All are equity securities, mainly comprising Shell’s interest in Tiga. If the oil price assumption used in its valuation were to bedecreased by $10 per barrel with no change in other measurement inputs, its carrying amount at December 31, 2017, would decrease by $99 million (2016: $110 million). 11 TRADE AND OTHER RECEIVABLES
$ million Dec 31, 2017 Dec 31, 2016 Current Non-current Current Non-current
Trade receivables 30,721 — 25,766 — Other receivables 9,036 5,525 7,556 5,231 Amounts due from joint ventures and associates 868 1,327 2,175 2,510 Derivative contracts (see Note 19) 5,304 919 5,957 405 Prepayments and deferred charges 3,940 1,623 4,210 1,407 Total 49,869 9,394 45,664 9,553
The fair value of financial assets included above approximates the carrying amount and, other than the fair value of certain derivative contracts, was determined from predominantlyunobservable inputs. Other receivables at December 31, 2017, include receivables from certain governments in their capacity as joint arrangement partners, of $2,265 million (2016: $2,644 million), afterprovisions for impairments, that are overdue in part or in full. Recoverability and timing thereof is subject to uncertainty, however, the ultimate risk of default on the carrying amountis considered to be low. Other receivables also include income tax receivable (see Note 16) and other taxes recoverable. Provisions for impairments deducted from trade and other receivables amounted to $881 million at December 31, 2017 (2016: $822 million, as revised).
Overdue trade receivables $ million Dec 31, 2017 Dec 31, 2016
Overdue 1–30 days 1,154 747 Overdue 31–180 days 480 649 Overdue more than 180 days 368 545 Total 2,002 1,941
Information about offsetting, collateral and credit risk is presented in Note 19.
FINANCIAL STATEMENTS AND SUPPLEMENTS SHELL ANNUAL REPORT AND FORM 20-F 2017 156

12 INVENTORIES
$ million Dec 31, 2017 Dec 31, 2016
Oil, gas and chemicals 22,962 19,653 Materials 2,261 2,122 Total 25,223 21,775
Inventories at December 31, 2017, include write-downs to net realisable value of $253 million (2016: $566 million). 13 CASH AND CASH EQUIVALENTS
$ million Dec 31, 2017 Dec 31, 2016
Cash 4,672 3,426 Short-term bank deposits 3,996 4,084 Money market funds, reverse repos and other cash equivalents 11,644 11,620 Total 20,312 19,130 Included in cash and cash equivalents at December 31, 2017, were amounts totalling $120 million (2016: $349 million) subject to currency controls or other legal restrictions.Information about credit risk is presented in Note 19. 14 DEBT AND LEASE ARRANGEMENTS DEBT
Debt $ million Dec 31, 2017 Dec 31, 2016
Debt(excluding
finance leaseliabilities)
Financelease
liabilities Total
Debt(excluding
finance leaseliabilities)
Financelease
liabilities Total Short-term debt 1,211 — 1,211 1,787 — 1,787 Long-term debt due within 1 year 9,500 1,084 10,584 6,574 1,123 7,697 Current debt 10,711 1,084 11,795 8,361 1,123 9,484 Non-current debt 59,430 14,440 73,870 69,256 13,736 82,992 Total 70,141 15,524 85,665 77,617 14,859 92,476

Net debt $ million
Current
debt Non-current
debt
Cash and cashequivalents
(see Note 13) Net debt At January 1, 2017 (9,484 ) (82,992 ) 19,130 (73,346 )Cash flow 11,942 (113 ) 535 12,364 Finance lease additions (56 ) (1,772 ) — (1,828 )Other movements (13,717 ) 13,749 — 32 Currency translation differences and foreign exchange gains/(losses) (480 ) (2,742 ) 647 (2,575 )At December 31, 2017 (11,795 ) (73,870 ) 20,312 (65,353 )At January 1, 2016 (5,530 ) (52,849 ) 31,752 (26,627 )Additions on acquisition of BG (1,544 ) (19,690 ) 6,803 (14,431 )Cash flow 5,092 (16,166 ) (17,922 ) (28,996 )Finance lease additions (147 ) (2,581 ) — (2,728 )Other movements (7,438 ) 6,687 — (751 )Currency translation differences and foreign exchange gains/(losses) 83 1,607 (1,503 ) 187 At December 31, 2016 (9,484 ) (82,992 ) 19,130 (73,346 )
Management’s financial strategy is to manage Shell’s assets and liabilities with the aim that, across the business cycle, “cash in” at least equals “cash out” while maintaining a strongbalance sheet.
FINANCIAL STATEMENTS AND SUPPLEMENTS SHELL ANNUAL REPORT AND FORM 20-F 2017 157

Gearing, defined as net debt (total debt less cash and cash equivalents) as a percentage of total capital (net debt plus total equity), is a key measure of Shell’s capital structure. Across thebusiness cycle, management aims to manage gearing within a range of 0-30%. At December 31, 2017, gearing was 24.8% (2016: 28.0%).
Gearing $ million, except where indicated Dec 31, 2017 Dec 31, 2016 Net debt 65,353 73,346 Total equity 197,812 188,511 Total capital 263,165 261,857 Gearing 24.8 % 28.0 %
Management’s priorities for applying Shell’s cash are the servicing and reduction of debt commitments, payment of dividends, followed by a balance of capital investment and sharebuybacks. Management’s policy is to grow the dollar dividend through time, in line with its view of Shell’s underlying earnings and cash flow. Shell has access to international debt capital markets via two commercial paper (CP) programmes, a Euro medium-term note (EMTN) programme and a US universal shelf (US shelf)registration. Issuances under the CP programmes are supported by a committed credit facility and cash.
Borrowing facilities and amounts undrawn $ million Facility Amount undrawn Dec 31, 2017 Dec 31, 2016 Dec 31, 2017 Dec 31, 2016 CP programmes 20,000 20,000 19,659 18,982 EMTN programme unlimited unlimited N/A N/A US shelf registration unlimited unlimited N/A N/A Committed credit facility 8,500 7,480 8,500 7,480
Under the CP programmes, Shell can issue debt of up to $10 billion with maturities not exceeding 270 days and $10 billion with maturities not exceeding 397 days. The EMTNprogramme is updated each year, most recently in August 2017. No debt was issued under this programme in 2017 (2016: $4,510 million issued). The US shelf registration providesShell with the flexibility to issue debt securities, ordinary shares, preferred shares and warrants. The registration is updated every three years and was last updated in December 2017.No debt was issued under this registration in 2017 (2016: $12,000 million issued). The committed credit facility is available at pre-agreed margins and expires in 2020. The terms andavailability are not conditional on Shell’s financial ratios or its financial credit ratings. In addition, other subsidiaries have access to undrawn short-term bank facilities totalling $3,409 million at December 31, 2017 (2016: $3,835 million). Interest rate swaps have been entered into against certain fixed rate debt affecting the effective interest rate on these balances (see Note 19). The following tables compare contractual cash flows for debt excluding finance lease liabilities at December 31, with the carrying amount in the Consolidated Balance Sheet.Contractual amounts reflect the effects of changes in foreign exchange rates; differences from carrying amounts reflect the effects of discounting, premiums and, where hedgeaccounting is applied, fair value adjustments. Interest is estimated assuming interest rates applicable to variable rate debt remain constant and there is no change in aggregate principalamounts of debt other than repayment at scheduled maturity, as reflected in the table.
2017 $ million Contractual payments Between Between Between Between Difference Less than 1 and 2 2 and 3 3 and 4 4 and 5 5 years from carrying Carrying 1 year years years years years and later Total amount amount Commercial paper 341 — — — — — 341 5 346 Bonds 8,989 8,306 5,900 5,047 4,620 35,037 67,899 131 68,030 Bank and other borrowings 1,321 43 127 56 180 36 1,763 2 1,765 Total (excluding interest) 10,651 8,349 6,027 5,103 4,800 35,073 70,003 138 70,141 Interest 1,957 1,688 1,457 1,328 1,221 15,293 22,944
FINANCIAL STATEMENTS AND SUPPLEMENTS SHELL ANNUAL REPORT AND FORM 20-F 2017 158

2016 $ million Contractual payments Between Between Between Between Difference Less than 1 and 2 2 and 3 3 and 4 4 and 5 5 years from carrying Carrying 1 year years years years years and later Total amount amount Commercial paper 1,018 — — — — — 1,018 (6) 1,012 Bonds 5,943 8,483 7,964 5,900 4,902 39,566 72,758 321 73,079 Bank and other borrowings 1,363 595 358 302 213 572 3,403 123 3,526 Total (excluding interest) 8,324 9,078 8,322 6,202 5,115 40,138 77,179 438 77,617 Interest 2,236 2,051 1,790 1,557 1,423 23,230 32,287
The fair value of debt excluding finance lease liabilities at December 31, 2017, was $74,650 million (2016: $80,408 million), mainly determined from the prices quoted for thosesecurities. LEASE ARRANGEMENTSFinance lease liabilities mainly relate to contracts in Upstream and Integrated Gas for floating production, storage and offloading units, subsea equipment and power generation.Finance lease liabilities are secured on the leased assets. Operating lease contracts are, in Upstream and Integrated Gas, principally for drilling and ancillary equipment, service vessels,LNG vessels and land and buildings; in Downstream, principally for tankers, storage capacity and retail sites; and in Corporate, principally for land and buildings. The future minimum lease payments for finance and operating leases and the present value of future minimum finance lease payments at December 31, by payment date are as follows:
2017 $ million Finance leases Operating leases
Futureminimum
lease payments Interest
Present valueof future minimum
lease payments
Futureminimum lease
payments [A] Less than 1 year 2,274 1,190 1,084 4,793 Between 1 and 5 years 8,246 3,887 4,359 12,961 5 years and later 15,043 4,962 10,081 5,715 Total 25,563 10,039 15,524 23,469[A] Including $5,660 million in respect of drilling and ancillary equipment (see Note 8).
2016 $ million Finance leases Operating leases
Futureminimum
lease payments Interest
Present valueof future minimum
lease payments
Futureminimum lease
payments [A] Less than 1 year 2,193 1,070 1,123 4,805 Between 1 and 5 years 7,727 3,265 4,462 13,979 5 years and later 14,305 5,031 9,274 7,214 Total 24,225 9,366 14,859 25,998[A] Including $6,926 million in respect of drilling and ancillary equipment (see Note 8). Future minimum lease payments at December 31, 2017, are stated before deduction of amounts expected to be received under non-cancellable sub-leases of $336 million (2016: $418million) in respect of finance leases and $300 million (2016: $252 million) in respect of operating leases. Operating lease expense in 2017 was $4,822 million (2016: $5,063 million; 2015: $4,751 million).
FINANCIAL STATEMENTS AND SUPPLEMENTS SHELL ANNUAL REPORT AND FORM 20-F 2017 159

15 TRADE AND OTHER PAYABLES
$ million Dec 31, 2017 Dec 31, 2016 Current Non-current Current Non-current Trade payables 33,196 — 28,069 — Other payables 5,767 3,090 5,007 3,035 Amounts due to joint ventures and associates 2,021 29 1,973 26 Derivative contracts (see Note 19) 5,253 981 6,418 3,315 Accruals and deferred income 10,426 328 11,950 549 Total 56,663 4,428 53,417 6,925
The fair value of financial liabilities included above approximates the carrying amount and, other than the fair value of certain derivative contracts, was determined frompredominantly unobservable inputs. Other payables include amounts due to joint arrangement partners and in respect of other project-related items and cash-settled share-based compensation plans. Information about offsetting, collateral and liquidity risk is presented in Note 19. 16 TAXATION
Taxation charge/(credit) $ million 2017 2016 2015 Current tax
Charge in respect of current period 7,204 3,936 6,886 Adjustments in respect of prior periods (613 ) (1,205 ) 172
Total 6,591 2,731 7,058 Deferred tax
Relating to the origination and reversal of temporary differences, tax losses and credits (4,102 ) (2,688 ) (6,833 )Relating to changes in tax rates and legislation 2,004 (200 ) (526 )Adjustments in respect of prior periods 202 986 148
Total (1,896 ) (1,902 ) (7,211 )Total taxation charge/(credit) 4,695 829 (153 )
Adjustments in respect of prior periods relate to events in the current period and reflect the effects of changes in rules, facts or other factors compared with those used in establishingthe current tax position or deferred tax balance in prior periods. In 2017, deferred tax relating to changes in tax rates and legislation was mainly in respect of the US Tax Cuts and Jobs Act (the Act).
FINANCIAL STATEMENTS AND SUPPLEMENTS SHELL ANNUAL REPORT AND FORM 20-F 2017 160

Reconciliation of applicable tax charge/(credit) at statutory tax rates to taxation charge/(credit) $ million 2017 2016 2015 Income before taxation 18,130 5,606 2,047 Less: share of profit of joint ventures and associates (4,225 ) (3,545 ) (3,527 )Income/(loss) before taxation and share of profit of joint ventures and associates 13,905 2,061 (1,480 )Applicable tax charge/(credit) at statutory tax rates 4,532 (344 ) 930 Adjustments in respect of prior periods (411 ) (219 ) 320 Tax effects of:
Expenses not deductible for tax purposes 2,423 2,066 1,452 Changes in tax rates and legislation (see above) 2,004 (200 ) (526 )Income not subject to tax at statutory rates (1,852 ) (1,740 ) (2,597 )(Recognition)/derecognition of deferred tax assets (957 ) 1,575 108 Deductible items not expensed (584 ) (516 ) (418 )Taxable income not recognised 251 509 384
Other (711 ) (302 ) 194 Taxation charge/(credit) 4,695 829 (153 )
The weighted average of statutory tax rates was 33% in 2017 (2016: (17)%; 2015: (63)%). The rate in 2017 reflects a return to an overall tax charge on a pre-tax income. The negativerate in 2016 (tax credit on pre-tax income) was mainly due to losses incurred in jurisdictions with a higher weighted average statutory rate than jurisdictions in which profits weremade. The negative rate in 2015 (tax charge on a pre-tax loss) was mainly due to impairment charges, and other charges related to ceasing activities in Alaska and the Carmon Creekproject.
Taxes payable $ million Dec 31, 2017 Dec 31, 2016 Income taxes 4,062 4,082 Sales taxes, excise duties and similar levies 3,188 2,603 Total 7,250 6,685 Included in other receivables at December 31, 2017 (see Note 11), was income tax receivable of $933 million (2016: $1,037 million).
FINANCIAL STATEMENTS AND SUPPLEMENTS SHELL ANNUAL REPORT AND FORM 20-F 2017 161

Deferred tax $ million
Total
Decommissioningand other
provisions
Lossescarried
forward
Property,plant and
equipment Retirement
benefits Other At January 1, 2017
Deferred tax assets 14,425 2,944 12,179 (6,607 ) 3,817 2,092 Deferred tax liabilities (15,274 ) 4,789 3,816 (23,846 ) 654 (687 )
(849 ) 7,733 15,995 (30,453 ) 4,471 1,405 Recognised in the year
Recognised in income 1,896 (1,853 ) (3,221 ) 6,626 (622 ) 966 Other movements (584 ) 33 (763 ) 964 (876 ) 58 Currency translation differences 321 269 553 (662 ) 153 8
1,633 (1,551 ) (3,431 ) 6,928 (1,345 ) 1,032 At December 31, 2017
Deferred tax assets 13,791 3,679 11,765 (7,698 ) 3,347 2,698 Deferred tax liabilities (13,007 ) 2,503 799 (15,827 ) (221 ) (261 )
784 6,182 12,564 (23,525 ) 3,126 2,437 At January 1, 2016
Deferred tax assets 11,033 3,674 7,688 (6,651 ) 3,461 2,861 Deferred tax liabilities (8,976 ) 5,307 3,806 (17,664 ) 309 (734 )
2,057 8,981 11,494 (24,315 ) 3,770 2,127 Recognised in the year
Additions on acquisition of BG (5,163 ) [A] 702 1,624 (7,310 ) 39 (218 )Recognised in income 1,902 (1,445 ) 3,566 144 33 (396 )Other movements 610 94 (229 ) 199 738 (192 )Currency translation differences (255 ) (599 ) (460 ) 829 (109 ) 84
(2,906 ) (1,248 ) 4,501 (6,138 ) 701 (722 )At December 31, 2016
Deferred tax assets 14,425 2,944 12,179 (6,607 ) 3,817 2,092 Deferred tax liabilities (15,274 ) 4,789 3,816 (23,846 ) 654 (687 )
(849 ) 7,733 15,995 (30,453 ) 4,471 1,405[A] Comprising deferred tax assets and liabilities of $3,278 million and $8,441 million respectively.
The table above takes into consideration the offsetting of deferred tax assets and deferred tax liabilities within the same tax jurisdiction. The overall deferred tax position in a particulartax jurisdiction determines if a deferred tax balance is presented within deferred tax assets or deferred tax liabilities. Accordingly, certain deferred tax assets are presented withindeferred tax liabilities, and certain deferred tax liabilities within deferred tax assets. Other movements in deferred tax assets and liabilities principally relate to acquisitions, sales of non-current assets and businesses, and amounts recognised in other comprehensiveincome, which in 2017 include amounts in respect of the Act. Before taking into consideration the offsetting described above, the amount of deferred tax assets dependent on future taxable profits not arising from the reversal of existing deferredtax liabilities, and which relate to tax jurisdictions where Shell has suffered a loss in the current or preceding year, was $12,452 million at December 31, 2017 (2016: $11,896 million).It is considered probable based on business forecasts that such profits will be available. Unrecognised deductible temporary differences, unused tax losses and credits carried forward amounted to $34,773 million at December 31, 2017 (2016: $39,589 million) includingamounts of $28,016 million (2016: $31,669 million) that are subject to time limits for utilisation of five years or later or are not time limited. Retained earnings of subsidiaries, joint ventures and associates amounted to $223,746 million at December 31, 2017 (2016: $211,075 million). Provision has been made forwithholding and other taxes that would become payable on the distribution of these earnings only to the extent that either Shell does not control the relevant entity or it is expected thatthese earnings will be remitted in the foreseeable future. For a significant majority of the retained earnings no provision has been made, because either distribution would not be subjectto tax or is not expected in the foreseeable future.
FINANCIAL STATEMENTS AND SUPPLEMENTS SHELL ANNUAL REPORT AND FORM 20-F 2017 162

17 RETIREMENT BENEFITSRetirement benefits are provided through a number of funded and unfunded defined benefit plans and defined contribution plans, the most significant of which are in the Netherlands,UK and USA. Benefits comprise principally pensions; retirement healthcare and life insurance are also provided in certain countries.
Retirement benefit expense $ million 2017 2016 2015
Defined benefit plans: Current service cost, net of plan participants’ contributions 1,500 1,527 1,855 Interest expense on obligations 2,309 2,643 2,944 Interest income on plan assets (2,019 ) (2,358 ) (2,495 )Other (404 ) (116 ) 207
Total 1,386 1,696 2,511 Defined contribution plans 429 485 473 Total retirement benefit expense 1,815 2,181 2,984
Retirement benefit expense is presented principally within production and manufacturing expenses and selling, distribution and administrative expenses in the Consolidated Statementof Income. Interest income on plan assets is calculated using the same rate as that applied to the related defined benefit obligations for each plan to determine interest expense.
Remeasurements $ million 2017 2016 2015
Actuarial gains/(losses) on obligations: Due to changes in demographic assumptions 933 809 (517 )Due to changes in financial assumptions [A] (4,495 ) (11,391 ) 6,381 Due to experience adjustments 37 642 121
Total (3,525 ) (9,940 ) 5,985 Return on plan assets in excess of interest income 4,942 5,106 298 Other movements 50 18 55 Total remeasurements 1,467 (4,816 ) 6,338[A] Mainly in the discount rates applied.
Experience adjustments arise from differences between the actuarial assumptions made in respect of the year and actual outcomes.
Defined benefit plans $ million Dec 31, 2017 Dec 31, 2016
Obligations (104,285 ) (94,405 )Plan assets 93,243 81,276 Net liability (11,042 ) (13,129 )Retirement benefits in the Consolidated Balance Sheet:
Non-current assets 2,799 1,456 Non-current liabilities (13,247 ) (14,130 )Current liabilities (594 ) (455 )
Total (11,042 ) (13,129 )
FINANCIAL STATEMENTS AND SUPPLEMENTS SHELL ANNUAL REPORT AND FORM 20-F 2017 163

Defined benefit plan obligations $ million, except where indicated 2017 2016
At January 1 94,405 89,426 Current service cost 1,550 1,585 Interest expense 2,309 2,643 Actuarial losses 3,525 9,940 Benefit payments (4,579) (3,847) Other movements (949) 1,006 [A]Currency translation differences 8,024 (6,348) At December 31 104,285 94,405 Comprising:
Funded pension plans 94,903 85,357 Weighted average duration 19 years 18 years
Unfunded pension plans 4,824 4,463 Weighted average duration 12 years 11 years
Other unfunded plans 4,558 4,585 Weighted average duration 13 years 13 years
[A] Includes additions to obligations on acquisition of BG of $1,958 million.
Defined benefit plan assets $ million, except where indicated 2017 2016
At January 1 81,276 80,851 Return on plan assets (in excess of interest income) 4,942 5,106 Interest income 2,019 2,358 Employer contributions 1,804 1,341 Plan participants’ contributions 50 58 Benefit payments (4,294) (3,560) Other movements (245) 1,211 [A]Currency translation differences 7,691 (6,089) At December 31 93,243 81,276 Comprising:
Quoted in active markets: Equities 32% 29% Debt securities 45% 46% Real estate 1% 1% Investment funds 1% 1% Other 1% 1%
Other: Equities 7% 9% Debt securities 3% 3% Real estate 6% 6% Investment funds 3% 2% Other 1% 2%
[A] Includes additions to plan assets on acquisition of BG of $2,194 million.
Long-term investment strategies of plans are generally determined by the relevant pension plan trustees using a structured asset liability modelling approach to define the asset mix thatbest meets the objectives of optimising returns within agreed risk levels while maintaining adequate funding levels. Employer contributions to defined benefit pension plans are set by local trustees based on actuarial valuations in accordance with local regulations and are estimated to be $1.0 billionin 2018. Additional contributions to the Netherlands defined benefit pension plan would be required if the 12-month rolling average local funding percentage falls below 105% for six monthsor more. At the most recent (2017) funding valuation the local funding percentage was above this level. There are no set minimum statutory funding requirements for the UK plans.Under an agreement with the trustee of the main UK defined benefit plan, Shell will provide additional contributions if the funding position falls below a certain level. For the USplans, under the Pension Protection Act there are minimum required contribution levels; forecast contributions are expected to exceed these.
FINANCIAL STATEMENTS AND SUPPLEMENTS SHELL ANNUAL REPORT AND FORM 20-F 2017 164

The principal assumptions applied in determining the present value of defined benefit obligations and their bases were as follows: ■ rates of increase in pensionable remuneration, pensions in payment and healthcare costs: historical experience and management’s long-term expectation;■ discount rates: prevailing long-term AA corporate bond yields, chosen to match the currency and duration of the relevant obligation; and■ mortality rates: published standard mortality tables for the individual countries concerned adjusted for Shell experience where statistically significant. The weighted averages for those assumptions and related sensitivity information at December 31 are presented below. Sensitivity information indicates by how much the definedbenefit obligations would increase or decrease if a given assumption were to increase or decrease with no change in other assumptions.
$ million, except where indicated Effect of using alternative assumptions Assumptions used Increase/(decrease) in defined benefit obligations 2017 2016 Range of assumptions 2017 2016
Rate of increase in pensionable remuneration 5% 5% -1% to +1% (2,150) to 2,782 (1,895) to 2,504Rate of increase in pensions in payment 2% 2% -1% to +1% (10,120) to 12,662 (8,850) to 11,271Rate of increase in healthcare costs 7% 7% -1% to +1% (451) to 551 (455) to 555Discount rate for pension plans 3% 3% -1% to +1% 19,042 to (14,567) 16,904 to (12,912)Discount rate for healthcare plans 4% 4% -1% to +1% 599 to (483) 662 to (528)Expected age at death for persons aged 60:
Men 87 years 87 years -1 year to +1 year (1,906) to 2,022 (1,743) to 1,797Women 89 years 89 years -1 year to +1 year (1,720) to 1,828 (1,484) to 1,530
FINANCIAL STATEMENTS AND SUPPLEMENTS SHELL ANNUAL REPORT AND FORM 20-F 2017 165

18 DECOMMISSIONING AND OTHER PROVISIONS
$ million
Decommissioning
and restoration Other TotalAt January 1, 2017
Current 797 2,987 3,784Non-current 24,368 5,250 29,618
25,165 8,237 33,402Additions 1,168 2,630 3,798Amounts charged against provisions (491) (2,325) (2,816)Accretion expense 897 141 1,038Disposals (2,807) [A] (95) (2,902)Remeasurements and other movements (4,245) (1,021) (5,266)Currency translation differences 897 280 1,177 (4,581) (390) (4,971)At December 31, 2017
Current 817 2,648 3,465Non-current 19,767 5,199 24,966
20,584 7,847 28,431At January 1, 2016
Current 1,239 2,826 4,065Non-current 23,008 3,140 26,148
24,247 5,966 30,213Additions on acquisition of BG 3,965 1,577 [B] 5,542Other additions
976 [C] 4,793[C][D] 5,769
Amounts charged against provisions (880) (2,562) (3,442)Accretion expense 1,013 103 1,116Disposals (478) [C] (80) [C] (558)Remeasurements and other movements (2,528) [C] (1,410) [C] (3,938)Currency translation differences (1,150) (150) (1,300) 918 2,271 3,189At December 31, 2016
Current 797 2,987 3,784Non-current 24,368 5,250 29,618
25,165 8,237 33,402[A] Mainly related to interests in the UK and Canada.[B] Includes $950 million representing the fair value of contingent liabilities assumed, mainly in relation to litigation costs.[C] As revised, to align with current year presentation.[D] Mainly relating to onerous contracts and redundancy costs (see Note 26).
The amount and timing of settlement in respect of these provisions are uncertain and dependent on various factors that are not always within management’s control. The discount rateapplied at December 31, 2017 was 4% (2016: 4%).
Reviews of estimated future decommissioning and restoration costs and the discount rate applied are carried out annually. In 2017, the review identified cost reductions from moreefficient execution of decommissioning and restoration activities such as onshore demolition, supply chain improvements, learning from other industries and application oftechnologies. In 2017, there was a decrease of $3,980 million (2016: $2,361 million) in the provision resulting from changes in cost estimates, reported within remeasurements andother movements. Of the decommissioning and restoration provision at December 31, 2017, an estimated $3,896 million is expected to be utilised between one to five years, $3,449 million within six to10 years, and the remainder in later periods. Other provisions principally comprise amounts recognised in respect of environmental costs ($1,505 million at December 31, 2017; 2016: $1,482 million), litigation costs, redundancycosts, employee benefits and onerous contracts.
FINANCIAL STATEMENTS AND SUPPLEMENTS SHELL ANNUAL REPORT AND FORM 20-F 2017 166

19 FINANCIAL INSTRUMENTS AND OTHER DERIVATIVE CONTRACTSFinancial instruments and other derivative contracts in the Consolidated Balance Sheet comprise investments in securities (see Note 10), cash and cash equivalents (see Note 13), debt(see Note 14) and certain amounts reported within trade and other receivables (see Note 11) and trade and other payables (see Note 15), which include derivative contracts. RISKSIn the normal course of business, financial instruments of various kinds are used for the purposes of managing exposure to interest rate, foreign exchange and commodity pricemovements. Treasury standards are applicable to all subsidiaries and each subsidiary is required to adopt a treasury policy consistent with these standards. These policies cover: financing structure;interest rate and foreign exchange risk management; insurance; counterparty risk management; and use of derivative contracts. Wherever possible, treasury operations are carried outthrough specialist regional organisations without removing from each subsidiary the responsibility to formulate and implement appropriate treasury policies. Apart from forward foreign exchange contracts to meet known commitments, the use of derivative contracts by most subsidiaries is not permitted by their treasury policy. Other than in exceptional cases, the use of external derivative contracts is confined to specialist trading and central treasury organisations that have appropriate skills, experience,supervision, control and reporting systems. Shell’s operations expose it to market, credit and liquidity risk, as described below. Market riskMarket risk is the possibility that changes in interest rates, foreign exchange rates or the prices of crude oil, natural gas, LNG, refined products, chemical feedstocks, power and carbon-emission rights will adversely affect the value of assets, liabilities or expected future cash flows. Interest rate riskMost debt is raised from central borrowing programmes. Shell’s policy continues to be to have debt principally denominated in dollars and to maintain a largely floating interest rateexposure profile; however, Shell has issued a significant amount of fixed rate debt in recent years, taking advantage of historically low interest rates available in US debt markets. As aresult, a substantial portion of the debt portfolio at December 31, 2017, is at fixed rates and this reduces Shell’s exposure to the dollar LIBOR interest rate. The financing of most subsidiaries is structured on a floating-rate basis and, except in special cases, further interest rate risk management is discouraged. On the basis of the floating rate net debt position at December 31, 2017, (both issued and hedged), and assuming other factors (principally foreign exchange rates and commodityprices) remained constant and that no further interest rate management action was taken, an increase in interest rates of 1% would have decreased 2017 income before taxation by $174million (2016: $210 million, based on the floating rate position at December 31, 2016). The carrying amounts and maturities of debt and borrowing facilities are presented in Note 14. Interest expense is presented in Note 6.
FINANCIAL STATEMENTS AND SUPPLEMENTS SHELL ANNUAL REPORT AND FORM 20-F 2017 167

Foreign exchange riskMany of the markets in which Shell operates are priced, directly or indirectly, in dollars. As a result, the functional currency of most Integrated Gas and Upstream entities and thosewith significant cross-border business is the dollar. For Downstream entities, the functional currency is typically the local currency. Consequently, Shell is exposed to varying levels offoreign exchange risk when an entity enters into transactions that are not denominated in its functional currency, when foreign currency monetary assets and liabilities are translated atthe balance sheet date and as a result of holding net investments in operations that are not dollar-functional. Each entity is required to adopt treasury policies that are designed tomeasure and manage its foreign exchange exposures by reference to its functional currency. Foreign exchange gains and losses arise in the normal course of business from the recognition of receivables and payables and other monetary items in currencies other than an entity’sfunctional currency. Foreign exchange risk may also arise in connection with capital expenditure. For major projects, an assessment is made at the final investment decision stagewhether to hedge any resulting exposure. Assuming other factors (principally interest rates and commodity prices) remained constant and that no further foreign exchange risk management action were taken, a 10%appreciation against the dollar at December 31 of the main currencies to which Shell is exposed would have the following effects:
$ million
Increase/(decrease)
in income before taxation Increase in net assets 2017 2016 2017 2016
10% appreciation against the dollar of: Canadian dollar (43 ) (53 ) 1,111 1,666 Euro 130 (75 ) 1,086 845 Australian dollar (24 ) 45 786 669 Sterling (77 ) (141 ) 632 549
The above sensitivity information was calculated by reference to carrying amounts of assets and liabilities at December 31 only. The effect on income before taxation arises inconnection with monetary balances denominated in currencies other than an entity’s functional currency; the effect on net assets arises principally from the translation of assets andliabilities of entities that are not dollar-functional. Foreign exchange gains and losses included in income are presented in Note 5. Commodity price riskCertain subsidiaries have a mandate to trade crude oil, natural gas, LNG, refined products, chemical feedstocks, power and carbon-emission rights, and to use commodity derivativecontracts (forwards, futures, swaps and options) as a means of managing price and timing risks arising from this trading activity. In effecting these transactions, the entities concernedoperate within procedures and policies designed to ensure that risks, including those relating to the default of counterparties, are managed within authorised limits. Risk management systems are used for recording and valuing instruments. Commodity price risk exposure is monitored, and the acceptable level of exposure determined, by marketrisk committees. There is regular reviewing of mandated trading limits by senior management, daily monitoring of market risk exposure using value-at-risk (VAR) techniques, dailymonitoring of trading positions against limits, and marking-to-fair value of trading exposures with a department independent of traders reviewing the market values applied. Althoughtrading losses can and do occur, the nature of the trading portfolio and its management are considered adequate mitigants against the risk of significant losses. VAR techniques based on variance/covariance or Monte Carlo simulation models are used to make a statistical assessment of the market risk arising from possible future changes inmarket values over a 24-hour period and within a 95% confidence level. The calculation of potential changes in fair value takes into account positions, the history of price movementsand the correlation of these price movements. Models are regularly reviewed against actual fair value movements to ensure integrity is maintained. The VAR year-end positions inrespect of commodities traded in active markets, which are presented in the table below, are calculated on a diversified basis in order to reflect the effect of offsetting risk withincombined portfolios.
Value-at-risk (pre-tax) $ million Dec 31, 2017 Dec 31, 2016
Global oil 25 29 North America gas and power 11 12 Europe gas and power 3 2 Carbon-emission rights 1 3
Credit riskPolicies are in place to ensure that sales of products are made to customers with appropriate creditworthiness. These policies include detailed credit analysis and monitoring of tradingpartners against counterparty credit limits. Credit information is regularly shared between business and finance functions, with dedicated teams in place to quickly identify and respondto cases of credit deterioration. Mitigation measures are defined and implemented for high-risk business partners and customers, and include shortened payment terms, collateral orother security posting and vigorous collections. In addition, policies limit
FINANCIAL STATEMENTS AND SUPPLEMENTS SHELL ANNUAL REPORT AND FORM 20-F 2017 168

the amount of credit exposure to any individual financial institution. There are no material concentrations of credit risk, with individual customers or geographically, and there hasbeen no significant level of counterparty default in recent years. Surplus cash is invested in a range of short-dated, secure and liquid instruments including short-term bank deposits, money market funds, reverse repos and similar instruments. Theportfolio of these investments is diversified to avoid concentrating risk in any one instrument, country or counterparty. Management monitors the investments regularly and adjusts theinvestment portfolio in light of new market information where necessary to ensure credit risk is effectively diversified. In commodity trading, counterparty credit risk is managed within a framework of credit limits with utilisation being regularly reviewed. Credit risk exposure is monitored and theacceptable level is determined by a credit committee. Credit checks are performed by a department independent of traders, and are undertaken before contractual commitment. Whereappropriate, netting arrangements, credit insurance, prepayments and collateral are used to manage specific risks. Shell routinely enters into offsetting, master netting and similar arrangements with trading and other counterparties to manage credit risk. Where there is a legally enforceable right ofoffset under such arrangements and Shell has the intention to settle on a net basis or realise the asset and settle the liability simultaneously, the net asset or liability is recognised in theConsolidated Balance Sheet, otherwise assets and liabilities are presented gross. These amounts, as presented net and gross within trade and other receivables and trade and otherpayables in the Consolidated Balance Sheet at December 31, were as follows:
2017 $ million Amounts offset Amounts not offset
Gross amounts
before offset Amounts
offset Net amountsas presented
Cash collateralreceived/pledged
Other offsettinginstruments Net amounts
Assets: Within trade receivables 10,642 6,486 4,156 42 51 4,063Within derivative contracts 6,987 2,387 4,600 186 2,326 2,088
Liabilities: Within trade payables 10,442 6,486 3,956 41 51 3,864Within derivative contracts 7,315 2,392 4,923 300 2,326 2,297
2016 $ million Amounts offset Amounts not offset
Gross amounts
before offset Amounts
offset Net amountsas presented
Cash collateralreceived/pledged
Other offsettinginstruments Net amounts
Assets: Within trade receivables 9,844 6,539 3,305 1 12 3,292 Within derivative contracts 6,309 2,197 4,112 107 2,126 [A] 1,879 [A]
Liabilities: Within trade payables 9,489 6,535 2,954 — 12 2,942 Within derivative contracts 9,434 2,197 7,237 86 2,126 [A] 5,025 [A]
[A] As revised. Amounts not offset principally relate to contracts where the intention to settle on a net basis was not clearly established at December 31. The carrying amount of financial assets pledged as collateral for liabilities or contingent liabilities at December 31, 2017, presented within trade and other receivables, was $1,890million (2016: $1,815 million). The carrying amount of collateral held at December 31, 2017, presented within trade and other payables, was $282 million (2016: $173 million).Collateral mainly relates to initial margins held with commodity exchanges and over-the-counter counterparty variation margins. Liquidity riskLiquidity risk is the risk that suitable sources of funding for Shell’s business activities may not be available. Management believes that it has access to sufficient debt funding sources(capital markets), and to undrawn committed borrowing facilities to meet foreseeable requirements. Information about borrowing facilities is presented in Note 14. DERIVATIVE CONTRACTS AND HEDGESDerivative contracts are used principally as hedging instruments, however, because hedge accounting is not always applied, movements in the carrying amounts of derivative contractsthat are recognised in income are not always matched in the same period by the recognition of the income effects of the related hedged items.
FINANCIAL STATEMENTS AND SUPPLEMENTS SHELL ANNUAL REPORT AND FORM 20-F 2017 169

Carrying amounts, maturities and hedgesThe carrying amounts of derivative contracts at December 31 (see Notes 11 and 15), designated and not designated as hedging instruments for hedge accounting purposes, were asfollows:
2017 $ million Assets Liabilities
Designated Not
designated Total Designated Not
designated Total Net Interest rate swaps — 16 16 165 34 199 (183 )Forward foreign exchange contracts 22 403 425 — 591 591 (166 )Currency swaps and options 483 208 691 815 76 891 (200 )Commodity derivatives — 4,929 4,929 — 4,428 4,428 501 Other contracts — 162 162 — 125 125 37 Total 505 5,718 6,223 980 5,254 6,234 (11 )
2016 $ million Assets Liabilities
Designated Not
designated Total Designated Not
designated Total Net Interest rate swaps 38 15 53 136 38 174 (121 )Forward foreign exchange contracts — 469 469 10 348 358 111 Currency swaps and options 3 280 283 3,241 545 3,786 (3,503 )Commodity derivatives — 5,480 5,480 — 5,230 5,230 250 Other contracts — 77 77 — 185 185 (108 )Total 41 6,321 6,362 3,387 6,346 9,733 (3,371 )
Net losses before tax on derivative contracts, excluding realised commodity contracts and those accounted for as hedges, were $1,321 million in 2017 (2016: $414 million gains; 2015:$4,107 million gains). In 2015, certain cash and cash equivalents and forward foreign exchange contracts were designated as cash flow hedges of a significant portion of the forecast cash consideration forthe acquisition of BG (see Note 29). Losses of $411 million were recognised in other comprehensive income in 2016 (2015: $537 million) and the accumulated losses were reclassifiedto the balance sheet in 2016 (see Note 22). In addition, certain contracts, mainly to hedge price risk relating to forecast commodity transactions which mature in 2018-2020, were designated in cash flow hedging relationships.In 2017, $29 million net losses for ineffectiveness were recognised in income (2016: $nil; 2015: $1 million net gains). The net carrying amount of commodity derivative contractsdesignated as cash flow hedging instruments at December 31, 2017, was a liability of $620 million (2016: $115 million), and was presented after the offset of related margin balancesmaintained with exchanges. Certain interest rate and currency swaps were designated in fair value hedges, principally in respect of debt for which the net carrying amount of the related derivative contracts, net ofaccrued interest, at December 31, 2017, was a liability of $826 million (2016: $3,472 million). In 2016, debt and currency swaps were designated as hedges of net investments in foreign operations, relating to the foreign exchange risk arising between certain intermediate holdingcompanies and their subsidiaries. The total carrying amount of the hedging instruments at December 31, 2016, was a net liability of $5,381 million. On January 1, 2017, these were de-designated as hedges following changes in the functional currency of certain entities to the US dollar. In the course of trading operations, certain contracts are entered into for delivery of commodities that are accounted for as derivatives. The resulting price exposures are managed byentering into related derivative contracts. These contracts are managed on a fair value basis and the maximum exposure to liquidity risk is the undiscounted fair value of derivativeliabilities. For a minority of commodity derivative contracts, carrying amounts cannot be derived from quoted market prices or other observable inputs, in which case fair value is estimatedusing valuation techniques such as Black-Scholes, option spread models and extrapolation using quoted spreads with assumptions developed internally based on observable marketactivity. Other contracts include certain contracts that are held to sell or purchase commodities and others containing embedded derivatives, which are required to be recognised at fair valuebecause of pricing or delivery conditions, even though they were entered into to meet operational requirements. These contracts are expected to mature in 2018-2025, with certaincontracts having early termination rights (for either party). Valuations are derived from quoted market prices for the next six years and, thereafter, from forward gas price formulaeused in similar contracts. Future gas price assumptions are the most significant input to this model, and a decrease at December 31, 2017, of 10% in the projected gas price would,assuming other inputs remained unchanged, increase income before taxation by $30 million (2016: $33 million).
FINANCIAL STATEMENTS AND SUPPLEMENTS SHELL ANNUAL REPORT AND FORM 20-F 2017 170

The contractual maturities of derivative liabilities at December 31 compare with their carrying amounts in the Consolidated Balance Sheet as follows:
2017 $ million Contractual maturities
Less than
1 year
Between1 and 2
years
Between2 and 3
years
Between3 and 4
years
Between4 and 5
years 5 years
and later Total
Differencefrom carrying
amount [A] Carrying
amount Forward foreign exchange contracts 315 37 14 3 2 (39) 332 259 591 Currency swaps and options 541 343 140 304 194 879 2,401 (1,510) 891 Commodity derivatives 3,002 754 305 122 74 263 4,520 (92) 4,428 Other contracts 146 115 56 18 1 3 339 (15) 324 Total 4,004 1,249 515 447 271 1,106 7,592 (1,358) 6,234[A] Mainly related to the effect of discounting.
2016 $ million Contractual maturities
Less than
1 year
Between1 and 2
years
Between2 and 3
years
Between3 and 4
years
Between4 and 5
years 5 years
and later Total
Differencefrom carrying
amount [A] Carrying
amount Forward foreign exchange contracts 341 97 56 — (27) — 467 (109) 358 Currency swaps and options 1,062 1,269 831 372 701 3,762 7,997 (4,211) 3,786 Commodity derivatives 3,889 706 344 111 47 204 5,301 (71) 5,230 Other contracts 95 130 102 53 20 3 403 (44) 359 Total 5,387 2,202 1,333 536 741 3,969 14,168 (4,435) 9,733[A] Mainly related to the effect of discounting.
Fair value measurementsThe net carrying amounts of derivative contracts held at December 31, categorised according to the predominant source and nature of inputs used in determining the fair value of eachcontract, were as follows:
2017 $ million
Prices in activemarkets for identical
assets/liabilities
Otherobservable
inputs Unobservable
inputs Total Interest rate swaps — (183 ) — (183 )Forward foreign exchange contracts — (166 ) — (166 )Currency swaps and options — (200 ) — (200 )Commodity derivatives 36 302 163 501 Other contracts — (97 ) 134 37 Total 36 (344 ) 297 (11 )
2016 $ million
Prices in activemarkets for identical
assets/liabilities
Otherobservable
inputs Unobservable
inputs Total Interest rate swaps — (121 ) — (121 )Forward foreign exchange contracts — 111 — 111 Currency swaps and options — (3,503 ) — (3,503 )Commodity derivatives 12 (153 ) 391 250 Other contracts (2 ) (183 ) 77 (108 )Total 10 (3,849 ) 468 (3,371 )
FINANCIAL STATEMENTS AND SUPPLEMENTS SHELL ANNUAL REPORT AND FORM 20-F 2017 171

Net carrying amounts of derivative contracts measured using predominantly unobservable inputs $ million 2017 2016
At January 1 468 607 Net losses recognised in revenue (248 ) (361 )Purchases (252 ) (227 )Sales 562 428 Recategorisations (net) (248 ) 56 Currency translation differences 15 (35 )At December 31 297 468
Included in net losses recognised in revenue in 2017 were unrealised net gains totalling $39 million relating to assets and liabilities held at December 31, 2017 (2016: $333 million). 20 SHARE CAPITAL
Issued and fully paid ordinary shares of €0.07 each [A] Number of shares Nominal value ($ million) A B A B Total
At January 1, 2017 4,428,903,813 3,745,486,731 374 309 683 Scrip dividends 168,232,237 — 13 — 13 At December 31, 2017 4,597,136,050 3,745,486,731 387 309 696 At January 1, 2016 3,990,921,569 2,440,410,614 340 206 546 Scrip dividends 219,253,936 — 17 — 17 Shares issued (see Note 29) 218,728,308 1,305,076,117 17 103 120 At December 31, 2016 4,428,903,813 3,745,486,731 374 309 683[A] Share capital at December 31, 2017, and 2016, also included 50,000 issued and fully paid sterling deferred shares of £1 each.
At the Company’s Annual General Meeting (AGM) on May 23, 2017, the Board was authorised to allot ordinary shares in the Company, and to grant rights to subscribe for or toconvert any security into ordinary shares in the Company, up to an aggregate nominal amount of €190 million (representing 2,714 million ordinary shares of €0.07 each), and to listsuch shares or rights on any stock exchange. This authority expires at the earlier of the close of business on August 23, 2018, and the end of the AGM to be held in 2018, unlesspreviously renewed, revoked or varied by the Company in a general meeting. 21 SHARE-BASED COMPENSATION PLANS AND SHARES HELD IN TRUST
Share-based compensation expense $ million 2017 2016 2015
Equity-settled plans 422 488 621 Cash-settled plans 380 205 129 Total 802 693 750
The principal share-based employee compensation plans are the PSP and LTIP. Awards of shares and American Depository Shares (ADSs) of the Company under the PSP and LTIP aregranted upon certain conditions to eligible employees. The actual amount of shares that may vest ranges from 0% to 200% of the awards, depending on the outcomes of prescribedperformance conditions over a three-year period beginning on January 1 of the award year. Shares and ADSs vest for nil consideration.
FINANCIAL STATEMENTS AND SUPPLEMENTS SHELL ANNUAL REPORT AND FORM 20-F 2017 172

Share awards under the PSP and LTIP
Number of A shares
(million) Number of B shares
(million) Number of A ADSs
(million)
Weighted averageremaining contractual
life (years) At January 1, 2017 36 12 10 1.0 Granted 10 4 3 Vested (12 ) (4 ) (4 ) Forfeited (1 ) — — At December 31, 2017 33 12 9 0.9 At January 1, 2016 36 12 10 1.0 Granted 11 4 3 Vested (11 ) (4 ) (3 ) At December 31, 2016 36 12 10 1.0
Other plans offer employees opportunities to acquire shares and ADSs of the Company or receive cash benefits measured by reference to the Company’s share price. Shell employee share ownership trusts and trust-like entities purchase the Company’s shares in the open market to meet delivery commitments under employee share plans. AtDecember 31, 2017, they held 15.2 million A shares (2016: 13.1 million), 2.9 million B shares (2016: 6.2 million) and 5.9 million A ADSs (2016: 4.9 million).
22 OTHER RESERVES
Other reserves attributable to Royal Dutch Shell plc shareholders $ million
Mergerreserve
Sharepremium
reserve
Capitalredemption
reserve Share plan
reserve
Accumulatedother
comprehensiveincome Total
At January 1, 2017 37,311 154 84 1,644 (27,895 ) 11,298 Other comprehensive income attributable to Royal Dutch Shell plc shareholders — — — — 5,851 5,851 Scrip dividends (13 ) — — — — (13 )Share-based compensation — — — (204 ) — (204 )At December 31, 2017 37,298 154 84 1,440 (22,044 ) 16,932 At January 1, 2016 3,398 154 84 1,658 (22,480 ) (17,186 )Other comprehensive loss attributable to Royal Dutch Shell plc shareholders — — — — (5,949 ) (5,949 )Scrip dividends (17 ) — — — — (17 )Shares issued 33,930 — — — — 33,930 Share-based compensation — — — (14 ) 534 520 At December 31, 2016 37,311 154 84 1,644 (27,895 ) 11,298 At January 1, 2015 3,405 154 83 1,723 (19,730 ) (14,365 )Other comprehensive loss attributable to Royal Dutch Shell plc shareholders — — — — (2,750 ) (2,750 )Scrip dividends (7 ) — — — — (7 )Repurchases of shares — — 1 — — 1 Share-based compensation — — — (65 ) — (65 )At December 31, 2015 3,398 154 84 1,658 (22,480 ) (17,186 )
FINANCIAL STATEMENTS AND SUPPLEMENTS SHELL ANNUAL REPORT AND FORM 20-F 2017 173
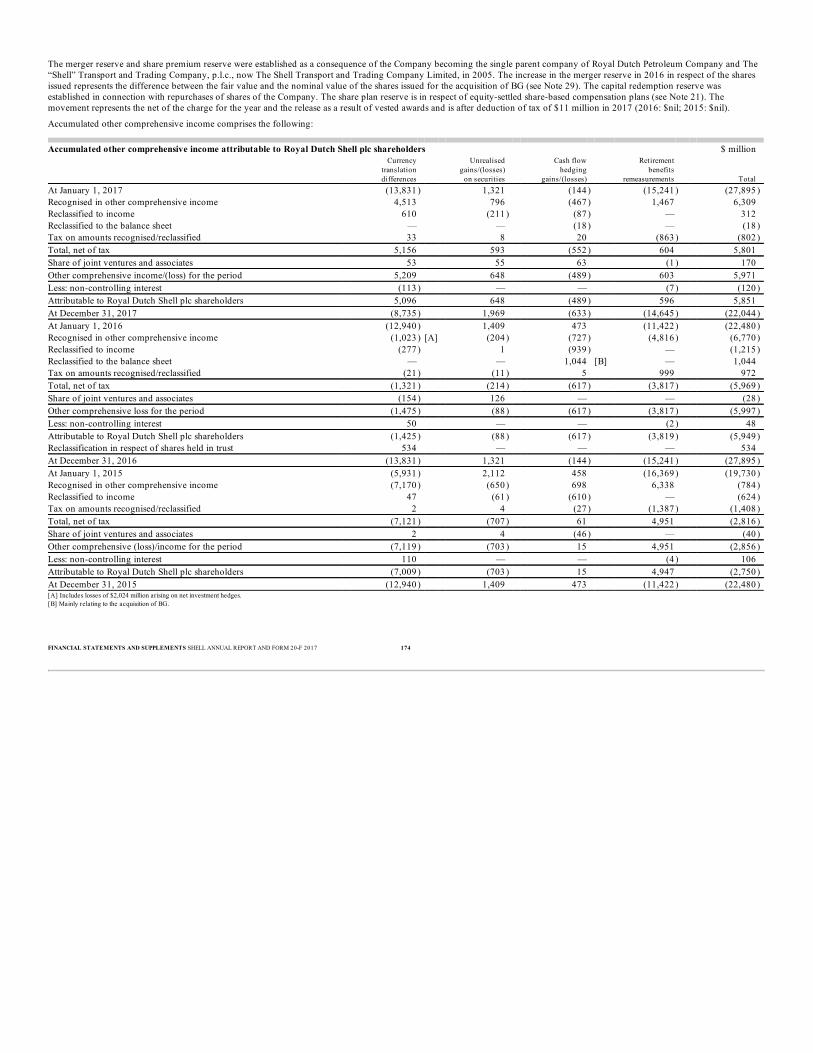
The merger reserve and share premium reserve were established as a consequence of the Company becoming the single parent company of Royal Dutch Petroleum Company and The“Shell” Transport and Trading Company, p.l.c., now The Shell Transport and Trading Company Limited, in 2005. The increase in the merger reserve in 2016 in respect of the sharesissued represents the difference between the fair value and the nominal value of the shares issued for the acquisition of BG (see Note 29). The capital redemption reserve wasestablished in connection with repurchases of shares of the Company. The share plan reserve is in respect of equity-settled share-based compensation plans (see Note 21). Themovement represents the net of the charge for the year and the release as a result of vested awards and is after deduction of tax of $11 million in 2017 (2016: $nil; 2015: $nil).
Accumulated other comprehensive income comprises the following:
Accumulated other comprehensive income attributable to Royal Dutch Shell plc shareholders $ million
Currencytranslationdifferences
Unrealisedgains/(losses)
on securities
Cash flowhedging
gains/(losses)
Retirementbenefits
remeasurements Total At January 1, 2017 (13,831 ) 1,321 (144 ) (15,241 ) (27,895 )Recognised in other comprehensive income 4,513 796 (467 ) 1,467 6,309 Reclassified to income 610 (211 ) (87 ) — 312 Reclassified to the balance sheet — — (18 ) — (18 )Tax on amounts recognised/reclassified 33 8 20 (863 ) (802 )Total, net of tax 5,156 593 (552 ) 604 5,801 Share of joint ventures and associates 53 55 63 (1 ) 170 Other comprehensive income/(loss) for the period 5,209 648 (489 ) 603 5,971 Less: non-controlling interest (113 ) — — (7 ) (120 )Attributable to Royal Dutch Shell plc shareholders 5,096 648 (489 ) 596 5,851 At December 31, 2017 (8,735 ) 1,969 (633 ) (14,645 ) (22,044 )At January 1, 2016 (12,940 ) 1,409 473 (11,422 ) (22,480 )Recognised in other comprehensive income (1,023 ) [A] (204 ) (727 ) (4,816 ) (6,770 )Reclassified to income (277 ) 1 (939 ) — (1,215 )Reclassified to the balance sheet — — 1,044 [B] — 1,044 Tax on amounts recognised/reclassified (21 ) (11 ) 5 999 972 Total, net of tax (1,321 ) (214 ) (617 ) (3,817 ) (5,969 )Share of joint ventures and associates (154 ) 126 — — (28 )Other comprehensive loss for the period (1,475 ) (88 ) (617 ) (3,817 ) (5,997 )Less: non-controlling interest 50 — — (2 ) 48 Attributable to Royal Dutch Shell plc shareholders (1,425 ) (88 ) (617 ) (3,819 ) (5,949 )Reclassification in respect of shares held in trust 534 — — — 534 At December 31, 2016 (13,831 ) 1,321 (144 ) (15,241 ) (27,895 )At January 1, 2015 (5,931 ) 2,112 458 (16,369 ) (19,730 )Recognised in other comprehensive income (7,170 ) (650 ) 698 6,338 (784 )Reclassified to income 47 (61 ) (610 ) — (624 )Tax on amounts recognised/reclassified 2 4 (27 ) (1,387 ) (1,408 )Total, net of tax (7,121 ) (707 ) 61 4,951 (2,816 )Share of joint ventures and associates 2 4 (46 ) — (40 )Other comprehensive (loss)/income for the period (7,119 ) (703 ) 15 4,951 (2,856 )Less: non-controlling interest 110 — — (4 ) 106 Attributable to Royal Dutch Shell plc shareholders (7,009 ) (703 ) 15 4,947 (2,750 )At December 31, 2015 (12,940 ) 1,409 473 (11,422 ) (22,480 )[A] Includes losses of $2,024 million arising on net investment hedges.[B] Mainly relating to the acquisition of BG.
FINANCIAL STATEMENTS AND SUPPLEMENTS SHELL ANNUAL REPORT AND FORM 20-F 2017 174

23 DIVIDENDS
Interim dividends $ million 2017 2016 2015
A shares Cash: $1.88 per share (2016: $1.88; 2015: $1.88) 4,919 4,545 5,203 Scrip: $1.88 per share (2016: $1.88; 2015: $1.88) 3,558 3,491 2,154
Total – A shares 8,477 8,036 7,357 B shares
Cash: $1.88 per share (2016: $1.88; 2015: $1.88) 5,958 5,132 4,167 Scrip: $1.88 per share (2016: $1.88; 2015: $1.88) 1,193 1,791 448
Total – B shares 7,151 6,923 4,615 Total 15,628 14,959 11,972
In addition, on February 1, 2018, the Directors announced a further interim dividend in respect of 2017 of $0.47 per A share and $0.47 per B share. The total dividend is estimated tobe $3,921 million and is payable on March 26, 2018, to shareholders on the register at February 16, 2018. The Scrip Dividend Programme has been cancelled with effect from thefourth quarter 2017 interim dividend. Dividends on A shares are by default paid in euros, although holders may elect to receive dividends in sterling. Dividends on B shares are by default paid in sterling, although holdersmay elect to receive dividends in euros. Dividends on ADSs are paid in dollars. 24 EARNINGS PER SHARE
2017 2016 2015 Income attributable to Royal Dutch Shell plc shareholders ($ million) 12,977 4,575 1,939 Weighted average number of A and B shares used as the basis for determining:
Basic earnings per share (million) 8,223.4 7,833.7 6,320.3 Diluted earnings per share (million) 8,299.0 7,891.7 6,393.8
Basic earnings per share are calculated by dividing the income attributable to Royal Dutch Shell plc shareholders for the year by the weighted average number of A and B sharesoutstanding during the year. The weighted average number of shares outstanding excludes shares held in trust. Diluted earnings per share are based on the same income figures. The weighted average number of shares outstanding during the year is increased by dilutive shares related to share-based compensation plans. Earnings per share are identical for A and B shares. 25 LEGAL PROCEEDINGS AND OTHER CONTINGENCIESGENERALIn the ordinary course of business, Shell subsidiaries are subject to a number of contingencies arising from litigation and claims brought by governmental, including tax authorities,and private parties. The operations and earnings of Shell subsidiaries continue, from time to time, to be affected to varying degrees by political, legislative, fiscal and regulatorydevelopments, including those relating to the protection of the environment and indigenous groups in the countries in which they operate. The industries in which Shell subsidiaries areengaged are also subject to physical risks of various types. The amounts claimed in relation to such events and, if such claims against Shell were successful, the costs of implementing the remedies sought in the various cases could be substantial.Based on information available to date and taking into account that in some cases it is not practicable to estimate the possible magnitude or timing of any resultant payments,management believes that the foregoing are not expected to have a material adverse impact on Shell’s Consolidated Financial Statements. However, there remains a high degree ofuncertainty around these contingencies, as well as their potential effect on future operations, earnings, cash flows and Shell’s financial condition. PESTICIDE LITIGATIONShell Oil Company (SOC), along with other agricultural chemical pesticide manufacturers and distributors, has been sued by public and quasi-public water purveyors allegingresponsibility for groundwater contamination caused by applications of chemical pesticides. Most of these lawsuits assert various theories of strict liability and seek to recover actualdamages, including water well treatment and remediation costs. All of the suits assert claims for punitive damages. There are approximately 35 such cases pending. Based on the claimsasserted and SOC’s track record with regard to amounts paid to resolve varying claims, management does not expect that the outcome of these lawsuits pending at December 31, 2017,will have a material adverse impact on Shell. However, there remains a high degree of uncertainty regarding the potential outcome of some of these pending lawsuits, as well as theirpotential effect on future operations, earnings, cash flows and Shell’s financial condition.
FINANCIAL STATEMENTS AND SUPPLEMENTS SHELL ANNUAL REPORT AND FORM 20-F 2017 175
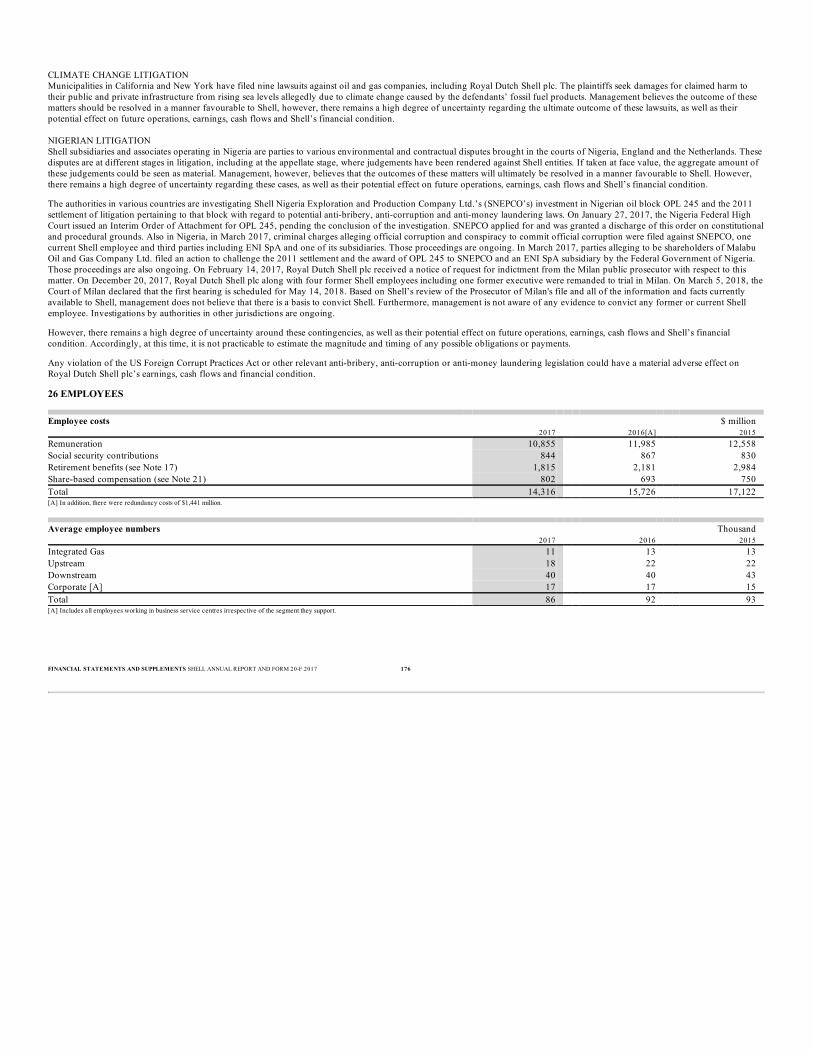
CLIMATE CHANGE LITIGATIONMunicipalities in California and New York have filed nine lawsuits against oil and gas companies, including Royal Dutch Shell plc. The plaintiffs seek damages for claimed harm totheir public and private infrastructure from rising sea levels allegedly due to climate change caused by the defendants’ fossil fuel products. Management believes the outcome of thesematters should be resolved in a manner favourable to Shell, however, there remains a high degree of uncertainty regarding the ultimate outcome of these lawsuits, as well as theirpotential effect on future operations, earnings, cash flows and Shell’s financial condition. NIGERIAN LITIGATIONShell subsidiaries and associates operating in Nigeria are parties to various environmental and contractual disputes brought in the courts of Nigeria, England and the Netherlands. Thesedisputes are at different stages in litigation, including at the appellate stage, where judgements have been rendered against Shell entities. If taken at face value, the aggregate amount ofthese judgements could be seen as material. Management, however, believes that the outcomes of these matters will ultimately be resolved in a manner favourable to Shell. However,there remains a high degree of uncertainty regarding these cases, as well as their potential effect on future operations, earnings, cash flows and Shell’s financial condition.
The authorities in various countries are investigating Shell Nigeria Exploration and Production Company Ltd.’s (SNEPCO’s) investment in Nigerian oil block OPL 245 and the 2011settlement of litigation pertaining to that block with regard to potential anti-bribery, anti-corruption and anti-money laundering laws. On January 27, 2017, the Nigeria Federal HighCourt issued an Interim Order of Attachment for OPL 245, pending the conclusion of the investigation. SNEPCO applied for and was granted a discharge of this order on constitutionaland procedural grounds. Also in Nigeria, in March 2017, criminal charges alleging official corruption and conspiracy to commit official corruption were filed against SNEPCO, onecurrent Shell employee and third parties including ENI SpA and one of its subsidiaries. Those proceedings are ongoing. In March 2017, parties alleging to be shareholders of MalabuOil and Gas Company Ltd. filed an action to challenge the 2011 settlement and the award of OPL 245 to SNEPCO and an ENI SpA subsidiary by the Federal Government of Nigeria.Those proceedings are also ongoing. On February 14, 2017, Royal Dutch Shell plc received a notice of request for indictment from the Milan public prosecutor with respect to thismatter. On December 20, 2017, Royal Dutch Shell plc along with four former Shell employees including one former executive were remanded to trial in Milan. On March 5, 2018, theCourt of Milan declared that the first hearing is scheduled for May 14, 2018. Based on Shell’s review of the Prosecutor of Milan's file and all of the information and facts currentlyavailable to Shell, management does not believe that there is a basis to convict Shell. Furthermore, management is not aware of any evidence to convict any former or current Shellemployee. Investigations by authorities in other jurisdictions are ongoing.
However, there remains a high degree of uncertainty around these contingencies, as well as their potential effect on future operations, earnings, cash flows and Shell’s financialcondition. Accordingly, at this time, it is not practicable to estimate the magnitude and timing of any possible obligations or payments.
Any violation of the US Foreign Corrupt Practices Act or other relevant anti-bribery, anti-corruption or anti-money laundering legislation could have a material adverse effect onRoyal Dutch Shell plc’s earnings, cash flows and financial condition.
26 EMPLOYEES
Employee costs $ million 2017 2016[A] 2015
Remuneration 10,855 11,985 12,558 Social security contributions 844 867 830 Retirement benefits (see Note 17) 1,815 2,181 2,984 Share-based compensation (see Note 21) 802 693 750 Total 14,316 15,726 17,122[A] In addition, there were redundancy costs of $1,441 million.
Average employee numbers Thousand 2017 2016 2015
Integrated Gas 11 13 13 Upstream 18 22 22 Downstream 40 40 43 Corporate [A] 17 17 15 Total 86 92 93[A] Includes all employees working in business service centres irrespective of the segment they support.
FINANCIAL STATEMENTS AND SUPPLEMENTS SHELL ANNUAL REPORT AND FORM 20-F 2017 176

27 DIRECTORS AND SENIOR MANAGEMENT .
Remuneration of Directors of the Company $ million 2017 2016 2015
Emoluments 11 10 12 Value of released awards under long-term incentive plans 5 8 1 Employer contributions to pension plans 1 1 1
Emoluments comprise salaries and fees, annual bonuses (for the period for which performance is assessed) and other benefits. The value of released awards under long-term incentiveplans for the period is in respect of the performance period ending in that year. In 2017, retirement benefits were accrued in respect of qualifying services under defined benefit plansby three Directors. Further information on the remuneration of the Directors can be found in the Directors’ Remuneration Report on pages 94-117.
Directors and Senior Management expense $ million 2017 2016 2015
Short-term benefits 23 21 21 Retirement benefits 3 3 4 Share-based compensation 17 15 19 Termination and related amounts 3 4 — Total 46 43 44
Directors and Senior Management comprise members of the Executive Committee and the Non-executive Directors of the Company.
Short-term benefits comprise salaries and fees, annual bonuses delivered in cash and shares (for the period for which performance is assessed), other benefits and employer socialsecurity contributions. Prior to 2017, these included the 50% of annual bonuses delivered in cash, and share-based compensation included the appropriate proportion of the deferredelement (under the Deferred Bonus Plan). Following shareholder approval at the 2017 AGM, the Deferred Bonus Plan has been removed and 50% of the bonus is delivered in sharessubject to a three-year holding period.
28 AUDITOR’S REMUNERATION
$ million 2017 2016 2015
Fees in respect of the audit of the Consolidated and Parent Company Financial Statements, including audit of consolidation returns 27 32 5 Other audit fees, principally in respect of audits of accounts of subsidiaries 21 17 46 Total audit fees 48 49 51 Audit-related fees [A] 4 2 2 Fees in respect of other non-audit services [B] 1 1 — Total 53 52 53[A] Categorised as fees for audit services for US reporting purposes. Aggregate audit fees for US reporting purposes amounted to $52 million in 2017 (2016: $51 million; 2015: $53 million).[B] Categorised as all other fees for US reporting purposes and mainly related to agreed-upon-procedures. In addition, the auditor provided audit services to retirement benefit plans for employees of subsidiaries. Remuneration amounted to $1 million in 2017 (2016: $1 million; 2015: $1million). With effect from 2016, Ernst & Young LLP (EY) was appointed as auditor of the Company, replacing PricewaterhouseCoopers LLP (PwC). Auditor’s remuneration for 2017 and2016 relates to EY and for 2015 to PwC. From 2016, fees in respect of the audit of the Consolidated Financial Statements include audit of consolidation returns carried out locally thatwas previously included within other audit fees.
FINANCIAL STATEMENTS AND SUPPLEMENTS SHELL ANNUAL REPORT AND FORM 20-F 2017 177
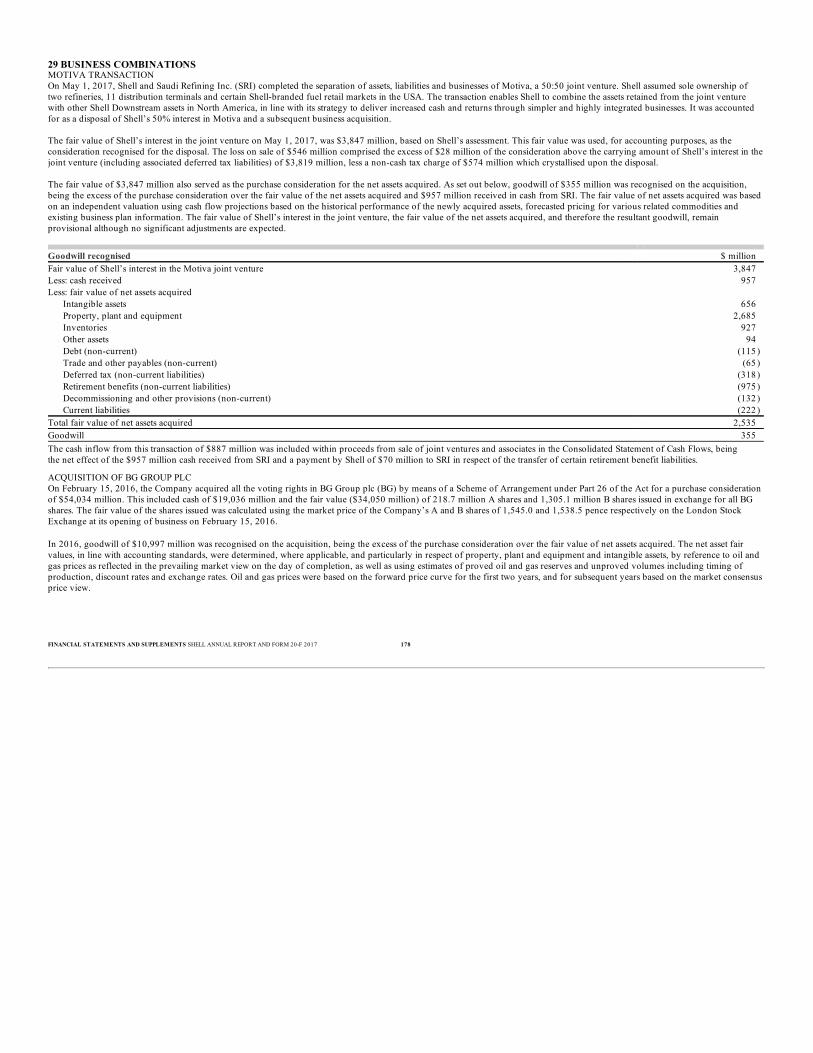
29 BUSINESS COMBINATIONSMOTIVA TRANSACTIONOn May 1, 2017, Shell and Saudi Refining Inc. (SRI) completed the separation of assets, liabilities and businesses of Motiva, a 50:50 joint venture. Shell assumed sole ownership oftwo refineries, 11 distribution terminals and certain Shell-branded fuel retail markets in the USA. The transaction enables Shell to combine the assets retained from the joint venturewith other Shell Downstream assets in North America, in line with its strategy to deliver increased cash and returns through simpler and highly integrated businesses. It was accountedfor as a disposal of Shell’s 50% interest in Motiva and a subsequent business acquisition. The fair value of Shell’s interest in the joint venture on May 1, 2017, was $3,847 million, based on Shell’s assessment. This fair value was used, for accounting purposes, as theconsideration recognised for the disposal. The loss on sale of $546 million comprised the excess of $28 million of the consideration above the carrying amount of Shell’s interest in thejoint venture (including associated deferred tax liabilities) of $3,819 million, less a non-cash tax charge of $574 million which crystallised upon the disposal. The fair value of $3,847 million also served as the purchase consideration for the net assets acquired. As set out below, goodwill of $355 million was recognised on the acquisition,being the excess of the purchase consideration over the fair value of the net assets acquired and $957 million received in cash from SRI. The fair value of net assets acquired was basedon an independent valuation using cash flow projections based on the historical performance of the newly acquired assets, forecasted pricing for various related commodities andexisting business plan information. The fair value of Shell’s interest in the joint venture, the fair value of the net assets acquired, and therefore the resultant goodwill, remainprovisional although no significant adjustments are expected.
Goodwill recognised $ million Fair value of Shell’s interest in the Motiva joint venture 3,847 Less: cash received 957 Less: fair value of net assets acquired
Intangible assets 656 Property, plant and equipment 2,685 Inventories 927 Other assets 94 Debt (non-current) (115 )Trade and other payables (non-current) (65 )Deferred tax (non-current liabilities) (318 )Retirement benefits (non-current liabilities) (975 )Decommissioning and other provisions (non-current) (132 )Current liabilities (222 )
Total fair value of net assets acquired 2,535 Goodwill 355The cash inflow from this transaction of $887 million was included within proceeds from sale of joint ventures and associates in the Consolidated Statement of Cash Flows, beingthe net effect of the $957 million cash received from SRI and a payment by Shell of $70 million to SRI in respect of the transfer of certain retirement benefit liabilities.
ACQUISITION OF BG GROUP PLCOn February 15, 2016, the Company acquired all the voting rights in BG Group plc (BG) by means of a Scheme of Arrangement under Part 26 of the Act for a purchase considerationof $54,034 million. This included cash of $19,036 million and the fair value ($34,050 million) of 218.7 million A shares and 1,305.1 million B shares issued in exchange for all BGshares. The fair value of the shares issued was calculated using the market price of the Company’s A and B shares of 1,545.0 and 1,538.5 pence respectively on the London StockExchange at its opening of business on February 15, 2016. In 2016, goodwill of $10,997 million was recognised on the acquisition, being the excess of the purchase consideration over the fair value of net assets acquired. The net asset fairvalues, in line with accounting standards, were determined, where applicable, and particularly in respect of property, plant and equipment and intangible assets, by reference to oil andgas prices as reflected in the prevailing market view on the day of completion, as well as using estimates of proved oil and gas reserves and unproved volumes including timing ofproduction, discount rates and exchange rates. Oil and gas prices were based on the forward price curve for the first two years, and for subsequent years based on the market consensusprice view.
FINANCIAL STATEMENTS AND SUPPLEMENTS SHELL ANNUAL REPORT AND FORM 20-F 2017 178
Supplementary information – oil and gas (unaudited)
The information set out on pages 179-198 is referred to as “unaudited” as a means of clarifying that it is not covered by the audit opinion of the independent registered publicaccounting firm that has audited and reported on the “Consolidated Financial Statements”.
PROVED RESERVESProved reserves estimates are calculated pursuant to the US Securities and Exchange Commission (SEC) Rules and the Financial Accounting Standard Board’s Topic 932. Provedreserves can be either developed or undeveloped. The definitions used are in accordance with the SEC Rule 4-10 (a) of Regulation S-X. We include proved reserves associated withfuture production that will be consumed in operations. Proved reserves shown are net of any quantities of crude oil or natural gas that are expected to be (or could be) taken as royalties in kind. Proved reserves outside North Americainclude quantities that will be settled as royalties in cash. Proved reserves include certain quantities of crude oil or natural gas that will be produced under arrangements that involveShell subsidiaries, joint ventures and associates in risks and rewards but do not transfer title of the product to those entities. Subsidiaries’ proved reserves at December 31, 2017, were divided into 80% developed and 20% undeveloped on a barrel of oil equivalent basis. For the Shell share of joint venturesand associates, the proved reserves at December 31, 2017, were divided into 91% developed and 9% undeveloped on a barrel of oil equivalent basis. Proved reserves are recognised under various forms of contractual agreements. Shell’s proved reserves volumes at December 31, 2017, present in agreements such as production-sharing contracts (PSC), tax/variable royalty contracts or other forms of economic entitlement contracts, where the Shell share of reserves can vary with commodity prices, were 1,941million barrels of crude oil and natural gas liquids, and 12,588 thousand million standard cubic feet (scf) of natural gas. Proved reserves cannot be measured exactly because estimation of reserves involves subjective judgement (see “Risk factors” on page 13 and our “Proved reserves assurance process”below). These estimates remain subject to revision and are unaudited supplementary information.
PROVED RESERVES ASSURANCE PROCESSA central group of reserves experts, who on average have around 29 years’ experience in the oil and gas industry, undertake the primary assurance of the proved reserves bookings.This group of experts is part of the Resources Assurance and Reporting (RAR) organisation within Shell. A Vice President with 32 years’ experience in the oil and gas industrycurrently heads the RAR organisation. He is a member of the Society of Petroleum Engineers and holds a BA in mathematics from Oxford University and a MEng in PetroleumEngineering from Heriot Watt University. The RAR organisation reports directly to an Executive Vice President of Finance, who is a member of the Upstream Reserves Committee(URC). The URC is a multidisciplinary committee consisting of senior representatives from the Finance, Legal, Projects & Technology and Upstream organisations. The URC reviewsand endorses all major (larger than 20 million barrels of oil equivalent) proved reserves bookings and endorses the total aggregated proved reserves. Final approval of all provedreserves bookings remains with Shell’s Executive Committee. The Internal Audit function also provides secondary assurance through audits of the control framework.
FINANCIAL STATEMENTS AND SUPPLEMENTS SHELL ANNUAL REPORT AND FORM 20-F 2017 179

CRUDE OIL, NATURAL GAS LIQUIDS, SYNTHETIC CRUDE OIL AND BITUMENShell subsidiaries’ proved reserves of crude oil, natural gas liquids (NGLs), synthetic crude oil and bitumen at the end of the year; their share of the proved reserves of joint venturesand associates at the end of the year; and the changes in such reserves during the year are set out on pages 181-183. Significant changes in these proved reserves are discussed below. PROVED RESERVES 2017-2016Shell subsidiariesEuropeThe net increase of 61 million barrels in revisions and reclassifications resulted from field performance studies and development activities in Denmark, Norway and the UK. The sale ofminerals in place of 50 million barrels occurred in the UK. AsiaThe net increase of 153 million barrels in revisions and reclassifications was mainly in Oman and Malaysia. The increase of 95 million barrels in extensions and discoveries was inKazakhstan and Malaysia. USAThe net increase of 235 million barrels in revisions and reclassifications resulted from field performance studies and development activities in respect of Stones and Mars in the Gulf ofMexico, and the Delaware Permian Basin. The increase of 242 million barrels in extensions and discoveries was in the Delaware Permian Basin, Appomattox and Vicksburg in the Gulfof Mexico. CanadaThe sale of minerals in place of 1,992 million barrels in synthetic crude oil resulted from the sale of our 60% interest in the Athabasca Oil Sands Project (AOSP) and our in-situ andundeveloped oil sands interests. The purchase of minerals in place of 664 million barrels in synthetic crude oil resulted from the separate acquisition of a 50% controlling interest inMarathon Oil Canada Corporation, which has a 20% interest in the AOSP. Shell share of joint ventures and associatesAsiaThe net increase of 76 million barrels in revisions and reclassifications was mainly in Brunei. PROVED RESERVES 2016-2015Shell subsidiariesAcquisition of BG Group plcPurchases of minerals in place included 1,205 million barrels additions on acquisition of BG Group plc (BG), notably 85 million barrels in Europe, 175 million barrels in Asia and 931million barrels in South America. AsiaThe net increase of 100 million barrels in revisions and reclassifications mainly related to Malaysia and Russia. CanadaThe increase of 96 million barrels in synthetic crude oil extensions and discoveries was in the Muskeg River Mine. South AmericaThe net increase of 86 million barrels in revisions and reclassifications was mainly due to a transfer of contingent resource to proved reserves in Brazil.
FINANCIAL STATEMENTS AND SUPPLEMENTS SHELL ANNUAL REPORT AND FORM 20-F 2017 180

Proved developed and undeveloped reserves 2017 Million barrels North America South Europe Asia Oceania Africa USA Canada America Total
Oil and
NGL Oil and
NGL Oil and
NGL Oil and
NGL Oil and
NGL Oil and
NGL Syntheticcrude oil Bitumen
Oil andNGL
Oil andNGL
Syntheticcrude oil Bitumen
Allproducts
Shell subsidiaries At January 1 435 1,386 128 529 491 18 2,014 2 992 3,979 2,014 2 5,995 Revisions and reclassifications 61 153 13 23 235 8 (3 ) 2 38 531 (3 ) 2 530 Improved recovery — 35 — — 38 — — — — 73 — — 73 Extensions and discoveries — 95 — — 242 7 — — 30 374 — — 374 Purchases of minerals in place — — — — 2 — 664 — — 2 664 — 666 Sales of minerals in place (50 ) — — (14 ) — — (1,992 ) (2 ) — (64 ) (1,992 ) (2 ) (2,058 )Production [A] (90 ) (187 ) (9 ) (75 ) (109 ) (11 ) (34 ) (2 ) (114 ) (595 ) (34 ) (2 ) (631 )At December 31 356 1,482 132 463 899 22 649 — 946 4,300 649 — 4,949
Shell share of joint ventures and associates
At January 1 7 256 — — — — — — — 263 — — 263 Revisions and reclassifications 6 76 — — — — — — — 82 — — 82 Improved recovery — 3 — — — — — — — 3 — — 3 Extensions and discoveries — 1 — — — — — — — 1 — — 1 Purchases of minerals in place — — — — — — — — — — — — — Sales of minerals in place — — — — — — — — — — — — — Production (1 ) (35 ) — — — — — — — (36 ) — — (36 )At December 31 12 301 — — — — — — — 313 — — 313
Total 368 1,783 132 463 899 22 649 — 946 4,613 649 — 5,262 Reserves attributable to non-controlling interest in Shell subsidiaries at December 31 — — — — — — 325 — — — 325 — 325[A] Included 1 million barrels consumed in operations for synthetic crude oil.
Proved developed reserves 2017 Million barrels North America South Europe Asia Oceania Africa USA Canada America Total
Oil and
NGL Oil and
NGL Oil and
NGL Oil and
NGL Oil and
NGL Oil and
NGL Syntheticcrude oil Bitumen
Oil andNGL
Oil andNGL
Syntheticcrude oil Bitumen
Allproducts
Shell subsidiaries At January 1 257 1,184 36 461 437 14 1,387 2 543 2,932 1,387 2 4,321 At December 31 250 1,364 46 373 569 21 649 — 651 3,274 649 — 3,923
Shell share of joint ventures and associates
At January 1 4 215 — — — — — — — 219 — — 219 At December 31 11 253 — — — — — — — 264 — — 264
Proved undeveloped reserves 2017 Million barrels North America South Europe Asia Oceania Africa USA Canada America Total
Oil and
NGL Oil and
NGL Oil and
NGL Oil and
NGL Oil and
NGL Oil and
NGL Syntheticcrude oil Bitumen
Oil andNGL
Oil andNGL
Syntheticcrude oil Bitumen
Allproducts
Shell subsidiaries At January 1 178 202 92 68 54 4 627 — 449 1,047 627 — 1,674 At December 31 106 118 86 90 330 1 — — 295 1,026 — — 1,026
Shell share of joint ventures and associates
At January 1 3 41 — — — — — — — 44 — — 44 At December 31 1 48 — — — — — — — 49 — — 49
FINANCIAL STATEMENTS AND SUPPLEMENTS SHELL ANNUAL REPORT AND FORM 20-F 2017 181

Proved developed and undeveloped reserves 2016 Million barrels North America South Europe Asia Oceania Africa USA Canada America Total
Oil and
NGL Oil and
NGL Oil and
NGL Oil and
NGL Oil and
NGL Oil and
NGL Syntheticcrude oil Bitumen
Oil andNGL
Oil andNGL
Syntheticcrude oil Bitumen
Allproducts
Shell subsidiaries At January 1 417 1,286 126 579 560 22 1,941 3 56 3,046 1,941 3 4,990 Revisions and reclassifications 24 100 9 21 17 3 33 4 86 260 33 4 297 Improved recovery — 22 — — 2 — — — — 24 — — 24 Extensions and discoveries — 4 — — 20 6 96 — — 30 96 — 126 Purchases of minerals in place 85 175 2 14 — — — — 931 1,207 — — 1,207 Sales of minerals in place (5 ) — — — (5 ) (2 ) — — — (12 ) — — (12 )Production [A] (86 ) (201 ) (9 ) (85 ) (103 ) (11 ) (56 ) (5 ) (81 ) (576 ) (56 ) (5 ) (637 )At December 31 435 1,386 128 529 491 18 2,014 2 992 3,979 2,014 2 5,995
Shell share of joint ventures and associates
At January 1 11 290 12 — — — — — — 313 — — 313 Revisions and reclassifications (3 ) 1 (11 ) — — — — — — (13 ) — — (13 )Improved recovery — — — — — — — — — — — — — Extensions and discoveries — 1 — — — — — — — 1 — — 1 Purchases of minerals in place — — — — — — — — — — — — — Sales of minerals in place — — — — — — — — — — — — — Production (1 ) (36 ) (1 ) — — — — — — (38 ) — — (38 )At December 31 7 256 — — — — — — — 263 — — 263
Total 442 1,642 128 529 491 18 2,014 2 992 4,242 2,014 2 6,258 Reserves attributable to non-controlling interest in Shell subsidiaries at December 31 — — — 4 — — — — — 4 — — 4[A] Included 2 million barrels consumed in operations for synthetic crude oil.
Proved developed reserves 2016 Million barrels North America South Europe Asia Oceania Africa USA Canada America Total
Oil and
NGL Oil and
NGL Oil and
NGL Oil and
NGL Oil and
NGL Oil and
NGL Syntheticcrude oil Bitumen
Oil andNGL
Oil andNGL
Syntheticcrude oil Bitumen
Allproducts
Shell subsidiaries At January 1 220 972 36 437 455 20 1,405 3 44 2,184 1,405 3 3,592 At December 31 257 1,184 36 461 437 14 1,387 2 543 2,932 1,387 2 4,321
Shell share of joint ventures and associates
At January 1 5 204 9 — — — — — — 218 — — 218 At December 31 4 215 — — — — — — — 219 — — 219
Proved undeveloped reserves 2016 Million barrels North America South Europe Asia Oceania Africa USA Canada America Total
Oil and
NGL Oil and
NGL Oil and
NGL Oil and
NGL Oil and
NGL Oil and
NGL Syntheticcrude oil Bitumen
Oil andNGL
Oil andNGL
Syntheticcrude oil Bitumen
Allproducts
Shell subsidiaries At January 1 197 314 90 142 105 2 536 — 12 862 536 — 1,398 At December 31 178 202 92 68 54 4 627 — 449 1,047 627 — 1,674
Shell share of joint ventures and associates
At January 1 6 86 3 — — — — — — 95 — — 95 At December 31 3 41 — — — — — — — 44 — — 44
FINANCIAL STATEMENTS AND SUPPLEMENTS SHELL ANNUAL REPORT AND FORM 20-F 2017 182
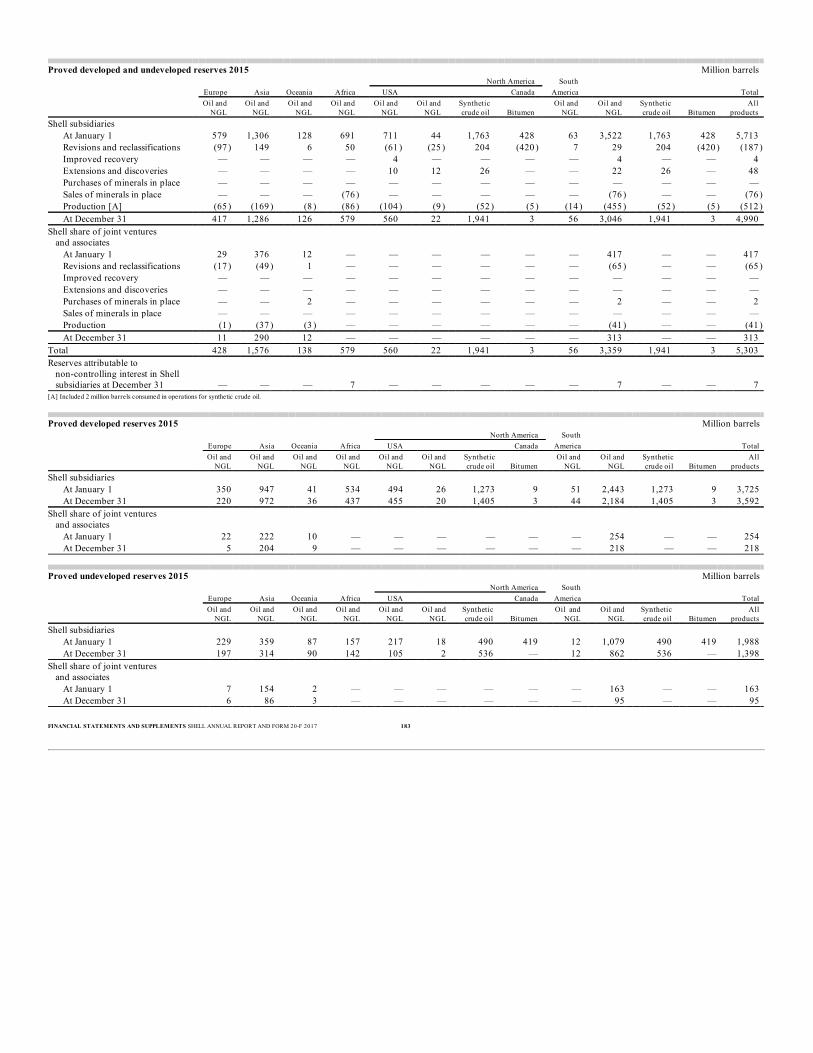
Proved developed and undeveloped reserves 2015 Million barrels North America South Europe Asia Oceania Africa USA Canada America Total
Oil and
NGL Oil and
NGL Oil and
NGL Oil and
NGL Oil and
NGL Oil and
NGL Syntheticcrude oil Bitumen
Oil andNGL
Oil andNGL
Syntheticcrude oil Bitumen
Allproducts
Shell subsidiaries At January 1 579 1,306 128 691 711 44 1,763 428 63 3,522 1,763 428 5,713 Revisions and reclassifications (97 ) 149 6 50 (61 ) (25 ) 204 (420 ) 7 29 204 (420 ) (187 )Improved recovery — — — — 4 — — — — 4 — — 4 Extensions and discoveries — — — — 10 12 26 — — 22 26 — 48 Purchases of minerals in place — — — — — — — — — — — — — Sales of minerals in place — — — (76 ) — — — — — (76 ) — — (76 )Production [A] (65 ) (169 ) (8 ) (86 ) (104 ) (9 ) (52 ) (5 ) (14 ) (455 ) (52 ) (5 ) (512 )At December 31 417 1,286 126 579 560 22 1,941 3 56 3,046 1,941 3 4,990
Shell share of joint ventures and associates
At January 1 29 376 12 — — — — — — 417 — — 417 Revisions and reclassifications (17 ) (49 ) 1 — — — — — — (65 ) — — (65 )Improved recovery — — — — — — — — — — — — — Extensions and discoveries — — — — — — — — — — — — — Purchases of minerals in place — — 2 — — — — — — 2 — — 2 Sales of minerals in place — — — — — — — — — — — — — Production (1 ) (37 ) (3 ) — — — — — — (41 ) — — (41 )At December 31 11 290 12 — — — — — — 313 — — 313
Total 428 1,576 138 579 560 22 1,941 3 56 3,359 1,941 3 5,303 Reserves attributable to non-controlling interest in Shell subsidiaries at December 31 — — — 7 — — — — — 7 — — 7[A] Included 2 million barrels consumed in operations for synthetic crude oil.
Proved developed reserves 2015 Million barrels North America South Europe Asia Oceania Africa USA Canada America Total
Oil and
NGL Oil and
NGL Oil and
NGL Oil and
NGL Oil and
NGL Oil and
NGL Syntheticcrude oil Bitumen
Oil andNGL
Oil andNGL
Syntheticcrude oil Bitumen
Allproducts
Shell subsidiaries At January 1 350 947 41 534 494 26 1,273 9 51 2,443 1,273 9 3,725 At December 31 220 972 36 437 455 20 1,405 3 44 2,184 1,405 3 3,592
Shell share of joint ventures and associates
At January 1 22 222 10 — — — — — — 254 — — 254 At December 31 5 204 9 — — — — — — 218 — — 218
Proved undeveloped reserves 2015 Million barrels North America South Europe Asia Oceania Africa USA Canada America Total
Oil and
NGL Oil and
NGL Oil and
NGL Oil and
NGL Oil and
NGL Oil and
NGL Syntheticcrude oil Bitumen
Oil andNGL
Oil andNGL
Syntheticcrude oil Bitumen
Allproducts
Shell subsidiaries At January 1 229 359 87 157 217 18 490 419 12 1,079 490 419 1,988 At December 31 197 314 90 142 105 2 536 — 12 862 536 — 1,398
Shell share of joint ventures and associates
At January 1 7 154 2 — — — — — — 163 — — 163 At December 31 6 86 3 — — — — — — 95 — — 95
FINANCIAL STATEMENTS AND SUPPLEMENTS SHELL ANNUAL REPORT AND FORM 20-F 2017 183

NATURAL GASShell subsidiaries’ proved reserves of natural gas at the end of the year, their share of the proved reserves of joint ventures and associates at the end of the year, and the changes in suchreserves during the year are set out on pages 186-188. Significant changes in these proved reserves are discussed below. Volumes are not adjusted to standard heat content. Apart fromintegrated projects, volumes of gas are reported on an “as-sold” basis. The price used to calculate future revenue and cash flows from proved gas reserves is the contract price or the12-month average on “as-sold” volumes. Volumes associated with integrated projects are those measured at a designated transfer point between the upstream and downstream portionsof the integrated project. Natural gas volumes are converted into oil equivalent using a factor of 5,800 scf per barrel. PROVED RESERVES 2017-2016Shell subsidiariesEuropeThe sale of minerals in place of 224 thousand million scf was mainly the UK fields: Elgin-Franklin, Everest, J-Area, Lomond and Erskine. AsiaThe net increase of 979 thousand million scf in revisions and reclassifications resulted from field performance updates and development activities in Kazakhstan and Malaysia. Theincrease of 549 thousand million scf in extensions and discoveries was mainly in China and Kazakhstan. OceaniaThe net decrease of 574 thousand million scf in revisions and reclassifications resulted from field performance updates and development activities. There was a decrease of 958thousand million scf in the Surat Basin (Australia) and an increase of 384 thousand million scf from Jansz-lo, Prelude, Gorgon (all Australia) and Maui (New Zealand). The purchasesof minerals in place of 204 thousand million scf were in the Surat Basin. AfricaThe net increase of 287 thousand million scf in revisions and reclassifications resulted from field performance updates and development activities, mainly in Kolo Creek in Nigeria. USAThe net increase of 958 thousand million scf in revisions and reclassifications resulted from field performance updates and development activities in Tioga, East Texas and NorthLouisiana and the Delaware Permian Basin. The increase of 1,163 thousand million scf in extensions and discoveries was mainly in Tioga, the Delaware Permian Basin, Appomattoxand Kaikias. CanadaThe net increase of 412 thousand million scf in revisions and reclassifications resulted from field performance studies and development activities in Groundbirch, Waterton and FoxCreek. The increase of 205 thousand million scf in extensions and discoveries was in Groundbirch and Fox Creek. Shell share of joint ventures and associatesEuropeThe net decrease of 1,027 thousand million scf in revisions and reclassifications was mainly in the Netherlands, due to further reassessment of Groningen compression. AsiaThe net increase of 652 thousand million scf in revisions and reclassifications resulted from field performance studies and development activities in Brunei and Russia.
FINANCIAL STATEMENTS AND SUPPLEMENTS SHELL ANNUAL REPORT AND FORM 20-F 2017 184

PROVED RESERVES 2016-2015Shell subsidiariesAcquisition of BGPurchases of minerals in place included 7,111 thousand million scf additions on acquisition of BG, notably 419 thousand million scf in Europe, 576 thousand million scf in Asia, 3,904thousand million scf in Oceania, 327 thousand million scf in Africa, 151 thousand million scf in the USA and 1,734 thousand million scf in South America. AsiaThe net increase of 554 thousand million scf in revisions and reclassifications was mainly due to technical revisions in Kazakhstan and Thailand, and an increased PSC entitlement sharein Qatar. OceaniaThe purchase of minerals in place of 426 thousand million scf, excluding the increase on acquisition of BG (see above), was from the acquisition of a further interest in the Jansz-Iofield in Australia. USAThe increase of 200 thousand million scf in extensions and discoveries was in shale. Shell share of joint ventures and associatesEuropeThe net decrease of 636 thousand million scf in revisions and reclassifications was mainly due to a reassessment of Groningen compression in the Netherlands. OceaniaThe net decrease of 464 thousand million scf in revisions and reclassifications was due to the change of accounting classification for Woodside Petroleum Limited in Australia.
FINANCIAL STATEMENTS AND SUPPLEMENTS SHELL ANNUAL REPORT AND FORM 20-F 2017 185

Proved developed and undeveloped reserves 2017 Thousand million standard cubic feet North America South Europe Asia Oceania Africa USA Canada America Total
Shell subsidiaries At January 1 3,741 11,073 9,051 2,225 675 844 1,650 29,259 Revisions and reclassifications 197 979 (574 ) 287 958 412 45 2,304 Improved recovery — 66 — — 74 — — 140 Extensions and discoveries 2 549 — — 1,163 205 6 1,925 Purchases of minerals in place — — 204 — 3 43 27 277 Sales of minerals in place (224 ) — — (7 ) (11 ) (6 ) — (248 )Production [A] (616 ) (845 ) (703 ) (423 ) (293 ) (226 ) (227 ) (3,333 )At December 31 3,100 11,822 7,978 2,082 2,569 1,272 1,501 30,324
Shell share of joint ventures and associates At January 1 6,497 4,754 31 — — — — 11,282 Revisions and reclassifications (1,027 ) 652 9 — — — — (366 )Improved recovery — 1 — — — — — 1 Extensions and discoveries — 11 — — — — — 11 Purchases of minerals in place — — — — — — — — Sales of minerals in place — — — — — — — — Production [B] (345 ) (454 ) (21 ) — — — — (820 )At December 31 5,125 4,964 19 — — — — 10,108
Total 8,225 16,786 7,997 2,082 2,569 1,272 1,501 40,432 Reserves attributable to non-controlling interest in Shell subsidiaries at December 31 — 2 — — — — — 2[A] Included 215 thousand million standard cubic feet consumed in operations.[B] Included 41 thousand million standard cubic feet consumed in operations.
Proved developed reserves 2017 Thousand million standard cubic feet North America South
Europe Asia Oceania Africa USA Canada America Total Shell subsidiaries
At January 1 3,437 10,569 3,966 1,618 563 458 1,172 21,783 At December 31 2,978 11,460 5,026 1,493 1,652 859 1,225 24,693
Shell share of joint ventures and associates At January 1 5,240 4,110 31 — — — — 9,381 At December 31 5,055 4,275 19 — — — — 9,349
Proved undeveloped reserves 2017 Thousand million standard cubic feet North America South Europe Asia Oceania Africa USA Canada America Total
Shell subsidiaries At January 1 304 504 5,085 607 112 386 478 7,476 At December 31 122 362 2,952 589 917 413 276 5,631
Shell share of joint ventures and associates At January 1 1,257 644 — — — — — 1,901 At December 31 70 689 — — — — — 759
FINANCIAL STATEMENTS AND SUPPLEMENTS SHELL ANNUAL REPORT AND FORM 20-F 2017 186

Proved developed and undeveloped reserves 2016 Thousand million standard cubic feet North America South Europe Asia Oceania Africa USA Canada America Total
Shell subsidiaries At January 1 3,848 10,692 5,411 2,236 754 955 43 23,939 Revisions and reclassifications 92 554 (177 ) 51 (95 ) 41 66 532 Improved recovery — 10 — — — — — 10 Extensions and discoveries 4 162 — 2 200 180 3 551 Purchases of minerals in place 419 576 4,330 327 151 — 1,734 7,537 Sales of minerals in place (7 ) — — — (7 ) (63 ) — (77 )Production [A] (615 ) (921 ) (513 ) (391 ) (328 ) (269 ) (196 ) (3,233 )At December 31 3,741 11,073 9,051 2,225 675 844 1,650 29,259
Shell share of joint ventures and associates At January 1 7,538 5,363 535 — — — — 13,436 Revisions and reclassifications (636 ) (197 ) (464 ) — — — — (1,297 )Improved recovery — — — — — — — — Extensions and discoveries — 35 — — — — — 35 Purchases of minerals in place — — — — — — — — Sales of minerals in place — — — — — — — — Production [B] (405 ) (447 ) (40 ) — — — — (892 )At December 31 6,497 4,754 31 — — — — 11,282
Total 10,238 15,827 9,082 2,225 675 844 1,650 40,541 Reserves attributable to non-controlling interest in Shell subsidiaries at December 31 — 3 — 2 — — — 5[A] Included 197 thousand million standard cubic feet consumed in operations.[B] Included 44 thousand million standard cubic feet consumed in operations.
Proved developed reserves 2016 Thousand million standard cubic feet North America South Europe Asia Oceania Africa USA Canada America Total
Shell subsidiaries At January 1 3,471 9,920 1,234 1,386 572 636 37 17,256 At December 31 3,437 10,569 3,966 1,618 563 458 1,172 21,783
Shell share of joint ventures and associates At January 1 5,933 4,301 420 — — — — 10,654 At December 31 5,240 4,110 31 — — — — 9,381
Proved undeveloped reserves 2016 Thousand million standard cubic feet North America South Europe Asia Oceania Africa USA Canada America Total
Shell subsidiaries At January 1 377 772 4,177 850 182 319 6 6,683 At December 31 304 504 5,085 607 112 386 478 7,476
Shell share of joint ventures and associates At January 1 1,605 1,062 115 — — — — 2,782 At December 31 1,257 644 — — — — — 1,901
FINANCIAL STATEMENTS AND SUPPLEMENTS SHELL ANNUAL REPORT AND FORM 20-F 2017 187

Proved developed and undeveloped reserves 2015 Thousand million standard cubic feet North America South Europe Asia Oceania Africa USA Canada America Total
Shell subsidiaries At January 1 4,430 10,071 5,575 2,621 1,561 1,611 48 25,917 Revisions and reclassifications (61 ) 1,385 41 5 (587 ) (581 ) 11 213 Improved recovery — — — — 1 — — 1 Extensions and discoveries — — — 4 59 175 — 238 Purchases of minerals in place — — — — — 2 — 2 Sales of minerals in place (19 ) — — (115 ) (5 ) — — (139 )Production [A] (502 ) (764 ) (205 ) (279 ) (275 ) (252 ) (16 ) (2,293 )At December 31 3,848 10,692 5,411 2,236 754 955 43 23,939
Shell share of joint ventures and associates At January 1 7,866 6,030 503 — — — — 14,399 Revisions and reclassifications 92 (214 ) 23 — — — — (99 )Improved recovery 6 — — — — — — 6 Extensions and discoveries 11 — — — — — — 11 Purchases of minerals in place — — 84 — — — — 84 Sales of minerals in place — — — — — — — — Production [B] (437 ) (453 ) (75 ) — — — — (965 )At December 31 7,538 5,363 535 — — — — 13,436
Total 11,386 16,055 5,946 2,236 754 955 43 37,375 Reserves attributable to non-controlling interest in Shell subsidiaries at December 31 — 2 — 3 — — — 5[A] Included 145 thousand million standard cubic feet consumed in operations.[B] Included 55 thousand million standard cubic feet consumed in operations.
Proved developed reserves 2015 Thousand million standard cubic feet North America South Europe Asia Oceania Africa USA Canada America Total
Shell subsidiaries At January 1 3,774 9,114 1,398 1,162 1,275 939 42 17,704 At December 31 3,471 9,920 1,234 1,386 572 636 37 17,256
Shell share of joint ventures and associates At January 1 6,386 4,501 433 — — — — 11,320 At December 31 5,933 4,301 420 — — — — 10,654
Proved undeveloped reserves 2015 Thousand million standard cubic feet North America South
Europe Asia Oceania Africa USA Canada America Total Shell subsidiaries
At January 1 656 957 4,177 1,459 286 672 6 8,213 At December 31 377 772 4,177 850 182 319 6 6,683
Shell share of joint ventures and associates At January 1 1,480 1,529 70 — — — — 3,079 At December 31 1,605 1,062 115 — — — — 2,782
FINANCIAL STATEMENTS AND SUPPLEMENTS SHELL ANNUAL REPORT AND FORM 20-F 2017 188

STANDARDISED MEASURE OF DISCOUNTED FUTURE CASH FLOWSThe SEC Form 20-F requires the disclosure of a standardised measure of discounted future net cash flows, relating to proved reserves quantities and based on a 12-month unweightedarithmetic average sales price, calculated on a first-day-of-the-month basis, with cost factors based on those at the end of each year, currently enacted tax rates and a 10% annualdiscount factor. In our view, the information so calculated does not provide a reliable measure of future cash flows from proved reserves, nor does it permit a realistic comparison to bemade of one entity with another because the assumptions used cannot reflect the varying circumstances within each entity. In addition, a substantial but unknown proportion of futurereal cash flows from oil and gas production activities is expected to derive from reserves which have already been discovered, but which cannot yet be regarded as proved. STANDARDISED MEASURE OF DISCOUNTED FUTURE CASH FLOWS RELATING TO PROVED RESERVES AT DECEMBER 31
2017 – Shell subsidiaries $ million North America South Europe Asia Oceania Africa USA Canada America Total
Future cash inflows 34,902 94,535 51,052 29,276 49,389 32,576 50,620 342,350 Future production costs 15,672 30,894 18,264 11,496 29,505 20,242 30,924 156,997 Future development costs 7,852 12,558 14,062 4,920 14,200 5,115 6,210 64,917 Future tax expenses 5,747 18,048 1,169 9,064 2,177 2,509 4,888 43,602 Future net cash flows 5,631 33,035 17,557 3,796 3,507 4,710 8,598 76,834 Effect of discounting cash flows at 10% 825 15,115 5,773 (9 ) (796 ) 3,077 2,325 26,310 Standardised measure of discounted future net cash flows 4,806 17,920 11,784 3,805 4,303 1,633 6,273 50,524 Non-controlling interest included — 1 — — — 870 — 871
2017 – Shell share of joint ventures and associates $ million North America South Europe Asia Oceania Africa USA Canada America Total
Future cash inflows 22,725 37,954 69 — — — — 60,748 Future production costs 17,442 17,592 54 — — — — 35,088 Future development costs 1,051 7,605 64 — — — — 8,720 Future tax expenses 1,803 5,172 — — — — — 6,975 Future net cash flows 2,429 7,585 (49 ) — — — — 9,965 Effect of discounting cash flows at 10% 1,008 1,862 (14 ) — — — — 2,856 Standardised measure of discounted future net cash flows 1,421 5,723 (35 ) [A] — — — — 7,109[A] While proved reserves are economically producible at the 2017 yearly average price, the standardised measure of discounted future net cash flows was negative for those proved reserves at December 31, 2017, due to addition of overhead, tax andabandonment costs and ongoing commitments post production of proved reserves.
2016 – Shell subsidiaries $ million North America South Europe Asia Oceania Africa USA Canada America Total
Future cash inflows 33,837 71,019 49,872 26,422 20,239 71,652 41,999 315,040 Future production costs 17,276 25,793 22,842 12,302 17,114 54,966 21,780 172,073 Future development costs 11,630 12,481 16,795 5,533 7,894 11,948 15,053 81,334 Future tax expenses 824 9,059 1,734 5,427 561 1,327 3,700 22,632 Future net cash flows 4,107 23,686 8,501 3,160 (5,330 ) 3,411 1,466 39,001 Effect of discounting cash flows at 10% 351 10,663 2,889 (231 ) (3,423 ) 2,129 (1,095 ) 11,283 Standardised measure of discounted future net cash flows 3,756 13,023 5,612 3,391 (1,907 ) [A] 1,282 2,561 27,718 Non-controlling interest included — — — (65 ) [A] — — — (65 )[A] While proved reserves are economically producible at the 2016 yearly average price, the standardised measure of discounted future net cash flows was negative for those proved reserves at December 31, 2016, due to addition of overhead, tax andabandonment costs and ongoing commitments post production of proved reserves.
FINANCIAL STATEMENTS AND SUPPLEMENTS SHELL ANNUAL REPORT AND FORM 20-F 2017 189

2016 – Shell share of joint ventures and associates $ million North America South Europe Asia Oceania Africa USA Canada America Total
Future cash inflows 26,224 28,000 88 — — — — 54,312 Future production costs 18,163 14,060 65 — — — — 32,288 Future development costs 1,367 7,588 41 — — — — 8,996 Future tax expenses 2,526 3,280 — — — — — 5,806 Future net cash flows 4,168 3,072 (18 ) — — — — 7,222 Effect of discounting cash flows at 10% 2,363 692 (9 ) — — — — 3,046 Standardised measure of discounted future net cash flows 1,805 2,380 (9 ) — — — — 4,176
2015 – Shell subsidiaries $ million North America South Europe Asia Oceania Africa USA Canada America Total
Future cash inflows 46,910 83,549 36,644 35,856 28,755 81,957 2,264 315,935 Future production costs 21,526 25,494 11,690 17,470 21,480 60,449 1,728 159,837 Future development costs 12,003 12,730 12,987 6,344 10,930 17,983 898 73,875 Future tax expenses 7,660 15,926 1,407 6,357 864 1,099 86 33,399 Future net cash flows 5,721 29,399 10,560 5,685 (4,519 ) 2,426 (448 ) 48,824 Effect of discounting cash flows at 10% 1,870 14,181 5,894 1,372 (2,394 ) 2,241 (221 ) 22,943 Standardised measure of discounted future net cash flows 3,851 15,218 4,666 4,313 (2,125 ) [A] 185 (227 ) [A] 25,881 Non-controlling interest included — (1 ) — (149 ) [A] — — — (150 )[A] While proved reserves are economically producible at the 2015 yearly average price, the standardised measure of discounted future net cash flows was negative for those proved reserves at December 31, 2015, due to addition of overhead, tax andabandonment costs.
2015 – Shell share of joint ventures and associates $ million North America South Europe Asia Oceania Africa USA Canada America Total
Future cash inflows 45,488 43,271 5,261 — — — — 94,020 Future production costs 27,279 19,566 1,055 — — — — 47,900 Future development costs 1,513 7,449 492 — — — — 9,454 Future tax expenses 4,121 6,384 1,121 — — — — 11,626 Future net cash flows 12,575 9,872 2,593 — — — — 25,040 Effect of discounting cash flows at 10% 9,597 3,393 1,087 — — — — 14,077 Standardised measure of discounted future net cash flows 2,978 6,479 1,506 — — — — 10,963
FINANCIAL STATEMENTS AND SUPPLEMENTS SHELL ANNUAL REPORT AND FORM 20-F 2017 190

CHANGE IN STANDARDISED MEASURE OF DISCOUNTED FUTURE NET CASH FLOWS RELATING TO PROVED RESERVES
2017 $ million
Shell
subsidiaries
Shell shareof joint ventures
and associates Total At January 1 27,718 4,176 31,894 Net changes in prices and production costs 34,190 3,952 38,142 Revisions of previous reserves estimates 13,769 1,931 15,700 Extensions, discoveries and improved recovery 3,901 79 3,980 Purchases and sales of minerals in place (2,068 ) — (2,068 )Development cost related to future production (4,823 ) 461 (4,362 )Sales and transfers of oil and gas, net of production costs (27,544 ) (3,652 ) (31,196 )Development cost incurred during the year 14,262 536 14,798 Accretion of discount 3,844 630 4,474 Net change in income tax (12,725 ) (1,004 ) (13,729 )At December 31 50,524 7,109 57,633
2016 $ million
Shell
subsidiaries
Shell shareof joint ventures
and associates Total At January 1 25,881 10,963 36,844 Net changes in prices and production costs (21,506 ) (6,942 ) (28,448 )Revisions of previous reserves estimates 6,175 (1,328 ) 4,847 Extensions, discoveries and improved recovery 1,268 (17 ) 1,251 Purchases and sales of minerals in place 24,279 — 24,279 Development cost related to future production (15,327 ) (150 ) (15,477 )Sales and transfers of oil and gas, net of production costs (19,657 ) (3,087 ) (22,744 )Development cost incurred during the year 15,403 854 16,257 Accretion of discount 4,376 1,363 5,739 Net change in income tax 6,826 2,520 9,346 At December 31 27,718 4,176 31,894
2015 $ million
Shell
subsidiaries
Shell shareof joint ventures
and associates Total At January 1 78,627 23,344 101,971 Net changes in prices and production costs (123,966 ) (19,098 ) (143,064 )Revisions of previous reserves estimates 7,672 (1,255 ) 6,417 Extensions, discoveries and improved recovery 297 7 304 Purchases and sales of minerals in place (1,706 ) 218 (1,488 )Development cost related to future production 4,329 927 5,256 Sales and transfers of oil and gas, net of production costs (18,930 ) (4,383 ) (23,313 )Development cost incurred during the year 17,818 1,463 19,281 Accretion of discount 13,837 3,188 17,025 Net change in income tax 47,903 6,552 54,455 At December 31 25,881 10,963 36,844
FINANCIAL STATEMENTS AND SUPPLEMENTS SHELL ANNUAL REPORT AND FORM 20-F 2017 191

OIL AND GAS EXPLORATION AND PRODUCTION ACTIVITIES CAPITALISED COSTSThe aggregate amount of property, plant and equipment and intangible assets, excluding goodwill, relating to oil and gas exploration and production activities, and the aggregateamount of the related depreciation, depletion and amortisation at December 31, are shown in the tables below. SHELL SUBSIDIARIES
$ million 2017 2016
Cost Proved properties [A] 276,002 286,509 Unproved properties 23,707 25,582 Support equipment and facilities 6,112 6,418
305,821 318,509 Depreciation, depletion and amortisation
Proved properties [A] 132,823 129,243 Unproved properties 5,193 6,569 Support equipment and facilities 3,436 3,245
141,452 139,057 Net capitalised costs 164,369 179,452[A] Includes capitalised asset decommissioning and restoration costs and related depreciation. SHELL SHARE OF JOINT VENTURES AND ASSOCIATES
$ million 2017 2016
Cost Proved properties [A] 42,370 40,773 Unproved properties 2,657 2,992 Support equipment and facilities 4,452 4,383
49,479 48,148 Depreciation, depletion and amortisation
Proved properties [A] 31,844 28,712 Unproved properties 20 20 Support equipment and facilities 3,142 3,054
35,006 31,786 Net capitalised costs 14,473 16,362[A] Includes capitalised asset decommissioning and restoration costs and related depreciation. OIL AND GAS EXPLORATION AND PRODUCTION ACTIVITIES COSTS INCURREDCosts incurred during the year in oil and gas property acquisition, exploration and development activities, whether capitalised or charged to income currently, are shown in the tablesbelow. Finance leases are excluded. Development costs include capitalised asset decommissioning and restoration costs (including increases or decreases arising from changes to costestimates or to the discount rate applied to the obligations) and exclude costs of acquiring support equipment and facilities, but include depreciation thereon. SHELL SUBSIDIARIES
2017 $ million North America South Europe Asia Oceania Africa USA Other[A] America Total
Acquisition of properties Proved — — — 10 — 2,246 19 2,275 Unproved — 12 — 18 141 320 57 548
Exploration 329 135 38 138 1,354 235 600 2,829 Development 776 840 2,493 371 4,123 722 1,671 10,996[A] Comprises Canada, Honduras and Mexico.
FINANCIAL STATEMENTS AND SUPPLEMENTS SHELL ANNUAL REPORT AND FORM 20-F 2017 192

2016 [A] $ million North America South Europe Asia Oceania Africa USA Other[B] America Total
Acquisition of properties Proved 1,978 4,709 6,917 926 132 — 28,803 43,465 Unproved 280 — 2 357 87 20 102 848
Exploration 338 400 34 247 1,043 415 574 3,051 Development 2,289 1,982 3,352 1,087 3,497 701 1,788 14,696[A] Including $44,127 million of related costs incurred on acquisition of BG. The comparatives have been amended to conform with the current year presentation.[B] Comprises Canada, Honduras and Mexico.
2015 $ million North America South Europe Asia Oceania Africa USA Other[A] America Total
Acquisition of properties Proved 2 3 — — 2 86 — 93 Unproved 1 1 — — 135 30 10 177
Exploration 360 822 198 376 3,433 554 542 6,285 Development 3,777 2,703 3,760 2,829 5,720 1,747 80 20,616[A] Comprises Canada and Mexico. SHELL SHARE OF JOINT VENTURES AND ASSOCIATESJoint ventures and associates did not incur costs in the acquisition of oil and gas properties in 2017, 2016 or 2015.
2017 $ million North America South Europe Asia Oceania Africa USA Canada America Total
Exploration 3 82 8 — — — — 93 Development (22 ) [A] 660 58 — — — — 696[A] Includes a revision of decommissioning and restoration provisions.
2016 $ million North America South Europe Asia Oceania Africa USA Canada America Total
Exploration 33 57 101 — — — — 191 Development 99 2,173 273 — — — — 2,545
2015 $ million North America South Europe Asia Oceania Africa USA Canada America Total
Exploration 40 132 125 — — — — 297 Development 254 2,434 854 — — — — 3,542
FINANCIAL STATEMENTS AND SUPPLEMENTS SHELL ANNUAL REPORT AND FORM 20-F 2017 193

OIL AND GAS EXPLORATION AND PRODUCTION ACTIVITIES EARNINGSThe results of operations for oil and gas producing activities are shown in the tables below. Taxes other than income tax include cash-paid royalties to governments outside NorthAmerica. SHELL SUBSIDIARIES
2017 $ million North America South Europe Asia Oceania Africa USA Other[A] America Total
Revenue Third parties 1,193 2,708 1,414 1,872 1,080 339 689 9,295 Sales between businesses 7,120 9,061 2,400 3,218 5,119 2,938 5,245 35,101
Total 8,313 11,769 3,814 5,090 6,199 3,277 5,934 44,396 Production costs excluding taxes 2,509 2,469 1,110 1,365 2,558 1,571 1,218 12,800 Taxes other than income tax 89 556 119 287 98 1 1,691 2,841 Exploration 243 245 42 129 868 142 276 1,945 Depreciation, depletion and amortisation 2,560 2,892 1,777 1,863 3,410 3,886 3,374 19,762 Other costs/(income) (157 ) 1,073 (382 ) 145 114 1,050 469 2,312 Earnings before taxation 3,069 4,534 1,148 1,301 (849 ) (3,373 ) (1,094 ) 4,736 Taxation charge/(credit) 1,689 2,969 (202 ) (361 ) 363 (1,486 ) (294 ) 2,678 Earnings after taxation 1,380 1,565 1,350 1,662 (1,212 ) (1,887 ) (800 ) 2,058[A] Comprises Canada, Honduras and Mexico.
2016 $ million North America South Europe Asia Oceania Africa USA Other[A] America Total
Revenue Third parties 969 2,656 1,069 1,380 643 41 476 7,234 Sales between businesses 5,816 7,284 1,438 3,138 3,960 3,789 2,980 28,405
Total 6,785 9,940 2,507 4,518 4,603 3,830 3,456 35,639 Production costs excluding taxes 2,565 2,212 805 1,468 3,348 2,230 865 13,493 Taxes other than income tax 66 421 83 194 70 — 790 1,624 Exploration 250 408 70 356 438 291 295 2,108 Depreciation, depletion and amortisation 3,270 3,304 1,130 2,018 4,372 1,953 2,881 18,928 Other costs/(income) 1,925 1,606 (700 ) 356 40 680 (173 ) 3,734 Earnings before taxation (1,291 ) 1,989 1,119 126 (3,665 ) (1,324 ) (1,202 ) (4,248 )Taxation (credit)/charge (311 ) 1,918 559 431 (1,351 ) (377 ) (1,032 ) (163 )Earnings after taxation (980 ) 71 560 (305 ) (2,314 ) (947 ) (170 ) (4,085 )[A] Comprises Canada, Honduras and Mexico.
2015 $ million North America South Europe Asia Oceania Africa USA Other[A] America Total Revenue
Third parties 1,866 2,577 1,202 1,174 567 53 85 7,524 Sales between businesses 5,707 8,040 418 3,737 4,941 4,045 535 27,423
Total 7,573 10,617 1,620 4,911 5,508 4,098 620 34,947 Production costs excluding taxes 2,490 2,163 541 1,570 3,039 2,612 343 12,758 Taxes other than income tax 128 435 115 347 79 — 63 1,167 Exploration 261 1,255 195 161 3,336 164 347 5,719 Depreciation, depletion and amortisation 2,769 3,047 478 1,733 6,259 6,570 687 21,543 Other costs/(income) 779 1,465 226 (1,441 ) 668 2,172 232 4,101 Earnings before taxation 1,146 2,252 65 2,541 (7,873 ) (7,420 ) (1,052 ) (10,341 )Taxation charge/(credit) 418 2,516 429 866 (2,907 ) (1,815 ) 278 (215 )Earnings after taxation 728 (264 ) (364 ) 1,675 (4,966 ) (5,605 ) (1,330 ) (10,126 )[A] Comprises Canada and Mexico.
FINANCIAL STATEMENTS AND SUPPLEMENTS SHELL ANNUAL REPORT AND FORM 20-F 2017 194

SHELL SHARE OF JOINT VENTURES AND ASSOCIATESOceania included Shell’s 14% share of Woodside from January 2015 to April 2016, when its accounting classification was changed from an associate to an investment in securities.Woodside is a publicly-listed company on the Australian Securities Exchange for which we have limited access to data; accordingly, the numbers are estimated.
2017 $ million North America South Europe Asia Oceania Africa USA Canada America Total Third-party revenue 1,646 4,503 58 — — — — 6,207 Total 1,646 4,503 58 — — — — 6,207 Production costs excluding taxes 337 729 93 — — — — 1,159 Taxes other than income tax 631 705 4 — — — — 1,340 Exploration 7 57 4 — — — — 68 Depreciation, depletion and amortisation 188 1,654 40 — — — — 1,882 Other costs/(income) (83 ) 511 (60 ) — — — — 368 Earnings before taxation 566 847 (23 ) — — — — 1,390 Taxation charge 173 197 — — — — — 370 Earnings after taxation 393 650 (23 ) — — — — 1,020
2016 $ million North America South Europe Asia Oceania Africa USA Canada America TotalThird-party revenue 1,705 3,708 197 — — — — 5,610Total 1,705 3,708 197 — — — — 5,610Production costs excluding taxes 383 [A] 705 123 — — — — 1,211Taxes other than income tax 706 456 7 — — — — 1,169Exploration 36 25 27 — — — — 88Depreciation, depletion and amortisation 208 1,663 237 — — — — 2,108Other costs/(income) (11) [A] 401 (28) — — — — 362Earnings before taxation 383 458 (169) — — — — 672Taxation charge 91 23 8 — — — — 122Earnings after taxation 292 435 (177) — — — — 550[A] As revised.
2015 $ million North America South Europe Asia Oceania Africa USA Canada America TotalThird-party revenue 2,764 5,177 632 — — — — 8,573Total 2,764 5,177 632 — — — — 8,573Production costs excluding taxes 414 [A] 745 215 — — — — 1,374Taxes other than income tax 1,253 877 31 — — — — 2,161Exploration 21 20 42 — — — — 83Depreciation, depletion and amortisation 196 1,463 1,114 — — — — 2,773Other costs/(income) 189 [A] 580 11 — — — — 780Earnings before taxation 691 1,492 (781) — — — — 1,402Taxation charge 237 242 19 — — — — 498Earnings after taxation 454 1,250 (800) — — — — 904[A] As revised.
FINANCIAL STATEMENTS AND SUPPLEMENTS SHELL ANNUAL REPORT AND FORM 20-F 2017 195

ACREAGE AND WELLSThe tables below reflect acreage and wells of Shell subsidiaries, joint ventures and associates. The term “gross” refers to the total activity in which Shell subsidiaries, joint ventures andassociates have an interest. The term “net” refers to the sum of the fractional interests owned by Shell subsidiaries plus the Shell share of joint ventures and associates’ fractionalinterests. Net data below are rounded to the nearest whole number.
Oil and gas acreage (at December 31) Thousand acres 2017 2016 2015
Developed Undeveloped Developed Undeveloped Developed
Undeveloped Gross Net Gross Net Gross Net Gross Net Gross Net Gross Net
Europe [A] 6,463 2,071 14,119 6,187 6,556 2,197 18,216 10,241 7,152 2,194 14,623 7,732 Asia 25,975 9,139 35,305 18,730 26,003 9,199 58,463 36,298 25,581 9,181 36,658 22,995 Oceania 3,296 1,255 22,406 13,985 1,939 822 37,876 24,109 2,041 530 51,740 16,975 Africa 4,663 1,938 33,453 20,811 5,083 2,315 41,517 29,152 4,650 2,071 40,435 27,058 North America – USA 1,936 1,134 2,718 1,937 2,002 1,197 4,151 2,577 1,659 1,158 5,033 4,262 North America – Canada 953 651 16,714 15,005 976 670 26,149 19,402 1,227 745 32,706 25,716 South America 1,302 606 9,338 6,196 1,315 547 17,759 14,643 100 52 7,851 3,621 Total 44,588 16,794 134,053 82,851 43,874 16,947 204,131 136,422 42,410 15,931 189,046 108,359[A] Includes Greenland.
Number of productive wells [A] (at December 31) 2017 2016 2015 Oil Gas Oil Gas Oil Gas Gross Net Gross Net Gross Net Gross Net Gross Net Gross Net
Europe 1,156 303 1,235 392 1,215 321 1,232 403 1,272 344 1,229 392 Asia 9,410 3,132 711 283 9,261 3,141 656 263 8,271 2,853 334 190 Oceania — — 3,499 1,926 — — 3,257 1,734 — — 624 234 Africa 380 155 180 122 662 289 191 127 821 334 129 86 North America – USA 15,408 7,817 1,636 717 15,532 7,892 3,046 2,136 15,331 7,893 2,522 2,403 North America – Canada — — 892 794 283 283 941 781 286 286 1,209 1,059 South America 111 47 55 32 73 28 50 26 25 15 7 2 Total 26,465 11,454 8,208 4,266 27,026 11,954 9,373 5,470 26,006 11,725 6,054 4,366 [A] The number of productive wells with multiple completions (more than one formation producing into the same well bore) at December 31, 2017, was 1,946 gross (761 net); 2016: 1,721 gross, corrected from 1,754 (686 net, corrected from 691); 2015:1,778gross, corrected from 1,811 (755 net, corrected from 760).
FINANCIAL STATEMENTS AND SUPPLEMENTS SHELL ANNUAL REPORT AND FORM 20-F 2017 196

Number of net productive wells and dry holes drilled 2017 2016 2015 Productive Dry Productive Dry Productive Dry Exploratory [A]
Europe — 1 — — 1 2 Asia 3 5 2 4 — 11 Oceania 2 — — — — 3 Africa 2 3 4 2 5 — North America – USA 9 6 40 2 35 8 North America – Canada 30 5 — — 73 5 South America 6 — — — — 1
Total 52 20 46 8 114 30 Development
Europe 5 — 10 1 10 — Asia 312 4 265 — 252 2 Oceania 63 — 184 — 2 — Africa 24 3 15 — 24 — North America – USA 237 — 137 — 433 — North America – Canada 56 1 50 — 20 2 South America 1 — 3 — 3 1
Total 698 8 664 1 744 5[A] Productive wells are wells with proved reserves allocated. Exploratory wells in the process of drilling are excluded and presented separately below.
Number of wells in the process of exploratory drilling [A] 2017
At January 1
Wells in the process ofdrilling at January 1 and
allocated provedreserves during the year
Wells in the processof drilling at January 1
and determined asdry during the year
New wells in the processof drilling at December 31 At December 31
Gross Net Gross Net Gross Net Gross Net Gross Net Europe 25 [B] 12 (4 ) (1 ) (2 ) (1 ) 3 1 22 11 Asia 96 [C] 38 [C] (24 ) (13 ) (15 ) (5 ) 14 5 71 25 Oceania 198 65 (4 ) (2 ) (148 ) (48 ) 4 2 50 17 Africa 45 [D] 27 (3 ) (2 ) (6 ) (3 ) 6 5 42 27 North America – USA 178 126 (86 ) (47 ) (9 ) (8 ) 131 67 214 138 North America – Canada 39 [E] 39 [E] (29 ) (29 ) (6 ) (6 ) 1 1 5 5 South America 51 28 [F] (19 ) (14 ) (4 ) (2 ) 18 8 46 20 Total 632 335 (169 ) (108 ) (190 ) (73 ) 177 89 450 243[A] Wells in the process of drilling includes exploratory wells pending further evaluation.[B] Corrected from 26.[C] Corrected from 94 gross (37 net).[D] Corrected from 46.[E] Corrected from 11 gross (11 net).[F] Corrected from 27.
FINANCIAL STATEMENTS AND SUPPLEMENTS SHELL ANNUAL REPORT AND FORM 20-F 2017 197

Number of wells in the process of development drilling 2017 At January 1 At December 31 Gross Net Gross Net Europe 17 6 7 2 Asia 35 11 75 29 Oceania 5 1 1 — Africa 8 3 — — North America – USA 14 11 144 97 North America – Canada 3 2 21 18 South America 9 2 12 3 Total 91 36 260 149 In addition to the present activities mentioned above, the following recovery methods are operational in the following countries: water flooding (Brazil (including water alternatinggas), Brunei, Denmark, Malaysia, Nigeria, Norway, Oman, Russia, the UK and the USA); gas injection (Brunei, Kazakhstan, Malaysia, Nigeria and Oman); steam injection (Canada, theNetherlands, Oman and the USA), and polymer flooding (Oman).
FINANCIAL STATEMENTS AND SUPPLEMENTS SHELL ANNUAL REPORT AND FORM 20-F 2017 198

Parent Company Financial Statements
The Parent Company Financial Statements have not been audited in accordance with the standards of the Public Company Accounting Oversight Board (United States). 200 Statement of Income200 Statement of Comprehensive Income200 Balance Sheet201 Statement of Changes in Equity201 Statement of Cash Flows202 Notes to the Parent Company Financial Statements202 Note 1 Basis of preparation202 Note 2 Significant accounting policies203 Note 3 Interest and other income/expense203 Note 4 Investments in subsidiaries203 Note 5 Accounts payable and accrued liabilities203 Note 6 Taxation204 Note 7 Financial instruments204 Note 8 Share capital206 Note 9 Other reserves206 Note 10 Dividends206 Note 11 Legal proceedings and other contingencies206 Note 12 Directors and Senior Management206 Note 13 Related parties207 Note 14 Auditor’s remuneration207 Note 15 Acquisition of BG Group plc
FINANCIAL STATEMENTS AND SUPPLEMENTS SHELL ANNUAL REPORT AND FORM 20-F 2017 199

Statement of Income $ million Notes 2017 2016 Dividend income 10,958 14,132 Interest and other income 3 49 612 Administrative expenses (53) (488) [A] Interest and other expense 3 (26) (25) Income before taxation 10,928 14,231 Taxation (credit)/charge 6 (23) 26 Income for the period 10,951 14,205 [A] Includes BG acquisition costs
Statement of Comprehensive Income $ million 2017 2016 Income for the period 10,951 14,205 Comprehensive income for the period 10,951 14,205
Balance Sheet $ million Notes Dec 31, 2017 Dec 31, 2016 Assets Non-current assets Investments in subsidiaries 4 256,882 256,583 Deferred tax 6 598 352 257,480 256,935 Current assets Amounts due from subsidiaries 13 5,022 4,680 Cash and cash equivalents 3 2 5,025 4,682 Total assets 262,505 261,617 Liabilities Non-current liabilities Accounts payable and accrued liabilities 5 332 224 332 224 Current liabilities Accounts payable and accrued liabilities 5 4,333 4,049 4,333 4,049 Total liabilities 4,665 4,273 Equity Share capital 8 696 683 Other reserves 9 235,366 235,573 Retained earnings 21,778 21,088 Total equity 257,840 257,344 Total liabilities and equity 262,505 261,617 Signed on behalf of the Board /s/ Jessica Uhl Jessica UhlChief Financial OfficerMarch 14, 2018
FINANCIAL STATEMENTS AND SUPPLEMENTS SHELL ANNUAL REPORT AND FORM 20-F 2017 200

Statement of Changes in Equity $ million
Notes Share
capital Other
reserves Retainedearnings
Totalequity
At January 1, 2017 683 235,573 21,088 257,344 Comprehensive income for the period — — 10,951 10,951 Dividends paid 10 — — (15,628 ) (15,628 )Scrip dividends 10 13 (13 ) 4,751 4,751 Share-based compensation 9 — (194 ) 616 422 At December 31, 2017 696 235,366 21,778 257,840 At January 1, 2016 546 201,674 16,045 218,265 Comprehensive income for the period — — 14,205 14,205 Dividends paid 10 — — (14,959 ) (14,959 )Scrip dividends 10 17 (17 ) 5,282 5,282 Shares issued 8 120 33,930 — 34,050 Share-based compensation 9 — (14 ) 515 501 At December 31, 2016 683 235,573 21,088 257,344
Statement of Cash Flows $ million Notes 2017 2016
Income for the period 10,951 14,205 Adjustment for:
Dividend income (10,958 ) (14,132 )Tax (23 ) 26 Interest income (24 ) (17 )Interest and other expense 26 25 Share-based compensation 25 21 (Increase)/decrease in working capital (333 ) 13,868
Cash flow from operating activities (336 ) 13,996 Acquisition of BG Group plc 15 — (19,036 )Dividends received 10,958 14,132 Interest received 24 17 Share-based compensation 258 130 Cash flow from investing activities 11,240 (4,757 )Cash dividends paid 10 (10,877 ) (9,677 )Interest and other expense paid (26 ) (25 )Cash flow from financing activities (10,903 ) (9,702 )Increase/(decrease) in cash and cash equivalents 1 (463 )Cash and cash equivalents at January 1 2 465 Cash and cash equivalents at December 31 3 2
FINANCIAL STATEMENTS AND SUPPLEMENTS SHELL ANNUAL REPORT AND FORM 20-F 2017 201

Notes to the Parent Company Financial Statements
1 BASIS OF PREPARATIONThe Financial Statements of Royal Dutch Shell plc (the Company) have been prepared in accordance with the provisions of the Companies Act 2006 (the Act) and with InternationalFinancial Reporting Standards (IFRS) as adopted by the European Union. As applied to the Company, there are no material differences from IFRS as issued by the InternationalAccounting Standards Board (IASB); therefore, the Financial Statements have been prepared in accordance with IFRS as issued by the IASB. As described in the accounting policies in Note 2, the Financial Statements have been prepared under the historical cost convention except for certain items measured at fair value.Those accounting policies have been applied consistently in all periods presented. The Financial Statements were approved and authorised for issue by the Board of Directors on March 14, 2018. The preparation of financial statements in conformity with IFRS requires the use of certain accounting estimates. It also requires management to exercise its judgement in the process ofapplying the Company’s accounting policies. Actual results may differ from those estimates. The financial results of the Company are included in the Consolidated Financial Statements on pages 137-178. The financial results of the Company incorporate the results of theDividend Access Trust (the Trust), the financial statements of which are presented on pages 213-216. The Company’s principal activity is being the parent company for Shell, as described in Note 1 to the Consolidated Financial Statements. 2 SIGNIFICANT ACCOUNTING POLICIESThe Company’s accounting policies follow those of Shell as set out in Note 2 to the Consolidated Financial Statements. The following are Company-specific policies and changes toIFRS not yet adopted. PRESENTATION AND FUNCTIONAL CURRENCYThe Company’s presentation and functional currency is US dollars (dollars). INVESTMENTSInvestments in subsidiaries are stated at cost, net of any impairment. For the purposes of determining whether impairment of investments in subsidiaries has occurred, and the extent ofany impairment loss or its reversal, the key assumptions management uses in estimating risk-adjusted future cash flows for value-in-use measures include future oil and gas prices,expected production volumes and refining margins appropriate to the local circumstances and environment. These assumptions and the judgements of management that are based onthem are subject to change as new information becomes available. Cash flow estimates are risk-adjusted to reflect local conditions as appropriate and discounted at a rate based onShell's marginal cost of debt. Changes in economic conditions can also affect the rate used to discount future cash flow estimates. Future price assumptions are presented in Note 8 tothe Consolidated Financial Statements. The original cost of the Company’s investment in Royal Dutch Petroleum Company (Royal Dutch) was based on the fair value of the shares transferred to the Company by the formershareholders of Royal Dutch in exchange for A shares in the Company during the public exchange offer in 2005. The original cost of the Company’s investment in The “Shell”Transport and Trading Company, p.l.c., now The Shell Transport and Trading Company Limited (Shell Transport), was the fair value of the shares held by the former shareholders ofThe “Shell” Transport and Trading Company, p.l.c. transferred in consideration for the issuance of B shares as part of the Scheme of Arrangement in 2005. The Company’sinvestments in Royal Dutch and Shell Transport now represent an investment in Shell Petroleum N.V. (Shell Petroleum); this change had no impact on the cost of investments insubsidiaries. DIVIDEND INCOMEDividends are recognised on a paid basis unless the dividend has been confirmed by a general meeting of Shell Petroleum, in which case income is recognised on the date at whichreceipt is deemed virtually certain. SHARE-BASED COMPENSATION PLANSThe fair value of share-based compensation for equity-settled plans granted to employees of subsidiaries under the Company’s plans is recognised as an investment in subsidiaries fromthe date of grant over the vesting period with a corresponding increase in equity. Changes in the fair value of share-based compensation for cash-settled plans relating to employees ofsubsidiaries are recognised as an investment in subsidiaries with a corresponding change in liabilities. In the year of vesting of a plan, the costs for the actual deliveries are charged tothe relevant employing subsidiaries. This is recognised as a realisation of the investment originally booked. If the actual vesting costs are higher than the cumulatively recognised share-based compensation charge, the difference is recognised in income. See Note 21 to the Consolidated Financial Statements for information on the Company’s principal plan. TAXATIONThe Company is tax-resident in the Netherlands. For the assessment of corporate income tax in the Netherlands, the Company and certain of its subsidiaries form a fiscal unit, in respectof which the Company recognises any current tax receivable or payable (and deferred tax asset or liability) for the fiscal unit as a whole to the extent such balances have been settledbetween the Company and other members of the fiscal unit at the balance sheet date. The Company’s tax charge or credit recognised in income is calculated at the statutory tax rate prevailing in the Netherlands for current tax and statutory tax rate substantively enactedin the Netherlands for deferred tax.
FINANCIAL STATEMENTS AND SUPPLEMENTS SHELL ANNUAL REPORT AND FORM 20-F 2017 202
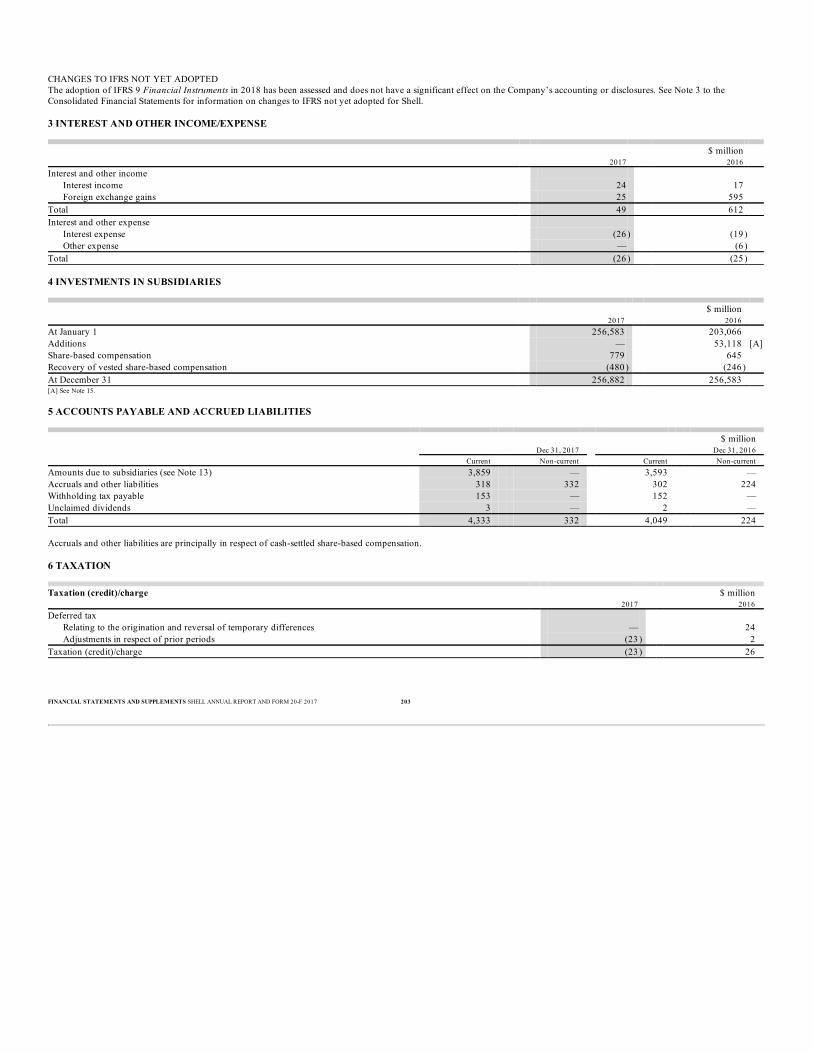
CHANGES TO IFRS NOT YET ADOPTEDThe adoption of IFRS 9 Financial Instruments in 2018 has been assessed and does not have a significant effect on the Company’s accounting or disclosures. See Note 3 to theConsolidated Financial Statements for information on changes to IFRS not yet adopted for Shell. 3 INTEREST AND OTHER INCOME/EXPENSE
$ million 2017 2016
Interest and other income Interest income 24 17 Foreign exchange gains 25 595
Total 49 612 Interest and other expense
Interest expense (26 ) (19 ) Other expense — (6 )
Total (26 ) (25 ) 4 INVESTMENTS IN SUBSIDIARIES
$ million 2017 2016 At January 1 256,583 203,066 Additions — 53,118 [A]Share-based compensation 779 645 Recovery of vested share-based compensation (480 ) (246 ) At December 31 256,882 256,583 [A] See Note 15. 5 ACCOUNTS PAYABLE AND ACCRUED LIABILITIES
$ million Dec 31, 2017 Dec 31, 2016 Current Non-current Current Non-current Amounts due to subsidiaries (see Note 13) 3,859 — 3,593 — Accruals and other liabilities 318 332 302 224 Withholding tax payable 153 — 152 — Unclaimed dividends 3 — 2 — Total 4,333 332 4,049 224 Accruals and other liabilities are principally in respect of cash-settled share-based compensation. 6 TAXATION
Taxation (credit)/charge $ million 2017 2016
Deferred tax Relating to the origination and reversal of temporary differences — 24 Adjustments in respect of prior periods (23 ) 2
Taxation (credit)/charge (23 ) 26
FINANCIAL STATEMENTS AND SUPPLEMENTS SHELL ANNUAL REPORT AND FORM 20-F 2017 203

Reconciliation of applicable tax charge at statutory tax rate to taxation (credit)/charge $ million 2017 2016
Income before taxation 10,928 14,231 Applicable tax charge at the statutory tax rate of 25.0% (2016: 25.0%) 2,732 3,558 Adjustments in respect of prior periods (23 ) 2 Tax effects of:
Income not subject to tax at statutory rates (2,744 ) (3,681 )Expenses not deductible for tax purposes 6 112
Other 6 35 Taxation (credit)/charge (23 ) 26 Taxes payable are reported within accounts payable and accrued liabilities (see Note 5).
Deferred tax assets $ million 2017 2016 At January 1 352 438 Recognised in income 23 (26 )Other movements 223 (60 )At December 31 598 352 Deferred tax assets are recognised in respect of credits carried forward and for an amount of $476 million at December 31, 2017 (2016: $271 million) in respect of tax losses, whichare available for relief against future taxable profits for up to nine years from the year in which the losses were incurred.
7 FINANCIAL INSTRUMENTSFinancial assets and liabilities in the Company’s Balance Sheet comprise cash and cash equivalents, amounts due from subsidiaries (see Note 13) and certain amounts reported withinaccounts payable and accrued liabilities (see Note 5). The fair value of financial assets and liabilities at December 31, 2017, and 2016, approximates their carrying amount. Information on financial risk management is presented in Note 19 to the Consolidated Financial Statements. Foreign currency derivatives are used by the Company to manage foreignexchange risk, which arises when certain transactions are denominated in a currency that is not the Company’s functional currency. There were no derivative financial instruments heldat December 31, 2017, or 2016.
8 SHARE CAPITAL
Issued and fully paid ordinary shares of €0.07 each [A] Number of shares Nominal value ($ million)
A B A B Total At January 1, 2017 4,428,903,813 3,745,486,731 374 309 683 Scrip dividends 168,232,237 — 13 — 13 At December 31, 2017 4,597,136,050 3,745,486,731 387 309 696 At January 1, 2016 3,990,921,569 2,440,410,614 340 206 546 Scrip dividends 219,253,936 — 17 — 17 Shares issued (see Note 15) 218,728,308 1,305,076,117 17 103 120 At December 31, 2016 4,428,903,813 3,745,486,731 374 309 683[A] Share capital at December 31, 2017, and 2016, also included 50,000 issued and fully paid sterling deferred shares of £1 each. At the Company’s Annual General Meeting (AGM) on May 23, 2017, the Board was authorised to allot ordinary shares in the Company, and to grant rights to subscribe for or toconvert any security into ordinary shares in the Company, up to an aggregate nominal amount of €190 million (representing 2,714 million ordinary shares of €0.07 each), and to listsuch shares or rights on any stock exchange. This authority expires at the earlier of the close of business on August 23, 2018, and the end of the AGM to be held in 2018, unlesspreviously renewed, revoked or varied by the Company in a general meeting. B shares rank equally in all respects with A shares except for the dividend access mechanism described below. The Company, Shell Transport and BG Group plc, now BG GroupLimited (BG), can procure the termination of the dividend access mechanism at any time. Upon such termination, B shares will form one class with A shares ranking equally in allrespects and A and B shares will be known as ordinary shares without further distinction. The sterling deferred shares are redeemable only at the discretion of the Company for £1 each and carry no voting rights. There are no further rights to participate in profits or assets,including the right to receive dividends. Upon winding up or liquidation, the shares carry a right to repayment of paid-up nominal value, ranking ahead of A and B shares.
FINANCIAL STATEMENTS AND SUPPLEMENTS SHELL ANNUAL REPORT AND FORM 20-F 2017 204

For information on the number of shares in the Company held by Shell employee share ownership trusts and trust-like entities to meet delivery commitments under employee shareplans, see Note 21 to the Consolidated Financial Statements. DIVIDEND ACCESS MECHANISM FOR B SHARESGeneralDividends paid on A shares have a Dutch source for tax purposes and are subject to Dutch withholding tax. It is the expectation and the intention, although there can be no certainty, that holders of B shares will receive dividends through the dividend access mechanism. Any dividends paidon the dividend access shares will have a UK source for UK and Dutch tax purposes. There will be no Dutch withholding tax on such dividends. From April 2016, there were changesto the taxation of dividends for individual shareholders resident in the UK. The dividend tax credit was abolished, and a tax-free dividend allowance introduced. Description of dividend access mechanismShell Transport and BG have each issued a dividend access share to Computershare Trustees (Jersey) Limited as Trustee. Pursuant to a declaration of trust, the Trustee will hold anydividends paid in respect of the dividend access shares on trust for the holders of B shares and will arrange for prompt disbursement of such dividends to holders of B shares. Interestand other income earned on unclaimed dividends will be for the account of Shell Transport and BG and any dividends which are unclaimed after 12 years will revert to Shell Transportand BG, as appropriate. Holders of B shares will not have any interest in either dividend access share and will not have any rights against Shell Transport and BG as issuers of thedividend access shares. The only assets held on trust for the benefit of the holders of B shares will be dividends paid to the Trustee in respect of the dividend access shares. The declaration and payment of dividends on the dividend access shares will require board action by Shell Transport and BG (as applicable) and will be subject to any applicablelimitations in law or in the Shell Transport or BG (as appropriate) articles of association in effect. In no event will the aggregate amount of the dividend paid by Shell Transport and BGunder the dividend access mechanism for a particular period exceed the aggregate of the dividend announced by the Board of the Company on B shares in respect of the same period(after giving effect to currency conversions). In particular, under their respective articles of association, Shell Transport and BG are each only able to pay a dividend on their respective dividend access shares which represents aproportional amount of the aggregate of any dividend announced by the Company on the B shares in respect of the relevant period, where such proportions are calculated by referenceto, in the case of Shell Transport, the number of B shares in existence prior to completion of the Company’s acquisition of BG (the Acquisition) and, in the case of BG, the number ofB shares issued as part of the Acquisition, in each case as against the total number of B shares in issue immediately following completion of the Acquisition. Operation of the dividend access mechanismIf, in connection with the announcement of a dividend by the Company on B shares, the Board of Shell Transport and/or the Board of BG elects to declare and pay a dividend on theirrespective dividend access shares to the Trustee, the holders of B shares will be beneficially entitled to receive their share of those dividends pursuant to the declaration of trust (andarrangements will be made to ensure that the dividend is paid in the same currency in which they would have received a dividend from the Company). If any amount is paid by Shell Transport or BG by way of a dividend on the dividend access shares and paid by the Trustee to any holder of B shares, the dividend which the Companywould otherwise pay on B shares will be reduced by an amount equal to the amount paid to such holders of B shares by the Trustee. The Company will have a full and unconditional obligation, in the event that the Trustee does not pay an amount to holders of B shares on a cash dividend payment date (even if thatamount has been paid to the Trustee), to pay immediately the dividend announced on B shares. The right of holders of B shares to receive distributions from the Trustee will bereduced by an amount equal to the amount of any payment actually made by the Company on account of any dividend on B shares. If for any reason no dividend is paid on the dividend access shares, holders of B shares will only receive dividends from the Company directly. Any payment by the Company will besubject to Dutch withholding tax (unless an exemption is obtained under Dutch law or under the provisions of an applicable tax treaty). The Dutch tax treatment of dividends paid under the dividend access mechanism has been confirmed by the Dutch Revenue Service in an agreement (“vaststellingsovereenkomst”)with the Company and N.V. Koninklijke Nederlandsche Petroleum Maatschappij (Royal Dutch Petroleum Company) dated October 26, 2004, as supplemented and amended by anagreement between the same parties dated April 25, 2005, and a final settlement agreement in connection with the Acquisition dated November 9, 2015. The agreements state, amongother things, that dividend distributions on the dividend access shares by Shell Transport and/or BG will not be subject to Dutch withholding tax provided that the dividend accessmechanism is structured and operated substantially as set out above. The Company may not extend the dividend access mechanism to any future issuances of B shares without prior consultation with the Dutch Revenue Service. Accordingly, the Company would not expect to issue additional B shares unless confirmation from the Dutch Revenue Service was obtained or the Company were to determine that thecontinued operation of the dividend access mechanism was unnecessary. Any further issue of B shares is subject to advance consultation with the Dutch Revenue Service. The dividend access mechanism may be suspended or terminated at any time by the Company’s Directors or the Directors of Shell Transport or BG, for any reason and withoutfinancial recompense. This might, for instance, occur in response to changes in relevant tax legislation.
FINANCIAL STATEMENTS AND SUPPLEMENTS SHELL ANNUAL REPORT AND FORM 20-F 2017 205

9 OTHER RESERVES
$ million
Mergerreserve
Sharepremium
reserve
Capitalredemption
reserve
Shareplan
reserve Total At January 1, 2017 234,244 154 84 1,091 235,573 Scrip dividends (13 ) — — — (13 )Share-based compensation — — — (194 ) (194 )At December 31, 2017 234,231 154 84 897 235,366 At January 1, 2016 200,331 154 84 1,105 201,674 Scrip dividends (17 ) — — — (17 )Shares issued (see Note 15) 33,930 — — — 33,930 Share-based compensation — — — (14 ) (14 )At December 31, 2016 234,244 154 84 1,091 235,573 The merger reserve was established as a consequence of the Company becoming the single parent company of Royal Dutch and Shell Transport and represented the difference betweenthe cost of the investment in those companies and the nominal value of shares issued in exchange for those investments as required by the prevailing legislation at that time, section 131of the Companies Act 1985. The increase in the merger reserve in 2016 in respect of the shares issued represents the difference between the fair value and the nominal value of theshares issued for the Acquisition (see Note 15). On January 6, 2006, loan notes were converted into 4,827,974 A shares. The difference between the carrying value of the loan notes and the nominal value of the new shares issuedwas credited to the share premium reserve. The capital redemption reserve was established in connection with repurchases of shares of the Company. The share plan reserve is inrespect of equity-settled share-based compensation plans (see Note 21 to the Consolidated Financial Statements) and share-based compensation for the year is the net of the charge toequity and the release as a result of vested awards. 10 DIVIDENDS See Note 23 to the Consolidated Financial Statements. 11 LEGAL PROCEEDINGS AND OTHER CONTINGENCIESSee Note 25 to the Consolidated Financial Statements. 12 DIRECTORS AND SENIOR MANAGEMENTSee Note 27 to the Consolidated Financial Statements for the remuneration of Directors of the Company. In 2017, the Company recognised $25 million (2016: $22 million) inadministrative expenses for the compensation of Directors and Senior Management. 13 RELATED PARTIESInformation about the Company’s subsidiaries, and whether these are held directly or indirectly, and other related undertakings (all of which are held indirectly), at December 31,2017, is set out in Exhibit 8.
$ million
Amounts due from subsidiaries Amounts due to subsidiaries
(see Note 5) 2017 2016 2017 2016
Shell Petroleum 4,502 4,201 672 409 Shell Treasury Centre Limited 518 476 — — Shell Treasury Luxembourg Sarl — — 3,164 3,163 Other 2 3 23 21 Total 5,022 4,680 3,859 3,593 The amount due from Shell Petroleum, which is denominated in dollars, is repayable on demand. Interest is calculated at US LIBOR less 0.058% (2016: US LIBOR less 0.103%) andinterest income in 2017 was $19 million (2016: $12 million). The amount due from Shell Treasury Centre Limited (STCL) comprises call deposits in dollars, sterling and euros. Interest is calculated at US LIBOR less 0.058% (2016: US LIBORless 0.103%) on dollar balances, at GBP LIBOR less 0.137% (2016: GBP LIBOR less 0.137%) on sterling balances and at Euro Overnight Index Average (EONIA) less 0.1% (2016:EONIA less 0.1%) on euro balances, unless this results in a negative interest rate in which case no interest is earned. Interest income in 2017 from STCL was $5 million (2016: $4million). The net amount due to Shell Treasury Luxembourg Sarl at December 31, 2017, which is repayable on demand, comprises an interest-bearing receivable of €1,289 million (2016:€1,183 million) and an interest-bearing payable of $4,707 million (2016: $4,408 million). Interest on euro balances is calculated at EONIA less 0.1% (2016: EONIA less 0.1%) unlessthis results in a negative interest rate in which case no interest is earned. Interest on dollar balances is calculated at US LIBOR (2016: US LIBOR). Net interest expense on these balancesin 2017 was $26 million (2016: $19 million).
FINANCIAL STATEMENTS AND SUPPLEMENTS SHELL ANNUAL REPORT AND FORM 20-F 2017 206

OTHER TRANSACTIONS AND BALANCESThe Company enters into forward and spot foreign currency contracts with Treasury companies, which are subsidiaries. There were no open foreign currency contracts at December31, 2017, or 2016. The Company settles general and administrative expenses of the Trust, including the auditor’s remuneration. The Company has guaranteed contractual payments totalling $58,527 million at December 31, 2017 (2016: $61,684 million), and related interest, in respect of listed debt issued byShell International Finance B.V. 14 AUDITOR’S REMUNERATIONSee Note 28 to the Consolidated Financial Statements. 15 ACQUISITION OF BG GROUP PLCOn February 15, 2016, the Company acquired all the voting rights in BG Group plc by means of a Scheme of Arrangement under Part 26 of the Act, via the issuance of 218.7 millionA shares and 1,305.1 million B shares with a fair value of $34,050 million and cash payments of $19,036 million in exchange for all BG Group plc shares. The fair value of the sharesissued was calculated using the market price of the Company’s A and B shares of 1,545.0 and 1,538.5 pence respectively on the London Stock Exchange at its opening of business onFebruary 15, 2016. The cash payments were funded by amounts previously held on deposit with Shell Petroleum. In September 2016, the Company’s shares in BG Group Limited(formerly BG Group plc) were exchanged for an increased investment in Shell Petroleum.
FINANCIAL STATEMENTS AND SUPPLEMENTS SHELL ANNUAL REPORT AND FORM 20-F 2017 207

Independent Auditor’s Report to Computershare Trustees (Jersey) Limited as Trusteeof the Royal Dutch Shell Dividend Access Trust and the Board of Directors of RoyalDutch Shell plc
Opinion on the Financial Statements We have audited the non-statutory financial statements of the Royal Dutch Shell Dividend Access Trust (the Financial Statements) for the year ended December 31, 2017, whichcomprise the Statement of Income, the Statement of Comprehensive Income, the Balance Sheet, the Statement of Changes in Equity, the Statement of Cash Flows and the related Notes1 to 8. The financial reporting framework that has been applied in their preparation is International Financial Reporting Standards (IFRS) as adopted by the European Union (EU) andIFRS as issued by the International Accounting Standards Board (IASB). In our opinion, the Financial Statements:
■ give a true and fair view of the Royal Dutch Shell Divided Access Trust’s (the Trust) affairs as at December 31, 2017, and of its income for the year then ended; and■ have been properly prepared both in accordance with IFRS as adopted by the EU and IFRS as issued by the IASB.
Basis for opinionWe conducted our audit in accordance with International Standards on Auditing (UK) (ISAs (UK)). Our responsibilities under those standards are further described in the “Auditor’sresponsibilities for the audit of the financial statements” section of our report below. We are independent of the Trust in accordance with the ethical requirements that are relevant toour audit of the financial statements in the UK, including the Financial Reporting Council’s Ethical Standards, and we have fulfilled our other ethical responsibilities in accordance withthese requirements. We believe that the audit evidence we have obtained is sufficient and appropriate to provide a basis for our opinion. Use of our reportThis report is made solely to the Trustee of the Royal Dutch Shell Dividend Access Trust (the Trustee) and the Board of Directors of Royal Dutch Shell plc. (the Directors), as a body,in accordance with our engagement letter. Our audit work has been undertaken so that we might state to the Trustee and the Directors those matters we are required to state to them inan auditor’s report and for no other purpose. To the fullest extent permitted by law, we do not accept or assume responsibility to anyone other than the Trust and the Trustee and theDirectors as a body, for our audit work, for this report, or for the opinions we have formed. Conclusions relating to going concernWe have nothing to report in respect of the following matters in relation to which the ISAs (UK) require us to report to you where:
■ the Trustee’s use of the going concern basis of accounting in the preparation of the Financial Statements is not appropriate; or■ the Trustee has not disclosed in the Financial Statements any identified material uncertainties that may cast significant doubt about the Trust’s ability to continue to adopt the going
concern basis of accounting for a period of at least twelve months from the date of approval of the Financial Statements.
Other informationThe other information comprises the information included in the annual report, other than the Financial Statements and our auditor’s report thereon. The Directors are responsible forthe other information. Our opinion on the Financial Statements does not cover the other information and, we do not express any form of assurance conclusion thereon. In connection with our audit of the Financial Statements, our responsibility is to read the other information and, in doing so, consider whether the other information is materiallyinconsistent with the Financial Statements or our knowledge obtained in the audit or otherwise appears to be materially misstated. If we identify such material inconsistencies orapparent material misstatements, we are required to determine whether there is a material misstatement in the Financial Statements or a material misstatement of the other information.If, based on the work we have performed, we conclude that there is a material misstatement of the other information, we are required to report that fact. We have nothing to report in this regard. Responsibilities of the TrusteeThe Trustee is responsible for the preparation of the Financial Statements and for being satisfied that they give a true and fair view, and for such internal control as the Trusteedetermines is necessary to enable the preparation of Financial Statements that are free from material misstatement, whether due to fraud or error. In preparing the Financial Statements, the Trustee is responsible for assessing the Trust’s ability to continue as a going concern, disclosing, as applicable, matters related to goingconcern and using the going concern basis of accounting unless the Trustee either intends to liquidate the Trust or to cease operations, or have no realistic alternative but to do so. TheTrustee is also required to: present fairly the financial position, financial performance and cash flows of the Trust; select suitable accounting policies in accordance with IAS 8:Accounting Policies, Changes in Accounting Estimates and Errors and then apply them consistently; present information, including accounting policies, in a manner that providesrelevant, reliable, comparable and understandable information; make judgements that are reasonable; provide additional disclosures when compliance with the specific requirements inIFRS as adopted by the EU and as issued by the IASB is insufficient to enable users to understand the impact of particular transactions, other events and conditions on the Trust’sfinancial position and financial performance; and state whether the Financial Statements have been prepared in accordance with IFRS as adopted by the EU and as issued by the IASB.
FINANCIAL STATEMENTS AND SUPPLEMENTS SHELL ANNUAL REPORT AND FORM 20-F 2017 208

Independent Auditor’s Report to Computershare Trustees (Jersey) Limited as Trusteeof the Royal Dutch Shell Dividend Access Trust and the Board of Directors of RoyalDutch Shell plc
Auditor’s responsibilities for the audit of the financial statementsOur objectives are to obtain reasonable assurance about whether the financial statements as a whole are free from material misstatement, whether due to fraud or error, and to issue anauditor’s report that includes our opinion. Reasonable assurance is a high level of assurance, but is not a guarantee that an audit conducted in accordance with ISAs (UK) will alwaysdetect a material misstatement when it exists. Misstatements can arise from fraud or error and are considered material if, individually or in aggregate, they could reasonably be expectedto influence the economic decisions of users taken on the basis of these financial statements. A further description of our responsibilities for the audit of the financial statements is located on the Financial Reporting Council’s website athttps://www.frc.org.uk/auditorsresponsibilities. This description forms part of our auditor’s report. /s/ Ernst & Young LLPLondonMarch 14, 2018 1. The maintenance and integrity of the Shell website are the responsibility of the Directors of Royal Dutch Shell plc; the work carried out by the auditors does not involve consideration of these matters and,
accordingly, the auditors accept no responsibility for any changes that may have occurred to the Financial Statements since they were initially presented on the website.2. Legislation in the UK governing the preparation and dissemination of financial statements may differ from legislation in other jurisdictions. The report set out above is included for the purposes of Royal Dutch Shell plc’s Annual Report and Accounts for 2017 only and does not form part of Royal Dutch Shell plc’s AnnualReport on Form 20-F for 2017.
FINANCIAL STATEMENTS AND SUPPLEMENTS SHELL ANNUAL REPORT AND FORM 20-F 2017 209

Report of Independent Registered Public Accounting Firm
TO COMPUTERSHARE TRUSTEES (JERSEY) LIMITED AS TRUSTEE OF THE ROYAL DUTCH SHELL DIVIDEND ACCESS TRUST AND THE BOARDOF DIRECTORS AND SHAREHOLDERS OF ROYAL DUTCH SHELL PLCOpinion on the Financial StatementsWe have audited the accompanying balance sheets of Royal Dutch Shell Dividend Access Trust (the Trust) as of December 31, 2017, and 2016, the related statements of income,comprehensive income, changes in equity and cash flows, for each of the two years in the period ended December 31, 2017, and the related notes (collectively referred to as theFinancial Statements). In our opinion, the Financial Statements present fairly, in all material respects, the financial position of the Trust at December 31, 2017, and 2016, and the resultsof its operations and its cash flows for each of the two years in the period ended December 31, 2017, in conformity with International Financial Reporting Standards (IFRS) as issuedby the International Accounting Standards Board and in conformity with IFRS as adopted by the European Union. We also have audited, in accordance with the standards of the Public Company Accounting Oversight Board (United States) (PCAOB), the Trust’s internal control over financialreporting as of December 31, 2017, based on criteria established in Internal Control-Integrated Framework issued by the Committee of Sponsoring Organizations of the TreadwayCommission (2013 framework), and our report dated March 14, 2018, expressed an unqualified opinion thereon. Basis for OpinionThese financial statements are the responsibility of the Trustee of the Trust (the Trustee) and the management of Royal Dutch Shell plc (the Management). Our responsibility is toexpress an opinion on the Trust’s Financial Statements based on our audits. We are a public accounting firm registered with the PCAOB and are required to be independent with respectto the Trust in accordance with the US federal securities laws and the applicable rules and regulations of the Securities and Exchange Commission and the PCAOB. We conducted our audits in accordance with the standards of the PCAOB. Those standards require that we plan and perform the audit to obtain reasonable assurance about whether thefinancial statements are free of material misstatement, whether due to error or fraud. Our audits included performing procedures to assess the risks of material misstatement of thefinancial statements, whether due to error or fraud, and performing procedures that respond to those risks. Such procedures included examining, on a test basis, evidence regarding theamounts and disclosures in the financial statements. Our audits also included evaluating the accounting principles used and significant estimates made by the Trustee and Management,as well as evaluating the overall presentation of the financial statements. We believe that our audits provide a reasonable basis for our opinion. /s/ Ernst & Young LLPWe have served as the Trust’s auditor since 2016.London, United KingdomMarch 14, 2018
TO COMPUTERSHARE TRUSTEES (JERSEY) LIMITED AS TRUSTEE OF THE ROYAL DUTCH SHELL DIVIDEND ACCESS TRUST AND THE BOARDOF DIRECTORS AND SHAREHOLDERS OF ROYAL DUTCH SHELL PLCOpinion on Internal Control over Financial ReportingWe have audited the Royal Dutch Shell Dividend Access Trust’s (the Trust) internal control over financial reporting as of December 31, 2017, based on criteria established in InternalControl— Integrated Framework issued by the Committee of Sponsoring Organizations of the Treadway Commission (2013 framework), (the COSO criteria). In our opinion, the Trustmaintained, in all material respects, effective internal control over financial reporting as of December 31, 2017, based on the COSO criteria. We also have audited, in accordance with the standards of the Public Company Accounting Oversight Board (United States) (PCAOB), the Financial Statements of the Trust, and ourreport dated March 14, 2018, expressed an unqualified opinion thereon. Basis for OpinionThe Trustee of the Trust (the Trustee) and the management of Royal Dutch Shell plc (the Management) are responsible for maintaining effective internal control over financialreporting and for their assessment of the effectiveness of internal control over financial reporting included in the accompanying Trustee’s and Management’s report on internal controlover financial reporting as set out on page 82. Our responsibility is to express an opinion on the Trust’s internal control over financial reporting based on our audit. We are a publicaccounting firm registered with the PCAOB and are required to be independent with respect to the Trust in accordance with the US federal securities laws and the applicable rules andregulations of the Securities and Exchange Commission and the PCAOB. We conducted our audit in accordance with the standards of the PCAOB. Those standards require that we plan and perform the audit to obtain reasonable assurance about whethereffective internal control over financial reporting was maintained in all material respects. Our audit included obtaining an understanding of internal control over financial reporting,assessing the risk that a material weakness exists, testing and evaluating the design and operating effectiveness of internal control based on the assessed risk, and performing such otherprocedures as we considered necessary in the circumstances. We believe that our audit provides a reasonable basis for our opinion.
FINANCIAL STATEMENTS AND SUPPLEMENTS SHELL ANNUAL REPORT AND FORM 20-F 2017 210

Report of Independent Registered Public Accounting Firm
Definition and Limitations of Internal Control over Financial ReportingA company’s internal control over financial reporting is a process designed to provide reasonable assurance regarding the reliability of financial reporting and the preparation offinancial statements for external purposes in accordance with generally accepted accounting principles. A company’s internal control over financial reporting includes those policiesand procedures that (1) pertain to the maintenance of records that, in reasonable detail, accurately and fairly reflect the transactions and dispositions of the assets of the company; (2)provide reasonable assurance that transactions are recorded as necessary to permit preparation of financial statements in accordance with generally accepted accounting principles, andthat receipts and expenditures of the company are being made only in accordance with authorisations of management and directors of the company; and (3) provide reasonableassurance regarding prevention or timely detection of unauthorised acquisition, use, or disposition of the company’s assets that could have a material effect on the financial statements. Because of its inherent limitations, internal control over financial reporting may not prevent or detect misstatements. Also, projections of any evaluation of effectiveness to futureperiods are subject to the risk that controls may become inadequate because of changes in conditions, or that the degree of compliance with the policies or procedures may deteriorate. /s/ Ernst & Young LLPLondon, United KingdomMarch 14, 2018
1. The maintenance and integrity of the Shell website are the responsibility of the Directors of Royal Dutch Shell plc; the work carried out by the auditors does not involve consideration of these matters and,accordingly, the auditors accept no responsibility for any changes that may have occurred to the financial statements since they were initially presented on the website.
2. Legislation in the UK governing the preparation and dissemination of financial statements may differ from legislation in other jurisdictions.
The reports set out above are included for the purposes of Royal Dutch Shell plc’s Annual Report on Form 20-F for 2017 only and do not form part of Royal Dutch Shell plc’s AnnualReport and Accounts for 2017.
FINANCIAL STATEMENTS AND SUPPLEMENTS SHELL ANNUAL REPORT AND FORM 20-F 2017 211

Report of Independent Registered Public Accounting Firm
TO COMPUTERSHARE TRUSTEES (JERSEY) LIMITED AS TRUSTEE OF THE ROYAL DUTCH SHELL DIVIDEND ACCESS TRUST AND THE BOARDOF DIRECTORS AND SHAREHOLDERS OF ROYAL DUTCH SHELL PLCIn our opinion, the accompanying Statement of Income, the Statement of Comprehensive Income, the Statement of Changes in Equity, the Statement of Cash Flows, and the relatedNotes to the Royal Dutch Shell Dividend Access Trust Financial Statements for the year ended December 31, 2015 present fairly, in all material respects, the results of operations andcash flows of the Royal Dutch Shell Dividend Access Trust (the Trust) in conformity with International Financial Reporting Standards as issued by the International AccountingStandards Board and in conformity with International Financial Reporting Standards as adopted by the European Union. These financial statements are the responsibility of the Trustee and management of Royal Dutch Shell plc. Our responsibility is to express an opinion on these financial statements basedon our audit. We conducted our audit of these financial statements in accordance with the standards of the Public Company Accounting Oversight Board (United States). Thosestandards require that we plan and perform the audit to obtain reasonable assurance about whether the financial statements are free of material misstatement. An audit includesexamining, on a test basis, evidence supporting the amounts and disclosures in the financial statements, assessing the accounting principles used and significant estimates made bymanagement, and evaluating the overall financial statement presentation. We believe that our audit provides a reasonable basis for our opinion. /s/ PricewaterhouseCoopers CI LLPJersey, Channel IslandsMarch 9, 2016 Note that the report set out above is included for the purposes of Royal Dutch Shell plc’s Annual Report on Form 20-F for 2017 only and does not form part of Royal Dutch Shellplc’s Annual Report and Accounts for 2017.
FINANCIAL STATEMENTS AND SUPPLEMENTS SHELL ANNUAL REPORT AND FORM 20-F 2017 212

Royal Dutch Shell Dividend Access Trust Financial Statements
214 Statement of Income214 Statement of Comprehensive Income214 Balance Sheet215 Statement of Changes in Equity215 Statement of Cash Flows216 Notes to the Royal Dutch Shell Dividend Access Trust Financial Statements216 Note 1 The Trust216 Note 2 Basis of preparation216 Note 3 Significant accounting policies216 Note 4 Unclaimed dividends216 Note 5 Capital account216 Note 6 Distributions made216 Note 7 Related parties216 Note 8 Auditor’s remuneration
FINANCIAL STATEMENTS AND SUPPLEMENTS SHELL ANNUAL REPORT AND FORM 20-F 2017 213
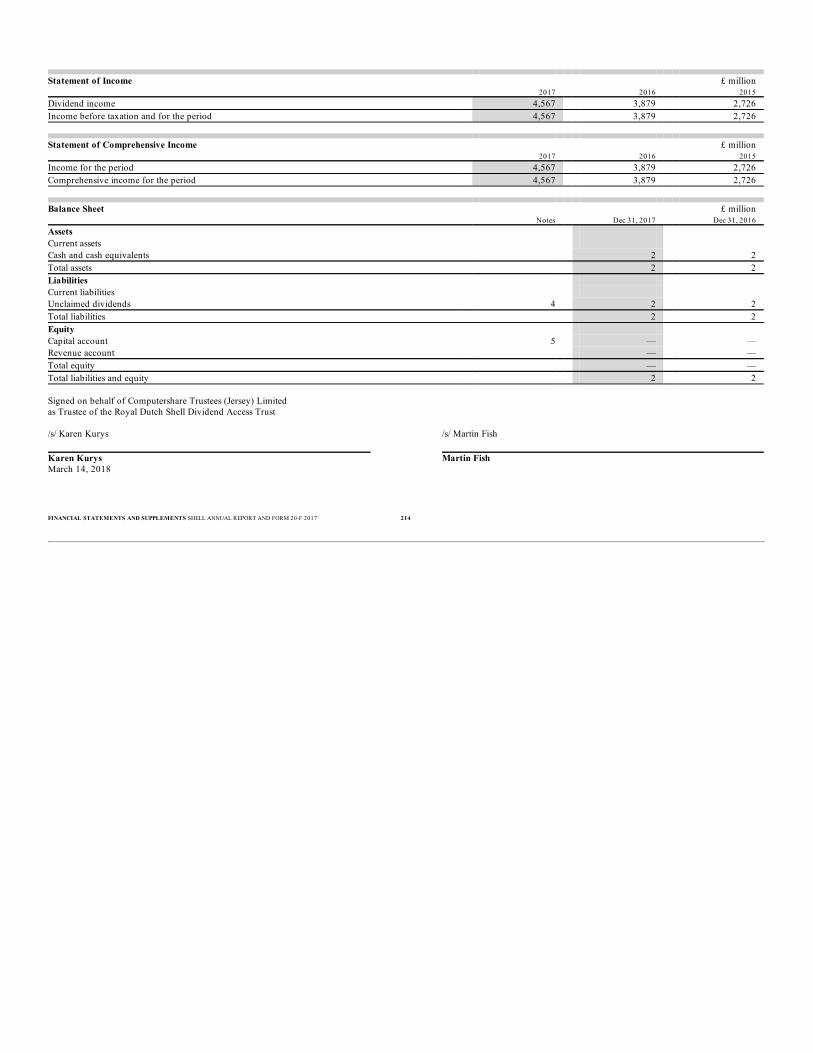
Statement of Income £ million 2017 2016 2015
Dividend income 4,567 3,879 2,726 Income before taxation and for the period 4,567 3,879 2,726
Statement of Comprehensive Income £ million 2017 2016 2015
Income for the period 4,567 3,879 2,726 Comprehensive income for the period 4,567 3,879 2,726
Balance Sheet £ million Notes Dec 31, 2017 Dec 31, 2016
Assets Current assets Cash and cash equivalents 2 2 Total assets 2 2 Liabilities Current liabilities Unclaimed dividends 4 2 2 Total liabilities 2 2 Equity Capital account 5 — — Revenue account — — Total equity — — Total liabilities and equity 2 2 Signed on behalf of Computershare Trustees (Jersey) Limitedas Trustee of the Royal Dutch Shell Dividend Access Trust /s/ Karen Kurys /s/ Martin Fish Karen Kurys Martin FishMarch 14, 2018
FINANCIAL STATEMENTS AND SUPPLEMENTS SHELL ANNUAL REPORT AND FORM 20-F 2017 214

Statement of Changes in Equity £ million
Notes Capitalaccount
Revenueaccount
Totalequity
At January 1, 2017 — — — Comprehensive income for the period — 4,567 4,567 Distributions made 6 — (4,567 ) (4,567 )At December 31, 2017 — — — At January 1, 2016 — — — Comprehensive income for the period — 3,879 3,879 Distributions made 6 — (3,879 ) (3,879 )At December 31, 2016 — — — At January 1, 2015 — — — Comprehensive income for the period — 2,726 2,726 Distributions made 6 — (2,726 ) (2,726 )At December 31, 2015 — — —
Statement of Cash Flows £ million 2017 2016 2015
Income for the period 4,567 3,879 2,726 Adjustment for:
Dividends received (4,567 ) (3,879 ) (2,726 )Cash flow from operating activities — — — Dividends received 4,567 3,879 2,726 Cash flow from investing activities 4,567 3,879 2,726 Cash distributions made (4,567 ) (3,879 ) (2,725 )Cash flow from financing activities (4,567 ) (3,879 ) (2,725 )Change in cash and cash equivalents — — 1 Cash and cash equivalents at January 1 2 2 1 Cash and cash equivalents at December 31 2 2 2
FINANCIAL STATEMENTS AND SUPPLEMENTS SHELL ANNUAL REPORT AND FORM 20-F 2017 215

Notes to the Royal Dutch Shell Dividend Access Trust Financial Statements
1 THE TRUSTThe Royal Dutch Shell Dividend Access Trust (the Trust) was established on May 19, 2005, by The “Shell” Transport and Trading Company, p.l.c., now The Shell Transport andTrading Company Limited (Shell Transport), and Royal Dutch Shell plc (the Company). The Trust is governed by the applicable laws of England and Wales and is resident anddomiciled in Jersey. The Trust is not subject to taxation. The Trustee of the Trust is Computershare Trustees (Jersey) Limited, registration number 92182 (the Trustee), QueenswayHouse, Hilgrove Street, St Helier, Jersey, JE1 1ES. The Trust was established as part of a dividend access mechanism. Shell Transport and BG Group plc, now BG Group Limited (BG), have each issued a dividend access share to the Trustee. Following the announcement of a dividend by the Companyon the B shares, Shell Transport and BG may declare a dividend on their dividend access shares. The primary purposes of the Trust are to receive, on behalf of the B shareholders of the Company and in accordance with their respective holdings of B shares in the Company, anyamounts paid by way of dividend on the dividend access shares and to pay such amounts to the B shareholders on the same pro rata basis. The Trust is not subject to significant marketrisk, credit risk or liquidity risk. The Trust shall not endure for a period in excess of 80 years from May 19, 2005, being the date on which the Trust Deed was executed. 2 BASIS OF PREPARATIONThe Financial Statements of the Trust have been prepared in accordance with International Financial Reporting Standards (IFRS) as adopted by the European Union. As applied to theTrust, there are no material differences from IFRS as issued by the International Accounting Standards Board (IASB); therefore, the Financial Statements have been prepared inaccordance with IFRS as issued by the IASB. The Financial Statements have been prepared under the historical cost convention. The accounting policies described in Note 3 have been applied consistently in all periods presented. The Financial Statements were approved and authorised for issue by the Trustee on March 14, 2018. The financial results of the Trust are included in the Consolidated and Parent Company Financial Statements on pages 137-178 and pages 199-207 respectively. 3 SIGNIFICANT ACCOUNTING POLICIESThe Trust’s accounting policies follow those of Shell as set out in Note 2 to the Consolidated Financial Statements. The following are Trust-specific policies. PRESENTATION AND FUNCTIONAL CURRENCYThe Trust’s presentation and functional currency is sterling. The Trust’s dividend income and dividends paid are principally in sterling. DIVIDEND INCOMEDividends on the dividend access shares are recognised on a paid basis unless the dividend has been confirmed by a general meeting of Shell Transport or BG, in which case income isrecognised on the date on which receipt is deemed virtually certain. DISTRIBUTIONS MADEAmounts are recorded as distributed once a wire transfer or cheque is issued. To the extent that cheques expire or are returned unpresented, the Trust records a liability for unclaimeddividends and a corresponding amount of cash. 4 UNCLAIMED DIVIDENDSUnclaimed dividends of £2,302,549 (2016: £1,972,676) include any dividend cheque payments that have not been presented within 12 months, have expired or have been returnedunpresented. 5 CAPITAL ACCOUNTThe capital account is represented by the dividend access share of 25 pence settled in the Trust by Shell Transport and the dividend access share of 10 pence settled in the Trust byBG. 6 DISTRIBUTIONS MADEDistributions are made to the B shareholders of the Company in accordance with the Trust Deed. See Note 23 to the Consolidated Financial Statements for information about dividendsper share. Any wire transfers that are not completed are replaced by cheques. 7 RELATED PARTIESThe Trust received dividend income of £2,970 million (2016: £2,533 million; 2015: £2,726 million) in respect of the dividend access share from Shell Transport and £1,597 million(2016: £1,346 million) in respect of the dividend access share from BG. The Trust made distributions of £4,567 million (2016: £3,879 million; 2015: £2,726 million) to the Bshareholders of the Company. The Company pays the general and administrative expenses of the Trust, including the auditor’s remuneration. 8 AUDITOR’S REMUNERATIONAuditor’s remuneration for 2017 audit services was £33,750 (2016: £33,750; 2015: £33,750).
FINANCIAL STATEMENTS AND SUPPLEMENTS SHELL ANNUAL REPORT AND FORM 20-F 2017 216

Royal Dutch Shell plc (the Company) was incorporated in England and Wales onFebruary 5, 2002, as a private company under the Companies Act 1985, as amended. OnOctober 27, 2004, the Company was re-registered as a public company limited by sharesand changed its name from Forthdeal Limited to Royal Dutch Shell plc. The Company isregistered at Companies House, Cardiff, under company number 4366849, and at theChamber of Commerce, The Hague, under company number 34179503. The LegalEntity Identifier (LEI) issued by the London Stock Exchange is21380068P1DRHMJ8KU70. The business address for the Directors and SeniorManagement is Carel van Bylandtlaan 30, 2596 HR, The Hague, The Netherlands. The Company is resident in the Netherlands for Dutch and UK tax purposes and itsprimary objective is to carry on the business of a holding company. It is not directly orindirectly owned or controlled by another corporation or by any government and doesnot know of any arrangements that may result in a change of control of the Company. NATURE OF TRADING MARKETThe Company has two classes of ordinary shares: A and B shares. The principal tradingmarket for A shares is Euronext Amsterdam and the principal trading market for B sharesis the London Stock Exchange. Ordinary shares are traded in registered form. A and B American Depositary Shares (ADSs) are listed on the New York Stock Exchange[A]. A depositary receipt is a certificate that evidences ADSs. Depositary receipts areissued, cancelled and exchanged at the office of The Bank of New York Mellon,101 Barclay Street, New York, NY 10286, USA, as depositary (the Depositary) under adeposit agreement between the Company, the Depositary and the holders of ADSs. EachADS represents two €0.07 shares of Royal Dutch Shell plc deposited under theagreement. More information relating to ADSs is given on page 221.[A] At February 16, 2018, 478,067,812 A ADSs and 307,432,534 B ADSs were outstanding, representing 21% and 16% of therespective share capital class, held by 5,700 and 925 holders of record with an address in the USA, respectively. In addition toholders of ADSs, at February 16, 2018, 35,338 A shares and 1,034,164 B shares of €0.07 each were outstanding, representing0.001% and 0.027% of the respective share capital class, held by 331 and 3,178 holders of record registered with an address inthe USA, respectively.
Listing information A shares B shares
Ticker symbol London RDSA RDSBTicker symbol Amsterdam RDSA RDSBTicker symbol New York (ADS [A]) RDS.A RDS.BISIN Code GB00B03MLX29 GB00B03MM408CUSIP G7690A100 G7690A118SEDOL Number London B03MLX2 B03MM40SEDOL Number Euronext B09CBL4 B09CBN6Weighting on FTSE at 31/12/17 4.87% 5.79%Weighting on AEX at 31/12/17 15.92% not included
SHARE CAPITALThe issued and fully paid share capital of the Company at February 16, 2018, was asfollows:
Share capital Issued and fully paid Number Nominal value
Ordinary shares of €0.07 each A shares 4,597,136,050 €321,799,524B shares 3,745,486,731 €262,184,071
Sterling deferred shares of £1 each 50,000 £50,000 The Directors may only allot new ordinary shares if they have authority fromshareholders to do so. The Company seeks to renew this authority annually at its AnnualGeneral Meeting (AGM). Under the resolution passed at the Company’s 2017 AGM, theDirectors were granted authority to allot ordinary shares up to an aggregate nominalamount equivalent to approximately one-third of the issued ordinary share capital of theCompany (in line with the guidelines issued by institutional investors). The following is a summary of the material terms of the Company’s ordinary shares,including brief descriptions of the provisions contained in the Articles of Association (theArticles) and applicable laws of England and Wales in effect on the date of this document.This summary does not purport to include complete statements of these provisions: ■ upon issuance, A and B shares are fully paid and free from all liens, equities, charges,
encumbrances and other interest of the Company and not subject to calls of any kind;■ all A and B shares rank equally for all dividends and distributions on ordinary share
capital; and■ A and B shares are admitted to the Official List of the UK Listing Authority and to
trading on the market for listed securities of the London Stock Exchange. A and Bshares are also admitted to trading on Euronext Amsterdam. A and B ADSs are listed onthe New York Stock Exchange.
At December 31, 2017, trusts and trust-like entities holding shares for the benefit ofemployee share plans of Shell held (directly and indirectly) 30 million shares of theCompany with an aggregate market value of $998 million and an aggregate nominalvalue of €2 million.
[A] Each A ADS represents two A shares of €0.07 each and each B ADS represents two B shares of €0.07 each.
Additional InformationShareholder information
ADDITIONAL INFORMATION SHELL ANNUAL REPORT AND FORM 20-F 2017 217

SIGNIFICANT SHAREHOLDINGSThe Company’s A and B shares have identical voting rights, and accordingly the Company’s major shareholders do not have different voting rights. SIGNIFICANT DIRECT SHAREHOLDINGSDirect holdings of 3% or more of A and B shares combined held by registered members representing the interests of underlying investors at December 31, 2017, are given below.
Direct shareholdings A shares B shares Total Number % Number % Number %
Euroclear Nederland 2,012,545,344 43.78 14,824,206 0.40 2,027,369,550 24.30 BNY (Nominees) Limited 787,847,266 17.14 597,789,774 15.96 1,385,637,040 16.61 Chase Nominees Limited 85,008,779 1.85 245,221,731 6.55 330,230,510 3.96 State Street Nominees Limited (OM02) 129,034,595 2.81 160,840,178 4.29 289,874,773 3.47 SIGNIFICANT INDIRECT SHAREHOLDINGSInterests of investors with 3% or more of A and B shares combined at December 31, 2017, are given below.
Indirect shareholdings A shares B shares Total Number % Number % Number %
BlackRock, Inc. 361,174,730 7.86 261,634,575 6.99 622,809,305 7.47 The Capital Group Companies, Inc. 68,717,359 1.49 375,623,767 10.03 444,341,126 5.33 The Vanguard Group, Inc. 148,617,903 3.23 118,899,011 3.17 267,516,914 3.21 NOTIFICATION OF MAJOR SHAREHOLDINGSAs at December 31, 2017, the Company had been notified by the following investor of its interests in the Company’s shares pursuant to Disclosure Guidance and Transparency Rule(DTR) 5.
Investor A shares B shares Total [B] Number % Number % Number %
BlackRock, Inc. [A] 277,045,557 6.10 218,422,847 5.83 495,468,404 5.97[A] The Company received numerous notifications from BlackRock, Inc. during 2017. The information given is derived from the most recent notification.[B] Excludes financial instruments according to Art. 13(1)(a) of Directive 2004/109/EC (DTR 5.3.1.1 (a)) and financial instruments with similar economic effect according to Art. 13(1)(b) of Directive 2004/109/EC (DTR 5.3.1.1 (b)). The Company did not receive any further notifications pursuant to DTR 5 in the period from December 31, 2017, to February 16, 2018 (being a date not more than one month priorto the date of the Company’s Notice of Annual General Meeting).
ADDITIONAL INFORMATION SHELL ANNUAL REPORT AND FORM 20-F 2017 218

DIVIDENDSThe following tables show the dividends on each class of share and each class of ADS for the years 2013-2017.
A and B shares $ 2017 2016 2015 2014 2013
Q1 0.47 0.47 0.47 0.47 0.45 Q2 0.47 0.47 0.47 0.47 0.45 Q3 0.47 0.47 0.47 0.47 0.45 Q4 0.47 0.47 0.47 0.47 0.45 Total announced in respect of the year 1.88 1.88 1.88 1.88 1.80
A shares € [A] 2017 2016 2015 2014 2013
Q1 0.42 0.42 0.42 0.35 0.34 Q2 0.39 0.42 0.42 0.36 0.34 Q3 0.40 0.44 0.43 0.38 0.33 Q4 0.38 0.44 0.42 0.43 0.32 Total announced in respect of the year 1.59 1.72 1.69 1.53 1.34 Amount paid during the year 1.65 1.70 1.71 1.42 1.34[A] Euro equivalent, rounded to the nearest euro cent.
B shares Pence [A] 2017 2016 2015 2014 2013
Q1 37.12 32.98 30.75 28.03 28.99 Q2 36.28 35.27 30.92 29.09 28.67 Q3 35.02 37.16 31.07 30.16 27.51 Q4 33.91 38.64 32.78 31.20 26.88 Total announced in respect of the year 142.33 144.05 125.52 118.48 112.05 Amount paid during the year 147.06 138.19 123.94 114.16 113.96[A] Sterling equivalent.
A and B ADSs $ 2017 2016 2015 2014 2013
Q1 0.94 0.94 0.94 0.94 0.90 Q2 0.94 0.94 0.94 0.94 0.90 Q3 0.94 0.94 0.94 0.94 0.90 Q4 0.94 0.94 0.94 0.94 0.90 Total announced in respect of the year 3.76 3.76 3.76 3.76 3.60 Amount paid during the year 3.76 3.76 3.76 3.72 3.56
ADDITIONAL INFORMATION SHELL ANNUAL REPORT AND FORM 20-F 2017 219

HIGH, LOW AND YEAR-END SHARE PRICESThe following tables show the high, low and year-end prices, taken directly from the respective securities exchange, of the Company’s registered ordinary shares: ■ of €0.07 nominal value on the London Stock Exchange;■ of €0.07 nominal value on Euronext Amsterdam; and■ in the form of ADSs on the New York Stock Exchange (ADSs do not have a nominal value).
Annual share prices
Euronext Amsterdam
A shares New York Stock Exchange
A ADSs High € Low € Year-end € High $ Low $ Year-end $
2013 27.06 23.40 25.91 73.00 62.65 71.27 2014 31.13 24.30 27.66 83.42 60.84 66.95 2015 29.59 19.58 21.10 67.16 43.26 45.79 2016 26.39 16.53 25.99 56.29 35.80 54.38 2017 28.25 22.73 27.77 66.92 50.32 66.71
London Stock Exchange
B shares New York Stock Exchange
B ADSs High pence Low pence Year-end pence High $ Low $ Year-end $
2013 2,375 2,070 2,280 75.18 65.02 75.11 2014 2,614 1,985 2,233 88.13 62.11 69.56 2015 2,315 1,423 1,543 70.15 43.51 46.04 2016 2,359 1,261 2,354 58.49 35.96 57.97 2017 2,513 2,037 2,509 68.48 53.10 68.29
Quarterly share prices
Euronext Amsterdam
A shares London Stock Exchange
B shares New York Stock Exchange
A ADSs New York Stock Exchange
B ADSs High € Low € High pence Low pence High $ Low $ High $ Low $
2016 Q1 22.29 16.53 1,757 1,261 50.32 35.80 50.78 35.96 Q2 24.78 20.33 2,062 1,634 55.22 46.42 56.92 47.08 Q3 25.40 20.81 2,163 1,869 56.29 46.57 57.88 49.56 Q4 26.39 22.17 2,359 2,006 54.98 48.07 58.49 50.94
2017 Q1 26.87 23.53 2,404 2,137 56.39 50.32 59.56 53.46 Q2 25.66 22.83 2,254 2,037 56.26 51.08 58.53 53.10 Q3 25.71 22.73 2,307 2,039 60.66 52.44 62.61 53.56 Q4 28.25 25.55 2,513 2,299 66.92 60.05 68.48 61.69
Monthly share prices
Euronext Amsterdam
A shares London Stock Exchange
B shares New York Stock Exchange
A ADSs New York Stock Exchange
B ADSs High € Low € High pence Low pence High $ Low $ High $ Low $
2017 September 25.71 23.09 2,307 2,134 60.66 54.95 62.61 56.44 October 27.00 25.55 2,431 2,299 63.28 60.05 65.60 61.69 November 28.25 25.93 2,513 2,355 65.83 61.46 67.40 63.45 December 28.05 26.74 2,510 2,353 66.92 63.10 68.48 64.56
2018 January 29.15 27.65 2,617 2,480 72.43 66.91 74.60 68.49 February 28.23 24.20 2,482 2,247 69.69 61.02 71.00 61.92
ADDITIONAL INFORMATION SHELL ANNUAL REPORT AND FORM 20-F 2017 220

METHOD OF HOLDING SHARES OR AN INTEREST IN SHARESThere are several ways in which Royal Dutch Shell plc registered shares or an interest inthese shares can be held, including: ■ directly as registered shares either in uncertificated form or in certificated form in a
shareholder’s own name;■ indirectly through Euroclear Nederland (in respect of which the Dutch Securities Giro
Act (“Wet giraal effectenverkeer”) is applicable);■ through the Royal Dutch Shell Corporate Nominee; and■ as a direct or indirect holder of either an A or a B ADS with the Depositary. AMERICAN DEPOSITARY SHARESThe Depositary is the registered shareholder of the shares underlying the A or B ADSsand enjoys the rights of a shareholder under the Articles. Holders of ADSs will not haveshareholder rights. The rights of the holder of an A or a B ADS are specified in therespective Depositary agreements with the Depositary and are summarised below. The Depositary will receive all cash dividends and other cash distributions made on thedeposited shares underlying the ADSs and, where possible and on a reasonable basis, willdistribute such dividends and distributions to holders of ADSs. Rights to purchaseadditional shares will also be made available to the Depositary who may make such rightsavailable to holders of ADSs. All other distributions made on the Company’s shares willbe distributed by the Depositary in any means that the Depositary thinks is equitable andpractical. The Depositary may deduct its fees and expenses and the amount of any taxesowed from any payments to holders and it may sell a holder’s deposited shares to pay anytaxes owed. The Depositary is not responsible if it decides that it is unlawful orimpractical to make a distribution available to holders of ADSs. The Depositary will notify holders of ADSs of shareholders’ meetings of the Companyand will arrange to deliver voting materials to such holders of ADSs if requested by theCompany. Upon request by a holder, the Depositary will endeavour to appoint suchholder as proxy in respect of such holder’s deposited shares entitling such holder toattend and vote at shareholders’ meetings. Holders of ADSs may also instruct theDepositary to vote their deposited securities and the Depositary will try, as far as practicaland lawful, to vote deposited shares in accordance with such instructions. The Companycannot ensure that holders will receive voting materials or otherwise learn of anupcoming shareholders’ meeting in time to ensure that holders can instruct the Depositaryto vote their shares. Upon payment of appropriate fees, expenses and taxes: (i) shareholders may deposit theirshares with the Depositary and receive the corresponding class and amount of ADSs; and(ii) holders of ADSs may surrender their ADSs to the Depositary and have thecorresponding class and amount of shares credited to their account. Further, subject to certain limitations, holders may, at any time, cancel ADSs andwithdraw their underlying shares or have the corresponding class and amount of sharescredited to their account. The Depositary may also deliver ADSs prior to deposit of theunderlying securities subject to certain conditions, including, without limitation, that suchpre-released ADSs are fully collateralised and that the underlying securities are assignedto and held for the account of the Depositary.
FEES PAID BY HOLDERS OF ADSsThe Depositary collects its fees for delivery and surrender of ADSs directly frominvestors depositing shares or surrendering ADSs for the purpose of withdrawal or fromintermediaries acting for them. The Depositary collects fees for making distributions toinvestors by deducting those fees from the amounts distributed or by selling a portion ofdistributable property to pay the fees. The Depositary may generally refuse to providefee-attracting services until its fees for those services are paid. See page 222. REIMBURSEMENTS TO THE COMPANYThe Bank of New York Mellon, as Depositary, has agreed to reimburse the Company forexpenses it incurs that are related maintenance expenses of the ADS programme. TheDepositary has agreed to reimburse the Company for its continuing annual stockexchange listing fees. The Depositary has also agreed to pay certain legal expenses andthe standard out-of-pocket maintenance costs for the ADSs, which consist of the expensesof postage and envelopes for mailing annual and interim financial reports, printing anddistributing dividend cheques, electronic filing of US federal tax information, mailingrequired tax forms, stationery, postage, facsimile and telephone calls. It has also agreed toreimburse the Company annually for certain costs associated with the AGM, investorrelationship programmes and special investor relations promotional activities. There arelimits on the amount of expenses for which the Depositary will reimburse the Company,but the amount of reimbursement available to the Company is not necessarily tied to theamount of fees the Depositary collects from investors. From January 1, 2017, to February16, 2018, the Company received $2,165,198 from the Depositary. SCRIP DIVIDEND PROGRAMMEThe Company operated a Scrip Dividend Programme until the third quarter of 2017which enabled shareholders to increase their shareholding by choosing to receive newshares instead of cash dividends (if approved by the Board). Only new A shares wereissued under the programme, including to shareholders who hold B shares. Moreinformation can be found at www.shell.com/scrip. DIVIDEND REINVESTMENT PLANWith effect from the fourth quarter 2017 interim dividend, the Dividend ReinvestmentPlan (DRIP) provided by Equiniti Financial Services Limited (EFSL), part of the samegroup of companies as Royal Dutch Shell plc’s Registrar, Equiniti, was reintroduced.More information can be found at www.shareview.co.uk/info/drip or by contactingEquiniti. The dividend reinvestment options offered by ABN AMRO Bank N.V. and The Bank ofNew York Mellon were also reintroduced at this time. More information can be found bycontacting the relevant provider.
ADDITIONAL INFORMATION SHELL ANNUAL REPORT AND FORM 20-F 2017 221
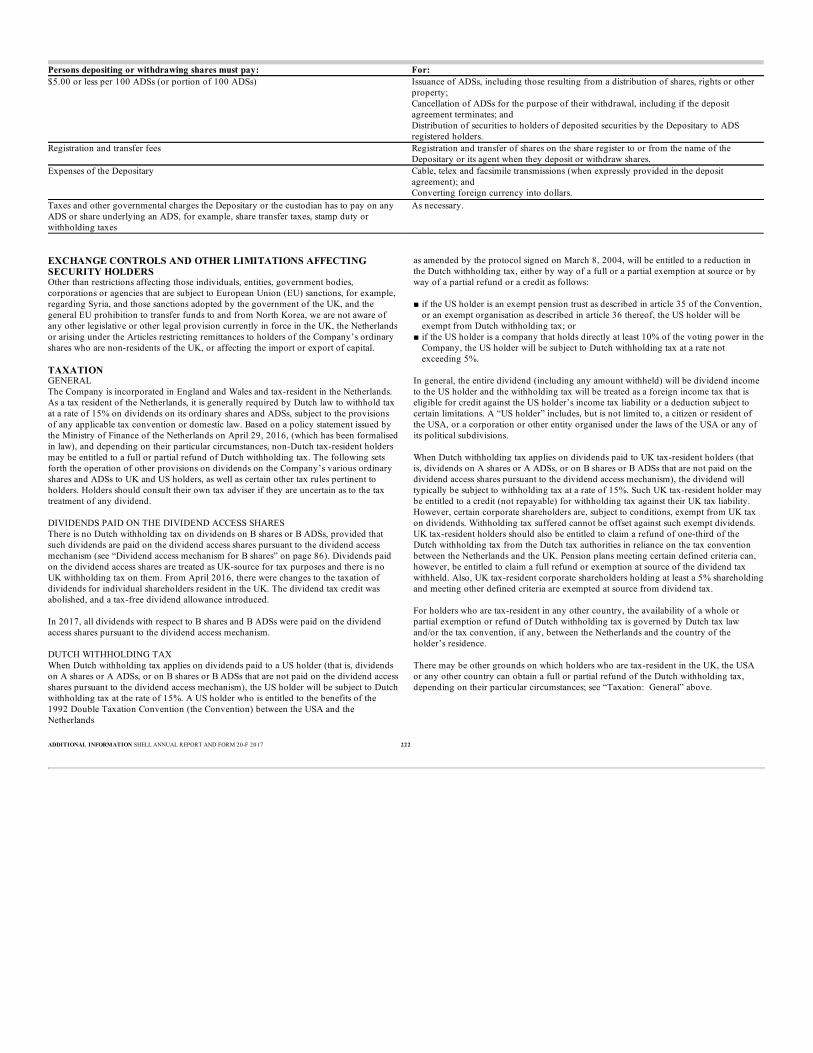
EXCHANGE CONTROLS AND OTHER LIMITATIONS AFFECTINGSECURITY HOLDERSOther than restrictions affecting those individuals, entities, government bodies,corporations or agencies that are subject to European Union (EU) sanctions, for example,regarding Syria, and those sanctions adopted by the government of the UK, and thegeneral EU prohibition to transfer funds to and from North Korea, we are not aware ofany other legislative or other legal provision currently in force in the UK, the Netherlandsor arising under the Articles restricting remittances to holders of the Company’s ordinaryshares who are non-residents of the UK, or affecting the import or export of capital. TAXATIONGENERALThe Company is incorporated in England and Wales and tax-resident in the Netherlands.As a tax resident of the Netherlands, it is generally required by Dutch law to withhold taxat a rate of 15% on dividends on its ordinary shares and ADSs, subject to the provisionsof any applicable tax convention or domestic law. Based on a policy statement issued bythe Ministry of Finance of the Netherlands on April 29, 2016, (which has been formalisedin law), and depending on their particular circumstances, non-Dutch tax-resident holdersmay be entitled to a full or partial refund of Dutch withholding tax. The following setsforth the operation of other provisions on dividends on the Company’s various ordinaryshares and ADSs to UK and US holders, as well as certain other tax rules pertinent toholders. Holders should consult their own tax adviser if they are uncertain as to the taxtreatment of any dividend. DIVIDENDS PAID ON THE DIVIDEND ACCESS SHARESThere is no Dutch withholding tax on dividends on B shares or B ADSs, provided thatsuch dividends are paid on the dividend access shares pursuant to the dividend accessmechanism (see “Dividend access mechanism for B shares” on page 86). Dividends paidon the dividend access shares are treated as UK-source for tax purposes and there is noUK withholding tax on them. From April 2016, there were changes to the taxation ofdividends for individual shareholders resident in the UK. The dividend tax credit wasabolished, and a tax-free dividend allowance introduced. In 2017, all dividends with respect to B shares and B ADSs were paid on the dividendaccess shares pursuant to the dividend access mechanism. DUTCH WITHHOLDING TAXWhen Dutch withholding tax applies on dividends paid to a US holder (that is, dividendson A shares or A ADSs, or on B shares or B ADSs that are not paid on the dividend accessshares pursuant to the dividend access mechanism), the US holder will be subject to Dutchwithholding tax at the rate of 15%. A US holder who is entitled to the benefits of the1992 Double Taxation Convention (the Convention) between the USA and theNetherlands
as amended by the protocol signed on March 8, 2004, will be entitled to a reduction inthe Dutch withholding tax, either by way of a full or a partial exemption at source or byway of a partial refund or a credit as follows: ■ if the US holder is an exempt pension trust as described in article 35 of the Convention,
or an exempt organisation as described in article 36 thereof, the US holder will beexempt from Dutch withholding tax; or
■ if the US holder is a company that holds directly at least 10% of the voting power in theCompany, the US holder will be subject to Dutch withholding tax at a rate notexceeding 5%.
In general, the entire dividend (including any amount withheld) will be dividend incometo the US holder and the withholding tax will be treated as a foreign income tax that iseligible for credit against the US holder’s income tax liability or a deduction subject tocertain limitations. A “US holder” includes, but is not limited to, a citizen or resident ofthe USA, or a corporation or other entity organised under the laws of the USA or any ofits political subdivisions. When Dutch withholding tax applies on dividends paid to UK tax-resident holders (thatis, dividends on A shares or A ADSs, or on B shares or B ADSs that are not paid on thedividend access shares pursuant to the dividend access mechanism), the dividend willtypically be subject to withholding tax at a rate of 15%. Such UK tax-resident holder maybe entitled to a credit (not repayable) for withholding tax against their UK tax liability.However, certain corporate shareholders are, subject to conditions, exempt from UK taxon dividends. Withholding tax suffered cannot be offset against such exempt dividends.UK tax-resident holders should also be entitled to claim a refund of one-third of theDutch withholding tax from the Dutch tax authorities in reliance on the tax conventionbetween the Netherlands and the UK. Pension plans meeting certain defined criteria can,however, be entitled to claim a full refund or exemption at source of the dividend taxwithheld. Also, UK tax-resident corporate shareholders holding at least a 5% shareholdingand meeting other defined criteria are exempted at source from dividend tax. For holders who are tax-resident in any other country, the availability of a whole orpartial exemption or refund of Dutch withholding tax is governed by Dutch tax lawand/or the tax convention, if any, between the Netherlands and the country of theholder’s residence. There may be other grounds on which holders who are tax-resident in the UK, the USAor any other country can obtain a full or partial refund of the Dutch withholding tax,depending on their particular circumstances; see “Taxation: General” above.
Persons depositing or withdrawing shares must pay: For:$5.00 or less per 100 ADSs (or portion of 100 ADSs) Issuance of ADSs, including those resulting from a distribution of shares, rights or other
property; Cancellation of ADSs for the purpose of their withdrawal, including if the deposit
agreement terminates; and Distribution of securities to holders of deposited securities by the Depositary to ADS
registered holders.Registration and transfer fees Registration and transfer of shares on the share register to or from the name of the
Depositary or its agent when they deposit or withdraw shares.Expenses of the Depositary Cable, telex and facsimile transmissions (when expressly provided in the deposit
agreement); andConverting foreign currency into dollars.
Taxes and other governmental charges the Depositary or the custodian has to pay on anyADS or share underlying an ADS, for example, share transfer taxes, stamp duty orwithholding taxes
As necessary.
ADDITIONAL INFORMATION SHELL ANNUAL REPORT AND FORM 20-F 2017 222

DUTCH CAPITAL GAINS TAXATIONCapital gains on the sale of shares of a Dutch tax-resident company by a US holder aregenerally not subject to taxation by the Netherlands unless the US holder has a permanentestablishment therein and the capital gain is derived from the sale of shares that are part ofthe business property of the permanent establishment. DUTCH SUCCESSION DUTY AND GIFT TAXESShares of a Dutch tax-resident company held by an individual who is not a resident or adeemed resident of the Netherlands will generally not be subject to succession duty in theNetherlands on the individual’s death. A gift of shares of a Dutch tax-resident company by an individual who is not a resident ora deemed resident of the Netherlands is generally not subject to Dutch gift tax. UK STAMP DUTY AND STAMP DUTY RESERVE TAX Sales or transfers of the Company’s ordinary shares within a clearance service (such asEuroclear Nederland) or of the Company’s ADSs within the ADS depositary receiptssystem will not give rise to a stamp duty reserve tax (SDRT) liability and should not inpractice require the payment of UK stamp duty. The transfer of the Company’s ordinary shares to a clearance service (such as EuroclearNederland) or to an issuer of depositary shares (such as ADSs) will generally give rise to aUK stamp duty or SDRT liability at the rate of 1.5% of consideration given or, if none, ofthe value of the shares. A sale of the Company’s ordinary shares that are not held within aclearance service (for example, settled through the UK’s CREST system of paperlesstransfers) will generally be subject to UK stamp duty or SDRT at the rate of 0.5% of theamount of the consideration, normally paid by the purchaser.
CAPITAL GAINS TAXFor the purposes of UK capital gains tax, the market values [A] of the shares of theformer public parent companies of the Royal Dutch/Shell Group at the relevant dateswere:
£ March 31, 1982 July 20, 2005
Royal Dutch Petroleum Company (N.V. Koninklijke Nederlandsche Petroleum Maatschappij) which ceased to exist on December 21, 2005 1.1349 17.6625 The “Shell” Transport and Trading Company, p.l.c. which delisted on July 19, 2005 1.4502 Not applicable[A] Restated where applicable to reflect all capitalisation issues since the relevant date. This includes the change in the capitalstructure in 2005, when Royal Dutch Shell plc became the single parent company of Royal Dutch Petroleum Company and ofThe “Shell” Transport and Trading Company, p.l.c., now The Shell Transport and Trading Company Limited, and one share inRoyal Dutch Petroleum Company was exchanged for two Royal Dutch Shell plc A shares and one share in The “Shell”Transport and Trading Company, p.l.c. was exchanged for 0.287333066 Royal Dutch Shell plc B shares.
ADDITIONAL INFORMATION SHELL ANNUAL REPORT AND FORM 20-F 2017 223

In accordance with our General Business Principles and Code of Conduct, Shell seeks tocomply with all applicable international trade laws including applicable sanctions andembargoes. The activities listed below have been conducted outside the USA by non-US affiliates ofRoyal Dutch Shell plc. None of the payments disclosed below were made in US dollars,nor are any of the balances disclosed below held in US dollars; however, for disclosurepurposes, all have been converted into US dollars at the appropriate exchange rate. We donot believe that any of the transactions or activities listed below violated US sanctions. At December 31, 2017, we have a receivable of $10.5 million outstanding with theNational Iranian Oil Company (NIOC) associated with our previous upstream activitiesconducted prior to the imposition of European Union sanctions. In 2017, we agreed to extend the term of a memorandum of understanding and a separateconfidentiality agreement, each originally signed in 2016, with NIOC to cover a jointreview of a number of oil and gas opportunities. In April 2017, we entered into aconfidentiality and restricted use agreement with the National Petrochemical Company(NPC) regarding a potential midstream opportunity in Iran. In August 2017, we signed anamendment to extend the term of a non-binding letter of intent that was signed in 2016with NPC to cover a joint review of opportunities in the Iranian petrochemicals sector. InAugust 2017, we entered into a technology licence agreement with PetrochemicalIndustries Design and Engineering Company (PIDEC) to provide licence and engineeringservices to Abadan Oil Refinery Company (AORC) in relation to Cansolv sulphur dioxide(SO2) scrubbing technology, as well as a separate end-user licence agreement with AORCfor a continuing licence for the Cansolv SO2 technology once PIDEC’s work at Abadanhas been completed. In addition, a separate agreement was signed at the same timebetween Shell, the Iran branch of Shell Development B.V. (SDI) and PIDEC, for thearrangement of payments due under the licence and engineering agreement to be made toSDI in Iran. There was no gross revenue or net profit associated with these agreements. In December 2016, we entered into a technology licence agreement with Hamedan IbnSina Petrochemical Company for a Shell ethylene process, and during 2017 thisgenerated gross revenue of $6.3 million and a net profit of $0.2 million. Hamedan IbnSina Petrochemical Company payments were made into our account at Karafarin Bank. In 2017, we received gross revenue of $236,602 into our account at Karafarin Bank fromBank Mellat in relation to advisory services provided to Marun Petrochemical Company,pursuant to an advisory agreement entered into in June 2017. No net profit was associatedwith these services in 2017. In 2017, two oil cargoes, which we purchased from NIOC in December 2016, weresubsequently sold to a Shell refinery, resulting in gross revenue of
$212 million and net profit of $3.4 million. In 2017, we purchased oil cargoes fromNIOC, which were subsequently sold to a Shell refinery, resulting in gross revenue of$221 million and net profit of $7.5 million. Freight and ancillary services pertaining tothese cargoes, amounting to approximately $11 million and $3 million, have not beensettled with NIOC and National Iranian Tanker Company, respectively. Shell mayconsider future business opportunities with NIOC, including the purchase and trading ofoil, however no opportunities are currently being contemplated. In 2017, we paid $13 for a 2013 corporate income tax claim, $84 in stamp duty inrelation to a 2008/2009 value-added tax claim and $818 for a 2013 value-added taxclaim to the Iranian Ministry of Finance, through our Iranian accountant Bayat Rayan.There was no gross revenue or net profit associated with these transactions. In 2017, we paid $7,579 to the Iranian Civil Aviation Authority for the clearance ofoverflight permits for Shell aircraft over Iranian airspace. There was no gross revenue ornet profit associated with these transactions. On occasion, our aircraft may be routed overIran and therefore these payments may continue in the future. In 2017, Shell employees met with Iranian officials in Iran. In relation to these travellingShell employees, $21,411 was paid to Iranian authorities for visas, airport services andexit fees; $187 was paid to Bimeh Insurance Company for travel insurance; $5,637 waspaid to Iranian airlines for flight tickets; and $298 was paid to Iranian hotels. We alsodiscovered $224 in travel visa costs in relation to 2016 that were not previously disclosed.We also paid $127 to the Iranian embassy in the Netherlands to ratify documents. Inaddition, we paid $28,099 in conference registration fees for conferences in Iran attendedby Shell employees. The conferences attended were the Petroleum Conference – Iran2017; the Iran Renewable Energy Commercial Conference; the Iranian Petroleum andEnergy Club Congress and Exhibition; and the Iran Petrochemical Forum. There was nogross revenue or net profit associated with these transactions. We expect to continuediscussions with Iranian officials and therefore similar payments may continue in thefuture. In 2017, we provided downstream retail services to the Iranian Embassy in Argentina.This transaction generated gross revenue of $441 and an estimated net profit of $63. Wehave no contractual agreement with this embassy. We maintain accounts with Karafarin Bank where our cash deposits (balance of $8.4million at December 31, 2017) generated non-taxable interest income of $0.4 million in2017, and we paid $450 in bank charges. We have made payments amounting to $1.2million through our account in Karafarin Bank to a variety of non-sanctioned parties. Wemade a bank transfer of $1,164 to test the ability to transfer funds from our KarafarinBank account to Syndicate Bank in India.
Section 13(R) of the US Securities Exchange Act of 1934 disclosure
ADDITIONAL INFORMATION SHELL ANNUAL REPORT AND FORM 20-F 2017 224

These non-GAAP measures, also known as alternative performance measures, arefinancial measures other than those defined in International Financial Reporting Standardswhich Shell considers provide useful information. EARNINGS ON A CURRENT COST OF SUPPLIES BASISSegment earnings are presented on a current cost of supplies basis (CCS earnings), whichis the earnings measure used by the Chief Executive Officer for the purposes of makingdecisions about allocating resources and assessing performance. On this basis, thepurchase price of volumes sold during the period is based on the current cost of suppliesduring the same period after making allowance for the tax effect. CCS earnings thereforeexclude the effect of changes in the oil price on inventory carrying amounts. The currentcost of supplies adjustment does not impact Cash flow from operating activities in the“Consolidated Statement of Cash Flows”.
Reconciliation of CCS earnings to income for the period $ million 2017 2016 2015
Earnings on a current cost of supplies basis (CCS earnings) 12,471 3,692 4,155 Attributable to non-controlling interest (390 ) (159 ) (313 )Earnings on a current cost of supplies basis attributable to Royal Dutch Shell plc shareholders 12,081 3,533 3,842 Current cost of supplies adjustment 964 1,085 (1,955 )Non-controlling interest (68 ) (43 ) 52 Income attributable to Royal Dutch Shell plc shareholders 12,977 4,575 1,939 Non-controlling interest 458 202 261 Income for the period 13,435 4,777 2,200 CAPITAL INVESTMENTCapital investment is a measure used to make decisions about allocating resources andassessing performance.
Capital investment reconciliation $ million 2017 2016 2015
Capital expenditure [A] 20,845 22,116 26,131 Capital investment related to the acquisition of BG Group plc — 52,904 — Investments in joint ventures and associates [A] 595 1,330 896 Exploration expense, excluding exploration wells written off 1,048 1,274 2,948 Finance leases 1,074 2,343 91 Other 444 (90 ) (1,205 )Capital investment 24,006 79,877 28,861 Of which
Integrated Gas 3,827 26,214 5,178 Upstream 13,648 47,507 18,349 Downstream 6,416 6,057 5,119 Corporate 115 99 215
[A] Included within Cash flow from investing activities in the “Consolidated Statement of Cash Flows”.
Organic capital investment includes capital expenditure and new finance leases of existingsubsidiaries, investments in existing joint ventures and associates, and exploration expense(excluding well write-offs). Inorganic capital investment includes investments related tothe acquisition of businesses, investments in new joint ventures and associates, and newacreage.
Organic and inorganic capital investment $ million 2017 2016 2015 Organic capital investment 22,177 26,913 28,403 Inorganic capital investment 1,829 52,964 458 Total capital investment 24,006 79,877 28,861 DIVESTMENTSDivestments is a measure used to monitor the progress of our divestment programme.This measure comprises proceeds from sale of property, plant and equipment andbusinesses, joint ventures and associates, and other Integrated Gas, Upstream andDownstream investments, adjusted onto an accruals basis and for any share considerationreceived or contingent consideration initially recognised upon the related divestment, aswell as proceeds from sale of interests in entities while retaining control (for example,proceeds from sale of interests in Shell Midstream Partners, L.P.).
Divestments reconciliation $ million 2017 2016 2015
Proceeds from sale of property, plant and equipment and businesses [A] 8,808 2,072 4,720 Proceeds from sale of joint ventures and associates [A] 2,177 1,565 276 Share and contingent consideration [B] 3,046 275 — Proceeds from sale of interests in entities while retaining control [C] 278 1,108 595 Other 3,031 [D] (36 ) (51 )Divestments 17,340 4,984 5,540 Of which
Integrated Gas 3,077 352 269 Upstream 11,542 1,726 2,478 Downstream 2,703 2,889 2,282 Corporate 18 17 511
[A] Included within Cash flow from investing activities in the “Consolidated Statement of Cash Flows”.[B] With effect from 2017, this is valued at the date of the related divestment, instead of when these shares are disposed of orthe contingent consideration is realised. There is also no impact on divestments as a result of any revaluation. Comparativeinformation, which only affects the Upstream segment in 2016, has been adjusted. In 2017, it mainly comprises $2,829 millionfor shares in Canadian Natural Resources Limited received as partial consideration in the oil sands divestment (see Note 8 tothe “Consolidated Financial Statements” on page 153).[C] Included within “Change in non-controlling interest” in Cash flow from financing activities in the “Consolidated Statementof Cash Flows”.[D] Includes proceeds of $2,635 million from the sale of shares in Woodside Petroleum Limited.
Non-GAAP measures reconciliations
ADDITIONAL INFORMATION SHELL ANNUAL REPORT AND FORM 20-F 2017 225

OPERATING EXPENSESOperating expenses is a measure of Shell’s cost management performance, comprisingitems from the “Consolidated Statement of Income” as follows.
Operating expenses $ million 2017 2016 2015
Production and manufacturing expenses 26,652 28,434 28,095 Selling, distribution and administrative expenses 10,509 12,101 11,956 Research and development 922 1,014 1,093 Total 38,083 41,549 41,144 Of which
Integrated Gas 5,471 6,479 4,088 Upstream 12,656 14,501 15,740 Downstream 19,583 19,681 20,816 Corporate 373 888 500
RETURN ON AVERAGE CAPITAL EMPLOYEDReturn on average capital employed (ROACE) measures the efficiency of our utilisationof the capital that we employ. In this calculation, ROACE is defined as income for theperiod, adjusted for after-tax interest expense, as a percentage of the average capitalemployed for the period. Capital employed consists of total equity, current debt and non-current debt.
Calculation of return on average capital employed $ million 2017 2016 2015
Income for the period 13,435 4,777 2,200 Interest expense after tax 2,995 2,730 2,030 Income before interest expense 16,430 7,507 4,230 Capital employed – opening 280,988 222,500 218,326 Capital employed – closing 283,477 280,988 222,500 Capital employed – average 282,233 251,744 220,413 ROACE 5.8% 3.0% 1.9% FREE CASH FLOWFree cash flow is used to evaluate cash available for financing activities, includingdividend payments, after investment in maintaining and growing our business. It isdefined as follows.
Free cash flow $ million 2017 2016 2015
Cash flow from operating activities 35,650 20,615 29,810 Cash flow from investing activities (8,029 ) (30,963 ) (22,407 )Free cash flow 27,621 (10,348 ) 7,403
ADDITIONAL INFORMATION SHELL ANNUAL REPORT AND FORM 20-F 2017 226

Index to the Exhibits
Exhibit No. Description Page1.1 Memorandum of Association of Royal Dutch Shell plc, together with a special resolution of Royal Dutch Shell plc dated May 18, 2010, (incorporated by
reference to Exhibit 4.12 to the Registration Statement on Form F-3 (No. 333-177588) of Royal Dutch Shell plc filed with the US Securities and ExchangeCommission on October 28, 2011).
1.2 Articles of Association of Royal Dutch Shell plc, together with a special resolution of Royal Dutch Shell plc dated May 18, 2010, (incorporated by
reference to Exhibit 4.11 to the Registration Statement on Form F-3 (No. 333-177588) of Royal Dutch Shell plc filed with the US Securities and ExchangeCommission on October 28, 2011).
2.1 Amended and Restated Dividend Access Trust Deed dated December 22, 2015, (incorporated by reference to Exhibit 2 to the Annual Report for the fiscal
year ended December 31, 2015, on Form 20-F (File No. 001-32575) of Royal Dutch Shell plc filed with the US Securities and Exchange Commission onMarch 10, 2016).
4.1 Shell Provident Fund Regulations and Trust Agreement, as amended (incorporated by reference to Exhibit 4.7 to the Post-Effective Amendment to
Registration Statement on Form S-8 (No. 333-126715) of Royal Dutch Shell plc filed with the US Securities and Exchange Commission on June 18,2007).
4.2 Form of Director Indemnity Agreement (incorporated by reference to Exhibit 4.3 to the Annual Report for the fiscal year ended December 31, 2005, on
Form 20-F (File No. 001-32575) of Royal Dutch Shell plc filed with the US Securities and Exchange Commission on March 13, 2006).
4.3 Senior Debt Securities Indenture dated June 27, 2006, among Shell International Finance B.V., as issuer, Royal Dutch Shell plc, as guarantor, and
Deutsche Bank Trust Company Americas, as trustee (incorporated by reference to Exhibit 4.3 to the Registration Statement on Form F-3 (No. 333-126726) of Royal Dutch Shell plc filed with the US Securities and Exchange Commission on July 20, 2005, amended from then to be dated as of June 27,2006, and with the parties’ signatures).
4.4 Form of contract of employment for Executive Directors (incorporated by reference to Exhibit 4.5 to the Annual Report for fiscal year ended December
31, 2013, on Form 20-F (File No. 001-32575) of Royal Dutch Shell plc filed with the US Securities and Exchange Commission on March 13, 2014).
4.5 Form of Letter of appointments for Non-executive Directors (incorporated by reference to Exhibit 4.11 to the Annual Report for fiscal year ended
December 31, 2006, on Form 20-F (File No. 001-32575) of Royal Dutch Shell plc filed with the US Securities and Exchange Commission on March 13,2007).
7.1 Calculation of Ratio of Earnings to Fixed Charges. E1 7.2 Calculation of Return on Average Capital Employed (ROACE) (incorporated by reference to page 226 herein). 7.3 Calculation of gearing (incorporated by reference to page 22 and Note 14 to the Consolidated Financial Statements on page 158 herein). 8.1 Significant Shell subsidiaries at December 31, 2017. E2 12.1 Section 302 Certification of Royal Dutch Shell plc. E21 12.2 Section 302 Certification of Royal Dutch Shell plc. E22 13.1 Section 906 Certification of Royal Dutch Shell plc. E23 99.1 Consent of Ernst & Young LLP, London, United Kingdom. E24 99.2 Consent of PricewaterhouseCoopers LLP, London, United Kingdom. E25 99.3 Consent of Ernst & Young LLP, London, United Kingdom, relating to the Royal Dutch Shell Dividend Access Trust. E26 99.4 Consent of PricewaterhouseCoopers CI LLP, Jersey, Channel Islands, relating to the Royal Dutch Shell Dividend Access Trust. E27 101 Interactive data files.
ADDITIONAL INFORMATION SHELL ANNUAL REPORT AND FORM 20-F 2017 227

Signatures
The registrant hereby certifies that it meets all of the requirements for filing on Form 20-F and that it has duly caused and authorised the undersigned to sign the Annual Report onForm 20-F on its behalf.
Royal Dutch Shell plc /s/ Ben van Beurden Ben van Beurden Chief Executive Officer March 14, 2018
ADDITIONAL INFORMATION SHELL ANNUAL REPORT AND FORM 20-F 2017 228

FINANCIAL CALENDAR IN 2018 The Annual General Meeting will be held on May 22, 2018. 2017 Fourth 2018 First 2018 Second 2018 Third quarter [A] quarter [B] quarter [B] quarter [B] Results announcements February 1 April 26 July 26 November 1 Interim dividend timetable Announcement date February 1 [C] April 26 July 26 November 1 Ex-dividend date [D] February 15 May 10 August 9 November 15 Record date February 16 May 11 August 10 November 16 Closing date for currency election [E] March 2 May 25 August 24 November 30 Euro and sterling equivalents announcement date March 9 June 4 September 3 December 6 Payment date March 26 June 18 September 17 December 19
[A] In respect of the financial year ended December 31, 2017.[B] In respect of the financial year ending December 31, 2018.[C] The Directors do not propose to recommend any further distribution in respect of 2017.[D] The New York Stock Exchange (NYSE), with effect from September 5, 2017, reduced the standard settlement cycle in accordance with the SEC amendments to Exchange Act Rule 15c6-1(a). Under these rules, regular settlement willoccur on a T+2 basis for trades occurring on or after the SEC's implementation date of September 5, 2017. As a result, RDS A and B ADSs traded on the NYSE markets will now settle in line with RDS A and B shares traded on Europeanmarkets, which moved to a T+2 settlement basis for trades in 2014, resulting in the same ex-dividend date for RDS A and B shares, and RDS A and B ADSs. Record dates will not change.[E] A different currency election date may apply to shareholders holding shares in a securities account with a bank or financial institution ultimately through Euroclear Nederland. This may also apply to other shareholders who do not holdtheir shares either directly on the Register of Members or in the corporate sponsored nominee arrangement. Shareholders can contact their broker, financial intermediary, bank or financial institution for the election deadline that applies.
REGISTERED OFFICE SHAREHOLDER RELATIONS INVESTOR RELATIONS Royal Dutch Shell plc Royal Dutch Shell plc Royal Dutch Shell plc Shell Centre Carel van Bylandtlaan 30 PO Box 162 London SE1 7NA 2596 HR The Hague 2501 AN The Hague United Kingdom The Netherlands The Netherlands +31 (0)70 377 1365 +31 (0)70 377 4540 Registered in England and Wales +31 (0)70 377 4088 or Company number 4366849 or Shell Oil Company Registered with the Dutch Trade Register Royal Dutch Shell plc Investor Relations under number 34179503 Shell Centre 150 N Dairy Ashford London SE1 7NA Houston, TX 77079 Headquarters United Kingdom USA Royal Dutch Shell plc +44 (0)20 7934 3363 +1 832 337 2034 Carel van Bylandtlaan 30 2596 HR The Hague [email protected] [email protected] The Netherlands www.shell.com/shareholder [email protected] www.shell.com/investor
SHARE REGISTRATION AMERICAN DEPOSITARY REPORT ORDERING Equiniti SHARES (ADSs) [email protected] Aspect House BNY Mellon Shareowner Services Spencer Road PO Box 505000 Annual Report/20-F service for US residents Lancing Louisville, KY 40233-5000 +1 888 301 0504 West Sussex BN99 6DA USA United Kingdom 0800 169 1679 (UK) Overnight correspondence to: +44 (0)121 415 7073 BNY Mellon Shareowner Services 462 South 4th Street Suite 1600 For online information about your holding Louisville KY 40202 and to change the way you receive your USA company documents: www.shareview.co.uk +1 888 737 2377 (USA) +1 201 680 6825 (international)
[email protected] www.mybnymdr.com

All our reports are available athttp://reports.shell.com
Download our apps atwww.shell.com/mobile_and_apps
Check our latest news@Shell
■ Comprehensive financial information on our
activities throughout 2017■ Detailed operational information including
maps■ Report on our progress in contributing
to sustainable development
■ Company news■ Service-station locations
■ Follow @Shell on Twitter■ www.facebook.com/shell

Exhibit 7.1
Calculation of ratio of earnings to fixed charges $ million 2017 2016 2015 2014 2013
Pre-tax income from continuing operations before income from equity investees 13,905 2,061 (1,480 ) 22,198 26,317 Total fixed charges 4,270 3,508 2,495 2,113 1,710 Distributed income from equity investees 4,998 3,820 4,627 6,902 7,117 Interest capitalised (622 ) (725 ) (839 ) (757 ) (762 )Total earnings 22,551 8,664 4,803 30,456 34,382 Interest expensed and capitalised 3,562 2,736 1,795 1,522 1,412 Interest within rental expense 708 772 700 591 298 Total fixed charges 4,270 3,508 2,495 2,113 1,710 Ratio of earnings to fixed charges 5.28 2.47 1.93 14.41 20.11 For the purposes of the table above, earnings consist of pre-tax income from continuing operations (before adjustment for non-controlling interest) plus fixed charges (excludingcapitalised interest) less undistributed income of joint ventures and associates. Fixed charges consist of expensed and capitalised interest (excluding accretion expense) plus interestwithin rental expenses (for operating leases).
ADDITIONAL INFORMATION SHELL ANNUAL REPORT AND FORM 20-F 2017 E1

Exhibit 8.1
SIGNIFICANT SUBSIDIARIES AND OTHER RELATED UNDERTAKINGS (AUDITED)Significant subsidiaries and other related undertakings at December 31, 2017, are set out below. Significant subsidiaries are shaded and each meets the threshold specified under rule 1-02(w) of Regulation S-X. Shell’s percentage of share capital is shown to the nearest whole number. All subsidiaries have been included in the “Consolidated Financial Statements” onpages 137-178, and those held directly by the Company are marked with the footnote [a]. A number of the entities listed are dormant or not yet operational. Entities that areproportionately consolidated are identified by the footnote [b]. Shell-owned shares are ordinary (voting) shares unless identified with one of the following annotations against thecompany name: [c] Membership interest; [d] Partnership capital; [e] Non-redeemable; [f] Ordinary, Membership interest; [g] Ordinary, Non-redeemable; [h] Ordinary, Partnershipcapital; [i] Ordinary, Redeemable; [j] Ordinary, Redeemable, Non-redeemable; and [k] Redeemable, Non-redeemable.
Company by country of incorporation Address of registered office %ARGENTINA
Deheza S.A.I.C.F. e I. Av. Pte. Roque Sáenz Pena 788, 4th floor, Buenos Aires, 1383 100Energina Compañía Argentina de Petróleo S.A. Av. Pte. Roque Sáenz Pena 788, 4th floor, Buenos Aires, 1383 100Estación Lima S.A. Av. Pte. Roque Sáenz Pena 788, 4th floor, Buenos Aires, 1383 100O & G Developments Ltd S.A. Av. Pte. Roque Sáenz Pena 788, 4th floor, Buenos Aires, 1383 100Shell Compañía Argentina de Petróleo S.A. Av. Pte. Roque Sáenz Pena 788, 4th floor, Buenos Aires, 1383 100Shell Gas S.A. Av. Pte. Roque Sáenz Pena 788, 4th floor, Buenos Aires, 1383 100
AUSTRALIA
A.C.N. 081 118 292 Pty Limited Level 30, 275 George Street, Brisbane, QLD 4000 100Arrow Energy Holdings Pty Ltd Level 39, 111 Eagle Street, Brisbane, QLD 4000 50Austen & Butta Pty Ltd Shell House, 562 Wellington Street, Perth, WA 6000 100Australian Oil & Gas Corporation Pty Ltd Level 30, 275 George Street, Brisbane, QLD 4000 100BC 789 Holdings Pty Ltd Level 30, 275 George Street, Brisbane, QLD 4000 100BG CPS Pty Limited Level 30, 275 George Street, Brisbane, QLD 4000 100BG Pacific Holdings Pty Ltd Level 30, 275 George Street, Brisbane, QLD 4000 100BNG (Surat) Pty Ltd Level 30, 275 George Street, Brisbane, QLD 4000 100Condamine 1 Pty Ltd Level 30, 275 George Street, Brisbane, QLD 4000 100Condamine 2 Pty Ltd Level 30, 275 George Street, Brisbane, QLD 4000 100Condamine 3 Pty Ltd Level 30, 275 George Street, Brisbane, QLD 4000 100Condamine 4 Pty Ltd Level 30, 275 George Street, Brisbane, QLD 4000 100Condamine Power Station Pty Ltd Level 30, 275 George Street, Brisbane, QLD 4000 100Fuelink Pty Ltd Shell House, 562 Wellington Street, Perth, WA 6000 100Interstate Pipelines Pty Limited Level 30, 275 George Street, Brisbane, QLD 4000 100Monash Energy Pty Ltd Level 14, 390 St Kilda Road, South Melbourne, VIC, 3004 50New South Oil Pty Ltd Level 30, 275 George Street, Brisbane, QLD 4000 100North West Shelf LNG Pty Ltd Shell House, 562 Wellington Street, Perth, WA 6000 100OME Resources Australia Pty Ltd Level 30, 275 George Street, Brisbane, QLD 4000 100Petroleum Exploration Australia Pty Limited Level 30, 275 George Street, Brisbane, QLD 4000 100Petroleum Resources (Thailand) Pty. Limited Level 30, 275 George Street, Brisbane, QLD 4000 100Provident & Pensions Holdings Proprietary Limited Shell House, 562 Wellington Street, Perth, WA 6000 100Pure Energy Resources Pty Limited Level 30, 275 George Street, Brisbane, QLD 4000 100QCLNG Operating Company Pty Ltd [i] Level 30, 275 George Street, Brisbane, QLD 4000 75QCLNG Pty Ltd Level 30, 275 George Street, Brisbane, QLD 4000 100QGC (B7) Pty Ltd Level 30, 275 George Street, Brisbane, QLD 4000 100QGC (Exploration) Pty Ltd Level 30, 275 George Street, Brisbane, QLD 4000 100QGC (Infrastructure) Pty Ltd Level 30, 275 George Street, Brisbane, QLD 4000 100QGC Common Facilities Company Pty Ltd Level 30, 275 George Street, Brisbane, QLD 4000 100QGC Holdings 2 Pty Ltd Level 30, 275 George Street, Brisbane, QLD 4000 100QGC Holdings 3 Pty Ltd Level 30, 275 George Street, Brisbane, QLD 4000 100QGC Holdings 4 Pty Ltd Level 30, 275 George Street, Brisbane, QLD 4000 100QGC Holdings 5 Pty Ltd Level 30, 275 George Street, Brisbane, QLD 4000 100QGC Holdings 6 Pty Ltd Level 30, 275 George Street, Brisbane, QLD 4000 100QGC Holdings 7 Pty Ltd Level 30, 275 George Street, Brisbane, QLD 4000 100QGC Holdings 8 Pty Ltd Level 30, 275 George Street, Brisbane, QLD 4000 100QGC Holdings 9 Pty Ltd Level 30, 275 George Street, Brisbane, QLD 4000 100QGC Midstream Holdings Pty Ltd Level 30, 275 George Street, Brisbane, QLD 4000 100QGC Midstream Investments Pty Ltd Level 30, 275 George Street, Brisbane, QLD 4000 100QGC Midstream Land Pty Ltd Level 30, 275 George Street, Brisbane, QLD 4000 100QGC Midstream Limited Partnership Level 42, Bourke Place, 600 Bourke Street, Melbourne, VIC 3000 100QGC Midstream Services Pty Ltd Level 30, 275 George Street, Brisbane, QLD 4000 100QGC Northern Forestry Pty Ltd Level 30, 275 George Street, Brisbane, QLD 4000 100QGC Pty Limited Level 30, 275 George Street, Brisbane, QLD 4000 100QGC Sales Qld Pty Ltd Level 30, 275 George Street, Brisbane, QLD 4000 100QGC Train 1 Pty Ltd Level 30, 275 George Street, Brisbane, QLD 4000 100
ADDITIONAL INFORMATION SHELL ANNUAL REPORT AND FORM 20-F 2017 E2

Company by country of incorporation Address of registered office %QGC Train 1 Tolling Pty Ltd Level 30, 275 George Street, Brisbane, QLD 4000 100QGC Train 1 UJV Manager Pty Ltd Level 30, 275 George Street, Brisbane, QLD 4000 100QGC Train 2 Pty Ltd Level 30, 275 George Street, Brisbane, QLD 4000 100QGC Train 2 Tolling No.2 Pty Ltd Level 30, 275 George Street, Brisbane, QLD 4000 100QGC Train 2 Tolling Pty Ltd Level 30, 275 George Street, Brisbane, QLD 4000 100QGC Train 2 UJV Manager Pty Ltd Level 30, 275 George Street, Brisbane, QLD 4000 100QGC Upstream Holdings Pty Ltd Level 30, 275 George Street, Brisbane, QLD 4000 100QGC Upstream Finance Pty Ltd Level 30, 275 George Street, Brisbane, QLD 4000 100QGC Upstream Investments Pty Ltd Level 30, 275 George Street, Brisbane, QLD 4000 100QGC Upstream Limited Partnership Level 42, Bourke Place, 600 Bourke Street, Melbourne, VIC 3000 100Queensland Gas Company Pty Ltd Level 30, 275 George Street, Brisbane, QLD 4000 100Roma Petroleum Pty Limited Level 30, 275 George Street, Brisbane, QLD 4000 100SASF Pty Ltd Shell House, 562 Wellington Street, Perth, WA 6000 100SGA (Queensland) Pty Ltd Level 30, 275 George Street, Brisbane, QLD 4000 100Sgai Pty Limited Level 30, 275 George Street, Brisbane, QLD 4000 100Shell Australia FLNG Pty Ltd Shell House, 562 Wellington Street, Perth, WA 6000 100Shell Australia Lubricants Production Pty Ltd Shell House, 562 Wellington Street, Perth, WA 6000 100Shell Australia Pty Ltd Shell House, 562 Wellington Street, Perth, WA 6000 100Shell Australia Services Company Pty Ltd Shell House, 562 Wellington Street, Perth, WA 6000 100Shell Custodian Pty Ltd Shell House, 562 Wellington Street, Perth, WA 6000 100Shell Development (PSC19) Pty Ltd Shell House, 562 Wellington Street, Perth, WA 6000 100Shell Development (PSC20) Pty Ltd Shell House, 562 Wellington Street, Perth, WA 6000 100Shell Energy Australia Pty Ltd Level 30, 275 George Street, Brisbane, QLD 4000 100Shell Energy Holdings Australia Limited Shell House, 562 Wellington Street, Perth, WA 6000 100Shell Energy Investments Australia Pty Ltd Shell House, 562 Wellington Street, Perth, WA 6000 100Shell Global Solutions Australia Pty Ltd Shell House, 562 Wellington Street, Perth, WA 6000 100Shell Tankers Australia Pty Ltd Shell House, 562 Wellington Street, Perth, WA 6000 100Starzap Pty Ltd Level 30, 275 George Street, Brisbane, QLD 4000 100Sunshine 685 Pty Limited Level 30, 275 George Street, Brisbane, QLD 4000 100Sunshine Gas Pty Limited Level 30, 275 George Street, Brisbane, QLD 4000 100Trident LNG Shipping Services Pty Ltd Shell House, 562 Wellington Street, Perth, WA 6000 100Trident Shipping Services Pty Ltd Shell House, 562 Wellington Street, Perth, WA 6000 100Walloons Coal Seam Gas Company Pty Limited [i] Level 30, 275 George Street, Brisbane, QLD 4000 75
AUSTRIA Salzburg Fuelling GmbH Innsbrucker Bundesstrasse 95, Salzburg, 5020 33Shell Austria Gesellschaft mbH Tech Gate, Donau-City-Str. 1, Vienna, 1220 100Shell Brazil Holding GmbH Tech Gate, Donau-City-Str. 1, Vienna, 1220 100Shell China Holding GmbH Schulhof 6/1, Vienna, 1010 100TBG Tanklager Betriebsgesellschaft m.b.H. Rettenlackstrasse 3, Salzburg, 5020 50Transalpine Ölleitung in Österreich GmbH Kienburg 11, Matrei in Osttirol, 9971 19
BAHAMAS Shell E & P Ireland Offshore Inc. P.O. Box N4805, St. Andrew's Court, Frederick Street Steps, Nassau 100
BARBADOS Shell Trinidad and Tobago Resources SRL One Welches, Welches, St. Thomas, BB22025 100Shell Western Supply and Trading Limited Mahogany Court, Wildey Business Park, Wildey, St. Michael, BB11000 100
BELGIUM Belgian Shell S.A. Cantersteen 47, Brussels, 1000 100CRI Catalyst Company Belgium N.V. Pantserschipstraat 331, Gent, 9000 100Ethyleen Pijpleiding Maatschappij (Belgie) N.V. Kantersteen 47, Brussels, 1000 100New Market Belgium Cantersteen 47, Brussels, 1000 100
BERMUDA Egypt LNG Shipping Limited Clarendon House, 2 Church Street, Hamilton, HM 11 25Gas Investments & Services Company Limited 3rd Floor Continental Building, 25 Church Street, Hamilton, HM 12 85Kuwait Shell Limited 3rd Floor Continental Building, 25 Church Street, Hamilton, HM 12 100Pecten Middle East Services Company Limited 3rd Floor Continental Building, 25 Church Street, Hamilton, HM 12 100Pecten Somalia Company Limited 3rd Floor Continental Building, 25 Church Street, Hamilton, HM 12 100Qatar Shell GTL Limited 3rd Floor Continental Building, 25 Church Street, Hamilton, HM 12 100Sakhalin Energy Investment Company Ltd Clarendon House, 2 Church Street, Third Floor, Hamilton, HM 11 28Shell Australia Natural Gas Shipping Limited 3rd Floor Continental Building, 25 Church Street, Hamilton, HM 12 100Shell Bermuda (Overseas) Limited 3rd Floor Continental Building, 25 Church Street, Hamilton, HM 12 100Shell Caribbean & Central America Ltd 3rd Floor Continental Building, 25 Church Street, Hamilton, HM 12 100Shell Deepwater Borneo Limited 3rd Floor Continental Building, 25 Church Street, Hamilton, HM 12 100Shell EP International Limited 3rd Floor Continental Building, 25 Church Street, Hamilton, HM 12 100Shell Exploration and Production Guyana Limited 3rd Floor Continental Building, 25 Church Street, Hamilton, HM 12 100Shell Holdings (Bermuda) Limited 3rd Floor Continental Building, 25 Church Street, Hamilton, HM 12 100Shell International Trading Middle East Limited 3rd Floor Continental Building, 25 Church Street, Hamilton, HM 12 100Shell Markets (Middle East) Limited 3rd Floor Continental Building, 25 Church Street, Hamilton, HM 12 100Shell Mexico Exploration and Production Investment Limited 3rd Floor Continental Building, 25 Church Street, Hamilton, HM 12 100
ADDITIONAL INFORMATION SHELL ANNUAL REPORT AND FORM 20-F 2017E3

Company by country of incorporation Address of registered office %Shell Offshore Central Gabon Ltd 3rd Floor Continental Building, 25 Church Street, Hamilton, HM 12 100Shell Oman Trading Limited 3rd Floor Continental Building, 25 Church Street, Hamilton, HM 12 100Shell Overseas Holdings (Oman) Limited 3rd Floor Continental Building, 25 Church Street, Hamilton, HM 12 100Shell Petroleum (Malaysia) Ltd 3rd Floor Continental Building, 25 Church Street, Hamilton, HM 12 100Shell Saudi Arabia (Refining) Limited 3rd Floor Continental Building, 25 Church Street, Hamilton, HM 12 100Shell South Syria Exploration Limited 3rd Floor Continental Building, 25 Church Street, Hamilton, HM 12 100Shell Trading (M.E.) Private Limited 3rd Floor Continental Building, 25 Church Street, Hamilton, HM 12 100Shell Trust (Bermuda) Limited 3rd Floor Continental Building, 25 Church Street, Hamilton, HM 12 100Shell Trust (U.K. Property) Limited 3rd Floor Continental Building, 25 Church Street, Hamilton, HM 12 100Solen Insurance Limited 3rd Floor Continental Building, 25 Church Street, Hamilton, HM 12 100Solen Life Insurance Limited 3rd Floor Continental Building, 25 Church Street, Hamilton, HM 12 100Tacoma Company Limited 3rd Floor Continental Building, 25 Church Street, Hamilton, HM 12 100
BRAZIL BG Comercio e Importacao Ltda. Av. República do Chile 330, 23o andar, Torre 2, Centro, Rio de Janeiro, 20031-170 100BG do Brasil Ltda. Av. República do Chile 330, 23o andar, Torre 2, sala 2309, Centro, Rio de Janeiro, 20031-170 100BG Petroleo & Gas Brasil Ltda Av. República do Chile 330, 23o andar, Torre 2, sala 2309, Centro, Rio de Janeiro, 20031-170 100Fusus Comercio e Participacoes Ltda. Calcada das Orquideas 40, 1 E 2 Andares, Centro Comercial 1, Alphaville, Barueri - SP, 06453-017 100Icolub - Industria de Lubrificantes S.A. Praia Intendente Bittencourt, 2 (Parte), Ilha do Governador, Rio de Janeiro, 21930-030 100Pecten do Brasil Servicos de Petroleo Ltda Av.das Americas 4200, Bloco 6, 4th Floor (parte), Barra da Tijuca, Rio de Janeiro, 22640-102 100Raizen Combustíveis S.A. Victor Civita, 77, Block 1, Edifice: Rio Office Park, 4 floor, Barra da Tijuca, Rio de Janeiro, 22775-044 50Raizen Energia S.A. Av. Brigadeiro Faria Lima, 4100, 11th floor, part V, Itaim Bibi, São Paulo, 04538-132 50Seapos Ltda. Av.das Americas 4200, Bloco 6, sala 301 (parte), Barra da Tijuca, Rio de Janeiro, 22640-102 100Shell Brasil Participações Ltda. Av. Brigadeiro Faria Lima 3311, Conj 81 Sala 02, Itam Bibi, São Paulo, 04538-133 100Shell Brasil Petroleo Ltda. Av.das Americas 4200, Bloco 6, salas 101,201,301,401,501,601, Barra da Tijuca, Rio de Janeiro, 22640-102 100Shell Energy do Brasil Ltda Av.das Americas 4200, Bloco 6, sala 501 (parte), Barra da Tijuca, Rio de Janeiro, 22640-102 100
BRUNEI Brunei LNG Sendirian Berhad Lumut, Seria, KC2935 25Brunei Shell Marketing Company Sendirian Berhad Brunei Shell Petroleum Company, Sendirian Berhad, Seria, KB2933 50Brunei Shell Petroleum Company Sendirian Berhad Jalan Utara, Panaga, Seria, KB2933 50Brunei Shell Tankers Sendirian Berhad Jalan Utara, Panaga, Seria, KB2933 25Shell Borneo Sendirian Berhad c/o BSP Head Office, NDCO Block, Ground Floor, Jalan Utara, Panaga Seria, KB2933 100
BULGARIA Shell Bulgaria Ead 48, Sitnyakovo Blvd., Serdika Offices, 8th floor, Sofia, 1505 100
CAMBODIA Angkor Resources Co Ltd Office No. 186 C, Street 155 Sangkat Toul Tumpoung I, Khan Chamkamorn, Phnom Penh 49
CANADA 10084751 Canada Limited 400 4th Avenue S.W., Calgary, Alberta, T2P 0J4 1001745844 Alberta Ltd. 400 4th Avenue S.W., Calgary, Alberta, T2P 0J4 503095381 Nova Scotia Company 1959 Upper Water Street, Suite 1100, Halifax, Nova Scotia, B3J 3E5 1006581528 Canada Ltd. 400 4th Avenue S.W., Calgary, Alberta, T2P 0J4 1007026609 Canada Inc. 400 4th Avenue S.W., Calgary, Alberta, T2P 0J4 1007645929 Canada Limited 400 4th Avenue S.W., Calgary, Alberta, T2P 0J4 100Alberta Products Pipe Line Ltd. 5305 McCall Way N.E., Calgary, Alberta, T2E 7N7 20BG Canada Ltd. 400 4th Avenue S.W., Calgary, Alberta, T2P 0J4 100BlackRock Ventures Inc. 400 4th Avenue S.W., Calgary, Alberta, T2P 0J4 100BR Oil Sands Corporation 400 4th Avenue S.W., Calgary, Alberta, T2P 0J4 100Cansolv Technologies Inc. 400 4th Avenue S.W., Calgary, Alberta, T2P 0J4 100Coral Cibola Canada Inc. 400 4th Avenue S.W., Calgary, Alberta, T2P 0J4 100Criterion Catalysts & Technologies Canada, Inc. 400 4th Avenue S.W., Calgary, Alberta, T2P 0J4 100FP Solutions Corporation 400 4th Avenue S.W., Calgary, Alberta, T2P 0J4 33LNG Canada Development Inc. [b] 400 4th Avenue S.W., Calgary, Alberta, T2P 0J4 50Sable Offshore Energy Inc. 1701 Hollis Street, Suite 1400, Halifax, Nova Scotia, B3J 3M8 33SCL Pipeline Inc. 400 4th Avenue S.W., Calgary, Alberta, T2P 0J4 100SFJ Inc. 199 Bay Street, Suite 5300, Commerce Court West, Toronto, Ontario, M5L 1B9 50Shell Americas Funding (Canada) Limited 400 4th Avenue S.W., Calgary, Alberta, T2P 0J4 100Shell Canada Energy [c] 400 4th Avenue S.W., Calgary, Alberta, T2P 0J4 100Shell Canada Exploration [c] 400 4th Avenue S.W., Calgary, Alberta, T2P 0J4 100Shell Canada Limited 400 4th Avenue S.W., Calgary, Alberta, T2P 0J4 100Shell Canada OP Inc. 400 4th Avenue S.W., Calgary, Alberta, T2P 0J4 100Shell Canada Products 400 4th Avenue S.W., Calgary, Alberta, T2P 0J4 100Shell Canada Resources [c] 400 4th Avenue S.W., Calgary, Alberta, T2P 0J4 100Shell Canada Services Limited 400 4th Avenue S.W., Calgary, Alberta, T2P 0J4 100Shell Chemicals Canada [c] 400 4th Avenue S.W., Calgary, Alberta, T2P 0J4 100Shell Energy Merchants Canada Inc. 400 4th Avenue S.W., Calgary, Alberta, T2P 0J4 100Shell Energy North America (Canada) Inc. 400 4th Avenue S.W., Calgary, Alberta, T2P 0J4 100Shell Global Solutions Canada Inc. 400 4th Avenue S.W., Calgary, Alberta, T2P 0J4 100Shell Quebec Limitée 400 boul de Maisonneuve Ouest, Montreal, Quebec, H3A 1L4 100Shell Trading Canada [c] 400 4th Avenue S.W., Calgary, Alberta, T2P 0J4 100
ADDITIONAL INFORMATION SHELL ANNUAL REPORT AND FORM 20-F 2017E4

Company by country of incorporation Address of registered office %Sun-Canadian Pipe Line Company Limited 830 Highway No. 6 North, Flamborough, Ontario, L0R 2H0 45Trans-Northern Pipelines Inc. 45 Vogel Road, Suite 310, Richmond Hill, Ontario, L4B 3P6 33
CAYMAN ISLANDS Beryl North Sea Limited Sterling Trust (Cayman) Limited, Whitehall House, 238 North Church Street, P.O. Box 1043, George Town, KY1-1102 100BG Egypt S.A. 5th Floor, Bermuda House, Dr Roy's Drive, George Town, Grand Cayman, KY1-1102 100BG Exploration and Production India Limited Floor 4, Willow House, Cricket Square, George Town, P.O. Box 268, Grand Cayman, KY1-1104 100Gas Resources Limited Caribbean Management Ltd, 5th Floor, Bermuda House, 36C Dr Roy's Drive, Grand Cayman, KY1- 1102 100Schiehallion Oil & Gas Limited Sterling Trust (Cayman) Limited, Whitehall House, 238 North Church Street, P.O. Box 1043, George Town, KY1-1102 100Shell Bolivia Corporation PricewaterhouseCoopers Services, Strathvale House, P.O. Box 258, Grand Cayman, KY1-1104 100Shell North Sea Holdings Limited Maples Corporate Services Limited, Ugland House, P.O. Box 309, Grand Cayman, KY1-1104 100
CHINA Beijing Shell Petroleum Company Ltd. Unit 1101-1104, level 11, Building 1, No. 19 Chaoyang Park Road, Chaoyang District, Beijing, 100125 49Cansolv Technologies (Beijing) Company Limited Unit 09, Level 31 No. 16 Building, No. 1 Jian Guo Men Wai Avenue, Chaoyang District, Beijing, 100004 100Chongqing Doyen Shell Petroleum and Chemical Co. Ltd. No. 196, Shuang Yuan Street, Beibei Zone, Chongqing, 400700 49CNOOC and Shell Petrochemicals Company Limited Dayawan Petrochemical Industrial Park, Huizhou, Guangdong, 516086 50Hangzhou Natural Gas Company Limited 10/F, Meiqi Mansion, No. 30 Tianmushan Road, Hangzhou, 310007 25Infineum (China) Co. Ltd. No. 1 Dongxin Road, Jiangsu Yangtze River International, Chemical Industry Park, Zhangjiagang, Jiangsu 50Shell (Beijing) Real Estate Consulting Ltd. Unit 01, 32/F, No. 16 Building, No. 1 Courtyard Jian Guo Men Wai Avenue, Chaoyang District, Beijing, 100004 100Shell (China) Limited 30/F Unit 01-02, No. 16 Building, No. 1 Courtyard, Jian Guo Men Wai Avenue, Chaoyang District, Beijing, 100004 100Shell (China) Projects & Technology Limited Unit 01 - 08, Level 31, No. 16 Building, No. 1 Jian Guo Men Wai Avenue, Chaoyang District, Beijing, 100004 100Shell (Shanghai) Petroleum Company Limited Room 522, The British Road No. 38, China (Shanghai) Pilot Free Trade Zone, Shanghai, 200131 100Shell (Shanghai) Technology Limited Building 4, Jin Chuang Building, No. 4560, Jin Ke Road, Pilot Free Trade Zone, Shanghai 100Shell (Tianjin) Lubricants Company Limited North to Gang Bei Road and east to Hai Gang Road, Nangang Industrial Zone, Tianjin Economic-Technological Development Area, Tianjin,
300280100
Shell (Tianjin) Oil and Petrochemical Company Limited No. 286 Nansan Road, Tianjin Harbour, Nanjiang Development Zone, Tanggu District, Tianjin, 300452 100Shell (Zhejiang) Petroleum Trading Limited No. 1 Wangjiaba, Xinmiaozhi Village, Puyuan Town, Tongxiang, Jiaxing, Zhejiang, 314502 100Shell (Zhuhai) Lubricants Company Limited Nanjin Wan, Gaolan Dao, Zhuhai Harbour Industrial Zone, Guangdong, 519050 100Shell Energy (China) Limited Room 530, 5th Floor, Building 1, No. 239 Gang'ao Road, China (Shanghai) Free Trade Zone, Shanghai, 200137 100Shell North China Petroleum Group Co., Ltd. 5th Floor, Administrative Commission Building, Wuqing Development Area, No. 18 Fuyuan Road, Wuqing District, Tianjin, 300203 49Shell Road Solutions (Zhenjiang) Co. Ltd Dagang District, New Zone, Zhenjiang, Jiangsu, 212132 100Shell Road Solutions Xinyue (Foshan) Co. Ltd. Baisha, Hekou, Sanshui District, Foshan, Guangdong, 528133 60Sinopec and Shell (Jiangsu) Petroleum Marketing Company Limited No. 100, Xingang Dadao, Nanjing Economic and Technological Development Zone, Nanjing, Jiangsu, 210000 40Suzhou Liyuan Retail Site Management Co., Ltd. No. 358 Zhuhui Road, Suzhou, 215000 50Yanchang and Shell (Guangdong) Petroleum Co., Ltd. 39th Floor as Planning-designed (41st Floor as Self-designated), Leatop Plaza, No. 32 East Zhujiang Road, Zhujiang New Town, Tianhe District,
Guangzhou49
Yanchang and Shell (Sichuan) Petroleum Company Limited 23F, Yanlord Square, Section 2, Renmin South Road, Chengdu, Sichuan, 610016 45Yanchang and Shell Petroleum Company Limited Room 1801 Building B, 18F City Gateway, No. 1 Jinye Road, Hi-Tech Zone, Xi'an, 710075 45Yueyang Sinopec and Shell Coal Gasification Company Limited Qilishan, Yueyang, Hunan, 414003 50Zhejiang Shell Fuels Company Limited Room 2103, North Tower, Yefeng Modern Center, No. 161, Shaoxing Road, Xiacheng District, Hangzhou City (Zhejiang Province), 310004 100Zhejiang Shell Oil and Petrochemical Company Limited The Port of Zhapu, Jiaxing Municipality, Zhejiang, 314201 100
COLOMBIA C.I. Shell Comercializadora Colombia, S.A.S Calle 100 No. 7 - 33, Piso 20, Edificio "Capital Tower", Bogotá, 452 100Shell Colombia S.A. Calle 90 No. 19 - 41, Oficina 702- Edificio Quantum, Bogotá, 452 100Unión Temporal Bloque Sin Off 7 Calle 100 No. 7 - 33, Piso 20, Edificio "Capital Tower", Bogotá, 452 65
COOK ISLANDS Branstone (International) Limited [i] Bermuda House, Tutakimoa Road, Rarotonga 100
CÔTE D'IVOIRE Cote d'Ivoire GNL 14, Blvd Carde, Imm. Les Heveas, Plateau, Abidjan, BP V 194 13
CYPRUS Rosneft-Shell Caspian Ventures Limited [g] 8 Michalaki Karaoli Street, Anemomylos Office Building, 4th Floor, Office 401, Nicosia, 1095 49
CZECH REPUBLIC Shell Czech Republic A.S. Antala Staska 2027/77, Praha 4, 140 00 100
DENMARK A/S Dansk Shell Egeskovvej 265, Fredericia, 7000 100Shell EP Holdingselskab Danmark ApS Midtermolen 3, 4, Copenhagen, 2100 100Shell Olie-og Gasudvinding Danmark Pipelines ApS Midtermolen 3, 4, Copenhagen, 2100 100
EGYPT Alam El Shawish Petroleum Company [b] 127 Abdel Aziz Fahmy St., Heliopolis, P.O. Box 5958, Cairo, 5958 20Badr Petroleum Company [b] 127 Abdel Aziz Fahmy St., Heliopolis, P.O. Box 5958, Cairo, 5958 50Burullus Gas Company S.A.E. [b] 28 Road 270, Maadi, Cairo 25El Behera Natural Gas Liquefaction Company S.A.E. City of Rashid, El Behera Governorate 36IDKU Natural Gas Liquefaction Company S.A.E. City of Rashid, El Behera Governorate 38Obaiyed Petroleum Company [b] 127 Abdel Aziz Fahmy St., Heliopolis, P.O. Box 5958, Cairo, 5958 50Rashid Petroleum Company S.A.E. [b] 38 Street No. 270, Maadi, Cairo 40Shell Egypt Trading Business View Building, No. 79, 90 Street (South), Fifth Settlement- New Cairo, Cairo, 11835 100Shell Lubricants Egypt Business View Building, No. 79, 90 Street (South), Fifth Settlement- New Cairo, Cairo, 11835 100
ADDITIONAL INFORMATION SHELL ANNUAL REPORT AND FORM 20-F 2017 E5

Company by country of incorporation Address of registered office %Sitra Petroleum Company [b] 127 Abdel Aziz Fahmy St., Heliopolis, P.O. Box 5958, Cairo, 5958 50The Egyptian LNG Company S.A.E. City of Rashid, El Behera Governorate 36The Egyptian Operating Company for Natural Gas Liquefaction Projects S.A.E. City of Rashid, El Behera Governorate 36Tiba Petroleum Company [b] 127 Abdel Aziz Fahmy St., Heliopolis, P.O. Box 5958, Cairo, 5958 26West Sitra Petroleum Company [b] 127 Abdel Aziz Fahmy St., Heliopolis, P.O. Box 5958, Cairo, 5958 50
FINLAND Shell Aviation Finland Oy Ayritie 12 A, Vantaa, 01510 100
FRANCE Avitair SAS Immeuble "Les portes de la Défense", 307 Rue d'Estienne d'Orves, Colombes, 92708 100Groupement d'Exploitation du Dépôt de Réception Chennevières [b] [c] Chemin de Livry, Dépôt de Chennevières, Chennevières-lès-Louvres, 95380 11Groupement Pétrolier Aviation SNC Aéroport Roissy Charles de Gaulle, Zone de Frêt 1, 3 Rue des Vignes, Tremblay-en-France, 93290 20Infineum France Chemin départemental 54, Berre-L'Etang, 13130 50Service Aviation Paris (G.I.E.) Orly Sud No. 144 - Bat. 438, Orly Aerogares, 94541 33Shell Retraites SAS Immeuble "Les portes de la Défense", 307 Rue d'Estienne d'Orves, Colombes, 92708 100Société de Gestion Mobilière et Immobilière SAS Immeuble "Les portes de la Défense", 307 Rue d'Estienne d'Orves, Colombes, 92708 100Société des Pétroles Shell SAS Immeuble "Les portes de la Défense", 307 Rue d'Estienne d'Orves, Colombes, 92708 100Ste du Pipeline Sud Européen S.A. 7-9, Rue des Freres Morane, Paris Cedex 15, 75738 21The New Motion France SAS 15 Avenue du Centre, Guyancourt, 78280 100
GERMANY AGES Maut System GmbH & Co. KG Berghausener Straße 96, Langenfeld, 40764 25BEB Erdgas und Erdoel GmbH & Co. KG [b] Riethorst 12, Hannover, 30659 50BEB Holding GmbH [b] Caffamacherreihe 5, Hamburg, 20355 50Carissa Einzelhandel- und Tankstellenservice GmbH & Co. KG Willinghusener Weg 5 D-E, Oststeinbek, 22113 100Carissa Verwaltungsgesellschaft mbH Suhrenkamp 71 - 77, Hamburg, 22335 100CRI Catalyst Leuna GmbH Am Haupttor, Bau 8322, Leuna, 06237 100CRI Deutschland GmbH Am Haupttor, Bau 8322, Leuna, 06237 100Deutsche Infineum GmbH & Co. KG Neusser Landstraße 16, Köln, 50735 50Deutsche Shell GmbH Suhrenkamp 71 - 77, Hamburg, 22335 100Deutsche Shell Holding GmbH Suhrenkamp 71 - 77, Hamburg, 22335 100Deutsche Transalpine Oelleitung GmbH Paul Wassermann Str. 3, Munchen, 81829 19Erdoel-Raffinerie Deurag-Nerag GmbH Riethorst 12, Hannover, 30659 50euroShell Deutschland GmbH & Co. KG Suhrenkamp 71 - 77, Hamburg, 22335 100euroShell Deutschland Verwaltungsgesellschaft mbH Suhrenkamp 71 - 77, Hamburg, 22335 100FBG Ferngasbeteiligungsgesellschaft mbH Suhrenkamp 71 - 77, Hamburg, 22335 100H2 Mobility Deutschland GmbH and Co. KG Linienstrasse 160, Berlin, 10115 28HPRDS und SPNV Deutschland Oil GmbH & Co. KG Suhrenkamp 71 - 77, Hamburg, 22335 100HPRDS und SPNV Deutschland Verwaltungsges. mbH Suhrenkamp 71 - 77, Hamburg, 22335 90Infineum Deutschland Verwaltungsgesellschaft mbH Neusser Landstraße 16, Köln, 50735 50Mineraloelraffinerie Oberrhein Verwaltungs GmbH DEA-Scholven-Str., Karlsruhe, 76187 32Nord-West Oelleitung GmbH [b] Zum Oelhafen 207, Wilhelmshaven, 26384 20Oberrheinische Mineraloelwerke GmbH [b] DEA-Scholven-Str., Karlsruhe, 76187 42PCK Raffinerie GmbH [b] Passower Chaussee 111, Schwedt/Oder, 16303 38Rheinland Kraftstoff GmbH Auf dem Schollbruch 24-26, Gelsenkirchen, 45899 100Rhein-Main-Rohrleitungstransportgesellschaft mbH [b] Godorfer Hauptstrasse 186, Köln, 50997 63Shell Algeria Zerafa GmbH Suhrenkamp 71 - 77, Hamburg, 22335 100Shell Deutschland Additive GmbH Suhrenkamp 71 - 77, Hamburg, 22335 100Shell Deutschland Oil GmbH Suhrenkamp 71 - 77, Hamburg, 22335 100Shell Energy Deutschland GmbH Suhrenkamp 71 - 77, Hamburg, 22335 100Shell Erdgas Beteiligungsgesellschaft mbH Suhrenkamp 71 - 77, Hamburg, 22335 100Shell Erdgas Marketing GmbH & Co. KG Suhrenkamp 71 - 77, Hamburg, 22335 75Shell Erdoel und Erdgas Exploration GmbH Suhrenkamp 71 - 77, Hamburg, 22335 100Shell Exploration and Development Libya GmbH I Suhrenkamp 71 - 77, Hamburg, 22335 100Shell Exploration and Production Colombia GmbH Suhrenkamp 71 - 77, Hamburg, 22335 100Shell Exploration and Production Libya GmbH Suhrenkamp 71 - 77, Hamburg, 22335 100Shell Exploration et Production du Maroc GmbH Suhrenkamp 71 - 77, Hamburg, 22335 100Shell Exploration New Ventures One GmbH Suhrenkamp 71 - 77, Hamburg, 22335 100Shell Exploration und Produktion Deutschland GmbH Suhrenkamp 71 - 77, Hamburg, 22335 100Shell Global Solutions (Deutschland) GmbH Hohe-Schaar-Straße 36, Hamburg, 21107 100Shell Grundstücksgesellschaft Wesseling GmbH & Co. KG Suhrenkamp 71 - 77, Hamburg, 22335 100Shell Hydrogen Deutschland GmbH Suhrenkamp 71 - 77, Hamburg, 22335 100Shell Tunisia El Jem GmbH Suhrenkamp 71 - 77, Hamburg, 22335 100Shell Tunisia Kairouan GmbH Suhrenkamp 71 - 77, Hamburg, 22335 100Shell Tunisia Offshore GmbH Suhrenkamp 71 - 77, Hamburg, 22335 100Shell Verwaltungsgesellschaft für Erdgasbeteiligungen mbH Suhrenkamp 71 - 77, Hamburg, 22335 100SPNV Deutschland Beteiligungsges. mbH Suhrenkamp 71 - 77, Hamburg, 22335 100The New Motion Deutschland GmbH c/o Mindspace, Friedrichstraße 68, Berlin, 10117 100
ADDITIONAL INFORMATION SHELL ANNUAL REPORT AND FORM 20-F 2017 E6

Company by country of incorporation Address of registered office %GIBRALTAR
Shell LNG Gibraltar Limited 57/63 Line Wall Road, P.O. Box 199, Gibraltar 51GREECE
Attiki Natural Gas Distribution Company S.A. 11 Sofokli Venizelou Ave. & Serron Str, 141 23 Lykovryssi, Athens, 104 47 49Shell & MOH Aviation Fuels A.E. 151 Kifisias Ave., Marousi, Athens, 15124 51
GREENLAND Shell Greenland A/S Aqqusinersuaq 48A, P.O. Box 1728, Nuuk, 3900 100
GUAM Shell Guam Inc. 643 Chalan San Antonio, Suite 100, Tamuning, GU 96911 100
HONG KONG AFSC Management Limited 3 Scenic Road, Chek Lap Kok, Lantau 11AFSC Operations Limited 3 Scenic Road, Chek Lap Kok, Lantau 11AFSC Refuelling Limited 3 Scenic Road, Chek Lap Kok, Lantau 11Branstone Company Limited 35/F AIA Kowloon Tower, Landmark East, 100 How Ming Street, Kwun Tong (Kowloon) 100Fulmart Limited 35/F AIA Kowloon Tower, Landmark East, 100 How Ming Street, Kwun Tong (Kowloon) 100Hong Kong Response Limited Esso Tsing Yi Terminal, Lot 46 Tsing Yi Road, Tsing Yi Island, New Territories 25Ocean Century Tf Limited [i] 35/F AIA Kowloon Tower, Landmark East, 100 How Ming Street, Kwun Tong (Kowloon) 100Shell Developments (HK) Limited [i] 35/F AIA Kowloon Tower, Landmark East, 100 How Ming Street, Kwun Tong (Kowloon) 100Shell Hong Kong Limited 35/F AIA Kowloon Tower, Landmark East, 100 How Ming Street, Kwun Tong (Kowloon) 100Shell Korea Limited 35/F AIA Kowloon Tower, Landmark East, 100 How Ming Street, Kwun Tong (Kowloon) 100Shell Macau Limited 35/F AIA Kowloon Tower, Landmark East, 100 How Ming Street, Kwun Tong (Kowloon) 100
HUNGARY Shell Hungary Trading close Company Limited by shares Bocskai út 134-146., Budapest, 1113 100
INDIA BG India Energy Private Limited 3-C World Trade Tower, New Barakhamba Lane, New Delhi, 110001 100BG India Energy Services Private Limited 3-C World Trade Tower, New Barakhamba Lane, New Delhi, 110001 100BG India Energy Solutions Private Limited 3-C World Trade Tower, New Barakhamba Lane, New Delhi, 110001 100BG LNG Regas India Private Limited 3-C World Trade Tower, New Barakhamba Lane, New Delhi, 110001 100Hazira LNG Private Limited 101-103 Abhijeet-II, Mithakhali Circle, Ahmedabad 380 006, Gujarat, 380006 74Hazira Port Private Limited 101-103 Abhijeet-II, Mithakhali Circle, Ahmedabad 380 006, Gujarat, 380006 74Mahanagar Gas Limited MGL House, G-33 Block, Bandra-Kurla Complex, Bandra (East), Mumbai, 400051 32Pennzoil Quaker State India Limited Plot No. T-5, MIDC, Taloja Industrial Area, Tal-Panvel, Raigad District, Maharashtra (Mumbai), 410208 100Shell Energy Marketing and Trading India Private Limited [b] Ikeva Venture and Knowledge Advisory, Services Pvt Ltd, Level 1, MB Towers, Road no 10, Banjara Hills, Hyderabad, 500034 100Shell India Markets Private Limited 2nd floor, Campus 4A, RMZ Millenia Business Park, 143 Dr MG Road, Kandanchavady, Perungudi, Chennai, 600096 100Shell MRPL Aviation Fuels and Services Limited 102, Prestige Sigma, Vittal Mallya Road, Bangalore, 560001 50
INDONESIA PT. Gresik Distribution Terminal Talavera Office Park 22-26th Floor, Jl. Letjen. TB Simatupang Kav. 22-26, Jakarta Selatan, Jakarta, 12430 100PT. Shell Indonesia Talavera Office Park 22-26th Floor, Jl. Letjen. TB Simatupang Kav. 22-26, Jakarta Selatan, Jakarta, 12430 100PT. Shell Manufacturing Indonesia Talavera Office Park 22-26th Floor, Jl. Letjen. TB Simatupang Kav. 22-26, Jakarta Selatan, Jakarta, 12430 100PT. Shell Solar Indonesia Talavera Office Park 22-26th Floor, Jl. Letjen. TB Simatupang Kav. 22-26, Jakarta Selatan, Jakarta, 12430 100
IRAQ Basrah Gas Company Khor Al Zubair, Basrah 44
IRELAND Asiatic Petroleum Company (Dublin) Limited Embassy House, Herbert Park Lane, Ballsbridge, Dublin, D04 H6Y0 100Irish Shell Trust Designated Activity Company Embassy House, Herbert Park Lane, Ballsbridge, Dublin, D04 H6Y0 100Shell and Topaz Aviation Ireland Limited Suite 7 Northwood House, Northwood Business Park, Santry, Dublin, 9 50Shell E&P Ireland Limited Embassy House, Herbert Park Lane, Ballsbridge, Dublin, D04 H6Y0 100
ISLE OF MAN Petrolon Europe Limited Fort Anne, Douglas, IM1 5PD 100Petrolon International Limited Fort Anne, Douglas, IM1 5PD 100Shell Marine Personnel (I.O.M.) Limited Euromanx House, Freeport, Ballasalla, IM9 2AP 100Shell Ship Management Limited Euromanx House, Freeport, Ballasalla, IM9 2AP 100
ITALY Alle S.R.L. Via Vittor Pisani 16, Milano, 20124 100Aquila S.p.A. Via Vittor Pisani 16, Milano, 20124 100BG Italia Power S.p.A. Via Tortona 25, Milano, 20144 100Brindisi LNG S.p.A. Via Tortona 25, Milano, 20144 100Infineum Italia S.R.L. Strada di Scorrimento 2, Vado Ligure (SA), 17047 50Shell Energy Italia S.R.L. Via Vittor Pisani 16, Milano, 20124 100Shell International Exploration and Development Italia S.p.A. Piazza dell'Indipendenza 11/B, Rome, 00185 100Shell Italia E&P S.p.A. Piazza dell'Indipendenza 11/B, Rome, 00185 100Shell Italia Holding S.p.A. Via Vittor Pisani 16, Milano, 20124 100Shell Italia Oil Products S.R.L. Via Vittor Pisani 16, Milano, 20124 100Societa Italiana per l'Oleodotto Transalpino S.p.A. Via Muggia #1, San Dorligo della Valle, Trieste, 34147 19Societa' Oleodotti Meridionali S.p.A. Via Emilia 1, San Donato Milanese, 20097 30
JAPAN Brunei Energy Services Company Ltd. 1-8-2 Marunouchi, Chiyoda-ku, Tokyo, 100-0005 25
ADDITIONAL INFORMATION SHELL ANNUAL REPORT AND FORM 20-F 2017 E7

Company by country of incorporation Address of registered office %Japan Chemtech Ltd. 3-2 Daiba 2-Chome, Minato-Ku, Tokyo, 135-8074 30Sakhalin LNG Services Company Ltd. 2-3, Kanda, Awaji-cho, Chiyoda-ku, Tokyo, 101-0063 50Shell Chemicals Japan Ltd. 3-2 Daiba 2-Chome, Minato-Ku, Tokyo, 135-8074 100Shell Japan Limited 16F Pacific Century Place, 1-11-1, Marunouchi, Chiyoda-ku, Tokyo, 100-6216 100Shell Japan Trading Ltd. 3-2 Daiba 2-Chome, Minato-Ku, Tokyo, 135-8074 53
JERSEY Morzine Limited Ogier House, The Esplanade, St. Helier, JE4 9WG 33Shell Service Station Properties Limited Queensway House, Hilgrove Street, St. Helier, JE1 1ES 100
LUXEMBOURG Shell Finance Luxembourg Sarl 7, Rue de l'Industrie, Bertrange, Luxembourg, L-8069 100Shell Luxembourgeoise Sarl 7, Rue de l'Industrie, Bertrange, Luxembourg, L-8005 100Shell Treasury Luxembourg Sarl 7, Rue de l'Industrie, Bertrange, Luxembourg, L-8069 100
MACAU Shell Macau Petroleum Company Limited 876 Avenida da Amizade, Edificio Marina Gardens, Room 310, 3rd Floor 100
MALAYSIA Bonuskad Loyalty Sdn. Bhd. [i] Level 8, Symphony House, Block D13, Pusat Dagangan Dana 1, Jalan PJU 1A/46, Petaling Jaya/Selangor Darul Ehsan, 47301 33IOT Management Sdn. Bhd. Lot 7689 and Lot 7690, Section 64, Kuching Town Land District, Jalan Pending, Kuching, Sarawak, 93450 7Kebabangan Petroleum Operating Company Sdn. Bhd. [b] Suite 13.03, 13 Floor, Menara Tan & Tan, 207 Tun Razak, Kuala Lumpur/Federal Territory, 50400 30P S Pipeline Sendirian Berhad Level 30, Tower 1, Petronas Twin Towers, KLCC, Kuala Lumpur/Federal Territory, 50088 50P S Terminal Sendirian Berhad Lot 6.05, Level 6, KPMG Tower, 8 First Avenue Bandar Utama, Petaling Jaya/Selangor Darul Ehsan, 47800 35Pertini Vista Sdn. Bhd. Lot 6.05, Level 6, KPMG Tower, 8 First Avenue Bandar Utama, Petaling Jaya/Selangor Darul Ehsan, 47800 100Provista Ventures Sdn. Bhd. Lot 6.05, Level 6, KPMG Tower, 8 First Avenue Bandar Utama, Petaling Jaya/Selangor Darul Ehsan, 47800 100Sarawak Shell Berhad Lot 6.05, Level 6, KPMG Tower, 8 First Avenue Bandar Utama, Petaling Jaya/Selangor Darul Ehsan, 47800 100Shell Business Service Centre Sdn. Bhd. Lot 6.05, Level 6, KPMG Tower, 8 First Avenue Bandar Utama, Petaling Jaya/Selangor Darul Ehsan, 47800 100Shell Global Solutions (Malaysia) Sdn. Bhd. Lot 6.05, Level 6, KPMG Tower, 8 First Avenue Bandar Utama, Petaling Jaya/Selangor Darul Ehsan, 47800 100Shell Malaysia Trading Sendirian Berhad Lot 6.05, Level 6, KPMG Tower, 8 First Avenue Bandar Utama, Petaling Jaya/Selangor Darul Ehsan, 47800 100Shell MDS (Malaysia) Sendirian Berhad Lot 6.05, Level 6, KPMG Tower, 8 First Avenue Bandar Utama, Petaling Jaya/Selangor Darul Ehsan, 47800 72Shell New Ventures Malaysia Sdn. Bhd. [i] Lot 6.05, Level 6, KPMG Tower, 8 First Avenue Bandar Utama, Petaling Jaya/Selangor Darul Ehsan, 47800 100Shell People Services Asia Sdn. Bhd. Lot 6.05, Level 6, KPMG Tower, 8 First Avenue Bandar Utama, Petaling Jaya/Selangor Darul Ehsan, 47800 100Shell Sabah Selatan Sendirian Berhad Lot 6.05, Level 6, KPMG Tower, 8 First Avenue Bandar Utama, Petaling Jaya/Selangor Darul Ehsan, 47800 100Shell Timur Sdn. Bhd. Lot 6.05, Level 6, KPMG Tower, 8 First Avenue Bandar Utama, Petaling Jaya/Selangor Darul Ehsan, 47800 70Shell Treasury Malaysia (L) Limited Kensington Gardens, No. U1317, Lot 7616, Jalan Jumidar Buyong, Labuan F.T., 87000 100Tanjung Manis Oil Terminal Management Sdn. Bhd. Lot 7689 and Lot 7690, Section 64, Kuching Town Land District, Jalan Pending, Kuching, Sarawak, 93450 14
MAURITIUS BG Mauritius LNG Holdings Ltd 6th Floor, Tower A, 1 Cybercity, Ebene, 72201 100BG Mumbai Holdings Limited 6th Floor, Tower A, 1 Cybercity, Ebene, 72201 100Pennzoil Products International Company 33 Edith Cavell Street, Port Louis, 11324 100
MEXICO BG Group Mexico Exploration, S.A. de C.V. Paseo de las Palmas 425, Piso 3, Colonia Lomas de Chapultepec, Ciudad de México, 11000 100BG Group Mexico Services, S.A. de C.V. Paseo de las Palmas 425, Piso 3, Colonia Lomas de Chapultepec, Ciudad de México, 11000 100Gas Del Litoral, S. de R.L. de C.V. Paseo de las Palmas 425, Piso 3, Colonia Lomas de Chapultepec, Ciudad de México, 11000 75Shell Exploración y Extracción de México, S.A. de C.V. Paseo de las Palmas 425, Piso 3, Colonia Lomas de Chapultepec, Ciudad de México, 11000 100Shell México Gas Natural, S. de R.L. de C.V. Paseo de las Palmas 425, Piso 3, Colonia Lomas de Chapultepec, Ciudad de México, 11000 100Shell México, S.A. de C.V. Paseo de las Palmas 425, Piso 3, Colonia Lomas de Chapultepec, Ciudad de México, 11000 100Shell Servicios México, S.A. de C.V. Paseo de las Palmas 425, Piso 3, Colonia Lomas de Chapultepec, Ciudad de México, 11000 100Shell Trading México, S. de R.L. de C.V. Paseo de las Palmas 425, Piso 3, Colonia Lomas de Chapultepec, Ciudad de México, 11000 100
MONGOLIA BGMEP, LLC Suite 403, Floor 4, New Century Plaza, Chinggis Avenue, 1st Khoroo, Sukhbaatar, Ulaanbaatar 100
NETHERLANDS Amsterdam Schiphol Pijpleiding Beheer B.V. Amsterdamseweg 55, 1182 GP Amstelveen, P.O. Box 75650, Luchthaven Schiphol, 1118 ZS 40Attiki Gas B.V. Carel van Bylandtlaan 30, The Hague, 2596 HR 100B.R.E. B.V. Lelystad, Deventer, 7425 SB 100B.V. Dordtsche Petroleum Maatschappij Carel van Bylandtlaan 30, The Hague, 2596 HR 100B.V. Petroleum Assurantie Maatschappij Carel van Bylandtlaan 30, The Hague, 2596 HR 100BG Gas Atlantic Holdings B.V. Carel van Bylandtlaan 30, The Hague, 2596 HR 100BG Gas Brazil E&P 12 B.V. Carel van Bylandtlaan 30, The Hague, 2596 HR 100BG Gas Brazil Holdings B.V. Carel van Bylandtlaan 30, The Hague, 2596 HR 100BG Gas Brazilian Investment B.V. Carel van Bylandtlaan 30, The Hague, 2596 HR 100BG Gas Global Holdings B.V. Carel van Bylandtlaan 30, The Hague, 2596 HR 100BG Gas International B.V. Carel van Bylandtlaan 30, The Hague, 2596 HR 100BG Gas International Holdings B.V. Carel van Bylandtlaan 30, The Hague, 2596 HR 100BG Gas Netherlands Holdings B.V. Carel van Bylandtlaan 30, The Hague, 2596 HR 100BG Gas Sao Paulo Investments B.V. Carel van Bylandtlaan 30, The Hague, 2596 HR 100BJS Oil Operations B.V. Carel van Bylandtlaan 30, The Hague, 2596 HR 80BJSA Exploration and Production B.V. Carel van Bylandtlaan 30, The Hague, 2596 HR 100Caspi Meruerty Operating Company B.V. Prins Bernhardplein 200, 1097JB Amsterdam, Amsterdam, 1077 XX 40Chosun Shell B.V. Carel van Bylandtlaan 30, The Hague, 2596 HR 100Cicerone Holding B.V. Herikerbergweg 238, Amsterdam, 1101 CM 51
ADDITIONAL INFORMATION SHELL ANNUAL REPORT AND FORM 20-F 2017E8

Company by country of incorporation Address of registered office %ELLBA B.V. [b] Vondelingenweg 601, Vondelingenplaat, Rotterdam, 3196 KK 50ELLBA C.V. [b] [d] Vondelingenweg 601, Vondelingenplaat, Rotterdam, 3196 KK 50Euroshell Cards B.V. Weena 70, Rotterdam, 3012 CM 100Gasterra B.V. P.O. Box 477, Groningen, 9700 AL 25Guara B.V. Weena 722, Rotterdam, 3014 DA 30Infineum Holdings B.V. Herikerbergweg 238, Amsterdam, 1101 CM 50Integral Investments B.V. Carel van Bylandtlaan 30, The Hague, 2596 HR 100Jordan Oil Shale Company B.V. Carel van Bylandtlaan 30, The Hague, 2596 HR 100Karachaganak Petroleum Operating B.V. Strawinskylaan 1725, Amsterdam, 1077 XX 29Libra Oil & Gas B.V. Weena 762, Rotterdam, 3014 DA 20LNG Shipping Operation Services Netherlands B.V. Carel van Bylandtlaan 30, The Hague, 2596 HR 100Loyalty Management Netherlands B.V. Polaris Avenue 81, P.O. Box 2047, 2130 GE, Hoofddorp, 2132 JH 40Maasvlakte Olie Terminal C.V. [d] Europaweg 975, Maasvlakte, Rotterdam, 3199 LC 16Multi Tank Card B.V. Antareslaan 39, P.O. Box 3068, 2130 KB, Hoofddorp, 2132 JE 30N.V. Rotterdam-Rijn Pijpleiding Maatschappij [b] Butaanweg 215, Vondelingplaat-Rotterdam, 3196 KC 56Nederlandse Aardolie Maatschappij B.V. Schepersmaat 2, Assen, 9405 TA 50Netherlands Alng Holding Company B.V. Carel van Bylandtlaan 30, The Hague, 2596 HR 100Noordzeewind B.V. 2e Havenstraat 5b, Ijmuiden, 1976 CE 50Noordzeewind C.V. [d] 2e Havenstraat 5b, Ijmuiden, 1976 CE 50Paqell B.V. Tjalke de Boerstrjitte 24, Balk, 8561 EL 50Raffinaderij Shell Mersin N.V. Carel van Bylandtlaan 30, The Hague, 2596 HR 100RESCO B.V. Carel van Bylandtlaan 30, The Hague, 2596 HR 100Rub' Al-Khali Gas Development B.V. Carel van Bylandtlaan 30, The Hague, 2596 HR 100Salym Petroleum Development N.V. [b] Carel van Bylandtlaan 30, The Hague, 2596 HR 50Shell Abu Dhabi B.V. Carel van Bylandtlaan 30, The Hague, 2596 HR 100Shell Additives Holdings (I) B.V. Carel van Bylandtlaan 30, The Hague, 2596 HR 100Shell Additives Holdings (II) B.V. Carel van Bylandtlaan 30, The Hague, 2596 HR 100Shell and Vivo Lubricants B.V. Carel van Bylandtlaan 30, The Hague, 2596 HR 50Shell Asset Management Company B.V. Carel van Bylandtlaan 30, The Hague, 2596 HR 100Shell Bab Gas Development B.V. Carel van Bylandtlaan 30, The Hague, 2596 HR 100Shell Brazil Holding B.V. Carel van Bylandtlaan 30, The Hague, 2596 HR 100Shell Business Development Central Asia B.V. Carel van Bylandtlaan 30, The Hague, 2596 HR 100Shell Caspian B.V. Carel van Bylandtlaan 30, The Hague, 2596 HR 100Shell Caspian Pipeline Holdings B.V. Carel van Bylandtlaan 30, The Hague, 2596 HR 100Shell Chemicals Europe B.V. Weena 70, Rotterdam, 3012 CM 100Shell Chemicals Ventures B.V. [k] Carel van Bylandtlaan 30, The Hague, 2596 HR 100Shell China B.V. Carel van Bylandtlaan 30, The Hague, 2596 HR 100Shell China Holdings B.V. Carel van Bylandtlaan 30, The Hague, 2596 HR 100Shell Deepwater Tanzania B.V. Carel van Bylandtlaan 30, The Hague, 2596 HR 100Shell Development Iran B.V. Carel van Bylandtlaan 30, The Hague, 2596 HR 100Shell Downstream Services International B.V. Weena 70, Rotterdam, 3012 CM 100Shell E and P Offshore Services B.V. Carel van Bylandtlaan 30, The Hague, 2596 HR 100Shell Egypt N.V. [e] Carel van Bylandtlaan 30, The Hague, 2596 HR 100Shell Energy Europe B.V. Carel van Bylandtlaan 30, The Hague, 2596 HR 100Shell EP Holdings (EE&ME) B.V. Carel van Bylandtlaan 30, The Hague, 2596 HR 100Shell EP Middle East Holdings B.V. Carel van Bylandtlaan 30, The Hague, 2596 HR 100Shell EP Russia Investments (III) B.V. Carel van Bylandtlaan 30, The Hague, 2596 HR 100Shell EP Russia Investments (V) B.V. Carel van Bylandtlaan 30, The Hague, 2596 HR 100Shell EP Somalia B.V. Carel van Bylandtlaan 30, The Hague, 2596 HR 100Shell EP Wells Equipment Services B.V. Carel van Bylandtlaan 30, The Hague, 2596 HR 100Shell Exploration and Production (78) B.V. Carel van Bylandtlaan 30, The Hague, 2596 HR 100Shell Exploration and Production (79) B.V. Carel van Bylandtlaan 30, The Hague, 2596 HR 100Shell Exploration and Production (82) B.V. Carel van Bylandtlaan 30, The Hague, 2596 HR 100Shell Exploration and Production (83) B.V. Carel van Bylandtlaan 30, The Hague, 2596 HR 100Shell Exploration and Production (84) B.V. Carel van Bylandtlaan 30, The Hague, 2596 HR 100Shell Exploration and Production (85) B.V. Carel van Bylandtlaan 30, The Hague, 2596 HR 100Shell Exploration and Production (86) B.V. Carel van Bylandtlaan 30, The Hague, 2596 HR 100Shell Exploration and Production (87) B.V. Carel van Bylandtlaan 30, The Hague, 2596 HR 100Shell Exploration and Production (88) B.V. Carel van Bylandtlaan 30, The Hague, 2596 HR 100Shell Exploration and Production (89) B.V. Carel van Bylandtlaan 30, The Hague, 2596 HR 100Shell Exploration and Production (90) B.V. Carel van Bylandtlaan 30, The Hague, 2596 HR 100Shell Exploration and Production (91) B.V. Carel van Bylandtlaan 30, The Hague, 2596 HR 100Shell Exploration and Production (XL) B.V. Carel van Bylandtlaan 30, The Hague, 2596 HR 100Shell Exploration and Production (LI) B.V. Carel van Bylandtlaan 30, The Hague, 2596 HR 100Shell Exploration and Production (LVII) B.V. Carel van Bylandtlaan 30, The Hague, 2596 HR 100Shell Exploration and Production (LIX) B.V. Carel van Bylandtlaan 30, The Hague, 2596 HR 100Shell Exploration and Production (LX) B.V. Carel van Bylandtlaan 30, The Hague, 2596 HR 100Shell Exploration and Production (LXI) B.V. Carel van Bylandtlaan 30, The Hague, 2596 HR 100Shell Exploration and Production (LXII) B.V. Carel van Bylandtlaan 30, The Hague, 2596 HR 100
ADDITIONAL INFORMATION SHELL ANNUAL REPORT AND FORM 20-F 2017 E9

Company by country of incorporation Address of registered office %Shell Exploration and Production (LXIII) B.V. Carel van Bylandtlaan 30, The Hague, 2596 HR 100Shell Exploration and Production (LXIV) B.V. Carel van Bylandtlaan 30, The Hague, 2596 HR 100Shell Exploration and Production (LXV) B.V. Carel van Bylandtlaan 30, The Hague, 2596 HR 100Shell Exploration and Production (LXVI) B.V. Carel van Bylandtlaan 30, The Hague, 2596 HR 100Shell Exploration and Production (LXVII) B.V. Carel van Bylandtlaan 30, The Hague, 2596 HR 100Shell Exploration and Production (LXXI) B.V. Carel van Bylandtlaan 30, The Hague, 2596 HR 100Shell Exploration and Production (LXXIV) B.V. Carel van Bylandtlaan 30, The Hague, 2596 HR 100Shell Exploration and Production (LXXV) B.V. Carel van Bylandtlaan 30, The Hague, 2596 HR 100Shell Exploration and Production Holdings B.V. Carel van Bylandtlaan 30, The Hague, 2596 HR 100Shell Exploration and Production Investments B.V. Carel van Bylandtlaan 30, The Hague, 2596 HR 100Shell Exploration and Production Services (RF) B.V. Carel van Bylandtlaan 30, The Hague, 2596 HR 100Shell Exploration and Production South Africa B.V. Carel van Bylandtlaan 30, The Hague, 2596 HR 100Shell Exploration and Production Ukraine I B.V. Carel van Bylandtlaan 30, The Hague, 2596 HR 100Shell Exploration and Production Ukraine Investments (I) B.V. Carel van Bylandtlaan 30, The Hague, 2596 HR 100Shell Exploration and Production Ukraine Investments (II) B.V. Carel van Bylandtlaan 30, The Hague, 2596 HR 100Shell Exploration and Production Ukraine Investments (IV) B.V. Carel van Bylandtlaan 30, The Hague, 2596 HR 100Shell Exploration B.V. Carel van Bylandtlaan 30, The Hague, 2596 HR 100Shell Exploration Company (RF) B.V. Carel van Bylandtlaan 30, The Hague, 2596 HR 100Shell Exploration Company (West) B.V. Carel van Bylandtlaan 30, The Hague, 2596 HR 100Shell Exploration Company B.V. Carel van Bylandtlaan 30, The Hague, 2596 HR 100Shell Exploration Venture Services B.V. Carel van Bylandtlaan 30, The Hague, 2596 HR 100Shell Finance (Netherlands) B.V. Carel van Bylandtlaan 30, The Hague, 2596 HR 100Shell Gas & Power Developments B.V. Carel van Bylandtlaan 30, The Hague, 2596 HR 100Shell Gas (LPG) Holdings B.V. Carel van Bylandtlaan 30, The Hague, 2596 HR 100Shell Gas B.V. Carel van Bylandtlaan 30, The Hague, 2596 HR 100Shell Gas Iraq B.V. Carel van Bylandtlaan 30, The Hague, 2596 HR 100Shell Gas Nigeria B.V. Carel van Bylandtlaan 30, The Hague, 2596 HR 100Shell Gas Venezuela B.V. Carel van Bylandtlaan 30, The Hague, 2596 HR 100Shell Generating (Holding) B.V. Carel van Bylandtlaan 30, The Hague, 2596 HR 100Shell Global Solutions (Eastern Europe) B.V. Carel van Bylandtlaan 30, The Hague, 2596 HR 100Shell Global Solutions International B.V. Kessler Park 1, Rijswijk, 2288 GS 100Shell Global Solutions Services B.V. Carel van Bylandtlaan 30, The Hague, 2596 HR 100Shell Information Technology International B.V. Carel van Bylandtlaan 30, The Hague, 2596 HR 100Shell International B.V. Carel van Bylandtlaan 30, The Hague, 2596 HR 100Shell International Exploration and Production B.V. Carel van Bylandtlaan 16, The Hague, 2596 HR 100Shell International Finance B.V. [a] Carel van Bylandtlaan 30, The Hague, 2596 HR 100Shell Internationale Research Maatschappij B.V. Carel van Bylandtlaan 30, The Hague, 2596 HR 100Shell Internet Ventures B.V. Carel van Bylandtlaan 30, The Hague, 2596 HR 100Shell Iraq B.V. Carel van Bylandtlaan 30, The Hague, 2596 HR 100Shell Iraq Petroleum Development B.V. Carel van Bylandtlaan 30, The Hague, 2596 HR 100Shell Iraq Services B.V. Carel van Bylandtlaan 30, The Hague, 2596 HR 100Shell Kazakhstan B.V. Carel van Bylandtlaan 30, The Hague, 2596 HR 100Shell Kazakhstan Development B.V. Carel van Bylandtlaan 30, The Hague, 2596 HR 100Shell Kuwait Exploration and Production B.V. Carel van Bylandtlaan 30, The Hague, 2596 HR 100Shell LNG Port Spain B.V. Carel van Bylandtlaan 30, The Hague, 2596 HR 100Shell Lubricants Supply Company B.V. Weena 70, Rotterdam, 3012 CM 100Shell Manufacturing Services B.V. Carel van Bylandtlaan 30, The Hague, 2596 HR 100Shell Mozambique B.V. Carel van Bylandtlaan 30, The Hague, 2596 HR 100Shell MSPO 2 Holding B.V. Vondelingenweg 601, Vondelingenplaat, Rotterdam, 3196 KK 100Shell Namibia Upstream B.V. Carel van Bylandtlaan 30, The Hague, 2596 HR 100Shell Nanhai B.V. Carel van Bylandtlaan 30, The Hague, 2596 HR 100Shell Nederland B.V. Carel van Bylandtlaan 30, The Hague, 2596 HR 100Shell Nederland Chemie B.V. [i] Chemieweg 25, P.O. Box 6060, Moerdijk, 4780 LN 100Shell Nederland Raffinaderij B.V. Vondelingenweg 601, Vondelingenplaat, Rotterdam, 3196 KK 100Shell Nederland Verkoopmaatschappij B.V. Weena 70, Rotterdam, 3012 CM 100Shell Nusantara Trading B.V. Carel van Bylandtlaan 30, The Hague, 2596 HR 100Shell Offshore (Personnel) Services B.V. Carel van Bylandtlaan 30, The Hague, 2596 HR 100Shell Offshore North Gabon B.V. Carel van Bylandtlaan 30, The Hague, 2596 HR 100Shell Offshore Services B.V. Carel van Bylandtlaan 30, The Hague, 2596 HR 100Shell OKLNG Holdings B.V. Carel van Bylandtlaan 30, The Hague, 2596 HR 100Shell Olie - OG Gasudvinding Danmark B.V. Carel van Bylandtlaan 30, The Hague, 2596 HR 100Shell Olie OG Gas Holding B.V. [k] Carel van Bylandtlaan 30, The Hague, 2596 HR 100Shell Oman Exploration and Production B.V. Carel van Bylandtlaan 30, The Hague, 2596 HR 100Shell Overseas Investments B.V. Carel van Bylandtlaan 30, The Hague, 2596 HR 100Shell Pensioenbureau Nederland B.V. Postbus 157, The Hague, 2501 CD 100Shell Petroleum N.V. [a] Carel van Bylandtlaan 30, The Hague, 2596 HR 100Shell Philippines Exploration B.V. Carel van Bylandtlaan 30, The Hague, 2596 HR 100Shell Project Development (VIII) B.V. Carel van Bylandtlaan 30, The Hague, 2596 HR 100Shell RDS Holding B.V. Carel van Bylandtlaan 30, The Hague, 2596 HR 100
ADDITIONAL INFORMATION SHELL ANNUAL REPORT AND FORM 20-F 2017 E10

Company by country of incorporation Address of registered office %Shell Sakhalin Holdings B.V. Carel van Bylandtlaan 30, The Hague, 2596 HR 100Shell Sakhalin Services B.V. Carel van Bylandtlaan 30, The Hague, 2596 HR 100Shell Salym Development B.V. Carel van Bylandtlaan 30, The Hague, 2596 HR 100Shell Services Oman B.V. Carel van Bylandtlaan 30, The Hague, 2596 HR 100Shell Shared Services (Asia) B.V. Carel van Bylandtlaan 30, The Hague, 2596 HR 100Shell South Africa Upstream B.V. Carel van Bylandtlaan 30, The Hague, 2596 HR 100Shell TapUp B.V. Hofplein 20, Rotterdam, 3032 AC 100Shell Technology Ventures B.V. Carel van Bylandtlaan 30, The Hague, 2596 HR 100Shell Technology Ventures Fund 1 B.V. Teleportboulevard 140, Amsterdam, 1043 EJ 52Shell Technology Ventures Investments B.V. Carel van Bylandtlaan 30, The Hague, 2596 HR 100Shell Trademark Management B.V. Carel van Bylandtlaan 30, The Hague, 2596 HR 100Shell Trading Rotterdam B.V. Weena 70, Rotterdam, 3012 CM 100Shell Trading Russia B.V. Carel van Bylandtlaan 30, The Hague, 2596 HR 100Shell Upstream Albania B.V. Carel van Bylandtlaan 30, The Hague, 2596 HR 100Shell Upstream Development B.V. Carel van Bylandtlaan 30, The Hague, 2596 HR 100Shell Upstream Indonesia Services B.V. Carel van Bylandtlaan 30, The Hague, 2596 HR 100Shell Upstream Spain B.V. Carel van Bylandtlaan 30, The Hague, 2596 HR 100Shell Upstream Turkey B.V. Carel van Bylandtlaan 30, The Hague, 2596 HR 100Shell Western LNG B.V. Carel van Bylandtlaan 30, The Hague, 2596 HR 100Shell Windenergy Netherlands B.V. Carel van Bylandtlaan 30, The Hague, 2596 HR 100Shell Windenergy NZW I B.V. Carel van Bylandtlaan 30, The Hague, 2596 HR 100Snijders Olie B.V. Weena 70, Rotterdam, 3012 CM 100Syria Shell Petroleum Development B.V. [j] Carel van Bylandtlaan 30, The Hague, 2596 HR 65Tamba B.V. Carel van Bylandtlaan 30, The Hague, 2596 HR 50Tankstation Exploitatie Maatschappij Holding B.V. Weena 70, Rotterdam, 3012 CM 100The New Motion B.V. Rigakade 20, Amsterdam, 1013 BC 100Tupi B.V. Wilhelminatoren, Wilhelminaplein 14, Rotterdam, 3072 25Waalbrug Exploitatie Maatschappij B.V. Henri Berssenbruggestraat 9, Deventer, 7425 SB 100Zeolyst C.V. Oosterhorn 36, Farmsum, 9936 HD 50
NEW ZEALAND Energy Finance NZ Limited Level 10, ASB Tower, 2 Hunter Street, P.O. Box 1873, Wellington, 6011 100Energy Holdings Offshore Limited Level 10, ASB Tower, 2 Hunter Street, P.O. Box 1873, Wellington, 6011 100Energy Infrastructure Limited Level 10, ASB Tower, 2 Hunter Street, P.O. Box 1873, Wellington, 6011 100Energy Petroleum Holdings Limited Level 10, ASB Tower, 2 Hunter Street, P.O. Box 1873, Wellington, 6011 100Energy Petroleum Investments Limited [i] Level 10, ASB Tower, 2 Hunter Street, P.O. Box 1873, Wellington, 6011 100Energy Petroleum Taranaki Limited Level 10, ASB Tower, 2 Hunter Street, P.O. Box 1873, Wellington, 6011 100Maui Development Limited Level 10, ASB Tower, 2 Hunter Street, P.O. Box 1873, Wellington, 6011 84Shell (Petroleum Mining) Company Limited Level 10, ASB Tower, 2 Hunter Street, P.O. Box 1873, Wellington, 6011 100Shell Energy Asia Limited Level 10, ASB Tower, 2 Hunter Street, P.O. Box 1873, Wellington, 6011 100Shell Exploration NZ Ltd [i] Level 10, ASB Tower, 2 Hunter Street, P.O. Box 1873, Wellington, 6011 100Shell GSB Limited Level 10, ASB Tower, 2 Hunter Street, P.O. Box 1873, Wellington, 6011 100Shell Investments NZ Limited Level 10, ASB Tower, 2 Hunter Street, P.O. Box 1873, Wellington, 6011 100Shell New Zealand (2011) Limited [i] Level 10, ASB Tower, 2 Hunter Street, P.O. Box 1873, Wellington, 6011 100Shell New Zealand Pensions Limited Level 10, ASB Tower, 2 Hunter Street, P.O. Box 1873, Wellington, 6011 100Shell Taranaki Limited Level 10, ASB Tower, 2 Hunter Street, P.O. Box 1873, Wellington, 6011 100Southern Petroleum No Liability Level 10, ASB Tower, 2 Hunter Street, P.O. Box 1873, Wellington, 6011 100Taranaki Offshore Petroleum Company of New Zealand Level 10, ASB Tower, 2 Hunter Street, P.O. Box 1873, Wellington, 6011 100
NICARAGUA Compañía Química Nicaragüense S.A. Hospital Militar, 1C al Norte 10, VRS Oeste Cas Bolonia, Managua 100
NIGERIA All on Partnerships for Energy Access Limited by Guarantee 44 Bourdillon Road, Ikoyi, Lagos 100BG Exploration and Production Nigeria Limited Eko Nominees Limited, 252E Muri Okunola Street, Victoria Island, Lagos 100BG Upstream A Nigeria Limited Eko Nominees Limited, 252E Muri Okunola Street, Victoria Island, Lagos 100Delta Business Development Limited Freeman House, 21/22 Marina, P.M.B. 2418, Lagos 100Nigeria LNG Limited Corporate Office, Intels Aba Road Estate, Km16 Aba Expressway, Port Harcourt, 500211 26NLNG Ship Manning Limited Corporate Office, Intels Aba Road Estate, Km16 Aba Expressway, Port Harcourt, 500211 20Shell Exploration and Production Africa Limited Freeman House, 21/22 Marina, P.M.B. 2418, Lagos 100Shell Nigeria Closed Pension Fund Administrator Ltd Freeman House, 21/22 Marina, P.M.B. 2418, Lagos 100Shell Nigeria Exploration and Production Company Ltd Freeman House, 21/22 Marina, P.M.B. 2418, Lagos 100Shell Nigeria Exploration and Production Delta Limited Freeman House, 21/22 Marina, P.M.B. 2418, Lagos 100Shell Nigeria Exploration and Production Echo Limited Freeman House, 21/22 Marina, P.M.B. 2418, Lagos 100Shell Nigeria Exploration Properties Alpha Limited Freeman House, 21/22 Marina, P.M.B. 2418, Lagos 100Shell Nigeria Exploration Properties Beta Limited Freeman House, 21/22 Marina, P.M.B. 2418, Lagos 100Shell Nigeria Exploration Properties Charlie Limited Freeman House, 21/22 Marina, P.M.B. 2418, Lagos 100Shell Nigeria Gas Ltd (SNG) Freeman House, 21/22 Marina, P.M.B. 2418, Lagos 100Shell Nigeria Infrastructure Development Limited Freeman House, 21/22 Marina, P.M.B. 2418, Lagos 100Shell Nigeria Offshore Prospecting Limited Freeman House, 21/22 Marina, P.M.B. 2418, Lagos 100Shell Nigeria Oil Products Limited (SNOP) Freeman House, 21/22 Marina, P.M.B. 2418, Lagos 100Shell Nigeria Ultra Deep Limited Freeman House, 21/22 Marina, P.M.B. 2418, Lagos 100
ADDITIONAL INFORMATION SHELL ANNUAL REPORT AND FORM 20-F 2017 E11

Company by country of incorporation Address of registered office %Shell Nigeria Upstream Ventures Limited Freeman House, 21/22 Marina, P.M.B. 2418, Lagos 100Shell Thrift & Loan Fund Trustees Nig Ltd Freeman House, 21/22 Marina, P.M.B. 2418, Lagos 99The Shell Petroleum Development Company of Nigeria Limited Shell Industrial Area, Port Harcourt, Rivers State, P.O. Box 263, Port Harcourt 100
NORWAY A/S Norske Shell Tankvegen 1, Tananger, 4056 100Aviation Fuelling Services Norway AS Karenslyst Allé 2, Oslo, 0278 50Gasnor AS Helganesvegen 59, Karmoy, 4262 Avalsnes 100Ormen Lange Eiendom DA Nyhamna, Aukra, 6480 18Shell Marine Products AS Karenslyst Allé 2, Oslo, 0278 100Vestprosess DA Forusbeen 50, Stavanger, 4035 8
OMAN Oman LNG LLC P.O. Box 560, Mina Al Fahal, Muscat, 116 30Petroleum Development Oman LLC P.O. Box 81, Mina Al Fahal, Muscat, 113 34Shell Development Oman LLC P.O. Box 74, Mina Al Fahal, Muscat, 116 100Shell Oman Marketing Company SAOG P.O. Box 38, Mina Al Fahal, Muscat, 116 49
PAKISTAN Pak Arab Pipeline Company Limited House No. 2-B, Nazimuddin Road, F-8/1, Islamabad, 75400 20Pakistan Refinery Limited Korangi Creek Road, P.O. Box 4612, Karachi, 75190 32Shell Pakistan Limited Shell House, 6 Ch. Khaliquzzaman Road, Karachi, 75530 76
PERU Shell GNL Peru S.A.C. Calle Dean Valdivia 111, Oficina 802, San Isidro, Lima, Lima 27 100Shell Operaciones Peru S.A.C. Calle Dean Valdivia 111, Oficina 802, San Isidro, Lima, Lima 27 100
PHILIPPINES Bonifacio Gas Corporation 2nd Floor, Bonifacio Tech. Center, 31st Street cor. 2nd Avenue, Crescent Park West, Bonifacio Global City, Taguig, Metro Manila 24First Philippine Industrial Corporation 6F, Rockwell Business Center Tower, Ortigas Avenue, Pasig City, 1605 40Kamayan Realty Corporation NDC Bldg., 116 Tordesillas St., Salcedo Village, Makati City, Metro Manila, 1227 22Pilipinas Shell Petroleum Corporation Shellhouse, 156 Valero Street, Salcedo Village, Brgy. Bel-Air, Makati City, Metro Manila, 1227 55Shell Chemicals Philippines, Inc. Shellhouse, 156 Valero Street, Salcedo Village, Brgy. Bel-Air, Makati City, Metro Manila, 1227 100Shell Gas and Energy Philippines Corporation Shellhouse, 156 Valero Street, Salcedo Village, Brgy. Bel-Air, Makati City, Metro Manila, 1227 100Shell Gas Trading (Asia Pacific), Inc. Subic Bay Free Port Zone, Olangapo City, 2200 100Shell Solar Philippines Corporation Shellhouse, 156 Valero Street, Salcedo Village, Brgy. Bel-Air, Makati City, Metro Manila, 1227 100Tabangao Realty, Inc. Shellhouse, 156 Valero Street, Salcedo Village, Brgy. Bel-Air, Makati City, Metro Manila, 1227 40
POLAND Shell Polska Sp. z o.o. ul. Bitwy Warszawskiej 1920 r. nr 7A, Warsaw, 02-366 100
PORTUGAL Shell Madeira Praia Formosa Av. dos Combatentes da Grande Guerra nº 17, Freguesia de S. Juliao, Setúbal, 2900-329 100
PUERTO RICO BG Puerto Rico, Inc. 403 Munoz Rivera Avenue, (Hato Rey), San Juan, 00918-3345 100Station Managers of Puerto Rico, Inc. P.O. Box 186, Yabucoa, PR 00767-0186 100
QATAR Qatar Liquefied Gas Company Limited (4) P.O. Box 22666, Doha 30Qatar Shell Research & Technology Centre QSTP-LLC Qatar Science & Technology Park Tech1, Office 101, P.O. Box 3747, Doha 100Qatar Shell Service Company W.L.L. Al Mirqab Tower, West Bay, P.O. Box 3747, Doha 100
RUSSIA Khanty-Mansiysk Petroleum Alliance Closed Joint Stock Company [b] 24 A Yakubovicha ul., Saint Petersburg, 190000 50Limited Liability Company "Shell Neftegaz Development (IV)" Novinsky blvd, 31, Moscow, 123242 100Limited Liability Company "Shell Neftegaz Development (V)" Novinsky blvd, 31, Moscow, 123242 100Limited Liability Company “Shell Neft” 24 Bld D Smolnaya street, Moscow, 125445 100Syriaga Neftegaz Development Novinsky blvd, 31, Moscow, 123242 100
SAINT KITTS AND NEVIS Shell Oil & Gas (Malaysia) LLC Morning Star Holdings Limited, Main Street, Suite 556, Charlestown, Nevis, West Indies 90
SAINT LUCIA BG Atlantic 1 Holdings Limited Mercury Court, Choc Estate, Castries 100BG Atlantic 2/3 Holdings Limited Mercury Court, Choc Estate, Castries 100BG Atlantic 4 Holdings Limited Mercury Court, Choc Estate, Castries 100BG Central Holdings Limited Mercury Court, Choc Estate, Castries 100BG West Indies No. 2 Limited Mercury Court, Choc Estate, Castries 100
SAUDI ARABIA Al Jomaih and Shell Lubricating Oil Co.Ltd. P.O. Box 41467, Riyadh, 11521 50Peninsular Aviation Services Company Limited P.O. Box 6369, Jeddah, 21442 25Saudi Aramco Shell Refinery Company [b] P.O. Box 10088, Madinat Al-Jubail Al-Sinaiyah, Al Jubail, 31961 50Shell Global Solutions Saudi Arabia LLC P.O. Box 16996, Riyadh, 11474 100
SINGAPORE BG Asia Pacific Holdings Pte. Limited The Metropolis Tower 1, 9 North Buona Vista Drive, #07-01, Singapore, 138588 100BG Asia Pacific Services Pte. Ltd. The Metropolis Tower 1, 9 North Buona Vista Drive, #07-01, Singapore, 138588 100BG Exploration & Production Myanmar Pte. Ltd. The Metropolis Tower 1, 9 North Buona Vista Drive, #07-01, Singapore, 138588 100BG Insurance Company (Singapore) Pte Ltd 10 Collyer Quay, #10-01 Ocean Financial Centre, Singapore, 049315 100BG Myanmar Pte. Ltd. The Metropolis Tower 1, 9 North Buona Vista Drive, #07-01, Singapore, 138588 100
ADDITIONAL INFORMATION SHELL ANNUAL REPORT AND FORM 20-F 2017E12

Company by country of incorporation Address of registered office %BG Oil Marketing Pte Ltd The Metropolis Tower 1, 9 North Buona Vista Drive, #07-01, Singapore, 138588 100CRI/Criterion Marketing Asia Pacific Pte Ltd The Metropolis Tower 1, 9 North Buona Vista Drive, #07-01, Singapore, 138588 100Ellba Eastern (Pte) Ltd The Metropolis Tower 1, 9 North Buona Vista Drive, #07-01, Singapore, 138588 100Fuelng Pte. Ltd 50 Gul Road, Singapore, 629351 50Infineum Singapore Pte Ltd 31 International Business Park, #04-08, Creative Resource, Singapore, 609921 50QPI and Shell Petrochemicals (Singapore) Pte Ltd The Metropolis Tower 1, 9 North Buona Vista Drive, #07-01, Singapore, 138588 51Shell Chemicals Seraya Pte. Ltd. The Metropolis Tower 1, 9 North Buona Vista Drive, #07-01, Singapore, 138588 100Shell Eastern Petroleum (Pte) Ltd [i] The Metropolis Tower 1, 9 North Buona Vista Drive, #07-01, Singapore, 138588 100Shell Eastern Trading (Pte) Ltd [i] The Metropolis Tower 1, 9 North Buona Vista Drive, #07-01, Singapore, 138588 100Shell Gas Marketing Pte. Ltd. The Metropolis Tower 1, 9 North Buona Vista Drive, #07-01, Singapore, 138588 100Shell India Ventures Pte. Ltd. The Metropolis Tower 1, 9 North Buona Vista Drive, #07-01, Singapore, 138588 100Shell Integrated Gas Thailand Pte.Limited The Metropolis Tower 1, 9 North Buona Vista Drive, #07-01, Singapore, 138588 100Shell International Shipping Services (Pte) Ltd The Metropolis Tower 1, 9 North Buona Vista Drive, #07-01, Singapore, 138588 100Shell Myanmar Energy Pte. Ltd. The Metropolis Tower 1, 9 North Buona Vista Drive, #07-01, Singapore, 138588 100Shell Myanmar Petroleum Pte. Ltd. The Metropolis Tower 1, 9 North Buona Vista Drive, #07-01, Singapore, 138588 100Shell Pulau Moa Pte Ltd The Metropolis Tower 1, 9 North Buona Vista Drive, #07-01, Singapore, 138588 100Shell Seraya Pioneer (Pte) Ltd The Metropolis Tower 1, 9 North Buona Vista Drive, #07-01, Singapore, 138588 100Shell Singapore Trustees (Pte) Ltd The Metropolis Tower 1, 9 North Buona Vista Drive, #07-01, Singapore, 138588 100Shell Tankers (Singapore) Private Limited The Metropolis Tower 1, 9 North Buona Vista Drive, #07-01, Singapore, 138588 100Shell Treasury Centre East (Pte) Ltd The Metropolis Tower 1, 9 North Buona Vista Drive, #07-01, Singapore, 138588 100Singapore Lube Park Pte. Ltd. [b] The Metropolis Tower 1, 9 North Buona Vista Drive, #07-01, Singapore, 138588 44Sirius Well Manufacturing Services Pte. Ltd. 83 Clemenceau Avenue #04-00, Singapore, 239920 50
SLOVAKIA SHELL Slovakia s.r.o. Einsteinova 23, Bratislava, 851 01 100
SLOVENIA Shell Adria d.o.o. Bravnicarjeva ulica 13, Ljubljana, 1000 100
SOUTH AFRICA Bituguard Southern Africa (Pty) Ltd Twickenham, The Campus, 57 Sloan Street, Epsom Downs, Bryanston, 2021 36Blendcor (Pty) Ltd. [b] Honshu Road, Durban, 4001 36Sekelo Oil Trading (Pty) Limited Suite OE/1, The Nautica, The Waterclub, Beach Road, Granger Bay, Cape Town, 8001 43Shell & BP South African Petroleum Refineries (Pty) Limited [b] Reunion, Durban, 4001 36Shell Downstream South Africa (Pty) Ltd Twickenham, The Campus, 57 Sloan Street, Epsom Downs, Bryanston, 2021 72Shell Global Customer Services Centre CA Media City, 10 Rua Vasco Da Gama, Cape Town, 8001 100Shell South Africa Energy (Pty) Ltd Twickenham, The Campus, 57 Sloan Street, Epsom Downs, Bryanston, 2021 100Shell South Africa Exploration (Pty) Limited Twickenham, The Campus, 57 Sloan Street, Epsom Downs, Bryanston, 2021 100Shell South Africa Holdings (Pty) Ltd Twickenham, The Campus, 57 Sloan Street, Epsom Downs, Bryanston, 2021 100STISA (Pty) Limited Suite OE/2, The Nautica, The Waterclub, Beach Road, Granger Bay, Cape Town, 8001 72
SOUTH KOREA Hankook Shell Oil Company No 250, Sinsun-ro, Nam-gu, Busan, 48561 54Hyundai and Shell Base Oil Co., Ltd 640-6, Daejuk-ri, Daesan-eup, Seosan-shi, Chungchongnam-do, 356-713 40
SPAIN BG Energy Iberian Holdings, S.L. Paseo de la Castellana, 257-6º, Madrid, 28046 100Shell & Disa Aviation España, S.L. Rio Bullaque, 2, Madrid, 28034 50Shell España, S.A. Paseo de la Castellana, 257-6º, Madrid, 28046 100Shell Spain LNG, S.A.U. Paseo de la Castellana, 257-6º, Madrid, 28046 100
SUDAN Shell (Sudan) Petroleum Development Company Limited Shell House, P.O. Box 320, Khartoum 100
SWEDEN A Flygbranslehantering Aktiebolag P.O. Box 135, Stockholm-Arlanda, 190 46 25BG International Services AB Deloitte, P.O. Box 450, Ostersund, 831 26 100Gothenburgh Fuelling Company AB P.O. Box 2154, Gothenburg, 438 14 33Malmoe Fuelling Services AB Sturup Flygplats, P.O. Box 22, Malmoe, 230 32 33Shell Aviation Sweden AB Gustavslundsvagen 22, Bromma, 16751 100Stockholm Fuelling Services AB P.O. Box 85, Stockholm-Arlanda, 190 45 25
SWITZERLAND Bully 1 (Switzerland) GmbH Dorfstrasse 19a, Baar, 6340 50Bully 2 (Switzerland) GmbH Dorfstrasse 19a, Baar, 6340 50Saraco SA Route de Pré-Bois 17, Cointrin, 1216 20Shell (Switzerland) AG Baarermatte, Baar, 6340 100Shell Brands International AG Baarermatte, Baar, 6340 100Shell Corporate Services Switzerland AG Baarermatte, Baar, 6340 100Shell Finance Switzerland AG Baarermatte, Baar, 6340 100Shell Holdings Switzerland AG Baarermatte, Baar, 6340 100Shell Lubricants Switzerland AG Steigerhubelstrasse 8, Bern, 3008 100Shell Trading Switzerland AG Baarermatte, Baar, 6340 100Shell Treasury Company Switzerland AG Baarermatte, Baar, 6340 100SOGEP Sociéte Genevoise des Pétroles SA Route de Vernier 132, Vernier, 1214 34Solen Versicherungen AG Baarermatte, Baar, 6340 100Stazioni Autostradali Bellinzona SA Autostrada A2 (direzione Gottardo), Hotel Bellinzona Sud, Monte Carasso, 6513 50
ADDITIONAL INFORMATION SHELL ANNUAL REPORT AND FORM 20-F 2017 E13

Company by country of incorporation Address of registered office %UBAG - Unterflurbetankungsanlage Flughafen Zürich AG Zwüscheteich, Rümlang, 8153 20
SYRIA Al Badiah Petroleum Company Damascus New Sham Western Dummar, Island No 1 - Property 2299, P.O. Box 7660, Damascus 22Al Furat Petroleum Company Damascus New Sham Western Dummar, Island No 1 - Property 2299, P.O. Box 7660, Damascus 20
TAIWAN CPC Shell Lubricants Co. Ltd No 2, Tso-Nan Road, Nan-Tze District, P.O. Box 25-30, Kaohsiung, 811 51Shell Taiwan Limited International Trade Building, Room 2001, 20th Floor, 333, Keelung Road Section 1, Taipei, 110 100
TANZANIA Fahari Gas Marketing Company Limited 1st Floor Kilwa House, Plot 369, Toure Drive, Oyster Bay, P.O. Box 105833, Dar es Salaam 53Mzalendo Gas Processing Company Limited 1st Floor Kilwa House, Plot 369, Toure Drive, Oyster Bay, P.O. Box 105833, Dar es Salaam 53Ruvuma Pipeline Company Limited 1st Floor Kilwa House, Plot 369, Toure Drive, Oyster Bay, P.O. Box 105833, Dar es Salaam 53Shell Tanzania Limited De Ocean Plaza, 3rd Floor, Plot 400, Toure Drive, Masaki, P.O. Box 9404, Dar es Salaam 100Tanzania LNG Limited 1st Floor Kilwa House, Plot 369, Toure Drive, Oyster Bay, P.O. Box 105833, Dar es Salaam 100
THAILAND Pattanadhorn Company Limited 10 Soonthornkosa Road, Klongtoey, Bangkok, 10110 42Sahapanichkijphun Company Limited 10 Soonthornkosa Road, Klongtoey, Bangkok, 10110 42Shell Global Solutions (Thailand) Limited 10 Soonthornkosa Road, Klongtoey, Bangkok, 10110 48Shell Global Solutions Holdings (Thailand) Limited 10 Soonthornkosa Road, Klongtoey, Bangkok, 10110 49Thai Energy Company Limited 10 Soonthornkosa Road, Klongtoey, Bangkok, 10110 100Unitas Company Limited 10 Soonthornkosa Road, Klongtoey, Bangkok, 10110 42
TRINIDAD AND TOBAGO BG 2/3 Investments Limited 5 Saint Clair Avenue, Saint Clair, Port of Spain 100Point Fortin LNG Exports Limited 5 Saint Clair Avenue, Saint Clair, Port of Spain 63Shell Gas Supply Trinidad Limited 5 Saint Clair Avenue, Saint Clair, Port of Spain 100Shell LNG T&T Ltd 5 Saint Clair Avenue, Saint Clair, Port of Spain 100Shell Manatee Limited 5 Saint Clair Avenue, Saint Clair, Port of Spain 100Shell Trinidad Central Block Limited 5 Saint Clair Avenue, Saint Clair, Port of Spain 100Shell Trinidad Ltd Shell Energy House, 5 St. Clair Avenue, Point Lisas, Port of Spain 100The International School of Port of Spain Limited 1 International Drive, Westmoorings 25TRINLING Limited 5 Saint Clair Avenue, Saint Clair, Port of Spain 100
TUNISIA Amilcar Petroleum Operations S.A. Immeuble Mezghenni, Rue Windermere BP36, Les Berges du Lac, Tunis, 1053 50Shell Tunisia LPG S.A. Immeuble Rue du Lac Windermere, Les Berges du Lac, Tunis, 1053 100Tunisian Processing S.A. Immeuble Rue du Lac Windermere, Les Berges du Lac, Tunis, 1053 100
TURKEY Ambarli Depolama Hizmetleri Ltd. Sti. Yakuplu Mah. Gencosman Cad. No:7, Beylikduzu, Istanbul, 34524 35Cekisan Depolama Hizmetleri Ltd. Sti. Yakuplu Mah. Gencosman Cad. No:3, Beylikduzu, Istanbul, 34524 35Marmara Depoculuk Hizmetleri A.S. Sultankoy Mahallesi Maltepe Sokak No:66, Marmara Ereglisi, Tekirdag, 59750 32Samsun Akaryakit ve Depolama A.S. Dilovasi Organize Sanayi Bolgesi 1.Kisim 1004 Sokak No:10, Dilovasi, Kocaeli 35Shell & Turcas Petrol A.S. Gulbahar Mah.Salih Tozan Sok., Karamancilar Is Merkezi B Blok No:18, Esentepe, Sisli, Istanbul, 34394 70Shell Enerji A.S. Gulbahar Mah.Salih Tozan Sok., Karamancilar Is Merkezi B Blok No:18, Esentepe, Sisli, Istanbul, 34394 100Shell Petrol A.S. Gulbahar Mah.Salih Tozan Sok., Karamancilar Is Merkezi B Blok No:18, Esentepe, Sisli, Istanbul, 34394 70
UKRAINE Shell Ukraine Exploration and Production I LLC 4 Mykoly Grinchenka street, Kiev, 03038 100
UNITED ARAB EMIRATES ADNOC Gas Processing P.O. Box 665, Abu Dhabi 15Emdad Aviation Fuel Storage FZCO Emdad Aviation Fuel Storage FZCO, P.O. Box 261781, Jebel Ali, Dubai 32Sharjah Fuelling Services Company Ltd. P.O. Box 4225, Sharjah, 4225 49
UK Alie Investments Limited Shell Centre, London, SE1 7NA 100Angkor Shell Limited Shell Centre, London, SE1 7NA 100Autogas Limited Athena House, Athena Drive, Tachbrook Park, Warwick, CV34 6RL 50BG Aruba Limited Shell Centre, London, SE1 7NA 100BG Atlantic Finance Limited Shell Centre, London, SE1 7NA 100BG Central Holdings Limited Shell Centre, London, SE1 7NA 100BG Central Investments Limited Shell Centre, London, SE1 7NA 100BG CSB2 Limited Shell Centre, London, SE1 7NA 100BG Cyprus Limited Shell Centre, London, SE1 7NA 100BG Delta Limited Shell Centre, London, SE1 7NA 100BG Employee Shares Trustees Limited Shell Centre, London, SE1 7NA 100BG Energy Capital Plc Shell Centre, London, SE1 7NA 100BG Energy Holdings Limited Shell Centre, London, SE1 7NA 100BG Energy Marketing Limited Shell Centre, London, SE1 7NA 100BG Energy Trading Limited Shell Centre, London, SE1 7NA 100BG Equatorial Guinea Limited Shell Centre, London, SE1 7NA 100BG Exploration and Production Limited Shell Centre, London, SE1 7NA 100BG Finance Investments Limited Shell Centre, London, SE1 7NA 100BG Gas Marketing Limited Shell Centre, London, SE1 7NA 100BG Gas Services Limited Shell Centre, London, SE1 7NA 100
ADDITIONAL INFORMATION SHELL ANNUAL REPORT AND FORM 20-F 2017 E14

Company by country of incorporation Address of registered office %BG Gas Supply (UK) Limited Shell Centre, London, SE1 7NA 100BG General Holdings Limited Shell Centre, London, SE1 7NA 100BG General Investments Shell Centre, London, SE1 7NA 100BG General Partner Limited 50 Lothian Road, Festival Square, Edinburgh, EH3 9WJ 100BG Global Employee Resources Limited Shell Centre, London, SE1 7NA 100BG Global Energy Limited Shell Centre, London, SE1 7NA 100BG Great Britain Limited Shell Centre, London, SE1 7NA 100BG Group Company Secretaries Limited Shell Centre, London, SE1 7NA 100BG Group Employee Benefit Trust Limited Shell Centre, London, SE1 7NA 100BG Group Employee Shares Trustees Limited Shell Centre, London, SE1 7NA 100BG Group Healthcare Trustee Limited Shell Centre, London, SE1 7NA 100BG Group Limited Shell Centre, London, SE1 7NA 100BG Group Pension Trustees Limited Shell Centre, London, SE1 7NA 100BG Group Trustees Limited Shell Centre, London, SE1 7NA 100BG Intellectual Property Limited Shell Centre, London, SE1 7NA 100BG International Limited Shell Centre, London, SE1 7NA 100BG Iran Limited Shell Centre, London, SE1 7NA 100BG Karachaganak Limited Shell Centre, London, SE1 7NA 100BG Karachaganak Trading Limited Shell Centre, London, SE1 7NA 100BG Kenya L10A Limited Shell Centre, London, SE1 7NA 100BG Kenya L10B Limited Shell Centre, London, SE1 7NA 100BG LNG Investments Limited Shell Centre, London, SE1 7NA 100BG LNG Transport No.5 Limited Shell Centre, London, SE1 7NA 100BG Mongolia Holdings Limited Shell Centre, London, SE1 7NA 100BG Netherlands Shell Centre, London, SE1 7NA 100BG Netherlands Financing Unlimited Shell Centre, London, SE1 7NA 100BG Norge Exploration Limited Shell Centre, London, SE1 7NA 100BG Norge Limited Shell Centre, London, SE1 7NA 100BG North Investments Limited Shell Centre, London, SE1 7NA 100BG North Sea Holdings Limited Shell Centre, London, SE1 7NA 100BG OKLNG Limited Shell Centre, London, SE1 7NA 100BG Omikron Limited Shell Centre, London, SE1 7NA 100BG Overseas Holdings Limited Shell Centre, London, SE1 7NA 100BG Overseas Investments Limited Shell Centre, London, SE1 7NA 100BG Overseas Limited Shell Centre, London, SE1 7NA 100BG Pension Funding Scottish Limited Partnership [l] 50 Lothian Road, Festival Square, Edinburgh, EH3 9WJ 100BG Rosetta Limited Shell Centre, London, SE1 7NA 100BG Singapore Limited Shell Centre, London, SE1 7NA 100BG South Asia LNG Limited Shell Centre, London, SE1 7NA 100BG South East Asia Limited Shell Centre, London, SE1 7NA 100BG Subsea Well Project Limited Shell Centre, London, SE1 7NA 100BG Tanzania Holdings Limited Shell Centre, London, SE1 7NA 100BG Thailand Limited Shell Centre, London, SE1 7NA 100BG Trinidad LNG Limited Shell Centre, London, SE1 7NA 100BG UK Capital II Limited Shell Centre, London, SE1 7NA 100BG UK Capital Limited Shell Centre, London, SE1 7NA 100BG UK Holdings Limited Shell Centre, London, SE1 7NA 100Brazil Shipping I Limited Shell Centre, London, SE1 7NA 100Brazil Shipping II Limited Shell Centre, London, SE1 7NA 100British Pipeline Agency Limited 5-7 Alexandra Road, Hemel Hempstead, Herts, HP2 5BS 50CRI Catalyst Company Europe Limited Shell Centre, London, SE1 7NA 100CRI/Criterion Catalyst Company Limited Shell Centre, London, SE1 7NA 100Dragon LNG Group Limited Main Road, Waterston, Milford Haven, Pembrokeshire, SA73 1DR 50Eastham Refinery Limited [b] 8 York Road, London, SE1 7NA 50Enterprise Oil Limited 8 York Road, London, SE1 7NA 100Enterprise Oil Middle East Limited 8 York Road, London, SE1 7NA 100Enterprise Oil Norge Limited 8 York Road, London, SE1 7NA 100Enterprise Oil Operations Limited 8 York Road, London, SE1 7NA 100Enterprise Oil U.K. Limited 8 York Road, London, SE1 7NA 100Farepilot Limited Shell Centre, London, SE1 7NA 87Framecroft Limited Shell Centre, London, SE1 7NA 100Gainrace Limited 8 York Road, London, SE1 7NA 100Gatwick Airport Storage and Hydrant Company Limited 8 York Road, London, SE1 7NA 13Glossop Limited 8 York Road, London, SE1 7NA 100GOGB Limited 8 York Road, London, SE1 7NA 100Heathrow Airport Fuel Company Limited Building 1204, Sandringham Road, Heathrow Airport, Hounslow, Middlesex, TW6 3SH 14Heathrow Hydrant Operating Company Limited Building 1204, Sandringham Road, Heathrow Airport, Hounslow, Middlesex, TW6 3SH 10
[l] Established by BG Group plc and the BG Trustee in 2013 as part of funding agreements associated with the BG pension scheme. Under the exemption conferred by Regulation 7 of the Partnerships (Accounts) Regulations 2008, the accounts of this partnership have not beenappended to Shell’s Consolidated Financial Statements and have not been filed at the Companies House.
ADDITIONAL INFORMATION SHELL ANNUAL REPORT AND FORM 20-F 2017 E15

Company by country of incorporation Address of registered office %Holaw (619) Limited Shell Centre, London, SE1 7NA 100International Inland Waterways, Limited 8 York Road, London, SE1 7NA 100Karachaganak Project Development Limited [b] Shell Centre, London, SE1 7NA 38Khmer Shell Limited Shell Centre, London, SE1 7NA 100Kite Power Systems Limited 146 New London Road, Chelmsford, Essex, CM2 0AW 34Lensbury Limited Broom Road, Teddington, Middlesex, TW11 9NU 100Manchester Airport Storage and Hydrant Company Limited 50 Broadway, London, SW1H 0BL 25Maritime Association for Risk Mitigation & Safety Limited Shell Centre, London, SE1 7NA 100Methane Services Limited Shell Centre, London, SE1 7NA 100Murphy Schiehallion Limited Shell Centre, London, SE1 7NA 100Octane Holdings Limited Shell Centre, London, SE1 7NA 100Octane Properties Limited Shell Centre, London, SE1 7NA 100Private Oil Holdings Oman Limited 8 York Road, London, SE1 7NA 85Sabah Shell Petroleum Company Limited Shell Centre, London, SE1 7NA 100Saxon Oil Limited 8 York Road, London, SE1 7NA 100Saxon Oil Miller Limited 8 York Road, London, SE1 7NA 100Schooner Trustees Limited Shell Centre, London, SE1 7NA 100SELAP Limited 8 York Road, London, SE1 7NA 100SF Investment Management Limited Shell Centre, London, SE1 7NA 100Shell Aircraft Limited Shell Centre, London, SE1 7NA 100Shell Arabia Car Service Limited Shell Centre, London, SE1 7NA 100Shell Aviation Limited Shell Centre, London, SE1 7NA 100Shell Benin Upstream Ltd Shell Centre, London, SE1 7NA 100Shell Business Development Middle East Limited Shell Centre, London, SE1 7NA 100Shell Caribbean Investments Limited Shell Centre, London, SE1 7NA 100Shell Chemical Company of Eastern Africa Limited Shell Centre, London, SE1 7NA 100Shell Chemicals (Hellas) Limited Shell Centre, London, SE1 7NA 100Shell Chemicals Limited Shell Centre, London, SE1 7NA 100Shell Chemicals Support Services Asia Limited Shell Centre, London, SE1 7NA 100Shell Chemicals U.K. Limited Shell Centre, London, SE1 7NA 100Shell China Exploration and Production Company Limited Shell Centre, London, SE1 7NA 100Shell Clair UK Limited Shell Centre, London, SE1 7NA 100Shell Club Corringham Limited Shell Centre, London, SE1 7NA 100Shell Company (Hellas) Limited Shell Centre, London, SE1 7NA 100Shell Company (Pacific Islands) Limited Shell Centre, London, SE1 7NA 100Shell Corporate Director Limited Shell Centre, London, SE1 7NA 100Shell Corporate Secretary Limited Shell Centre, London, SE1 7NA 100Shell Direct (U.K.) Limited Shell Centre, London, SE1 7NA 100Shell Distributor (Holdings) Limited Shell Centre, London, SE1 7NA 100Shell Employee Benefits Trustee Limited Shell Centre, London, SE1 7NA 100Shell Energy Europe Limited Shell Centre, London, SE1 7NA 100Shell Energy Investments Limited Shell Centre, London, SE1 7NA 100Shell Energy Supply UK LTD. Shell Centre, London, SE1 7NA 100Shell EP Offshore Ventures Limited Shell Centre, London, SE1 7NA 100Shell Exploration and Production Oman Limited Shell Centre, London, SE1 7NA 100Shell Exploration and Production Tanzania Limited Shell Centre, London, SE1 7NA 100Shell Gas Holdings (Malaysia) Limited Shell Centre, London, SE1 7NA 100Shell Hasdrubal Limited Shell Centre, London, SE1 7NA 100Shell Holdings (U.K.) Limited Shell Centre, London, SE1 7NA 100Shell Information Technology International Limited 8 York Road, London, SE1 7NA 100Shell International Gas Limited Shell Centre, London, SE1 7NA 100Shell International Limited Shell Centre, London, SE1 7NA 100Shell International Petroleum Company Limited Shell Centre, London, SE1 7NA 100Shell International Trading and Shipping Company Limited 80 Strand, London, WC2R 0ZA 100Shell Malaysia Limited Shell Centre, London, SE1 7NA 100Shell Marine Products Limited Shell Centre, London, SE1 7NA 100Shell Overseas Holdings Limited Shell Centre, London, SE1 7NA 100Shell Overseas Services Limited Shell Centre, London, SE1 7NA 100Shell Pension Reserve Company (SIPF) Limited Shell Centre, London, SE1 7NA 100Shell Pension Reserve Company (SOCPF) Limited Shell Centre, London, SE1 7NA 100Shell Pension Reserve Company (UK) Limited Shell Centre, London, SE1 7NA 100Shell Pensions Trust Limited Shell Centre, London, SE1 7NA 100Shell Property Company Limited Shell Centre, London, SE1 7NA 100Shell QGC Holdings Limited [i] Shell Centre, London, SE1 7NA 100Shell QGC Midstream 2 Limited Shell Centre, London, SE1 7NA 100Shell QGC Midstream 1 Limited [i] Shell Centre, London, SE1 7NA 100Shell QGC Upstream 2 Limited Shell Centre, London, SE1 7NA 100Shell QGC Upstream 1 Limited Shell Centre, London, SE1 7NA 100Shell Research Limited Shell Centre, London, SE1 7NA 100
ADDITIONAL INFORMATION SHELL ANNUAL REPORT AND FORM 20-F 2017 E16

Company by country of incorporation Address of registered office %Shell Response Limited 80 Strand, London, WC2R 0ZA 100Shell Shared Service Centre - Glasgow Limited Shell Centre, London, SE1 7NA 100Shell Subsidiary Distributors Pension Trustee Limited Shell Centre, London, SE1 7NA 100Shell Supplementary Pension Plan Trustees Limited Shell Centre, London, SE1 7NA 100Shell Tankers (U.K.) Limited 3 Savoy Place, London, WC2R 0DX 100Shell Trading International Limited Shell Centre, London, SE1 7NA 100Shell Treasury Centre Limited Shell Centre, London, SE1 7NA 100Shell Treasury Dollar Company Limited Shell Centre, London, SE1 7NA 100Shell Treasury Euro Company Limited Shell Centre, London, SE1 7NA 100Shell Treasury UK Limited Shell Centre, London, SE1 7NA 100Shell Trinidad 5(A) Limited Shell Centre, London, SE1 7NA 100Shell Trinidad and Tobago Limited Shell Centre, London, SE1 7NA 100Shell Trinidad Block E Limited Shell Centre, London, SE1 7NA 100Shell Trustee Solutions Limited 1 Altens Farm Road, Nigg, Aberdeen, AB12 3FY 100Shell Tunisia Upstream Limited Shell Centre, London, SE1 7NA 100Shell U.K. Limited Shell Centre, London, SE1 7NA 100Shell U.K. North Atlantic Limited Shell Centre, London, SE1 7NA 100Shell U.K. Oil Products Limited Shell Centre, London, SE1 7NA 100Shell Upstream Overseas Services (I) Limited Shell Centre, London, SE1 7NA 100Shell Ventures New Zealand Limited Shell Centre, London, SE1 7NA 100Shell Ventures U.K. Limited Shell Centre, London, SE1 7NA 100Shell Windenergy Limited Shell Centre, London, SE1 7NA 100Shell-Mex and B.P. Limited Shell Centre, London, SE1 7NA 60Stansted Fuelling Company Limited Exxonmobil House, Ermyn Way, Leatherhead, KT22 8UX 14STT (Das Beneficiary) Limited [a] Shell Centre, London, SE1 7NA 100Synthetic Chemicals (Northern) Limited 8 York Road, London, SE1 7NA 100Telegraph Service Stations Limited 8 York Road, London, SE1 7NA 100The Anglo-Saxon Petroleum Company Limited Shell Centre, London, SE1 7NA 100The Asiatic Petroleum Company Limited Shell Centre, London, SE1 7NA 100The Consolidated Petroleum Company Limited Shell Centre, London, SE1 7NA 50The Consolidated Petroleum Supply Company Limited Shell Centre, London, SE1 7NA 50The Mexican Eagle Oil Company Limited 8 York Road, London, SE1 7NA 100The New Motion EVSE Limited C/O Jag Shaw Baker, Berners House, 47-48 Berners Street, London, W1T 3NF 100The Shell Company (W.I.) Limited Shell Centre, London, SE1 7NA 100The Shell Company of Hong Kong Limited Shell Centre, London, SE1 7NA 100The Shell Company of India Limited Shell Centre, London, SE1 7NA 100The Shell Company of Nigeria Limited Shell Centre, London, SE1 7NA 100The Shell Company of Thailand Limited Shell Centre, London, SE1 7NA 100The Shell Company of The Philippines Limited Shell Centre, London, SE1 7NA 75The Shell Company of Turkey Limited Shell Centre, London, SE1 7NA 100The Shell Company of West Africa Limited Shell Centre, London, SE1 7NA 100The Shell Marketing Company of Borneo Limited Shell Centre, London, SE1 7NA 100The Shell Petroleum Company Limited Shell Centre, London, SE1 7NA 100The Shell Transport and Trading Company Limited Shell Centre, London, SE1 7NA 100Thermocomfort Limited 8 York Road, London, SE1 7NA 100UK Shell Pension Plan Trust Limited Shell Centre, London, SE1 7NA 100United Kingdom Oil Pipelines Limited [b] 5-7 Alexandra Road, Hemel Hempstead, Herts, HP2 5BS 48Walton-Gatwick Pipeline Company Limited [b] 5-7 Alexandra Road, Hemel Hempstead, Herts, HP2 5BS 52West London Pipeline and Storage Limited [b] 5-7 Alexandra Road, Hemel Hempstead, Herts, HP2 5BS 38Wonderbill Limited Shell Centre, London, SE1 7NA 87Woodlea Limited Shell Centre, London, SE1 7NA 100
URUGUAY BG (Uruguay) S.A. La Cumparsita, 1373 4th Floor, Montevideo, 11200 100Dinarel S.A. La Cumparsita, 1373 4th Floor, Montevideo, 11200 50Gasoducto Cruz del Sur S.A. La Cumparsita, 1373 4th Floor, Montevideo, 11200 40
USA Aera Energy LLC [b] 10000 Ming Avenue, Bakersfield, CA 93311 52Aera Energy Services Company 10000 Ming Avenue, Bakersfield, CA 93311 50Airbiquity Inc. 1011 Western Avenue, Suite 600, Seattle, WA 98104 26Amberjack Pipeline Company LLC The Corporation Trust Company, Corporation Trust Center, 1209 Orange Street, Wilmington, DE 19801 63Atlantic 1 Holdings LLC [c] The Corporation Trust Company, Corporation Trust Center, 1209 Orange Street, Wilmington, DE 19801 46Atlantic 2/3 Holdings LLC [c] The Corporation Trust Company, Corporation Trust Center, 1209 Orange Street, Wilmington, DE 19801 58Atlantic 4 Holdings LLC [c] The Corporation Trust Company, Corporation Trust Center, 1209 Orange Street, Wilmington, DE 19801 51Au Energy, LLC 41805 Albrae Street, Fremont, CA, 94538 50Baconton Power LLC [c] 1499 38th Boulevard N.W., Cairo, GA 31728 35Bengal Pipeline Company LLC 1185 Sanctuary Parkway, Suite 100, Alpharetta, GA 30009 31BG Alaska E&P, Inc. The Corporation Trust Company, Corporation Trust Center, 1209 Orange Street, Wilmington, DE 19801 100BG Brasilia, LLC The Corporation Trust Company, Corporation Trust Center, 1209 Orange Street, Wilmington, DE 19801 100BG Energy Finance, Inc. The Corporation Trust Company, Corporation Trust Center, 1209 Orange Street, Wilmington, DE 19801 100
ADDITIONAL INFORMATION SHELL ANNUAL REPORT AND FORM 20-F 2017 E17

Company by country of incorporation Address of registered office %BG Energy Merchants, LLC The Corporation Trust Company, Corporation Trust Center, 1209 Orange Street, Wilmington, DE 19801 100BG Exploration America, Inc. The Corporation Trust Company, Corporation Trust Center, 1209 Orange Street, Wilmington, DE 19801 100BG Gulf Coast LNG, LLC The Corporation Trust Company, Corporation Trust Center, 1209 Orange Street, Wilmington, DE 19801 100BG Lake Charles Operations, LLC The Corporation Trust Company, Corporation Trust Center, 1209 Orange Street, Wilmington, DE 19801 100BG LNG Services, LLC The Corporation Trust Company, Corporation Trust Center, 1209 Orange Street, Wilmington, DE 19801 100BG LNG Trading, LLC The Corporation Trust Company, Corporation Trust Center, 1209 Orange Street, Wilmington, DE 19801 100BG North America, LLC The Corporation Trust Company, Corporation Trust Center, 1209 Orange Street, Wilmington, DE 19801 100BG Production Company (PA), LLC The Corporation Trust Company, Corporation Trust Center, 1209 Orange Street, Wilmington, DE 19801 100BG Production Company (WV), LLC The Corporation Trust Company, Corporation Trust Center, 1209 Orange Street, Wilmington, DE 19801 100BG US Gathering Company, LLC The Corporation Trust Company, Corporation Trust Center, 1209 Orange Street, Wilmington, DE 19801 100BG US Production Company, LLC The Corporation Trust Company, Corporation Trust Center, 1209 Orange Street, Wilmington, DE 19801 100BG US Services, Inc. The Corporation Trust Company, Corporation Trust Center, 1209 Orange Street, Wilmington, DE 19801 100Brazil Crude Services, LLC The Corporation Trust Company, Corporation Trust Center, 1209 Orange Street, Wilmington, DE 19801 100Brazos Wind Ventures, LLC [c] The Corporation Trust Company, Corporation Trust Center, 1209 Orange Street, Wilmington, DE 19801 50Caesar Oil Pipeline Company, LLC The Corporation Trust Company, Corporation Trust Center, 1209 Orange Street, Wilmington, DE 19801 15Colbea Enterprises, LLC 2050 Plainfield Pike, Cranston, RI 02921 50Colonial Pipeline Company P.O. Box 1624, Alpharetta, GA 30009-9934 13Colorado Wind Ventures, LLC 825 Ne Multnomah, Portland, OR 97232 50Concha Chemical Pipeline LLC [c] The Corporation Trust Company, Corporation Trust Center, 1209 Orange Street, Wilmington, DE 19801 100Crestwood Permian Basin LLC 811 Main Street, Suite 3400, Houston, TX 77002 24CRI Catalyst Company LP [d] The Corporation Trust Company, Corporation Trust Center, 1209 Orange Street, Wilmington, DE 19801 100CRI Sales and Services Inc. The Corporation Trust Company, Corporation Trust Center, 1209 Orange Street, Wilmington, DE 19801 100CRI U.S. LP [d] The Corporation Trust Company, Corporation Trust Center, 1209 Orange Street, Wilmington, DE 19801 100CRI Zeolites Inc. The Corporation Trust Company, Corporation Trust Center, 1209 Orange Street, Wilmington, DE 19801 100CRI/Criterion, Inc. The Corporation Trust Company, Corporation Trust Center, 1209 Orange Street, Wilmington, DE 19801 100Criterion Catalyst Company The Corporation Trust Company, Corporation Trust Center, 1209 Orange Street, Wilmington, DE 19801 100Criterion Catalysts & Technologies L.P. [d] The Corporation Trust Company, Corporation Trust Center, 1209 Orange Street, Wilmington, DE 19801 100Deer Park Refining Limited Partnership [b] [c] The Corporation Trust Company, Corporation Trust Center, 1209 Orange Street, Wilmington, DE 19801 51Endymion Oil Pipeline Company, LLC The Corporation Trust Company, Corporation Trust Center, 1209 Orange Street, Wilmington, DE 19801 5Enterprise Oil North America Inc. The Corporation Trust Company, Corporation Trust Center, 1209 Orange Street, Wilmington, DE 19801 100EPP LLC 2441 High Timbers Drive, Suite 220, The Woodlands, TX 77380 100Equilon Enterprises LLC [c] The Corporation Trust Company, Corporation Trust Center, 1209 Orange Street, Wilmington, DE 19801 100EXCO Appalachia Midstream, LLC The Corporation Trust Company, Corporation Trust Center, 1209 Orange Street, Wilmington, DE 19801 50EXCO Resources (PA), LLC [b] The Corporation Trust Company, Corporation Trust Center, 1209 Orange Street, Wilmington, DE 19801 50Explorer Pipeline Company P.O. Box 2650, Tulsa, OK 74101 32Gaviota Terminal Company [d] (Mail address) 910 Louisiana Street, Houston, TX 77002 20Infineum USA Inc. 1900 East Linden Avenue, Linden, NJ 07036 50Infineum USA L.P. Corporation Service Company, 2711 Centerville Road, Suite 400, Wilmington, DE 19808 50Jiffy Lube International, Inc. The Corporation Trust Company, Corporation Trust Center, 1209 Orange Street, Wilmington, DE 19801 100Lake Charles Exports, LLC The Corporation Trust Company, Corporation Trust Center, 1209 Orange Street, Wilmington, DE 19801 80Laurentide E&P, LLC The Corporation Trust Company, Corporation Trust Center, 1209 Orange Street, Wilmington, DE 19801 100LOCAP LLC 111 Veterans Blvd, Suite 600, Metarie, LA 70005 20LOOP LLC 137 Northpark Blvd., Covington, LA 70433 46Maple Power Holdings LLC Bechtel Enterprises, P.O. Box 193965, San Francisco, CA, 94119-3965 68Mars Oil Pipeline Company LLC [d] The Corporation Trust Company, Corporation Trust Center, 1209 Orange Street, Wilmington, DE 19801 35Mattox Pipeline Company LLC [c] The Corporation Trust Company, Corporation Trust Center, 1209 Orange Street, Wilmington, DE 19801 79Mertvyi Kultuk LLC The Corporation Trust Company, Corporation Trust Center, 1209 Orange Street, Wilmington, DE 19801 100Motiva Company The Corporation Trust Company, Corporation Trust Center, 1209 Orange Street, Wilmington, DE 19801 100MP2 Energy LLC [d] 2441 High Timbers Drive, Suite 220, The Woodlands, TX 77380 100MP2 Energy NE LLC 2441 High Timbers Drive, Suite 220, The Woodlands, TX 77380 100MP2 Energy NY LLC 2441 High Timbers Drive, Suite 220, The Woodlands, TX 77380 100MP2 Energy Retail Holdings LLC 2441 High Timbers Drive, Suite 220, The Woodlands, TX 77380 100MP2 Energy Texas LLC 2441 High Timbers Drive, Suite 220, The Woodlands, TX 77380 100MP2 Generation LLC 2441 High Timbers Drive, Suite 220, The Woodlands, TX 77380 100MP2 Mesquite Creek Wind LLC 2441 High Timbers Drive, Suite 220, The Woodlands, TX 77380 100Mpower2 LLC 2441 High Timbers Drive, Suite 220, The Woodlands, TX 77380 100Nedpower Mount Storm LLC [f] The Corporation Trust Company, Corporation Trust Center, 1209 Orange Street, Wilmington, DE 19801 50Noble Assurance Company C T Corporation System, 1999 Bryan Street, Suite 900, Dallas, TX 75201 100Odyssey Pipeline L.L.C. [c] The Corporation Trust Company, Corporation Trust Center, 1209 Orange Street, Wilmington, DE 19801 34Oryx Caspian Pipeline, L.L.C. [c] The Corporation Trust Company, Corporation Trust Center, 1209 Orange Street, Wilmington, DE 19801 100Pacwest Energy, LLC. 3450 E. Commercial Ct., Meridian, ID 83642 50Pecten Arabian Company The Corporation Trust Company, Corporation Trust Center, 1209 Orange Street, Wilmington, DE 19801 100Pecten Brazil Exploration Company The Corporation Trust Company, Corporation Trust Center, 1209 Orange Street, Wilmington, DE 19801 100Pecten Midstream LLC [c] The Corporation Trust Company, Corporation Trust Center, 1209 Orange Street, Wilmington, DE 19801 48Pecten Orient Company The Corporation Trust Company, Corporation Trust Center, 1209 Orange Street, Wilmington, DE 19801 100Pecten Orient Company LLC [c] The Corporation Trust Company, Corporation Trust Center, 1209 Orange Street, Wilmington, DE 19801 100Pecten Producing Company The Corporation Trust Company, Corporation Trust Center, 1209 Orange Street, Wilmington, DE 19801 100Pecten Trading Company The Corporation Trust Company, Corporation Trust Center, 1209 Orange Street, Wilmington, DE 19801 100Pecten Victoria Company The Corporation Trust Company, Corporation Trust Center, 1209 Orange Street, Wilmington, DE 19801 100
ADDITIONAL INFORMATION SHELL ANNUAL REPORT AND FORM 20-F 2017 E18

Company by country of incorporation Address of registered office %Pecten Yemen Masila Company The Corporation Trust Company, Corporation Trust Center, 1209 Orange Street, Wilmington, DE 19801 100Pelican Transmission, LLC [c] The Corporation Trust Company, Corporation Trust Center, 1209 Orange Street, Wilmington, DE 19801 100Pennzoil-Quaker State Company The Corporation Trust Company, Corporation Trust Center, 1209 Orange Street, Wilmington, DE 19801 100Pennzoil-Quaker State International Corporation The Corporation Trust Company, Corporation Trust Center, 1209 Orange Street, Wilmington, DE 19801 100Pennzoil-Quaker State Nominee Company The Corporation Trust Company of Nevada, 311 South Division Street, Carson City, NV 89703 100Peru LNG Company LLC [c] The Corporation Trust Company, Corporation Trust Center, 1209 Orange Street, Wilmington, DE 19801 20Poseidon Oil Pipeline Company, LLC Corporation Service Company, 1013 Center Road, Wilmington, DE 19805 17Power Limited Partnership [d] The Corporation Trust Company, Corporation Trust Center, 1209 Orange Street, Wilmington, DE 19801 100Proteus Oil Pipeline Company, LLC The Corporation Trust Company, Corporation Trust Center, 1209 Orange Street, Wilmington, DE 19801 5Quaker State Investment Corporation The Corporation Trust Company, Corporation Trust Center, 1209 Orange Street, Wilmington, DE 19801 100RDK Ventures, LLC 4080 West Jonathan Moore Pike, Columbus, IN 47201 50Rilette Springs, LLC The Corporation Trust Company, Corporation Trust Center, 1209 Orange Street, Wilmington, DE 19801 100RK Caspian Shipping Company, LLC [c] The Corporation Trust Company, Corporation Trust Center, 1209 Orange Street, Wilmington, DE 19801 100S T Exchange, Inc. The Corporation Trust Company, Corporation Trust Center, 1209 Orange Street, Wilmington, DE 19801 100Salamander Inc. The Corporation Trust Company, Corporation Trust Center, 1209 Orange Street, Wilmington, DE 19801 100San Pablo Bay Pipeline Company LLC [c] The Corporation Trust Company, Corporation Trust Center, 1209 Orange Street, Wilmington, DE 19801 100Sand Dollar Pipeline LLC [c] The Corporation Trust Company, Corporation Trust Center, 1209 Orange Street, Wilmington, DE 19801 48SCOGI GP [d] The Corporation Trust Company, Corporation Trust Center, 1209 Orange Street, Wilmington, DE 19801 100Shell (US) Gas & Power M&T Holdings, Inc. The Corporation Trust Company, Corporation Trust Center, 1209 Orange Street, Wilmington, DE 19801 100Shell Broadwater Holdings LLC The Corporation Trust Company, Corporation Trust Center, 1209 Orange Street, Wilmington, DE 19801 100Shell California Pipeline Company LLC [c] The Corporation Trust Company, Corporation Trust Center, 1209 Orange Street, Wilmington, DE 19801 100Shell Catalysts Ventures Inc. The Corporation Trust Company, Corporation Trust Center, 1209 Orange Street, Wilmington, DE 19801 100Shell Chemical Appalachia LLC [c] The Corporation Trust Company, Corporation Trust Center, 1209 Orange Street, Wilmington, DE 19801 100Shell Chemical LP [h] The Corporation Trust Company, Corporation Trust Center, 1209 Orange Street, Wilmington, DE 19801 100Shell Chemicals Arabia LLC [c] The Corporation Trust Company, Corporation Trust Center, 1209 Orange Street, Wilmington, DE 19801 100Shell Communications, Inc. The Corporation Trust Company, Corporation Trust Center, 1209 Orange Street, Wilmington, DE 19801 100Shell Deepwater Royalties Inc. The Corporation Trust Company, Corporation Trust Center, 1209 Orange Street, Wilmington, DE 19801 100Shell Downstream Inc. The Corporation Trust Company, Corporation Trust Center, 1209 Orange Street, Wilmington, DE 19801 100Shell Energy Company The Corporation Trust Company, Corporation Trust Center, 1209 Orange Street, Wilmington, DE 19801 100Shell Energy Holding GP LLC [c] The Corporation Trust Company, Corporation Trust Center, 1209 Orange Street, Wilmington, DE 19801 100Shell Energy North America (US), L.P. [d] The Corporation Trust Company, Corporation Trust Center, 1209 Orange Street, Wilmington, DE 19801 100Shell Energy Resources Company The Corporation Trust Company, Corporation Trust Center, 1209 Orange Street, Wilmington, DE 19801 100Shell EP Holdings Inc. The Corporation Trust Company, Corporation Trust Center, 1209 Orange Street, Wilmington, DE 19801 100Shell Expatriate Employment US Inc. The Corporation Trust Company, Corporation Trust Center, 1209 Orange Street, Wilmington, DE 19801 100Shell Exploration & Production Company The Corporation Trust Company, Corporation Trust Center, 1209 Orange Street, Wilmington, DE 19801 100Shell Exploration Company Inc. The Corporation Trust Company, Corporation Trust Center, 1209 Orange Street, Wilmington, DE 19801 100Shell Frontier Oil & Gas Inc. The Corporation Trust Company, Corporation Trust Center, 1209 Orange Street, Wilmington, DE 19801 100Shell Gas Gathering Corp. #2 The Corporation Trust Company, Corporation Trust Center, 1209 Orange Street, Wilmington, DE 19801 100Shell Global Solutions (US) Inc. The Corporation Trust Company, Corporation Trust Center, 1209 Orange Street, Wilmington, DE 19801 100Shell GOM Pipeline Company LLC [c] The Corporation Trust Company, Corporation Trust Center, 1209 Orange Street, Wilmington, DE 19801 100Shell Gulf of Mexico Inc. The Corporation Trust Company, Corporation Trust Center, 1209 Orange Street, Wilmington, DE 19801 100Shell Information Technology International Inc. The Corporation Trust Company, Corporation Trust Center, 1209 Orange Street, Wilmington, DE 19801 100Shell International Exploration and Production Inc. The Corporation Trust Company, Corporation Trust Center, 1209 Orange Street, Wilmington, DE 19801 100Shell Leasing Company The Corporation Trust Company, Corporation Trust Center, 1209 Orange Street, Wilmington, DE 19801 100Shell Marine Products (US) Company The Corporation Trust Company, Corporation Trust Center, 1209 Orange Street, Wilmington, DE 19801 100Shell Midstream LP Holdings LLC [c] The Corporation Trust Company, Corporation Trust Center, 1209 Orange Street, Wilmington, DE 19801 100Shell Midstream Operating LLC [c] The Corporation Trust Company, Corporation Trust Center, 1209 Orange Street, Wilmington, DE 19801 48Shell Midstream Partners GP LLC [c] The Corporation Trust Company, Corporation Trust Center, 1209 Orange Street, Wilmington, DE 19801 100Shell Midstream Partners, L.P. [h] The Corporation Trust Company, Corporation Trust Center, 1209 Orange Street, Wilmington, DE 19801 48Shell NA Gas & Power Holding Company The Corporation Trust Company, Corporation Trust Center, 1209 Orange Street, Wilmington, DE 19801 100Shell NA LNG LLC [c] The Corporation Trust Company, Corporation Trust Center, 1209 Orange Street, Wilmington, DE 19801 100Shell North America Gas & Power Services Company The Corporation Trust Company, Corporation Trust Center, 1209 Orange Street, Wilmington, DE 19801 100Shell Offshore and Chemical Investments Inc. The Corporation Trust Company, Corporation Trust Center, 1209 Orange Street, Wilmington, DE 19801 100Shell Offshore Inc. The Corporation Trust Company, Corporation Trust Center, 1209 Orange Street, Wilmington, DE 19801 100Shell Offshore Response Company LLC [c] The Corporation Trust Company, Corporation Trust Center, 1209 Orange Street, Wilmington, DE 19801 100Shell Oil Company The Corporation Trust Company, Corporation Trust Center, 1209 Orange Street, Wilmington, DE 19801 100Shell Oil Company Investments Inc. The Corporation Trust Company, Corporation Trust Center, 1209 Orange Street, Wilmington, DE 19801 100Shell Oil Products Company LLC [c] The Corporation Trust Company, Corporation Trust Center, 1209 Orange Street, Wilmington, DE 19801 100Shell Onshore Ventures Inc. The Corporation Trust Company, Corporation Trust Center, 1209 Orange Street, Wilmington, DE 19801 100Shell Petroleum Inc. The Corporation Trust Company, Corporation Trust Center, 1209 Orange Street, Wilmington, DE 19801 100Shell Pipeline Company LP [d] The Corporation Trust Company, Corporation Trust Center, 1209 Orange Street, Wilmington, DE 19801 100Shell Pipeline GP LLC [c] The Corporation Trust Company, Corporation Trust Center, 1209 Orange Street, Wilmington, DE 19801 100Shell Rail Operations Company The Corporation Trust Company, Corporation Trust Center, 1209 Orange Street, Wilmington, DE 19801 100Shell RSC Company The Corporation Trust Company, Corporation Trust Center, 1209 Orange Street, Wilmington, DE 19801 100Shell Technology Ventures LLC [c] The Corporation Trust Company, Corporation Trust Center, 1209 Orange Street, Wilmington, DE 19801 100Shell Thailand E&P Inc. The Corporation Trust Company, Corporation Trust Center, 1209 Orange Street, Wilmington, DE 19801 100Shell Trademark Management Inc. The Corporation Trust Company, Corporation Trust Center, 1209 Orange Street, Wilmington, DE 19801 100Shell Trading (US) Company The Corporation Trust Company, Corporation Trust Center, 1209 Orange Street, Wilmington, DE 19801 100Shell Trading North America Company The Corporation Trust Company, Corporation Trust Center, 1209 Orange Street, Wilmington, DE 19801 100
ADDITIONAL INFORMATION SHELL ANNUAL REPORT AND FORM 20-F 2017 E19

Company by country of incorporation Address of registered office %Shell Trading Risk Management, LLC [c] The Corporation Trust Company, Corporation Trust Center, 1209 Orange Street, Wilmington, DE 19801 100Shell Trading Services Company The Corporation Trust Company, Corporation Trust Center, 1209 Orange Street, Wilmington, DE 19801 100Shell Transportation Holdings LLC [c] The Corporation Trust Company, Corporation Trust Center, 1209 Orange Street, Wilmington, DE 19801 100Shell Treasury Center (West) Inc. The Corporation Trust Company, Corporation Trust Center, 1209 Orange Street, Wilmington, DE 19801 100Shell US E&P Investments LLC [c] The Corporation Trust Company, Corporation Trust Center, 1209 Orange Street, Wilmington, DE 19801 100Shell US Gas & Power LLC [c] The Corporation Trust Company, Corporation Trust Center, 1209 Orange Street, Wilmington, DE 19801 100Shell US Hosting Company The Corporation Trust Company, Corporation Trust Center, 1209 Orange Street, Wilmington, DE 19801 100Shell WindEnergy Inc. The Corporation Trust Company, Corporation Trust Center, 1209 Orange Street, Wilmington, DE 19801 100Shell WindEnergy Services Inc. The Corporation Trust Company, Corporation Trust Center, 1209 Orange Street, Wilmington, DE 19801 100Ship Shoal Pipeline Company [d] (Mail address) 910 Louisiana Street, Houston, TX 77002 43SOI Finance Inc. The Corporation Trust Company, Corporation Trust Center, 1209 Orange Street, Wilmington, DE 19801 100SOPC Holdings East LLC [c] The Corporation Trust Company, Corporation Trust Center, 1209 Orange Street, Wilmington, DE 19801 100SOPC Holdings West LLC The Corporation Trust Company, Corporation Trust Center, 1209 Orange Street, Wilmington, DE 19801 100SWEPI LP [d] The Corporation Trust Company, Corporation Trust Center, 1209 Orange Street, Wilmington, DE 19801 100Tejas Coral GP, LLC [c] The Corporation Trust Company, Corporation Trust Center, 1209 Orange Street, Wilmington, DE 19801 100Tejas Coral Holding, LLC [c] The Corporation Trust Company, Corporation Trust Center, 1209 Orange Street, Wilmington, DE 19801 100Tejas Power Generation, LLC [c] The Corporation Trust Company, Corporation Trust Center, 1209 Orange Street, Wilmington, DE 19801 100Texas Petroleum Group LLC 11111 Wilcrest Green, Suite 100, Houston, TX 77042 50Texas-New Mexico Pipe Line Company The Corporation Trust Company, Corporation Trust Center, 1209 Orange Street, Wilmington, DE 19801 100The Valley Camp Coal Company The Corporation Trust Company, Corporation Trust Center, 1209 Orange Street, Wilmington, DE 19801 100Three Wind Holdings LLC The Corporation Trust Company, Corporation Trust Center, 1209 Orange Street, Wilmington, DE 19801 50TMR Company The Corporation Trust Company, Corporation Trust Center, 1209 Orange Street, Wilmington, DE 19801 100Tri Star Energy LLC 1740 Ed Temple Blvd, Nashville, TN 37208 33Triton Diagnostics Inc. The Corporation Trust Company, Corporation Trust Center, 1209 Orange Street, Wilmington, DE 19801 100Triton Terminaling LLC [c] The Corporation Trust Company, Corporation Trust Center, 1209 Orange Street, Wilmington, DE 19801 100Triton West LLC The Corporation Trust Company, Corporation Trust Center, 1209 Orange Street, Wilmington, DE 19801 48True North Energy LLC 10346 Brecksville Rd, Brecksville, OH 44141 50URSA Oil Pipeline Company LLC [c] The Corporation Trust Company, Corporation Trust Center, 1209 Orange Street, Wilmington, DE 19801 45West Shore Pipe Line Company The Corporation Trust Company, Corporation Trust Center, 1209 Orange Street, Wilmington, DE 19801 19Zeolyst International (Mail address) 910 Louisiana Street, Houston, TX 77002 50Zydeco Pipeline Company LLC [c] The Corporation Trust Company, Corporation Trust Center, 1209 Orange Street, Wilmington, DE 19801 52
VENEZUELA Petroregional del Lago, S.A. Calle 78 con Av. 3H, Sector Dr. Portillo, Edificio Centro Empresarial Plaza, # 3G-81, Piso 1 a PH, Maracaibo, Zulia, 4002 40Shell Venezuela Productos, C.A. Av. Orinoco, Edificio Centro Empresarial Premium, Piso 2, Oficinas 2-A y 2-B, Urb. Las Mercedes, Caracas, Miranda, 1060 100Shell Venezuela, S.A. Calle 77 (5 de Julio), entre Av. 3C y Av. 3D, Edificio Torre Financiera BOD, Piso 4, Sector 5 de Julio, Maracaibo, Zulia, 4001 100Sucre Gas, S.A. Av. Leonardo Da Vinci, Edificio PDV Servicios, Caracas, Distrito Capital 30
VIETNAM Shell Vietnam Ltd Go Dau Industrial Zone, Phuoc Thai Commune, Long Thanh District, Dong Nai Province 100
ZIMBABWE Central African Petroleum Refineries (Private) Limited Block 1, Tendeseka Office Park, CNR Samora Machel Avenue, Renfrew Road, Harare 21
ADDITIONAL INFORMATION SHELL ANNUAL REPORT AND FORM 20-F 2017 E20

Exhibit 12.1
I, Ben van Beurden, certify that:
1. I have reviewed this Annual Report on Form 20-F of Royal Dutch Shell plc (the Company);
2. Based on my knowledge, this report does not contain any untrue statement of a material fact or omit to state a material fact necessary to make the statements made, in light of thecircumstances under which such statements were made, not misleading with respect to the period covered by this report;
3. Based on my knowledge, the financial statements, and other financial information included in this report, fairly present in all material respects the financial condition, results ofoperations and cash flows of the Company as of, and for, the periods presented in this report;
4. The Company’s other certifying officer and I are responsible for establishing and maintaining disclosure controls and procedures (as defined in Exchange Act Rules 13a-15(e) and15d-15(e)) and internal control over financial reporting (as defined in Exchange Act Rules 13a-15(f) and 15d-15(f)) for the Company and have:
(a) Designed such disclosure controls and procedures, or caused such disclosure controls and procedures to be designed under our supervision, to ensure that materialinformation relating to the Company, including its consolidated subsidiaries, is made known to us by others within those entities, particularly during the period in whichthis report is being prepared;
(b) Designed such internal control over financial reporting, or caused such internal control over financial reporting to be designed under our supervision, to providereasonable assurance regarding the reliability of financial reporting and the preparation of financial statements for external purposes in accordance with generally acceptedaccounting principles;
(c) Evaluated the effectiveness of the Company’s disclosure controls and procedures and presented in this report our conclusions about the effectiveness of the disclosurecontrols and procedures, as of the end of the period covered by this report based on such evaluation; and
(d) Disclosed in this report any change in the Company’s internal control over financial reporting that occurred during the period covered by the annual report that hasmaterially affected, or is reasonably likely to materially affect, the Company’s internal control over financial reporting; and
5. The Company’s other certifying officer and I have disclosed, based on our most recent evaluation of internal control over financial reporting, to the Company’s auditors and theaudit committee of the Company’s Board of Directors (or persons performing the equivalent functions):
(a) All significant deficiencies and material weaknesses in the design or operation of internal control over financial reporting which are reasonably likely to adversely affect theCompany’s ability to record, process, summarise and report financial information; and
(b) Any fraud, whether or not material, that involves management or other employees who have a significant role in the Company’s internal control over financial reporting. /s/ Ben van Beurden Ben van BeurdenChief Executive OfficerMarch 14, 2018
ADDITIONAL INFORMATION SHELL ANNUAL REPORT AND FORM 20-F 2017 E21

Exhibit 12.2
I, Jessica Uhl, certify that:
1. I have reviewed this Annual Report on Form 20-F of Royal Dutch Shell plc (the Company);
2. Based on my knowledge, this report does not contain any untrue statement of a material fact or omit to state a material fact necessary to make the statements made, in light of thecircumstances under which such statements were made, not misleading with respect to the period covered by this report;
3. Based on my knowledge, the financial statements, and other financial information included in this report, fairly present in all material respects the financial condition, results ofoperations and cash flows of the Company as of, and for, the periods presented in this report;
4. The Company’s other certifying officer and I are responsible for establishing and maintaining disclosure controls and procedures (as defined in Exchange Act Rules 13a-15(e) and15d-15(e)) and internal control over financial reporting (as defined in Exchange Act Rules 13a-15(f) and 15d-15(f)) for the Company and have:
(a) Designed such disclosure controls and procedures, or caused such disclosure controls and procedures to be designed under our supervision, to ensure that materialinformation relating to the Company, including its consolidated subsidiaries, is made known to us by others within those entities, particularly during the period in whichthis report is being prepared;
(b) Designed such internal control over financial reporting, or caused such internal control over financial reporting to be designed under our supervision, to providereasonable assurance regarding the reliability of financial reporting and the preparation of financial statements for external purposes in accordance with generally acceptedaccounting principles;
(c) Evaluated the effectiveness of the Company’s disclosure controls and procedures and presented in this report our conclusions about the effectiveness of the disclosurecontrols and procedures, as of the end of the period covered by this report based on such evaluation; and
(d) Disclosed in this report any change in the Company’s internal control over financial reporting that occurred during the period covered by the annual report that hasmaterially affected, or is reasonably likely to materially affect, the Company’s internal control over financial reporting; and
5. The Company’s other certifying officer and I have disclosed, based on our most recent evaluation of internal control over financial reporting, to the Company’s auditors and theaudit committee of the Company’s Board of Directors (or persons performing the equivalent functions):
(a) All significant deficiencies and material weaknesses in the design or operation of internal control over financial reporting which are reasonably likely to adversely affect theCompany’s ability to record, process, summarise and report financial information; and
(b) Any fraud, whether or not material, that involves management or other employees who have a significant role in the Company’s internal control over financial reporting. /s/ Jessica Uhl Jessica UhlChief Financial OfficerMarch 14, 2018
ADDITIONAL INFORMATION SHELL ANNUAL REPORT AND FORM 20-F 2017 E22

Exhibit 13.1
In connection with the Annual Report on Form 20-F of Royal Dutch Shell plc, a public limited company organized under the laws of England and Wales (the Company), for the yearended December 31, 2017, as filed with the Securities and Exchange Commission on the date hereof (the Report), each of the undersigned officers of the Company certify pursuant to18 U.S.C. Section 1350, as adopted pursuant to Section 906 of the Sarbanes-Oxley Act of 2002, to such officer’s knowledge, that:
1. The Report fully complies with the requirements of Section 13(a) or 15(d) of the Securities Exchange Act of 1934; and
2. The information contained in the Report fairly presents, in all material respects, the financial condition and results of operations of the Company as of, and for, the periods presentedin the Report.
The foregoing certification is provided solely for purposes of complying with the provisions of Section 906 of the Sarbanes-Oxley Act of 2002 and is not intended to be used or reliedupon for any other purpose. /s/ Ben van Beurden Ben van BeurdenChief Executive Officer /s/ Jessica Uhl Jessica UhlChief Financial OfficerMarch 14, 2018
ADDITIONAL INFORMATION SHELL ANNUAL REPORT AND FORM 20-F 2017 E23

Exhibit 99.1
CONSENT OF INDEPENDENT REGISTERED PUBLIC ACCOUNTING FIRMWe consent to the incorporation by reference in the Registration Statement on Form F-3 (No. 333-222005) and the Registration Statements on Form S-8 (No. 333-126715, 333-141397, 333-171206, 333-192821, 333-200953, 333-215273 and 333-222813) of Royal Dutch Shell plc of our reports dated March 14, 2018, with respect to the ConsolidatedFinancial Statements and the effectiveness of internal control over financial reporting of Royal Dutch Shell plc, included in the Annual Report on Form 20-F for the year endedDecember 31, 2017. /s/ Ernst & Young LLP Ernst & Young LLPLondon, United KingdomMarch 14, 2018
ADDITIONAL INFORMATION SHELL ANNUAL REPORT AND FORM 20-F 2017 E24

Exhibit 99.2
CONSENT OF INDEPENDENT REGISTERED PUBLIC ACCOUNTING FIRMWe hereby consent to the incorporation by reference in the Registration Statement on Form F-3 (No. 333-222005) and the Registration Statements on Form S-8 (No. 333-126715,333-141397, 333-171206, 333-192821, 333-200953, 333-215273 and 333-222813) of Royal Dutch Shell plc of our report dated March 9, 2016, relating to the ConsolidatedFinancial Statements, which appears in this Annual Report on Form 20-F. /s/ PricewaterhouseCoopers LLP PricewaterhouseCoopers LLPLondon, United KingdomMarch 14, 2018
ADDITIONAL INFORMATION SHELL ANNUAL REPORT AND FORM 20-F 2017 E25

Exhibit 99.3
CONSENT OF INDEPENDENT REGISTERED PUBLIC ACCOUNTING FIRMWe consent to the incorporation by reference in the Registration Statement on Form F-3 (No. 333-222005) and the Registration Statements on Form S-8 (No. 333-126715, 333-141397, 333-171206, 333-192821, 333-200953, 333-215273 and 333-222813) of Royal Dutch Shell plc of our reports dated March 14, 2018, with respect to the Royal Dutch ShellDividend Access Trust Financial Statements and the effectiveness of internal control over financial reporting of the Royal Dutch Shell Dividend Access Trust, included in the AnnualReport on Form 20-F for the year ended December 31, 2017. /s/ Ernst & Young LLP Ernst & Young LLPLondon, United KingdomMarch 14, 2018
ADDITIONAL INFORMATION SHELL ANNUAL REPORT AND FORM 20-F 2017 E26

Exhibit 99.4
CONSENT OF INDEPENDENT REGISTERED PUBLIC ACCOUNTING FIRMWe hereby consent to the incorporation by reference in the Registration Statement on Form F-3 (No. 333-222005) and the Registration Statements on Form S-8 (No. 333-126715,333-141397, 333-171206, 333-192821, 333-200953, 333-215273 and 333-222813) of Royal Dutch Shell plc of our report dated March 9, 2016, relating to the Royal Dutch ShellDividend Access Trust Financial Statements, which appears in this Annual Report on Form 20-F. /s/ PricewaterhouseCoopers CI LLP PricewaterhouseCoopers CI LLPJersey, Channel IslandsMarch 14, 2018
ADDITIONAL INFORMATION SHELL ANNUAL REPORT AND FORM 20-F 2017 E27
