gestamp.com · 4 gestamp automociÓn, s.a. and subsidiaries consolidated income statement for the...
TRANSCRIPT


GESTAMP AUTOMOCIÓN, S.A. AND SUBSIDIARIES Consolidated Financial Statements and Consolidated Management Report for the year ended December 31, 2017
1
GESTAMP AUTOMOCIÓN, S.A. AND SUBSIDIARIES
NOTE
Consolidated balance sheetConsolidated income statementConsolidated statement of comprehensive incomeConsolidated statement of changes in equityConsolidated cash flow statementNotes to the consolidated financial statements
1 Activity and companies included in consolidation scope
2 Consolidation scope2. a Breakdown of consolidation scope2. b Changes in consolidation scope
3 Business combination
4 Basis of presentation4. 1 True and fair view4. 2 Comparison of information4. 3 Basis of consolidation 4. 4 Going concern4. 5 Alternative management indicators
5 Changes in accounting policies6 Summary of significant accounting policies
6. 1 Foreign currency transactions6. 2 Property, plant and equipment6. 3 Business combinations and goodwill6. 4 Investment in associates and joint ventures6. 5 Other intangible assets6. 6 Financial assets6. 7 Impairment of assets6. 8 Assets and liabilities held for sale and discontinued operations6. 9 Trade and other receivables6. 10 Inventories6. 11 Tools made to customer order6. 12 Cash and cash equivalents6. 13 Government grants6. 14 Financial liabilities (trade and other payables and borrowings)6. 15 Provisions and contingent liabilities6. 16 Employee benefits6. 17 Leases6. 18 Revenue and expense recognition6. 19 Income tax6. 20 Derivative financial instruments and hedges6. 21 Related parties6. 22 Environmental expenses
7 Significant accounting judgments, estimates and assumptions
8 Changes in significant accounting policies and estimates and restatement of errors
9 Segment reporting
10 Intangible assets
11 Property, plant and equipment
12 Financial assets
13 Inventories
14 Trade and other receivables/ Other current assets/ Cash and cash equivalents
15 Issued capital and share premium
16 Retained earnings16. 1 Legal reserve16. 2 Goodwill reserve16. 3 Unrestricted reserves16. 4 Availability of reserves at fully-consolidated companies16. 5 Approval of the Financial Statements and proposal for the appropiation of profit
17 Translation differences
18 Non-controlling interest
19 Deferred income
20 Provisions and contingent liabilities
21 Pensions and other post-employment obligations
22 Non-trade liabilities
23 Deferred tax
24 Trade and other payables
25 Operating revenue
26 Operating expenses
27 Financial income and financial expenses
28 Income tax
29 Earnings per share
30 Commitments
31 Related party transactions31. 1 Balances and transactions with related parties31. 2 Remuneration of the members of the board of directors31. 3 Remuneration of executives
32 Other disclosures32. 1 Audit fees32. 2 Environmental issues
33 Financial risk management33. 1 Financial risk factors33. 2 Hedge accounting33. 3 Fair value of financial instruments33. 4 Capital risk management
34 Information on postponement of payments to suppliers in commercial transactions
35 Subsequent events
36 Information on compilance with the Article 229 of Spanish Corporate Enterprises Act
37 Additional note for English translationANNEX I Consolidation scope
ANNEX II Indirect investments
ANNEX III Guarantors
CONTENTS

2
GESTAMP AUTOMOCIÓN, S.A. AND SUBSIDIARIES
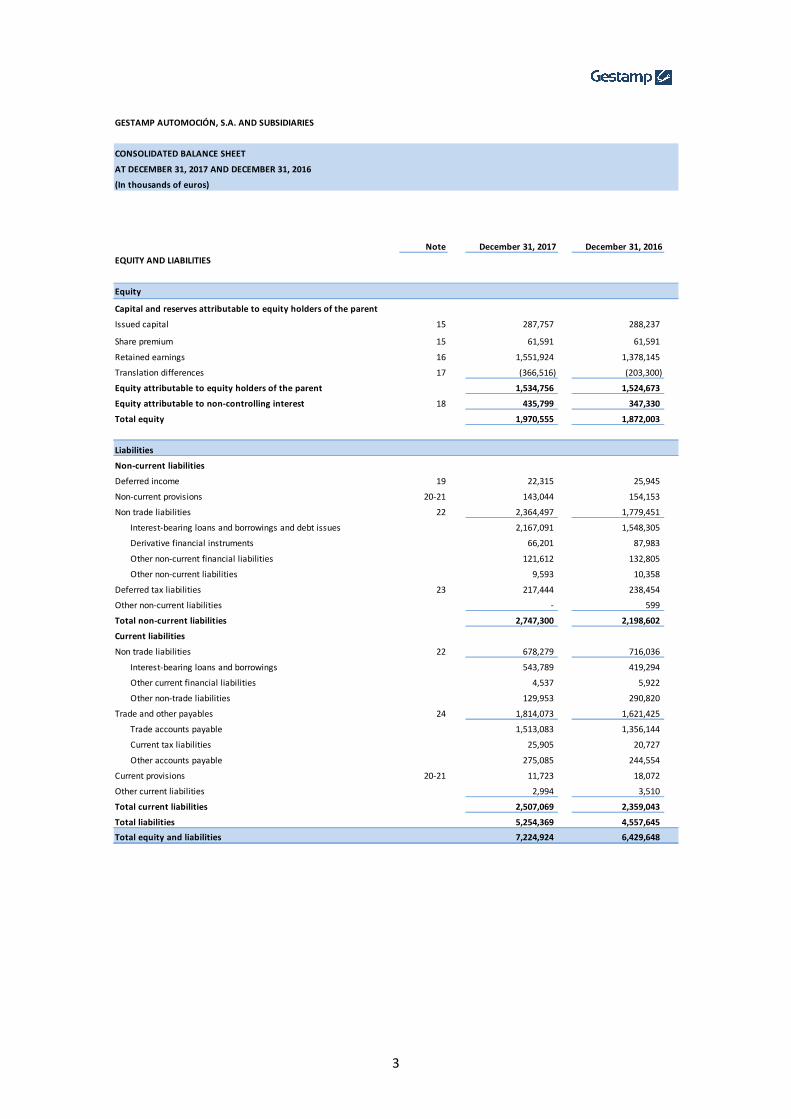
CONSOLIDATED BALANCE SHEET
AT DECEMBER 31, 2017 AND DECEMBER 31, 2016
(In thousands of euros)
Note December 31, 2017 December 31, 2016
ASSETS
Non-current assets
Intangible assets 10 414,697 392,964
Goodwill 104,757 110,504
Other intangible assets 309,940 282,460
Property, plant and equipment 11 3,407,779 3,160,014
Land and buildings 1,040,863 983,285
Plant and other PP&E 1,728,297 1,608,351
PP&E under construction and prepayments 638,619 568,378
Financial assets 12 69,427 95,514
Investments in associates accounted for using the equity method 1,787 5,740
Loans and receivables 39,248 50,581
Derivatives in effective hedges 14,718 25,710
Other non-current financial assets 13,674 13,483
Deferred tax assets 23 265,799 273,439
Total non-current assets 4,157,702 3,921,931
Current assets
Inventories 13 681,322 630,897
Raw materials and other consumables 350,446 308,335
Work in progress 143,476 141,149
Finished products and by-products 124,487 129,591
Prepayments to suppliers 62,913 51,822
Trade and other receivables 14 1,375,709 1,376,889
Trade receivables 1,174,714 1,169,925
Other receivables 31,627 20,819
Current income tax assets 26,795 35,306
Receivables from public authorities 142,573 150,839
Other current assets 14 71,057 26,240
Financial assets 12 78,896 43,228
Loans and receivables 34,598 11,036
Securities portfolio 5,376 338
Other current financial assets 38,922 31,854
Cash and cash equivalents 14 860,238 430,463
Total current assets 3,067,222 2,507,717
Total assets 7,224,924 6,429,648
3
GESTAMP AUTOMOCIÓN, S.A. AND SUBSIDIARIES
CONSOLIDATED BALANCE SHEET
AT DECEMBER 31, 2017 AND DECEMBER 31, 2016
(In thousands of euros)
Note December 31, 2017 December 31, 2016
EQUITY AND LIABILITIES
Equity
Capital and reserves attributable to equity holders of the parent
Issued capital 15 287,757 288,237
Share premium 15 61,591 61,591
Retained earnings 16 1,551,924 1,378,145
Translation differences 17 (366,516) (203,300)
Equity attributable to equity holders of the parent 1,534,756 1,524,673
Equity attributable to non-controlling interest 18 435,799 347,330
Total equity 1,970,555 1,872,003
Liabilities
Non-current liabilities
Deferred income 19 22,315 25,945
Non-current provisions 20-21 143,044 154,153
Non trade liabilities 22 2,364,497 1,779,451
Interest-bearing loans and borrowings and debt issues 2,167,091 1,548,305
Derivative financial instruments 66,201 87,983
Other non-current financial liabilities 121,612 132,805
Other non-current liabilities 9,593 10,358
Deferred tax liabilities 23 217,444 238,454
Other non-current liabilities - 599
Total non-current liabilities 2,747,300 2,198,602
Current liabilities
Non trade liabilities 22 678,279 716,036
Interest-bearing loans and borrowings 543,789 419,294
Other current financial liabilities 4,537 5,922
Other non-trade liabilities 129,953 290,820
Trade and other payables 24 1,814,073 1,621,425
Trade accounts payable 1,513,083 1,356,144
Current tax liabilities 25,905 20,727
Other accounts payable 275,085 244,554
Current provisions 20-21 11,723 18,072
Other current liabilities 2,994 3,510
Total current liabilities 2,507,069 2,359,043
Total liabilities 5,254,369 4,557,645
Total equity and liabilities 7,224,924 6,429,648

4
GESTAMP AUTOMOCIÓN, S.A. AND SUBSIDIARIES
CONSOLIDATED INCOME STATEMENT
FOR THE YEAR ENDED DECEMBER 31, 2017 AND DECEMBER 31, 2016
(In thousands of euros)
Note December 31, 2017 December 31, 2016
CONTINUING OPERATIONS
OPERATING INCOME 25 8,390,531 7,673,939
Revenue 8,201,571 7,548,938
Other operating income 197,192 131,571
Changes in inventories 13 (8,232) (6,570)
OPERATING EXPENSE 26 (7,905,802) (7,211,317)
Raw materials and other consumables (4,882,126) (4,509,742)
Personnel expenses (1,492,846) (1,366,884)
Depreciation, amortization, and impairment losses (405,147) (378,528)
Other operating expenses (1,125,683) (956,163)
OPERATING PROFIT 484,729 462,622
Financial income 27 9,000 5,275
Financial expenses 27 (101,753) (98,758)
Exchange gains (losses) (22,918) (12,442)
Share of profits from associates - equity method 12 (997) (8,539)
Change in fair value of financial instruments 2,086 -
Impairment and gains (losses) on sale of financial instruments 32 (77)
PROFIT BEFORE TAXES FROM CONTINUING OPERATIONS 370,179 348,081
Income tax expense 28 (82,102) (88,940)
PROFIT FOR THE YEAR FROM CONTINUING OPERATIONS 288,077 259,141
PROFIT FOR THE YEAR 288,077 259,141
Profit (loss) attributable to non-controlling interest 18 (48,385) (37,787)
PROFIT ATTRIBUTABLE TO EQUITY HOLDERS OF THE PARENT COMPANY 239,692 221,354
Earnings per share (in euros)
-Basic (*) 29 0.42 0.38
From continuing operations 0.42 0.38
-Diluted (*) 29 0.42 0.38
From continuing operations 0.42 0.38
(*) During 2017, a split stock took place in the proportion of 120 new shares for every former one. In order to make comparative
the infomation, the earning per share in 2016 is shown after applying the split stock of 2017
5
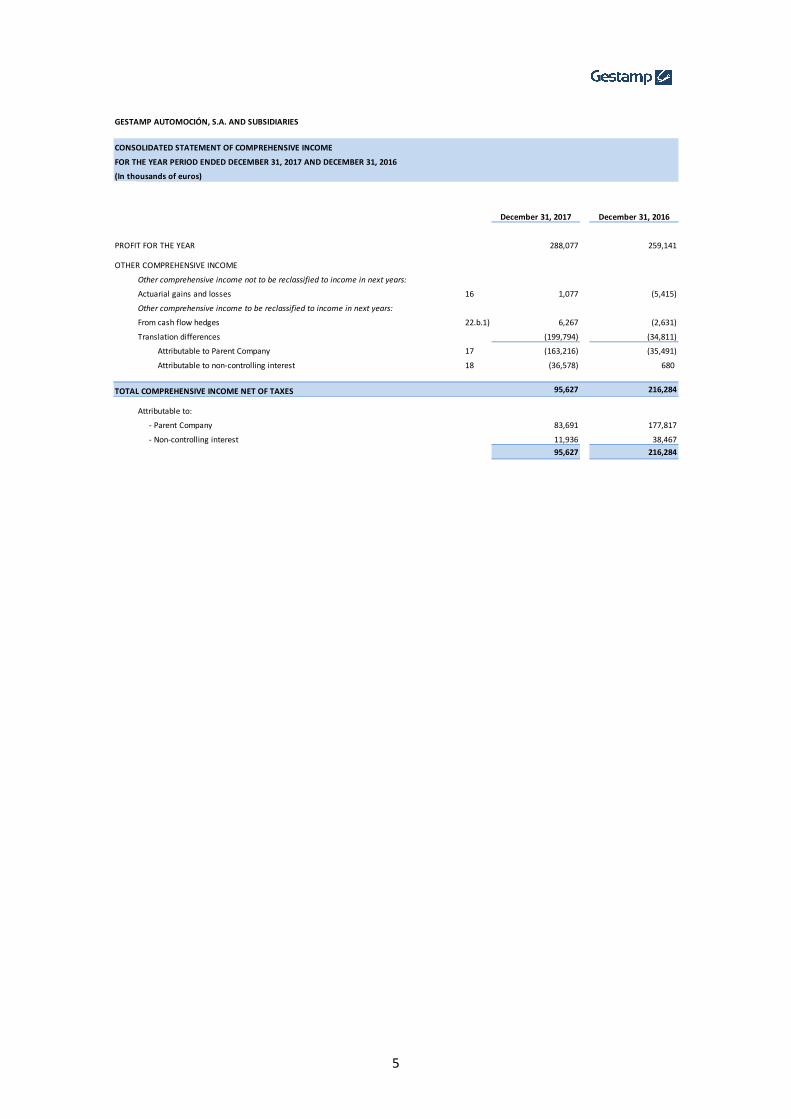
GESTAMP AUTOMOCIÓN, S.A. AND SUBSIDIARIES
CONSOLIDATED STATEMENT OF COMPREHENSIVE INCOME
FOR THE YEAR PERIOD ENDED DECEMBER 31, 2017 AND DECEMBER 31, 2016
(In thousands of euros)
December 31, 2017 December 31, 2016
PROFIT FOR THE YEAR 288,077 259,141
OTHER COMPREHENSIVE INCOME
Other comprehensive income not to be reclassified to income in next years:
Actuarial gains and losses 16 1,077 (5,415)
Other comprehensive income to be reclassified to income in next years:
From cash flow hedges 22.b.1) 6,267 (2,631)
Translation differences (199,794) (34,811)
Attributable to Parent Company 17 (163,216) (35,491)
Attributable to non-controlling interest 18 (36,578) 680
TOTAL COMPREHENSIVE INCOME NET OF TAXES 95,627 216,284
Attributable to:
- Parent Company 83,691 177,817
- Non-controlling interest 11,936 38,467
95,627 216,284

6
AT JANUARY 1, 2017 288,237 61,591 1,378,145 (203,300) 1,524,673 347,330 1,872,003
Profit for the period - - 239,692 - 239,692 48,385 288,077
Fair value adjustments (hedge) - - 6,267 - 6,267 - 6,267
Variation in translation differences - - - (163,216) (163,216) (36,578) (199,794)
Actuarial gains and losses - - 948 - 948 129 1,077
Total comprehensive income - - 246,907 (163,216) 83,691 11,936 95,627
Dividends distributed by the Parent Company - - (66,356) - (66,356) - (66,356)
Dividends distributed by subsidiaries - - - - - (5,931) (5,931)
Business combinations (Jui Li Eds. Body System., Co.Ltd Group and Gestamp Palau, S.A) - - - - - 2,164 2,164
Increase in shareholding in controlled companies - - (1,143) - (1,143) (3,307) (4,450)
Decrease in shareholding (480) - 480 - - - -
Capital increase in subsidiaries (Edscha Pha, Ltd.) - - - - - 1,199 1,199
Recognition of the Put Option sold to non-controlling interest (Note 22.d) - - (4,047) - (4,047) 80,947 76,900
Other movements and adjustments from prior years - - (2,062) - (2,062) 1,461 (601)
AT DECEMBER 31, 2017 287,757 61,591 1,551,924 (366,516) 1,534,756 435,799 1,970,555
CONSOLIDATED STATEMENT OF CHANGES IN EQUITY FOR THE YEAR PERIOD ENDED DECEMBER 31, 2017
(In thousands of euros)
Total capital and
reserves
GESTAMP AUTOMOCIÓN, S.A. AND SUBSIDIARIES
Non-controlling
interest
(Note 18)
Total equityShare premium
(Note 15)
Translation
differences
(Note 17)
Retained earnings
(Note 16)
Issued capital
(Note 15)

7
AT JANUARY 1, 2016 288,237 61,591 1,209,789 (167,809) 1,391,808 406,585 1,798,393
Profit for the period - - 221,354 - 221,354 37,787 259,141
Fair value adjustments (hedge) - - (2,631) - (2,631) - (2,631)
Variation in translation differences - - - (35,491) (35,491) 680 (34,811)
Actuarial gains and losses - - (5,415) - (5,415) - (5,415)
Total comprehensive income - - 213,308 (35,491) 177,817 38,467 216,284
Dividends distributed by the Parent Company - - (48,444) - (48,444) - (48,444)
Dividends distributed by the subsidiaries - - - - - (8,547) (8,547)
Business combination Çelik Form Gestamp Otomotiv, A.S. - - - - - (2,748) (2,748)
Disposal of companies (G Finance Luxemburgo, S.A.) - - - - - (51) (51)
Capital increase in controlled companies (Edscha Aapico Aut. Co. Ltd.) - - - - - 151 151
Acquisition of non-controlling interest in Gestamp 2008, S.L. (Note 2.b) - - (263) - (263) (6,119) (6,382)
Transfer from non-controlling interest due to changes in shareholding of Gestamp 2008, S.L (Note 2.b) - - (190) - (190) 190 -
Recognition of the Put Option sold to non-controlling interest (Note 22.d) - - 4,047 - 4,047 (80,947) (76,900)
Other movements and adjustments from prior years - - (102) - (102) 349 247
AT DECEMBER 31, 2016 288,237 61,591 1,378,145 (203,300) 1,524,673 347,330 1,872,003
Issued capital
(Note 15)
Share premium
(Note 15)
Non-controlling
interest
(Note 18)
Total equity
GESTAMP AUTOMOCIÓN, S.A. AND SUBSIDIARIES
CONSOLIDATED STATEMENT OF CHANGES IN EQUITY FOR THE YEAR PERIOD ENDED DECEMBER 31, 2016
(In thousands of euros)
Retained earnings
(Note 16)
Translation
differences
(Note 17)
Total capital and
reserves
8
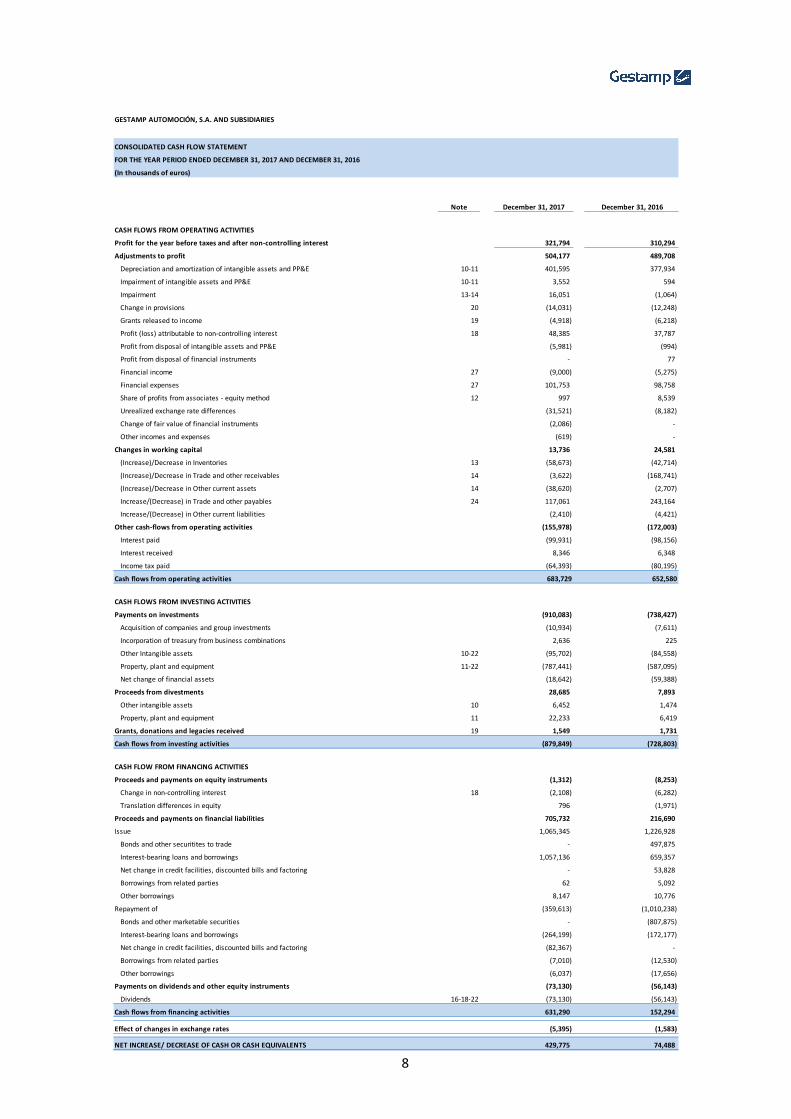
GESTAMP AUTOMOCIÓN, S.A. AND SUBSIDIARIES
FOR THE YEAR PERIOD ENDED DECEMBER 31, 2017 AND DECEMBER 31, 2016
(In thousands of euros)
Note December 31, 2017 December 31, 2016
CASH FLOWS FROM OPERATING ACTIVITIES
Profit for the year before taxes and after non-controlling interest 321,794 310,294
Adjustments to profit 504,177 489,708
Depreciation and amortization of intangible assets and PP&E 10-11 401,595 377,934
Impairment of intangible assets and PP&E 10-11 3,552 594
Impairment 13-14 16,051 (1,064)
Change in provisions 20 (14,031) (12,248)
Grants released to income 19 (4,918) (6,218)
Profit (loss) attributable to non-controlling interest 18 48,385 37,787
Profit from disposal of intangible assets and PP&E (5,981) (994)
Profit from disposal of financial instruments - 77
Financial income 27 (9,000) (5,275)
Financial expenses 27 101,753 98,758
Share of profits from associates - equity method 12 997 8,539
Unrealized exchange rate differences (31,521) (8,182)
Change of fair value of financial instruments (2,086) -
Other incomes and expenses (619) -
Changes in working capital 13,736 24,581
(Increase)/Decrease in Inventories 13 (58,673) (42,714)
(Increase)/Decrease in Trade and other receivables 14 (3,622) (168,741)
(Increase)/Decrease in Other current assets 14 (38,620) (2,707)
Increase/(Decrease) in Trade and other payables 24 117,061 243,164
Increase/(Decrease) in Other current liabilities (2,410) (4,421)
Other cash-flows from operating activities (155,978) (172,003)
Interest paid (99,931) (98,156)
Interest received 8,346 6,348
Income tax paid (64,393) (80,195)
Cash flows from operating activities 683,729 652,580
CASH FLOWS FROM INVESTING ACTIVITIES
Payments on investments (910,083) (738,427)
Acquisition of companies and group investments (10,934) (7,611)
Incorporation of treasury from business combinations 2,636 225
Other Intangible assets 10-22 (95,702) (84,558)
Property, plant and equipment 11-22 (787,441) (587,095)
Net change of financial assets (18,642) (59,388)
Proceeds from divestments 28,685 7,893
Other intangible assets 10 6,452 1,474
Property, plant and equipment 11 22,233 6,419
Grants, donations and legacies received 19 1,549 1,731
Cash flows from investing activities (879,849) (728,803)
CASH FLOW FROM FINANCING ACTIVITIES
Proceeds and payments on equity instruments (1,312) (8,253)
Change in non-controlling interest 18 (2,108) (6,282)
Translation differences in equity 796 (1,971)
Proceeds and payments on financial liabilities 705,732 216,690
Issue 1,065,345 1,226,928
Bonds and other securitites to trade - 497,875
Interest-bearing loans and borrowings 1,057,136 659,357
Net change in credit facilities, discounted bills and factoring - 53,828
Borrowings from related parties 62 5,092
Other borrowings 8,147 10,776
Repayment of (359,613) (1,010,238)
Bonds and other marketable securities - (807,875)
Interest-bearing loans and borrowings (264,199) (172,177)
Net change in credit facilities, discounted bills and factoring (82,367) -
Borrowings from related parties (7,010) (12,530)
Other borrowings (6,037) (17,656)
Payments on dividends and other equity instruments (73,130) (56,143)
Dividends 16-18-22 (73,130) (56,143)
Cash flows from financing activities 631,290 152,294
Effect of changes in exchange rates (5,395) (1,583)
NET INCREASE/ DECREASE OF CASH OR CASH EQUIVALENTS 429,775 74,488
CONSOLIDATED CASH FLOW STATEMENT
9
GESTAMP AUTOMOCIÓN, S.A. AND SUBSIDIARIES
NOTES TO THE CONSOLIDATED FINANCIAL STATEMENTS FOR YEAR PERIOD ENDED DECEMBER 31, 2017
1. Activity and companies included in consolidation scope GESTAMP AUTOMOCIÓN, S.A., (hereinafter, the “Parent Company”) was incorporated on December 22, 1997. Its registered address is currently in the Industrial Park of Lebario in Abadiano (Biscay, Spain). Its corporate purpose is to provide advisory and financing services and a link with the automobile industry for all its subsidiaries. On August 2, 2012 the Parent Company registered the change of its legal name, from limited company to corporation, at the Biscay Commercial Registry. Additionally, since 7 April 2017 the shares of the company are listed in Madrid, Barcelona, Valencia and Bilbao stock exchanges. The Parent Company, in turn, belongs to a larger group, headed by its majority shareholder Acek, Desarrollo y Gestión Industrial, S.L., formerly named Corporation Gestamp, S.L. The legal name change was adopted in the Extraordinary and Universal General Shareholders’ Meeting on February 5, 2015, being executed in a public deed on the same day. The Parent Company carries out commercial and financial transactions with the companies of Acek, Desarrollo y Gestión Industrial Group under the terms and conditions established among the parties on an arm’s length basis. Intra-Group and related parties transfer prices are duly documented in a transfer price dossier as stipulated by the prevailing legislation. The activities of the Parent Company and its subsidiaries (the Group) are focused on the design, development, and manufacturing of metal components for the automotive Industry via: stamping, tooling, assembly, welding, tailor welded blanks, die cutting and machinery. The Group also includes other companies dedicated to services such as research and development of new technologies. Most of the Group’s business is conducted in the Western Europe segment; the North America segment constitutes the second most significant geographic market and the Asia segment the third one (Note 9). Group sales are concentrated across a limited number of customers due to the nature of the automotive Industry. Admission to trading of the shares of the Parent Company Since April 7, 2017 Gestamp Automoción, S.A. shares are admitted to trading on Madrid, Barcelona, Valencia and Bilbao stock exchanges. There is no restrictions on transferability of the shares. The previous operations to the admission to trading of the shares of the Parent Company shares were as follows:
� On March 7, 2017 the share capital of the company was reduced in the amount of 479,595.30 euros with the aim of constitute a restricted reserve, with no reimbursement
10
to shareholders. This operation implied the reduction of the nominal value of the 4,795,953 shares of the company in the amount of 0.10 euros per share, this also implied that the nominal value of every share changed to 60.00 euros per share. The restricted reserve mentioned above will be un-restricted only in case of reduction of the share capital.
� After the share capital reduction, a share split operation was held on March 7, 2017. This
operation implied a reduction in the nominal value of every share, from 60.00 euros to 0.50 euros, and the transformation of every former share in 120 new shares. The operation did not implied any change in share capital, and the share capital of the company is since then divided into 575,514,360 shares with a nominal value of 0.50 euros.
The admission to trading of the shares of the Parent Company was conducted by means of an IPO (Initial Public Offering) for institutional investors, amounting to 155,388,877 shares representing 27% of the share capital of the company. The operation also included an additional acquisition option for up to 15% of the initial offer, which was materialized in the sale of 1,199,561 additional shares that represents an additional 0.21% of Gestamp Automoción, S.A. share capital. The IPO prospectus was approved by CNMV (Spanish securities and exchange authority) on March 23, 2017. On April 5, 2017 the subscription period ended and the offering price was fixed at 5.60 euros per share. Consequently, at December 31, 2017 Gestamp Automoción, S.A. shares were admitted to trading on Madrid, Barcelona, Valencia and Bilbao stock exchanges. JP Morgan Securities Plc., Morgan Stanley & Co. International Plc. and UBS Ltd. acted as lead underwriters for the initial public stock offering. The cost of the IPO amounted to 2,209 thousands of euros and were completely assumed by Gestamp Automoción, S.A., being accordingly booked in the company’s Income Statement. 2. Consolidation scope 2.a Breakdown of consolidation scope The breakdown of companies included in the consolidation scope, as well as information on the consolidation method applied, location, activity, direct or indirect shareholdings and their auditors, is specified in Annex I. The companies that hold the indirect investments corresponding to December 31, 2017 and December 31, 2016 are specified in Annex II. No significant subsidiaries have been excluded from the consolidation scope. The closing of the financial year for the companies included in the consolidation scope is December 31, with the exception of the subsidiaries Gestamp Services India Private, Ltd., Gestamp Automotive India Private, Ltd, Gestamp Automotive Chennai Private Ltd. and Gestamp Pune Automotive Private Ltd, whose fiscal years close on March 31. However, an interim closing as at December 31 has been prepared for including these companies in the Consolidated Financial Statements at December 31, 2017 and December 31, 2016.
There are no significant restrictions in the capability of accessing to or using the assets or liquidate the liabilities from the subsidiaries included in the consolidation scope.
11
2.b Changes in consolidation scope During 2017 In 2017, the companies MPO Providers Rezistent, S.R.L. (Romania), Gestamp Nitra, S.R.O. (Slovakia) and Almussafes Mantenimiento de Troqueles, S.L. (Spain) were acquired and included in consolidation scope by full consolidation method. Additionally, the companies Beyçelik Gestamp Teknoloji Kalip, A.S (Turkey), Gestamp (China) Holding, Co. Ltd. (China), Gestamp Autotech Japan K.K. (Japan) and Edscha Automotive Components (Chongqing), Co. Ltd. (China) were created and included in consolidation scope by full consolidation method (Note 3). On January 1, 2017, after getting permission from National Commission on Markets and Competition, the subsidiary Gestamp Metalbages, S.A. acquires 60% shareholding in subsidiary Essa Palau, S.A., increasing its shareholding in this company from 40% to 100% .This transaction implied a change in consolidation method of the subsidiary, changing from equity method to full consolidation method (Note 3). In addition, on March 9, 2017 the subsidiary changed its legal name to Gestamp Palau, S.A. On January 1, 2017 the subsidiary Edscha Holding Gmbh. acquired a 10% of shareholding in subsidiary Jui Li Edscha Body Systems, Co. Ltd., thus increasing its shareholding in this company and its subsidiaries Jui Li Hainan Industry Enterprise, Co. Ltd. and Jui Li Edscha Holding, Co.Ltd. from 50% to 60%. All these companies were incorporated in consolidation scope by equity method, and after this transaction they are included using full consolidation method (Note 3). On May 15, 2017 the subsidiary Beyçelik Gestamp Kalip, A.S. acquired to third parties a 48.4% shareholding in subsidiary Çelik Form Gestamp Otomotive, A.S. The acquisition price was 4,450 thousands of euros and after this operation the shareholding in the subsidiary mounted to 100%. This transaction implied a change in shareholding with no change on control, and thus the difference between non-controlling interests (3,307 thousands of euros (Note 18) and the fair value of the remuneration paid (4,450 thousands of euros) was booked as consolidated equity (1,143 thousands of euros). In 2017 also took place the merge operation between the subsidiaries Gestamp Metalbages, S.A. (the acquiring company) and Metalbages P-51, S.L. (the acquired company). Finally, the subsidiaries Edscha Scharwaechter Mechanisms, S.A.P.I. de C.V. and Edscha Scharwaechter Mechanism Servicios Laborales S.A.P.I. de C.V changed their legal names to Edscha Automotive SLP, S.A.P.I. de C.V. and Edscha Automotive SLP Servicios Laborales, S.A.P.I. de C.V. respectively (Annex I). The company Bero Tools, S.L. also changed its legal name to Gestamp Tooling Erandio, S.L. During 2016 On January, 2016 the company Çelik Form Gestamp Otomotive, A.S. was acquired and included in consolidation scope by full consolidation method (Note 3). The following companies were created in 2016: Gestamp Washtenaw, Llc., Gestamp San Luis de Potosí, S.A.P.I. de C.V., Gestamp San Luis de Potosí Servicios Laborales, S.A.P.I. de C.V., Gestamp Auto Components (Tianjin) Co., Ltd., Gestamp 2017 S.L., Autotech Engineering (Shanghai) Co. Ltd.,

12
Gestamp Hot Stamping Japan K.K. and Global Laser Araba S.L. All these companies were incorporated into the consolidation scope by the full consolidation method except the last one which was incorporated by the equity method. On March 31, 2016 the subsidiary Edscha Holding GmbH acquired an additional 40% shareholding in subsidiary Gestamp 2008 S.L. from the shareholder Ade Capital Sodical SCR, S.A. for 6,382 thousand euros, increasing its shareholding in this company from 60% to 100%. Since this transaction implied a change in shareholding but maintaining control, the difference between the adjustment to the non-controlling interest (6,119 thousand euros (Note 18) and the fair value effectively paid (6,382 thousand euros) was directly recognized in equity (263 thousand euros). Additionally, the increase in shareholding in Gestamp 2008 S.L. led to a rise in shareholding in their investees due to its previously held investments in several companies. This led to a transfer from Non-controlling interest to Retained earnings in the amount of 190 thousand euros (Note 18). In 2016 100% shareholding in the company G. Finance Luxemburgo S.A. was sold, including its subsidiary S.G.F. S.A, generating profit for 240 thousand euros. On a separate issue, the company Tavol Internacional SGPS, Lda. was dissolved. 3. Business combination During 2017 Gestamp Palau, S.A.
On November 24, 2016 Gestamp Metalbages, S.A. acquired 60% of shares of Gestamp Palau, S.A. (Essa Palau, S.A. changed its legal name on March 9, 2017) to third parties, for the amount of 5,491 thousand euros. This amount included the acquisition price (23,373 thousands of euros) less the debt and interests owed to the subsidiary by these third parties (17,882 thousands of euros). The previously mentioned debt was fully paid by Gestamp Metalbages, S.A. to Gestamp Palau, S.A. in the name of these third parties by means of bank transfer. The contract entered in to force on January 1, 2017 after National Commission on Markets and Competition approval (suspensory condition). Prior to this transaction the Group held a 40% shareholding in Gestamp Palau, S.A., thus the subsidiary was consolidated using equity method previously to control takeover. The valuation to fair value of this previously held shareholding at the date of acquisition, led to a gain of 3,660 thousands of euros. This amount was booked under the heading Other operating income in the Consolidated Income Statement (Note 25.b). Gestamp Palau, S.A. main activity is the manufacturing of automobile components for passenger cars. The fair value of the assets and liabilities from Gestamp Palau, S.A. obtained from the inclusion balance sheet is as follows:
13
The revenue and the income attributable to this business combination since the incorporation date to December 31, 2017 amounted to 61,867 thousand euros and 1,743 thousand euros of profit respectively. The headcount of this business unit incorporated to Group was 254 approximately. There were no significant costs associated to this transaction. Jui Li Edscha Body System Co., Ltd.
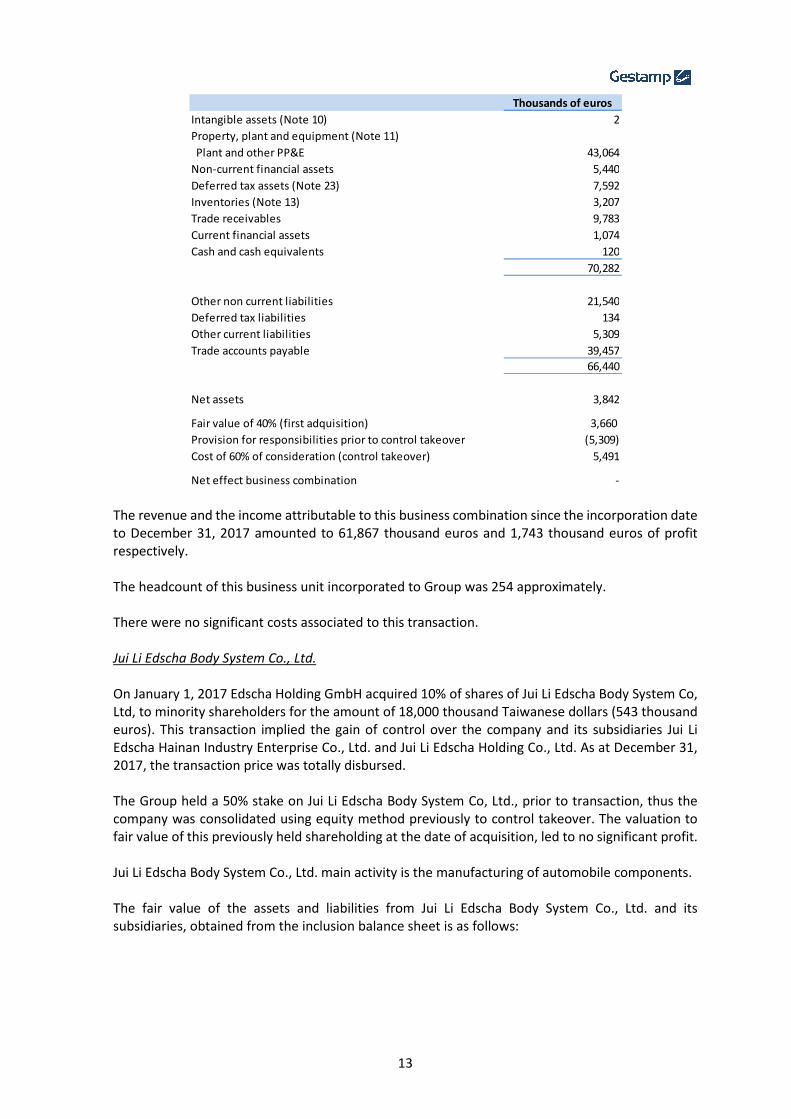
On January 1, 2017 Edscha Holding GmbH acquired 10% of shares of Jui Li Edscha Body System Co, Ltd, to minority shareholders for the amount of 18,000 thousand Taiwanese dollars (543 thousand euros). This transaction implied the gain of control over the company and its subsidiaries Jui Li Edscha Hainan Industry Enterprise Co., Ltd. and Jui Li Edscha Holding Co., Ltd. As at December 31, 2017, the transaction price was totally disbursed. The Group held a 50% stake on Jui Li Edscha Body System Co, Ltd., prior to transaction, thus the company was consolidated using equity method previously to control takeover. The valuation to fair value of this previously held shareholding at the date of acquisition, led to no significant profit. Jui Li Edscha Body System Co., Ltd. main activity is the manufacturing of automobile components. The fair value of the assets and liabilities from Jui Li Edscha Body System Co., Ltd. and its subsidiaries, obtained from the inclusion balance sheet is as follows:
Thousands of euros
Intangible assets (Note 10) 2
Property, plant and equipment (Note 11)
Plant and other PP&E 43,064
Non-current financial assets 5,440
Deferred tax assets (Note 23) 7,592
Inventories (Note 13) 3,207
Trade receivables 9,783
Current financial assets 1,074
Cash and cash equivalents 120
70,282
Other non current liabilities 21,540
Deferred tax liabilities 134
Other current liabilities 5,309
Trade accounts payable 39,457
66,440
Net assets 3,842
Fair value of 40% (first adquisition) 3,660
Provision for responsibilities prior to control takeover (5,309)
Cost of 60% of consideration (control takeover) 5,491
Net effect business combination -
14
The revenue and the income attributable to this business combination since the incorporation date to December 31, 2017 amounted to 9,095 thousand euros and 354 thousand euros of profit respectively. The headcount of this business unit incorporated to Group was 93 approximately. There were no significant costs associated to this transaction. MPO Providers Rezistent, S.R.L.
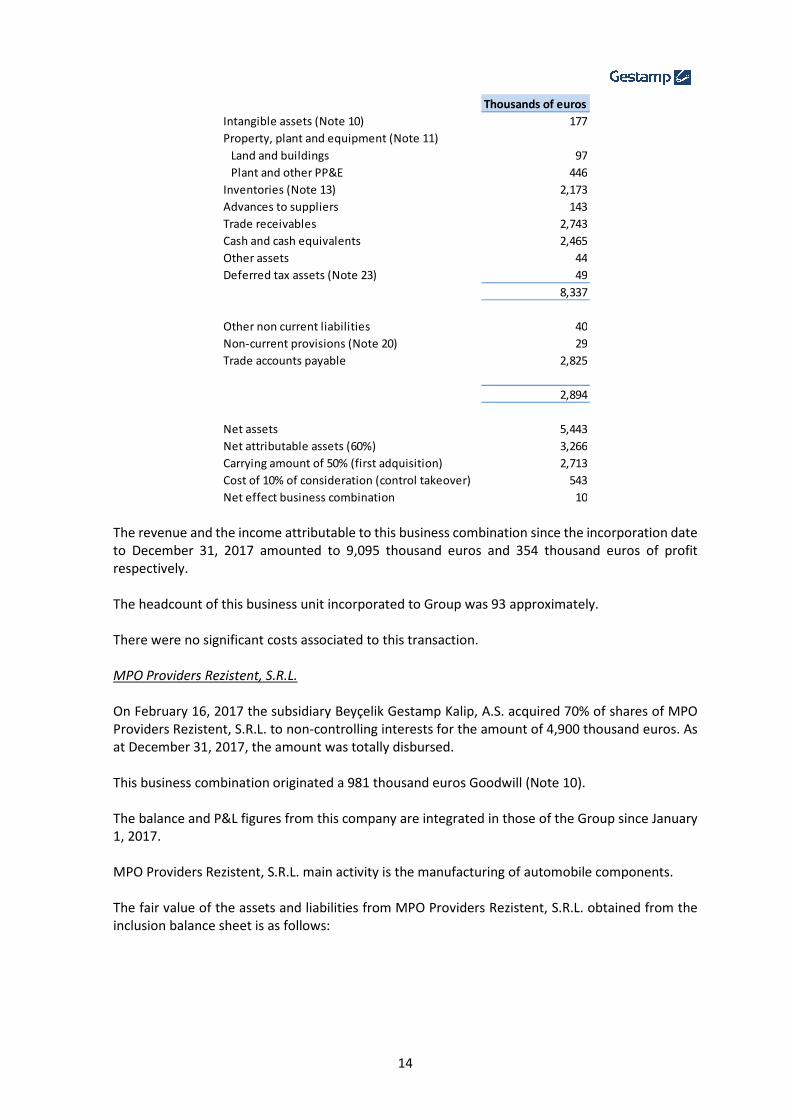
On February 16, 2017 the subsidiary Beyçelik Gestamp Kalip, A.S. acquired 70% of shares of MPO Providers Rezistent, S.R.L. to non-controlling interests for the amount of 4,900 thousand euros. As at December 31, 2017, the amount was totally disbursed. This business combination originated a 981 thousand euros Goodwill (Note 10). The balance and P&L figures from this company are integrated in those of the Group since January 1, 2017. MPO Providers Rezistent, S.R.L. main activity is the manufacturing of automobile components. The fair value of the assets and liabilities from MPO Providers Rezistent, S.R.L. obtained from the inclusion balance sheet is as follows:
Thousands of euros
Intangible assets (Note 10) 177
Property, plant and equipment (Note 11)
Land and buildings 97
Plant and other PP&E 446
Inventories (Note 13) 2,173
Advances to suppliers 143
Trade receivables 2,743
Cash and cash equivalents 2,465
Other assets 44
Deferred tax assets (Note 23) 49
8,337
Other non current liabilities 40
Non-current provisions (Note 20) 29
Trade accounts payable 2,825
2,894
Net assets 5,443
Net attributable assets (60%) 3,266
Carrying amount of 50% (first adquisition) 2,713
Cost of 10% of consideration (control takeover) 543
Net effect business combination 10

15
The revenue and the income attributable to this business combination since the incorporation date to December 31, 2017 amounted to 35,712 thousand euros and 850 thousand euros of profit respectively. The headcount of this business unit incorporated to Group was 300 approximately. There were no significant costs associated to this transaction. Gestamp Nitra, S.R.O.
On February 19, 2016 the Parent Company acquired 100% of shareholding in the Company Gestamp Nitra, S.R.O. for the amount of 6.8 thousand of euros. The subsidiary was included in the consolidation scope in 2017. There are no relevant effects related to this business combination. Gestamp Nitra, S.R.O. main activity is the stamping and manufacturing of automobile components for passenger cars. The revenue and the income attributable to this business combination since the incorporation date to December 31, 2017 amounted to 4,953 thousand euros and 55 thousand euros of profit respectively. There were no significant costs associated to this transaction.
Thousands of euros
Intangible assets (Note 10) 35
Property, plant and equipment (Note 11)
Land and buildings 1,461
Plant and other PP&E 3,814
Inventories (Note 13) 1,383
Trade receivables 3,435
Cash and cash equivalents 51
Other assets 6,103
16,282
Other non current liabilities 2,198
Other current liabilities 178
Trade accounts payable 3,149
Other liabilities 6,560
12,085
Net assets 4,197
Direct shareholding acquired 70.00%
Attributable net assets 2,938
Total consideration 4,900
Net effect business combination 1,962
Indirect shareholding 50.00%
Final net effect business combination 981
16
Almussafes Mantenimiento de Troqueles, S.L.
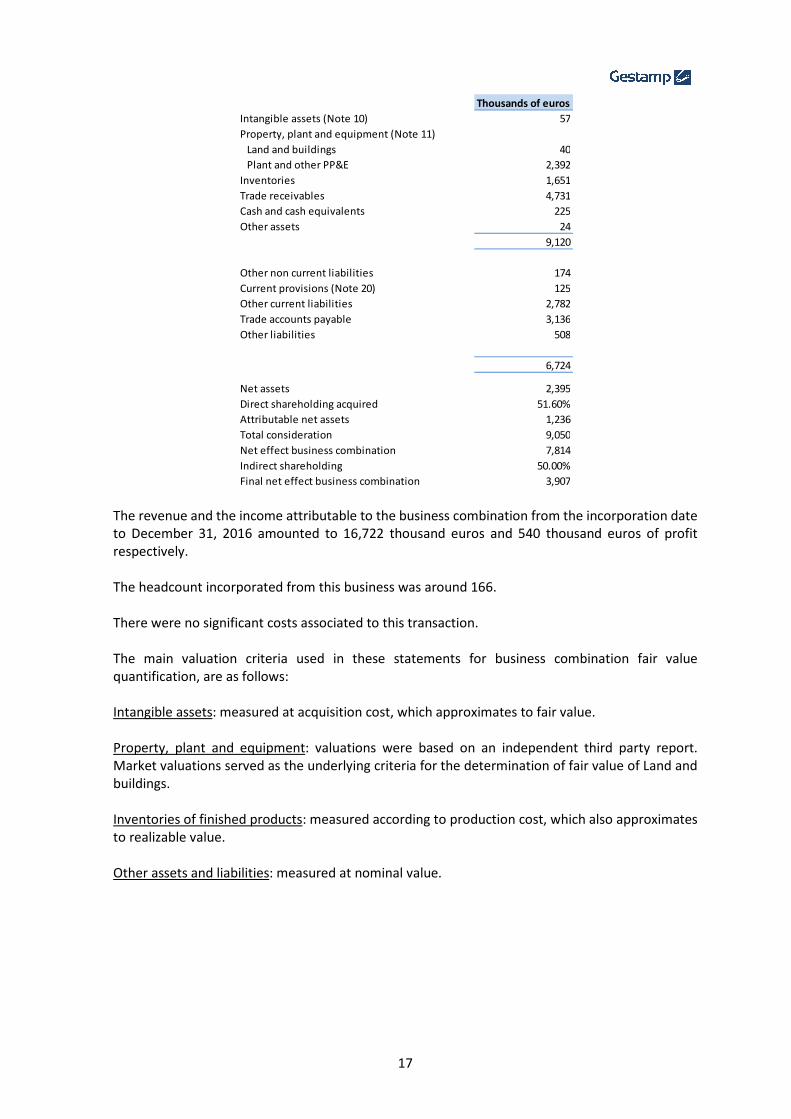
On November 24, 2016 Gestamp Metalbages, S.A. acquired 60% of shares of Gestamp Palau, S.A. to third parties, thus increasing its shareholding in this company from 40% to 100%. As a result of this transaction, the Group acquired the company Almussafes Mantenimiento de Troqueles, S.L. a solely held subsidiary of Gestamp Palau, S.A. This subsidiary was included in the consolidation scope in 2017. There are no relevant effects related to this business combination. Almussafes Mantenimiento de Troqueles, S.L main activity is the manufacturing and maintenance of dies. The revenue and the income attributable to this business combination since the incorporation date to December 31, 2017 amounted to 2,515 thousand euros and 556 thousand euros of profit respectively. There were no significant costs associated to this transaction. During 2016 On January 29, 2016 the subsidiary Beyçelik Gestamp Kalip A.S. acquired a 51.60% shareholding in Çelik Form Gestamp Otomotiv, A.S. for 9,050 thousand euros. Of this amount, 6,750 thousand euros was already disbursed at December 31, 2016 and the outstanding payment for 2,300 thousand euros was disbursed on 2017. The company is located in Bursa (Turkey) and its activity is stamping and manufacturing automobile components for passenger cars. The initial goodwill amounted to 7,814 thousand euros. Nevertheless since Beyçelik Gestamp Kalip A.S. is a 50% investee with a non-controlling interest, such part of the said goodwill is attributable to non-controlling interest, so the final goodwill is 3,907 thousand euros (Note 10). Similarly, the non-controlling interest initially incorporated for the not acquired percentage in Çelik Form Gestamp Otomotiv A.S. amounted to 1,159 euros (credit) but after attribution mentioned above the final balance is 2,748 thousand euros (debit) (Note 18). The fair value of the assets and liabilities from Çelik Form Gestamp Otomotiv, A.S. obtained from the inclusion balance sheet is as follows:
17
The revenue and the income attributable to the business combination from the incorporation date to December 31, 2016 amounted to 16,722 thousand euros and 540 thousand euros of profit respectively. The headcount incorporated from this business was around 166. There were no significant costs associated to this transaction. The main valuation criteria used in these statements for business combination fair value quantification, are as follows: Intangible assets: measured at acquisition cost, which approximates to fair value. Property, plant and equipment: valuations were based on an independent third party report. Market valuations served as the underlying criteria for the determination of fair value of Land and buildings. Inventories of finished products: measured according to production cost, which also approximates to realizable value. Other assets and liabilities: measured at nominal value.
Thousands of euros
Intangible assets (Note 10) 57
Property, plant and equipment (Note 11)
Land and buildings 40
Plant and other PP&E 2,392
Inventories 1,651
Trade receivables 4,731
Cash and cash equivalents 225
Other assets 24
9,120
Other non current liabilities 174
Current provisions (Note 20) 125
Other current liabilities 2,782
Trade accounts payable 3,136
Other liabilities 508
6,724
Net assets 2,395
Direct shareholding acquired 51.60%
Attributable net assets 1,236
Total consideration 9,050
Net effect business combination 7,814
Indirect shareholding 50.00%
Final net effect business combination 3,907

18
4. Basis of presentation 4.1 True and fair view The Consolidated Financial Statements for the period ended December 31, 2017 have been prepared in accordance with International Financial Reporting Standards (IFRS) adopted by the European Union and enacted in European Commission legislation in effect on December 31, 2017. The Consolidated Financial Statements have been prepared on the basis of the accounting records of each Group company as at December 31, 2017 and December 31, 2016. Each company prepares its Financial Statements in accordance with the accounting principles and standards in force in the country in which it operates; the required adjustments and reclassifications were made in consolidation process in order to harmonize the policies and methods used and to adapt them to IFRS. These Consolidated Financial Statements for year ended December 31, 2017 were authorized by the Board of Directors of Gestamp Automoción S.A. on February 26, 2018 for issue and submission to the Annual General Meeting where they are expected to be approved without modification. The figures contained in these Consolidated Financial Statements are expressed in thousands of euros, unless otherwise indicated, and consequently they are susceptible to rounding. 4.2 Comparison of information In 2017, the following companies were incorporated under the consolidation scope:
� MPO Providers Rezistent, S.R.L. � Beyçelik Gestamp Teknoloji Kalip, A.S. � Gestamp Nitra, S.R.O. � Almussafes Mantenimiento de Troqueles, S.L. � Gestamp (China) Holding, Co. Ltd. � Gestamp Autotech Japan K.K. � Edscha Automotive Components (Chongqing), Co. Ltd.
Additionally, the method used to include the following companies under the consolidation scope was modified (Note 2.b):
� Gestamp Palau, S.A. � Jui Li Edscha Body Systems, Co. Ltd. � Jui Li Edscha Hainan Industry Enterprise, Co. Ltd. � Jui Li Edscha Holding, Co. Ltd.
It also took place the merge operation between the subsidiaries Gestamp Metalbages, S.A. (the acquiring company) and Metalbages P-51, S.L. (the acquired company). The company Çelik Form Gestamp Otomotiv, A.S. was incorporated in January 2016 and control was taken through the subsidiary Beyçelik Gestamp Kalip, A.S. (Note 2.b). On December 2016 the company G. Finance Luxemburgo S.A. was sold including the interest in its subsidiary S.G.F., S.A. (Note 2.b).
19
4.3 Basis of consolidation The Consolidated Financial Statements comprise the financial statements of the Parent Company and subsidiaries at December 31, 2017. The Group controls a subsidiary if and only if it has:
� Power over the subsidiary (rights that give the ability to direct the relevant activities of the subsidiary)
� Exposure, or rights to variable returns from its involvement in the subsidiary and � The ability to use its power over the subsidiary to affect the said variable returns.
When the Group does not hold the majority of voting rights or similar rights of the subsidiary, the Group considers all relevant facts and circumstances to assess the existence of control. This includes:
� Contractual agreements with other investors holding voting rights of the subsidiary � Rights arisen from other contractual agreements � Potential voting rights of the Group � Power over relevant activities of the subsidiary
When facts and circumstances indicate changes in one or more elements determining control over a subsidiary, the Group reassesses the existence of control over such subsidiary (Note 7). Subsidiaries are fully consolidated from the acquisition date, when the Group obtains control, and continue to be consolidated until the date when such control ceases. If the Group loses or relinquishes control of a subsidiary, the Consolidated Financial Statements include that subsidiary’s results for the portion of the year during which the Group held control. The financial statement of the subsidiaries have the same closing date as the Parent Company, except for the companies mentioned in Note 2.a. The said companies have an additional closing for the financial year for their inclusion to the Consolidated Financial Statements, being elaborated with the same accounting policies in a uniform and coherent procedure. The profit of a subsidiary is attributed to non-controlling interest even if it means registering a receivable balance. Changes in shareholding percentage that do not mean loss of control are reflected as an equity transaction. When the Group lose control of a subsidiary:
� Derecognizes assets (including goodwill) and liabilities of such subsidiary. � Derecognizes carrying amount of non-controlling interests. � Derecognizes the translation differences registered in Equity. � Recognizes the fair value of the amount received for the operation. � Recognizes the fair value of any retained investment. � Recognizes any excess or deficit in the Consolidated Income Statement. � Reclassifies the shareholding of the Parent Company in the items previously registered in
Other Comprehensive Income to profit or to retained earnings, as appropriate.
20
Subsidiaries The full consolidation method is used for companies included in the consolidation scope and controlled by the Parent Company. The Parent Company controls a subsidiary if and only if the Parent Company has all the following:
I. Power over the subsidiary. The Parent Company has power when it has existing rights that give the ability to make decisions on their relevant activities, which affect, in a significant way, to the subsidiary returns
II. Exposure, or rights, to variable returns from its involvement with the subsidiary; and III. The ability to use its power over the subsidiary to affect the amount of the Parent Company’s
returns. Joint ventures Interests in joint ventures are consolidated using the equity method until the date on which the Group ceases to have joint control over the venture. A joint venture is an arrangement whereby the parties have joint control of the rights to the net assets of the joint venture. Joint control is the contractual agreement to share control and it exists only when decisions about the relevant activities require the unanimous consent of the parties sharing control. Joint operations A joint operation is a joint arrangement whereby the parties that have joint control of the arrangement have rights to the assets and obligations for the liabilities. Those parties are called joint operators. The joint operations where the Group acts as joint operator are consolidated under interest in assets, liabilities, income and expenses. Associates Investments in which the Group has significant influence but not control have been consolidated under the equity method. Significant influence is the power to participate in the financial and operating policy decisions of the subsidiary but it does not imply control or joint control on those policies. Considerations to make in order to decide whether there is significant influence are similar to those made to decide whether there is control over a subsidiary. For the purposes of the preparation of the accompanying Consolidated Financial Statements, significant influence is deemed to exist in investments in which the Group, directly or indirectly, holds over 20% of the voting power, and in certain instances where the Group’s holding is less than 20%, but significant influence can be clearly demonstrated. Translation of the Financial Statements of foreign operations The assets and liabilities and income statements of foreign companies included in the Consolidated Financial Statements, whose functional currency is different from the presentation currency are translated to euro using the closing foreign exchange rates method as follows:
� The assets, rights, and liabilities of foreign operations are translated at the exchange rate prevailing at the Consolidated Balance Sheet date.
� Income and expenses are translated using the average exchange rate, as long as that average is a reasonable approximation of the cumulative effect of the actual exchange rates prevailing at the transactions dates.
21
The differences between the net book value of equity of the foreign companies converted using historical exchange rates and including the net result from the Profit and Loss Account, reflecting the above mentioned treatment of income and expenses in foreign currencies, and the net book value of equity resulting from the conversion of goods, rights and liabilities using the exchange rate prevailing at the Consolidated Balance Sheet date, are registered as “Translation differences”, with the corresponding negative or positive sign, in the Equity in the Consolidated Balance Sheet (Note 17). Exchange gains and losses due to the impact of changes in the functional currency relative to the euro on foreign currency borrowings considered permanent are taken directly to equity under “Translation differences”, net of tax effect. The net amount of translation differences in 2017 is 74.6 million euros of negative translation differences (8.6 million euros of positive translation differences in 2016). The intercompany loans to subsidiaries whose repayment is not foreseen are considered permanent financing and thus they are considered equity. At December 31, 2017 and December 31, 2016 neither the Parent Company nor the subsidiaries held equity units issued by the Parent Company. The effect of changes in foreign exchange rates, when presenting the Statement of Cash Flows by indirect method, has been calculated considering an average for the year of Cash and cash equivalents and applying the change of foreign exchange rates at closing of each year. Transactions between companies included in the consolidation scope The following transactions and balances were eliminated in consolidation:
� Reciprocal receivables/payables and expenses/income relating to intra-Group transactions. � Income from the purchase and sale of property, plant and equipment and intangible assets
as well as unrealized gains on inventories, if the amount is significant. � Intra-Group dividends and the debit balance corresponding to interim dividends recognized
at the company that paid them. Non-controlling interest The value of non-controlling interest in the equity and profit (loss) for the year of subsidiaries consolidated by the full consolidation method is recognized in “Equity attributable to non-controlling interest” in the Equity in the Consolidated Balance Sheet and in “Profit (loss) attributable to non-controlling interest” in the Consolidated Income Statement and in the Consolidated Statement of Comprehensive Income, respectively. 4.4 Going concern The Group’s management has drawn up these Consolidated Financial Statements on a going concern basis given its judgment that there are no uncertainties regarding its ability to continue as a going concern. The Group has sufficient financing in place to fund its operations. The 80% of its bank financing as at December 31, 2017, maturing over periods longer than twelve months (December 31, 2016: 79%).

22
At December 31, 2017, total available liquidity hold by the Group raised the amount of 1,788.5 million euros (1,168.1 million euros at December 31, 2016), including 860.2 million euros in cash and cash equivalents (430.5 million euros at December 31, 2016) and 5.4 million euros in securities portfolio (0.3 million euros at December 31, 2016). In addition, the Group had undrawn credit facilities amounting to 642.9 million euros at December 31, 2017 (457.3 million euros at December 31, 2016) and 280.0 million euros in an undrawn Revolving Credit Facility at December 31, 2017 and December 31, 2016. The aforementioned Revolving Credit Facility has maturity on July 15, 2022, different than other credit facilities that have maturity not later than 12 months. 4.5 Alternative management indicators The Group uses a set of indicators in the decision making process since they allow a better analysis of their financial situation and they are widely used by investors, financial analysts and other interest groups. These indicators are not defined by IFRS and thus may not be comparable to similar indicators used by other companies. EBITDA (Earnings Before Interest, Taxes, Depreciation and Amortization) EBITDA represents the operating profit before depreciation, amortization and impairment losses. EBITDA at December 31, 2017 and 2016 was as follows:
EBIT (Earnings Before Interest and Taxes) EBIT is the Operating Profit Net Financial Debt Net Financial Debt at December 31, 2017 and December 31, 2016 was as follows (Note 22):
CAPEX CAPEX is calculated by adding the additions to Other intangible assets and to Property, plant and equipment. CAPEX at December 31, 2017 and December 31, 2016 was as follows (Note 10.b and Note 11):
2017 2016
Operating Profit 484,729 462,622
Depreciation and amortization 405,147 378,528
889,876 841,150
Thousands of euros
2017 2016
Interest-bearing loans and borrowings and debt issues 2,710,880 1,967,599
Financial leasing 32,672 33,574
Borrowings from related parties 59,294 70,162
Other non-current financial liabilities 34,183 34,991
Total (Note 22) 2,837,029 2,106,326
Current financial assets (78,896) (43,228)
Cash and cash equivalents (860,238) (430,463)
Total (939,134) (473,691)
Net financial debt 1,897,895 1,632,635
Thousands of euros

23
5. Changes in accounting policies a) Standards and interpretations approved by the European Union and applied for the first
time during the period The accounting policies used in the preparation of these Consolidated Financial Statements are the same as the policies applied in the Consolidated Financial Statements as at 31 December 2016, except for the amendments to IAS 7 Statement of Cash Flows: information provided. These amendments requires entities to disaggregate all changes in liabilities due to financial activity, including derivative financial instruments and hedges (e.g. exchange gains and losses). This new information to be provided had been detailed in Note 22, and as it is allowed in IAS 7, the Group opted for not provide comparative information. b) Standards issued by IASB but not yet effective this period. The Group will not adopt the standards, interpretations and amendments to standards issued by IASB, that are not effective in the European Union at the date of issuance of these Consolidated Financial Statements until its official implementation. These to be implemented standards will not have a significant impact in the Consolidated Financial Statements, except for the following policies, interpretations and disclosures: IFRS 9 - Financial Instruments
In July 2014, the IASB issued the final version of IFRS 9 Financial Instruments that replaces IAS 39 Financial Instruments: Recognition and Measurement and all previous versions of IFRS 9. IFRS 9 is effective for annual periods beginning on or after 1 January 2018. Except for hedge accounting, retrospective application is required. For hedge accounting, the requirements are generally applied prospectively, with some limited exceptions. The Group plans to adopt the new standard by not reexpresing comparative information. During 2017, the Group has performed a high-level impact assessment of all three aspects of IFRS 9. This preliminary assessment is based on currently available information and may be subject to changes arising from further detailed analyses or additional reasonable and supportable information being made available in 2018 when the Group will adopt this standard. The most relevant impact of IFRS 9 implementation in this Consolidated Financial Statements correspond to debt restructuring processes.
2017 2016
Additions to Other intangible assets 95,702 83,581
Additions to Property, plant and equipment 700,307 641,185
796,009 724,766
Thousands of euros

24
(a) Classification and measurement
The Group does not expect a significant impact on its balance sheet or equity on applying the classification and measurement requirements of IFRS 9, except for those aspects related to debt restructuring processes.
Loans as well as trade receivables are held to collect contractual cash flows and are expected to give rise to cash flows representing solely payments of principal and interest. The Group analysed the contractual cash flow characteristics of those instruments and concluded that all those instruments meet the criteria for amortized cost measurement under IFRS 9. Thus, no reclassification of those instruments is required.
Debt restructuring processes
Group financial debt with banks and credit institutions for the amount of 2,710,880 thousand euros (1,967,599 thousand euros at December 31, 2016) experienced some restructuring processes after the date on which was granted, as it is explained in Note 22. Taking into account these debt restructuration terms, the Group did not considered these modifications as relevant under IAS 39 requirements. Thus, the debt amount booked in the Consolidated Balance Sheet was adjusted to include restructuring fees and to update the effective interest rate.
IFRS 9 guidelines for this kind of debt restructuring processes is different from the above criteria, since it requires to adjust the debt balance registered in balance sheet by means of adjusted cash flows discounted to the original effective interest rate. This rate, once adjusted using the possible restructuring fees, must be used for subsequent periods.
(b) Impairment
IFRS 9 requires the Group to record expected credit losses on all of its debt securities, loans and trade receivables, either on a 12-month or lifetime basis. The Group expects to apply the simplified approach and record lifetime expected losses on all trade receivables. The Group expects no significant impact due to customer’s credit quality.
(c) Hedge accounting
The Group believes that all existing hedge relationships that are currently designated in effective hedging relationships will still qualify for hedge accounting under IFRS 9.
All things considered, the IFRS 9 adoption impact will be only linked to debt restructuring processes, and it is expected that this impact will be quantified as follows:
Millions of
euros
Liabilities 2017
Interest-bearing loans and borrowings (106)
Deferred tax liabilities 26
Total liabilities (80)
Positive impact on equity 80
25
IFRS 15 - Revenue from Contracts with Customers
IFRS 15 was issued in May 2014 and modified in April 2016. This standard establishes a five-step model to account for revenue arising from contracts with customers. Under IFRS 15, revenue is recognised at an amount that reflects the consideration to which an entity expects to be entitled in exchange for transferring goods or services to a customer. IFRS 15 implementation is required for annual periods beginning on 1 January 2018. Even they are not relevant, the Group analysed the impact on the amount and the time of recognition of the revenues. The specific circumstances related to this issue involving the Group are as follows:
(a) Performance obligations identification
The Group brings tooling services and pieces that are delivered to the customer over time, and not necessarily all of them at the same time. As a general point, Group contracts consist in non-previously determined service and pieces supply agreements, with possible additional orders from the customer.
(b) Allocation of the considerations
The Group negotiates with clients discounts or incentives, which result under IFRS 15 do not lead to significantly different results than those applied at the moment. Even if the agreement has an undetermined number of pieces to be produced, these discounts and incentives are discounted from expected future income.
(c) Revenue recognition
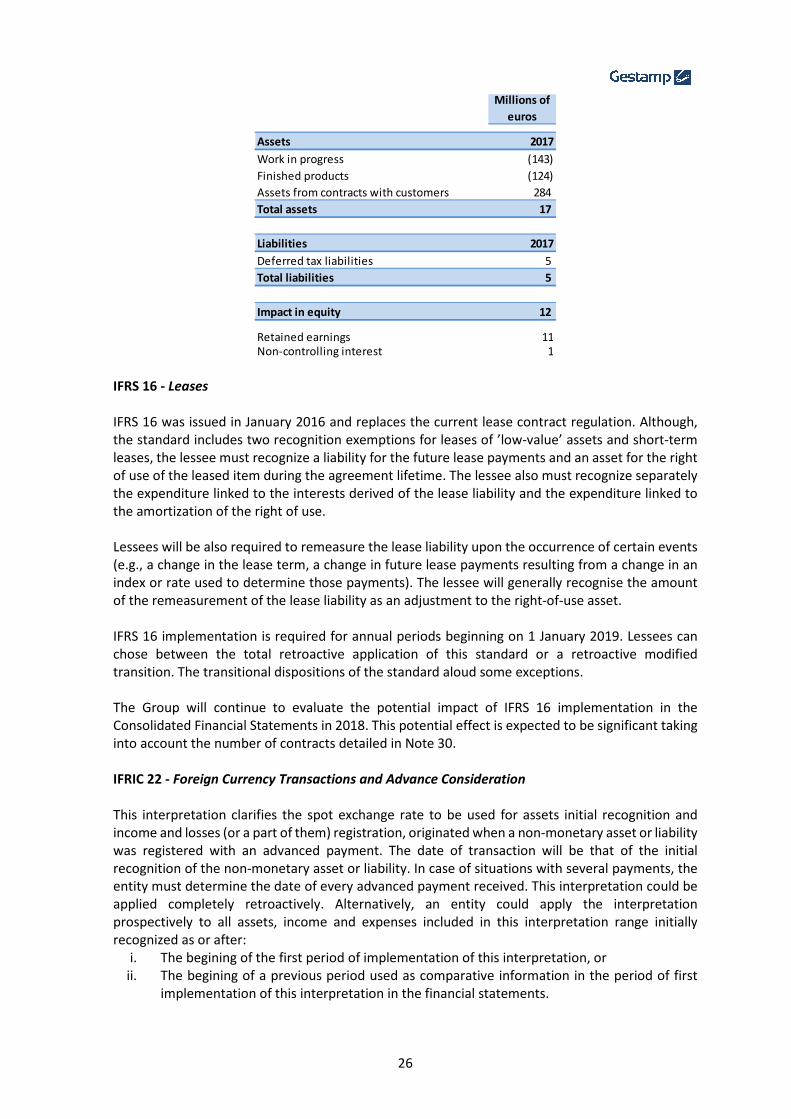
The Group recognizes revenue from pieces on a risk and profit transmission basis as required by IAS 18. Contrary to that criterion, IFRS 15 implies revenue recognition on control transmission basis. Relating to this issue, most of the pieces brought to customers do not have any alternative use, and considering all related circunstaces the Group has the right to receive the cost plus a margin.In accordance with that, the stocks of finished products and work in progress will be valuated at sale price and will be detailed in the Consolidated Balance Sheet under the heading Assets from contracts with customers.
(d) Presentation and disclosure requirements
IFRS 15 provides presentation and disclosure requirements, which are more detailed than under current IFRS. The presentation requirements represent a significant change from current practice and significantly increases the volume of disclosures required in Group’s Consolidated Financial Statements. Many of the disclosure requirements in IFRS 15 are completely new and the Group estimated that the impact of some of these requirements would be significant. The Group expects that the notes to the Consolidated Financial Statements will be extended due to implementation of significative judgements disclosures: agreement duration identification, performance obligations identification.
In accordance with IFRS 15 requirements, the Group will disclose the operating revenue from contracts with customers in additional categories such as revenue nature, which will be disclosed between the different segments reported.
The expected IFRS 15 implementation quantified effect is as follows:
26
IFRS 16 - Leases IFRS 16 was issued in January 2016 and replaces the current lease contract regulation. Although, the standard includes two recognition exemptions for leases of ’low-value’ assets and short-term leases, the lessee must recognize a liability for the future lease payments and an asset for the right of use of the leased item during the agreement lifetime. The lessee also must recognize separately the expenditure linked to the interests derived of the lease liability and the expenditure linked to the amortization of the right of use. Lessees will be also required to remeasure the lease liability upon the occurrence of certain events (e.g., a change in the lease term, a change in future lease payments resulting from a change in an index or rate used to determine those payments). The lessee will generally recognise the amount of the remeasurement of the lease liability as an adjustment to the right-of-use asset. IFRS 16 implementation is required for annual periods beginning on 1 January 2019. Lessees can chose between the total retroactive application of this standard or a retroactive modified transition. The transitional dispositions of the standard aloud some exceptions. The Group will continue to evaluate the potential impact of IFRS 16 implementation in the Consolidated Financial Statements in 2018. This potential effect is expected to be significant taking into account the number of contracts detailed in Note 30. IFRIC 22 - Foreign Currency Transactions and Advance Consideration
This interpretation clarifies the spot exchange rate to be used for assets initial recognition and income and losses (or a part of them) registration, originated when a non-monetary asset or liability was registered with an advanced payment. The date of transaction will be that of the initial recognition of the non-monetary asset or liability. In case of situations with several payments, the entity must determine the date of every advanced payment received. This interpretation could be applied completely retroactively. Alternatively, an entity could apply the interpretation prospectively to all assets, income and expenses included in this interpretation range initially recognized as or after:
i. The begining of the first period of implementation of this interpretation, or ii. The begining of a previous period used as comparative information in the period of first
implementation of this interpretation in the financial statements.
Millions of
euros
Assets 2017
Work in progress (143)
Finished products (124)
Assets from contracts with customers 284
Total assets 17
Liabilities 2017
Deferred tax liabilities 5
Total liabilities 5
Impact in equity 12
Retained earnings 11Non-controlling interest 1

27
This interpretation is expected to be required for annual periods beginning on 1 January 2018 or later. The advanced application of this interpretation is allowed and must be disclousured. Taking into account that the Group usual practice is in line with this interpretation, there is no expected effect in the consolidated financial statements related to this issue. IFRIC 23 – Uncertainty over Income Tax Treatments
IFRIC 23 clarifies the accounting for uncertainties over income taxes treatments under IAS 12. This interpretation not include levies and taxes out of IAS 12 scope, nor the treatment of tax penalties and interests related to this tax. The interpretation approach specifically to the following aspects:
� When an entity should consider uncertainty over tax separately. � The hypothesis to be implemented about fiscal authority’s tax treatment revision. � How an entity should determine income for tax purposes, tax bases, tax loses to be
compensated, tax deductions and tax rates. � How an entity should consider changes in facts and circumstances.
Any entity must determine to consider every uncertainty over income tax separately or jointly with other uncertainties over income tax. The criterion to be applied is those that better clarifies the uncertainty linked to income tax. This interpretation is expected to be required for annual periods beginning on 1 January 2019 or later, and some exceptions are allowed during transitional period. The Group will apply this interpretation since its implementation date. Taking into account that the Group operates in an international complex tax environment, the application of this interpretation might affect the consolidated financial statements and its disclosures. It also may be possible that the Group will need to implement new processes and procedures to obtain the necessary information to apply properly this interpretation. 6. Summary of significant accounting policies 6.1 Foreign currency transactions Functional and presentation currency Line items included in the financial statements of each entity are valued using the functional currency of the primary economic environment in which it operates. The Consolidated Financial Statements are presented in thousands of euros, as the Euro is the Group's presentation currency and the functional currency of the Parent Company. Transactions in foreign currency different to the functional currency of each company Transactions in foreign currencies different to the functional currency of each company are translated to the Group's functional currency at the exchange rate prevailing at the date of the transaction. Exchange gains and losses arising on the settlement of these transactions or on translating foreign currency denominated monetary assets and liabilities at closing rates are recognized in the Consolidated Income Statement.
28
6.2 Property, plant and equipment Property, plant and equipment is carried at either acquisition, transition cost to IFRS (January 1, 2007), or production cost, including all the costs and expenses directly related with assets acquired until ready for use, less accumulated depreciation and any impairment losses. Land is not depreciated and is presented net of any impairment charges. Acquisition cost includes:
� Purchase Price. � Discounts for prompt payment, which are deducted from the asset's carrying value. � Directly attributable costs incurred to ready the asset for use.
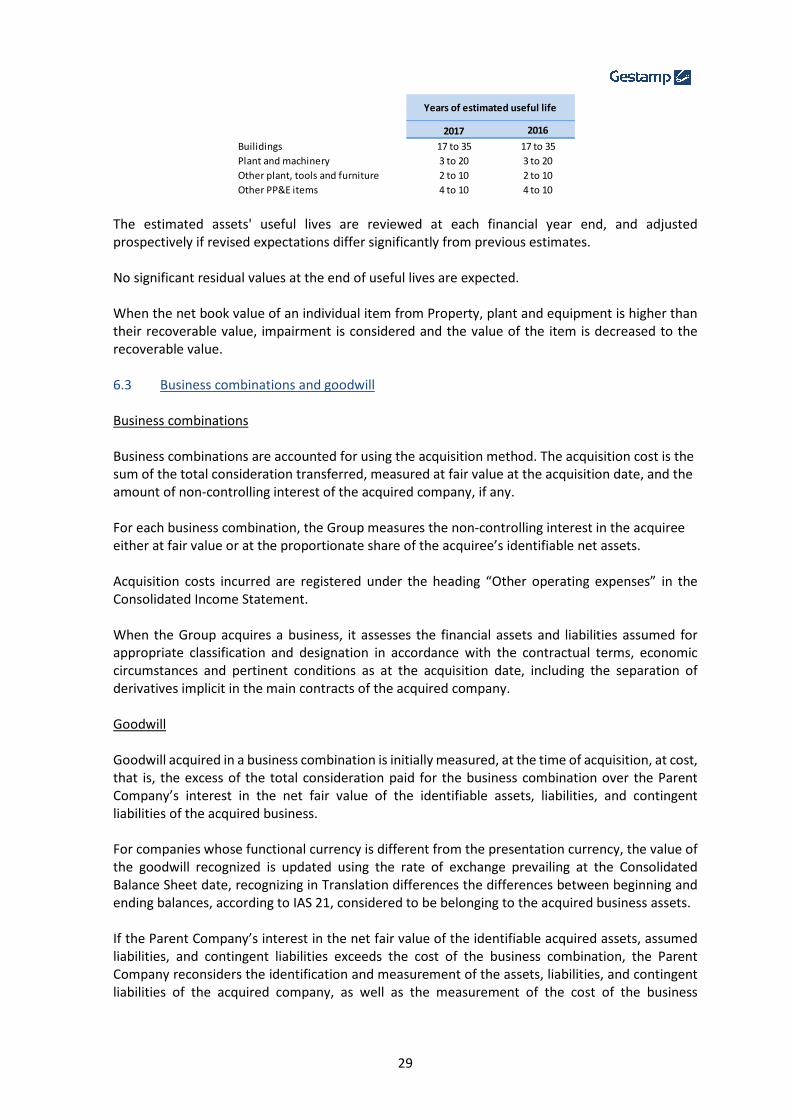
Prior to the IFRS transition date (January 1, 2007), certain Group companies revalued certain items of property, plant and equipment as permitted under applicable legislation (Royal Decree-Law 7/1996, Basque Regional Law 6/1996 and several international laws). The amount of these revaluations is considered part of the cost of the assets as provided for under IAS 1. At the transition date to EU-IFRS (January 1, 2007), Property, plant and equipment was measured at fair value at the said date, based on the appraisals of an independent expert, which generated a revaluation of Group assets (Note 11). The carrying value of Property plant, and equipment acquired by means of a business combination is measured by its fair value, determined by an independent expert at the moment of its incorporation into the Group (Note 6.3). Specific spare parts: certain major parts of some items of Property, plant and equipment may require replacement at irregular intervals. The cost of these parts is capitalized when the part is replaced and depreciated over their estimated useful lives. The net carrying amount of replaced parts is retired with a charge to income when the replacement occurs. Ordinary repair or maintenance work is not capitalized. An item of Property, plant and equipment is retired upon disposal or when no future economic benefits are expected from its use or disposal. Any gain or loss arising on retirement of the asset (calculated as the difference between the net disposal proceeds and the net carrying amount of the asset) is included in the Consolidated Income Statement in the year the asset is retired. As permitted under revised IAS 23, borrowing costs directly attributable to the acquisition or development of a qualifying asset - an asset that takes more than one year to be ready for its intended use - are capitalized as part of the cost of the respective assets. The amount of the said capitalized costs is not significant. Annual depreciation is calculated using the straight-line method based on the estimated useful lives of the various assets. The estimated useful lives of the various asset categories are:
29
The estimated assets' useful lives are reviewed at each financial year end, and adjusted prospectively if revised expectations differ significantly from previous estimates. No significant residual values at the end of useful lives are expected. When the net book value of an individual item from Property, plant and equipment is higher than their recoverable value, impairment is considered and the value of the item is decreased to the recoverable value. 6.3 Business combinations and goodwill Business combinations Business combinations are accounted for using the acquisition method. The acquisition cost is the sum of the total consideration transferred, measured at fair value at the acquisition date, and the amount of non-controlling interest of the acquired company, if any. For each business combination, the Group measures the non-controlling interest in the acquiree either at fair value or at the proportionate share of the acquiree’s identifiable net assets. Acquisition costs incurred are registered under the heading “Other operating expenses” in the Consolidated Income Statement. When the Group acquires a business, it assesses the financial assets and liabilities assumed for appropriate classification and designation in accordance with the contractual terms, economic circumstances and pertinent conditions as at the acquisition date, including the separation of derivatives implicit in the main contracts of the acquired company. Goodwill Goodwill acquired in a business combination is initially measured, at the time of acquisition, at cost, that is, the excess of the total consideration paid for the business combination over the Parent Company’s interest in the net fair value of the identifiable assets, liabilities, and contingent liabilities of the acquired business. For companies whose functional currency is different from the presentation currency, the value of the goodwill recognized is updated using the rate of exchange prevailing at the Consolidated Balance Sheet date, recognizing in Translation differences the differences between beginning and ending balances, according to IAS 21, considered to be belonging to the acquired business assets. If the Parent Company’s interest in the net fair value of the identifiable acquired assets, assumed liabilities, and contingent liabilities exceeds the cost of the business combination, the Parent Company reconsiders the identification and measurement of the assets, liabilities, and contingent liabilities of the acquired company, as well as the measurement of the cost of the business
2017 2016
Builidings 17 to 35 17 to 35
Plant and machinery 3 to 20 3 to 20
Other plant, tools and furniture 2 to 10 2 to 10
Other PP&E items 4 to 10 4 to 10
Years of estimated useful life

30
combination (even non-monetary) and recognizes any excess that continues to exist after this reconsideration in the Consolidated Income Statement. After initial recognition, goodwill is measured at cost less any accumulated impairment losses. Goodwill is tested for impairment annually or more frequently if events or changes in circumstances indicate that the carrying amount may be impaired. For the purpose of impairment testing, goodwill acquired in a business combination is, from the acquisition date, allocated to each of the Group’s cash-generating units or groups of cash-generating units (Note 6.7) expected to benefit from the business combination’s synergies, irrespective of any other Group assets or liabilities assigned to those units or groups of units. Impairment is determined by assessing the recoverable amount of the cash-generating unit or groups of cash-generating units to which the goodwill relates. If the recoverable amount of the cash-generating unit or group of cash-generating units is less than the carrying amount, the Group recognizes an impairment loss (Note 6.7). 6.4 Investment in associates and joint ventures The Group has several participations in joint ventures, businesses over which the Group exercises joint control, where contractual agreements exist establishing joint control over the economic activities of the said companies. The contracts require that the agreement between the parties with respect to the operating and financial decisions be unanimous. The Group also has participations in associates, businesses over which the Group has significant influence. Participations in associates and joint ventures are accounted for using the equity method. According to this method, the investment in an associate or a joint venture is initially recorded at cost. From the acquisition date on, the carrying amount of the investment is adjusted to reflect the changes of the investor’s share of the net assets of the associate and the joint venture. The goodwill related to the associate or jointly controlled entity is included in the carrying amount of the investment and it is not amortized and no related impairment test is performed. The share of the Group in profits of operations of the associate or joint venture is reflected in the Consolidated Income Statement. When there has been a change recognized directly in equity by the associate or joint venture, the Group recognizes its share of this change, when applicable, in the Consolidated Statement of Changes in Equity. Non-realized gains or losses resulting from transactions between the Group and the associate or joint venture corresponding to the share of the Group in the associate or joint venture are eliminated. The share of the Group in profits of the associate or joint venture is reflected directly in the Consolidated Income Statement and it represents profit after taxes and non-controlling interests existing in subsidiaries of the associate or joint venture. The financial statements of the associate and the joint venture are prepared for the same period as the Group; the required adjustments and reclassifications have been made in consolidation in order to harmonize the policies and methods used by the Group. After using the equity method, the Group decides if impairment losses on the investment in the associate or joint venture have to be recognized. At the closing date the Group considers if there
31
are evidences of impairment of the investment in the associate or joint venture. If so, the impairment is calculated as the difference between the recoverable amount and the carrying amount of the associate or joint venture, and the amount of such impairment is recognized in “Share of profits from associates- equity method” in the Consolidated Income Statement. When the significant influence of the Group in the associate or joint venture ceases, the Group recognises the investment at its fair value. Any difference between the carrying amount of the associate or joint venture at the moment of loss of significant influence and the fair value of the investment plus the income for sale, is recognized in the Consolidated Income Statement. 6.5 Other intangible assets Other intangible assets acquired by the Group are measured at cost less accumulated amortization and any accumulated impairment losses. An intangible asset is recognized only if it is probable that it will generate future benefits for the Group and that its cost can be reliably measured. Research and development costs Research costs are expensed as incurred. Development expenditure is capitalized when the Group can demonstrate:
� The technical feasibility of completing the intangible asset so that it will be available for use or sale;
� Its intention to complete and its ability to use or sell the resulting asset; � Its ability to use or sell the intangible asset; � The economic and commercial profitability of the project is reasonably ensured; � The availability of adequate technical and financial resources to complete and to use or sell
the resulting asset; and � Its ability to measure reliably the expenditure during development.
Capitalized development costs are amortized over the period of expected future benefits, no more than 6 years. At December 31, 2017 and December 31, 2016, there are no intangible assets related to development costs capitalized more than one year prior and whose amortization was not started. Concessions, patents, licenses, trademarks, et al. These intangible assets are initially measured at acquisition cost. They are assessed as having a finite useful life and are accordingly carried at cost net of accumulated amortization. Amortization is calculated using the straight-line method, based on the estimated useful life, in all instances less than 5 years; except the GESTAMP brand which is considered an asset of indefinite useful life. Software Software is measured at acquisition cost. Software acquired from third parties and capitalized is amortized over its useful life, which in no instance will exceed 5 years.
32
IT maintenance costs are expensed as incurred. 6.6 Financial assets Financial assets are initially measured at fair value plus any directly attributable transaction costs, except financial assets at fair value with changes through profit and loss where transaction costs are registered in the Consolidated Income Statement. The Group classifies its financial assets, current and non-current, into the following categories:
� Financial assets at fair value with changes through profit and loss (held for trading). � Held-to-maturity investments. � Loans and receivables. � Available-for-sale financial assets. � Investments in associates accounted for using the equity method.
Classification depends on the purpose for which the financial assets were acquired. Management determines the classification of its financial assets upon initial recognition and reassesses this designation at each year end. Financial assets at fair value with changes through profit and loss These are financial assets held for trading. Financial assets are classified as held for trading if they are acquired for the purpose of selling in the near term. This category includes derivative financial instruments, except those designated as hedging instruments in an effective hedge. They are classified as non-current assets, except for those maturing in less than 12 months, and they are carried on the balance sheet at fair value. Changes in value of these assets are recognized in the Consolidated Income Statement as Financial income or expenses. Fair value is the market price at the Consolidated Balance Sheet date. Held-to-maturity investments Financial assets with fixed or determinable payments and fixed maturities are classified as held-to-maturity when the Group has the positive intention and ability to hold them to maturity. They are classified as non-current, except for those maturing in less than 12 months from the balance sheet date. They are carried at amortized cost using the effective interest method, less any impairment charges. Loans and receivables Loans and receivables are financial assets with fixed or determinable payments that are not quoted in an active market. They are classified as current, except for those maturing in more than 12 months from the balance sheet date. They are carried at amortized cost using the effective interest method, less any impairment charges.
33
Available-for-sale financial assets These are financial assets that are designated as available-for-sale or are not classified in any of the three preceding categories. They are classified as non-current unless management plans to dispose of them within 12 months from the Consolidated Balance Sheet date. They are measured at fair value at the Consolidated Balance Sheet date. Unrealized gains or losses are recognized in Retained earnings until the investment is retired or impaired, at which time the cumulative gain or loss recorded in equity is recognized in the Consolidated Income Statement. Investments in associates accounted for using the equity method Investments in associates or joint ventures, companies in which the Group has significant influence, are accounted for using the equity method (Note 6.4). Derecognition of financial instruments The Group retires a transferred financial asset from the Consolidated Balance Sheet when it has transferred its rights to receive cash flows from the asset or, retaining these rights, when the Group has assumed a contractual obligation to pay the cash flows to a third party, and the Group has transferred substantially all the risks and rewards of ownership of the asset. If the entity has retained substantially all the risks and rewards of ownership of the transferred asset, the entity does not retire the transferred asset from its balance sheet and recognizes a financial liability for the consideration received. This financial liability is subsequently measured at amortized cost. The transferred financial asset continues to be measured using the same criteria as prior to the transfer. In subsequent periods, the Group recognizes any income on the transferred asset and any expense incurred on the financial liability in the Consolidated Income Statement. Such income and expense are not offset. 6.7 Impairment of assets Impairment of non-financial assets The Group assesses at each reporting date whether there is any indication that an asset may be impaired. If any indication exists, or when annual impairment testing for an asset is required, the Group estimates the asset’s recoverable amount as either the group of assets’ or cash-generating unit’s fair value less costs to sell, or its value in use, whichever is higher. A relevant decrease in EBITDA compared to the previous year or a relevant decrease of EBITDA in the following years forecast or any other qualitative factor that may affect the Cash-Generating Unit are considered indications of impairment. In the case of capitalized Research and Development Expenses, not obtaining the expected return is considered an indication of impairment. A cash-generating unit (CGU) is the smallest identifiable group of assets that generates cash flows that are largely independent of the cash inflows from other assets. The smallest identifiable group of assets designated are the operating plants or the individual companies. When the carrying amount of a group of assets or CGU exceeds its recoverable amount, an impairment loss is recognized and its carrying amount is decreased to its recoverable amount.
34
Impairment losses with respect to CGUs are allocated first to reduce the carrying amount of any goodwill allocated to the cash-generating units and, then, to proportionally reduce the carrying amount of the assets of the CGU unless, based on a review of the individual assets, it is considered that their fair value less costs to sell is higher than their carrying amount. When assessing value in use, estimated future cash-flows are discounted at present value by using a pre-tax discount rate that reflects current market valuations of money and risks of the asset. For calculating the fair value of the asset less costs to sell, recent transactions are considered and if they cannot be identified, a proper valuation method is used. These calculations are based on several considerations, market prices and other available indicators of the fair value. The calculation of impairment is based on detailed budgets and previsions individually prepared for each CGU to which the asset is allocated. Those budgets and previsions refer to a five-year period and for longer periods a long-term growth rate is calculated and used for estimating cash-flows after the fifth year. The impairment losses from continued operations, including impairment of inventories, are registered in the Consolidated Income Statement in the expenses related to the function of the impaired asset. For all assets except goodwill, an assessment is made every year to see if there is evidence that the impairment registered in previous years has been reduced or has disappeared. In such case, the Group estimates the recoverable value of the asset or the CGU. A previously recognized impairment loss is reversed, with the reversal recognized in the Consolidated Income Statement, if there has been a change in the assumptions used to determine the asset’s recoverable amount. The restated recoverable amount of the asset cannot exceed the carrying amount that would have been determined had no impairment loss been recognized. The following assets present specific characteristics when assessing their impairment: Consolidation goodwill Impairment test of goodwill is carried out on year end basis, and when there is also evidence that goodwill may be impaired. The impairment test for the goodwill assesses the recoverable value of each CGU allocated to it. If the recoverable value of the CGU is lower than its carrying amount, an impairment loss is registered. Goodwill impairment losses cannot be reversed in future periods. Intangible assets The Group has implemented annual procedures to test intangible assets with indefinite useful life for impairment. These assessments are carried out for each of the CGUs or groups of CGUs, as well as when there is evidence that intangible assets may be impaired. Impairment of financial assets The reduction in the fair value of available-for-sale financial assets that has been recognized directly in equity when there is objective evidence of impairment must be recognized in the Consolidated

35
Income Statement for the year. The cumulative loss recognized in the Consolidated Income Statement is measured as the difference between the acquisition cost and current fair value. Once an equity investment classified as available-for-sale has been impaired, any increase in value is registered in “Other comprehensive income” with no effect on the profit or loss for the year. In the case of debt instruments classified as available-for-sale assets, if the fair value of an impaired debt instrument subsequently increases and the increase can be objectively related to an event occurring after the impairment loss was recognized in the Consolidated Income Statement, the impairment loss would be reversed through the Consolidated Income Statement. The recoverable amount of held-to-maturity investments and loans and receivables carried at amortized cost is calculated as the present value of the expected future cash flows discounted at the original effective interest rate. The carrying amount of the asset is reduced through use of an allowance account and the amount of the loss is recognized in the Consolidated Income Statement. Current investments are not discounted to present value. Impairment losses on loans and receivables carried at amortized cost are reversed if the subsequent increase in the recoverable amount can be objectively related to an event occurring after the impairment loss was recognized. 6.8 Assets and liabilities held for sale and discontinued operations Assets and liabilities included in a disposal group whose recovery is expected through sale and not through continued use are included in this category. These assets are valued at lower cost between carrying amount and fair value less costs for sale. Discontinued operations are reflected in the Consolidated Income Statement separately from the revenue and expenses from continued operations. They are reflected in a line as profit after taxes from discontinued operations. At December 31, 2017 and December 31, 2016 there are no assets nor liabilities in this category and no profit from discontinued operations. 6.9 Trade and other receivables Accounts receivable from customers are measured in the accompanying Consolidated Balance Sheet at nominal value. Discounted bills pending maturity at year end are included in the accompanying Consolidated balance sheet under “Trade receivables,” with a balancing entry in “Interest-bearing loans and borrowings”. The balances transferred to banks as Non-Recourse Factoring are not included in “Trade receivables” since all risks related to them, including bad and past-due debt risks, have been transferred to the bank (Note 14.a). The Group recognizes impairment allowances on balances past-due over certain periods, or when other circumstances warrant their classification as impaired. 6.10 Inventories Inventories are valued at the lower of acquisition or production cost and net realizable value.
36
Cost includes all expenses derived from the acquisition and transformation of inventories, including any other expenses incurred to bring them to their present condition and location. Inventories have been valued using the average weighted cost method. When inventories are deemed impaired, their initially recognized value is written down to net realizable value (selling price less estimated costs of completion and sale). 6.11 Tools made to customer order A construction contract is a contract specifically negotiated with a customer for the construction of an asset or a combination of assets that are closely interrelated or interdependent in terms of their design, technology and function or their ultimate purpose or use. When the outcome of a construction contract can be estimated reliably, contract revenue and contract costs associated with the construction contract are recognized by reference to the stage of completion of the contract activity at the Consolidated Balance Sheet date (Note 6.18). When the outcome of a construction contract cannot be estimated reliably, revenue is recognized to the extent that contract costs incurred are expected to be recoverable. Based on its experience and Group estimates, with rare exceptions, management does not expect to incur losses, which have not been recognized in these Consolidated Financial Statements, on the definitive settlement of the tool manufacture contracts in progress at December 31, 2017. In the exceptional cases where there are contract costs that may not be recovered, no revenue is recognized and all amounts of such costs are recognized in the Consolidated Income Statement as an expense immediately. Customer advances received reflect billing milestones and not necessarily the stage of completion of the contract. Tools-in-progress measured using the stage of completion method are recognized under “Trade receivables” net of customer advances with a balancing entry to “Revenue from tool sales”. 6.12 Cash and cash equivalents Cash and cash equivalents comprise cash on hand and demand deposits, together with short-term, highly liquid investments that are subject to an insignificant risk of changes in value. An investment is considered a cash equivalent when it has a maturity of three months or less from the date of acquisition or establishment. 6.13 Government grants Government grants are recognized at fair value where there is reasonable assurance that the grant will be received and all attached conditions will be complied with. When the grant relates to an asset, it is recognized as “Deferred Income” in the Consolidated Balance Sheet and released to income over the expected useful life of the related asset. When the grant relates to expenditure items, it is recognized directly in the Consolidated Income Statement as income.
37
6.14 Financial liabilities (trade and other payables and borrowings) Financial liabilities are initially recognized at fair value less attributable to transaction costs except financial liabilities at fair value through profit and loss. After initial recognition, interest-bearing loans and borrowings are subsequently measured at amortized cost, measured as the difference between their cost and redemption value, using the effective interest rate method. Liabilities maturing in less than 12 months from the Consolidated Balance Sheet date are classified as current, while those with longer maturity periods are classified as non-current. A financial liability is retired when the obligation under the liability is discharged, cancelled or expires. When non-controlling interests have an option to sell their shares or investments to the Group, it is assessed whether there is present access to the ownership of the shares by the Group due to the conditions inherent to the option. The Group has no non-controlling interests with option to sell their shares where the Group has present access to the ownership of the shares. When the conditions of the sale option of the non-controlling interest do not give the Group present access to economic profit from the shares or investments, a partial recognition of non-controlling interest is registered. At first stage a financial liability is registered and reclassified to non-controlling interest. Any excess in the fair value of the liability related to the option with respect to the percentage corresponding to non-controlling interest is directly registered in equity attributable to the Parent Company. No amount is registered in the Consolidated Income Statement related to the subsequent accounting of the financial liability. Until the option is exercised, the same accounting will be carried out at each closing and the financial liability will be cancelled against the amount paid to non-controlling interest. If the option was not exercised, the financial liability would be cancelled against non-controlling interest and the corresponding equity attributable to the Parent Company in the same way as initially registered (Note 22.d). 6.15 Provisions and contingent liabilities Provisions are recognized when the Group has a present obligation (legal or implicit) as a result of past events, and it is probable that an outflow of resources will be required to settle the obligation, and when a reliable estimate can be made of the amount of the obligation. Provisions are reviewed at each Consolidated Balance Sheet date and adjusted to reflect the current best estimate of the liability. Headcount restructuring provisions are stated at the amount of expenses expected to arise from the restructuring and any other expenses not associated with the entity’s day-to-day business. Headcount restructuring provisions are only recognized when there is a formal plan identifying the affected business, the main locations affected, and the employees to receive redundancy payments, the outlays to be incurred, when it will be implemented, and when the entity has raised a valid expectation that it will carry out the restructuring and those affected have been informed. The provisions are determined by discounting expected future cash outlays using the pre-tax market rate and, where appropriate, the risks specific to the liability. This method is only applied if the effects are significant. When discounting is used, the increase in the provision due to the passage of time is recognized as a financial expense.
38
Contingent liabilities are potential obligations that arise from past events whose existence will be confirmed only by the occurrence or non-occurrence of one or more uncertain future events not within the control of the Group, as well as present obligations arising from past events, the amount of which cannot be reliably estimated or whose settlement may not require an outflow of resources. These contingent liabilities are only subject to disclosure and are not accounted for. 6.16 Employee benefits The Group has assumed pension commitments for some companies located in Germany and France. The group classifies its pension commitments depending on their nature in defined contribution plans and defined benefit plans. Defined contribution plans are post-employment benefit plans under which the company pays fixed contributions into a separate entity (insurance company or pension plan), and will have no legal or constructive obligation to pay further contributions if the separate company does not carry out its assumed commitments. Defined benefit plans are post-employments benefit plans other than defined contribution plans. Defined contribution plans The Group carries out predetermined contributions into a separate entity (insurance company or pension plan), and will have no legal or implicit obligation to pay further contributions if the separate company does not have enough assets to attend employee benefits related to their services rendered in current and previous years. The contributions made to defined contribution plans are recognized in profit and loss according to the accrual principle. The amount registered in the Consolidated Income Statement at December 31, 2017 was 5.5 million euros (December 31, 2016: 6.1 million euros) (Note 26.b). Defined benefit plans For defined benefit plans, the cost of providing these benefits is determined separately for each plan using the projected unit credit method. The actuarial gains and losses are recognized in OCI (Other Comprehensive Income) when incurred. In subsequent years, these actuarial gains and losses are registered as equity, and are not reclassified to profit and loss. The amounts to be recognized in profit and loss are:
� Current service cost. � Any past service cost and gains or losses upon payment. � Net interest on the net defined benefit liability (asset), which is determined by applying the
discount rate to the net defined benefit liability (asset). The past service costs will be recognized as expenses at the earlier of the following dates (i) in the period when the plan is amended or curtailment occurs (ii) when the Group recognizes related restructuring costs or benefits of termination. The net defined benefit liability (asset) is the deficit or surplus, detailed below, adjusted for any effect of limiting a net defined benefit asset to the asset ceiling. The asset ceiling is the present
39
value of any economic benefits available in the form of refunds from the plan or reductions in future contributions to the plan. The rate used to discount post-employment benefit obligations shall be determined by reference to market yields at the end of the reporting period on high quality corporate bonds. The deficit or surplus is:
� The present value of the defined benefit obligation. � Less the fair value of plan assets with which obligations are directly cancelled.
Plan assets comprise assets held by a long-term employee benefit fund, and qualifying insurance policies. These assets are not available to the reporting entity´s own creditors and cannot be returned to the reporting entity. Fair value is based on market price and in case of stock market values, it corresponds to published prices. Indemnities Indemnities to pay to employees dismissed through no fault of their own are calculated based on years of service. Any expenses incurred for indemnities are charged to the Consolidated Income Statement as soon as they are known. 6.17 Leases Leases in which all the risks and benefits associated with ownership of the asset are substantially transferred are classified as finance leases. Assets acquired under financial lease arrangements are recognized, based on their nature, at the lower of the fair value of the leased item and the present value of the minimum lease payments at the outset of the lease term. A financial liability is recognized for the same amount. Lease payments are apportioned between finance charges and reduction of the lease liability. Leased assets are depreciated, impaired, and retired using the same criteria applied to assets of a similar nature. Leases where the lessor substantially retains all the risks and benefits of ownership of the asset are classified as operating leases. Operating lease payments are recognized as an expense in the Consolidated Income Statement on a straight-line basis over the lease term. 6.18 Revenue and expense recognition Revenue and expenses are recognized when products are delivered or services are provided, regardless of when actual payment or collection occurs. Revenue is recognized at fair value of the balancing entry, defining fair value as the price that would be received to sell an asset or paid to transfer a liability in an orderly transaction between market participants at the measurement date. For those contracts according to stage of completion and when profit cannot be reliably estimated, revenue is recognized only to the extent where costs are recoverable and costs are recognized as expenses of the year when occurred.
40
Revenue includes: � Sale of goods: Revenue from the sale of goods is recognized when the following conditions
have been met: o The Group has transferred to the buyer the significant risks and rewards of ownership of
the goods; o The Group retains neither continuing managerial involvement to the degree usually
associated with ownership nor effective control over the goods sold; o The amount of revenue can be measured reliably; o It is probable that the economic benefits associated with the transaction will flow to the
Group. o The costs incurred or to be incurred in respect of the transaction can be reliably measured.
� Manufacture of tools and machinery for third party sale and rendering of services: the Group uses the stage of completion method for sales of tools and machinery because buyer can specify the most important structural elements in the design of tools before construction starts, as well as the most relevant structural changes (Note 6.11).
� Interest, royalties, and dividends: interest revenue is recognized as interest accrues taking into account the effective return of the asset (using the effective interest method, i.e., the rate that makes discounted future cash receipts through the expected life of the financial instrument equal to the initial carrying amount of the asset). Royalties are recognized on an accrual basis in accordance with the substance of the relevant agreement. Dividends are recognized when the shareholder’s right to receive payment is established.
Expenses are recognized when there is a decrease in the value of an asset or an increase in the value of a liability that can be measured reliably, and they are recognized during the period in which they are incurred. 6.19 Income tax The income tax recognized in the Consolidated Income Statement includes current and deferred income tax. Income tax expense is recognized in the Consolidated Income Statement except for current income tax relating to line items in equity, which is recognized in equity and not in the income statement. Current tax Current tax expense is the amount of income taxes payable in respect of the taxable profit for the year and is calculated based on net profit for the year before deducting tax expense (accounting profit), increased or decreased, as appropriate, by permanent and temporary differences between accounting and taxable profit as provided for in prevailing tax legislation. Tax credits The carry forward of unused tax credits and tax losses is recognized as a reduction in tax expense in the year in which they are applied or offset, unless there is reasonable doubt as to their realization, in which case they are not capitalized and are considered as a decrease in income tax expense in the year in which they are applied or offset.

41
Temporary differences Deferred tax liabilities: a deferred tax liability is recognized for all taxable temporary differences, except to the extent that the deferred tax liability arises from the initial recognition of goodwill or the initial recognition of an asset or liability in a transaction which is not a business combination and which, at the time of the transaction, affects neither the accounting nor the fiscal result. Deferred tax assets: a deferred tax asset is recognized for all deductible temporary differences to the extent that it is probable that taxable profit will be available against which the deductible temporary difference can be utilized, unless the deferred tax asset arises from the initial recognition of an asset or liability in a transaction that is not a business combination and which, at the time of the transaction, affects neither the accounting nor the fiscal result. 6.20 Derivative financial instruments and hedges The Parent Company has arranged cash flow (interest rate) hedges through entities that operate on organized markets. These instruments are used to hedge exposure to fluctuations in floating interest rates on a portion of the bank loans granted to the Parent Company and on a portion of expected future borrowings. These financial derivatives hedging cash flow are initially recognized in the Consolidated Balance Sheet at acquisition cost and, subsequently, they are marked to market. Any gains or losses arising from changes in the market value of derivatives in respect of the ineffective portion of an effective hedge are taken directly to the Consolidated Income Statement, while gains or losses on the effective portion are recognized in “Effective hedges” within “Retained earnings” with respect to cash flow hedges. The cumulative gain or loss recognized in equity is taken to the Consolidated Income Statement when the hedged item affects profit or loss or in the year of disposal of the item. Derivatives are recognized as assets when the fair value is positive and as liabilities when the fair value is negative. In addition, the Group had a debt instrument (US dollar bonds) until June 17, 2016 to cover the exposure to exchange rate risk of the investments in subsidiaries whose functional currency is US dollar (Note 22.b.2). Hedges of net investments in a foreign operation, including a hedge of a monetary item that is accounted for as part of the net investment, shall be accounted for similarly to cash flow hedges. The ineffective portion of the bonds’ exchange differences are recognized in the Consolidated Income Statement and the effective portion in Translation differences (Consolidated Equity). After cancellation of the debt instrument issued and considered hedge of net investment, the balance considered translation differences will stay in this heading until derecognition of the investment of the foreign operation. At the moment, the accumulated loss or gain in this heading is transferred to the Consolidated Income Statement.

42
6.21 Related parties The Group considers as Related Parties: direct and indirect shareholders, companies over which they have significant influence or joint control, companies accounted for under the equity method and their officers. Companies not belonging to the Group but belonging to the major shareholder of the Parent Company, with control or significant influence, are also considered related parties. 6.22 Environmental expenses Expenses relating to decontamination and restoration work in polluted areas, as well as the elimination of waste and other expenses incurred to comply with the environmental protection legislation, are registered in the year they are incurred, unless they correspond to the acquisition cost of assets to be used over an extended period. In this case, they are recognized in the corresponding heading under “Property, plant and equipment” and are depreciated using the same criteria described in Note 6.2. Estimable amounts of contingent liabilities for environmental issues, if any, would be provisioned as a liability in the Consolidated Balance Sheet. 7. Significant accounting judgments, estimates and assumptions The preparation of the accompanying Consolidated Financial Statements under IFRS requires management to make judgments, estimates and assumptions that affect the Consolidated Balance Sheet and the Consolidated Income Statement. The estimates that have a significant impact are as follows: Impairment of non-financial assets There is impairment when the carrying amount of an asset or a cash-generating unit (CGU) is higher than its recoverable value, which is the higher of its recoverable value less costs of sale and its value in use. For CGUs with a goodwill or an asset with indefinite useful life assigned, an impairment test is carried out every year by calculating the recoverable value through the value in use. The calculation is based on the discounting of cash flows. Cash flows are obtained from the most conservative budget for the next five years and they do not include uncommitted restructuring activities or the significant future investments which will increase the output of the asset related to the cash-generating unit under analysis. The recoverable amount is very sensitive to the discount rate used for discounting cash flows, to the expected future inflows and to the growth rate used for extrapolating them. The key assumptions used for calculating the recoverable amount of the cash-generating units as well as the sensitivity analysis are further detailed in Note 6.7 and Note 10. For calculating the value at perpetuity for the method of discounting cash-flows, a normalized year with all reasonable and recurrent in the future hypotheses is used.

43
For the remaining CGUs with no goodwill assigned but including significant non-current assets, an impairment test is carried out only when there is evidence of impairment according to indicators detailed in Note 6.7. Revenue recognition and the stage of completion The Group estimates the stage of completion of certain services to customers such as die design and tooling. The stage of completion is determined by the incurred costs with respect to the total expected costs, including certain assumptions regarding the total costs according to historic experience. Pension benefits The cost of the defined benefit plans and other post-employment benefits and the present value of the pension obligations are determined according to actuarial valuations. The actuarial valuations imply assumptions that may differ from the real future events. They include the discount rate, future salary increases, mortality rates and future pension increases. Since the valuation is complex and for the long-term, the calculation of the obligation for defined benefit plans is very sensitive to changes in those assumptions. All assumptions are revised at every closing date. The most changing parameter is the discount rate. To calculate the proper discount rate the Management uses the interest rate of 10-year bonds and extrapolates them over the underlying curve corresponding to the expected maturity of the obligation for defined benefit plans. In addition, the quality of the underlying bonds is reviewed. Those bonds with excessive credit spreads are excluded from the analysis as they are not considered to be of a high credit rating. Mortality rate is based in public mortality tables from the specific country. These tables use to change only in intervals according to demographic changes. Future salary increases and future pension increases are based on future expected inflation rates for each country. Further details on assumptions considered and a sensitivity analysis are included in Note 21. Taxes Deferred tax assets are recognized for negative tax bases and other unused tax incentives to the extent that it is probable that taxable profit will be available against which they can be utilized. The deferred tax asset to be registered depends on important judgments by Management according to a reasonable period and the future tax profits. The Group does not register deferred tax assets in the following cases: negative tax bases to be offset from subsidiaries with loss history, which cannot be used to offset future tax profits from other group companies and when there are no taxable temporary differences. Notes 23 and 28 include more detailed information about taxes and tax receivables not recognized for accounting purposes. Revision of useful lives Useful life of tangible fixed assets is determined according to the expected use of the asset as well as the past experience of use and duration of similar assets. In the 2016 review, the Group analyzed the current use of certain property, plant and equipment. This review was based on the analysis of an independent third party. The total cost of items whose useful life was reviewed was 2,205 million euros.

44
If this revision had not been carried out, the impact in the Consolidated Income Statement in 2016 would have been higher depreciation expenses in the amount of 12.5 million euros. Useful life of intangible assets without finite useful life (including capitalized development expenses) is calculated according to internal analysis where useful life is no longer than 6 years and recovery is linear according to the pattern of consumption representing the production of operating plants. Fair value of financial instruments When fair value of financial assets and liabilities cannot be obtained from quoted prices in active markets it is calculated by valuation techniques which include the model of discounting cash flows. The required data are obtained from observable markets when possible and when not, some value judgments are made in order to establish reasonable values. Judgments refer to liquidity risk, credit risk and volatility. Changes in assumptions related to these factors may affect the reasonable value of financial instruments reported (Note 12 and Note 22.b.1). Assessment of gain of control in subsidiaries According to IFRS 10, currently in force, the Group Management assess the existence of control of significant companies with 50% shareholding, like Beyçelik Gestamp Kalip, A.S. and Gestamp Automotive India Private Ltd. Regarding Beyçelik Gestamp Kalip, A.S., non-controlling interests are third parties external to Gestamp Automoción Group and over whom the shareholders of the Parent Company have no control. Regarding Gestamp Automotive India Private Ltd. non-controlling interests corresponding to the remaining 50% shareholding are Group related parties since it is to a company controlled by shareholders of the Parent Company. Although board members are elected according to shareholding percentage, it is considered there is control over this company according to the following circumstances related to the most important activities:
1. Car manufacturers require from their suppliers the capability to reach and maintain quality standards across a wide geographic presence in order to negotiate global supply.
2. Accordingly, the most important activities for a supplier in this sector are as follows: a. Continuous investment in technological research and development to satisfy
customer requirements. b. Global negotiation for approval and homologation of every component comprising
a product, as well as management of prices. c. All activities aimed to achieve excellent quality of components.
All these activities are carried out by the Group given that the other shareholder does not possess those capacities.
3. In this sense, the subsidiary technologically depends on the Group. Research and Development activities are fully carried out by the Group and the technology is provided to the subsidiary according to the agreement signed with the shareholders. Accordingly, Beyçelik Gestamp Kalip A.S. has right to use but no intellectual property. The technology of hot stamping currently used by the subsidiary is exclusive property of the Group.
45
4. In order to prove this excellence, an OEM supplier needs to be accredited as a Tier 1 supplier (high quality supplier) by the car manufacturer. The subsidiary could not obtain this certification if they did not belong to the Group.
Regarding Gestamp Automotive India Private Ltd, the Group has designated 4 board members of this company out of a total of 6 members, so the Group is capable of carrying out the relevant activities. 8. Changes in significant accounting policies and estimates and restatement of errors Changes in accounting estimates: The effect of a change in an accounting estimate is recognized in the same Consolidated Income Statement heading in which the associated income or expense was recognized under the former estimate. Changes in significant accounting policies and restatement of errors: Changes in accounting policies and restatement of errors are recognized to the extent they are significant: the cumulative effect of the change at the beginning of the period is recognized by restating “Retained earnings” while the period-specific effect of the change is recognized in the Consolidated Income Statement for the year. In these instances, the prior year’s balances are also restated to maintain comparability of information. 9. Segment reporting According to IFRS 8 “Operating segments”, segment information below is based on internal reports regularly reviewed by the board of directors of the Group in order to allocate resources to each segment and assess their performance. Operating segments identified by the board of directors of the Group are based on a geographical approach. The segments and countries included are as follows:
� Western Europe o Spain o Germany o United Kingdom o France o Portugal o Sweden o Luxembourg
� Eastern Europe
o Russia o Poland o Hungary o Czech Republic o Slovakia o Turkey o Romania
46
� Mercosur
o Brazil o Argentina
� North America
o USA o Mexico
� Asia
o China o South Korea o India o Thailand o Japan o Taiwan
Each segment includes the activity of Group companies located in countries belonging to the segment. The Board of Directors of the Group managed the operating segments corresponding to continuing activities basically according to the evolution of the main financial indicators from each segment such as revenue, EBITDA, EBIT and fixture investments. Financial income and expenses, as well as income tax, and the allocation of profit to non-controlling interests are analyzed together at Group level since they are centrally managed. Inside certain segments there are some countries meeting the definition of a significant segment; however, they are presented in the aggregate since the products and services generating ordinary income as well as productive processes are similar and additionally they show similar long-term financial performance and they belong to the same economic environment. Segment information for 2017 and 2016 is as follows:

47
Recurrent operating activities between subsidiaries of different segments are not significant. The heading “EBITDA” from each segment includes the costs of Group corporate services according to:
a) The criteria for distribution of management costs as per global agreements signed by Group companies.
b) The agreements for rendering specific services signed by certain Group companies.
WESTERN
EUROPE
EASTERN
EUROPEMERCOSUR NORTH AMERICA ASIA TOTAL
NON-CURRENT ASSETS
Goodwill 73,291 19,582 8,982 2,890 12 104,757
Other intangible assets 236,941 10,987 4,729 23,514 33,769 309,940
Property, plant and equipment 1,274,953 516,425 246,180 851,777 518,444 3,407,779
Non-current financial investments 41,766 30 2,737 8,512 16,382 69,427
Deferred tax assets 152,092 22,573 28,058 53,570 9,506 265,799
Total non-current assets 1,779,043 569,597 290,686 940,263 578,113 4,157,702
WORKING CAPITAL
Inventories 254,841 78,917 59,285 168,605 119,674 681,322
Trade and other receivables 692,296 189,535 53,930 140,831 299,117 1,375,709
Other current assets 5,940 11,520 10,036 37,656 5,905 71,057
Trade and other payables (1,030,507) (195,960) (72,260) (231,014) (284,332) (1,814,073)
Provisions (5,050) (3,616) (1,107) (237) (1,713) (11,723)
Other current liabilities (1,377) (1,190) - (423) (4) (2,994)
Other current debt (59,109) (4,250) (12,014) (24,660) (29,920) (129,953)
Total working capital (142,966) 74,956 37,870 90,758 108,727 169,345
WESTERN
EUROPE
EASTERN
EUROPEMERCOSUR NORTH AMERICA ASIA TOTAL
Revenue 4,011,171 1,043,441 562,316 1,482,798 1,101,845 8,201,571
EBITDA 423,876 122,842 59,530 123,208 160,420 889,876
Thousands of euros
ITEM
2017
Thousands of euros
2017
ITEM
WESTERN
EUROPE
EASTERN
EUROPEMERCOSUR NORTH AMERICA ASIA TOTAL
NON-CURRENT ASSETS
Goodwill 74,345 22,835 10,422 2,890 12 110,504
Other intangible assets 211,566 9,084 5,266 23,408 33,136 282,460
Property, plan and equipment 1,206,745 450,511 272,388 729,639 500,731 3,160,014
Non-current financial investments 46,747 36 10,980 9,667 28,084 95,514
Deferred tax assets 164,584 18,792 28,983 48,824 12,256 273,439
Total non-current assets 1,703,987 501,258 328,039 814,428 574,219 - 3,921,931
WORKING CAPITAL
Inventories 243,881 83,395 63,870 126,637 113,114 630,897
Trade and other receivables 631,866 169,093 54,882 230,882 290,166 1,376,889
Other current assets 3,362 5,740 3,487 12,897 754 26,240
Trade and other payables (856,615) (180,663) (64,640) (254,684) (264,823) (1,621,425)
Provisions (9,380) (3,300) (1,560) (129) (3,703) (18,072)
Other current liabilities 682 (600) - (3,580) (12) (3,510)
Other current debt (152,340) (10,409) (16,537) (84,416) (27,118) (290,820)
Total working capital (138,544) 63,256 39,502 27,607 108,378 100,199
WESTERN
EUROPE
EASTERN
EUROPEMERCOSUR NORTH AMERICA ASIA TOTAL
Revenue 3,704,113 859,490 401,365 1,546,104 1,037,866 7,548,938
EBITDA 378,044 95,614 23,198 167,183 177,111 841,150
Thousands of euros
2016
ITEM
Thousands of euros
2016
ITEM

48
The additions of Other intangible assets (Note 10.b) by segments are as follows:
The additions of Property, plant and equipment (Note 11) by segments are as follows:
In 2017, the three customers representing the highest contribution to sales represent the 48.1% of revenue (2016: 44.5%) and each of them represents more than 10% of revenue for the same period (2016: 10%). 10. Intangible assets
a) Goodwill The change in goodwill in 2017 and 2016 is as follows:
Segment 2017 2016
Western Europe 66,670 60,870
Eastern Europe 3,830 4,053
Mercosur 2,227 1,828
North America 8,704 7,818
Asia 14,271 9,012
Total 95,702 83,581
Thousands of euros
Segment 2017 2016
Western Europe 195,741 188,840
Eastern Europe 105,819 94,571
Mercosur 25,386 54,969
North America 264,212 227,493
Asia 109,149 75,312
Total 700,307 641,185
Thousands of euros
At December 31, Currency translation At December 31,
Segment / CGU 2016 Additions differences 2017
Western Europe
Gestamp HardTech AB 39,951 - (1,053) 38,898
Gestamp Metalbages S.A. 15,622 - - 15,622
Gestamp Aveiro, S.A. 7,395 - - 7,395
Gestamp Levante, S.A. 6,944 - - 6,944
Griwe Subgroup 6,466 - - 6,466
Adral, matricería y puesta a punto S.L. 857 - - 857
Eastern Europe
Beyçelik Gestamp Kalip, A.S. 19,356 - (3,582) 15,774
Gestamp Severstal Vsevolozhsk, Llc 117 - (8) 109
Çelik Form Gestamp Otomotive, A.S. 3,362 - (622) 2,740
MPO Providers Rez. S.R.L. - 981 (22) 959
Mercosur
Gestamp Brasil Industria de Autopeças, S.A. 10,422 - (1,440) 8,982
Asia
Gestamp Services India Private, Ltd. 12 - (1) 11
Total 110,504 981 (6,728) 104,757
Thousands of euros

49
Additions in 2017 correspond to the acquisition of MPO Providers Rezistent S.R.L., which has been included in the consolidation scope by full consolidation method, because of the acquisition of control of this business combination (Note 3).
Additions in 2016 correspond to the acquisition of Çelik Form Gestamp Otomotive, A.S. that has been included in the consolidation scope by full consolidation method (Note 3). Currency translation differences in 2017 and 2016 correspond to the adjustments to the goodwill of companies whose functional currency is different from the Euro, translated at the exchange rate prevailing at Consolidated Balance Sheet date, according to IAS 21 (Note 6.3). Impairment test of Goodwill The Group has implemented annual procedures to test goodwill for impairment. This assessment is carried out for each of the CGUs or groups of CGUs to which goodwill has been allocated. A CGU is the smallest identifiable group of assets that generates cash flows that are largely independent of the cash inflows from other assets or group of assets. The CGU recoverable value at December 31, 2017 and 2016 has been determined by choosing the higher value between the fair value less necessary costs to sale the CGU or the calculation of value in use, using cash flow projections covering a five-year period and based on the future business evolution. The cash flows beyond the five-year period have been extrapolated using a growth rate of 1% for 2017 and 2016. These hypotheses can be considered cautious compared with the rest of the long-term average growth rates of the automotive sector. The pre-tax discount rate for cash flow projections for the CGUs is calculated in base on the Weighted Average Cost of Capital (WACC) and it is based on the weighted average cost of equity and cost of debt according to the financial structure set for the Group. The pre-tax discount rates for the CGUs with the most significant goodwill in 2017 and 2016 are as follows:
At December 31, Currency translation At December 31,
Segment / CGU 2015 Additions differences 2016
Western Europe
Gestamp HardTech AB 41,624 - (1,673) 39,951
Gestamp Metalbages S.A. 15,622 - - 15,622
Gestamp Aveiro, S.A. 7,395 - - 7,395
Gestamp Levante, S.A. 6,944 - - 6,944
Griwe Subgroup 6,466 - - 6,466
Adral, matricería y pta a punto S.L. 857 - - 857
Eastern Europe
Beyçelik Gestamp Kalip, A.S. 22,620 - (3,264) 19,356
Gestamp Severstal Vsevolozhsk, Llc 96 - 21 117
Çelik Form Gestamp Otomotive, A.S. - 3,907 (545) 3,362
Mercosur
Gestamp Brasil Industria de Autopeças, S.A. 8,309 - 2,113 10,422
Asia
Gestamp Services India Private, Ltd. 13 - (1) 12
Total 109,946 3,907 (3,349) 110,504
Thousands of euros
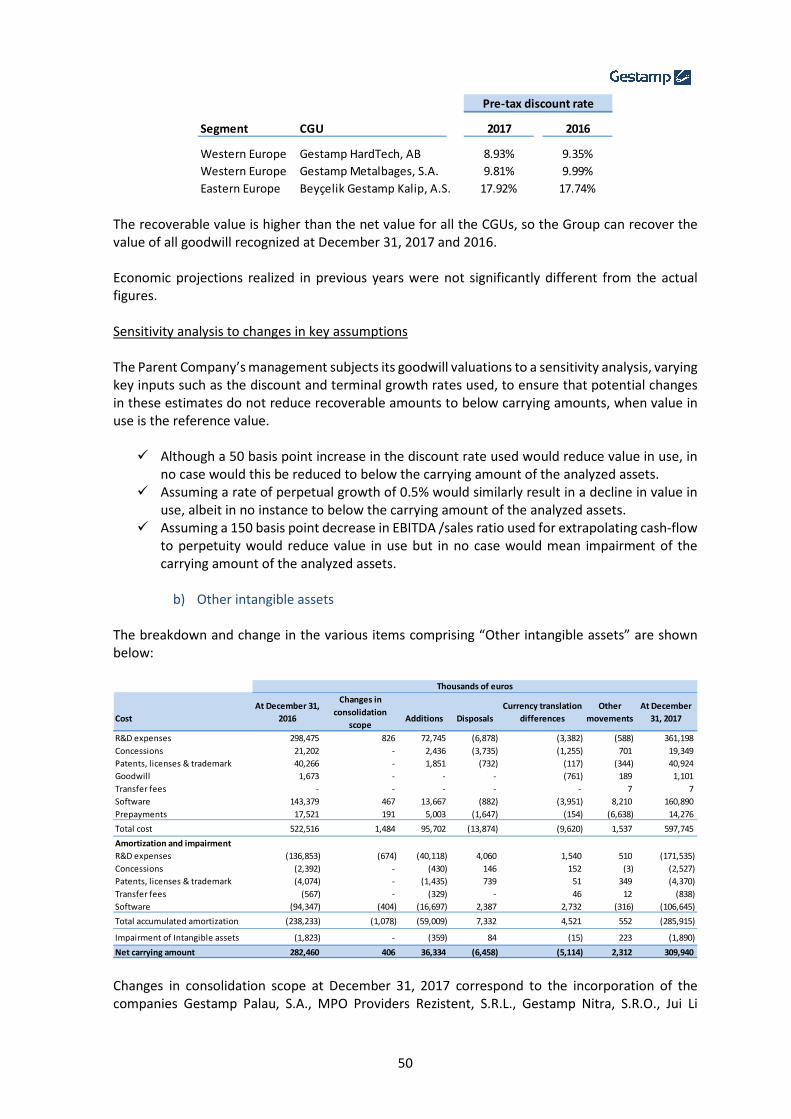
50
The recoverable value is higher than the net value for all the CGUs, so the Group can recover the value of all goodwill recognized at December 31, 2017 and 2016. Economic projections realized in previous years were not significantly different from the actual figures. Sensitivity analysis to changes in key assumptions The Parent Company’s management subjects its goodwill valuations to a sensitivity analysis, varying key inputs such as the discount and terminal growth rates used, to ensure that potential changes in these estimates do not reduce recoverable amounts to below carrying amounts, when value in use is the reference value.
� Although a 50 basis point increase in the discount rate used would reduce value in use, in no case would this be reduced to below the carrying amount of the analyzed assets.
� Assuming a rate of perpetual growth of 0.5% would similarly result in a decline in value in use, albeit in no instance to below the carrying amount of the analyzed assets.
� Assuming a 150 basis point decrease in EBITDA /sales ratio used for extrapolating cash-flow to perpetuity would reduce value in use but in no case would mean impairment of the carrying amount of the analyzed assets.
b) Other intangible assets
The breakdown and change in the various items comprising “Other intangible assets” are shown below:
Changes in consolidation scope at December 31, 2017 correspond to the incorporation of the companies Gestamp Palau, S.A., MPO Providers Rezistent, S.R.L., Gestamp Nitra, S.R.O., Jui Li
Segment CGU 2017 2016
Western Europe Gestamp HardTech, AB 8.93% 9.35%
Western Europe Gestamp Metalbages, S.A. 9.81% 9.99%
Eastern Europe Beyçelik Gestamp Kalip, A.S. 17.92% 17.74%
Pre-tax discount rate
Cost Additions Disposals
R&D expenses 298,475 826 72,745 (6,878) (3,382) (588) 361,198
Concessions 21,202 - 2,436 (3,735) (1,255) 701 19,349
Patents, licenses & trademark 40,266 - 1,851 (732) (117) (344) 40,924
Goodwill 1,673 - - - (761) 189 1,101
Transfer fees - - - - - 7 7
Software 143,379 467 13,667 (882) (3,951) 8,210 160,890
Prepayments 17,521 191 5,003 (1,647) (154) (6,638) 14,276
Total cost 522,516 1,484 95,702 (13,874) (9,620) 1,537 597,745
Amortization and impairment
R&D expenses (136,853) (674) (40,118) 4,060 1,540 510 (171,535)
Concessions (2,392) - (430) 146 152 (3) (2,527)
Patents, licenses & trademark (4,074) - (1,435) 739 51 349 (4,370)
Transfer fees (567) - (329) - 46 12 (838)
Software (94,347) (404) (16,697) 2,387 2,732 (316) (106,645)
Total accumulated amortization (238,233) (1,078) (59,009) 7,332 4,521 552 (285,915)
Impairment of Intangible assets (1,823) - (359) 84 (15) 223 (1,890)
Net carrying amount 282,460 406 36,334 (6,458) (5,114) 2,312 309,940
Thousands of euros
Changes in
consolidation
scope
Currency translation
differences
At December 31,
2016
Other
movements
At December
31, 2017

51
Edscha Body System Co., Ltd., Almussafes Mantenimiento de Troqueles, S.L. and Jui Li Edscha Hainan Industry Enterprise Co., Ltd. (Note 3). Additions to R&D expenses correspond mainly to development and design costs of portfolio projects, as well as the application of new technologies and the introduction of new materials related to the business. Additions to Software mainly correspond to software licenses renewal and to costs of SAP development and implementation. Additions to concessions are mainly related to land usage rights. Additions to Prepayments correspond to costs from SAP implementation. Additions to Patents, licenses & trademark mainly correspond to cost incurred due to industrial patents acquisition. The most significant additions by segment is shown in Note 9. Main disposals correspond to development projects whose feasibility is not reasonably assured, to software, and land usage rights disposals. The net balance of Other movements mainly reflects adjustments from previous years, as well as reclassifications between intangible assets and PP&E.
Changes in consolidation scope at December 31, 2016 corresponded to the incorporation of Çelik Form Gestamp Otomotiv, A.S. (Note 3). Additions to R&D expenses corresponded mainly to development and design costs of portfolio projects, as well as the application of new technologies and the introduction of new materials related to the business. Additions to Software mainly corresponded to software licenses renewal and to costs of SAP development and implementation.
Cost Additions Disposals
R&D expenses 240,898 - 58,887 (1,096) 5 (219) 298,475
Concessions 18,434 - 3,972 (707) (620) 123 21,202
Patents, licenses & trademark 39,102 - 1,491 (205) (115) (7) 40,266
Goodwill 1,900 - - - 89 (316) 1,673
Transfer fees 114 - - - 2 (116) -
Software 127,475 390 11,815 (1,699) 772 4,626 143,379
Prepayments 13,248 - 7,416 (217) (8) (2,918) 17,521
Total cost 441,171 390 83,581 (3,924) 125 1,173 522,516
Amortization and impairment
R&D expenses (103,622) - (33,920) 818 88 (217) (136,853)
Concessions (1,720) - (424) 47 57 (352) (2,392)
Patents, licenses & trademark (3,983) - (510) 15 44 360 (4,074)
Transfer fees (294) - (274) - (12) 13 (567)
Software (80,406) (333) (14,571) 1,670 (540) (167) (94,347)
Total accumulated amortization (190,025) (333) (49,699) 2,550 (363) (363) (238,233)
Impairment of Intangible assets (1,708) - (564) 2 (7) 454 (1,823)
Net carrying amount 249,438 57 33,318 (1,372) (245) 1,264 282,460
Changes in
consolidation
scope
Thousands of euros
Currency translation
differences
At December 31,
2015
Other
movements
At December 31,
2016
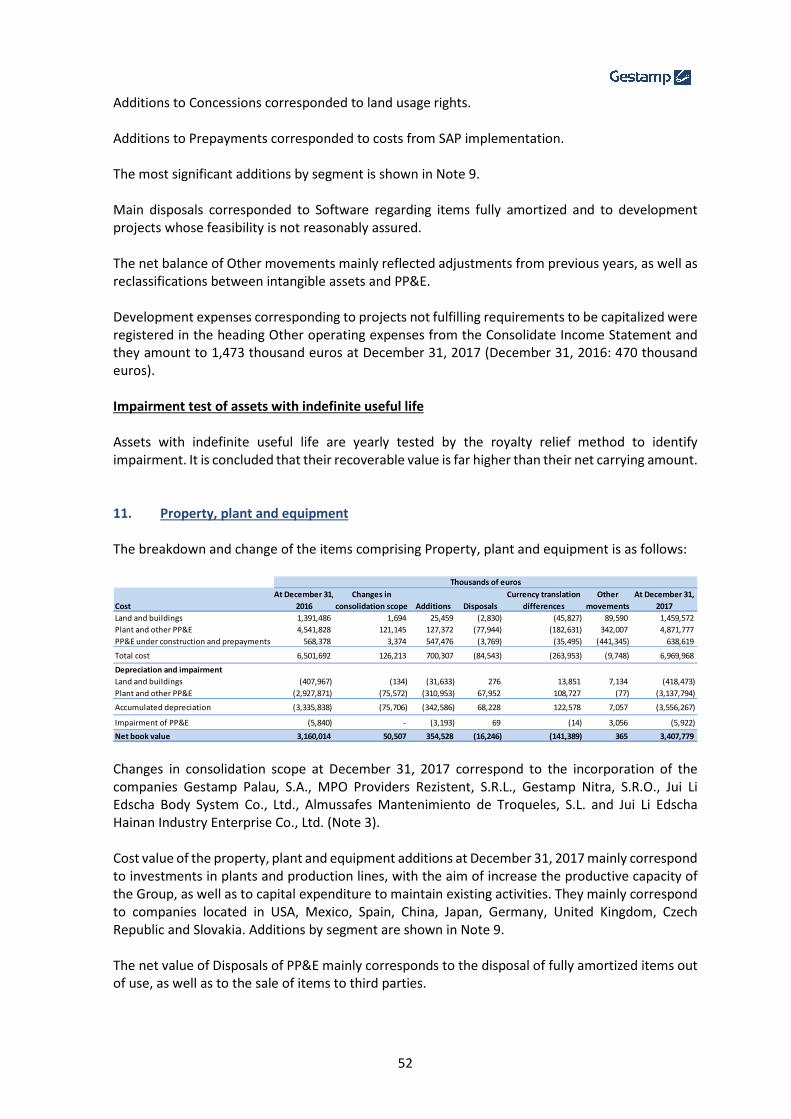
52
Additions to Concessions corresponded to land usage rights. Additions to Prepayments corresponded to costs from SAP implementation. The most significant additions by segment is shown in Note 9. Main disposals corresponded to Software regarding items fully amortized and to development projects whose feasibility is not reasonably assured. The net balance of Other movements mainly reflected adjustments from previous years, as well as reclassifications between intangible assets and PP&E. Development expenses corresponding to projects not fulfilling requirements to be capitalized were registered in the heading Other operating expenses from the Consolidate Income Statement and they amount to 1,473 thousand euros at December 31, 2017 (December 31, 2016: 470 thousand euros). Impairment test of assets with indefinite useful life Assets with indefinite useful life are yearly tested by the royalty relief method to identify impairment. It is concluded that their recoverable value is far higher than their net carrying amount. 11. Property, plant and equipment The breakdown and change of the items comprising Property, plant and equipment is as follows:
Changes in consolidation scope at December 31, 2017 correspond to the incorporation of the companies Gestamp Palau, S.A., MPO Providers Rezistent, S.R.L., Gestamp Nitra, S.R.O., Jui Li Edscha Body System Co., Ltd., Almussafes Mantenimiento de Troqueles, S.L. and Jui Li Edscha Hainan Industry Enterprise Co., Ltd. (Note 3). Cost value of the property, plant and equipment additions at December 31, 2017 mainly correspond to investments in plants and production lines, with the aim of increase the productive capacity of the Group, as well as to capital expenditure to maintain existing activities. They mainly correspond to companies located in USA, Mexico, Spain, China, Japan, Germany, United Kingdom, Czech Republic and Slovakia. Additions by segment are shown in Note 9. The net value of Disposals of PP&E mainly corresponds to the disposal of fully amortized items out of use, as well as to the sale of items to third parties.
At December 31, Currency translation Other At December 31,
Cost 2016 Additions Disposals differences movements 2017
Land and buildings 1,391,486 1,694 25,459 (2,830) (45,827) 89,590 1,459,572
Plant and other PP&E 4,541,828 121,145 127,372 (77,944) (182,631) 342,007 4,871,777
PP&E under construction and prepayments 568,378 3,374 547,476 (3,769) (35,495) (441,345) 638,619
Total cost 6,501,692 126,213 700,307 (84,543) (263,953) (9,748) 6,969,968
Depreciation and impairment
Land and buildings (407,967) (134) (31,633) 276 13,851 7,134 (418,473)
Plant and other PP&E (2,927,871) (75,572) (310,953) 67,952 108,727 (77) (3,137,794)
Accumulated depreciation (3,335,838) (75,706) (342,586) 68,228 122,578 7,057 (3,556,267)
Impairment of PP&E (5,840) - (3,193) 69 (14) 3,056 (5,922)
Net book value 3,160,014 50,507 354,528 (16,246) (141,389) 365 3,407,779
Changes in
consolidation scope
Thousands of euros
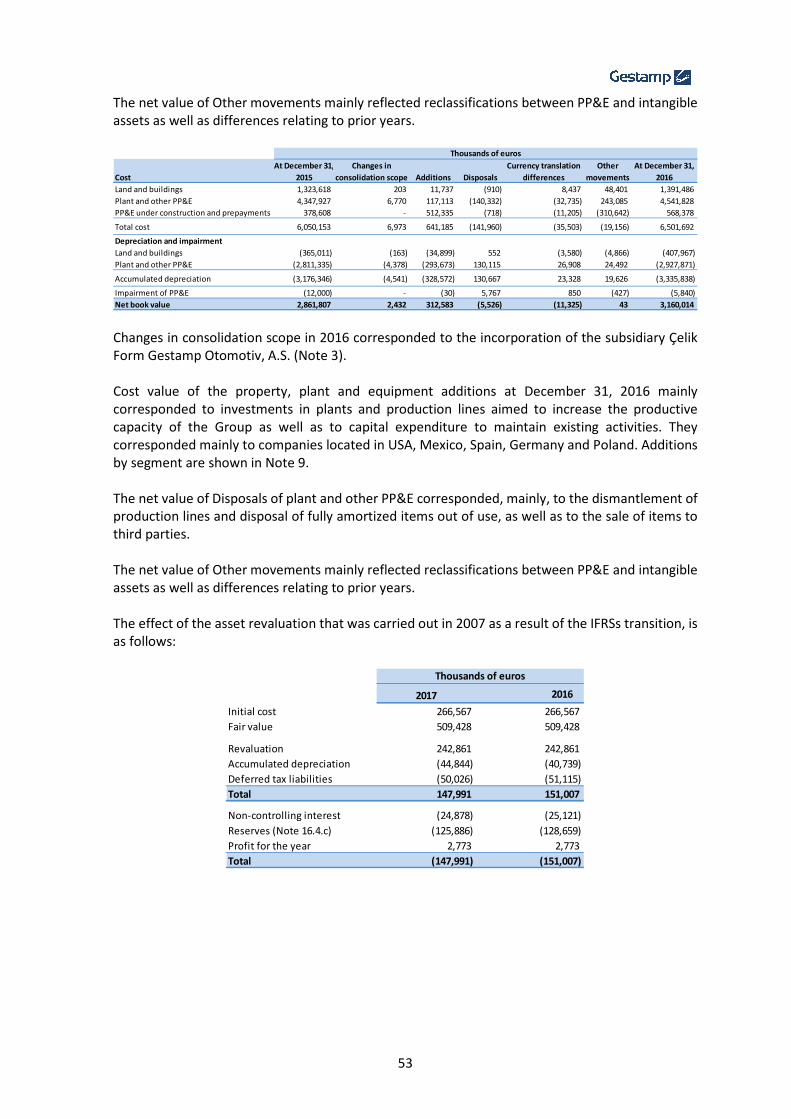
53
The net value of Other movements mainly reflected reclassifications between PP&E and intangible assets as well as differences relating to prior years.
Changes in consolidation scope in 2016 corresponded to the incorporation of the subsidiary Çelik Form Gestamp Otomotiv, A.S. (Note 3). Cost value of the property, plant and equipment additions at December 31, 2016 mainly corresponded to investments in plants and production lines aimed to increase the productive capacity of the Group as well as to capital expenditure to maintain existing activities. They corresponded mainly to companies located in USA, Mexico, Spain, Germany and Poland. Additions by segment are shown in Note 9. The net value of Disposals of plant and other PP&E corresponded, mainly, to the dismantlement of production lines and disposal of fully amortized items out of use, as well as to the sale of items to third parties. The net value of Other movements mainly reflected reclassifications between PP&E and intangible assets as well as differences relating to prior years. The effect of the asset revaluation that was carried out in 2007 as a result of the IFRSs transition, is as follows:
At December 31, Currency translation Other At December 31,
Cost 2015 Additions Disposals differences movements 2016
Land and buildings 1,323,618 203 11,737 (910) 8,437 48,401 1,391,486
Plant and other PP&E 4,347,927 6,770 117,113 (140,332) (32,735) 243,085 4,541,828
PP&E under construction and prepayments 378,608 - 512,335 (718) (11,205) (310,642) 568,378
Total cost 6,050,153 6,973 641,185 (141,960) (35,503) (19,156) 6,501,692
Depreciation and impairment
Land and buildings (365,011) (163) (34,899) 552 (3,580) (4,866) (407,967)
Plant and other PP&E (2,811,335) (4,378) (293,673) 130,115 26,908 24,492 (2,927,871)
Accumulated depreciation (3,176,346) (4,541) (328,572) 130,667 23,328 19,626 (3,335,838)
Impairment of PP&E (12,000) - (30) 5,767 850 (427) (5,840)
Net book value 2,861,807 2,432 312,583 (5,526) (11,325) 43 3,160,014
Changes in
consolidation scope
Thousands of euros
2017 2016
Initial cost 266,567 266,567
Fair value 509,428 509,428
Revaluation 242,861 242,861
Accumulated depreciation (44,844) (40,739)
Deferred tax liabilities (50,026) (51,115)
Total 147,991 151,007
Non-controlling interest (24,878) (25,121)
Reserves (Note 16.4.c) (125,886) (128,659)
Profit for the year 2,773 2,773
Total (147,991) (151,007)
Thousands of euros
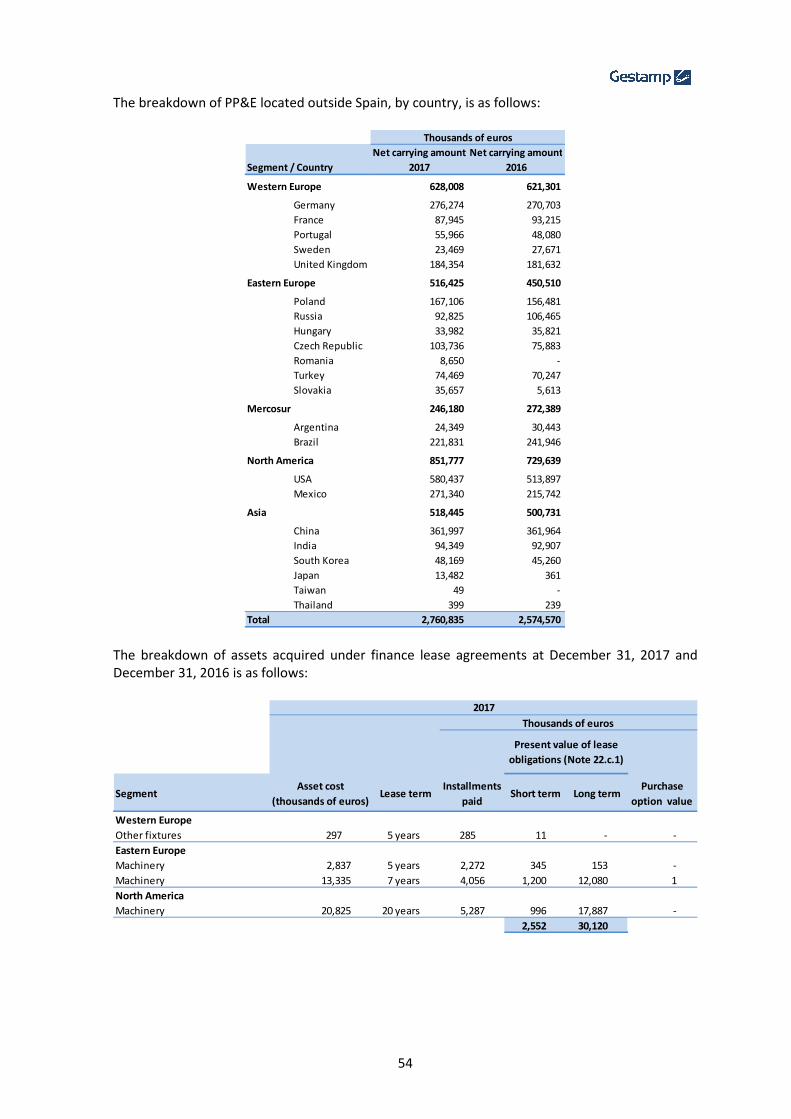
54
The breakdown of PP&E located outside Spain, by country, is as follows:
The breakdown of assets acquired under finance lease agreements at December 31, 2017 and December 31, 2016 is as follows:
Net carrying amount Net carrying amount
Segment / Country 2017 2016
Western Europe 628,008 621,301
Germany 276,274 270,703
France 87,945 93,215
Portugal 55,966 48,080
Sweden 23,469 27,671
United Kingdom 184,354 181,632
Eastern Europe 516,425 450,510
Poland 167,106 156,481
Russia 92,825 106,465
Hungary 33,982 35,821
Czech Republic 103,736 75,883
Romania 8,650 -
Turkey 74,469 70,247
Slovakia 35,657 5,613
Mercosur 246,180 272,389
Argentina 24,349 30,443
Brazil 221,831 241,946
North America 851,777 729,639
USA 580,437 513,897
Mexico 271,340 215,742
Asia 518,445 500,731
China 361,997 361,964
India 94,349 92,907
South Korea 48,169 45,260
Japan 13,482 361
Taiwan 49 -
Thailand 399 239
Total 2,760,835 2,574,570
Thousands of euros
SegmentAsset cost
(thousands of euros)Lease term
Installments
paidShort term Long term
Purchase
option value
Western Europe
Other fixtures 297 5 years 285 11 - -
Eastern Europe
Machinery 2,837 5 years 2,272 345 153 -
Machinery 13,335 7 years 4,056 1,200 12,080 1
North America
Machinery 20,825 20 years 5,287 996 17,887 -
2,552 30,120
2017
Thousands of euros
Present value of lease
obligations (Note 22.c.1)
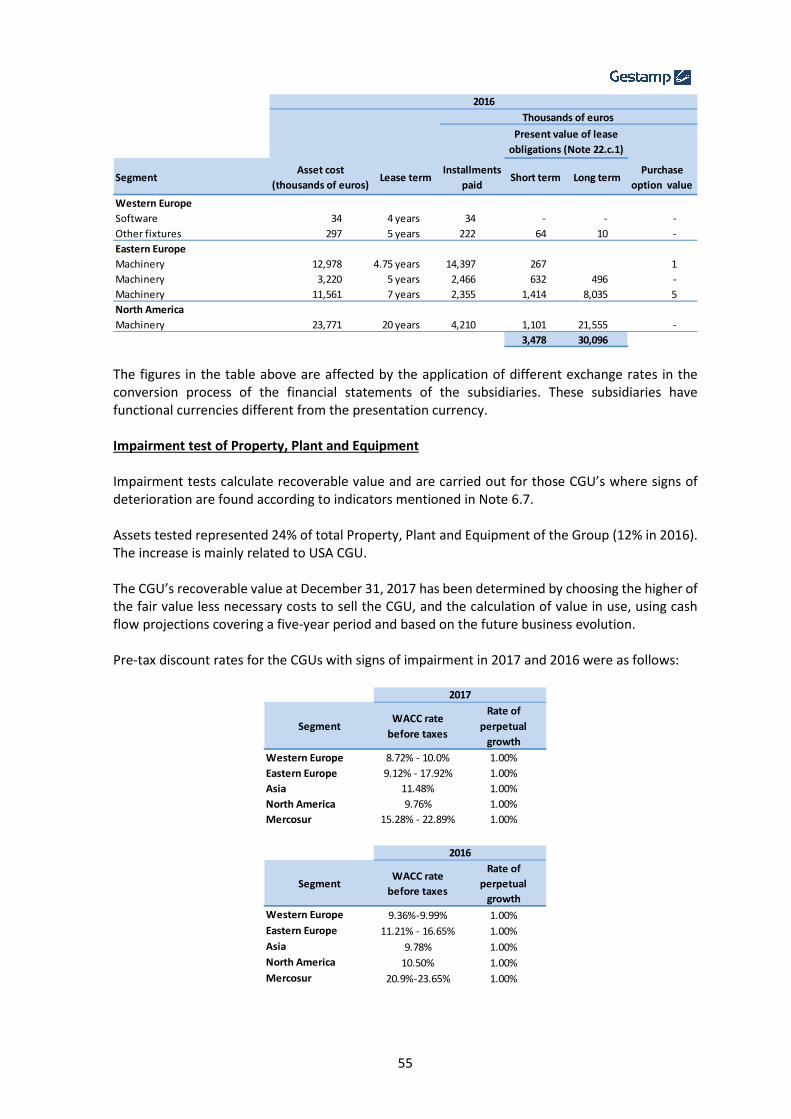
55
The figures in the table above are affected by the application of different exchange rates in the conversion process of the financial statements of the subsidiaries. These subsidiaries have functional currencies different from the presentation currency. Impairment test of Property, Plant and Equipment Impairment tests calculate recoverable value and are carried out for those CGU’s where signs of deterioration are found according to indicators mentioned in Note 6.7. Assets tested represented 24% of total Property, Plant and Equipment of the Group (12% in 2016). The increase is mainly related to USA CGU. The CGU’s recoverable value at December 31, 2017 has been determined by choosing the higher of the fair value less necessary costs to sell the CGU, and the calculation of value in use, using cash flow projections covering a five-year period and based on the future business evolution. Pre-tax discount rates for the CGUs with signs of impairment in 2017 and 2016 were as follows:
SegmentAsset cost
(thousands of euros)Lease term
Installments
paidShort term Long term
Purchase
option value
Western Europe
Software 34 4 years 34 - - -
Other fixtures 297 5 years 222 64 10 -
Eastern Europe
Machinery 12,978 4.75 years 14,397 267 1
Machinery 3,220 5 years 2,466 632 496 -
Machinery 11,561 7 years 2,355 1,414 8,035 5
North America
Machinery 23,771 20 years 4,210 1,101 21,555 -
3,478 30,096
2016
Present value of lease
obligations (Note 22.c.1)
Thousands of euros
SegmentWACC rate
before taxes
Rate of
perpetual
growth
Western Europe 8.72% - 10.0% 1.00%
Eastern Europe 9.12% - 17.92% 1.00%
Asia 11.48% 1.00%
North America 9.76% 1.00%
Mercosur 15.28% - 22.89% 1.00%
2017
SegmentWACC rate
before taxes
Rate of
perpetual
growth
Western Europe 9.36%-9.99% 1.00%
Eastern Europe 11.21% - 16.65% 1.00%
Asia 9.78% 1.00%
North America 10.50% 1.00%
Mercosur 20.9%-23.65% 1.00%
2016

56
The recoverable value was higher than the net value for all the CGUs, so the Group can recover the value of the consolidated assets of each CGU at December 31, 2017 and 2016. Economic projections from previous years were not significantly different from actual figures. Sensitivity analysis to changes in key assumptions The Parent Company’s management subjects its PP&E valuations to a sensitivity analysis, varying key inputs such as the discount and terminal growth rates used, to ensure that potential changes in these estimates do not reduce recoverable amounts to below carrying amounts, when value in use in the reference value.
� Although a 50 basis point increase in the discount rate used would reduce value in use, in no case would this be reduced to below the carrying amount of the analyzed assets.
� Assuming a rate of perpetual growth of 0.5% would similarly result in a decline in value in use, albeit in no instance to below the carrying amount of the analyzed assets.
� Assuming a 150 basis point decrease in Ebitda/sales ratio used for extrapolating cash flow to perpetuity would reduce value in use but in no case would mean impairment of the carrying amount of the analyzed assets.
Pledged property, plant and equipment to secure bank loans, in rem guarantees and others As at December 31, 2017 and 2016 there are no items of property, plant, and equipment set aside to secure bank loans (Note 22.a.1). 12. Financial assets The breakdown of the Group’s financial assets at December 31, 2017 and December 31, 2016 by category and maturity, expressed in thousands of euros, is as follows:
2017 2016 2017 2016 2017 2016 2017 2016 2017 2016
Non-current financial assets 1,787 5,740 39,248 50,581 14,718 25,710 - - 13,674 13,483
Investments accounted for using the equity method 1,787 5,740 - - - - - - - -
Held-to-maturity investments - - - - - - - - 898 957
Loans and receivables - - 39,248 50,581 - - - - 12,776 12,526
Derivative financial instruments (Note 22.b.1) - - - - 14,718 25,710 - - - -
Current financial assets - - 34,598 11,036 - - 5,376 338 38,922 31,854
Held-to-maturity investments - - - - - - 5,376 338 - -
Loans and receivables - - 34,598 11,036 - - - - 38,922 31,854
Total financial assets 1,787 5,740 73,846 61,617 14,718 25,710 5,376 338 52,596 45,337
Thousands of euros
Investments accounted for
using the equity method Other financial assetsSecurities portfolioLoans and receivables
Derivative financial
instruments
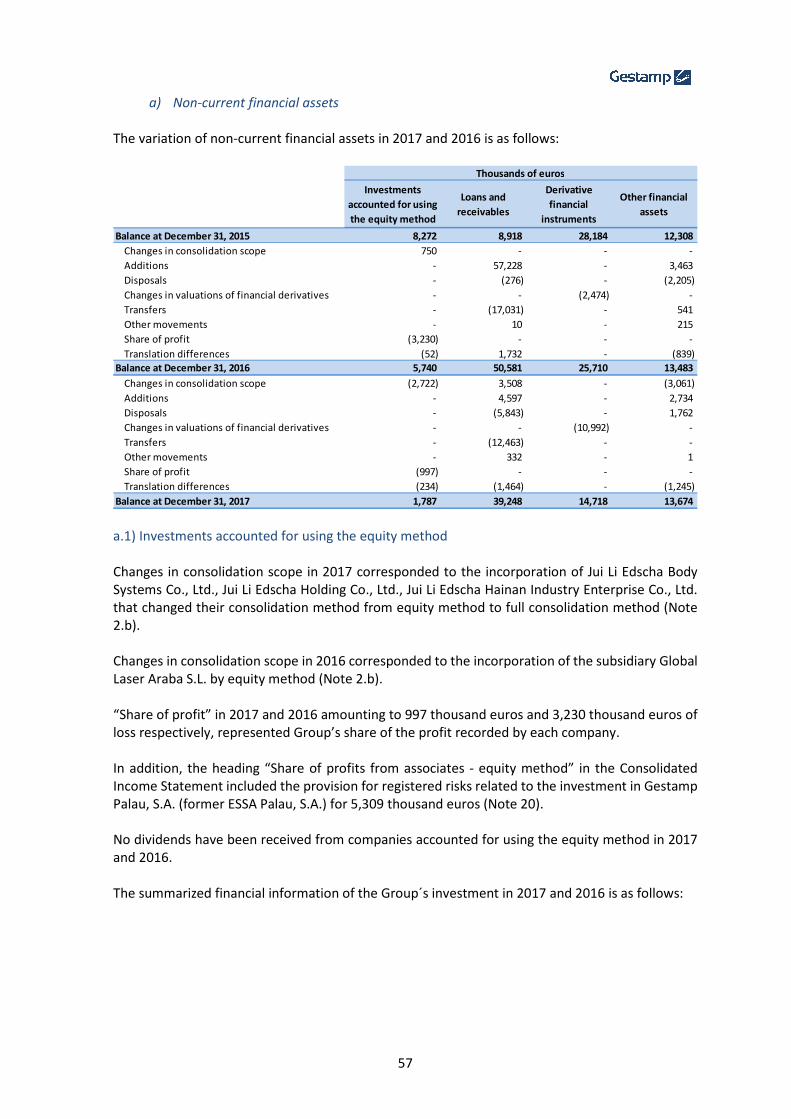
57
a) Non-current financial assets
The variation of non-current financial assets in 2017 and 2016 is as follows:
a.1) Investments accounted for using the equity method Changes in consolidation scope in 2017 corresponded to the incorporation of Jui Li Edscha Body Systems Co., Ltd., Jui Li Edscha Holding Co., Ltd., Jui Li Edscha Hainan Industry Enterprise Co., Ltd. that changed their consolidation method from equity method to full consolidation method (Note 2.b). Changes in consolidation scope in 2016 corresponded to the incorporation of the subsidiary Global Laser Araba S.L. by equity method (Note 2.b). “Share of profit” in 2017 and 2016 amounting to 997 thousand euros and 3,230 thousand euros of loss respectively, represented Group’s share of the profit recorded by each company. In addition, the heading “Share of profits from associates - equity method” in the Consolidated Income Statement included the provision for registered risks related to the investment in Gestamp Palau, S.A. (former ESSA Palau, S.A.) for 5,309 thousand euros (Note 20). No dividends have been received from companies accounted for using the equity method in 2017 and 2016. The summarized financial information of the Group´s investment in 2017 and 2016 is as follows:
Investments
accounted for using
the equity method
Loans and
receivables
Derivative
financial
instruments
Other financial
assets
Balance at December 31, 2015 8,272 8,918 28,184 12,308
Changes in consolidation scope 750 - - -
Additions - 57,228 - 3,463
Disposals - (276) - (2,205)
Changes in valuations of financial derivatives - - (2,474) -
Transfers - (17,031) - 541
Other movements - 10 - 215
Share of profit (3,230) - - -
Translation differences (52) 1,732 - (839)
Balance at December 31, 2016 5,740 50,581 25,710 13,483
Changes in consolidation scope (2,722) 3,508 - (3,061)
Additions - 4,597 - 2,734
Disposals - (5,843) - 1,762
Changes in valuations of financial derivatives - - (10,992) -
Transfers - (12,463) - -
Other movements - 332 - 1
Share of profit (997) - - -
Translation differences (234) (1,464) - (1,245)
Balance at December 31, 2017 1,787 39,248 14,718 13,674
Thousands of euros

58
Summarised balance sheet:
Summarised income statement:
Global Laser Araba GGM & subsidiaries Industrias Tamer, S.A.
Total non-current assets 11,942 68,787 1,396
Total current assets 2,751 52,349 4,622
Total non-current liabilities (10,600) (48,859) (220)
Total current liabilities (3,276) (68,337) (4,598)
- - -
Equity (817) (4,297) (1,200)
Translation differences - 357 -
Shareholding 30% 30% 30%
Carrying amount of the investment 245 1,182 360
December 31, 2017
Thousands of euros
Essa Palau, S.A. Global Laser ArabaJui Li Edscha Body
Systems & subsidiariesGGM & subsidiaries Industrias Tamer, S.A.
Total non-current assets 36,137 2,827 793 53,364 1,471
Total current assets 14,184 3,160 7,545 21,183 3,726
Total non-current liabilities (21,633) - (69) (25,860) (360)
Total current liabilities (54,090) (4,507) (2,825) (41,287) (3,657)
Equity 25,402 (1,480) (4,721) (6,978) (1,180)
Translation differences - - (723) (422) -
Shareholding 40% 30% 50% 30% 30%
Carrying amount of the investment - 444 2,722 2,220 354
December 31, 2016
Thousands of euros
Global Laser Araba GGM & subsidiaries Industrias Tamer, S.A.
Operating income 2,910 29,779 2,661
Operating expense (3,689) (30,937) (2,460)
OPERATING PROFIT/LOSS (779) (1,158) 201
Financial profit (166) (815) (15)
Exchange gain (losses) - (1,254) -
Impairment and other - - -
PROFIT/LOSS BEFORE TAXES (945) (3,227) 186
Income tax expense - - -
Adjustments from previous years 282 547 (166)
Profit for the year from discontinued
operations net of taxes- - -
PROFIT/LOSS FOR THE YEAR (663) (2,680) 20
Shareholding 30% 30% 30%
Participation of the Group in profit (199) (804) 6
December 31, 2017
Thousands of euros
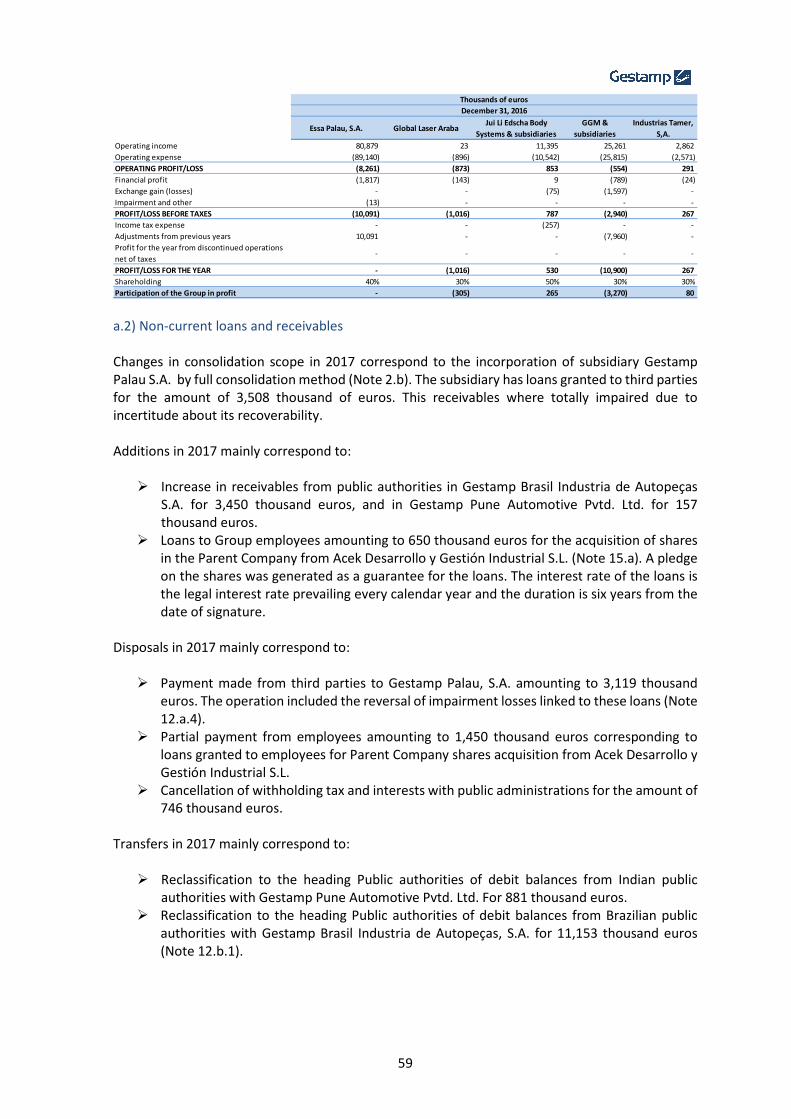
59
a.2) Non-current loans and receivables Changes in consolidation scope in 2017 correspond to the incorporation of subsidiary Gestamp Palau S.A. by full consolidation method (Note 2.b). The subsidiary has loans granted to third parties for the amount of 3,508 thousand of euros. This receivables where totally impaired due to incertitude about its recoverability. Additions in 2017 mainly correspond to:
� Increase in receivables from public authorities in Gestamp Brasil Industria de Autopeças S.A. for 3,450 thousand euros, and in Gestamp Pune Automotive Pvtd. Ltd. for 157 thousand euros.
� Loans to Group employees amounting to 650 thousand euros for the acquisition of shares in the Parent Company from Acek Desarrollo y Gestión Industrial S.L. (Note 15.a). A pledge on the shares was generated as a guarantee for the loans. The interest rate of the loans is the legal interest rate prevailing every calendar year and the duration is six years from the date of signature.
Disposals in 2017 mainly correspond to:
� Payment made from third parties to Gestamp Palau, S.A. amounting to 3,119 thousand euros. The operation included the reversal of impairment losses linked to these loans (Note 12.a.4).
� Partial payment from employees amounting to 1,450 thousand euros corresponding to loans granted to employees for Parent Company shares acquisition from Acek Desarrollo y Gestión Industrial S.L.
� Cancellation of withholding tax and interests with public administrations for the amount of 746 thousand euros.
Transfers in 2017 mainly correspond to:
� Reclassification to the heading Public authorities of debit balances from Indian public authorities with Gestamp Pune Automotive Pvtd. Ltd. For 881 thousand euros.
� Reclassification to the heading Public authorities of debit balances from Brazilian public authorities with Gestamp Brasil Industria de Autopeças, S.A. for 11,153 thousand euros (Note 12.b.1).
Essa Palau, S.A. Global Laser ArabaJui Li Edscha Body
Systems & subsidiaries
GGM &
subsidiaries
Industrias Tamer,
S,A.
Operating income 80,879 23 11,395 25,261 2,862
Operating expense (89,140) (896) (10,542) (25,815) (2,571)
OPERATING PROFIT/LOSS (8,261) (873) 853 (554) 291
Financial profit (1,817) (143) 9 (789) (24)
Exchange gain (losses) - - (75) (1,597) -
Impairment and other (13) - - - -
PROFIT/LOSS BEFORE TAXES (10,091) (1,016) 787 (2,940) 267
Income tax expense - - (257) - -
Adjustments from previous years 10,091 - - (7,960) -
Profit for the year from discontinued operations
net of taxes- - - - -
PROFIT/LOSS FOR THE YEAR - (1,016) 530 (10,900) 267
Shareholding 40% 30% 50% 30% 30%
Participation of the Group in profit - (305) 265 (3,270) 80
Thousands of euros
December 31, 2016

60
Additions in 2016 mainly corresponded to:
� Increase in debit balances from public authorities with Gestamp Brasil Industria de Autopeças S.A. for 9,963 thousand euros.
� Loan granted by the subsidiary Gestamp Finance Slovakia S.R.O. to Gestión Global de Matricería S.L. amounting to 8,400 thousand euros. This loan earns a 2.756% interest rate and initial maturity was March 2023. At December 31, 2016 this loan was transferred to short term and final maturity is June 2017.
� Loans to Group employees amounting to 37,110 thousand euros for the acquisition of shares in the Parent Company from Acek Desarrollo y Gestión Industrial S.L. (Note 15.a). A pledge on the shares was generated as a guarantee for the loans. The interest rate of the loans is the legal interest rate prevailing every calendar year and the duration is six years from the date of signature. The fair value of the shares sold by Acek Desarrollo y Gestión Industrial S.L. to employees was based on the operation between significant shareholders in the first quarter of 2016 and the Group Management considered it was out of scope of IFRS 2.
Transfers in 2016 mainly corresponded to the transfer to the heading Public authorities of debit balances of Brazilian public authorities with Gestamp Brasil Industria de Autopeças, S.A. amounting to 8,161 thousand euros and to the loan granted by the subsidiary Gestamp Finance Slovakia S.R.O. to Gestión Global de Matricería S.L. amounting to 8,400 thousand euros. a.3) Derivative financial instruments Changes in valuation of financial instruments at December 31, 2017 and 2016 correspond to the change in the present value of implicit derivatives mainly due to the decrease in notional hedged as well as to the evolution of the exchange rates applicable to sales and purchase prices in certain customer and supplier contracts (Note 22.b.1). a.4) Other non-current financial assets Changes in consolidation scope in 2017 correspond to the incorporation of subsidiary Gestamp Palau S.A. by full consolidation method (Note 2.b). The incorporation included the impairment of loans granted to third parties for the amount of 3,508 thousand euros (Note 12.a.2)). Additions in 2017 mainly correspond to deposits as guarantee for operating leases amounting to 526, deposits for employees accident insurance amounting to 1,029 thousand euros and deposits for legal responsibilities for the amount of 1,036 thousand euros. Disposals in 2017 mainly correspond to:
� Impairment reversal in Gestamp Palau, S.A. due to payment received from third parties for the amount of 3,119 thousand euros.
� The refund of security deposits linked to operational lease contracts for 642 thousand euros and of deposits for legal responsibilities for 162 thousand euros.
� Payments for the amount of 284 thousand euros linked to compensations for accidents at work.
Additions in 2016 mainly correspond to deposits as guarantee for operating leases amounting to 3,088 thousand euros.
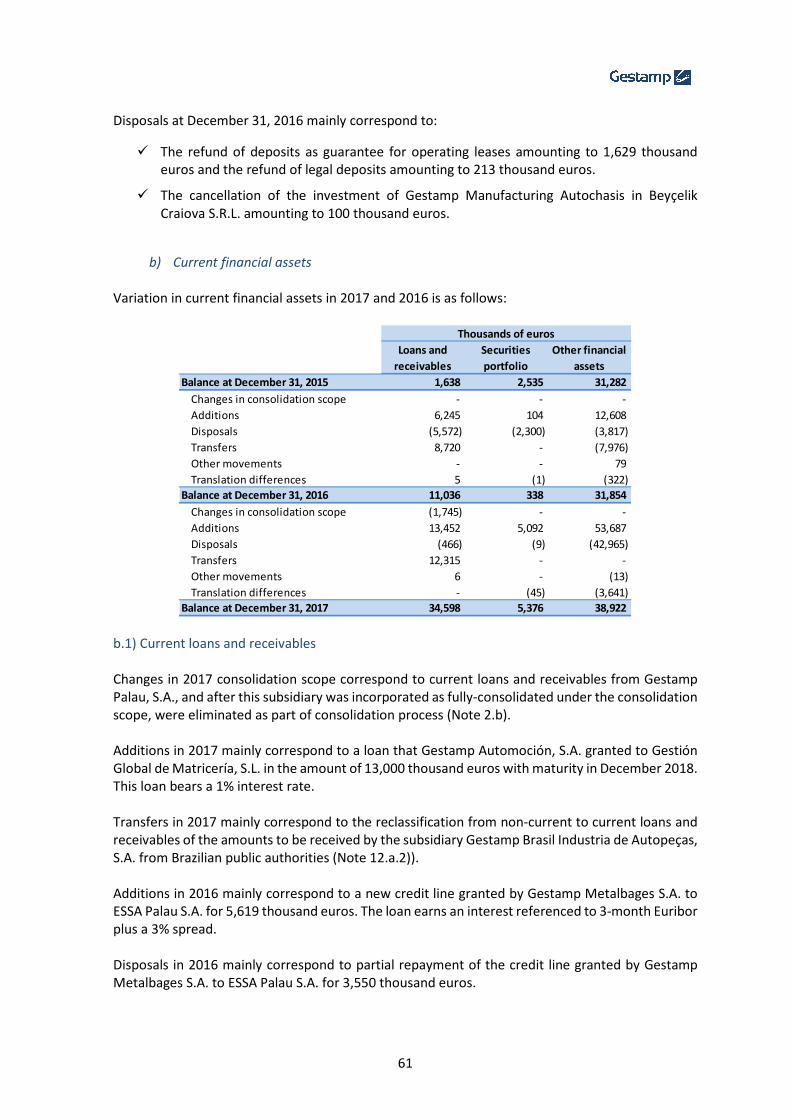
61
Disposals at December 31, 2016 mainly correspond to:
� The refund of deposits as guarantee for operating leases amounting to 1,629 thousand euros and the refund of legal deposits amounting to 213 thousand euros.
� The cancellation of the investment of Gestamp Manufacturing Autochasis in Beyçelik Craiova S.R.L. amounting to 100 thousand euros.
b) Current financial assets
Variation in current financial assets in 2017 and 2016 is as follows:
b.1) Current loans and receivables Changes in 2017 consolidation scope correspond to current loans and receivables from Gestamp Palau, S.A., and after this subsidiary was incorporated as fully-consolidated under the consolidation scope, were eliminated as part of consolidation process (Note 2.b). Additions in 2017 mainly correspond to a loan that Gestamp Automoción, S.A. granted to Gestión Global de Matricería, S.L. in the amount of 13,000 thousand euros with maturity in December 2018. This loan bears a 1% interest rate. Transfers in 2017 mainly correspond to the reclassification from non-current to current loans and receivables of the amounts to be received by the subsidiary Gestamp Brasil Industria de Autopeças, S.A. from Brazilian public authorities (Note 12.a.2)). Additions in 2016 mainly correspond to a new credit line granted by Gestamp Metalbages S.A. to ESSA Palau S.A. for 5,619 thousand euros. The loan earns an interest referenced to 3-month Euribor plus a 3% spread. Disposals in 2016 mainly correspond to partial repayment of the credit line granted by Gestamp Metalbages S.A. to ESSA Palau S.A. for 3,550 thousand euros.
Loans and
receivables
Securities
portfolio
Other financial
assets
Balance at December 31, 2015 1,638 2,535 31,282
Changes in consolidation scope - - -
Additions 6,245 104 12,608
Disposals (5,572) (2,300) (3,817)
Transfers 8,720 - (7,976)
Other movements - - 79
Translation differences 5 (1) (322)
Balance at December 31, 2016 11,036 338 31,854
Changes in consolidation scope (1,745) - -
Additions 13,452 5,092 53,687
Disposals (466) (9) (42,965)
Transfers 12,315 - -
Other movements 6 - (13)
Translation differences - (45) (3,641)
Balance at December 31, 2017 34,598 5,376 38,922
Thousands of euros
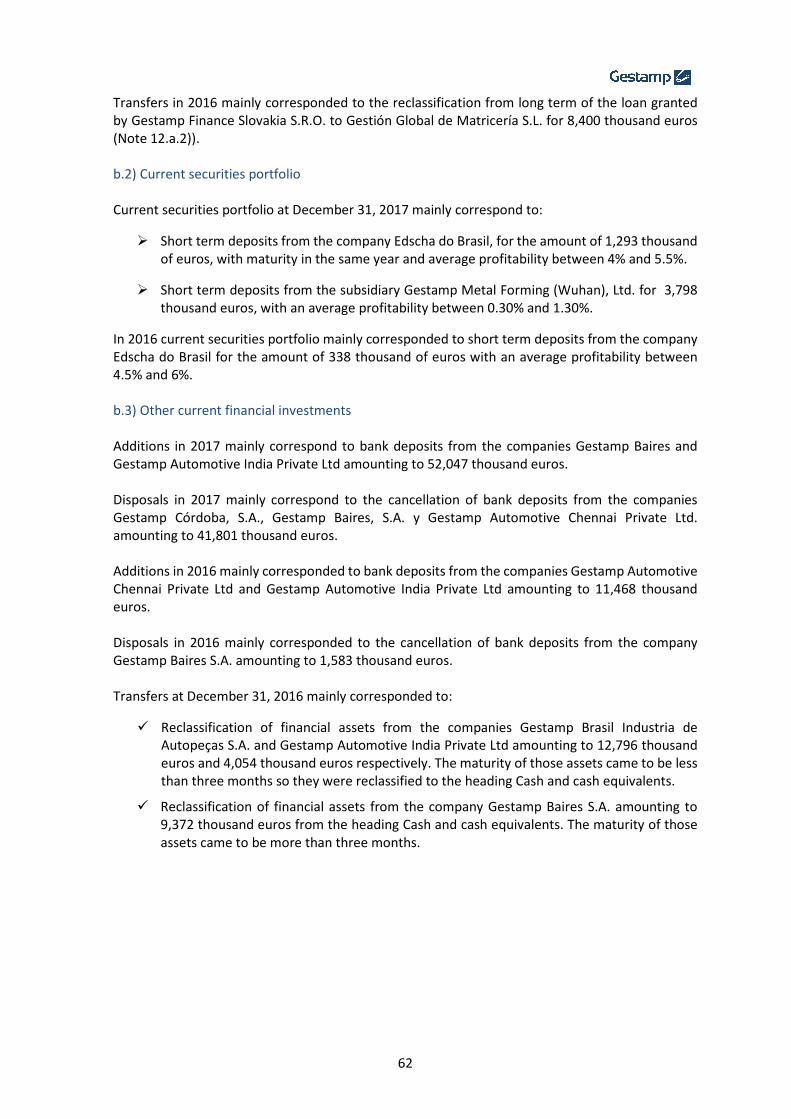
62
Transfers in 2016 mainly corresponded to the reclassification from long term of the loan granted by Gestamp Finance Slovakia S.R.O. to Gestión Global de Matricería S.L. for 8,400 thousand euros (Note 12.a.2)). b.2) Current securities portfolio Current securities portfolio at December 31, 2017 mainly correspond to:
� Short term deposits from the company Edscha do Brasil, for the amount of 1,293 thousand of euros, with maturity in the same year and average profitability between 4% and 5.5%.
� Short term deposits from the subsidiary Gestamp Metal Forming (Wuhan), Ltd. for 3,798 thousand euros, with an average profitability between 0.30% and 1.30%.
In 2016 current securities portfolio mainly corresponded to short term deposits from the company Edscha do Brasil for the amount of 338 thousand of euros with an average profitability between 4.5% and 6%. b.3) Other current financial investments Additions in 2017 mainly correspond to bank deposits from the companies Gestamp Baires and Gestamp Automotive India Private Ltd amounting to 52,047 thousand euros. Disposals in 2017 mainly correspond to the cancellation of bank deposits from the companies Gestamp Córdoba, S.A., Gestamp Baires, S.A. y Gestamp Automotive Chennai Private Ltd. amounting to 41,801 thousand euros. Additions in 2016 mainly corresponded to bank deposits from the companies Gestamp Automotive Chennai Private Ltd and Gestamp Automotive India Private Ltd amounting to 11,468 thousand euros. Disposals in 2016 mainly corresponded to the cancellation of bank deposits from the company Gestamp Baires S.A. amounting to 1,583 thousand euros. Transfers at December 31, 2016 mainly corresponded to:
� Reclassification of financial assets from the companies Gestamp Brasil Industria de Autopeças S.A. and Gestamp Automotive India Private Ltd amounting to 12,796 thousand euros and 4,054 thousand euros respectively. The maturity of those assets came to be less than three months so they were reclassified to the heading Cash and cash equivalents.
� Reclassification of financial assets from the company Gestamp Baires S.A. amounting to 9,372 thousand euros from the heading Cash and cash equivalents. The maturity of those assets came to be more than three months.

63
13. Inventories The breakdown of inventories at December 31, 2017 and December 31, 2016 is as follows:
The breakdowns of purchases used in production and changes in inventories are as follows:
Changes in consolidation scope correspond to the incorporation of the companies Gestamp Palau, S.A., MPO Providers Rezistent, S.R.L., Jui Li Edscha Body Systems Co., Ltd, Jui Li Edscha Holding Co., Ltd., Almussafes Mantenimiento de Troqueles, S.L. and Jui Li Edscha Hainan Industry Enterprise Co., Ltd. (Note 3). The inventories were not encumbered at December 31, 2017 nor at December 31, 2016.
2017 2016
Commercial inventories 42,571 11,235
Raw materials 189,819 170,560
Parts and subassemblies 68,382 65,121
Spare parts 80,459 74,157
Packaging materials 1,979 5,035
Total cost of raw materials and other consumables 383,210 326,108
Work in progress 149,416 145,508
Finished products 131,297 137,923
Byproducts, waste and recovered materials 696 518
Prepayments to suppliers 62,913 51,822
Total cost of inventories 727,532 661,879
Impairment of raw materials (23,569) (10,044)
Impairment of other consumables (9,195) (7,729)
Impairment of work in progress (5,940) (4,359)
Impairment of finished products (7,506) (8,850)
Total impairment (46,210) (30,982)
Total inventories 681,322 630,897
Thousands of euros
Balance at Balance at
Dec 31, 2016 Dec 31, 2017
Raw materials and other consumables 326,108 - - 55,744 55,744 1,358 383,210
Impairment of raw materials and other consumables (17,773) (19,248) 4,307 - (14,941) (50) (32,764)
Consumption (Note 26.a) 308,335 (19,248) 4,307 55,744 40,803 1,308 350,446
Balance at Balance at
Dec 31, 2016 Dec 31, 2017
Work in progress 145,508 - - (1,568) (1,568) 5,476 149,416
Finished products and byproducts 138,441 - - (6,448) (6,448) - 131,993
Impairment of finished products and work in progress (13,209) (3,998) 3,782 - (216) (21) (13,446)
Changes in inventories (see Income Statement) 270,740 (3,998) 3,782 (8,016) (8,232) 5,455 267,963
Thousands of euros
Change in inventories
ImpairmentReversal of
impairment
Changes in
inventoriesTotal
Changes in
consolidation
Thousands of euros
Change in inventories
ImpairmentReversal of
impairment
Changes in
inventoriesTotal
Changes in
consolidation
64
14. Trade and other receivables/ Other current assets/ Cash and cash equivalents a) Trade receivables
As indicated in Note 1, Group sales, as well as trade receivable balances, are concentrated across a limited number of customers due to the nature of the automotive industry. In general, trade receivable balances have high credit quality. Accounts receivable by stage of completion correspond to the income recognized pending invoicing. There are no prepayments exceeding the stage of completion by customer. The amount of customer prepayments for tools under construction registered in the heading Accounts receivable by stage of completion, was 750 million euros at December 31, 2017 (December 31, 2016: 713 million euros). The variation of the impairment provision at December 31, 2017 consisted of an increase of 805 thousand euros (December 31, 2016: 4.080 thousand euros) (Note 26.c) as well as written-off balances and translation differences. The age analysis of due accounts receivable related to the sale of parts at December 31, 2017 and 2016 is as follows:
The past due accounts receivable not provisioned are related to customers with no history of default. The receivables balances not yet due transferred by the Group as non-recourse factoring to Spanish, German, British, Brazilian and Polish banks, that were eliminated in the Consolidated Balance Sheet amounted to 380,293 thousand euros and to 300,755 thousand euros at December 31, 2017 and December 31, 2016 respectively. The expense of transferring non-due receivables balances at December 31, 2017 according to non-recourse factoring contracts amounted to 7,682 thousand euros (December 31, 2016: 5,350 thousand euros).
2017 2016
Trade receivables 792,553 843,048
Trade bills receivable 19,465 16,514
Accounts receivable by stage of completion, tools 307,281 279,677
Accounts receivable by stage of completion, machinery 27,742 2,976
Doubtful debts 1,355 770
Impairment losses (5,630) (4,736)
Trade receivables from related parties (Note 31.1) 31,948 31,676
Total 1,174,714 1,169,925
Thousands of euros
2016 2015
Less than 3 months 30,861 14,661
Between 3 and 6 months 3,931 6,093
Between 6 and 9 months 1,398 2,164
Between 9 and 12 months 236 730
More than 12 months 4,445 4,825
Total outstanding past due receivables 40,871 28,473
Impairment provision (5,630) (4,736)
Total 35,241 23,737
Thousands of euros
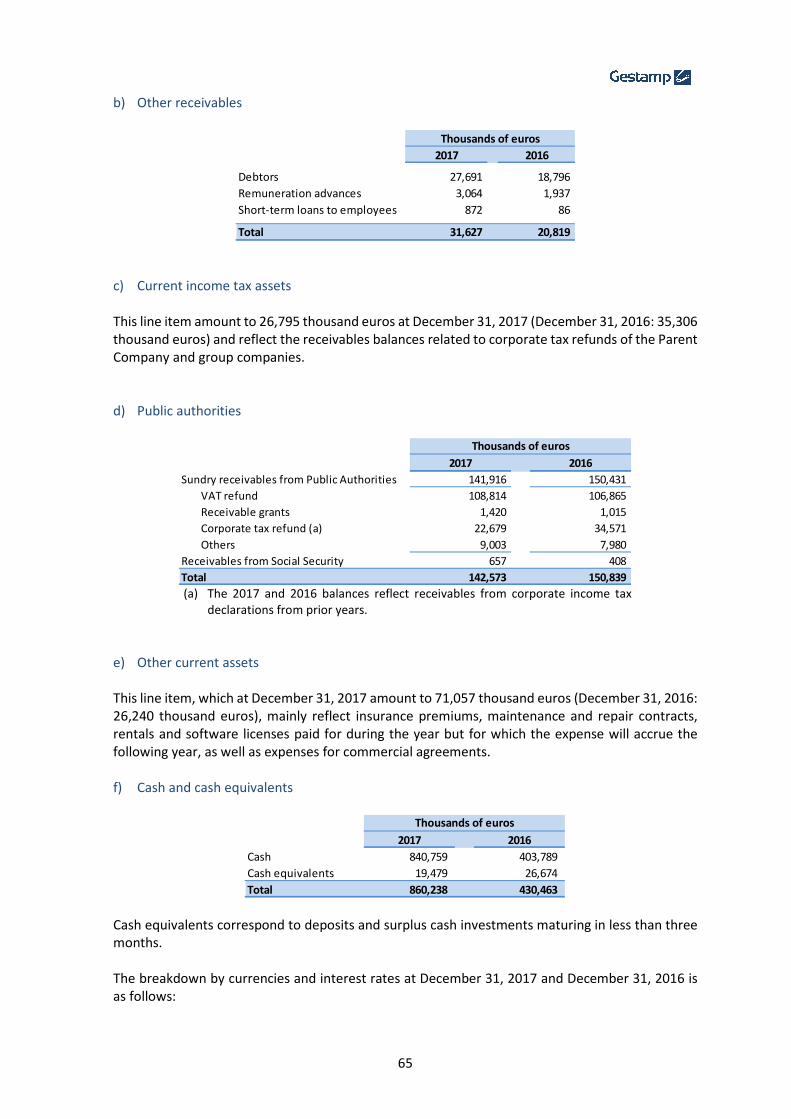
65
b) Other receivables
c) Current income tax assets This line item amount to 26,795 thousand euros at December 31, 2017 (December 31, 2016: 35,306 thousand euros) and reflect the receivables balances related to corporate tax refunds of the Parent Company and group companies. d) Public authorities
(a) The 2017 and 2016 balances reflect receivables from corporate income tax
declarations from prior years.
e) Other current assets This line item, which at December 31, 2017 amount to 71,057 thousand euros (December 31, 2016: 26,240 thousand euros), mainly reflect insurance premiums, maintenance and repair contracts, rentals and software licenses paid for during the year but for which the expense will accrue the following year, as well as expenses for commercial agreements. f) Cash and cash equivalents
Cash equivalents correspond to deposits and surplus cash investments maturing in less than three months. The breakdown by currencies and interest rates at December 31, 2017 and December 31, 2016 is as follows:
2017 2016
Debtors 27,691 18,796
Remuneration advances 3,064 1,937
Short-term loans to employees 872 86
Total 31,627 20,819
Thousands of euros
2017 2016
Sundry receivables from Public Authorities 141,916 150,431
VAT refund 108,814 106,865
Receivable grants 1,420 1,015
Corporate tax refund (a) 22,679 34,571
Others 9,003 7,980
Receivables from Social Security 657 408
Total 142,573 150,839
Thousands of euros
2017 2016
Cash 840,759 403,789
Cash equivalents 19,479 26,674
Total 860,238 430,463
Thousands of euros
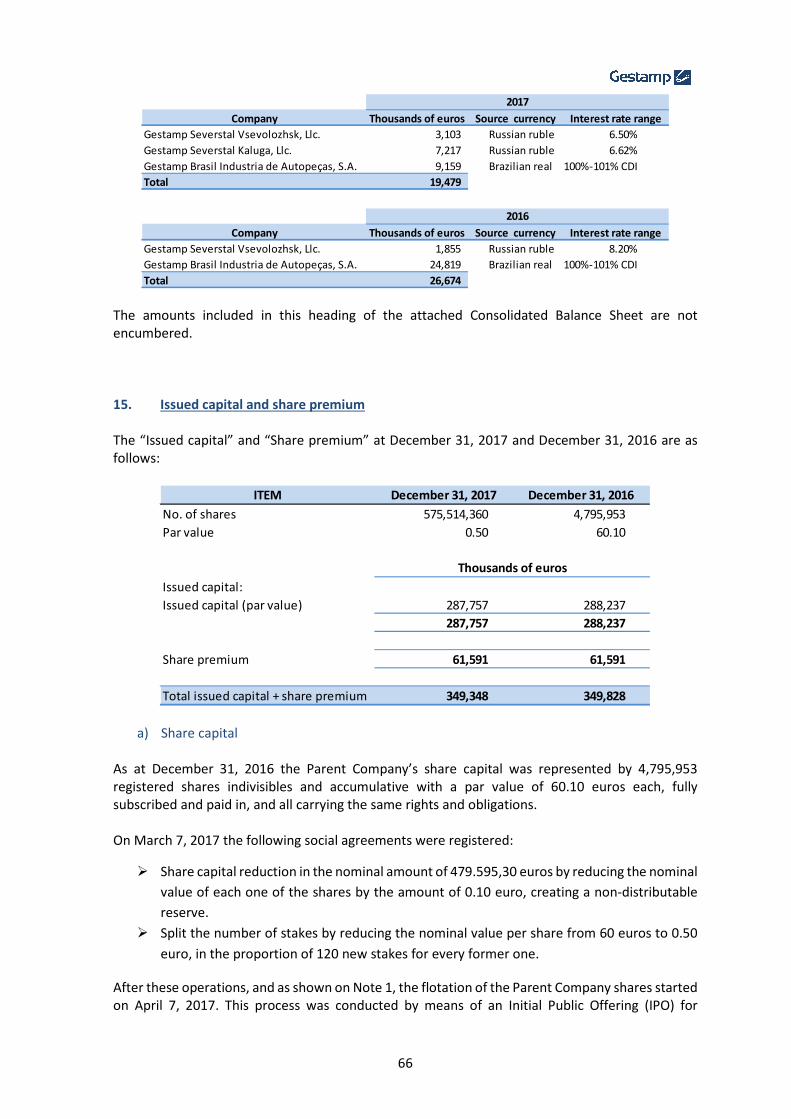
66
The amounts included in this heading of the attached Consolidated Balance Sheet are not encumbered. 15. Issued capital and share premium The “Issued capital” and “Share premium” at December 31, 2017 and December 31, 2016 are as follows:
a) Share capital As at December 31, 2016 the Parent Company’s share capital was represented by 4,795,953 registered shares indivisibles and accumulative with a par value of 60.10 euros each, fully subscribed and paid in, and all carrying the same rights and obligations. On March 7, 2017 the following social agreements were registered:
� Share capital reduction in the nominal amount of 479.595,30 euros by reducing the nominal
value of each one of the shares by the amount of 0.10 euro, creating a non-distributable
reserve.
� Split the number of stakes by reducing the nominal value per share from 60 euros to 0.50
euro, in the proportion of 120 new stakes for every former one.
After these operations, and as shown on Note 1, the flotation of the Parent Company shares started on April 7, 2017. This process was conducted by means of an Initial Public Offering (IPO) for
Company Thousands of euros Source currency Interest rate range
Gestamp Severstal Vsevolozhsk, Llc. 3,103 Russian ruble 6.50%
Gestamp Severstal Kaluga, Llc. 7,217 Russian ruble 6.62%
Gestamp Brasil Industria de Autopeças, S.A. 9,159 Brazilian real 100%-101% CDI
Total 19,479
2017
Company Thousands of euros Source currency Interest rate range
Gestamp Severstal Vsevolozhsk, Llc. 1,855 Russian ruble 8.20%
Gestamp Brasil Industria de Autopeças, S.A. 24,819 Brazilian real 100%-101% CDI
Total 26,674
2016
ITEM December 31, 2017 December 31, 2016
No. of shares 575,514,360 4,795,953
Par value 0.50 60.10
Issued capital:
Issued capital (par value) 287,757 288,237
287,757 288,237
Share premium 61,591 61,591
Total issued capital + share premium 349,348 349,828
Thousands of euros
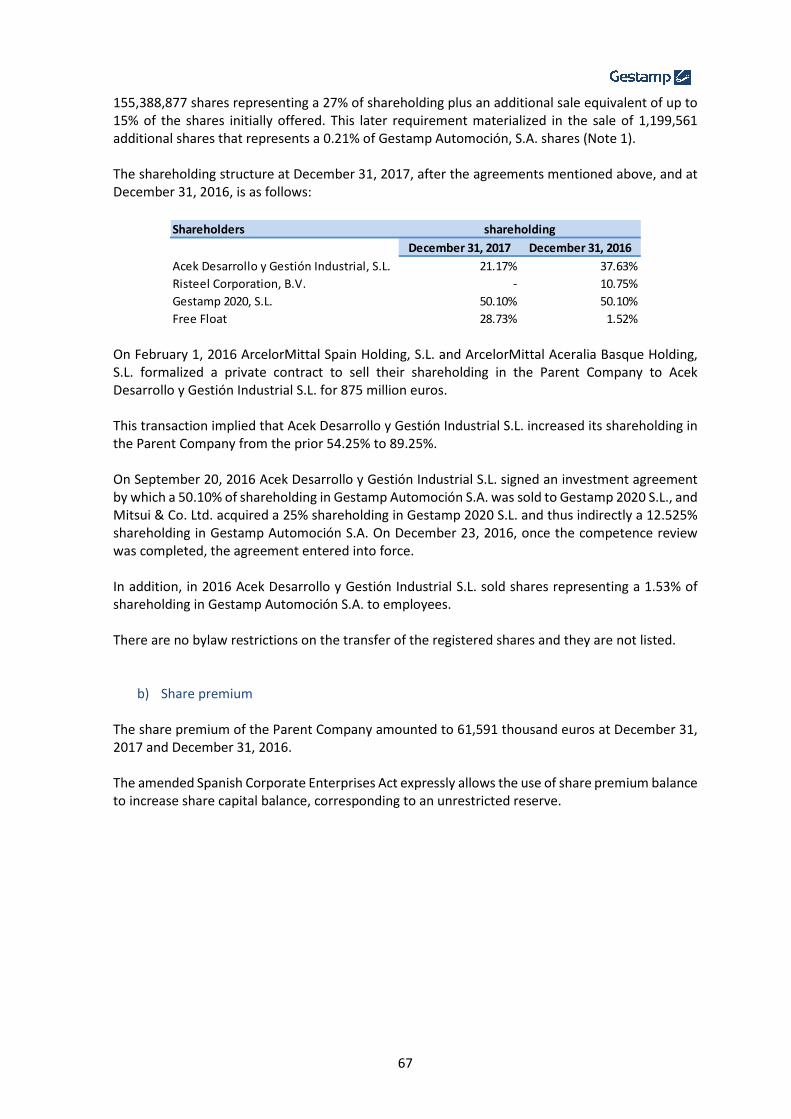
67
155,388,877 shares representing a 27% of shareholding plus an additional sale equivalent of up to 15% of the shares initially offered. This later requirement materialized in the sale of 1,199,561 additional shares that represents a 0.21% of Gestamp Automoción, S.A. shares (Note 1). The shareholding structure at December 31, 2017, after the agreements mentioned above, and at December 31, 2016, is as follows:
On February 1, 2016 ArcelorMittal Spain Holding, S.L. and ArcelorMittal Aceralia Basque Holding, S.L. formalized a private contract to sell their shareholding in the Parent Company to Acek Desarrollo y Gestión Industrial S.L. for 875 million euros. This transaction implied that Acek Desarrollo y Gestión Industrial S.L. increased its shareholding in the Parent Company from the prior 54.25% to 89.25%. On September 20, 2016 Acek Desarrollo y Gestión Industrial S.L. signed an investment agreement by which a 50.10% of shareholding in Gestamp Automoción S.A. was sold to Gestamp 2020 S.L., and Mitsui & Co. Ltd. acquired a 25% shareholding in Gestamp 2020 S.L. and thus indirectly a 12.525% shareholding in Gestamp Automoción S.A. On December 23, 2016, once the competence review was completed, the agreement entered into force. In addition, in 2016 Acek Desarrollo y Gestión Industrial S.L. sold shares representing a 1.53% of shareholding in Gestamp Automoción S.A. to employees. There are no bylaw restrictions on the transfer of the registered shares and they are not listed.
b) Share premium The share premium of the Parent Company amounted to 61,591 thousand euros at December 31, 2017 and December 31, 2016. The amended Spanish Corporate Enterprises Act expressly allows the use of share premium balance to increase share capital balance, corresponding to an unrestricted reserve.
Shareholders
December 31, 2017 December 31, 2016
Acek Desarrollo y Gestión Industrial, S.L. 21.17% 37.63%
Risteel Corporation, B.V. - 10.75%
Gestamp 2020, S.L. 50.10% 50.10%
Free Float 28.73% 1.52%
shareholding

68
16. Retained earnings The changes in “Retained earnings” for 2017 and 2016 are as follows:
Thousands of eurosLegal reserve
Goodwill
reservesUnrestricted
reserves
Reserves at fully
consolidated entities
Reserves at
associatesProfit for the
year
Effective
hedgesTotal
AT JANUARY 1, 2017 46,129 4,455 187,679 957,080 (3,796) 221,354 (34,756) 1,378,145
Profit for the period - - - - - 239,692 - 239,692
Fair value adjustments reserve (hedge) - - - - - - 6,267 6,267
Actuarial gains and losses - - - 948 - - - 948
Appropiation of 2016 profits 980 - 12,127 211,477 (3,230) (221,354) - -
Dividends distributed by the Parent Company - - (66,356) - - - - (66,356)
Dividends distributed by the subsidiaries - - 126,391 (126,391) - - - -
Business combinations (Jui Li Eds. Body System., Co.Ltd Group and Gestamp Palau, S.A) - - - (4,680) 4,680 - - -
Increase in shareholding in controlled companies - - - (1,143) - - - (1,143)
Decrease in shareholding - - 480 - - - - 480
Interest from participative loans - - 11,878 (11,878) - - - -
Recognition of the Put Option sold to non-controlling interest (Note 22.d) - - - (4,047) - - - (4,047)
Other movements and adjustments from prior years - (2,062) - - - (2,062)
AT DECEMBER 31, 2017 47,109 4,455 272,199 1,019,304 (2,346) 239,692 (28,489) 1,551,924
Legal reserveGoodwill
reservesUnrestricted
reserves
Reserves at fully
consolidated entities
Reserves at
associatesProfit for the
year
Effective
hedgesTotal
AT JANUARY 1, 2016 45,251 3,884 219,687 815,120 (3,508) 161,480 (32,125) 1,209,789
Profit for the period - - - - - 221,354 - 221,354
Fair value adjustments reserve (hedge) - - - - - - (2,631) (2,631)
Actuarial gains and losses - - - (5,415) - - - (5,415)
Appropiation of 2015 profits 878 571 7,480 152,915 (364) (161,480) - -
Dividends distributed by the Parent Company - - (48,444) - - - - (48,444)
Interest from participative loans - - 8,956 (8,956) - - - -
Acquisition of non-controlling interest in Gestamp 2008, S.L. (Note 2.b) - - - (263) - - - (263)
Transfer to non-controlling interest due to changes in shareholding of Gestamp 2008, S.L (Note 2.b) - - - (190) - - - (190)
Recognition of the Put Option sold to non-controlling interest (Note 22.d) - - - 4,047 - - - 4,047
Other movements and adjustments from prior years - - - (178) 76 - - (102)
AT DECEMBER 31, 2016 46,129 4,455 187,679 957,080 (3,796) 221,354 (34,756) 1,378,145
69
16.1 Legal reserve The Legal Reserve of the Parent Company amounted to 47,109 thousand euros at December 31, 2017 and to 46,129 thousand euros at December 31, 2016. The Parent Company is obliged to transfer 10% of profit for the year to a legal reserve until this reserve is equivalent to at least 20% of issued capital. This reserve is not distributable to shareholders and may only be used to offset losses if no other reserves are available. 16.2 Goodwill reserve The Parent Company is required to set aside a non-distributable reserve equal to the amount of goodwill on its balance sheet which was eliminated in the consolidation process and amounted to 3,805 thousand euros at December 31, 2017 (December 31, 2016: 7,610 thousand euros). The amount of the goodwill reserve amounted to 4,455 thousand euros at December 31, 2017 and at December 31, 2016.The amount provisioned in 2016 was 571 thousand euros. In 2017 no amount had been provisioned, being this reserve partially distributable in the amount exceeding the net book value of the goodwill at closing date. 16.3 Unrestricted reserves The most significant movements in the Parent Company’s unrestricted reserves as at December 31, 2017, apart from 2016 profit distribution, amount to 12,127 thousand euros (December 31, 2016: 7,480 thousand euros). These movements are included in the retained earnings detail shown above, and mainly correspond to:
• Dividend distribution by the Parent Company from unrestricted reserves on March 3, 2017, amounting 66,356 thousand euros (December 31, 2016: 48,444 thousand euros). The dividend is utterly paid at December 31, 2017.
• Dividend distribution by some subsidiaries from unrestricted reserves on December 21, 2017, amounting to 126,391 thousand euros. The dividends are utterly paid at December 31, 2017.
• On March 7, 2017 the Parent Company share capital is reduced in the nominal amount of 480 thousand euros by reducing the nominal value of each share in the amount of 0.10 euro. A non-distributable reserve was created for this purpose. This reserve is not distributable to shareholders and may only be used with the same requirements as a share capital reduction (Note 15.a).
• Reclassification of participative loan interests, from reserves at fully consolidated companies in the amount of 11,878 thousand euros (September 30, 2016: 8,956 thousand euros).
16.4 Availability of reserves at fully consolidated companies Reserves held by companies consolidated under the full consolidation method are subject to a number of restrictions as to their availability depending on whether they are legal reserves, revaluation reserves or other special reserves. The restrictions regarding the reserves mentioned above are the following: a) Revaluation reserve. Regional Law 6/1996 update
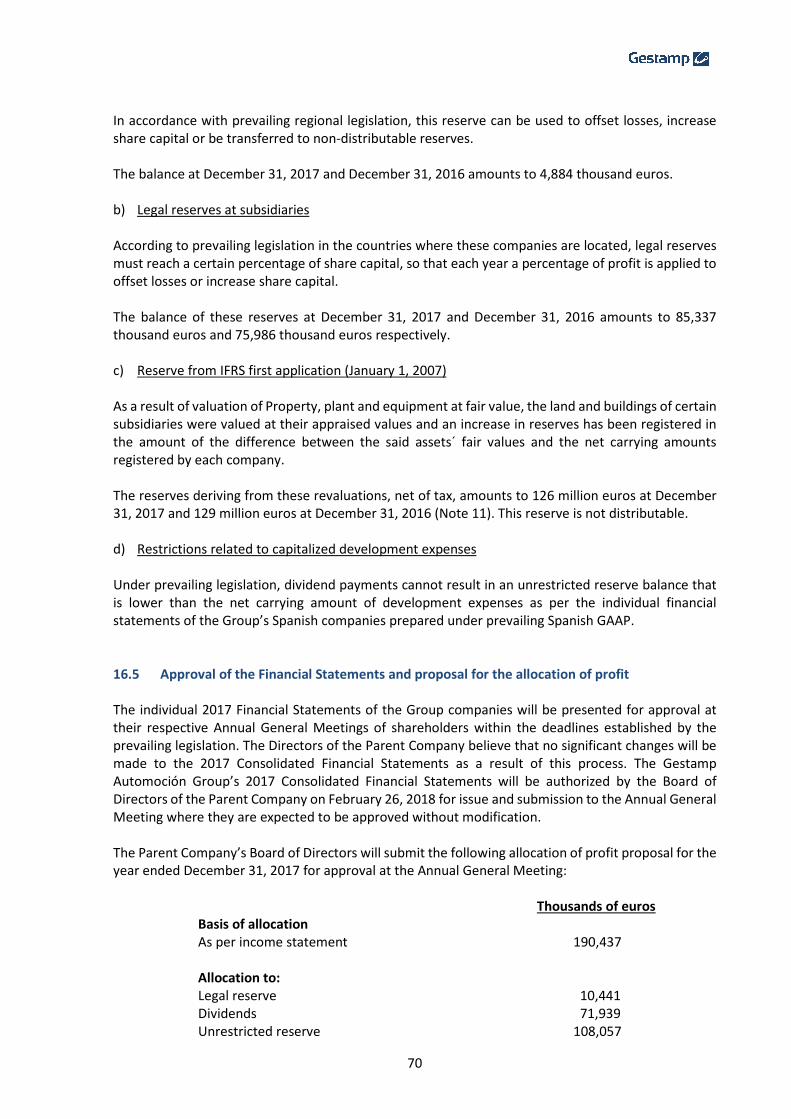
70
In accordance with prevailing regional legislation, this reserve can be used to offset losses, increase share capital or be transferred to non-distributable reserves. The balance at December 31, 2017 and December 31, 2016 amounts to 4,884 thousand euros. b) Legal reserves at subsidiaries
According to prevailing legislation in the countries where these companies are located, legal reserves must reach a certain percentage of share capital, so that each year a percentage of profit is applied to offset losses or increase share capital. The balance of these reserves at December 31, 2017 and December 31, 2016 amounts to 85,337 thousand euros and 75,986 thousand euros respectively. c) Reserve from IFRS first application (January 1, 2007)
As a result of valuation of Property, plant and equipment at fair value, the land and buildings of certain subsidiaries were valued at their appraised values and an increase in reserves has been registered in the amount of the difference between the said assets´ fair values and the net carrying amounts registered by each company. The reserves deriving from these revaluations, net of tax, amounts to 126 million euros at December 31, 2017 and 129 million euros at December 31, 2016 (Note 11). This reserve is not distributable. d) Restrictions related to capitalized development expenses Under prevailing legislation, dividend payments cannot result in an unrestricted reserve balance that is lower than the net carrying amount of development expenses as per the individual financial statements of the Group’s Spanish companies prepared under prevailing Spanish GAAP. 16.5 Approval of the Financial Statements and proposal for the allocation of profit The individual 2017 Financial Statements of the Group companies will be presented for approval at their respective Annual General Meetings of shareholders within the deadlines established by the prevailing legislation. The Directors of the Parent Company believe that no significant changes will be made to the 2017 Consolidated Financial Statements as a result of this process. The Gestamp Automoción Group’s 2017 Consolidated Financial Statements will be authorized by the Board of Directors of the Parent Company on February 26, 2018 for issue and submission to the Annual General Meeting where they are expected to be approved without modification. The Parent Company’s Board of Directors will submit the following allocation of profit proposal for the year ended December 31, 2017 for approval at the Annual General Meeting:
Thousands of euros Basis of allocation As per income statement 190,437 Allocation to: Legal reserve 10,441 Dividends 71,939 Unrestricted reserve 108,057
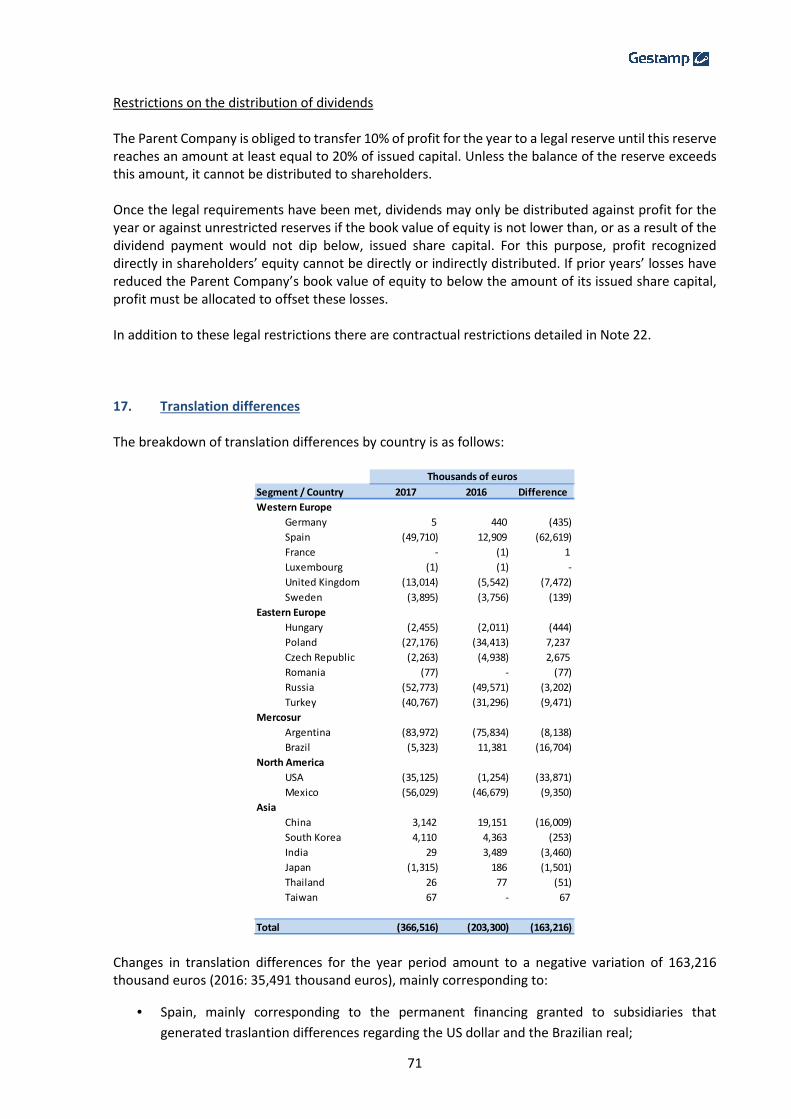
71
Restrictions on the distribution of dividends The Parent Company is obliged to transfer 10% of profit for the year to a legal reserve until this reserve reaches an amount at least equal to 20% of issued capital. Unless the balance of the reserve exceeds this amount, it cannot be distributed to shareholders. Once the legal requirements have been met, dividends may only be distributed against profit for the year or against unrestricted reserves if the book value of equity is not lower than, or as a result of the dividend payment would not dip below, issued share capital. For this purpose, profit recognized directly in shareholders’ equity cannot be directly or indirectly distributed. If prior years’ losses have reduced the Parent Company’s book value of equity to below the amount of its issued share capital, profit must be allocated to offset these losses. In addition to these legal restrictions there are contractual restrictions detailed in Note 22. 17. Translation differences The breakdown of translation differences by country is as follows:
Changes in translation differences for the year period amount to a negative variation of 163,216 thousand euros (2016: 35,491 thousand euros), mainly corresponding to:
• Spain, mainly corresponding to the permanent financing granted to subsidiaries that
generated traslantion differences regarding the US dollar and the Brazilian real;
Segment / Country 2017 2016 Difference
Western Europe
Germany 5 440 (435)
Spain (49,710) 12,909 (62,619)
France - (1) 1
Luxembourg (1) (1) -
United Kingdom (13,014) (5,542) (7,472)
Sweden (3,895) (3,756) (139)
Eastern Europe
Hungary (2,455) (2,011) (444)
Poland (27,176) (34,413) 7,237
Czech Republic (2,263) (4,938) 2,675
Romania (77) - (77)
Russia (52,773) (49,571) (3,202)
Turkey (40,767) (31,296) (9,471)
Mercosur
Argentina (83,972) (75,834) (8,138)
Brazil (5,323) 11,381 (16,704)
North America
USA (35,125) (1,254) (33,871)
Mexico (56,029) (46,679) (9,350)
Asia
China 3,142 19,151 (16,009)
South Korea 4,110 4,363 (253)
India 29 3,489 (3,460)
Japan (1,315) 186 (1,501)
Thailand 26 77 (51)
Taiwan 67 - 67
Total (366,516) (203,300) (163,216)
Thousands of euros
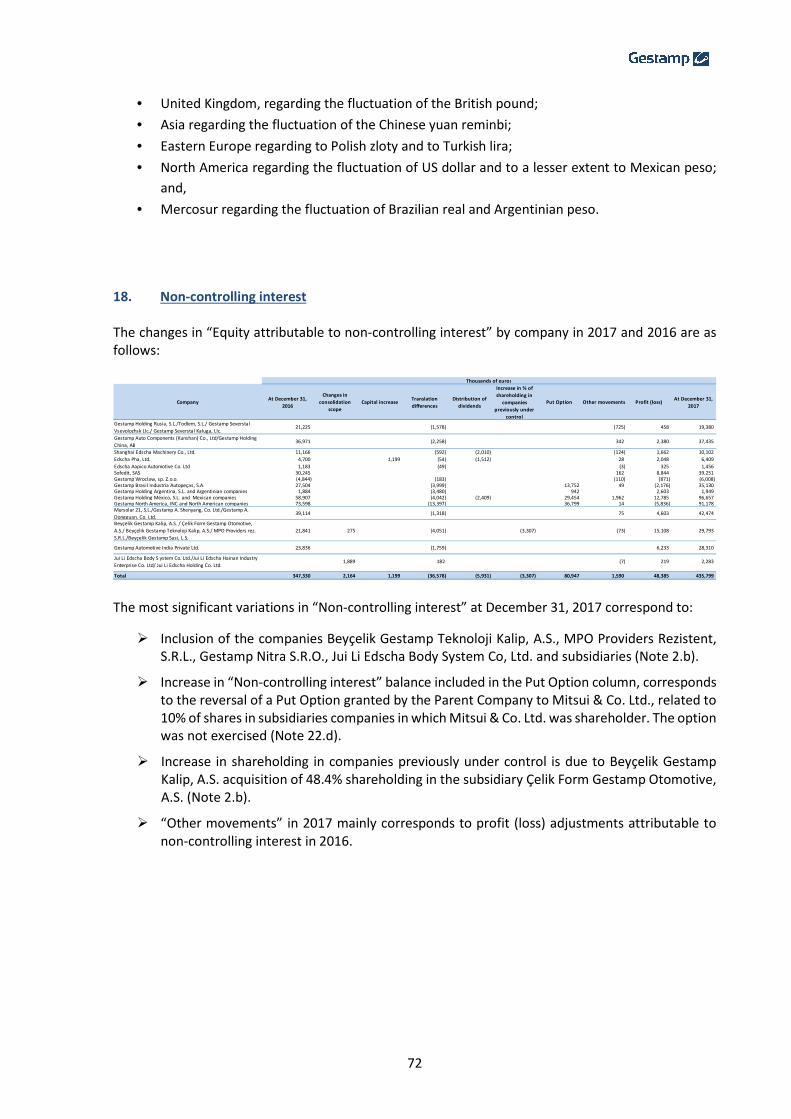
72
• United Kingdom, regarding the fluctuation of the British pound;
• Asia regarding the fluctuation of the Chinese yuan reminbi;
• Eastern Europe regarding to Polish zloty and to Turkish lira;
• North America regarding the fluctuation of US dollar and to a lesser extent to Mexican peso;
and,
• Mercosur regarding the fluctuation of Brazilian real and Argentinian peso.
18. Non-controlling interest The changes in “Equity attributable to non-controlling interest” by company in 2017 and 2016 are as follows:
The most significant variations in “Non-controlling interest” at December 31, 2017 correspond to:
� Inclusion of the companies Beyçelik Gestamp Teknoloji Kalip, A.S., MPO Providers Rezistent, S.R.L., Gestamp Nitra S.R.O., Jui Li Edscha Body System Co, Ltd. and subsidiaries (Note 2.b).
� Increase in “Non-controlling interest” balance included in the Put Option column, corresponds to the reversal of a Put Option granted by the Parent Company to Mitsui & Co. Ltd., related to 10% of shares in subsidiaries companies in which Mitsui & Co. Ltd. was shareholder. The option was not exercised (Note 22.d).
� Increase in shareholding in companies previously under control is due to Beyçelik Gestamp Kalip, A.S. acquisition of 48.4% shareholding in the subsidiary Çelik Form Gestamp Otomotive, A.S. (Note 2.b).
� “Other movements” in 2017 mainly corresponds to profit (loss) adjustments attributable to non-controlling interest in 2016.
CompanyAt December 31,
2016
Changes in
consolidation
scope
Capital increaseTranslation
differences
Distribution of
dividends
Increase in % of
shareholding in
companies
previously under
control
Put Option Other movements Profit (loss)At December 31,
2017
Gestamp Holding Rusia, S.L./Todlem, S.L./ Gestamp Severstal
Vsevolozhsk Llc./ Gestamp Severstal Kaluga, Llc.21,225 - - (1,578) - - - (725) 458 19,380
Gestamp Auto Components (Kunshan) Co., Ltd/Gestamp Holding
China, AB36,971 - - (2,258) - - - 342 2,380 37,435
Shanghai Edscha Machinery Co., Ltd. 11,166 - - (592) (2,010) - - (124) 1,662 10,102
Edscha Pha, Ltd. 4,700 - 1,199 (54) (1,512) - - 28 2,048 6,409
Edscha Aapico Automotive Co. Ltd 1,183 - - (49) - - - (3) 325 1,456 Sofedit, SAS 30,245 - - - - - - 162 8,844 39,251 Gestamp Wroclaw, sp. Z.o.o. (4,844) - - (183) - - - (110) (871) (6,008)Gestamp Brasil Industria Autopeças, S.A. 27,504 - - (3,999) - - 13,752 49 (2,176) 35,130 Gestamp Holding Argentina, S.L. and Argentinian companies 1,884 - - (3,480) - - 942 - 2,603 1,949 Gestamp Holding México, S.L. and Mexican companies 58,907 - - (4,042) (2,409) - 29,454 1,962 12,785 96,657 Gestamp North America, INC and North American companies 73,598 - - (13,397) - - 36,799 14 (5,836) 91,178 Mursolar 21, S.L./Gestamp A. Shenyang, Co. Ltd./Gestamp A.
Dongguan, Co. Ltd.39,114 - - (1,318) - - - 75 4,603 42,474
Beyçelik Gestamp Kalip, A.S. / Çelik Form Gestamp Otomotive,
A.S./ Beyçelik Gestamp Teknoloji Kalip, A.S./ MPO Providers rez.
S.R.L./Beyçelik Gestamp Sasi, L.S.
21,841 275 - (4,051) - (3,307) - (73) 15,108 29,793
Gestamp Automotive India Private Ltd. 23,836 - - (1,759) - - - - 6,233 28,310
Jui Li Edscha Body S ystem Co. Ltd./Jui Li Edscha Hainan Industry
Enterprise Co. Ltd/ Jui Li Edscha Holding Co. Ltd.1,889 - 182 - - - (7) 219 2,283
Total 347,330 2,164 1,199 (36,578) (5,931) (3,307) 80,947 1,590 48,385 435,799
Thousands of euros

73
The most significant variation in “Non-controlling interest” at December 31, 2016 corresponded to:
� Incorporation of the company Çelik Form Gestamp Otomotive, A.S. and exit from consolidation scope of the company G Finance Luxemburgo, S.A. (Note 2.b).
� Increase in shareholding in Gestamp 2008 S.L. Since there was already prior control in this company, there was a direct decrease in non-controlling interest of 6,119 thousand euros and an indirect increase due to the investments of this company in other group companies of 190 thousand euros (Note 2.b).
� Decrease in “Non-controlling interest” included in the Put Option Colum, corresponds to the Put Option granted by the Parent Company to Mitsui & Co. Ltd., issued on December 23, 2016, in relation to 10% of shares in subsidiary companies (Note 22.d).
� “Other movements” in 2016 corresponds to profit (loss) adjustments attributable to non-controlling interests in 2015.
The most significant non-controlling interest mentioned in this Note has protecting rights mainly related to significant decisions on divestments of fixed assets, company restructuring, granting of guarantees, distribution of dividends and changes in statutes. These protecting rights do not significantly restrict the Group capacity to access to or to use their assets as well as to liquidate their liabilities. Financial information about subsidiaries that have significant non-controlling interests is provided below and has been elaborated following the criteria as follows:
• Based on the individual financial statements of each subgroup, except for USA, Argentina, Mexico and Brazil which information had been based on their Consolidated Financial Statements.
• The formentioned financial statements are adapted to Group criteria.
• Intercompany eliminations from Gestamp Autoción Group consolidation process are not included.
• Other consolidation adjustments from Gestamp Automoción Group are detailed in an aditional line.
Summarised income statement at December 31, 2017 and December 31, 2016:
CompanyAt December 31,
2015
Changes in
consolidation
scope
Capital increaseTranslation
differences
Distribution of
dividends
Increase in % of
shareholding in
companies
previously under
control
Put Option Other movements Profit (loss)At December 31,
2016
G Finance Luxemburgo, S.A. 51 (51) - - - - - - - -
Gestamp Holding Rusia, S.L./Todlem, S.L./ Gestamp Severstal
Vsevolozhsk Llc./ Gestamp Severstal Kaluga, Llc.11,848 - - 3,702 - - - (427) 6,102 21,225
Gestamp Auto Components (Kunshan) Co., Ltd/Gestamp Holding
China, AB33,821 - - (1,215) - - - 1,687 2,678 36,971
Gestamp 2008, S.L. 6,119 - - - - (6,119) - - - -
Edscha Briey S.A.S. (11,053) - - - - 11,053 - - - -
Edscha Santander, S.L. 13,466 - - - - (13,466) - - - -
Edscha Burgos, S.A. (1,334) - - - - 1,334 - - - -
Edscha do Brasil Ltda. (1,079) - - (190) - 1,269 - - - -
Shanghai Edscha Machinery Co., Ltd. 12,603 - - (475) (2,169) - - - 1,207 11,166
Edscha Pha, Ltd. 2,773 - - 43 - - - 253 1,631 4,700
Edscha Aapico Automotive Co. Ltd 825 - 151 42 (168) - - 80 253 1,183
Gestamp Global Tooling, S.L. 11 - - - - - - - (11) -Sofedit, SAS 21,722 - - - - - - (857) 9,380 30,245 Gestamp Wroclaw, sp. Z.o.o. (478) - - 2 - - - - (4,368) (4,844)Gestamp Brasil Industria Autopeças, S.A. 35,242 - - 6,162 - - (13,752) 495 (643) 27,504 Gestamp Holding Argentina, S.L. and Argentinian companies 6,155 - - (2,199) - - (942) (197) (933) 1,884 Gestamp Holding México, S.L. and Mexican companies 96,135 - - (5,564) (6,210) - (29,454) (69) 4,069 58,907 Gestamp North America, INC and North American companies 105,911 - - 3,683 - - (36,799) (1) 804 73,598 Mursolar 21, S.L./Gestamp A. Shenyang, Co. Ltd./Gestamp A.
Dongguan, Co. Ltd.37,526 - - (580) - - - (1,189) 3,357 39,114
Beyçelik Gestamp Kalip, A.S. / Çelik Form Gestamp Otomotive,
A.S./Beyçelik Gestamp Sasi, L.S.19,388 (2,748) - (3,082) - - 574 7,709 21,841
Gestamp Automotive India Private Ltd. 16,933 - - 351 - - - - 6,552 23,836
Total 406,585 (2,799) 151 680 (8,547) (5,929) (80,947) 349 37,787 347,330
Thousands of euros

74
Summarised balance sheet at December 31, 2017 and December 31, 2016:
Summarized cash flow at December 31, 2017 and December 31, 2016:
Item USA SubgroupArgentina
SubgroupMexico Subgroup Brazil Subgroup Beyçelik, A.S.
Gestamp Holding
China SubgroupMursolar Subgroup Todlem Subgroup Total
Operating income 973,550 219,098 478,651 305,299 384,534 189,619 211,548 101,482 2,863,781
Operating expense (990,994) (200,330) (420,228) (288,423) (339,016) (181,801) (193,323) (89,192) (2,703,307)
Operating profit (17,444) 18,768 58,423 16,876 45,518 7,818 18,225 12,290 160,474
Financial profit (19,659) (2,098) 802 (18,164) (3,036) (32) (2,762) (6,185) (51,134)
Exchange gain (losses) (2,383) (874) 6,292 (6,638) (10,930) (1,275) 2,287 (3,398) (16,919)
Impairment and other - - 6 619 - - - - 625
Profit before taxes (39,486) 15,796 65,523 (7,307) 31,552 6,511 17,750 2,707 93,046
Income tax expense 24,507 (6,537) (14,615) 833 (3,322) (1,171) (1,287) (189) (1,781)
Non-controlling interest - (625) - - - - - - (625)
Profit attributable to parent company (14,979) 8,634 50,908 (6,474) 28,230 5,340 16,463 2,518 90,640
30% 30% 30% 30% 50% 31.05% 35.00% 41.87% -
Gain (Loss) attributable to non-controlling interest (4,494) 2,590 15,272 (1,942) 14,115 1,658 5,762 1,054 34,015
Consolidation adjustments (1,342) 13 (2,487) (234) (586) 722 (1,159) (593) (5,666)
Non-controlling interest profit (5,836) 2,603 12,785 (2,176) 13,529 2,380 4,603 461 28,349
Other subgroup non-controlling interest - - - - 1,579 - - (3) 1,576
Onther non-significative non-controlling interest 18,460
Total Gain (Loss) attributable to non-controlling interest (5,836) 2,603 12,785 (2,176) 15,108 2,380 4,603 458 48,385
2017
Item USA SubgroupArgentina
SubgroupMexico Subgroup Brazil Subgroup Beyçelik, A.S.
Gestamp Holding
China SubgroupMursolar Subgroup Todlem Subgroup Total
Operating income 1,086,896 156,838 407,146 220,570 286,509 206,359 195,671 94,996 2,654,985
Operating expense (1,066,058) (152,321) (362,370) (219,608) (261,956) (191,562) (174,081) (84,627) (2,512,583)
Operating profit 20,838 4,517 44,776 962 24,553 14,797 21,590 10,369 142,402
Financial profit (9,194) (3,247) 857 (17,745) (3,089) (248) (3,567) (7,687) (43,920)
Exchange gain (losses) 631 (2,234) (24,507) 14,394 (9,461) (1,759) (6,875) 16,391 (13,420)
Impairment and other - - (40) (170) - - - - (210)
Profit before taxes 12,275 (964) 21,086 (2,559) 12,003 12,790 11,148 19,073 84,852
Income tax expense (8,283) (737) (7,706) 1,892 (802) (4,171) (1,198) (4,832) (25,837)
Non-controlling interest - 158 - - - - - - 158
Profit attributable to parent company 3,992 (1,543) 13,380 (667) 11,201 8,619 9,950 14,241 59,173
30% 30% 30% 30% 50% 31.05% 35.00% 41.87% -
Gain (Loss) attributable to non-controlling interest 1,198 (463) 4,014 (200) 5,601 2,676 3,483 5,963 22,272
Consolidation adjustments (394) (470) 55 (443) 556 2 (126) 141 (679)
Non-controlling interest profit 804 (933) 4,069 (643) 6,157 2,678 3,357 6,104 21,593
Other subgroup non-controlling interest - - - - 1,552 - - (2) 1,550
Onther non-significative non-controlling interest 14,644
Total Gain (Loss) attributable to non-controlling interest 804 (933) 4,069 (643) 7,709 2,678 3,357 6,102 37,787
2016
Item USA SubgroupArgentina
SubgroupMexico Subgroup Brazil Subgroup Beyçelik, A.S.
Gestamp Holding
China SubgroupMursolar Subgroup Todlem Subgroup Total
Total non-current assets 603,798 31,645 276,292 237,421 79,946 70,086 138,481 86,912 1,524,581
Total current assets 458,825 100,960 308,259 110,898 96,731 99,492 2,982 37,919 1,216,066
Total non-current liabilities (158,468) (4,329) (14,496) (31,537) (21,696) (128) (7,841) (50,838) (289,333)
Total current liabilities (583,327) (107,394) (311,055) (217,717) (87,237) (51,078) (12,593) (19,862) (1,390,263)
Equity (302,740) (91,742) (332,356) (107,143) (94,891) (112,609) (121,029) (95,698) (1,258,208)
Translation differences (18,088) 70,860 73,356 8,078 27,147 (5,763) - 41,567 197,157 30% 30% 30% 30% 50% 31.05% 35% 42% -
Equity attributable to non-controlling interest (96,248) (6,265) (77,700) (29,720) (33,872) (36,755) (42,360) (22,665) (345,585)
Consolidation adjustments 5,070 4,316 (18,957) (5,410) 4,079 (680) (114) 3,285 (8,411)
Non-controlling interest (91,178) (1,949) (96,657) (35,130) (29,793) (37,435) (42,474) (19,380) (353,996)
Other not signitificative non-controlling interest - - - - - - - - (81,803)
Total Non-controlling interest (435,799)
2017
Item USA SubgroupArgentina
SubgroupMexico Subgroup Brazil Subgroup Beyçelik, A.S.
Gestamp Holding
China SubgroupMursolar Subgroup Todlem Subgroup Total
Total non-current assets 530,028 40,610 239,320 263,902 74,381 79,383 144,066 98,740 1,470,430
Total current assets 431,960 88,209 256,075 101,982 100,108 142,737 3,324 55,676 1,180,071
Total non-current liabilities (195,531) (6,204) (19,124) (98,260) (30,585) (5) (12,042) (79,160) (440,911)
Total current liabilities (382,077) (99,395) (246,450) (147,992) (86,262) (102,924) (14,254) (20,399) (1,099,753)
Equity (321,634) (83,255) (288,593) (113,620) (79,039) (106,152) (121,094) (92,656) (1,206,043)
Translation differences (62,746) 60,035 58,772 (6,012) 21,397 (13,039) - 37,799 96,206 30% 30% 30% 30% 50% 31.05% 35% 42% -
Equity attributable to non-controlling interest (115,314) (6,966) (68,946) (35,890) (28,821) (37,009) (42,383) (22,969) (358,298)
Consolidation adjustments 4,917 4,140 (19,415) (5,366) 6,980 38 3,269 1,744 (3,693)
Put Option (36,799) (942) (29,454) (13,752) - - - - (80,947)
Non-controlling interest (73,598) (1,884) (58,907) (27,504) (21,841) (36,971) (39,114) (21,225) (281,044)
Other not signitificative non-controlling interest - - - - - - - - (66,286)
Total Non-controlling interest (347,330)
2016
Item USA SubgroupArgentina
SubgroupMexico Subgroup Brazil Subgroup Beyçelik, A.S
Gestamp Holding
China SubgroupMursolar Subgroup Todlem Subgroup
Operating activities 13,417 22,761 53,870 37,766 48,008 23,284 (20) 24,687
Investing activities (202,559) (2,497) (96,631) (17,334) (22,061) (10,644) 9,664 (1,283)
Financing activities 248,882 (10,447) 55,793 (15,217) (14,562) (40,835) (9,644) (37,928)
Net increase (decrease) of cash or
cash equivalents59,740 9,817 13,032 5,215 11,385 (28,195) - (14,524)
2017

75
19. Deferred income Deferred income includes grants relating to assets obtained by Group subsidiaries, pending release to the Consolidated Income Statement. The variation in this heading as at December 31, 2017 and December 31, 2016 is as follows:
Grants received correspond to grants from public authorities for investments in plant and equipment and job-creation incentives. The Group companies are able to meet all the requirements attaching to these grants to qualify as non-reimbursable grants. Grants to be released to income next year are expected to be similar to the present year. 20. Provisions and contingent liabilities The breakdown of provisions by concept in 2017 and 2016 is as follows:
The changes in provisions during 2017 and 2016 are as follows:
Item USA SubgroupArgentina
SubgroupMexico Subgroup Brazil Subgroup Beyçelik, A.S
Gestamp Holding
China SubgroupMursolar Subgroup Todlem Subgroup
Operating activities 57,421 7,350 25,749 28,204 26,842 32,393 (53) 31,901
Investing activities (97,726) (3,718) (74,582) (43,030) (17,337) (20,805) (66,005) (1,398)
Financing activities 126,474 (8,356) 52,435 26,844 (5,352) (24,334) (820) (1,431)
Net increase (decrease) of cash or
cash equivalents86,169 (4,724) 3,602 12,018 4,153 (12,746) (66,878) 29,072
2016
Thousands of euros
Balance at December 31, 2015 30,720
Grants received during the period 2,264
Grants disposals during the period (529)
Released income during the period (Note 25.b) (6,218)
Translation differences (905)
Other movements 613
Balance at December 31, 2016 25,945
Grants received during the period 1,760
Grants disposals during the period (227)
Released income during the period (Note 25.b) (4,918)
Translation differences (261)
Other movements 16
Balance at December 31, 2017 22,315
2017 2016 2017 2016 2017 2016
Provision for employee compensation (Note 21) 100,984 91,642 625 1,904 101,609 93,546
Provision for taxes 7,848 7,252 - - 7,848 7,252
Provision for other responsibilities 34,212 55,259 11,098 16,168 45,310 71,427
143,044 154,153 11,723 18,072 154,767 172,225
Thousands of euros
TotalNon-current Current
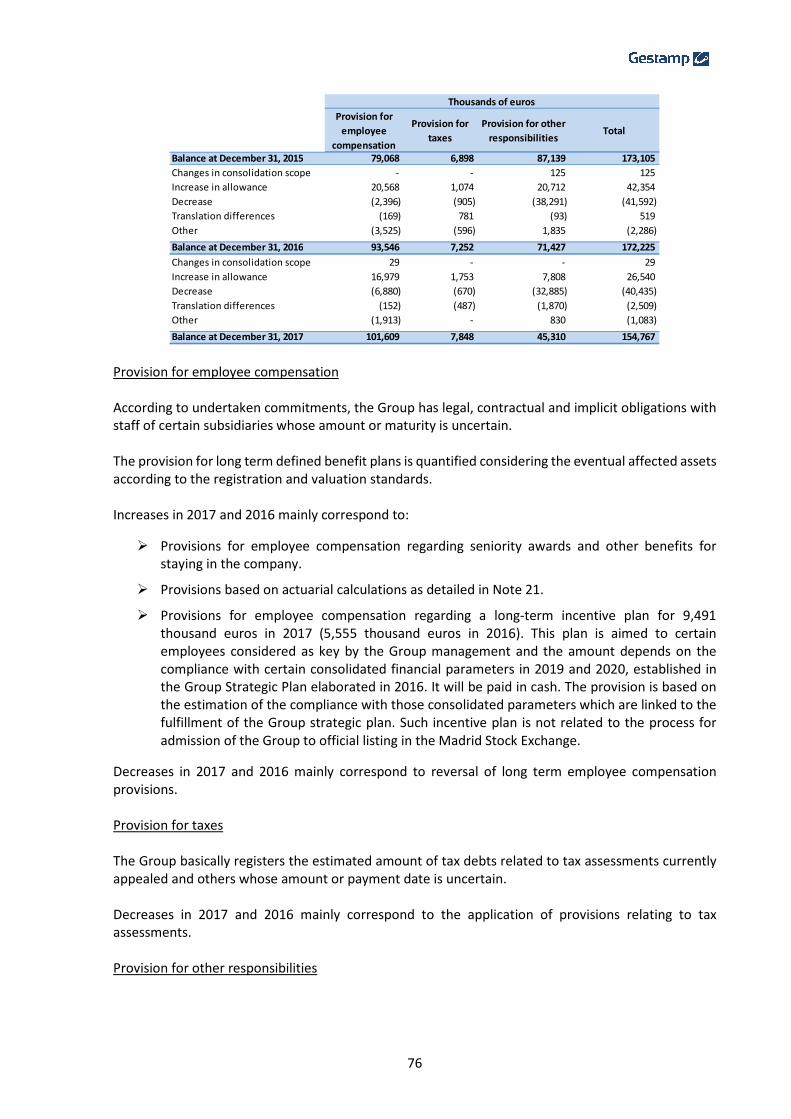
76
Provision for employee compensation According to undertaken commitments, the Group has legal, contractual and implicit obligations with staff of certain subsidiaries whose amount or maturity is uncertain. The provision for long term defined benefit plans is quantified considering the eventual affected assets according to the registration and valuation standards. Increases in 2017 and 2016 mainly correspond to:
� Provisions for employee compensation regarding seniority awards and other benefits for staying in the company.
� Provisions based on actuarial calculations as detailed in Note 21.
� Provisions for employee compensation regarding a long-term incentive plan for 9,491 thousand euros in 2017 (5,555 thousand euros in 2016). This plan is aimed to certain employees considered as key by the Group management and the amount depends on the compliance with certain consolidated financial parameters in 2019 and 2020, established in the Group Strategic Plan elaborated in 2016. It will be paid in cash. The provision is based on the estimation of the compliance with those consolidated parameters which are linked to the fulfillment of the Group strategic plan. Such incentive plan is not related to the process for admission of the Group to official listing in the Madrid Stock Exchange.
Decreases in 2017 and 2016 mainly correspond to reversal of long term employee compensation provisions. Provision for taxes The Group basically registers the estimated amount of tax debts related to tax assessments currently appealed and others whose amount or payment date is uncertain. Decreases in 2017 and 2016 mainly correspond to the application of provisions relating to tax assessments. Provision for other responsibilities
Provision for
employee
compensation
Provision for
taxes
Provision for other
responsibilitiesTotal
Balance at December 31, 2015 79,068 6,898 87,139 173,105
Changes in consolidation scope - - 125 125
Increase in allowance 20,568 1,074 20,712 42,354
Decrease (2,396) (905) (38,291) (41,592)
Translation differences (169) 781 (93) 519
Other (3,525) (596) 1,835 (2,286)
Balance at December 31, 2016 93,546 7,252 71,427 172,225
Changes in consolidation scope 29 - - 29
Increase in allowance 16,979 1,753 7,808 26,540
Decrease (6,880) (670) (32,885) (40,435)
Translation differences (152) (487) (1,870) (2,509)
Other (1,913) - 830 (1,083)
Balance at December 31, 2017 101,609 7,848 45,310 154,767
Thousands of euros

77
This line item primarily reflects provisions recognized by certain Group companies to cover specific risks arising from their day-to-day businesses and provisions for personnel restructuring and onerous contracts in 2016. In 2016, a provision for the amount 5,309 thousand euros was made with the purpose of reestablishing the financial position of the company Gestamp Palau S.A., included in the consolidation scope by equity method (Note 12.a.1). In 2017, with the integration of the company Gestamp Palau, S.A. in the consolidation scope as fully consolidated (Note 2.b), this provision was reversed. Decreases in 2016 correspond to the reversal of provisions for onerous contracts from Gestamp Vendas Novas Lda., company belonging to Western Europe segment. This reversal was registered in the heading “Other operating expenses” for the amount of 2,090 thousand euros (Note 26.c). In 2016 a reversal for the amount of 26,850 thousand euros was made as a result of risk revaluation in a provision from 2015 for risks on commercial activity. The provision was related to operating expenses valuated on 50,000 thousand euros that were registered as consumables and other operating expenses. This line item also includes provisions for risks related to personnel restructuring, commercial disputes and claims from suppliers. In 2017, and as a result of the obtainment of new information, the Group made a reversal of 13,640 thousand euros from exceeded provisions. Other decreases in provisions are mainly related to operational expenses and trade operations provisions applications from different Group subsidiaries. The Group Management considers that provisions registered in the Consolidated Balance Sheet duly cover the risks for litigations, arbitration and other contingencies, and no additional related liabilities are expected. As at December 31, 2017 and December 31, 2016 there are no significant contingent liabilities. 21. Pensions and other post-employment obligations The breakdown of the provision for employee benefits is as follows:
a) Employee benefits This line item includes provisions by some Group companies for seniority awards and other benefits for staying in the company (anniversary, retirement, awards, etc.). b) Defined benefit plans
Item 2017 2016 2017 2016 2017 2016
Employee benefits a) 21,515 14,114 625 1,904 22,140 16,018
Post-employment benefits
Defined benefit plans b) 79,469 77,528 - - 79,469 77,528
Total (Note 20) 100,984 91,642 625 1,904 101,609 93,546
TotalNon-current Current

78
The Group has a number of defined benefit plans. The main defined benefit plans are located in Germany and France. Among these pension plans, some are partially funded by investment funds and some are not funded at all by investment funds. The risks of the different defined benefit plans are those associated with pensions not funded by an external fund. Other risks of the defined benefit plans common to partially funded plans as well as to unfunded plans are those related to demographic issues, such as mortality and longevity of employees, and those related to financial issues such as pension increase rate depending on inflation. Assets and liabilities corresponding to the said plans at December 31, 2017 and December 31, 2016, by countries, are the following:
The changes in present value of plan liabilities are the following:
Item Germany France Total
Present value of the defined benefit obligation 76,162 9,775 85,937
Fair value of plan assets and reimbursement rights (4,575) (1,893) (6,468)
Value of defined benefit obligation at December 31, 2017 71,587 7,882 79,469
Thousand of euros
Item Germany France Total
Present value of the defined benefit obligation 74,551 9,648 84,199
Fair value of plan assets and reimbursement rights (4,516) (2,155) (6,671)
Value of defined benefit obligation at December 31, 2016 70,035 7,493 77,528
Thousand of euros
Germany France Total
Present value of the defined benefit obligation at December 31, 2015 66,573 8,846 75,419
Current service cost year 2016 2,929 552 3,481
Interest income or expense - 44 44
Interest income or expense 1,420 175 1,595
Pension cost charged to profit and loss at 2016 4,349 771 5,120
Payments from the plan except any settlements (1,392) (173) (1,565)
Payments from plan settlements - - -
Actuarial gains and losses arising from changes in demographic assumptions - (66) (66)
Actuarial gains and losses arising from changes in financial assumptions 5,021 655 5,676
Actuarial gains and losses attributable to non-controlling interests - (229) (229)
Remeasurements of the net defined benefit liability 5,021 360 5,381 (*)
Other effects - (156) (156)
Present value of the defined benefit obligation at December 31, 2016 74,551 9,648 84,199
Current service cost year 2017 3,261 605 3,866
Gains and losses arising from settlements - 6 6
Interest income or expense 1,172 144 1,316
Pension cost charged to profit and loss at 2016 4,433 755 5,188
Payments from the plan except any settlements (2,099) (366) (2,465)
Payments from plan settlements - - -
Actuarial gains and losses arising from changes in demographic assumptions - (607) (607)
Actuarial gains and losses arising from changes in financial assumptions (660) 130 (530)
Actuarial gains and losses attributable to non-controlling interests - 167 167
Remeasurements of the net defined benefit liability (660) (310) (970) (**)
Other effects (63) 48 (15)
Present value of the defined benefit obligation at December 31, 2017 76,162 9,775 85,937
Thousand of euros
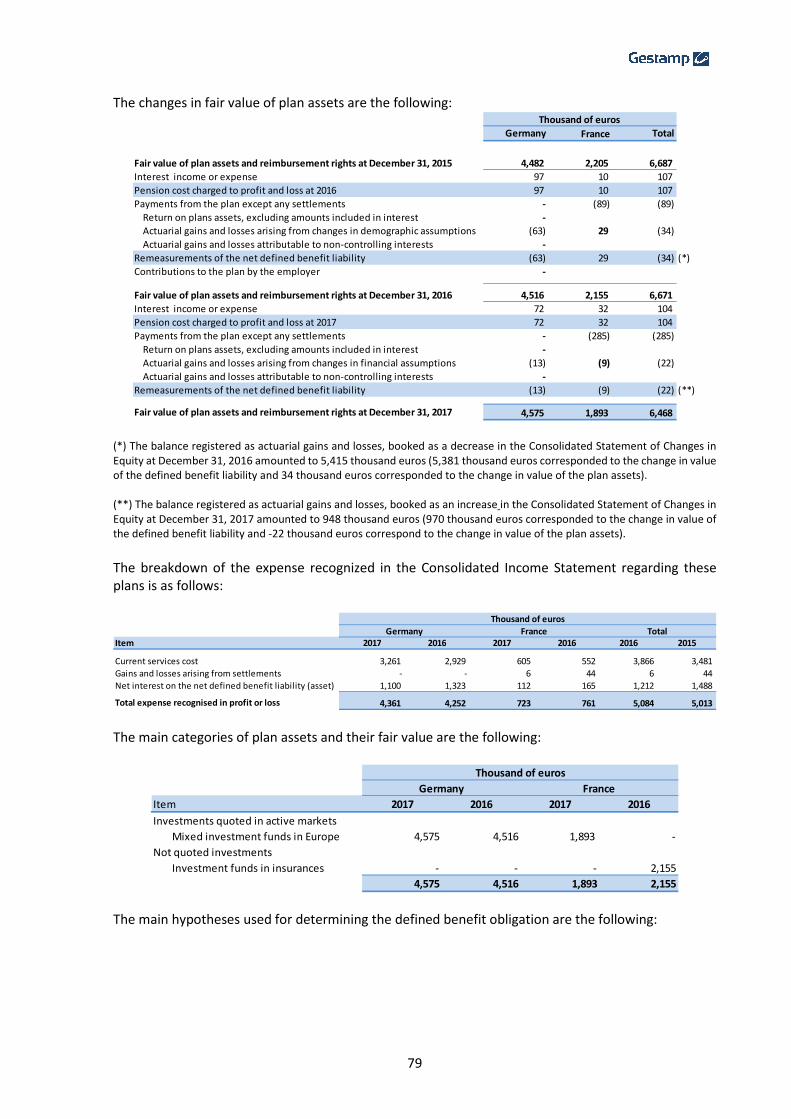
79
The changes in fair value of plan assets are the following:
(*) The balance registered as actuarial gains and losses, booked as a decrease in the Consolidated Statement of Changes in Equity at December 31, 2016 amounted to 5,415 thousand euros (5,381 thousand euros corresponded to the change in value of the defined benefit liability and 34 thousand euros corresponded to the change in value of the plan assets). (**) The balance registered as actuarial gains and losses, booked as an increase in the Consolidated Statement of Changes in Equity at December 31, 2017 amounted to 948 thousand euros (970 thousand euros corresponded to the change in value of the defined benefit liability and -22 thousand euros correspond to the change in value of the plan assets).
The breakdown of the expense recognized in the Consolidated Income Statement regarding these plans is as follows:
The main categories of plan assets and their fair value are the following:
The main hypotheses used for determining the defined benefit obligation are the following:
Germany France Total
Fair value of plan assets and reimbursement rights at December 31, 2015 4,482 2,205 6,687
Interest income or expense 97 10 107
Pension cost charged to profit and loss at 2016 97 10 107
Payments from the plan except any settlements - (89) (89)
Return on plans assets, excluding amounts included in interest - - -
Actuarial gains and losses arising from changes in demographic assumptions (63) 29 (34)
Actuarial gains and losses attributable to non-controlling interests - - -
Remeasurements of the net defined benefit liability (63) 29 (34) (*)
Contributions to the plan by the employer - - -
Fair value of plan assets and reimbursement rights at December 31, 2016 4,516 2,155 6,671
Interest income or expense 72 32 104
Pension cost charged to profit and loss at 2017 72 32 104
Payments from the plan except any settlements - (285) (285)
Return on plans assets, excluding amounts included in interest - - -
Actuarial gains and losses arising from changes in financial assumptions (13) (9) (22)
Actuarial gains and losses attributable to non-controlling interests - - -
Remeasurements of the net defined benefit liability (13) (9) (22) (**)
Fair value of plan assets and reimbursement rights at December 31, 2017 4,575 1,893 6,468
Thousand of euros
Item 2017 2016 2017 2016 2016 2015
Current services cost 3,261 2,929 605 552 3,866 3,481
Gains and losses arising from settlements - - 6 44 6 44
Net interest on the net defined benefit liability (asset) 1,100 1,323 112 165 1,212 1,488
Total expense recognised in profit or loss 4,361 4,252 723 761 5,084 5,013
Thousand of euros
TotalFranceGermany
Item 2017 2016 2017 2016
Investments quoted in active markets
Mixed investment funds in Europe 4,575 4,516 1,893 -
Not quoted investments
Investment funds in insurances - - - 2,155
4,575 4,516 1,893 2,155
Thousand of euros
Germany France
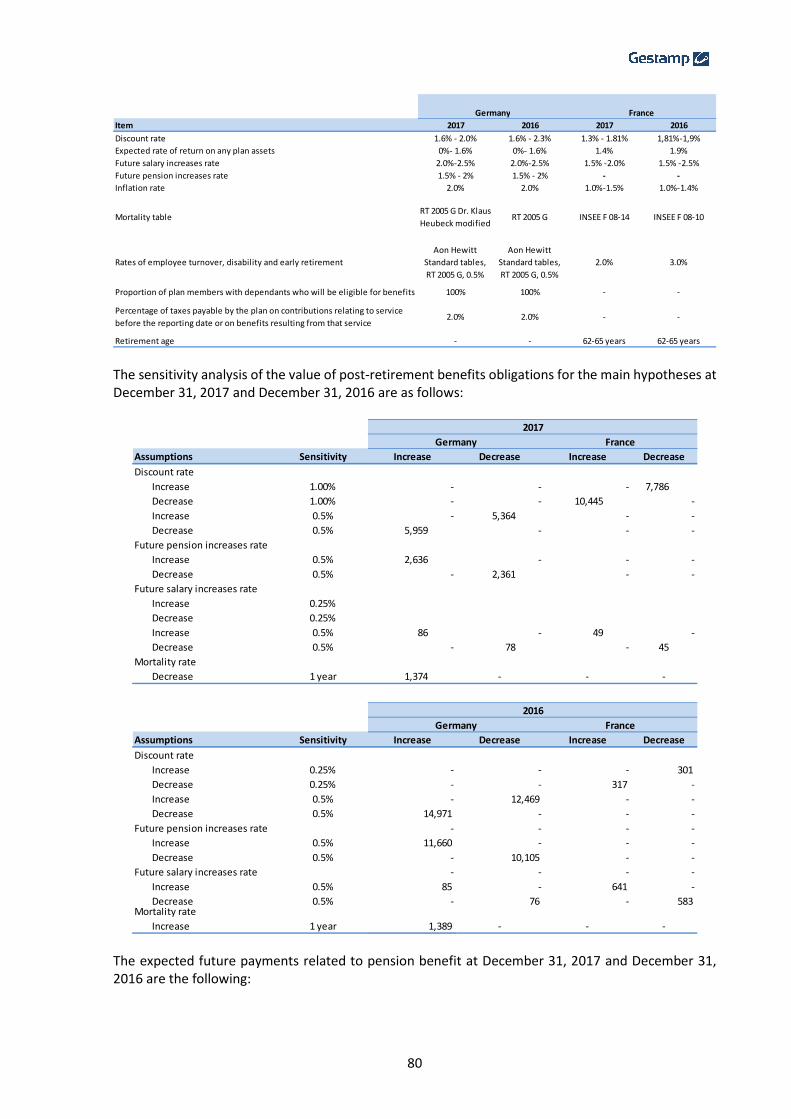
80
The sensitivity analysis of the value of post-retirement benefits obligations for the main hypotheses at December 31, 2017 and December 31, 2016 are as follows:
The expected future payments related to pension benefit at December 31, 2017 and December 31, 2016 are the following:
Item 2017 2016 2017 2016
Discount rate 1.6% - 2.0% 1.6% - 2.3% 1.3% - 1.81% 1,81%-1,9%
Expected rate of return on any plan assets 0%- 1.6% 0%- 1.6% 1.4% 1.9%
Future salary increases rate 2.0%-2.5% 2.0%-2.5% 1.5% -2.0% 1.5% -2.5%
Future pension increases rate 1.5% - 2% 1.5% - 2% - -
Inflation rate 2.0% 2.0% 1.0%-1.5% 1.0%-1.4%
Mortality tableRT 2005 G Dr. Klaus
Heubeck modified RT 2005 G INSEE F 08-14 INSEE F 08-10
Rates of employee turnover, disability and early retirement
Aon Hewitt
Standard tables,
RT 2005 G, 0.5%
Aon Hewitt
Standard tables,
RT 2005 G, 0.5%
2.0% 3.0%
Proportion of plan members with dependants who will be eligible for benefits 100% 100% - -
Percentage of taxes payable by the plan on contributions relating to service
before the reporting date or on benefits resulting from that service2.0% 2.0% - -
Retirement age - - 62-65 years 62-65 years
FranceGermany
Assumptions Sensitivity Increase Decrease Increase Decrease
Discount rate
Increase 1.00% - - - 7,786
Decrease 1.00% - - 10,445 -
Increase 0.5% - 5,364 - -
Decrease 0.5% 5,959 - - -
Future pension increases rate
Increase 0.5% 2,636 - - -
Decrease 0.5% - 2,361 - -
Future salary increases rate
Increase 0.25%
Decrease 0.25%
Increase 0.5% 86 - 49 -
Decrease 0.5% - 78 - 45
Mortality rate
Decrease 1 year 1,374 - - -
2017
Germany France
Assumptions Sensitivity Increase Decrease Increase Decrease
Discount rate
Increase 0.25% - - - 301
Decrease 0.25% - - 317 -
Increase 0.5% - 12,469 - -
Decrease 0.5% 14,971 - - -
Future pension increases rate - - - -
Increase 0.5% 11,660 - - -
Decrease 0.5% - 10,105 - -
Future salary increases rate - - - -
Increase 0.5% 85 - 641 -
Decrease 0.5% - 76 - 583 Mortality rate
Increase 1 year 1,389 - - -
2016
Germany France
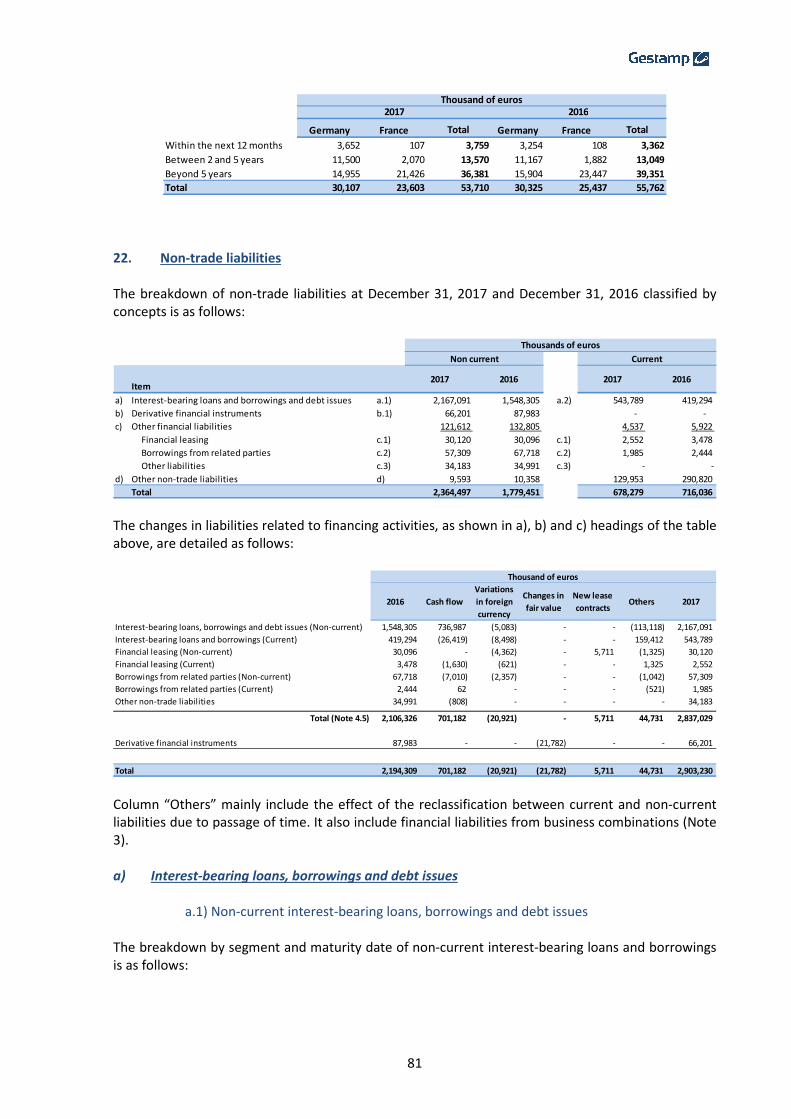
81
22. Non-trade liabilities The breakdown of non-trade liabilities at December 31, 2017 and December 31, 2016 classified by concepts is as follows:
The changes in liabilities related to financing activities, as shown in a), b) and c) headings of the table above, are detailed as follows:
Column “Others” mainly include the effect of the reclassification between current and non-current liabilities due to passage of time. It also include financial liabilities from business combinations (Note 3). a) Interest-bearing loans, borrowings and debt issues
a.1) Non-current interest-bearing loans, borrowings and debt issues
The breakdown by segment and maturity date of non-current interest-bearing loans and borrowings is as follows:
Germany France Total Germany France Total
Within the next 12 months 3,652 107 3,759 3,254 108 3,362
Between 2 and 5 years 11,500 2,070 13,570 11,167 1,882 13,049
Beyond 5 years 14,955 21,426 36,381 15,904 23,447 39,351
Total 30,107 23,603 53,710 30,325 25,437 55,762
Thousand of euros2017 2016
Item
a) Interest-bearing loans and borrowings and debt issues a.1) 2,167,091 1,548,305 a.2) 543,789 419,294
b) Derivative financial instruments b.1) 66,201 87,983 - -
c) Other financial liabilities 121,612 132,805 4,537 5,922
Financial leasing c.1) 30,120 30,096 c.1) 2,552 3,478
Borrowings from related parties c.2) 57,309 67,718 c.2) 1,985 2,444
Other liabilities c.3) 34,183 34,991 c.3) - -
d) Other non-trade liabilities d) 9,593 10,358 129,953 290,820
Total 2,364,497 1,779,451 678,279 716,036
Thousands of euros
Non current Current
20162017 2016 2017
2016 Cash flow
Variations
in foreign
currency
Changes in
fair value
New lease
contractsOthers 2017
Interest-bearing loans, borrowings and debt issues (Non-current) 1,548,305 736,987 (5,083) - - (113,118) 2,167,091
Interest-bearing loans and borrowings (Current) 419,294 (26,419) (8,498) - - 159,412 543,789
Financial leasing (Non-current) 30,096 - (4,362) - 5,711 (1,325) 30,120
Financial leasing (Current) 3,478 (1,630) (621) - - 1,325 2,552
Borrowings from related parties (Non-current) 67,718 (7,010) (2,357) - - (1,042) 57,309
Borrowings from related parties (Current) 2,444 62 - - - (521) 1,985
Other non-trade liabilities 34,991 (808) - - - - 34,183
Total (Note 4.5) 2,106,326 701,182 (20,921) - 5,711 44,731 2,837,029
Derivative financial instruments 87,983 - - (21,782) - - 66,201
Total 2,194,309 701,182 (20,921) (21,782) 5,711 44,731 2,903,230
Thousand of euros

82
The breakdown of maturity dates for the balances at December 31, 2016 is as follows:
The guarantees granted are personal guarantees of the borrower and were granted by a group of subsidiary companies (Annex III). There are no real guarantees over loans at December 31, 2016 nor at December 31, 2017 (Note 11). It also exists real and related guarantees in the description of individual financial arrangements included in this Note. The nominal interest rate on the loans at December 31, 2017 is as follows:
Interest rate
• Loans denominated in euro 0.90% - 1.45%
• Loans denominated in Brazilian real* 4.50% - 8.50%
• Loans denominated in Korean won 3.60%
• Loans denominated in US dollar 3.00%
* The lower level of the range corresponds to loans received by BNDES with a subsidized interest rate. The nominal interest rate on the loans at December 31, 2016 is as follows:
Interest rate
• Loans denominated in euro 1.00% - 1.45%
• Loans denominated in Brazilian real* 4.50% - 8.50%
• Loans denominated in Korean won 3.60%
• Loans denominated in US dollar 1.45% - 2.10%
* The lower level of the range corresponds to loans received by BNDES with a subsidized interest rate.
2016
Description 2019 2020 2021 2022 Beyond Total Total
In Euro 145,953 394,965 363,453 605,397 639,006 2,148,774 1,528,472
Western Europe 118,870 384,535 361,423 604,857 639,006 2,108,691 1,511,689
Eastern Europe 27,083 10,430 2,030 540 - 40,083 16,783
In foreign currency 5,757 3,614 1,971 4,379 2,596 18,317 19,833
Brazilian real
Mercosur 3,368 3,057 1,925 2,111 2,596 13,057 14,198
Turkish lira
Eastern Europe 1,100 550 46 - 1,696 -
Czech crown
Europa oriental 1,262 - - - 1,262 2,510
Remimbi yuan
Asia - - - - - - 2,726
Romanian leu
Eastern Europe - - - 2,268 - 2,268 -
Korean won
Asia 27 7 - - - 34 399
Total 151,710 398,579 365,424 609,776 641,602 2,167,091 1,548,305
Thousands of euros
2017
2018 2019 2020 2021 Beyond Total
99,950 159,279 250,027 390,619 648,430 1,548,305
Thousands of euros
2016

83
The loans in the schedule above where certain Group companies are guarantors or which are subject to covenants, are the following:
I) 2012 Bank of America Loan and 2013 Syndicated Loan (modified in 2016) On May 20, 2016 the Parent Company signed an agreement modifying the syndicated loan from April 2013. The agreement modified the amount granted (increase of 340 million euros, tranche A2) and certain loan conditions. After the required analysis, this operation was considered as a refinancing of the syndicated loan since there was no substantial modification of the debt. On March 21, 2017, maturity date of the contract, the loan signed between the Parent Company and Bank of America was completely paid. The most relevant information regarding interest-bearing loans and borrowings subject to covenants at December 31, 2017 and December 31, 2016 is as follows:
(*) On July 25, 2017 the Parent Company signed an agreement to modify the original syndicated loan signed on April 2013. This agreement implies changes in interest rates and maturity dates. The maturity date for the contract was modified to July 15, 2022. The outstanding amount of the syndicated loan, granted to the Parent Company, is registered as long-term in the amount of 852,473 thousand euros. The Revolving Credit Facility granted, amounting to 280,000 thousand euros, was undrawn neither at December 31, 2017 nor at December 31, 2016. As at December 31, 2016 and December 31, 2016, the Parent Company is not in breach of any of these covenants. Certain Group companies, which together represent a significant portion of total consolidated assets, revenue and EBITDA, act as joint guarantors of the mentioned loans. These companies are specified in Annex III.
II) May 2013 and May 2016 Bonds On May 2013, the Group completed an issuance of bonds through its subsidiary Gestamp Funding Luxembourg, S.A., a company belonging to the Western Europe segment. This issuance was carried
March 21, 2017
“Net debt/EBITDA”
below 3.50x
May 20, 2016
*
Entity Initial date Amount granted Maturity date Financial obligations
Bank of
America
Securities
Limited
March 21,
201260 million euros
Modification
agreement
date Restrictions
“Net debt/EBITDA”
below or equal 3.50x
Limitation for the dividends distribution:
- Dividends can be no more than 50% of the
consolidated benefit
“EBITDA/Financial
expense” above 4.00x
N/A
“EBITDA/Financial
expense” above 4.00x
Group of
banks
April 19,
2013
Tranche A1: 532
million euros
Tranche A2: 340
million euros
Revolving Credit
Facility:280
million euros
Tranche A1: May
31, 2021 *
Tranche A2: May
31, 2021 *
Revolving Credit
Facilities: May
31, 2021 *

84
out in two tranches, one amounting to 500 million euros with an interest rate of 5.875%, and the other amounting to 350 million dollars with a 5.625% interest rate. The initial maturity date of the bonds was May 31, 2020 and interest are payable every six months (November and May). On September and October 2015, the Group acquired a part of the issued bonds for 16,702 thousand dollars and 5,500 thousand euros. On May 11, 2016, a new issuance of bond by the subsidiary Gestamp Funding Luxembourg, S.A. was made for the amount of 500 million euros with a spread rate of 3.5%. This new issue of bonds was used to refinance the May 2013 bond emission plus interest payments, and was considered as a refinancing operation due to the nonexistence of significant modifications of the debt. The tranche A2 of the new syndicated loan for 340 million euros granted on May 20 (heading I) was used on June 17, 2016 to fully cancel the US dollar bond issued in May 2013 plus interest payments. After the required analysis, this re-financing was considered new debt and as a result was registered a financial expense for the amount of 9.8 million euros in the Consolidated Income Statement at December 31, 2016. The maturity date of the new bond is May 15, 2023 with coupon payable every six months (in November and May). The carrying value of the May 2016 bond emission at December 31, 2017 amounts to 479 million euros (December, 31 2016: 486 million euros). The carrying value of the May 2013 bonds at December 31, 2015 at the exchange rate of the said date amounted to 793 million euros (489 million euros and 304 million euros corresponding to the euro and dollar bond respectively). Certain Group companies, which together represent a significant portion of total consolidated assets, revenue and EBITDA, act as joint guarantors of the bonds. These companies are specified in Annex III.
III) European Investment Bank On June 15, 2016 the Parent Company signed a financing agreement with the European Investment Bank for the amount of 160 million euros. The loan term is seven years with maturity on June 22, 2023. The Parent Company must accomplish certain financial obligations related to Consolidated Financial Statements over the life of the loan. The mentioned obligations are as follows:
� “EBITDA / Financial expense” above 4.00x
� “Net Financial Debt / EBITDA” below 3.50x
The non-fulfilment of these financial obligations implies the early maturity of the loan. It exists a 20 working days period of grace to remedy the breach of these financial obligations. As at December 31, 2017 and 2016 these ratios were within the limits mentioned above (“EBITDA / Financial expense” ratio was 9.59 at December 31, 2017 and 9.00 at December 31, 2016, and “Net Financial Debt / EBITDA” ratio was 2.13 at December 31, 2017 and 1.94 at December 31, 2016). It also exists a limitation on dividends distribution such that dividends each year can be no more than 50% of the consolidated net income.
85
The outstanding amount of the syndicated loan, granted to the Parent Company, is registered as long-term in the amount of 160 million euros. Parent Company ratios accomplished both covenants on December 31, 2017 and on December 31, 2016. Certain Group companies, which together represent a significant portion of total consolidated assets, revenue and EBITDA, act as joint guarantors of this loan. These companies are specified in Annex III.
IV) KfW IPEX Bank GmbH On June 26, 2017 the Parent Company signed a financing agreement with KfW IPEX Bank GmbH for the amount of 45 million euros. The loan term is five years with maturity on June 19, 2022. The outstanding amount of the syndicated loan, granted to the Parent Company, is registered as long-term in the amount of 45 million euros. The Parent Company must accomplish certain financial obligations related to Consolidated Financial Statements over the life of the loan. The mentioned obligations are as follows:
� “EBITDA / Financial expense” above 4.00x
� “Net Financial Debt / EBITDA” below 3.50x
The non-fulfilment of these financial obligations implies the early maturity of the loan. It exists a 20 working days period of grace to remedy the breach of these financial obligations. As at December 31, 2017 and 2016 these ratios were within the limits mentioned above (“EBITDA / Financial expense” ratio was 9.59 at December 31, 2017 and 9.00 at December 31, 2016, and “Net Financial Debt / EBITDA” ratio was 2.13 at December 31, 2017 and 1.94 at December 31, 2016). Parent Company ratios accomplished both covenants on December 31, 2017 and on December 31, 2016. Certain Group companies, which together represent a significant portion of total consolidated assets, revenue and EBITDA, act as joint guarantors of this loan. These companies are specified in Annex III.
a.2) Current interest-bearing loans and borrowings The breakdown by segment of current interest-bearing loans and borrowings is as follows:
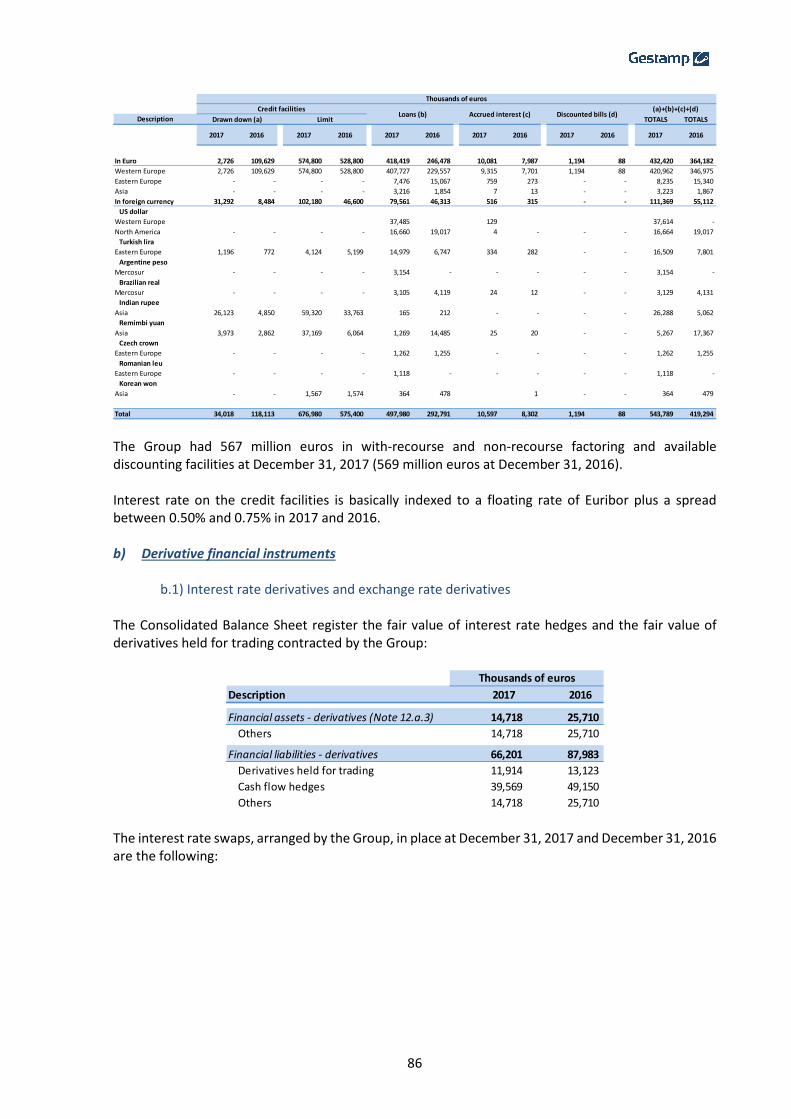
86
The Group had 567 million euros in with-recourse and non-recourse factoring and available discounting facilities at December 31, 2017 (569 million euros at December 31, 2016). Interest rate on the credit facilities is basically indexed to a floating rate of Euribor plus a spread between 0.50% and 0.75% in 2017 and 2016. b) Derivative financial instruments
b.1) Interest rate derivatives and exchange rate derivatives
The Consolidated Balance Sheet register the fair value of interest rate hedges and the fair value of derivatives held for trading contracted by the Group:
The interest rate swaps, arranged by the Group, in place at December 31, 2017 and December 31, 2016 are the following:
Description TOTALS TOTALS
In Euro 2,726 109,629 574,800 528,800 418,419 246,478 10,081 7,987 1,194 88 432,420 364,182
Western Europe 2,726 109,629 574,800 528,800 407,727 229,557 9,315 7,701 1,194 88 420,962 346,975
Eastern Europe - - - - 7,476 15,067 759 273 - - 8,235 15,340
Asia - - - - 3,216 1,854 7 13 - - 3,223 1,867
In foreign currency 31,292 8,484 102,180 46,600 79,561 46,313 516 315 - - 111,369 55,112
US dollar - -
Western Europe - - - - 37,485 - 129 - - - 37,614 -
North America - - - - 16,660 19,017 4 - - - 16,664 19,017
Turkish lira - - - - - - - - - - -
Eastern Europe 1,196 772 4,124 5,199 14,979 6,747 334 282 - - 16,509 7,801
Argentine peso - - - - - - - - - - -
Mercosur - - - - 3,154 - - - - - 3,154 -
Brazilian real - - - - - - - - - - -
Mercosur - - - - 3,105 4,119 24 12 - - 3,129 4,131
Indian rupee - - - - - - - - - - -
Asia 26,123 4,850 59,320 33,763 165 212 - - - - 26,288 5,062
Remimbi yuan - - - - - - - - - - -
Asia 3,973 2,862 37,169 6,064 1,269 14,485 25 20 - - 5,267 17,367
Czech crown - - - - - - - - - - -
Eastern Europe - - - - 1,262 1,255 - - - - 1,262 1,255
Romanian leu
Eastern Europe - - - - 1,118 - - - - - 1,118 -
Korean won - - - - - - - - - - -
Asia - - 1,567 1,574 364 478 - 1 - - 364 479
Total 34,018 118,113 676,980 575,400 497,980 292,791 10,597 8,302 1,194 88 543,789 419,294
Thousands of euros
Credit facilitiesLoans (b) Accrued interest (c) Discounted bills (d)
(a)+(b)+(c)+(d)
Drawn down (a) Limit
20162017 2016 2017 2017 2016 20172016 2017 2016 2017 2016
Description 2017 2016
Financial assets - derivatives (Note 12.a.3) 14,718 25,710
Others 14,718 25,710
Financial liabilities - derivatives 66,201 87,983
Derivatives held for trading 11,914 13,123
Cash flow hedges 39,569 49,150
Others 14,718 25,710
Thousands of euros
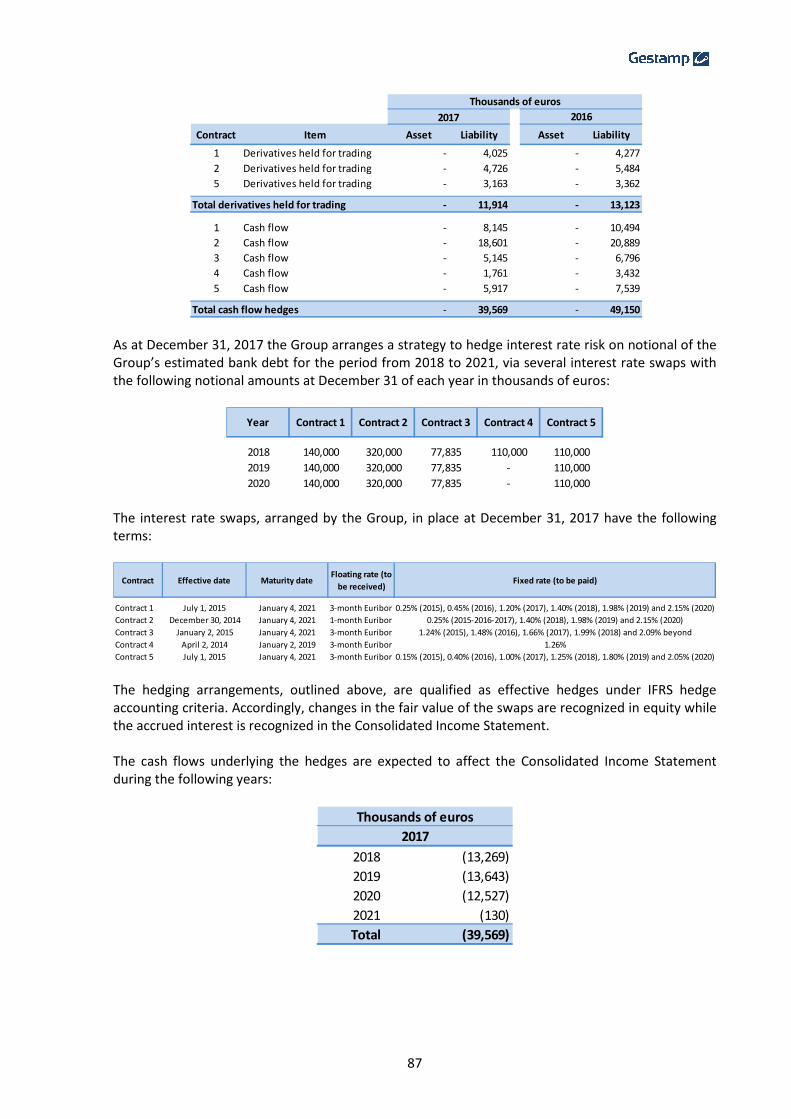
87
As at December 31, 2017 the Group arranges a strategy to hedge interest rate risk on notional of the Group’s estimated bank debt for the period from 2018 to 2021, via several interest rate swaps with the following notional amounts at December 31 of each year in thousands of euros:
The interest rate swaps, arranged by the Group, in place at December 31, 2017 have the following terms:
The hedging arrangements, outlined above, are qualified as effective hedges under IFRS hedge accounting criteria. Accordingly, changes in the fair value of the swaps are recognized in equity while the accrued interest is recognized in the Consolidated Income Statement. The cash flows underlying the hedges are expected to affect the Consolidated Income Statement during the following years:
Contract Item Asset Liability Asset Liability
1 Derivatives held for trading - 4,025 - 4,277
2 Derivatives held for trading - 4,726 - 5,484
5 Derivatives held for trading - 3,163 - 3,362
- 11,914 - 13,123
1 Cash flow - 8,145 - 10,494
2 Cash flow - 18,601 - 20,889
3 Cash flow - 5,145 - 6,796
4 Cash flow - 1,761 - 3,432
5 Cash flow - 5,917 - 7,539
- 39,569 - 49,150
Thousands of euros
Total cash flow hedges
Total derivatives held for trading
2017 2016
2018 140,000 320,000 77,835 110,000 110,000
2019 140,000 320,000 77,835 - 110,000
2020 140,000 320,000 77,835 - 110,000
Contract 4 Contract 5Year Contract 1 Contract 2 Contract 3
Contract 1 July 1, 2015 January 4, 2021 3-month Euribor 0.25% (2015), 0.45% (2016), 1.20% (2017), 1.40% (2018), 1.98% (2019) and 2.15% (2020)
Contract 2 December 30, 2014 January 4, 2021 1-month Euribor 0.25% (2015-2016-2017), 1.40% (2018), 1.98% (2019) and 2.15% (2020)
Contract 3 January 2, 2015 January 4, 2021 3-month Euribor 1.24% (2015), 1.48% (2016), 1.66% (2017), 1.99% (2018) and 2.09% beyond
Contract 4 April 2, 2014 January 2, 2019 3-month Euribor 1.26%
Contract 5 July 1, 2015 January 4, 2021 3-month Euribor 0.15% (2015), 0.40% (2016), 1.00% (2017), 1.25% (2018), 1.80% (2019) and 2.05% (2020)
Contract Effective date Maturity dateFloating rate (to
be received)Fixed rate (to be paid)
2018 (13,269)
2019 (13,643)
2020 (12,527)
2021 (130)
Total (39,569)
Thousands of euros
2017
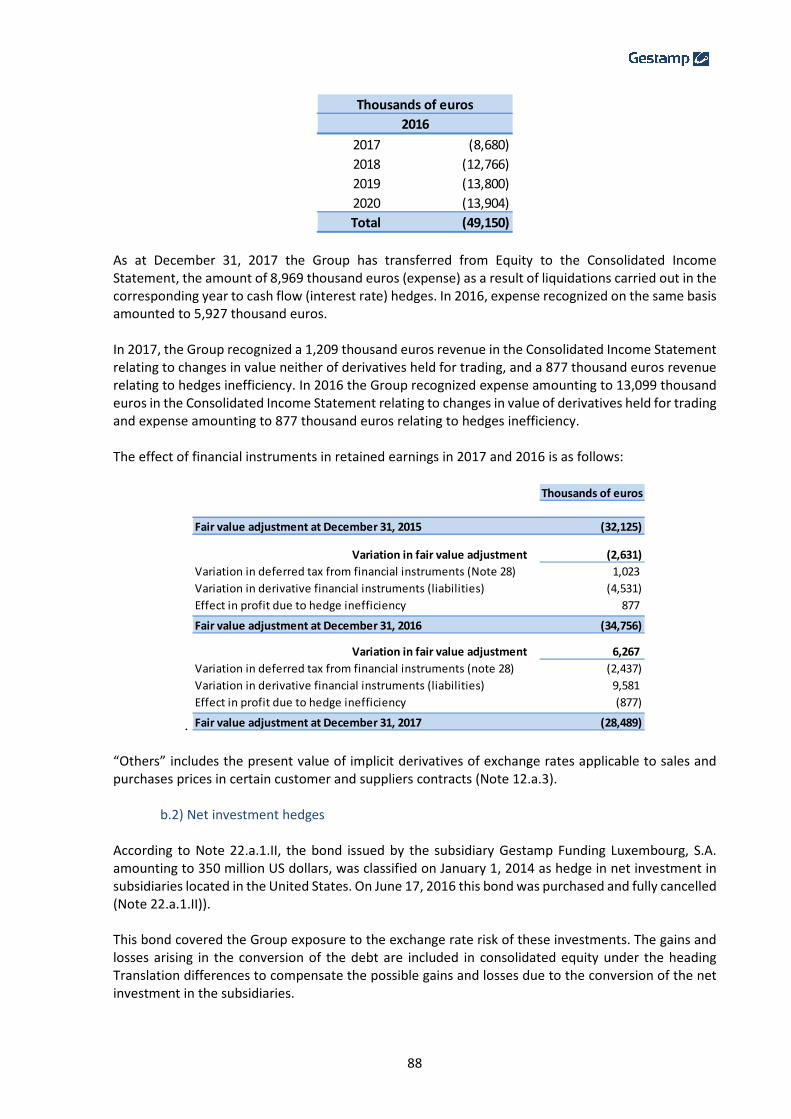
88
As at December 31, 2017 the Group has transferred from Equity to the Consolidated Income Statement, the amount of 8,969 thousand euros (expense) as a result of liquidations carried out in the corresponding year to cash flow (interest rate) hedges. In 2016, expense recognized on the same basis amounted to 5,927 thousand euros. In 2017, the Group recognized a 1,209 thousand euros revenue in the Consolidated Income Statement relating to changes in value neither of derivatives held for trading, and a 877 thousand euros revenue relating to hedges inefficiency. In 2016 the Group recognized expense amounting to 13,099 thousand euros in the Consolidated Income Statement relating to changes in value of derivatives held for trading and expense amounting to 877 thousand euros relating to hedges inefficiency. The effect of financial instruments in retained earnings in 2017 and 2016 is as follows:
. “Others” includes the present value of implicit derivatives of exchange rates applicable to sales and purchases prices in certain customer and suppliers contracts (Note 12.a.3).
b.2) Net investment hedges According to Note 22.a.1.II, the bond issued by the subsidiary Gestamp Funding Luxembourg, S.A. amounting to 350 million US dollars, was classified on January 1, 2014 as hedge in net investment in subsidiaries located in the United States. On June 17, 2016 this bond was purchased and fully cancelled (Note 22.a.1.II)). This bond covered the Group exposure to the exchange rate risk of these investments. The gains and losses arising in the conversion of the debt are included in consolidated equity under the heading Translation differences to compensate the possible gains and losses due to the conversion of the net investment in the subsidiaries.
2017 (8,680)
2018 (12,766)
2019 (13,800)
2020 (13,904)
Total (49,150)
2016
Thousands of euros
Thousands of euros
Fair value adjustment at December 31, 2015 (32,125)
Variation in fair value adjustment (2,631)
Variation in deferred tax from financial instruments (Note 28) 1,023
Variation in derivative financial instruments (liabilities) (4,531)
Effect in profit due to hedge inefficiency 877
Fair value adjustment at December 31, 2016 (34,756)
Variation in fair value adjustment 6,267
Variation in deferred tax from financial instruments (note 28) (2,437)
Variation in derivative financial instruments (liabilities) 9,581
Effect in profit due to hedge inefficiency (877)
Fair value adjustment at December 31, 2017 (28,489)
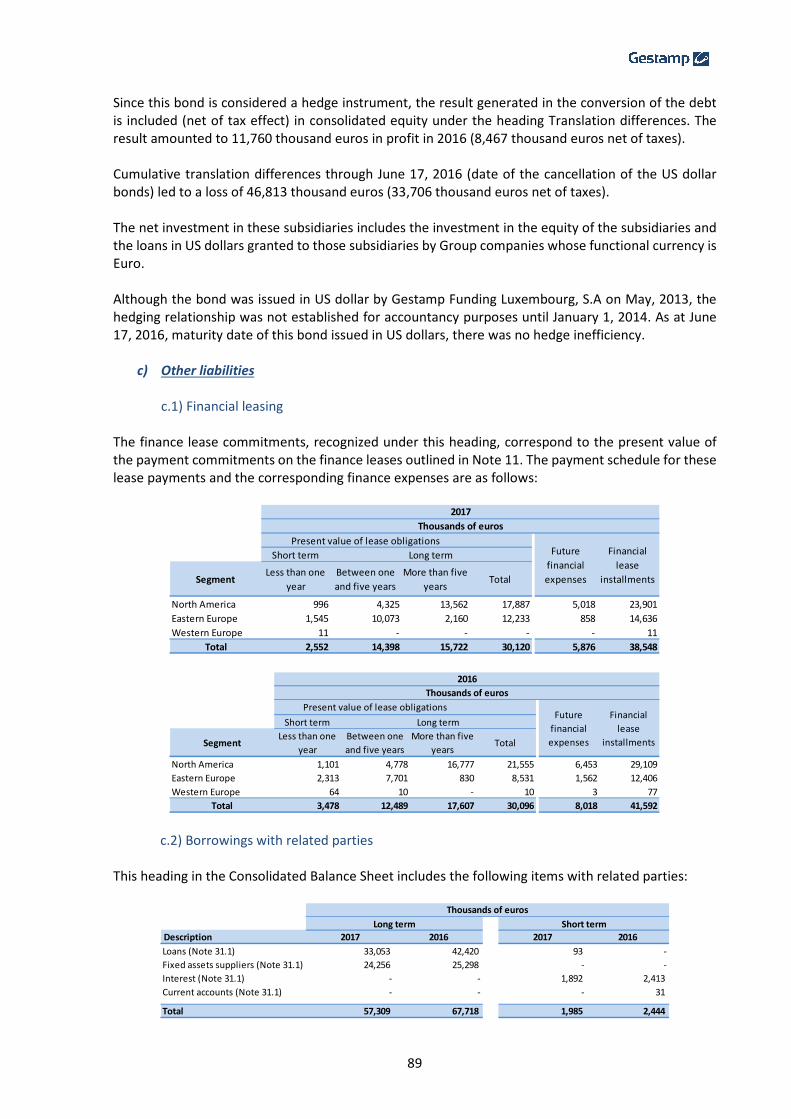
89
Since this bond is considered a hedge instrument, the result generated in the conversion of the debt is included (net of tax effect) in consolidated equity under the heading Translation differences. The result amounted to 11,760 thousand euros in profit in 2016 (8,467 thousand euros net of taxes). Cumulative translation differences through June 17, 2016 (date of the cancellation of the US dollar bonds) led to a loss of 46,813 thousand euros (33,706 thousand euros net of taxes). The net investment in these subsidiaries includes the investment in the equity of the subsidiaries and the loans in US dollars granted to those subsidiaries by Group companies whose functional currency is Euro. Although the bond was issued in US dollar by Gestamp Funding Luxembourg, S.A on May, 2013, the hedging relationship was not established for accountancy purposes until January 1, 2014. As at June 17, 2016, maturity date of this bond issued in US dollars, there was no hedge inefficiency.
c) Other liabilities
c.1) Financial leasing
The finance lease commitments, recognized under this heading, correspond to the present value of the payment commitments on the finance leases outlined in Note 11. The payment schedule for these lease payments and the corresponding finance expenses are as follows:
c.2) Borrowings with related parties This heading in the Consolidated Balance Sheet includes the following items with related parties:
Short term
SegmentLess than one
year
Between one
and five years
More than five
yearsTotal
North America 996 4,325 13,562 17,887 5,018 23,901
Eastern Europe 1,545 10,073 2,160 12,233 858 14,636
Western Europe 11 - - - - 11
Total 2,552 14,398 15,722 30,120 5,876 38,548
2017
Thousands of euros
Financial
lease
installments
Future
financial
expenses
Present value of lease obligations
Long term
Short term
SegmentLess than one
year
Between one
and five years
More than five
yearsTotal
North America 1,101 4,778 16,777 21,555 6,453 29,109
Eastern Europe 2,313 7,701 830 8,531 1,562 12,406
Western Europe 64 10 - 10 3 77
Total 3,478 12,489 17,607 30,096 8,018 41,592
Thousands of euros
Present value of lease obligationsFuture
financial
expenses
Financial
lease
installments
2016
Long term
Description 2017 2016 2017 2016
Loans (Note 31.1) 33,053 42,420 93 -
Fixed assets suppliers (Note 31.1) 24,256 25,298 - -
Interest (Note 31.1) - - 1,892 2,413
Current accounts (Note 31.1) - - - 31
Total 57,309 67,718 1,985 2,444
Long term Short term
Thousands of euros
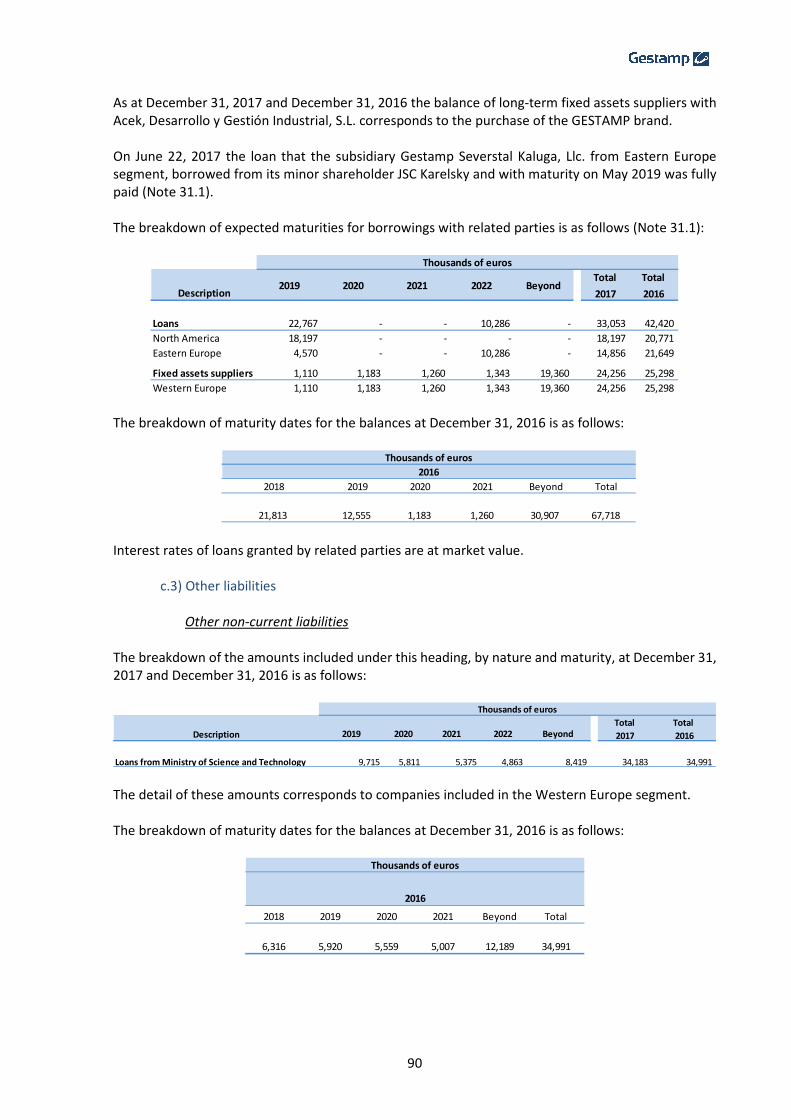
90
As at December 31, 2017 and December 31, 2016 the balance of long-term fixed assets suppliers with Acek, Desarrollo y Gestión Industrial, S.L. corresponds to the purchase of the GESTAMP brand. On June 22, 2017 the loan that the subsidiary Gestamp Severstal Kaluga, Llc. from Eastern Europe segment, borrowed from its minor shareholder JSC Karelsky and with maturity on May 2019 was fully paid (Note 31.1). The breakdown of expected maturities for borrowings with related parties is as follows (Note 31.1):
The breakdown of maturity dates for the balances at December 31, 2016 is as follows:
Interest rates of loans granted by related parties are at market value.
c.3) Other liabilities
Other non-current liabilities
The breakdown of the amounts included under this heading, by nature and maturity, at December 31, 2017 and December 31, 2016 is as follows:
The detail of these amounts corresponds to companies included in the Western Europe segment. The breakdown of maturity dates for the balances at December 31, 2016 is as follows:
Description2019 2020 2021 2022 Beyond
Total
2017
Total
2016
Loans 22,767 - - 10,286 - 33,053 42,420
North America 18,197 - - - - 18,197 20,771
Eastern Europe 4,570 - - 10,286 - 14,856 21,649
Fixed assets suppliers 1,110 1,183 1,260 1,343 19,360 24,256 25,298
Western Europe 1,110 1,183 1,260 1,343 19,360 24,256 25,298
Thousands of euros
2018 2019 2020 2021 Beyond Total
21,813 12,555 1,183 1,260 30,907 67,718
Thousands of euros
2016
Description 2019 2020 2021 2022 BeyondTotal
2017
Total
2016
Loans from Ministry of Science and Technology 9,715 5,811 5,375 4,863 8,419 34,183 34,991
Thousands of euros
2018 2019 2020 2021 Beyond Total
6,316 5,920 5,559 5,007 12,189 34,991
2016
Thousands of euros
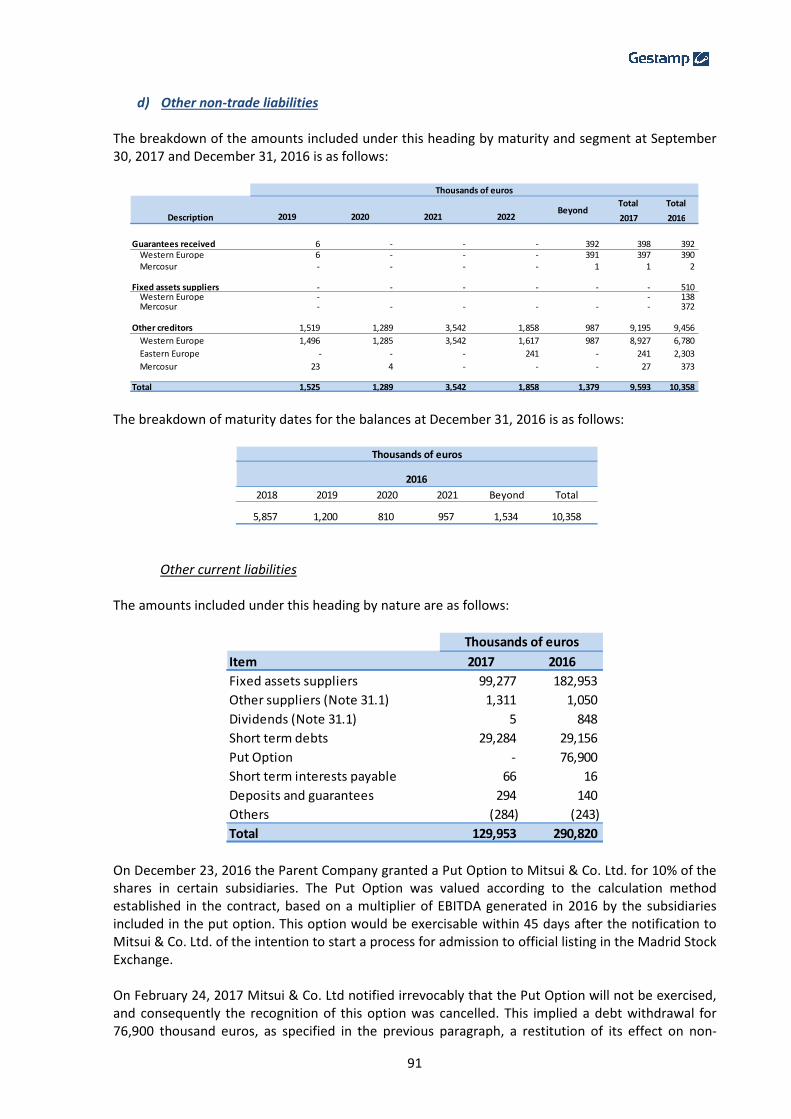
91
d) Other non-trade liabilities
The breakdown of the amounts included under this heading by maturity and segment at September 30, 2017 and December 31, 2016 is as follows:
The breakdown of maturity dates for the balances at December 31, 2016 is as follows:
Other current liabilities
The amounts included under this heading by nature are as follows:
On December 23, 2016 the Parent Company granted a Put Option to Mitsui & Co. Ltd. for 10% of the shares in certain subsidiaries. The Put Option was valued according to the calculation method established in the contract, based on a multiplier of EBITDA generated in 2016 by the subsidiaries included in the put option. This option would be exercisable within 45 days after the notification to Mitsui & Co. Ltd. of the intention to start a process for admission to official listing in the Madrid Stock Exchange. On February 24, 2017 Mitsui & Co. Ltd notified irrevocably that the Put Option will not be exercised, and consequently the recognition of this option was cancelled. This implied a debt withdrawal for 76,900 thousand euros, as specified in the previous paragraph, a restitution of its effect on non-
Description 2019 2020 2021 2022Beyond
Total
2017
Total
2016
Guarantees received 6 - - - 392 398 392 Western Europe 6 - - - 391 397 390 Mercosur - - - - 1 1 2
Fixed assets suppliers - - - - - - 510 Western Europe - - 138 Mercosur - - - - - - 372
Other creditors 1,519 1,289 3,542 1,858 987 9,195 9,456
Western Europe 1,496 1,285 3,542 1,617 987 8,927 6,780
Eastern Europe - - - 241 - 241 2,303
Mercosur 23 4 - - - 27 373
Total 1,525 1,289 3,542 1,858 1,379 9,593 10,358
Thousands of euros
2018 2019 2020 2021 Beyond Total
5,857 1,200 810 957 1,534 10,358
2016
Thousands of euros
Item 2017 2016
Fixed assets suppliers 99,277 182,953
Other suppliers (Note 31.1) 1,311 1,050
Dividends (Note 31.1) 5 848
Short term debts 29,284 29,156
Put Option - 76,900
Short term interests payable 66 16
Deposits and guarantees 294 140
Others (284) (243)
Total 129,953 290,820
Thousands of euros
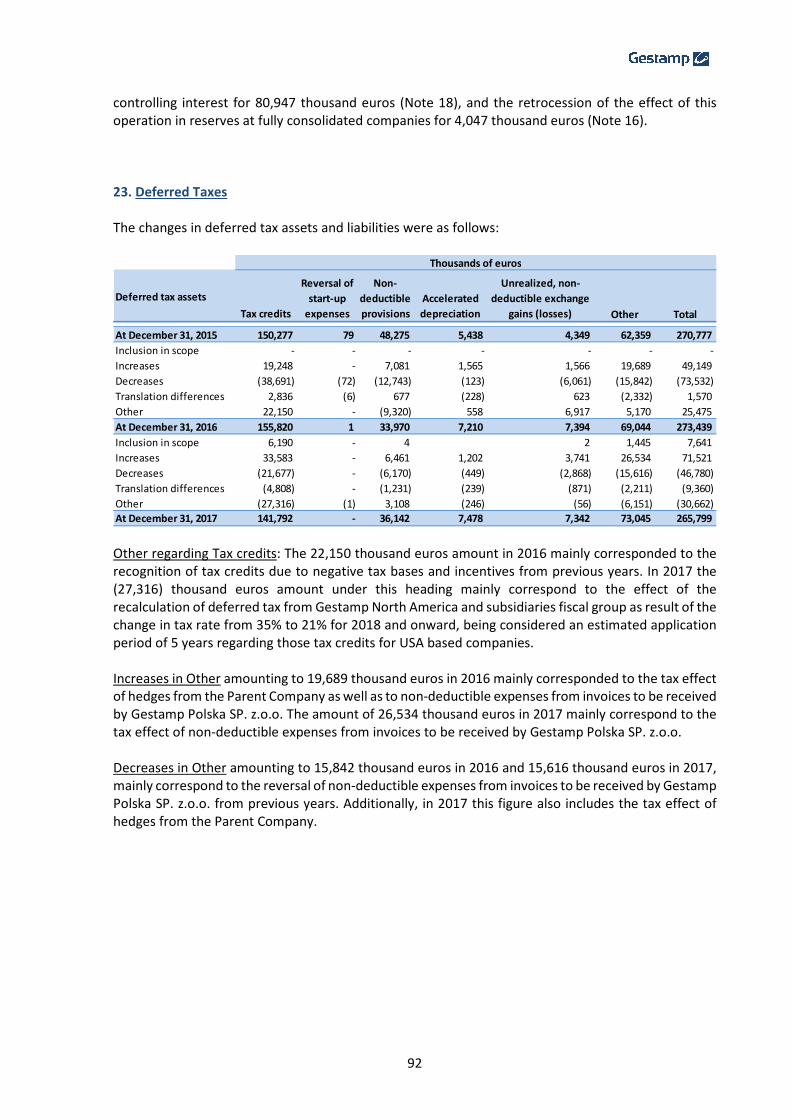
92
controlling interest for 80,947 thousand euros (Note 18), and the retrocession of the effect of this operation in reserves at fully consolidated companies for 4,047 thousand euros (Note 16). 23. Deferred Taxes The changes in deferred tax assets and liabilities were as follows:
Other regarding Tax credits: The 22,150 thousand euros amount in 2016 mainly corresponded to the recognition of tax credits due to negative tax bases and incentives from previous years. In 2017 the (27,316) thousand euros amount under this heading mainly correspond to the effect of the recalculation of deferred tax from Gestamp North America and subsidiaries fiscal group as result of the change in tax rate from 35% to 21% for 2018 and onward, being considered an estimated application period of 5 years regarding those tax credits for USA based companies. Increases in Other amounting to 19,689 thousand euros in 2016 mainly corresponded to the tax effect of hedges from the Parent Company as well as to non-deductible expenses from invoices to be received by Gestamp Polska SP. z.o.o. The amount of 26,534 thousand euros in 2017 mainly correspond to the tax effect of non-deductible expenses from invoices to be received by Gestamp Polska SP. z.o.o. Decreases in Other amounting to 15,842 thousand euros in 2016 and 15,616 thousand euros in 2017, mainly correspond to the reversal of non-deductible expenses from invoices to be received by Gestamp Polska SP. z.o.o. from previous years. Additionally, in 2017 this figure also includes the tax effect of hedges from the Parent Company.
Deferred tax assets
Tax credits
Reversal of
start-up
expenses
Non-
deductible
provisions
Accelerated
depreciation
Unrealized, non-
deductible exchange
gains (losses) Other Total
At December 31, 2015 150,277 79 48,275 5,438 4,349 62,359 270,777
Inclusion in scope - - - - - - -
Increases 19,248 - 7,081 1,565 1,566 19,689 49,149
Decreases (38,691) (72) (12,743) (123) (6,061) (15,842) (73,532)
Translation differences 2,836 (6) 677 (228) 623 (2,332) 1,570
Other 22,150 - (9,320) 558 6,917 5,170 25,475
At December 31, 2016 155,820 1 33,970 7,210 7,394 69,044 273,439
Inclusion in scope 6,190 - 4 2 1,445 7,641
Increases 33,583 - 6,461 1,202 3,741 26,534 71,521
Decreases (21,677) - (6,170) (449) (2,868) (15,616) (46,780)
Translation differences (4,808) - (1,231) (239) (871) (2,211) (9,360)
Other (27,316) (1) 3,108 (246) (56) (6,151) (30,662)
At December 31, 2017 141,792 - 36,142 7,478 7,342 73,045 265,799
Thousands of euros
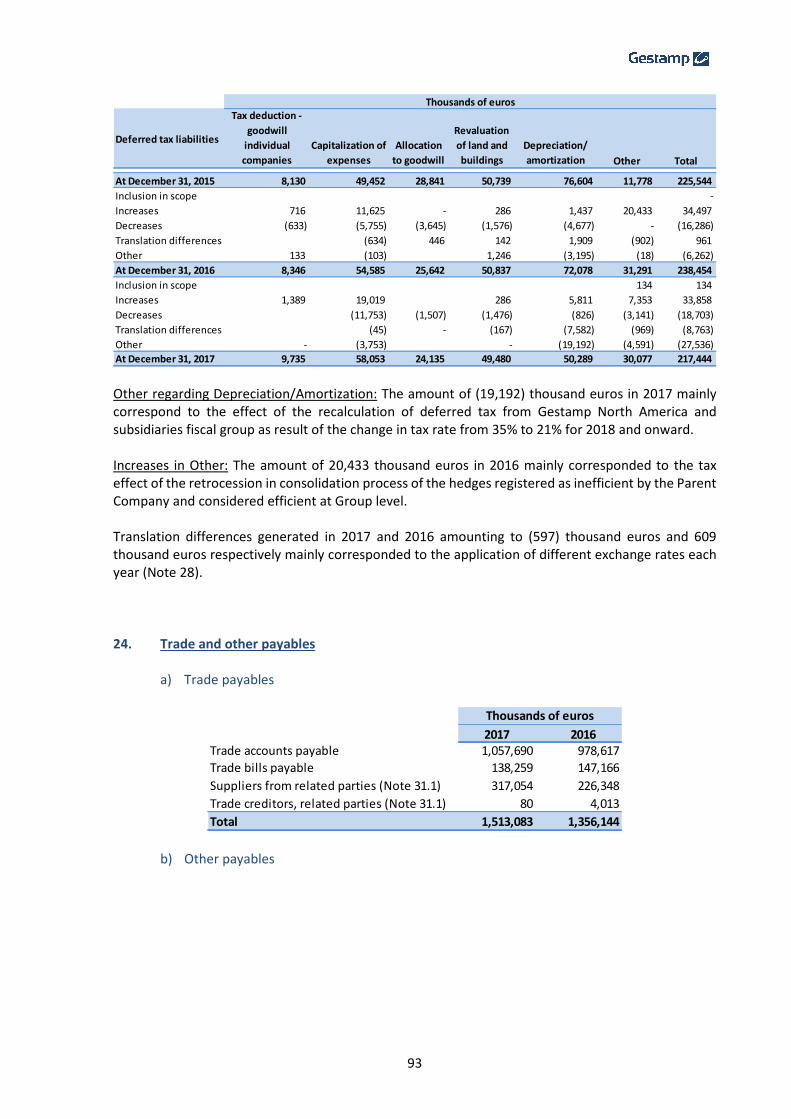
93
Other regarding Depreciation/Amortization: The amount of (19,192) thousand euros in 2017 mainly correspond to the effect of the recalculation of deferred tax from Gestamp North America and subsidiaries fiscal group as result of the change in tax rate from 35% to 21% for 2018 and onward. Increases in Other: The amount of 20,433 thousand euros in 2016 mainly corresponded to the tax effect of the retrocession in consolidation process of the hedges registered as inefficient by the Parent Company and considered efficient at Group level. Translation differences generated in 2017 and 2016 amounting to (597) thousand euros and 609 thousand euros respectively mainly corresponded to the application of different exchange rates each year (Note 28). 24. Trade and other payables
a) Trade payables
b) Other payables
Deferred tax liabilities
Tax deduction -
goodwill
individual
companies
Capitalization of
expenses
Allocation
to goodwill
Revaluation
of land and
buildings
Depreciation/
amortization Other Total
At December 31, 2015 8,130 49,452 28,841 50,739 76,604 11,778 225,544
Inclusion in scope -
Increases 716 11,625 - 286 1,437 20,433 34,497
Decreases (633) (5,755) (3,645) (1,576) (4,677) - (16,286)
Translation differences (634) 446 142 1,909 (902) 961
Other 133 (103) 1,246 (3,195) (18) (6,262)
At December 31, 2016 8,346 54,585 25,642 50,837 72,078 31,291 238,454
Inclusion in scope 134 134
Increases 1,389 19,019 286 5,811 7,353 33,858
Decreases (11,753) (1,507) (1,476) (826) (3,141) (18,703)
Translation differences (45) - (167) (7,582) (969) (8,763)
Other - (3,753) - (19,192) (4,591) (27,536)
At December 31, 2017 9,735 58,053 24,135 49,480 50,289 30,077 217,444
Thousands of euros
2017 2016Trade accounts payable 1,057,690 978,617
Trade bills payable 138,259 147,166
Suppliers from related parties (Note 31.1) 317,054 226,348
Trade creditors, related parties (Note 31.1) 80 4,013
Total 1,513,083 1,356,144
Thousands of euros
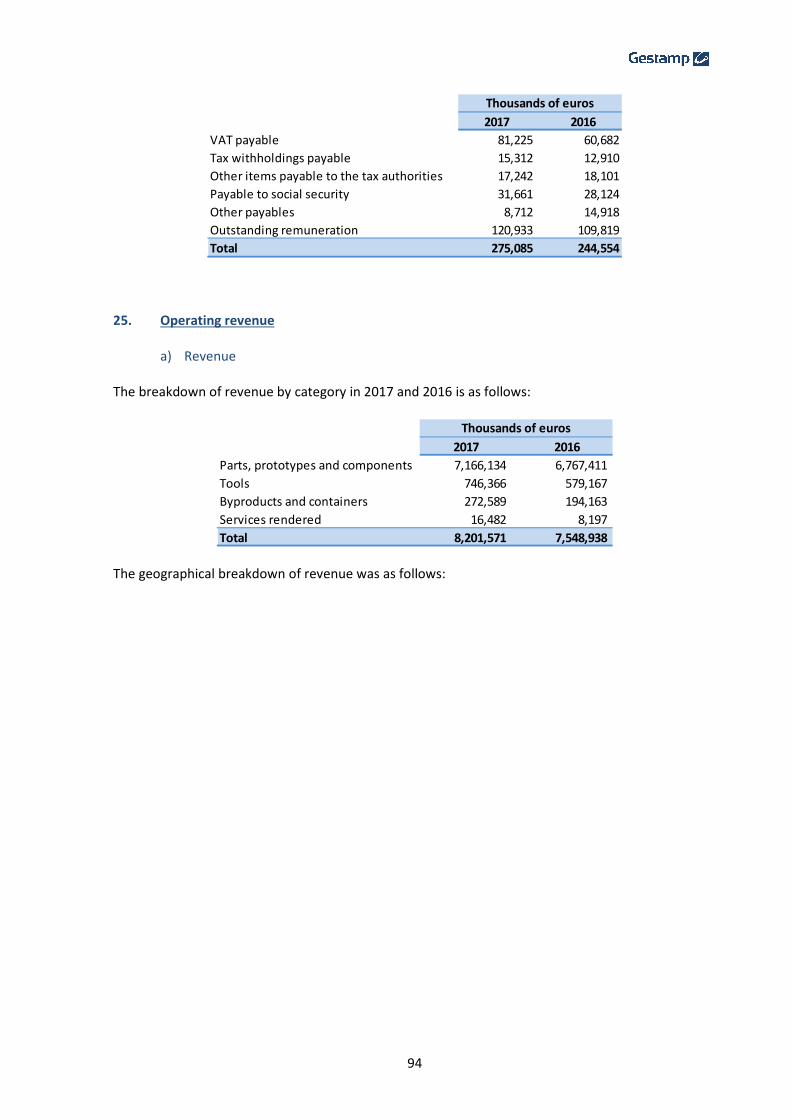
94
25. Operating revenue
a) Revenue The breakdown of revenue by category in 2017 and 2016 is as follows:
The geographical breakdown of revenue was as follows:
2017 2016
VAT payable 81,225 60,682
Tax withholdings payable 15,312 12,910
Other items payable to the tax authorities 17,242 18,101
Payable to social security 31,661 28,124
Other payables 8,712 14,918
Outstanding remuneration 120,933 109,819
Total 275,085 244,554
Thousands of euros
2017 2016
Parts, prototypes and components 7,166,134 6,767,411
Tools 746,366 579,167
Byproducts and containers 272,589 194,163
Services rendered 16,482 8,197
Total 8,201,571 7,548,938
Thousands of euros

95
b) Other operating income
Other operating income in 2017 and 2016 mainly include third party billing for transactions different from the main activity of the companies.
2017 2016 % variat.
Western Europe 4,011,171 3,704,114 8.3%
Spain 1,448,269 1,320,922 9.6%
Germany 1,158,328 1,044,527 10.9%
United Kingdom 636,405 670,805 -5.1%
France 501,413 434,989 15.3%
Portugal 198,359 159,911 24.0%
Sweden 68,397 72,960 -6.3%
Eastern Europe 1,043,441 859,489 21.4%
Turkey 322,297 272,037 18.5%
Czech Republic 185,295 167,687 10.5%
Russia 113,752 107,623 5.7%
Poland 307,889 256,290 20.1%
Hungary 66,973 50,584 32.4%
Slovakia 11,523 5,268 118.7%
Romania 35,712 -
Mercosur 562,316 401,365 40.1%
Brazil 346,256 245,709 40.9%
Argentina 216,060 155,656 38.8%
North America 1,482,798 1,546,104 -4.1%
USA 1,012,337 1,153,802 -12.3%
Mexico 470,461 392,302 19.9%
Asia 1,101,845 1,037,866 6.2%
China 736,292 719,602 2.3%
India 218,602 168,187 30.0%
South Korea 133,406 137,844 -3.2%
Japan 7,765 7,259 7.0%
Thailand 5,505 4,974 10.7%
Taiwan 275 -
8,201,571 7,548,938 8.6%
Thousands of euros
2017 2016
Other operating income 40,841 23,221
Grants related to income 5,245 3,494
Grants related to assets released to income for the year (Note 19) 4,918 6,218
Surplus provision for environmental matters and other commitments 4,462 4,261
Own work capitalized 128,094 93,383
Others 13,632 994
Profit (loss) from PP&E disposals 5,981 -
Adjustments from prior years (1,688) -
Other 9,339 994
Total 197,192 131,571
Thousands of euros
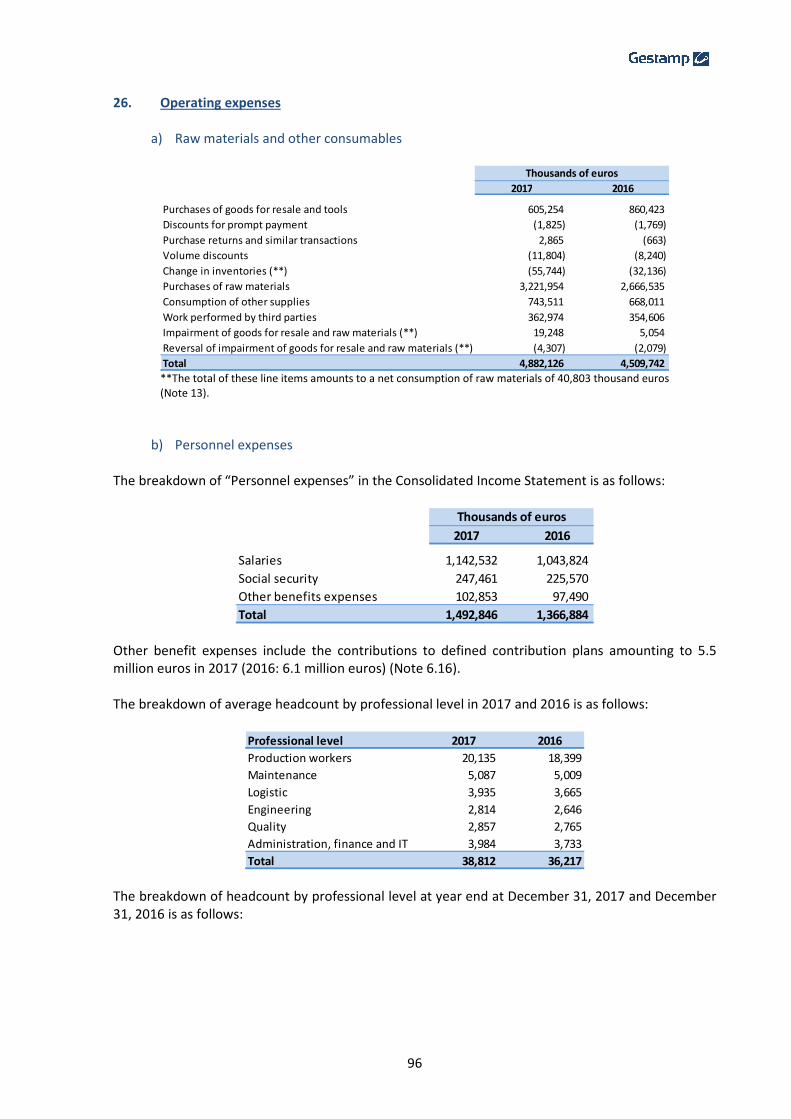
96
26. Operating expenses
a) Raw materials and other consumables
**The total of these line items amounts to a net consumption of raw materials of 40,803 thousand euros (Note 13).
b) Personnel expenses The breakdown of “Personnel expenses” in the Consolidated Income Statement is as follows:
Other benefit expenses include the contributions to defined contribution plans amounting to 5.5 million euros in 2017 (2016: 6.1 million euros) (Note 6.16). The breakdown of average headcount by professional level in 2017 and 2016 is as follows:
The breakdown of headcount by professional level at year end at December 31, 2017 and December 31, 2016 is as follows:
2017 2016
Purchases of goods for resale and tools 605,254 860,423
Discounts for prompt payment (1,825) (1,769)
Purchase returns and similar transactions 2,865 (663)
Volume discounts (11,804) (8,240)
Change in inventories (**) (55,744) (32,136)
Purchases of raw materials 3,221,954 2,666,535
Consumption of other supplies 743,511 668,011
Work performed by third parties 362,974 354,606
Impairment of goods for resale and raw materials (**) 19,248 5,054
Reversal of impairment of goods for resale and raw materials (**) (4,307) (2,079)
Total 4,882,126 4,509,742
Thousands of euros
2017 2016
Salaries 1,142,532 1,043,824
Social security 247,461 225,570
Other benefits expenses 102,853 97,490
Total 1,492,846 1,366,884
Thousands of euros
Professional level 2017 2016
Production workers 20,135 18,399
Maintenance 5,087 5,009
Logistic 3,935 3,665
Engineering 2,814 2,646
Quality 2,857 2,765
Administration, finance and IT 3,984 3,733
Total 38,812 36,217

97
c) Other operating expenses
27. Financial income and financial expenses
a) Financial income
b) Financial expenses
Professional level Males Females Males Females
Production workers 17,699 3,429 16,856 2,012
Maintenance 5,423 93 4,792 63
Logistic 3,711 487 3,265 309
Engineering 2,567 347 2,437 235
Quality 2,593 518 2,301 424
Administration, finance and IT 2,406 1,775 2,364 1,337
Total 34,399 6,649 32,015 4,380
20162017
2017 2016
Maintenance and upkeep 649,319 576,494
Other external services 438,619 334,783
Taxes and levies 35,830 34,302
Impairment of accounts receivable (Note 14.a) 805 4,080
Others 1,110 6,504
Provision for risks and expenses 1,110 5,217
Increase/ Application of provisions (Note 20) - (2,090)
Adjustments prior years - 5,567 Other - (2,190)
Total 1,125,683 956,163
Thousands of euros
2017 2016
From equity investments 1 1 From current loans to third parties - 3
Other financial income 8,519 4,839 From current loans to related parties (Note 31.1) 102 432
From non-current loans to third parties 378 -
Total 9,000 5,275
Thousands of euros
2017 2016
On bank borrowings 73,339 78,701
On trade bills with credit institutions 5,153 3,444
Other financial expenses 18,714 10,635
On update provisions 102 45
On borrowings from related parties (Note 31.1) 4,445 5,933
Total 101,753 98,758
Thousands of euros
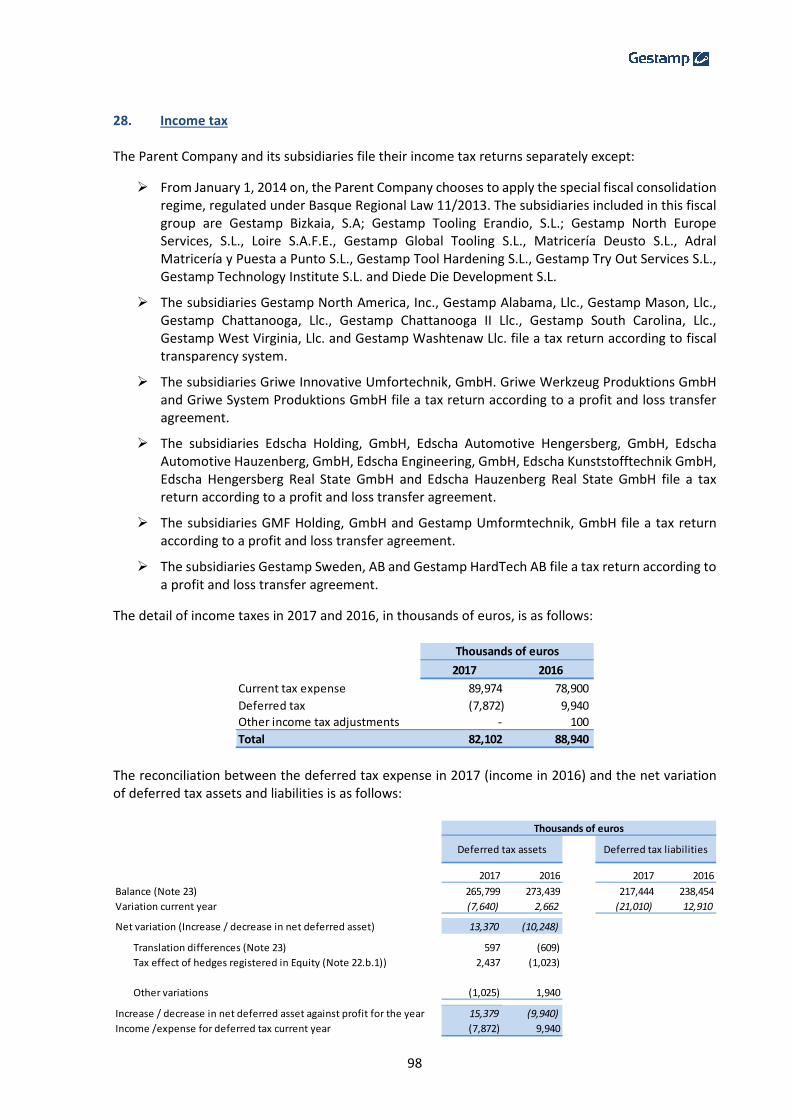
98
28. Income tax The Parent Company and its subsidiaries file their income tax returns separately except:
� From January 1, 2014 on, the Parent Company chooses to apply the special fiscal consolidation regime, regulated under Basque Regional Law 11/2013. The subsidiaries included in this fiscal group are Gestamp Bizkaia, S.A; Gestamp Tooling Erandio, S.L.; Gestamp North Europe Services, S.L., Loire S.A.F.E., Gestamp Global Tooling S.L., Matricería Deusto S.L., Adral Matricería y Puesta a Punto S.L., Gestamp Tool Hardening S.L., Gestamp Try Out Services S.L., Gestamp Technology Institute S.L. and Diede Die Development S.L.
� The subsidiaries Gestamp North America, Inc., Gestamp Alabama, Llc., Gestamp Mason, Llc., Gestamp Chattanooga, Llc., Gestamp Chattanooga II Llc., Gestamp South Carolina, Llc., Gestamp West Virginia, Llc. and Gestamp Washtenaw Llc. file a tax return according to fiscal transparency system.
� The subsidiaries Griwe Innovative Umfortechnik, GmbH. Griwe Werkzeug Produktions GmbH and Griwe System Produktions GmbH file a tax return according to a profit and loss transfer agreement.
� The subsidiaries Edscha Holding, GmbH, Edscha Automotive Hengersberg, GmbH, Edscha Automotive Hauzenberg, GmbH, Edscha Engineering, GmbH, Edscha Kunststofftechnik GmbH, Edscha Hengersberg Real State GmbH and Edscha Hauzenberg Real State GmbH file a tax return according to a profit and loss transfer agreement.
� The subsidiaries GMF Holding, GmbH and Gestamp Umformtechnik, GmbH file a tax return according to a profit and loss transfer agreement.
� The subsidiaries Gestamp Sweden, AB and Gestamp HardTech AB file a tax return according to a profit and loss transfer agreement.
The detail of income taxes in 2017 and 2016, in thousands of euros, is as follows:
The reconciliation between the deferred tax expense in 2017 (income in 2016) and the net variation of deferred tax assets and liabilities is as follows:
2017 2016
Current tax expense 89,974 78,900
Deferred tax (7,872) 9,940
Other income tax adjustments - 100
Total 82,102 88,940
Thousands of euros
2017 2016 2017 2016
Balance (Note 23) 265,799 273,439 217,444 238,454
Variation current year (7,640) 2,662 (21,010) 12,910
Net variation (Increase / decrease in net deferred asset) 13,370 (10,248)
Translation differences (Note 23) 597 (609)
Tax effect of hedges registered in Equity (Note 22.b.1)) 2,437 (1,023)
Other variations (1,025) 1,940
Increase / decrease in net deferred asset against profit for the year 15,379 (9,940)
Income /expense for deferred tax current year (7,872) 9,940
Thousands of euros
Deferred tax assets Deferred tax liabilities
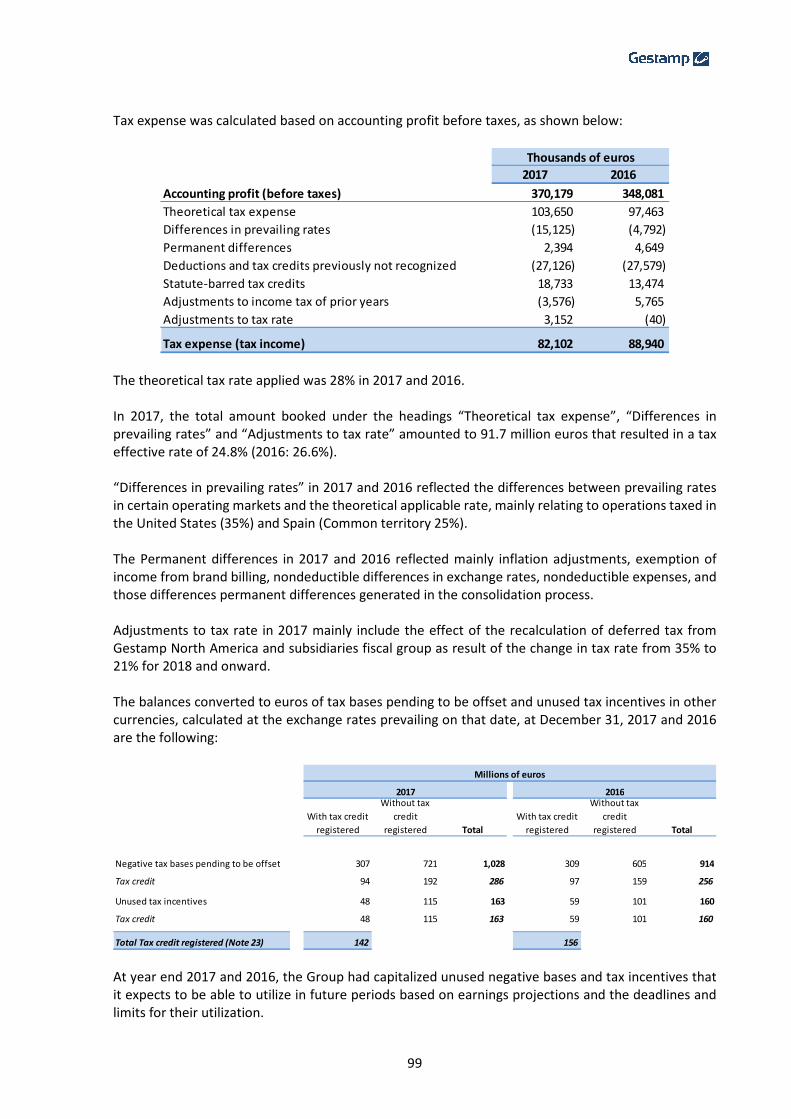
99
Tax expense was calculated based on accounting profit before taxes, as shown below:
The theoretical tax rate applied was 28% in 2017 and 2016. In 2017, the total amount booked under the headings “Theoretical tax expense”, “Differences in prevailing rates” and “Adjustments to tax rate” amounted to 91.7 million euros that resulted in a tax effective rate of 24.8% (2016: 26.6%). “Differences in prevailing rates” in 2017 and 2016 reflected the differences between prevailing rates in certain operating markets and the theoretical applicable rate, mainly relating to operations taxed in the United States (35%) and Spain (Common territory 25%). The Permanent differences in 2017 and 2016 reflected mainly inflation adjustments, exemption of income from brand billing, nondeductible differences in exchange rates, nondeductible expenses, and those differences permanent differences generated in the consolidation process. Adjustments to tax rate in 2017 mainly include the effect of the recalculation of deferred tax from Gestamp North America and subsidiaries fiscal group as result of the change in tax rate from 35% to 21% for 2018 and onward. The balances converted to euros of tax bases pending to be offset and unused tax incentives in other currencies, calculated at the exchange rates prevailing on that date, at December 31, 2017 and 2016 are the following:
At year end 2017 and 2016, the Group had capitalized unused negative bases and tax incentives that it expects to be able to utilize in future periods based on earnings projections and the deadlines and limits for their utilization.
2017 2016
Accounting profit (before taxes) 370,179 348,081
Theoretical tax expense 103,650 97,463
Differences in prevailing rates (15,125) (4,792)
Permanent differences 2,394 4,649
Deductions and tax credits previously not recognized (27,126) (27,579)
Statute-barred tax credits 18,733 13,474
Adjustments to income tax of prior years (3,576) 5,765
Adjustments to tax rate 3,152 (40)
Tax expense (tax income) 82,102 88,940
Thousands of euros
With tax credit
registered
Without tax
credit
registered Total
With tax credit
registered
Without tax
credit
registered Total
Negative tax bases pending to be offset 307 721 1,028 309 605 914
Tax credit 94 192 286 97 159 256
Unused tax incentives 48 115 163 59 101 160
Tax credit 48 115 163 59 101 160
Total Tax credit registered (Note 23) 142 156
Millions of euros
2017 2016
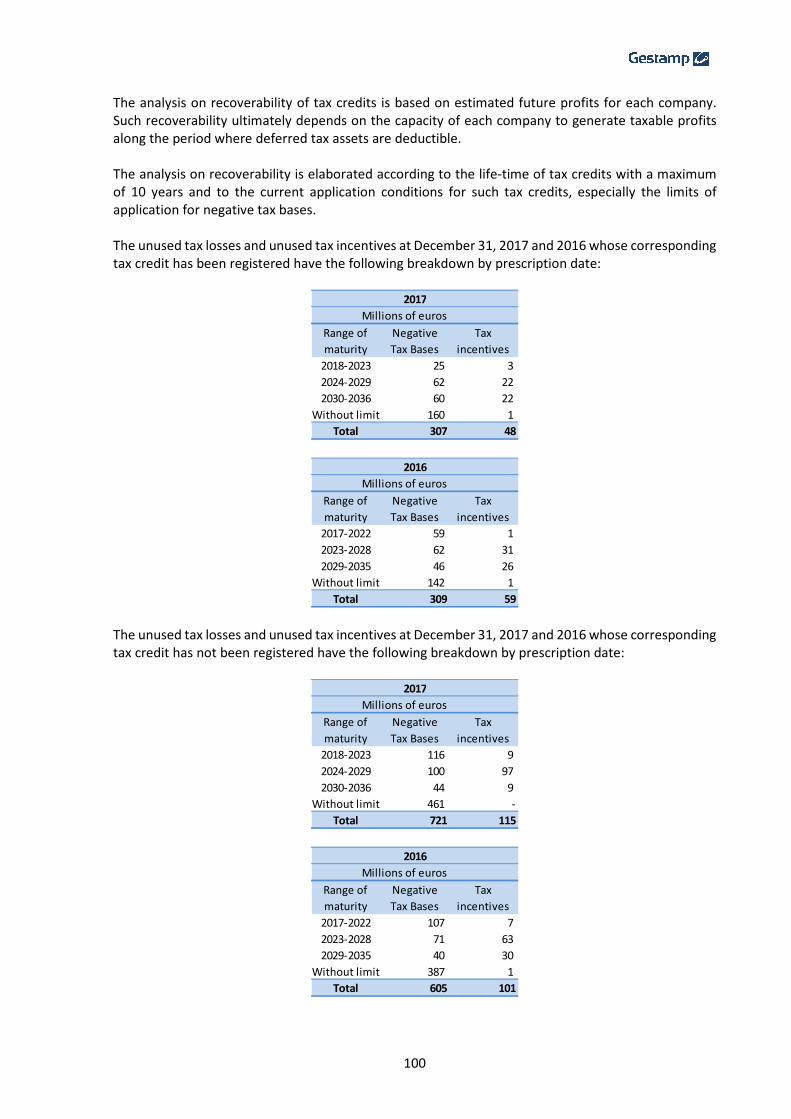
100
The analysis on recoverability of tax credits is based on estimated future profits for each company. Such recoverability ultimately depends on the capacity of each company to generate taxable profits along the period where deferred tax assets are deductible. The analysis on recoverability is elaborated according to the life-time of tax credits with a maximum of 10 years and to the current application conditions for such tax credits, especially the limits of application for negative tax bases. The unused tax losses and unused tax incentives at December 31, 2017 and 2016 whose corresponding tax credit has been registered have the following breakdown by prescription date:
The unused tax losses and unused tax incentives at December 31, 2017 and 2016 whose corresponding tax credit has not been registered have the following breakdown by prescription date:
Millions of euros
Range of
maturity
Negative
Tax Bases
Tax
incentives
2018-2023 25 3
2024-2029 62 22
2030-2036 60 22
Without limit 160 1
Total 307 48
2017
Millions of euros
Range of
maturity
Negative
Tax Bases
Tax
incentives
2017-2022 59 1
2023-2028 62 31
2029-2035 46 26
Without limit 142 1
Total 309 59
2016
Millions of euros
Range of
maturity
Negative
Tax Bases
Tax
incentives
2018-2023 116 9
2024-2029 100 97
2030-2036 44 9
Without limit 461 -
Total 721 115
2017
Millions of euros
Range of
maturity
Negative
Tax Bases
Tax
incentives
2017-2022 107 7
2023-2028 71 63
2029-2035 40 30
Without limit 387 1
Total 605 101
2016
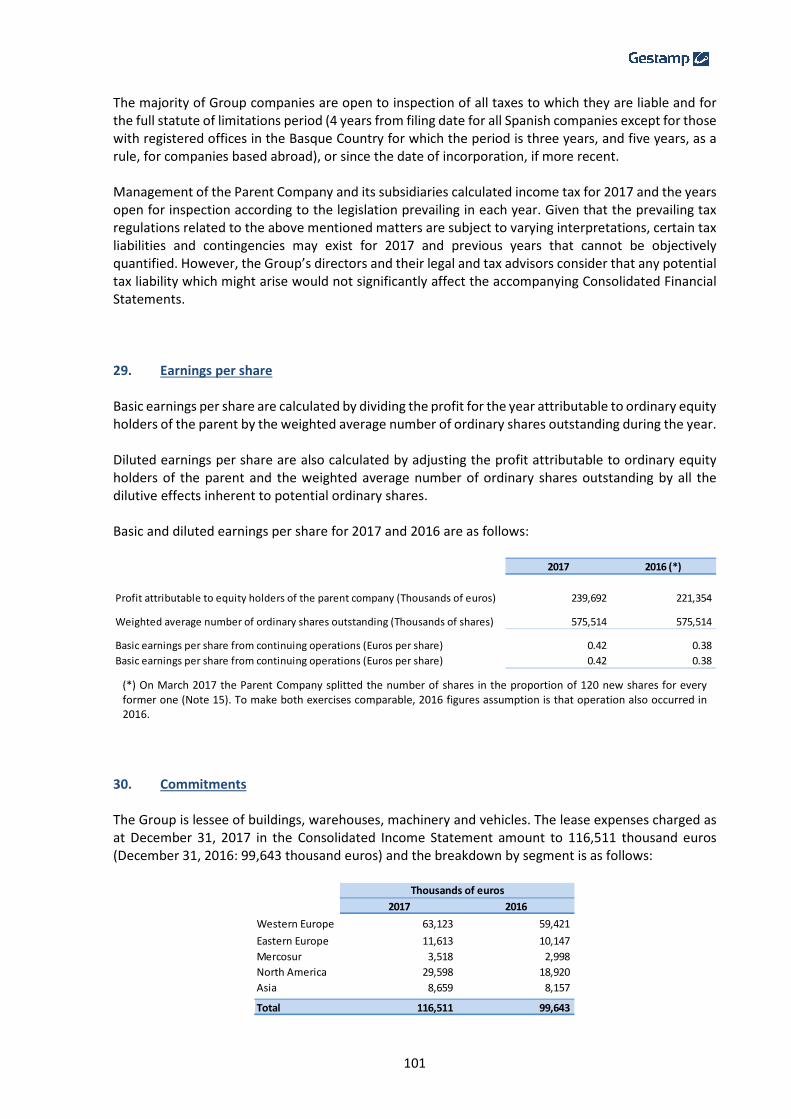
101
The majority of Group companies are open to inspection of all taxes to which they are liable and for the full statute of limitations period (4 years from filing date for all Spanish companies except for those with registered offices in the Basque Country for which the period is three years, and five years, as a rule, for companies based abroad), or since the date of incorporation, if more recent. Management of the Parent Company and its subsidiaries calculated income tax for 2017 and the years open for inspection according to the legislation prevailing in each year. Given that the prevailing tax regulations related to the above mentioned matters are subject to varying interpretations, certain tax liabilities and contingencies may exist for 2017 and previous years that cannot be objectively quantified. However, the Group’s directors and their legal and tax advisors consider that any potential tax liability which might arise would not significantly affect the accompanying Consolidated Financial Statements. 29. Earnings per share Basic earnings per share are calculated by dividing the profit for the year attributable to ordinary equity holders of the parent by the weighted average number of ordinary shares outstanding during the year. Diluted earnings per share are also calculated by adjusting the profit attributable to ordinary equity holders of the parent and the weighted average number of ordinary shares outstanding by all the dilutive effects inherent to potential ordinary shares. Basic and diluted earnings per share for 2017 and 2016 are as follows:
(*) On March 2017 the Parent Company splitted the number of shares in the proportion of 120 new shares for every former one (Note 15). To make both exercises comparable, 2016 figures assumption is that operation also occurred in 2016.
30. Commitments The Group is lessee of buildings, warehouses, machinery and vehicles. The lease expenses charged as at December 31, 2017 in the Consolidated Income Statement amount to 116,511 thousand euros (December 31, 2016: 99,643 thousand euros) and the breakdown by segment is as follows:
2017 2016 (*)
Profit attributable to equity holders of the parent company (Thousands of euros) 239,692 221,354
Weighted average number of ordinary shares outstanding (Thousands of shares) 575,514 575,514
Basic earnings per share from continuing operations (Euros per share) 0.42 0.38
Basic earnings per share from continuing operations (Euros per share) 0.42 0.38
2017 2016
Western Europe 63,123 59,421
Eastern Europe 11,613 10,147
Mercosur 3,518 2,998
North America 29,598 18,920
Asia 8,659 8,157
Total 116,511 99,643
Thousands of euros
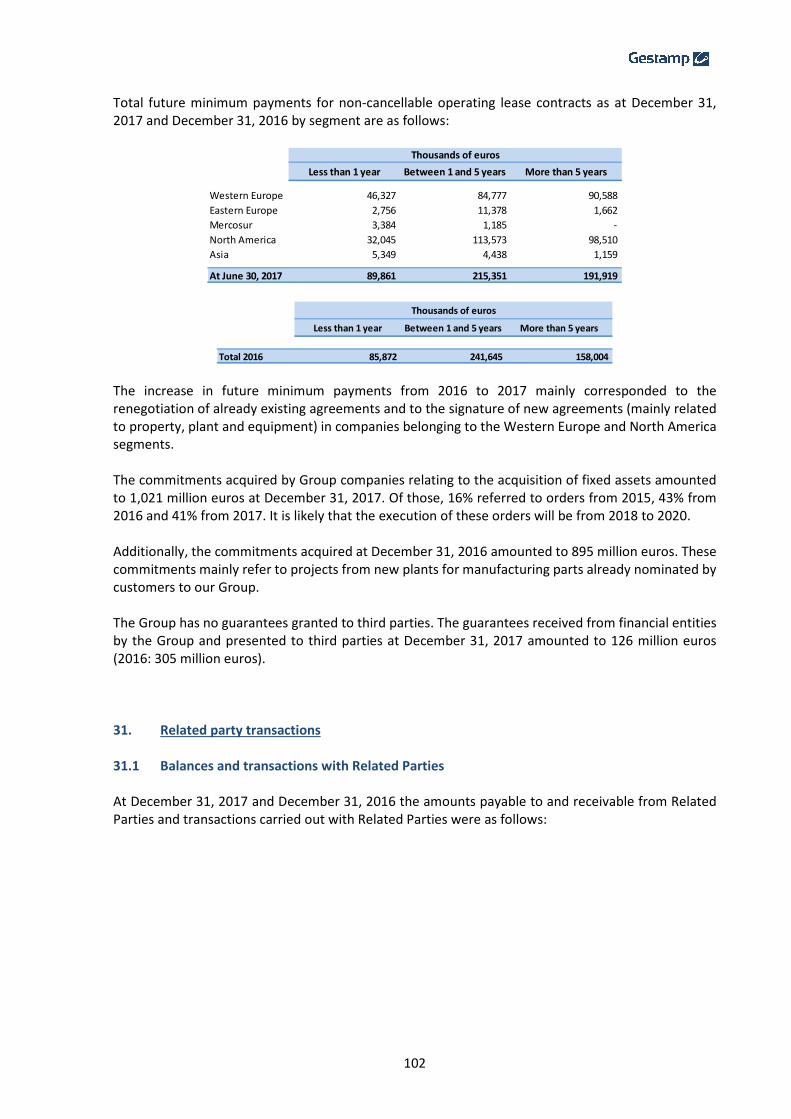
102
Total future minimum payments for non-cancellable operating lease contracts as at December 31, 2017 and December 31, 2016 by segment are as follows:
The increase in future minimum payments from 2016 to 2017 mainly corresponded to the renegotiation of already existing agreements and to the signature of new agreements (mainly related to property, plant and equipment) in companies belonging to the Western Europe and North America segments. The commitments acquired by Group companies relating to the acquisition of fixed assets amounted to 1,021 million euros at December 31, 2017. Of those, 16% referred to orders from 2015, 43% from 2016 and 41% from 2017. It is likely that the execution of these orders will be from 2018 to 2020. Additionally, the commitments acquired at December 31, 2016 amounted to 895 million euros. These commitments mainly refer to projects from new plants for manufacturing parts already nominated by customers to our Group. The Group has no guarantees granted to third parties. The guarantees received from financial entities by the Group and presented to third parties at December 31, 2017 amounted to 126 million euros (2016: 305 million euros). 31. Related party transactions 31.1 Balances and transactions with Related Parties At December 31, 2017 and December 31, 2016 the amounts payable to and receivable from Related Parties and transactions carried out with Related Parties were as follows:
Less than 1 year Between 1 and 5 years More than 5 years
Western Europe 46,327 84,777 90,588
Eastern Europe 2,756 11,378 1,662
Mercosur 3,384 1,185 -
North America 32,045 113,573 98,510
Asia 5,349 4,438 1,159
At June 30, 2017 89,861 215,351 191,919
Thousands of euros
Less than 1 year Between 1 and 5 years More than 5 years
Total 2016 85,872 241,645 158,004
Thousands of euros
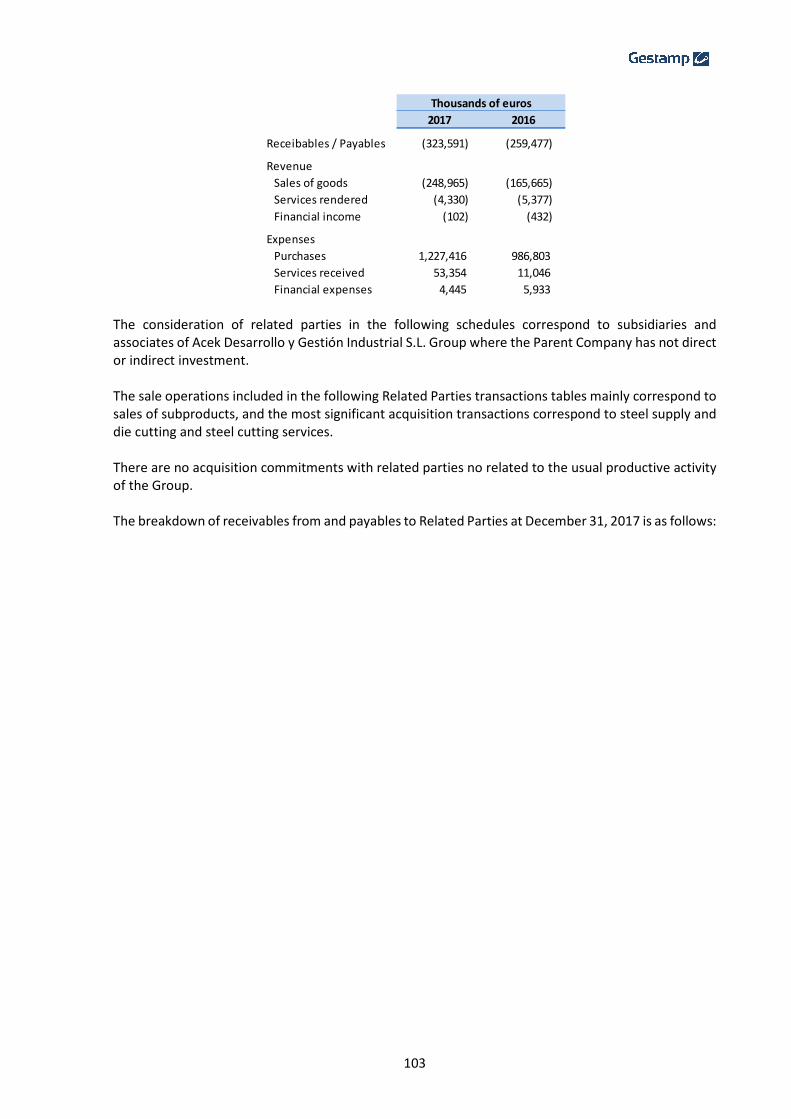
103
The consideration of related parties in the following schedules correspond to subsidiaries and associates of Acek Desarrollo y Gestión Industrial S.L. Group where the Parent Company has not direct or indirect investment. The sale operations included in the following Related Parties transactions tables mainly correspond to sales of subproducts, and the most significant acquisition transactions correspond to steel supply and die cutting and steel cutting services. There are no acquisition commitments with related parties no related to the usual productive activity of the Group. The breakdown of receivables from and payables to Related Parties at December 31, 2017 is as follows:
2017 2016
Receibables / Payables (323,591) (259,477)
Revenue
Sales of goods (248,965) (165,665)
Services rendered (4,330) (5,377)
Financial income (102) (432)
Expenses
Purchases 1,227,416 986,803
Services received 53,354 11,046
Financial expenses 4,445 5,933
Thousands of euros

104
The breakdown of receivables from and payables to Related Parties at December 31, 2016 is as follows:
Company Thousands of euros Company Thousands of euros
Shareholders Shareholders
Mitsui &Co., Ltd (18,197) Acek, Desarrollo y Gestión Industrial, S.L (1,244)
JSC Karelsky Okatysh (14,856) JSC Karelsky Okatysh (518)
Total non-current loans (Note 22.c.2) (33,053) Mitsui &Co., Ltd (94)
Associates Related parties
Esymo Metal, S.L. 320 Gonvarri I. Centro Servicios, S.L. (36)
Gestión Global de Matriceria, S.L 21,400 Total interest payable (Note 22.c.2) (1,892)
Total Current Loans 21,720 Associates
Associates Esymo Metal, S.L. 480
Esymo Metal, S.L. 1 Total Non-current Loans 480
Gestión Global de Matriceria, S.L 4 Others shareholders (5)
Total interest receivable 5 Total Dividends payable (Note 22.d) (5)
Related parties Shareholders
Gescrap Centro, S.L 1,416 Acek, Desarrollo y Gestión Industrial, S.L (945)
Gescrap France S.A.R.L. 953 Related parties
Gescrap Navarra, S.L. 345 Gonvarri Argentina S.A. (8,169)
Gescrap Polska, SP, ZOO 2,289 Gonvarri Galicia, SA (38,595)
Gescrap Desarrollo S.L.U. 1,236 Gonvarri I. Centro Servicios, S.L. (92,445)
Gescrap Bilbao, S.L. 4,697 Severstal Gonvarri Kaluga, LLC (5,300)
Gescrap Aragón, S.L. 62 Gonvarri Polska, SP, ZOO. (13,715)
Gescrap Autometal Mexico S.A. de C.V. 913 Gonvarri Ptos. Siderúrgicos, SA (20,668)
Gescrap Czech S.R.O. 66 Arcelormittal Gonvarri Brasil Ptos. Siderúrgicos, S.A (9,093)
Gescrap Rusia, Ltd. 285 Gonvauto Asturias S.L. (2,928)
Gescrap Autometal Comercio de Sucatas S.A. 843 Dongguan Gonvarri Center, LTD. (6,749)
Gestamp Solar Steel, S,L. 46 Gonvauto Navarra, SA (3,949)
Gescrap GmbH 4,143 Gonvauto Puebla S.A. de C.V. (28,165)
Gescrap Noroeste, S.L.U. 661 Gonvauto Thuringen, GMBH (11,074)
GES Recycling USA Llc. 2,290 Gonvauto, SA (27,410)
Gonvarri Galicia, SA 1,936 Gonvauto South Carolina LLC (8,314)
Gonvarri I. Centro Servicios, S.L. 1,198 Ind. Ferrodistribuidora, S.L. (1,786)
Gonvarri Industrial, S.A. (79) Láser Automotive Barcelona S.L. (1,267)
Gonvauto Navarra, SA 584 Bursa Celik Sigorta Aracilik Hizma. A.S. (37)
Gonvauto Puebla S.A. de C.V. 117 Gonvarri Czech S.R.O. (323)
Gonvauto Thuringen, GMBH 1,244 Steel & Alloy Ltd (21,380)
Gonvauto, SA 958 Inmobiliaria Acek,S.L. (132)
Steel & Alloy Ltd 612 Arcelor Group (4,162)
Others 154 Others (71)
Associates Associates
Gestamp Tooling Manufacturing Kunshan Co Ltd 395 Gestamp Tooling Manufacturing Kunshan Co Ltd (2,566)
Esymo Metal, S.L. 26 Esymo Metal, S.L. (1,690)
GGM Puebla, S.A. de C.V. 3,183 GGM Puebla, S.A. de C.V. (3,939)
Gestión Global de Matriceria, S.L 4 Gestión Global de Matriceria, S.L (330)
Global Laser Araba, S.L. 53 Global Laser Araba, S.L. (662)
Gonvvama, Ltd. 278 Ingeniería y Construcción Matrices, S.A. (955)
Hierros y Aplanaciones, S.A. 66 IxCxT, S.A. (235)
Ingeniería y Construcción Matrices, S.A. 871 Total Suppliers from related parties (Note 24.a) (317,054)
IxCxT, S.A. 103 Related parties
Total Trade receivables from related parties (Note 14.a) 31,948 Gestamp Solar Steel, S,L. (80)
Related parties Total Trade creditors, related parties (Note 24.a) (80)
Gescrap Bilbao, S.L. (93) Shareholders
Total current loans (Note 22.c.2) (93) Acek, Desarrollo y Gestión Industrial, S.L (24,256)
Shareholders Total non-current Fixed assets suppliers (Note 22.c.2) (24,256)
Acek, Desarrollo y Gestión Industrial, S.L (1,042)
Associates
GGM Puebla, S.A. de C.V. (269)
Total Other current suppliers (Note 22.d) (1,311)
Total balances receivable / payable (323,591)
Balance at December 31, 2017

105
Company Thousands of euros Company Thousands of euros
Shareholders Shareholders
Acek, Desarrollo y Gestión Industrial, S.L (31) Acek, Desarrollo y Gestión Industrial, S.L (1,292)
Total payable Current account (Note 22.c.2) (31) JSC Karelsky Okatysh (1,085)
Shareholders Related parties
Mitsui &Co., Ltd (20,771) Gonvarri I. Centro Servicios, S.L. (36)
JSC Karelsky Okatysh (21,649) Total interest payable (Note 22.c.2) (2,413)
Total non-current loans (Note 22.c.2) (42,420) Associates
Associates Esymo Metal, S.L. 800
Esymo Metal, S.L. 320 Total Non-current Loans 800
Essa Palau, S.A. 1,745 Shareholders
Gestión Global de Matriceria, S.L 8,400 Mitsui &Co., Ltd (842)
Total Current Loans 10,465 Otros socios (6)
Associates Total Dividends payable (Note 22.d) (848)
Esymo Metal, S.L. 1 Shareholders
Gestión Global de Matriceria, S.L 2 Acek, Desarrollo y Gestión Industrial, S.L (101)
Total interest receivable 3 Related parties
Shareholders Agricola La Veguilla, S.A. (18)
Acek, Desarrollo y Gestión Industrial, S.L 406 Gescrap Navarra, S.L. (2)
Related parties Gescrap Polska SPZOO (16)
Gescrap Centro, S.L 1,571 Gescrap France S.A.R.L. 2
Gescrap France S.A.R.L. 91 Gonvarri Argentina S.A. (7,903)
Gescrap Navarra, S.L. 86 Gonvarri Galicia, SA (31,988)
Gescrap Polska, SP, ZOO 258 Gonvarri Corporación Financiera, S.L. (62)
Gescrap, S.L. 803 Gonvarri I. Centro Servicios, S.L. (53,865)
Gescrap Hungría KFT 306 Gonvarri Polska, SP, ZOO. (23,714)
Gescrap Autometal Mexico S.A. de C.V. 96 Gonvarri Ptos. Siderúrgicos, SA (11,700)
Gescrap Czech S.R.O. 42 Arcelormittal Gonvarri Brasil Ptos. Siderúrgicos, S.A (2,341)
Gescrap Autometal Comercio de Sucatas S.A. 1,141 Gonvauto Asturias S.L. (1,608)
GES Recycling Ltd. 5 Gonvauto Navarra, SA (3,072)
Gescrap GmbH 1,454 Gonvauto Puebla S.A. de C.V. (16,946)
Gescrap Noroeste, S.L.U. 26 Gonvauto Thuringen, GMBH (7,590)
Gescrap Kaluga Llc. 257 Gonvauto, SA (30,220)
GES Recycling USA Llc. 852 Gonvauto South Carolina LLC (1,160)
Gonvarri Galicia, SA 1,225 Severstal Gonvarri Kaluga, LLC (135)
Gonvarri I. Centro Servicios, S.L. 264 Ind. Ferrodistribuidora, S.L. (504)
Gonvarri MS Corporate S.L. 46 Láser Automotive Barcelona S.L. (629)
Gonvauto Navarra, SA 432 Gonvarri Czech S.R.O. (771)
Gonvauto Puebla S.A. de C.V. 3 Steel & Alloy Ltd (12,143)
Gonvauto Thuringen, GMBH 3,147 Láser Automotive Gmbh (205)
Gonvauto, SA 3,199 Inmobiliaria Acek,S.L. (359)
Gonvarri Corporación Financiera, S.L. (369) Arcelor Group (1,991)
Gonvarri Polska, SP, ZOO. 5 Associates
Steel & Alloy Ltd 362 Essa Palau, S.A. (8,365)
Ind. Ferrodistribuidora, S.L. 56 Esymo Metal, S.L. (2,306)
Gestamp Energías Renovables S.L. 501 GGM Puebla, S.A. de C.V. (4,385)
Associates Gestión Global de Matriceria, S.L (444)
Gestamp Tooling Manufacturing Kunshan Co Ltd 8,166 Ingeniería y Construcción Matrices, S.A. (1,413)
Essa Palau, S.A. 1,647 IxCxT, S.A. (394)
Esymo Metal, S.L. 26 Total Suppliers from related parties (Note 24.a) (226,348)
GGM Puebla, S.A. de C.V. 2,736 Related parties
Gestión Global de Matriceria, S.L 77 Severstal Gonvarri Kaluga, LLC (4,002)
Ingeniería y Construcción Matrices, S.A. 2,540 Associates
IxCxT, S.A. 135 Gestión Global de Matriceria, S.L (11)
Jui Li Edscha Body System Co Ltd 3 Total Trade creditors, related parties (Note 24.a) (4,013)
Jui Li Edscha Hainan Co Ltd 81 ShareholdersTotal Trade receivables from related parties (Note 14.a) 31,676 Acek, Desarrollo y Gestión Industrial, S.L (25,298)
Total non-current fixed assets suppliers (Note 22.c.2) (25,298)ShareholdersAcek, Desarrollo y Gestión Industrial, S.L (978)AssociatesEsymo Metal, S.L. (72)Total Other current suppliers (Note 22.d) (1,050)
Total balances receivable / payable (259,477)
Balance at December 31, 2016
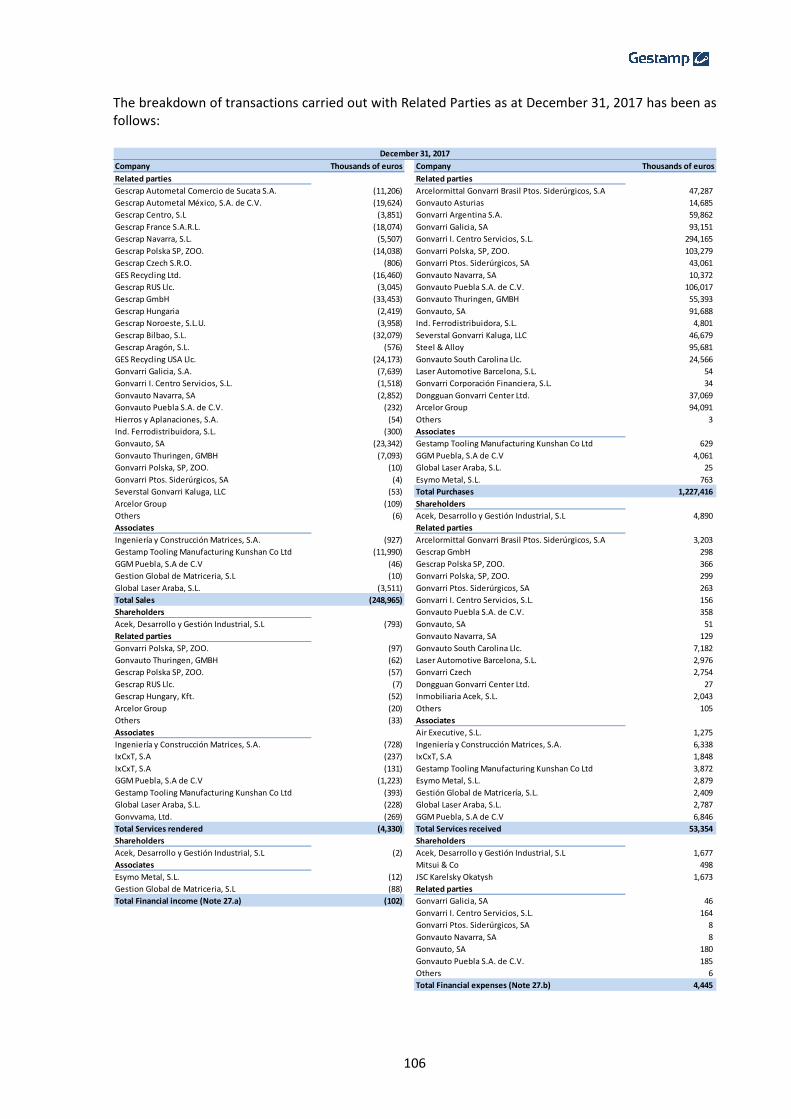
106
The breakdown of transactions carried out with Related Parties as at December 31, 2017 has been as follows:
Company Thousands of euros Company Thousands of euros
Related parties Related parties
Gescrap Autometal Comercio de Sucata S.A. (11,206) Arcelormittal Gonvarri Brasil Ptos. Siderúrgicos, S.A 47,287
Gescrap Autometal México, S.A. de C.V. (19,624) Gonvauto Asturias 14,685
Gescrap Centro, S.L (3,851) Gonvarri Argentina S.A. 59,862
Gescrap France S.A.R.L. (18,074) Gonvarri Galicia, SA 93,151
Gescrap Navarra, S.L. (5,507) Gonvarri I. Centro Servicios, S.L. 294,165
Gescrap Polska SP, ZOO. (14,038) Gonvarri Polska, SP, ZOO. 103,279
Gescrap Czech S.R.O. (806) Gonvarri Ptos. Siderúrgicos, SA 43,061
GES Recycling Ltd. (16,460) Gonvauto Navarra, SA 10,372
Gescrap RUS Llc. (3,045) Gonvauto Puebla S.A. de C.V. 106,017
Gescrap GmbH (33,453) Gonvauto Thuringen, GMBH 55,393
Gescrap Hungaria (2,419) Gonvauto, SA 91,688
Gescrap Noroeste, S.L.U. (3,958) Ind. Ferrodistribuidora, S.L. 4,801
Gescrap Bilbao, S.L. (32,079) Severstal Gonvarri Kaluga, LLC 46,679
Gescrap Aragón, S.L. (576) Steel & Alloy 95,681
GES Recycling USA Llc. (24,173) Gonvauto South Carolina Llc. 24,566
Gonvarri Galicia, S.A. (7,639) Laser Automotive Barcelona, S.L. 54
Gonvarri I. Centro Servicios, S.L. (1,518) Gonvarri Corporación Financiera, S.L. 34
Gonvauto Navarra, SA (2,852) Dongguan Gonvarri Center Ltd. 37,069
Gonvauto Puebla S.A. de C.V. (232) Arcelor Group 94,091
Hierros y Aplanaciones, S.A. (54) Others 3
Ind. Ferrodistribuidora, S.L. (300) Associates
Gonvauto, SA (23,342) Gestamp Tooling Manufacturing Kunshan Co Ltd 629
Gonvauto Thuringen, GMBH (7,093) GGM Puebla, S.A de C.V 4,061
Gonvarri Polska, SP, ZOO. (10) Global Laser Araba, S.L. 25
Gonvarri Ptos. Siderúrgicos, SA (4) Esymo Metal, S.L. 763
Severstal Gonvarri Kaluga, LLC (53) Total Purchases 1,227,416
Arcelor Group (109) Shareholders
Others (6) Acek, Desarrollo y Gestión Industrial, S.L 4,890
Associates Related parties
Ingeniería y Construcción Matrices, S.A. (927) Arcelormittal Gonvarri Brasil Ptos. Siderúrgicos, S.A 3,203
Gestamp Tooling Manufacturing Kunshan Co Ltd (11,990) Gescrap GmbH 298
GGM Puebla, S.A de C.V (46) Gescrap Polska SP, ZOO. 366
Gestion Global de Matriceria, S.L (10) Gonvarri Polska, SP, ZOO. 299
Global Laser Araba, S.L. (3,511) Gonvarri Ptos. Siderúrgicos, SA 263
Total Sales (248,965) Gonvarri I. Centro Servicios, S.L. 156
Shareholders Gonvauto Puebla S.A. de C.V. 358
Acek, Desarrollo y Gestión Industrial, S.L (793) Gonvauto, SA 51
Related parties Gonvauto Navarra, SA 129
Gonvarri Polska, SP, ZOO. (97) Gonvauto South Carolina Llc. 7,182
Gonvauto Thuringen, GMBH (62) Laser Automotive Barcelona, S.L. 2,976
Gescrap Polska SP, ZOO. (57) Gonvarri Czech 2,754
Gescrap RUS Llc. (7) Dongguan Gonvarri Center Ltd. 27
Gescrap Hungary, Kft. (52) Inmobiliaria Acek, S.L. 2,043
Arcelor Group (20) Others 105
Others (33) Associates
Associates Air Executive, S.L. 1,275
Ingeniería y Construcción Matrices, S.A. (728) Ingeniería y Construcción Matrices, S.A. 6,338
IxCxT, S.A (237) IxCxT, S.A 1,848
IxCxT, S.A (131) Gestamp Tooling Manufacturing Kunshan Co Ltd 3,872
GGM Puebla, S.A de C.V (1,223) Esymo Metal, S.L. 2,879
Gestamp Tooling Manufacturing Kunshan Co Ltd (393) Gestión Global de Matricería, S.L. 2,409
Global Laser Araba, S.L. (228) Global Laser Araba, S.L. 2,787
Gonvvama, Ltd. (269) GGM Puebla, S.A de C.V 6,846
Total Services rendered (4,330) Total Services received 53,354
Shareholders Shareholders
Acek, Desarrollo y Gestión Industrial, S.L (2) Acek, Desarrollo y Gestión Industrial, S.L 1,677
Associates Mitsui & Co 498
Esymo Metal, S.L. (12) JSC Karelsky Okatysh 1,673
Gestion Global de Matriceria, S.L (88) Related parties
Total Financial income (Note 27.a) (102) Gonvarri Galicia, SA 46
Gonvarri I. Centro Servicios, S.L. 164
Gonvarri Ptos. Siderúrgicos, SA 8
Gonvauto Navarra, SA 8
Gonvauto, SA 180
Gonvauto Puebla S.A. de C.V. 185
Others 6
Total Financial expenses (Note 27.b) 4,445
December 31, 2017

107
The breakdown of transactions carried out with Related Parties as at December 31, 2016 has been as follows:
Company Thousands of euros Company Thousands of euros
Related parties Related parties
Gescrap Autometal Comercio de Sucata S.A. (7,625) Arcelormittal Gonvarri Brasil Ptos. Siderúrgicos, S.A 19,296
Gescrap S.L. (29,419) Gonvauto Asturias S.L. 10,234
Gescrap Centro, S.L (2,522) Gonvarri Argentina S.A. 45,414
Gescrap France S.A.R.L. (12,412) Gonvarri Galicia, SA 75,030
Gescrap Navarra, S.L. (3,987) Gonvarri I. Centro Servicios, S.L. 198,962
Gescrap Polska SPZOO (6,947) Gonvarri Polska, SP, ZOO. 78,044
Gescrap Czech S.R.O. (482) Gonvarri Ptos. Siderúrgicos, SA 32,505
Gescrap Hungría KFT (1,372) Gonvauto Navarra, SA 11,348
GES Recycling Ltd. (1,291) Gonvauto Puebla S.A. de C.V. 64,761
Gescrap GmbH (6,701) Gonvauto Thuringen, GMBH 81,689
Gescrap Noroeste S.L.U. (2,411) Gonvauto, SA 88,158
Gescrap Kaluga Llc. (2,234) Hierros y Aplanaciones S.A. (55)
Gescrap Autometal México, S.A. de C.V. (11,621) Ind. Ferrodistribuidora, S.L. 1,824
GES Recycling USA Llc. (8,486) Severstal Gonvarri Kaluga, LLC 46,888
Gonvarri Galicia, SA (6,194) Steel & Alloy Ltd. 74,521
Gonvarri I. Centro Servicios, S.L. (1,385) Gonvauto South Carolina Llc. 8,485
Gonvauto Navarra, SA (3,079) Laser Automotive Barcelona S.L. 2,414
Gonvauto Puebla S.A. de C.V. (356) Gonvarri Czech S.R.O. 2,524
Gonvauto, SA (36,678) Laser Automotive Thuringen GmbH 815
Gonvauto Thuringen, GMBH (9,729) Gonvarri Corporación Financiera, S.L. 82
Severstal Gonvarri Kaluga, LLC (84) Grupo Arcelor 57,675
Ind. Ferrodistribuidora, S.L. (46) Associates
Associates Esymo Metal, S.L. 3,358
Ingeniería y Construcción Matrices, S.A. (830) Jui Li Edscha Body Systems Co. Ltd. 7
Jui Li Edscha Hainan Co. Ltd. (70) Ingeniería y Construcción Matrices, S.A. 7,831
Essa Palau, S.A. (6,455) IxCxT, S.A 580
GGM Puebla, S.A de C.V (2,599) GGM Puebla, S.A de C.V 12,374
Gestión Global de Matricería, S.L. (650) Essa Palau, S.A. 62,039
Total Sales (165,665) Total Purchases 986,803
Shareholders Shareholders
Acek, Desarrollo y Gestión Industrial, S.L (1,976) Acek, Desarrollo y Gestión Industrial, S.L 3,341
Related parties Related parties
Gonvarri Polska, SP, ZOO. (4) Air Executive, S.L. 1,417
Gonvarri Ptos. Siderúrgicos, SA (1) Agricola La Veguilla, S.A. 161
Gonvauto Thuringen, GMBH (75) Gescrap S.L. 202
Gonvarri Corporación Financiera, S.L. (5) Gescrap Navarra, S.L. 13
Inmobiliaria Acek, S.L (12) Gescrap Polska SPZOO 39
Gestamp Energías Renovables S.L. (414) Gonvarri I. Centro Servicios, S.L. 80
Gescrap S.L. (1) Gonvarri Polska, SP, ZOO. 10
Gescrap Autometal México, S.A. de C.V. (41) Gonvarri Ptos. Siderúrgicos, SA 305
Gescrap Autometal México Servicios, S.A. de C.V. (3) Gonvauto Puebla S.A. de C.V. 114
Gescrap France S.A.R.L. (37) Gonvauto, SA 11
Gescrap Polska SPZOO (65) Gonvarri Corporación Financiera, S.L. 2
Associates Laser Automotive Barcelona S.L. 5
Gestamp Tooling Manufacturing Kunshan Co Ltd (126) Ind. Ferrodistribuidora, S.L. 2
Esymo Metal, S.L. (126) Gonvauto Asturias S.L. (1)
Ingeniería y Construcción Matrices, S.A. (745) Gonvauto South Carolina Llc. (6)
IxCxT, S.A (242) Gonvarri Galicia, SA 90
Jui Li Edscha Body Systems Co. Ltd. (1) Gonvarri Czech S.R.O. 13
Jui Li Edscha Hainan Co. Ltd. (10) Inmobiliaria Acek, S.L 2,095
Essa Palau, S.A. (303) Associates
GGM Puebla, S.A de C.V (1,170) Esymo Metal, S.L. 397
Gestión Global de Matricería, S.L. (20) Ingeniería y Construcción Matrices, S.A. 184
Total Services rendered (5,377) IxCxT, S.A 83
Shareholders Essa Palau, S.A. (142)
Acek, Desarrollo y Gestión Industrial, S.L (11) Gestión Global de Matricería, S.L. 2,443
Associates GGM Puebla, S.A de C.V 188
Esymo Metal, S.L. (17) Total Services received 11,046
Essa Palau, S.A. (302) Shareholders
Gestión Global de Matricería, S.L. (102) Acek, Desarrollo y Gestión Industrial, S.L 1,851 Total Financial income (Note 27.a) (432) Mitsui & Co 933
JSC Karelsky Okatysh 2,138 Related partiesGonvarri Corporación Financiera, S.L. 77 Gonvarri Galicia, SA 247 Gonvarri I. Centro Servicios, S.L. 64 Gonvarri Ptos. Siderúrgicos, SA 83 Gonvauto Navarra, SA 10 Gonvauto, SA 188 Gonvauto Puebla S.A. de C.V. 342 Total Financial expenses (Note 27.b) 5,933
December 31, 2016
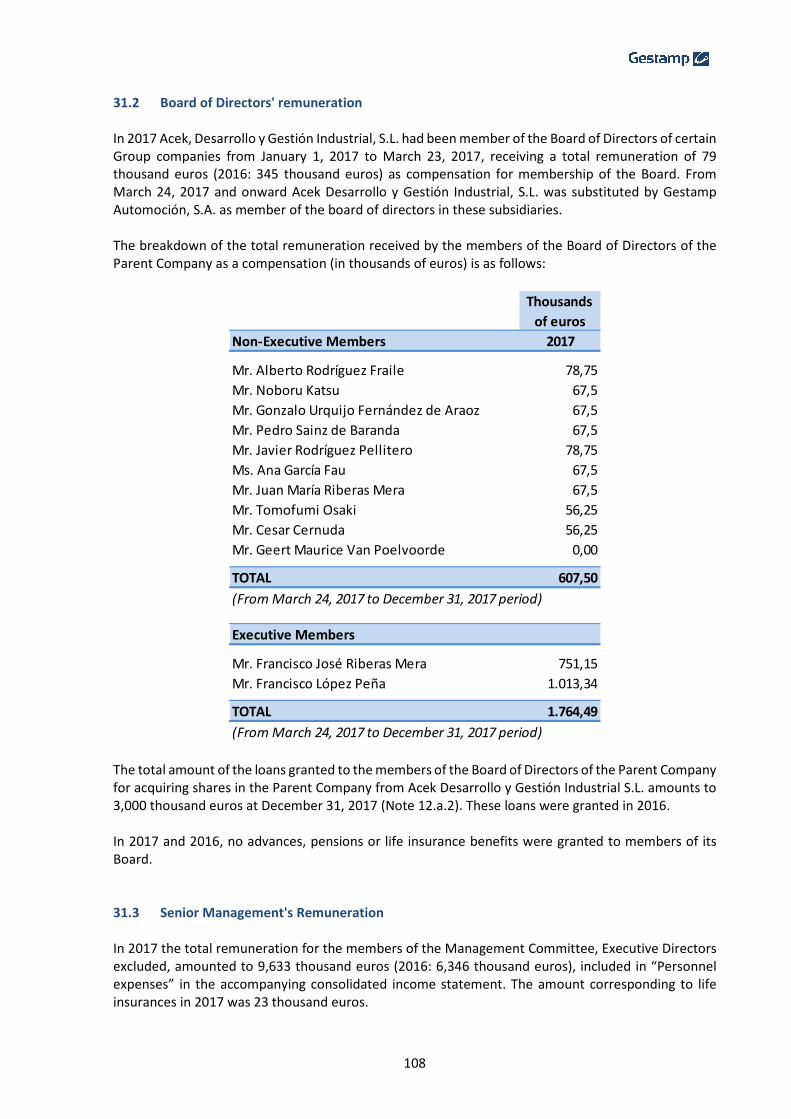
108
31.2 Board of Directors' remuneration In 2017 Acek, Desarrollo y Gestión Industrial, S.L. had been member of the Board of Directors of certain Group companies from January 1, 2017 to March 23, 2017, receiving a total remuneration of 79 thousand euros (2016: 345 thousand euros) as compensation for membership of the Board. From March 24, 2017 and onward Acek Desarrollo y Gestión Industrial, S.L. was substituted by Gestamp Automoción, S.A. as member of the board of directors in these subsidiaries. The breakdown of the total remuneration received by the members of the Board of Directors of the Parent Company as a compensation (in thousands of euros) is as follows:
The total amount of the loans granted to the members of the Board of Directors of the Parent Company for acquiring shares in the Parent Company from Acek Desarrollo y Gestión Industrial S.L. amounts to 3,000 thousand euros at December 31, 2017 (Note 12.a.2). These loans were granted in 2016. In 2017 and 2016, no advances, pensions or life insurance benefits were granted to members of its Board. 31.3 Senior Management's Remuneration In 2017 the total remuneration for the members of the Management Committee, Executive Directors excluded, amounted to 9,633 thousand euros (2016: 6,346 thousand euros), included in “Personnel expenses” in the accompanying consolidated income statement. The amount corresponding to life insurances in 2017 was 23 thousand euros.
Thousands
of euros
Non-Executive Members 2017
Mr. Alberto Rodríguez Fraile 78,75
Mr. Noboru Katsu 67,5
Mr. Gonzalo Urquijo Fernández de Araoz 67,5
Mr. Pedro Sainz de Baranda 67,5
Mr. Javier Rodríguez Pellitero 78,75
Ms. Ana García Fau 67,5
Mr. Juan María Riberas Mera 67,5
Mr. Tomofumi Osaki 56,25
Mr. Cesar Cernuda 56,25
Mr. Geert Maurice Van Poelvoorde 0,00
TOTAL 607,50
(From March 24, 2017 to December 31, 2017 period)
Executive Members
Mr. Francisco José Riberas Mera 751,15
Mr. Francisco López Peña 1.013,34
TOTAL 1.764,49
(From March 24, 2017 to December 31, 2017 period)
109
In 2016 loans amounting to 11,500 thousand euros were granted to the members of the Management Committee, except those who are members of the Board of Directors and who are included in Note 31.2, for acquiring shares in the Parent Company from Acek Desarrollo y Gestión Industrial S.L. (Note 12.a.2). 32. Other disclosures 32.1 Audit fees Audit fees related to the annual audit of consolidated and individual financial statements of the companies included in the consolidation scope for 2017 amounted to 4,276 thousand euros (2016: 3,950 thousand euros). Of the audit fees mentioned above, the fees paid to the auditor of the Parent Company for all audit work performed for the Group in 2017 amounted to 4,235 thousand euros (2016: 3,892 thousand euros). Fees paid to the auditor of the Parent Company and companies with their trade name for other services related to annual audit of the financial estatements amounted to 361 thousand euros in 2017 (2016: 20 thousand euros) Fees paid for other services rendered by the auditor of the Parent Company and companies with their trade name in 2017 amounted to 712 thousand euros (2016: 671 thousand euros). The nature of these services is mainly related to the collaboration in tax issues and in due diligence processes linked to new subsidiaries acquisition. 32.2 Environmental issues The cost of PP&E items acquired for environmental protection and improvement purposes amounted to 4,973 thousand euros at year end 2017. Accumulated depreciation on these assets stood at 2,539 thousand euros (2016: 5,152 thousand euros and 3,182 thousand euros, respectively). In 2017, the Group also recognized 1,396 thousand euros in environmental protection and improvement expenses (2016: 853 thousand euros). The accompanying consolidated balance sheet does not include any provision for environmental issues given that the Parent Company’s directors consider that at year end there are no liabilities to be settled in the future in connection with actions taken by the companies which comprise the consolidated Group to prevent, reduce or repair damages to the environment, and they believe that were such liabilities to exist, they would not be significant. At year end the Group had not received any subsidies for environmental issues. 33. Financial risk management To manage its financial risk, the Group continually revises its business plans, analyses the relationship between the risks and the present value of cash flows associated with its investments in addition to taking an accounting approach that allows an assessment of changes in risk exposure.
110
33.1 Financial risk factors In compliance with prevailing legislation, below is a description of the main financial risks to which the Group is exposed:
� Market risk
o Exposure to fluctuations in foreign exchange rates o Exposure to fluctuations in interest rates
� Liquidity risk
� Credit risk
� Raw material price risk
Foreign currency risk
Fluctuations in the exchange rate between the currency in which a transaction is denominated and the Group’s presentation currency can have a negative or positive impact on its profit or loss, specifically affecting management of its financial debt. The Group operates in the following currencies:
Euro US dollar Mexican peso Argentine peso Brazilian real British pound Swedish crown Polish zloty Hungarian forint Turkish lira Indian rupee Korean won Chinese yuan Russian rubble Czech crown Japanese yen Thai baht Romanian Leu Taiwanese Dollar
To manage exchange rate risk, the Group uses a series of financial instruments that give it a degree of flexibility, basically comprised of the following:
A. Foreign currency forward contracts: These arrangements lock in the price at which an entity can buy or sell a currency on a set date; the timing can be adjusted to align the transactions with the hedged cash flows.
B. "Puttable instruments": Other derivatives are also used to hedge currency risk, including those designed to lock in a maximum or minimum exchange rate (collar or tunnel) at a set settlement date.
At December 31, 2017 and December 31, 2016 these instruments were not arranged. The tables below show the sensitivity of profit and equity, in thousands of euros, to changes in exchange rates relative to the euro. The sensitivity of profit to exchange rate fluctuations, corresponding to years 2017 and 2016, is as follows:

111
The sensitivity of equity to exchange rate fluctuations, corresponding to years 2017 and 2016, is as follows:
Currency 5% Fluctuation-5% Fluctuation
Swedish crown (1,458) 1,458
US dollar (1,480) 1,480
Hungarian florint (738) 738
GB pound 816 (816)
Mexican peso 1,182 (1,182)
Brazilian real (244) 244
Chinese yuan 1,158 (1,158)
Indian rupee 255 (255)
Turkish lira 775 (775)
Argentine peso 369 (369)
Russian ruble 109 (109)
Korean won 301 (301)
Polish zloty 889 (889)
Czech crown 202 (202)
Japanese yen (25) 25
Thai baht 17 (17)
Romanian leu 43 (43)
Taiwanese dollar 3 (3)
IMPACT IN ABSOLUTE TERMS 2,174 (2,174)
PROFIT ATTRIBUTABLE
TO EQUITY HOLDERS OF
PARENT COMPANY 239,692 239,692
EFFECT IN RELATIVE TERMS 0.91% -0.91%
2017
IMPACT ON PROFIT
Currency 5% Fluctuation-5% Fluctuation
Swedish crown (1,311) 1,311
US dollar 80 (80)
Hungarian forint (740) 740
GB pound 631 (631)
Mexican peso 151 (151)
Brazilian real (470) 470
Chinese yuan 1,961 (1,961)
Indian rupee 379 (379)
Turkish lira 357 (357)
Argentine peso 31 (31)
Russian ruble 6 (6)
Korean won 453 (453)
Polish zloty 1,096 (1,096)
Czech crown 265 (265)
Japanese yen 57 (57)
Thai baht 18 (18)
IMPACT IN ABSOLUTE TERMS 2,964 (2,964)
PROFIT ATTRIBUTABLE
TO EQUITY HOLDERS OF
PARENT COMPANY 221,354 221,354
EFFECT IN RELATIVE TERMS 1.34% -1.34%
2016
IMPACT ON PROFIT

112
The amounts above had been calculated increasing or decreasing a 5% the exchange rates used to translate to euros the income statements and the equity of the subsidiary companies.
2017
Currency 5% Fluctuation -5% fluctuation
Swedish crown (4,133) 4,133
US dollar 3,121 (3,121)
Hungarian forint (3,850) 3,850
GB pound 8,318 (8,318)
Mexican peso 303 (303)
Brazilian real 2,702 (2,702)
Chinese yuan 11,756 (11,756)
Indian rupee 2,006 (2,006)
Turkish lira 797 (797)
Argentine peso (2,645) 2,645
Russian ruble (4,389) 4,389
Korean won 2,166 (2,166)
Polish zloty 860 (860)
Czech crown 135 (135)
Japanese yen (168) 168
Thai baht 116 (116)
Romanian leu 126 (126)
Taiwanese dollar 21 (21)
IMPACT IN ABSOLUTE TERMS 17,242 (17,242)
EQUITY 1,970,555 1,970,555
EFFECT IN RELATIVE TERMS 0.87% -0.87%
IMPACT ON EQUITY
2016
Currency 5% Fluctuation -5% fluctuation
Swedish crown (2,667) 2,667
US dollar 5,555 (5,555)
Hungarian forint (3,090) 3,090
Sterling pound 7,875 (7,875)
Mexican peso (520) 520
Brazilian real 3,400 (3,400)
Chinese yuan 11,183 (11,183)
Indian rupee 1,700 (1,700)
Turkish lira 243 (243)
Argentine peso (2,571) 2,571
Russian ruble (4,293) 4,293
Korean won 1,868 (1,868)
Polish zloty 1,988 (1,988)
Czech crown (201) 201
Japanese yen (67) 67
Thai baht 89 (89)
IMPACT IN ABSOLUTE TERMS 20,490 (20,490)
1,872,003 1,872,003
EFFECT IN RELATIVE TERMS 1.09% -1.09%
IMPACT ON EQUITY
EQUITY

113
In 2017, consolidated equity decreased in 199.8 million euros due to translation differences variation. This variation is mainly due to investment outside Eurozone. Interest rate risk The Group’s borrowings mainly bear interest at floating rates, exposing it to risk from fluctuations in market interest rates, so that market fluctuations affect cash flows. The Group mitigates this risk by using interest rate derivatives, mainly swaps, by which it converts the floating rate on a loan into a fixed rate. It may swap the rate on a portion of the loan or on the entire loan, and for its entire duration or a part thereof. In general, the Group’s borrowings are at floating rates indexed to Euribor except the bond issued by the Group on May 2016, which bears a fixed interest rate. Had the average interest on euro denominated financial borrowings changed in 50 Bps in 2017, all other variables remaining constant, the finance result would have changed in 7,102 thousand euros. Had the average interest on euro denominated financial borrowings changed in 50 Bps in 2016, all other variables remaining constant, the finance result would have changed in 3,764 thousand euros.
Liquidity risk Liquidity risk is defined as the risk that a company will not be able to service its commitments as a result of adverse conditions in the debt and/or equity markets that prevent or hinder its capital raising efforts. The Group manages liquidity risk by maintaining sufficient cash balances to enable it to negotiate refinancing on the best possible terms and to cover its short term cash outlays, thereby avoiding the need to raise funds on disadvantageous terms. The breakdown of liquidity and capital resources at December 31, 2017 and 2016 was as follows:
The amount corresponding to undrawn credit lines correspond to committed operation with several banks with a maturity of less than 12 months, meanwhile the Revolving credit facilities will attain its maturity on July 15, 2022. Liquidity reserves with maturity of more than 12 months, in absence of additional financing operations, will serve to cover debt maturities in 2018 for the amount of 544 million euros (Note 22.a.2); plus the cash flows from investment activities net of cash flow from operating activities (in 2017 this implied a cash need of 196 million euros as shown in the Consolidated Cash Flow Statement); and plus the payment of dividends that mounted to 73 million euros in 2017. The working capital can be defined as the permanent financial resources needed to carry out the activity of the company, that is, the part of current assets financed with long-term funds.
2017 2016
Cash and cash equivalents 860,238 430,463
Current financial investments
Debt securities 5,376 338
Revolving credit facilities (Note 22.a.1.I) 280,000 280,000
Undrawn credit lines 642,962 457,287
1,788,576 1,168,088
Thousands of euros
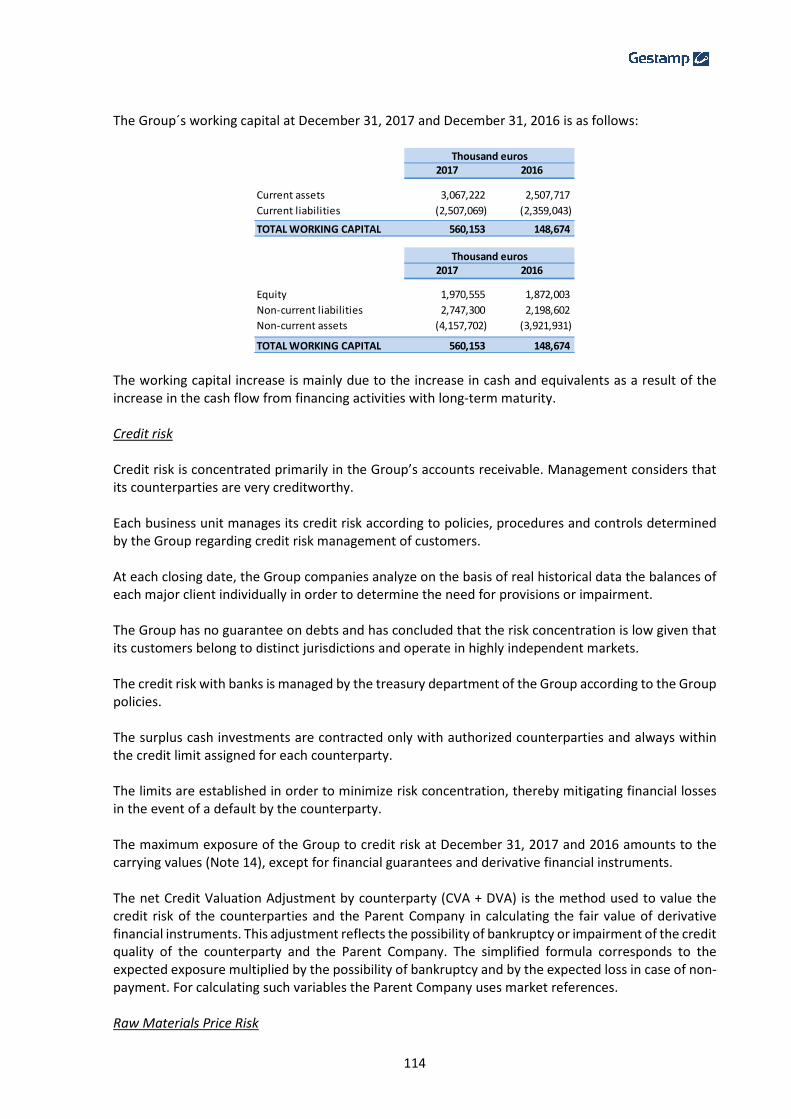
114
The Group´s working capital at December 31, 2017 and December 31, 2016 is as follows:
The working capital increase is mainly due to the increase in cash and equivalents as a result of the increase in the cash flow from financing activities with long-term maturity. Credit risk
Credit risk is concentrated primarily in the Group’s accounts receivable. Management considers that its counterparties are very creditworthy. Each business unit manages its credit risk according to policies, procedures and controls determined by the Group regarding credit risk management of customers. At each closing date, the Group companies analyze on the basis of real historical data the balances of each major client individually in order to determine the need for provisions or impairment. The Group has no guarantee on debts and has concluded that the risk concentration is low given that its customers belong to distinct jurisdictions and operate in highly independent markets. The credit risk with banks is managed by the treasury department of the Group according to the Group policies. The surplus cash investments are contracted only with authorized counterparties and always within the credit limit assigned for each counterparty. The limits are established in order to minimize risk concentration, thereby mitigating financial losses in the event of a default by the counterparty. The maximum exposure of the Group to credit risk at December 31, 2017 and 2016 amounts to the carrying values (Note 14), except for financial guarantees and derivative financial instruments. The net Credit Valuation Adjustment by counterparty (CVA + DVA) is the method used to value the credit risk of the counterparties and the Parent Company in calculating the fair value of derivative financial instruments. This adjustment reflects the possibility of bankruptcy or impairment of the credit quality of the counterparty and the Parent Company. The simplified formula corresponds to the expected exposure multiplied by the possibility of bankruptcy and by the expected loss in case of non-payment. For calculating such variables the Parent Company uses market references. Raw Materials Price Risk
2017 2016
Current assets 3,067,222 2,507,717
Current liabilities (2,507,069) (2,359,043)
TOTAL WORKING CAPITAL 560,153 148,674
2017 2016
Equity 1,970,555 1,872,003
Non-current liabilities 2,747,300 2,198,602
Non-current assets (4,157,702) (3,921,931)
TOTAL WORKING CAPITAL 560,153 148,674
Thousand euros
Thousand euros
115
The steel is the main raw material used in the business. For 2017, 63% of the steel was purchased through "re-sale" programs with customers (60% in 2016), whereby the OEM periodically negotiates with the steel maker the price of the steel that Gestamp uses for the production of automotive components. Any fluctuations in steel prices are directly adjusted in the selling price of the final product. In the case of products that use steel not purchased under "re-sale", the OEMs adjust Gestamp’s selling prices based on the steel prices they have negotiated with steel suppliers. Historically, the Group has negotiated and agreed its purchase contracts with steel suppliers under terms such that the impact (whether positive or negative) of the steel price fluctuation in these cases is minimal.
Hence Gestamp considers that the Group's exposure to steel price fluctuations is not significant. 33.2 Hedge accounting For the purpose of hedge accounting, the Group classifies its hedges as:
� Fair value hedges when hedging the exposure to changes in the market value of a recognized asset or liability, or of a firm commitment attributable to a specific risk.
� Cash flow hedges when hedging exposure to fluctuations in cash flows that are either attributable to a particular risk associated with a recognized asset or liability, or a highly probable forecast transaction.
� Hedges of a net investment in a foreign operation when hedging exposure to variability in exchange rates relative to a net investment in a foreign operation.
Such derivative financial instruments are initially recognized at acquisition cost and are subsequently valued at fair value. Changes in fair value are normally accounted for in keeping with specific hedge accounting criteria. The accounting for these instruments is carried out as follows:
� Fair value hedges: changes in the fair value of the hedging instrument and the hedged item, in both instances attributable to the risk hedged, are recognized in the Consolidated Income Statement.
� Cash flow hedges: changes in the fair value of the hedging instrument attributable to the risk hedged, as long as the hedge is effective, are recognized in “Retained earnings” in equity. Amounts taken to equity are transferred to the Consolidated Income Statement when the hedged cash flows affect profit or loss.
� Hedges of a net investment in a foreign operation: these hedges are accounted for in a way similar to cash flow hedges. Fair value gains or losses in these hedging instruments are recognized in "Translation differences." If a foreign operation is sold, the cumulative value of any such gains or losses recognized directly in equity ("Translation differences ") is transferred to the Consolidated Income Statement.
116
33.3 Fair value of financial instruments The fair value of financial instruments is determined as follows:
� The fair value of financial instruments that are actively traded in organized financial markets is determined by reference to quoted market prices.
� Where there is no active market, fair value is determined using cash flow analysis discounted at market discount rates and based on market assumptions at the time of the estimate.
Non-current financial assets There is no difference between the fair value and carrying amount of non-current loans granted since they all accrue interest at floating rates. Equity investments are carried on the Condensed Consolidated Balance Sheet at fair value when they can be valued reliably. Since it is usually not possible to measure the fair value of shareholdings in unlisted companies reliably, these investments are valued at acquisition cost or lower if there is evidence of impairment. Changes in fair value, net of the related tax effect, are recognized with a charge or credit, as appropriate, to “Retained earnings” within Equity until these investments are sold, at which time the cumulative amount recognized in equity is recognized in full in the Consolidated Income Statement. If fair value is lower than acquisition cost, the difference is recognized directly in equity, unless the asset is determined to be impaired, in which case it is recognized in the Consolidated Income Statement. Trade receivables For receivables due in less than one year, the Group considers the carrying amount a reasonable approximation of fair value. Current financial assets There is no difference between the fair value and carrying amount of short term loans granted since they all accrue interest at market rates. For other current financial assets, as their maturity is near the financial year end, the Group considers their carrying amounts a reasonable approximation of fair value. Interest-bearing loans and borrowings For current and non-current bank borrowings there is no difference between fair value and carrying amount since all these borrowings carry interest at market rates. Trade and other payables The Group’s management considers the carrying amount of the items recorded in this Consolidated Balance Sheet line item to be a reasonable approximation of fair value. Fair values of financial instruments The fair values of current and non-current financial assets and liabilities do not differ significantly from their respective carrying amounts.

117
The Group uses the following sequence of three levels, based on the relevance of the variables used, to measure the fair value of its financial instruments:
• Level 1: Unadjusted quoted price for identical assets or liabilities in active markets.
• Level 2: Variables which are observably different from the prices quoted in Level 1, either directly (price), or indirectly (derived from the price).
• Level 3: Variables which are not based on observable market data (non-observable variables).
The classification of financial assets recognized in the Consolidated Financial Statements, by methodology of fair value measurement, is as follows:
The classification of financial liabilities at fair value in the Consolidated Financial Statements, according to their relevant valuation methodology, is as follows:
33.4 Capital risk management The objective of the Group’s capital management is to protect its ability to continue as a going concern, upholding the commitment to remain solvent and to maximize shareholder value. The Group monitors its capital structure based on its leverage ratio. It defines leverage as net debt (financial borrowings, financial leasing, borrowing from related parties and other financial liabilities less short-term investments and cash and cash equivalents) divided by total equity (consolidated equity plus grants pending release to the income statement). The Group’s leverage is set forth below:
2017 2016 2017 2016 2017 2016
Financial assets measured at fair value
Financial derivative hedging instruments (Note 12.a.3) 14,718 25,710
Total - - 14,718 25,710 - -
Thousands of euros
Level 3Level 1 Level 2
2017 2016 2017 2016 2017 2016
Financial derivative hedging instruments 54,287 74,860
Financial derivative instruments held-for-trading 11,914 13,123
Total Financial derivative instruments (Note 22.b.1)) 66,201 87,983
Other current liabilities - Put Option (Note 22.d)) 76,900
Defined benefit plans (Note 21.b)) 79,469 77,528
Total 79,469 77,528 66,201 87,983 76,900
Thousands of euros
Level 1 Level 2 Level 3
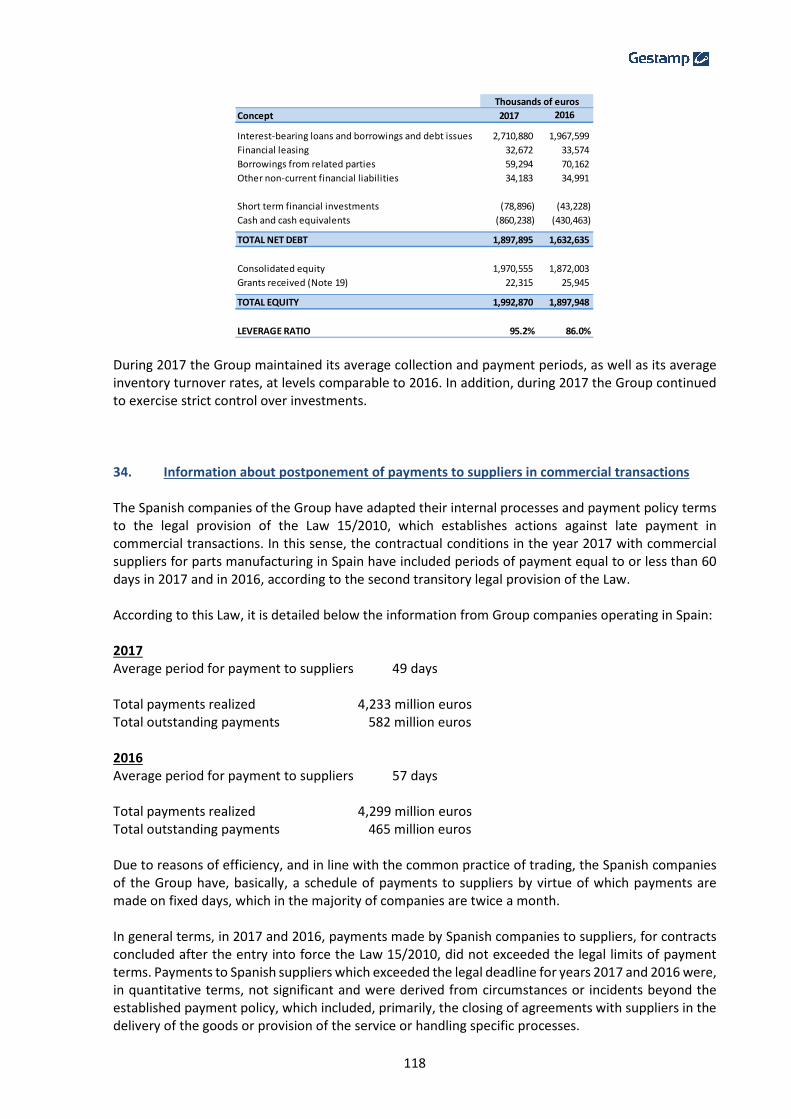
118
During 2017 the Group maintained its average collection and payment periods, as well as its average inventory turnover rates, at levels comparable to 2016. In addition, during 2017 the Group continued to exercise strict control over investments. 34. Information about postponement of payments to suppliers in commercial transactions The Spanish companies of the Group have adapted their internal processes and payment policy terms to the legal provision of the Law 15/2010, which establishes actions against late payment in commercial transactions. In this sense, the contractual conditions in the year 2017 with commercial suppliers for parts manufacturing in Spain have included periods of payment equal to or less than 60 days in 2017 and in 2016, according to the second transitory legal provision of the Law. According to this Law, it is detailed below the information from Group companies operating in Spain: 2017 Average period for payment to suppliers 49 days Total payments realized 4,233 million euros Total outstanding payments 582 million euros 2016 Average period for payment to suppliers 57 days Total payments realized 4,299 million euros Total outstanding payments 465 million euros Due to reasons of efficiency, and in line with the common practice of trading, the Spanish companies of the Group have, basically, a schedule of payments to suppliers by virtue of which payments are made on fixed days, which in the majority of companies are twice a month. In general terms, in 2017 and 2016, payments made by Spanish companies to suppliers, for contracts concluded after the entry into force the Law 15/2010, did not exceeded the legal limits of payment terms. Payments to Spanish suppliers which exceeded the legal deadline for years 2017 and 2016 were, in quantitative terms, not significant and were derived from circumstances or incidents beyond the established payment policy, which included, primarily, the closing of agreements with suppliers in the delivery of the goods or provision of the service or handling specific processes.
Concept 2017 2016
Interest-bearing loans and borrowings and debt issues 2,710,880 1,967,599
Financial leasing 32,672 33,574
Borrowings from related parties 59,294 70,162
Other non-current financial liabilities 34,183 34,991
Short term financial investments (78,896) (43,228)
Cash and cash equivalents (860,238) (430,463)
TOTAL NET DEBT 1,897,895 1,632,635
Consolidated equity 1,970,555 1,872,003
Grants received (Note 19) 22,315 25,945
TOTAL EQUITY 1,992,870 1,897,948
LEVERAGE RATIO 95.2% 86.0%
Thousands of euros

119
In addition, at December 31, 2017 and 2016 there were no outstanding amounts of payment to suppliers located in Spain exceeding the maximum legal payment terms. 35. Subsequent events There are no significant subsequent events as at December 31, 2017. 36. Information about compliance with the Article 229 of the Spanish Corporate Enterprises Act According to the articles 229 and 231 of the Spanish Corporate Enterprises Act and with the aim of reinforcing the transparency of capital companies, the joint administrators of the Parent Company and their representative natural persons have reported they have no situations of conflict with the interest of the Parent Company nor the subsidiaries. Additionally, Mr. Francisco José Riberas Mera and Mr. Juan María Riberas Mera, members of the Board of Directors of the Parent Company, have reported that they are shareholders and board members of ACEK, DESARROLLO Y GESTIÓN INDUSTRIAL, S.L. and the subsidiaries of the ACEK Desarrollo y Gestión Industrial Group. ACEK, DESARROLLO Y GESTIÓN INDUSTRIAL, S.L is the parent company of an industrial group that developed, through the following subgroups, the activities mentioned below:
• GESTAMP AUTOMOCIÓN GROUP: engaged in manufacturing and sale of metal parts and components for the automotive industry.
• HOLDING GONVARRI GROUP: engaged in manufacturing, processing and sale of metal products, including structures for renewable energy such as wind turbines, photovoltaic plants and infrastructure elements of solar thermal power plants.
• ACEK ENERGíAS RENOVABLES GROUP: dedicated to the development, construction and operation of plants generating renewable energy including solar, wind and biomass.
• INMOBILIARIA ACEK GROUP: engaged in real estate activities. ACEK, DESARROLLO Y GESTIÓN INDUSTRIAL, S.L holds a direct and indirect investment of 17.909% in the company Cie Automotive, S.A., of which Mr. Francisco José Riberas Mera and Mr. Juan María Riberas Mera are also directors. Additionally, Mr. Francisco López Peña is a member of the Board of CIE Automotive, S.A Cie Automotive, S.A. is the parent company of an industrial group, which is engaged in, among other things, the design, manufacture and sale of automobile components and sub-units on the world automotive market. Finally, ACEK, DESARROLLO Y GESTIÓN INDUSTRIAL, S.L. holds a direct investment of 50.00% in the company Sideacero, S.L., of which Mr. Francisco José Riberas Mera and Mr. Juan María Riberas Mera are also directors.
120
Sideacero, S.L. is the parent company of an industrial group, which is engaged in, among other things, import, export, purchase and sale of ferrous, non-ferrous products, steel materials and recovery materials. 37. Additional note for English translation These consolidated financial statements were originally prepared in Spanish. In the event of a discrepancy, the Spanish-language version prevails.

121
ANNEX I Consolidation scope
Company Address Country Direct shareholdingIndirect
shareholdingActivity Consolidation method Auditors
Gestamp Automoción, S.A. Vizcaya Spain Parent company Portfolio management Full Ernst & Young
Gestamp Bizkaia, S.A. Vizcaya Spain 85.31% 14.69% Tooling and parts manufacturing Full Ernst & Young
Gestamp Vigo, S.A. Pontevedra Spain 99.99% 0.01% Tooling and parts manufacturing Full Ernst & Young
Gestamp Cerveira, Lda. Viana do Castelo Portugal 42.25% 57.75% Tooling and parts manufacturing Full Ernst & Young
Gestamp Toledo, S.A. Toledo Spain 99.99% 0.01% Tooling and parts manufacturing Full Ernst & Young
Autotech Engineering AIE Vizcaya Spain 10.00% 90.00% Research & Development Full Ernst & Young
SCI de Tournan en Brie Tournan France 0.10% 99.90% Real Estate Full N/A
Gestamp Solblank Barcelona, S.A. Barcelona Spain 5.01% 94.99% Tailored blank welding Full Ernst & Young
Gestamp Palencia, S.A. Palencia Spain 100.00% Tooling and parts manufacturing Full Ernst & Young
Gestamp Argentina, S.A. Buenos Aires Argentina 70.00% Portfolio management Full Ernst & Young
Gestamp Córdoba, S.A. Córdoba Argentina 70.00% Tooling and parts manufacturing Full Ernst & Young
Gestamp Linares, S.A. Jaén Spain 5.02% 94.98% Tooling and parts manufacturing Full Ernst & Young
Gestamp Servicios, S.A. Madrid Spain 100.00% Investment promotion and subsidiaries l inked services Full Ernst & Young
Matricerías Deusto, S.L. Vizcaya Spain 100.00% Die cutting production Full Ernst & Young
Gestamp Galvanizados, S.A. Palencia Spain 100.00% Component galvanazing Full Ernst & Young
Gestamp Tech, S.L. Palencia Spain 0.33% 99.67% Dormant Full N/A
Gestamp Brasil Industria de Autopeças, S.A. Parana Brazi l 70.00% Tooling and parts manufacturing Full Ernst & Young
Gestamp Metalbages, S.A. Barcelona Spain 100.00% Tooling and parts manufacturing Full Ernst & Young
Gestamp Esmar, S.A. Barcelona Spain 0.10% 99.90% Tooling and parts manufacturing Full Ernst & Young
Gestamp Noury, S.A.S Tournan France 100.00% Tooling and parts manufacturing Full Ernst & Young
Gestamp Aveiro, S.A. Aveiro Portugal 100.00% Tooling and parts manufacturing Full Ernst & Young
Griwe Subgroup Westerburg Germany 100.00% Tooling and parts manufacturing Full Ernst & Young
Gestamp Aguascalientes, S.A.de C.V. Aguas Calientes Mexico 70.00% Tooling and parts manufacturing Full Ernst & Young
Mexicana Servicios Laborales, S.A.de C.V. Aguas Calientes Mexico 70.00% Labor services Full Ernst & Young
Gestamp Puebla, S.A. de C.V. Puebla Mexico 70.00% Tooling and parts manufacturing Full Ernst & Young
Gestamp Cartera de México, S.A. de C.V. Puebla Mexico 70.00% Portfolio management Full Ernst & Young
Gestamp Mexicana de Serv. Laborales, S.A. de C.V. Aguas Calientes Mexico 70.00% Labor services Full Ernst & Young
Gestamp Ingeniería Europa Sur, S.L. Barcelona Spain 100.00% Industrial services Full Ernst & Young
December 31, 2017
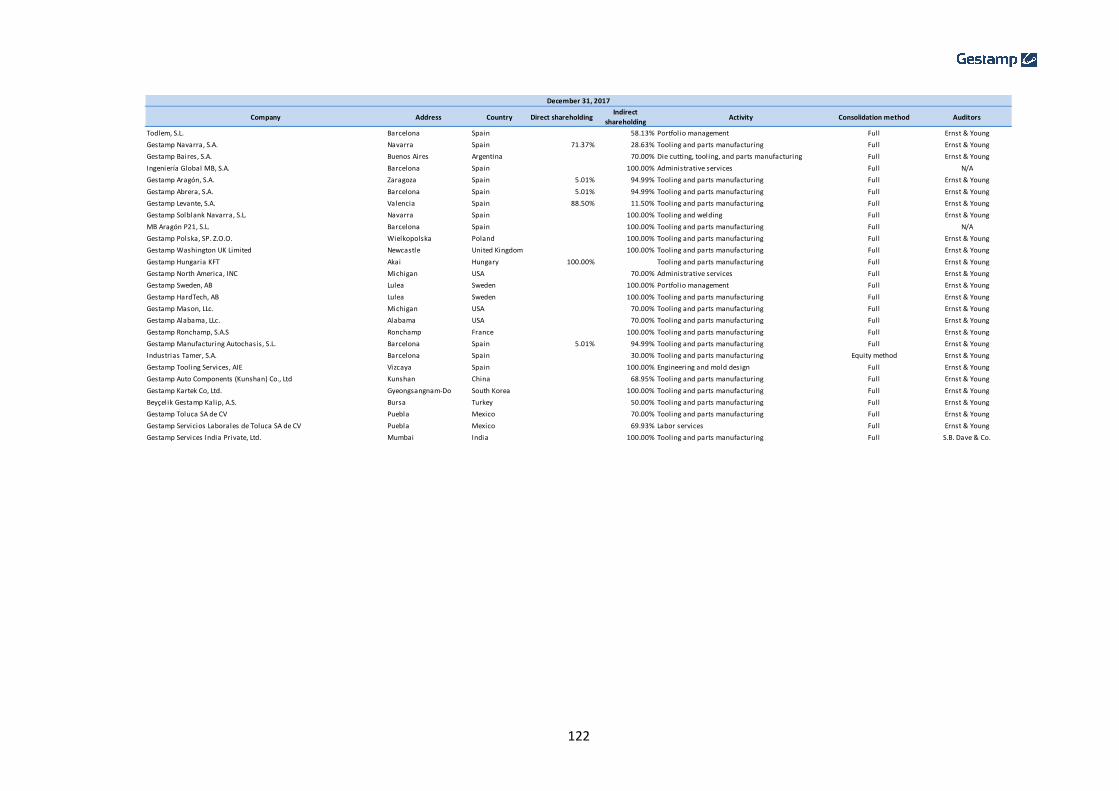
122
Company Address Country Direct shareholdingIndirect
shareholdingActivity Consolidation method Auditors
Todlem, S.L. Barcelona Spain 58.13% Portfol io management Full Ernst & Young
Gestamp Navarra, S.A. Navarra Spain 71.37% 28.63% Tooling and parts manufacturing Full Ernst & Young
Gestamp Baires, S.A. Buenos Aires Argentina 70.00% Die cutting, tooling, and parts manufacturing Full Ernst & Young
Ingeniería Global MB, S.A. Barcelona Spain 100.00% Administrative services Full N/A
Gestamp Aragón, S.A. Zaragoza Spain 5.01% 94.99% Tooling and parts manufacturing Full Ernst & Young
Gestamp Abrera, S.A. Barcelona Spain 5.01% 94.99% Tooling and parts manufacturing Full Ernst & Young
Gestamp Levante, S.A. Valencia Spain 88.50% 11.50% Tooling and parts manufacturing Full Ernst & Young
Gestamp Solblank Navarra, S.L. Navarra Spain 100.00% Tooling and welding Full Ernst & Young
MB Aragón P21, S.L. Barcelona Spain 100.00% Tooling and parts manufacturing Full N/A
Gestamp Polska, SP. Z.O.O. Wielkopolska Poland 100.00% Tooling and parts manufacturing Full Ernst & Young
Gestamp Washington UK Limited Newcastle United Kingdom 100.00% Tooling and parts manufacturing Full Ernst & Young
Gestamp Hungaria KFT Akai Hungary 100.00% Tooling and parts manufacturing Full Ernst & Young
Gestamp North America, INC Michigan USA 70.00% Administrative services Full Ernst & Young
Gestamp Sweden, AB Lulea Sweden 100.00% Portfol io management Full Ernst & Young
Gestamp HardTech, AB Lulea Sweden 100.00% Tooling and parts manufacturing Full Ernst & Young
Gestamp Mason, LLc. Michigan USA 70.00% Tooling and parts manufacturing Full Ernst & Young
Gestamp Alabama, LLc. Alabama USA 70.00% Tooling and parts manufacturing Full Ernst & Young
Gestamp Ronchamp, S.A.S Ronchamp France 100.00% Tooling and parts manufacturing Full Ernst & Young
Gestamp Manufacturing Autochasis, S.L. Barcelona Spain 5.01% 94.99% Tooling and parts manufacturing Full Ernst & Young
Industrias Tamer, S.A. Barcelona Spain 30.00% Tooling and parts manufacturing Equity method Ernst & Young
Gestamp Tooling Services, AIE Vizcaya Spain 100.00% Engineering and mold design Full Ernst & Young
Gestamp Auto Components (Kunshan) Co., Ltd Kunshan China 68.95% Tooling and parts manufacturing Full Ernst & Young
Gestamp Kartek Co, Ltd. Gyeongsangnam-Do South Korea 100.00% Tooling and parts manufacturing Full Ernst & Young
Beyçelik Gestamp Kalip, A.S. Bursa Turkey 50.00% Tooling and parts manufacturing Full Ernst & Young
Gestamp Toluca SA de CV Puebla Mexico 70.00% Tooling and parts manufacturing Full Ernst & Young
Gestamp Servicios Laborales de Toluca SA de CV Puebla Mexico 69.93% Labor services Full Ernst & Young
Gestamp Services India Private, Ltd. Mumbai India 100.00% Tooling and parts manufacturing Full S.B. Dave & Co.
December 31, 2017
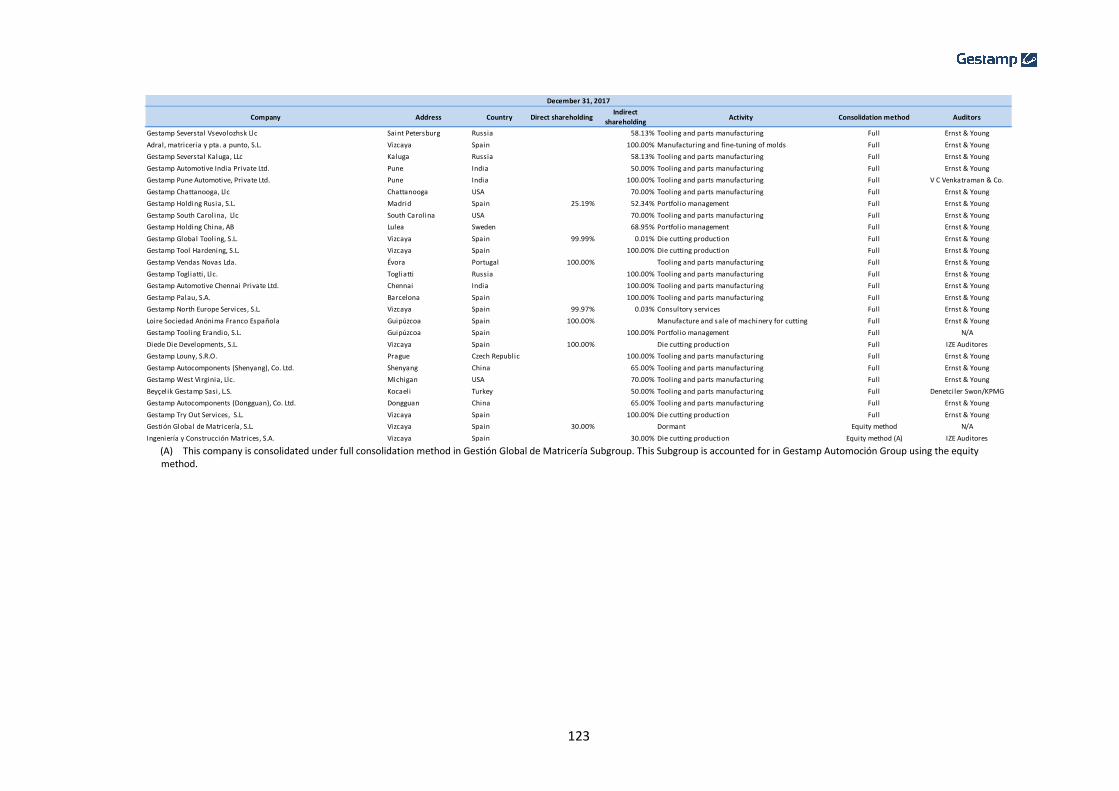
123
(A) This company is consolidated under full consolidation method in Gestión Global de Matricería Subgroup. This Subgroup is accounted for in Gestamp Automoción Group using the equity method.
Company Address Country Direct shareholdingIndirect
shareholdingActivity Consolidation method Auditors
Gestamp Severstal Vsevolozhsk Llc Saint Petersburg Russia 58.13% Tooling and parts manufacturing Full Ernst & Young
Adral, matriceria y pta. a punto, S.L. Vizcaya Spain 100.00% Manufacturing and fine-tuning of molds Full Ernst & Young
Gestamp Severstal Kaluga, LLc Kaluga Russia 58.13% Tooling and parts manufacturing Full Ernst & Young
Gestamp Automotive India Private Ltd. Pune India 50.00% Tooling and parts manufacturing Full Ernst & Young
Gestamp Pune Automotive, Private Ltd. Pune India 100.00% Tooling and parts manufacturing Full V C Venkatraman & Co.
Gestamp Chattanooga, Llc Chattanooga USA 70.00% Tooling and parts manufacturing Full Ernst & Young
Gestamp Holding Rusia, S.L. Madrid Spain 25.19% 52.34% Portfol io management Full Ernst & Young
Gestamp South Carolina, Llc South Carolina USA 70.00% Tooling and parts manufacturing Full Ernst & Young
Gestamp Holding China, AB Lulea Sweden 68.95% Portfol io management Full Ernst & Young
Gestamp Global Tooling, S.L. Vizcaya Spain 99.99% 0.01% Die cutting production Full Ernst & Young
Gestamp Tool Hardening, S.L. Vizcaya Spain 100.00% Die cutting production Full Ernst & Young
Gestamp Vendas Novas Lda. Évora Portugal 100.00% Tooling and parts manufacturing Full Ernst & Young
Gestamp Togliatti , Llc. Togliatti Russia 100.00% Tooling and parts manufacturing Full Ernst & Young
Gestamp Automotive Chennai Private Ltd. Chennai India 100.00% Tooling and parts manufacturing Full Ernst & Young
Gestamp Palau, S.A. Barcelona Spain 100.00% Tooling and parts manufacturing Full Ernst & Young
Gestamp North Europe Services, S.L. Vizcaya Spain 99.97% 0.03% Consultory services Full Ernst & Young
Loire Sociedad Anónima Franco Española Guipúzcoa Spain 100.00% Manufacture and sale of machinery for cutting Full Ernst & Young
Gestamp Tooling Erandio, S.L. Guipúzcoa Spain 100.00% Portfol io management Full N/A
Diede Die Developments, S.L. Vizcaya Spain 100.00% Die cutting production Full IZE Auditores
Gestamp Louny, S.R.O. Prague Czech Republic 100.00% Tooling and parts manufacturing Full Ernst & Young
Gestamp Autocomponents (Shenyang), Co. Ltd. Shenyang China 65.00% Tooling and parts manufacturing Full Ernst & Young
Gestamp West Virginia, Llc. Michigan USA 70.00% Tooling and parts manufacturing Full Ernst & Young
Beyçelik Gestamp Sasi, L.S. Kocaeli Turkey 50.00% Tooling and parts manufacturing Full Denetci ler Swon/KPMG
Gestamp Autocomponents (Dongguan), Co. Ltd. Dongguan China 65.00% Tooling and parts manufacturing Full Ernst & Young
Gestamp Try Out Services, S.L. Vizcaya Spain 100.00% Die cutting production Full Ernst & Young
Gestión Global de Matricería, S.L. Vizcaya Spain 30.00% Dormant Equity method N/A
Ingeniería y Construcción Matrices, S.A. Vizcaya Spain 30.00% Die cutting production Equity method (A) IZE Auditores
December 31, 2017
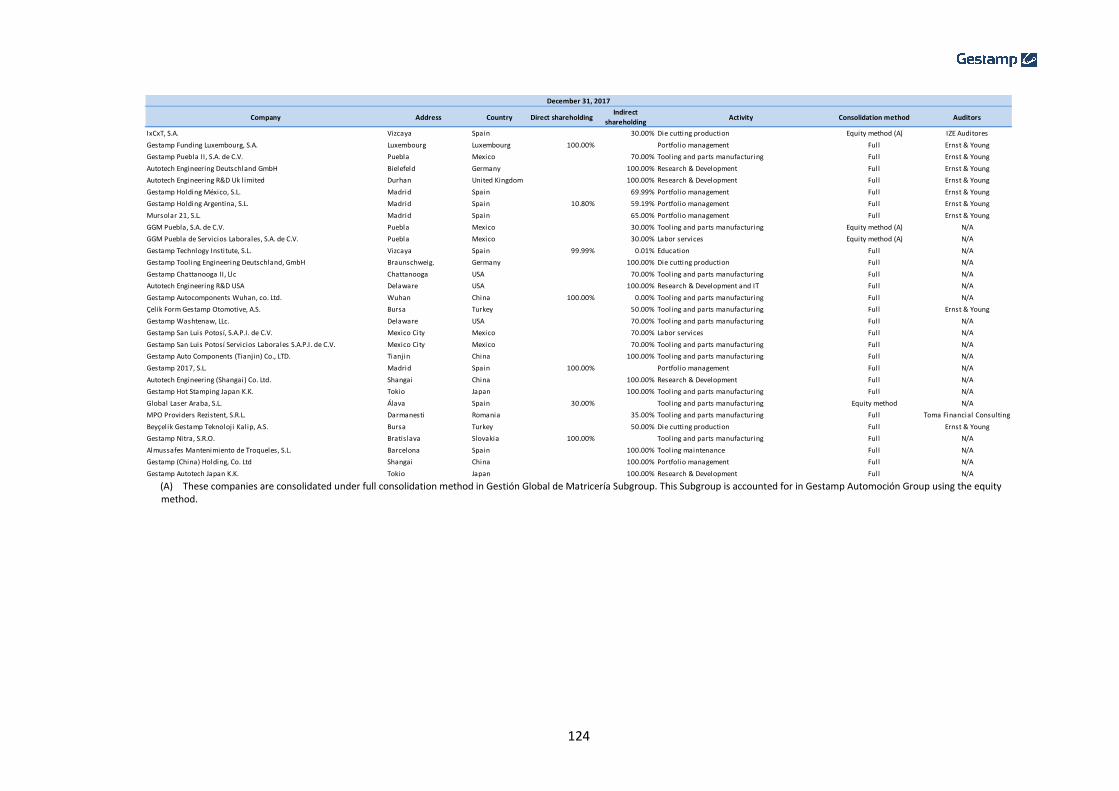
124
(A) These companies are consolidated under full consolidation method in Gestión Global de Matricería Subgroup. This Subgroup is accounted for in Gestamp Automoción Group using the equity method.
Company Address Country Direct shareholdingIndirect
shareholdingActivity Consolidation method Auditors
IxCxT, S.A. Vizcaya Spain 30.00% Die cutting production Equity method (A) IZE Auditores
Gestamp Funding Luxembourg, S.A. Luxembourg Luxembourg 100.00% Portfolio management Full Ernst & Young
Gestamp Puebla II, S.A. de C.V. Puebla Mexico 70.00% Tooling and parts manufacturing Full Ernst & Young
Autotech Engineering Deutschland GmbH Bielefeld Germany 100.00% Research & Development Full Ernst & Young
Autotech Engineering R&D Uk l imited Durhan United Kingdom 100.00% Research & Development Full Ernst & Young
Gestamp Holding México, S.L. Madrid Spain 69.99% Portfolio management Full Ernst & Young
Gestamp Holding Argentina, S.L. Madrid Spain 10.80% 59.19% Portfolio management Full Ernst & Young
Mursolar 21, S.L. Madrid Spain 65.00% Portfolio management Full Ernst & Young
GGM Puebla, S.A. de C.V. Puebla Mexico 30.00% Tooling and parts manufacturing Equity method (A) N/A
GGM Puebla de Servicios Laborales, S.A. de C.V. Puebla Mexico 30.00% Labor services Equity method (A) N/A
Gestamp Technlogy Institute, S.L. Vizcaya Spain 99.99% 0.01% Education Full N/A
Gestamp Tooling Engineering Deutschland, GmbH Braunschweig. Germany 100.00% Die cutting production Full N/A
Gestamp Chattanooga II, Llc Chattanooga USA 70.00% Tooling and parts manufacturing Full N/A
Autotech Engineering R&D USA Delaware USA 100.00% Research & Development and IT Full N/A
Gestamp Autocomponents Wuhan, co. Ltd. Wuhan China 100.00% 0.00% Tooling and parts manufacturing Full N/A
Çelik Form Gestamp Otomotive, A.S. Bursa Turkey 50.00% Tooling and parts manufacturing Full Ernst & Young
Gestamp Washtenaw, LLc. Delaware USA 70.00% Tooling and parts manufacturing Full N/A
Gestamp San Luis Potosí, S.A.P.I. de C.V. Mexico City Mexico 70.00% Labor services Full N/A
Gestamp San Luis Potosí Servicios Laborales S.A.P.I. de C.V. Mexico City Mexico 70.00% Tooling and parts manufacturing Full N/A
Gestamp Auto Components (Tianjin) Co., LTD. Tianjin China 100.00% Tooling and parts manufacturing Full N/A
Gestamp 2017, S.L. Madrid Spain 100.00% Portfolio management Full N/A
Autotech Engineering (Shangai) Co. Ltd. Shangai China 100.00% Research & Development Full N/A
Gestamp Hot Stamping Japan K.K. Tokio Japan 100.00% Tooling and parts manufacturing Full N/A
Global Laser Araba, S.L. Álava Spain 30.00% Tooling and parts manufacturing Equity method N/A
MPO Providers Rezistent, S.R.L. Darmanesti Romania 35.00% Tooling and parts manufacturing Full Toma Financial Consulting
Beyçelik Gestamp Teknoloji Kal ip, A.S. Bursa Turkey 50.00% Die cutting production Full Ernst & Young
Gestamp Nitra, S.R.O. Bratislava Slovakia 100.00% Tooling and parts manufacturing Full N/A
Almussafes Mantenimiento de Troqueles, S.L. Barcelona Spain 100.00% Tooling maintenance Full N/A
Gestamp (China) Holding, Co. Ltd Shangai China 100.00% Portfolio management Full N/A
Gestamp Autotech Japan K.K. Tokio Japan 100.00% Research & Development Full N/A
December 31, 2017
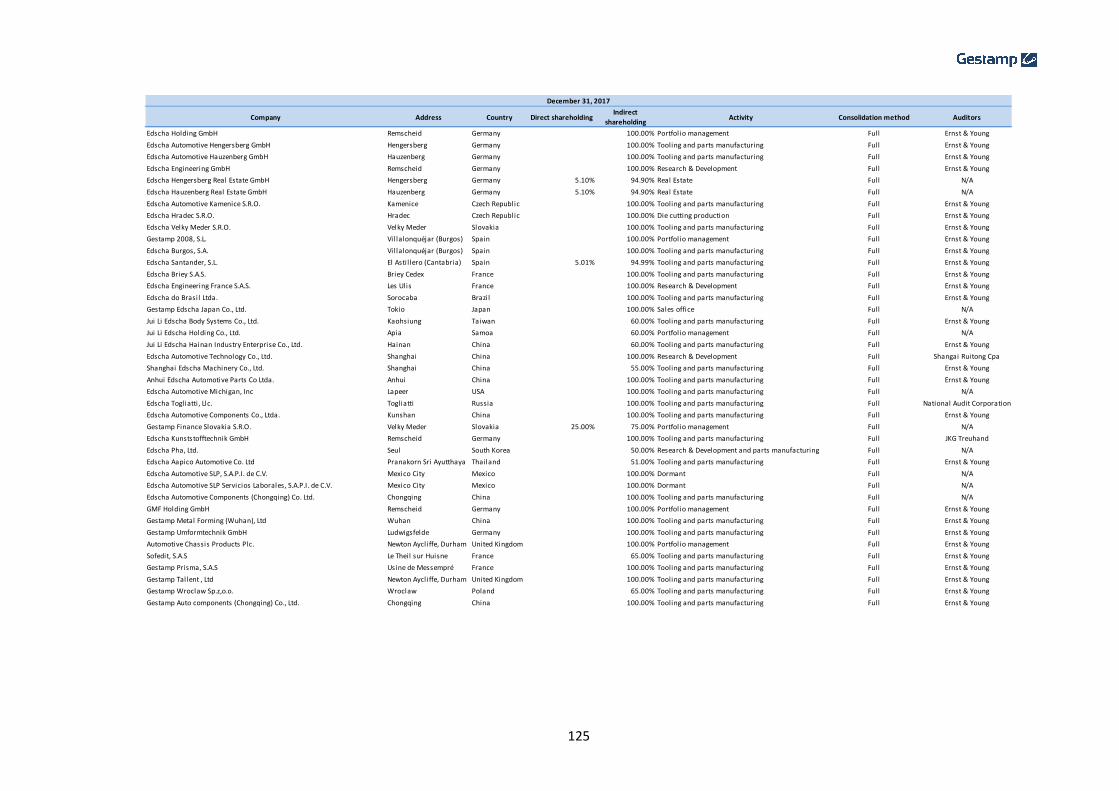
125
Company Address Country Direct shareholdingIndirect
shareholdingActivity Consolidation method Auditors
Edscha Holding GmbH Remscheid Germany 100.00% Portfol io management Full Ernst & Young
Edscha Automotive Hengersberg GmbH Hengersberg Germany 100.00% Tooling and parts manufacturing Full Ernst & Young
Edscha Automotive Hauzenberg GmbH Hauzenberg Germany 100.00% Tooling and parts manufacturing Full Ernst & Young
Edscha Engineering GmbH Remscheid Germany 100.00% Research & Development Full Ernst & Young
Edscha Hengersberg Real Estate GmbH Hengersberg Germany 5.10% 94.90% Real Estate Full N/A
Edscha Hauzenberg Real Estate GmbH Hauzenberg Germany 5.10% 94.90% Real Estate Full N/A
Edscha Automotive Kamenice S.R.O. Kamenice Czech Republic 100.00% Tooling and parts manufacturing Full Ernst & Young
Edscha Hradec S.R.O. Hradec Czech Republic 100.00% Die cutting production Full Ernst & Young
Edscha Velky Meder S.R.O. Velky Meder Slovakia 100.00% Tooling and parts manufacturing Full Ernst & Young
Gestamp 2008, S.L. Vi l lalonquéjar (Burgos) Spain 100.00% Portfol io management Full Ernst & Young
Edscha Burgos, S.A. Vil lalonquéjar (Burgos) Spain 100.00% Tooling and parts manufacturing Full Ernst & Young
Edscha Santander, S.L. El Asti llero (Cantabria) Spain 5.01% 94.99% Tooling and parts manufacturing Full Ernst & Young
Edscha Briey S.A.S. Briey Cedex France 100.00% Tooling and parts manufacturing Full Ernst & Young
Edscha Engineering France S.A.S. Les Ulis France 100.00% Research & Development Full Ernst & Young
Edscha do Brasi l Ltda. Sorocaba Brazi l 100.00% Tooling and parts manufacturing Full Ernst & Young
Gestamp Edscha Japan Co., Ltd. Tokio Japan 100.00% Sales office Full N/A
Jui Li Edscha Body Systems Co., Ltd. Kaohsiung Taiwan 60.00% Tooling and parts manufacturing Full Ernst & Young
Jui Li Edscha Holding Co., Ltd. Apia Samoa 60.00% Portfol io management Full N/A
Jui Li Edscha Hainan Industry Enterprise Co., Ltd. Hainan China 60.00% Tooling and parts manufacturing Full Ernst & Young
Edscha Automotive Technology Co., Ltd. Shanghai China 100.00% Research & Development Full Shangai Ruitong Cpa
Shanghai Edscha Machinery Co., Ltd. Shanghai China 55.00% Tooling and parts manufacturing Full Ernst & Young
Anhui Edscha Automotive Parts Co Ltda. Anhui China 100.00% Tooling and parts manufacturing Full Ernst & Young
Edscha Automotive Michigan, Inc Lapeer USA 100.00% Tooling and parts manufacturing Full N/A
Edscha Togliatti , Llc. Togliatti Russia 100.00% Tooling and parts manufacturing Full National Audit Corporation
Edscha Automotive Components Co., Ltda. Kunshan China 100.00% Tooling and parts manufacturing Full Ernst & Young
Gestamp Finance Slovakia S.R.O. Velky Meder Slovakia 25.00% 75.00% Portfol io management Full N/A
Edscha Kunststofftechnik GmbH Remscheid Germany 100.00% Tooling and parts manufacturing Full JKG Treuhand
Edscha Pha, Ltd. Seul South Korea 50.00% Research & Development and parts manufacturing Full N/A
Edscha Aapico Automotive Co. Ltd Pranakorn Sri Ayutthaya Thailand 51.00% Tooling and parts manufacturing Full Ernst & Young
Edscha Automotive SLP, S.A.P.I. de C.V. Mexico City Mexico 100.00% Dormant Full N/A
Edscha Automotive SLP Servicios Laborales, S.A.P.I. de C.V. Mexico City Mexico 100.00% Dormant Full N/A
Edscha Automotive Components (Chongqing) Co. Ltd. Chongqing China 100.00% Tooling and parts manufacturing Full N/A
GMF Holding GmbH Remscheid Germany 100.00% Portfol io management Full Ernst & Young
Gestamp Metal Forming (Wuhan), Ltd Wuhan China 100.00% Tooling and parts manufacturing Full Ernst & Young
Gestamp Umformtechnik GmbH Ludwigsfelde Germany 100.00% Tooling and parts manufacturing Full Ernst & Young
Automotive Chassis Products Plc. Newton Aycl iffe, Durham United Kingdom 100.00% Portfol io management Full Ernst & Young
Sofedit, S.A.S Le Theil sur Huisne France 65.00% Tooling and parts manufacturing Full Ernst & Young
Gestamp Prisma, S.A.S Usine de Messempré France 100.00% Tooling and parts manufacturing Full Ernst & Young
Gestamp Tallent , Ltd Newton Aycl iffe, Durham United Kingdom 100.00% Tooling and parts manufacturing Full Ernst & Young
Gestamp Wroclaw Sp.z,o.o. Wroclaw Poland 65.00% Tooling and parts manufacturing Full Ernst & Young
Gestamp Auto components (Chongqing) Co., Ltd. Chongqing China 100.00% Tooling and parts manufacturing Full Ernst & Young
December 31, 2017
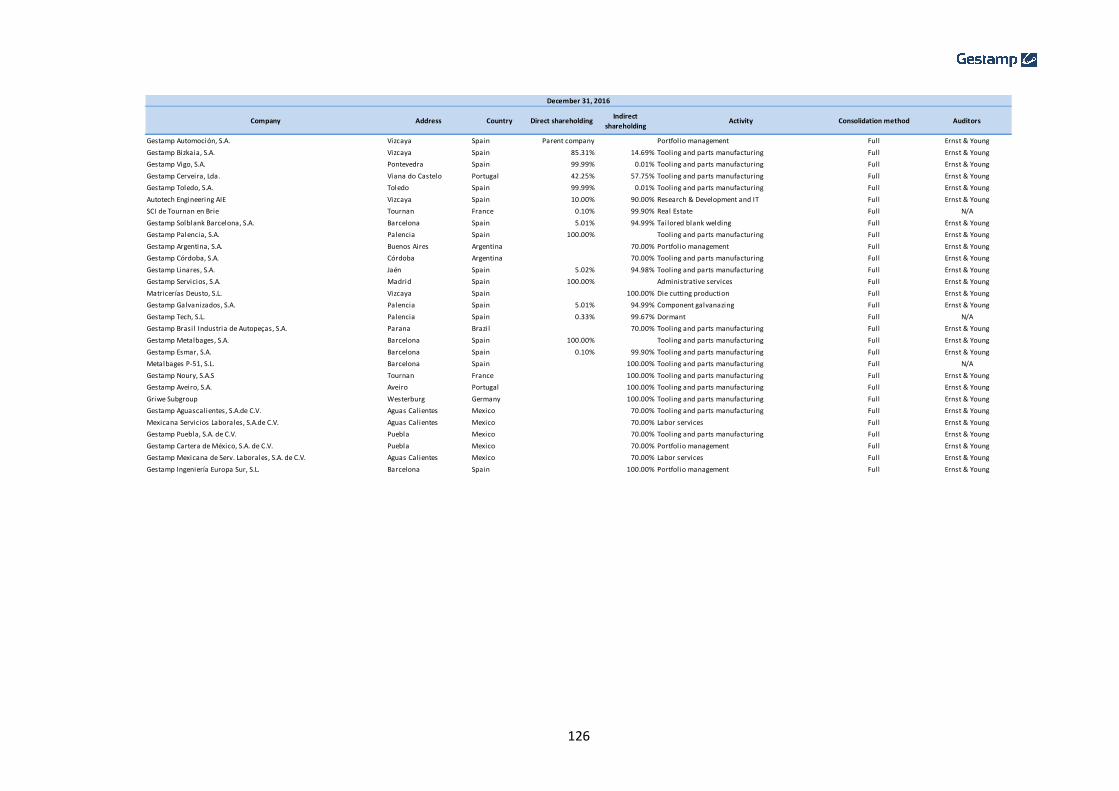
126
Company Address Country Direct shareholdingIndirect
shareholdingActivity Consolidation method Auditors
Gestamp Automoción, S.A. Vizcaya Spain Parent company Portfol io management Full Ernst & Young
Gestamp Bizkaia, S.A. Vizcaya Spain 85.31% 14.69% Tooling and parts manufacturing Full Ernst & Young
Gestamp Vigo, S.A. Pontevedra Spain 99.99% 0.01% Tooling and parts manufacturing Full Ernst & Young
Gestamp Cerveira, Lda. Viana do Castelo Portugal 42.25% 57.75% Tooling and parts manufacturing Full Ernst & Young
Gestamp Toledo, S.A. Toledo Spain 99.99% 0.01% Tooling and parts manufacturing Full Ernst & Young
Autotech Engineering AIE Vizcaya Spain 10.00% 90.00% Research & Development and IT Full Ernst & Young
SCI de Tournan en Brie Tournan France 0.10% 99.90% Real Estate Full N/A
Gestamp Solblank Barcelona, S.A. Barcelona Spain 5.01% 94.99% Tailored blank welding Full Ernst & Young
Gestamp Palencia, S.A. Palencia Spain 100.00% Tooling and parts manufacturing Full Ernst & Young
Gestamp Argentina, S.A. Buenos Aires Argentina 70.00% Portfol io management Full Ernst & Young
Gestamp Córdoba, S.A. Córdoba Argentina 70.00% Tooling and parts manufacturing Full Ernst & Young
Gestamp Linares, S.A. Jaén Spain 5.02% 94.98% Tooling and parts manufacturing Full Ernst & Young
Gestamp Servicios, S.A. Madrid Spain 100.00% Administrative services Full Ernst & Young
Matricerías Deusto, S.L. Vizcaya Spain 100.00% Die cutting production Full Ernst & Young
Gestamp Galvanizados, S.A. Palencia Spain 5.01% 94.99% Component galvanazing Full Ernst & Young
Gestamp Tech, S.L. Palencia Spain 0.33% 99.67% Dormant Full N/A
Gestamp Brasi l Industria de Autopeças, S.A. Parana Brazi l 70.00% Tooling and parts manufacturing Full Ernst & Young
Gestamp Metalbages, S.A. Barcelona Spain 100.00% Tooling and parts manufacturing Full Ernst & Young
Gestamp Esmar, S.A. Barcelona Spain 0.10% 99.90% Tooling and parts manufacturing Full Ernst & Young
Metalbages P-51, S.L. Barcelona Spain 100.00% Tooling and parts manufacturing Full N/A
Gestamp Noury, S.A.S Tournan France 100.00% Tooling and parts manufacturing Full Ernst & Young
Gestamp Aveiro, S.A. Aveiro Portugal 100.00% Tooling and parts manufacturing Full Ernst & Young
Griwe Subgroup Westerburg Germany 100.00% Tooling and parts manufacturing Full Ernst & Young
Gestamp Aguascalientes, S.A.de C.V. Aguas Calientes Mexico 70.00% Tooling and parts manufacturing Full Ernst & Young
Mexicana Servicios Laborales, S.A.de C.V. Aguas Calientes Mexico 70.00% Labor services Full Ernst & Young
Gestamp Puebla, S.A. de C.V. Puebla Mexico 70.00% Tooling and parts manufacturing Full Ernst & Young
Gestamp Cartera de México, S.A. de C.V. Puebla Mexico 70.00% Portfol io management Full Ernst & Young
Gestamp Mexicana de Serv. Laborales, S.A. de C.V. Aguas Calientes Mexico 70.00% Labor services Full Ernst & Young
Gestamp Ingeniería Europa Sur, S.L. Barcelona Spain 100.00% Portfol io management Full Ernst & Young
December 31, 2016
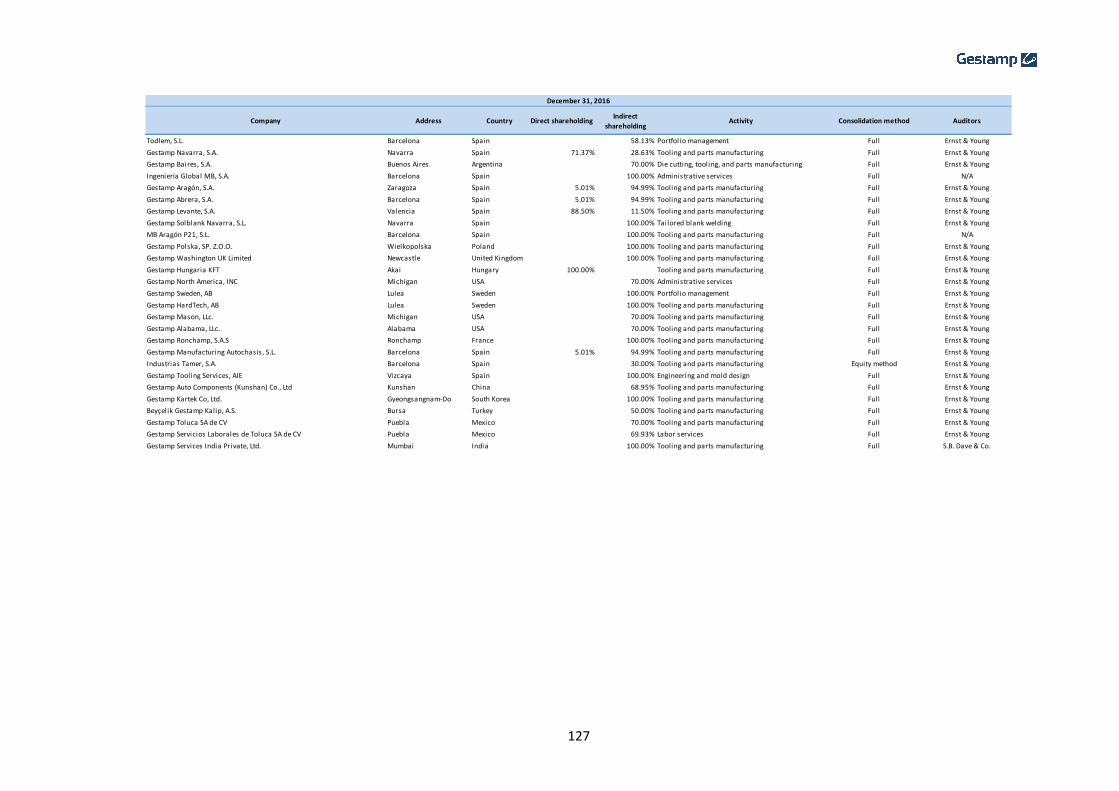
127
Company Address Country Direct shareholdingIndirect
shareholdingActivity Consolidation method Auditors
Todlem, S.L. Barcelona Spain 58.13% Portfol io management Full Ernst & Young
Gestamp Navarra, S.A. Navarra Spain 71.37% 28.63% Tooling and parts manufacturing Full Ernst & Young
Gestamp Baires, S.A. Buenos Aires Argentina 70.00% Die cutting, tooling, and parts manufacturing Full Ernst & Young
Ingeniería Global MB, S.A. Barcelona Spain 100.00% Administrative services Full N/A
Gestamp Aragón, S.A. Zaragoza Spain 5.01% 94.99% Tooling and parts manufacturing Full Ernst & Young
Gestamp Abrera, S.A. Barcelona Spain 5.01% 94.99% Tooling and parts manufacturing Full Ernst & Young
Gestamp Levante, S.A. Valencia Spain 88.50% 11.50% Tooling and parts manufacturing Full Ernst & Young
Gestamp Solblank Navarra, S.L. Navarra Spain 100.00% Tailored blank welding Full Ernst & Young
MB Aragón P21, S.L. Barcelona Spain 100.00% Tooling and parts manufacturing Full N/A
Gestamp Polska, SP. Z.O.O. Wielkopolska Poland 100.00% Tooling and parts manufacturing Full Ernst & Young
Gestamp Washington UK Limited Newcastle United Kingdom 100.00% Tooling and parts manufacturing Full Ernst & Young
Gestamp Hungaria KFT Akai Hungary 100.00% Tooling and parts manufacturing Full Ernst & Young
Gestamp North America, INC Michigan USA 70.00% Administrative services Full Ernst & Young
Gestamp Sweden, AB Lulea Sweden 100.00% Portfol io management Full Ernst & Young
Gestamp HardTech, AB Lulea Sweden 100.00% Tooling and parts manufacturing Full Ernst & Young
Gestamp Mason, LLc. Michigan USA 70.00% Tooling and parts manufacturing Full Ernst & Young
Gestamp Alabama, LLc. Alabama USA 70.00% Tooling and parts manufacturing Full Ernst & Young
Gestamp Ronchamp, S.A.S Ronchamp France 100.00% Tooling and parts manufacturing Full Ernst & Young
Gestamp Manufacturing Autochasis, S.L. Barcelona Spain 5.01% 94.99% Tooling and parts manufacturing Full Ernst & Young
Industrias Tamer, S.A. Barcelona Spain 30.00% Tooling and parts manufacturing Equity method Ernst & Young
Gestamp Tooling Services, AIE Vizcaya Spain 100.00% Engineering and mold design Full Ernst & Young
Gestamp Auto Components (Kunshan) Co., Ltd Kunshan China 68.95% Tooling and parts manufacturing Full Ernst & Young
Gestamp Kartek Co, Ltd. Gyeongsangnam-Do South Korea 100.00% Tooling and parts manufacturing Full Ernst & Young
Beyçelik Gestamp Kalip, A.S. Bursa Turkey 50.00% Tooling and parts manufacturing Full Ernst & Young
Gestamp Toluca SA de CV Puebla Mexico 70.00% Tooling and parts manufacturing Full Ernst & Young
Gestamp Servicios Laborales de Toluca SA de CV Puebla Mexico 69.93% Labor services Full Ernst & Young
Gestamp Services India Private, Ltd. Mumbai India 100.00% Tooling and parts manufacturing Full S.B. Dave & Co.
December 31, 2016

128
(A) These companies are consolidated under full consolidation method in Gestión Global de Matricería Subgroup. This Subgroup is accounted for in Gestamp Automoción Group using the equity
method.
Company Address Country Direct shareholdingIndirect
shareholdingActivity Consolidation method Auditors
Gestamp Severstal Vsevolozhsk Llc Saint Petersburg Russia 58.13% Tooling and parts manufacturing Full Ernst & Young
Adral, matriceria y pta. a punto, S.L. Vizcaya Spain 100.00% Adjustment Full Ernst & Young
Gestamp Severstal Kaluga, LLc Kaluga Russia 58.13% Tooling and parts manufacturing Full Ernst & Young
Gestamp Automotive India Private Ltd. Pune India 50.00% Tooling and parts manufacturing Full Ernst & Young
Gestamp Pune Automotive, Private Ltd. Pune India 100.00% Tooling and parts manufacturing Full Ernst & Young
Gestamp Chattanooga, Llc Chattanooga USA 70.00% Tooling and parts manufacturing Full Ernst & Young
Gestamp Holding Rusia, S.L. Madrid Spain 25.19% 52.34% Portfol io management Full Ernst & Young
Gestamp South Carolina, Llc South Carolina USA 70.00% Tooling and parts manufacturing Full Ernst & Young
Gestamp Holding China, AB Lulea Sweden 68.95% Portfol io management Full Ernst & Young
Gestamp Global Tooling, S.L. Vizcaya Spain 99.99% 0.01% Engineering and mold design Full Ernst & Young
Gestamp Tool Hardening, S.L. Vizcaya Spain 100.00% Engineering and mold design Full Ernst & Young
Gestamp Vendas Novas Lda. Évora Portugal 100.00% Tooling and parts manufacturing Full Ernst & Young
Gestamp Togliatti , Llc. Togliatti Russia 100.00% Tooling and parts manufacturing Full Ernst & Young
Gestamp Automotive Chennai Private Ltd. Chennai India 100.00% Tooling and parts manufacturing Full Ernst & Young
Essa Palau, S.A. Barcelona Spain 40.00% Tooling and parts manufacturing Equity method Deloitte
Gestamp North Europe Services, S.L. Vizcaya Spain 99.97% 0.03% Consultory services Full Ernst & Young
Loire Sociedad Anónima Franco Española Guipúzcoa Spain 100.00% Manufacture and sale of machinery for cutting Full Ernst & Young
Bero Tools, S.L. Guipúzcoa Spain 100.00% Portfol io management Full N/A
Diede Die Developments, S.L. Vizcaya Spain 100.00% Die cutting production Full IZE Auditores
Gestamp Louny, S.R.O. Prague Czech Republic 100.00% Tooling and parts manufacturing Full Ernst & Young
Gestamp Autocomponents (Shenyang), Co. Ltd. Shenyang China 65.00% Tooling and parts manufacturing Full Ernst & Young
Gestamp West Virginia, Llc. Michigan USA 70.00% Tooling and parts manufacturing Full Ernst & Young
Beyçelik Gestamp Sasi, L.S. Kocaeli Turkey 50.00% Tooling and parts manufacturing Full Denetci ler Swon/KPMG
Gestamp Autocomponents (Dongguan), Co. Ltd. Dongguan China 65.00% Tooling and parts manufacturing Full Ernst & Young
Gestamp Try Out Services, S.L. Vizcaya Spain 100.00% Die cutting production Full Ernst & Young
Gestión Global de Matricería, S.L. Vizcaya Spain 30.00% Dormant Equity method N/A
Ingeniería y Construcción Matrices, S.A. Vizcaya Spain 30.00% Die cutting production Equity method (A) IZE Auditores
December 31, 2016

129
(A) These companies are consolidated under full consolidation method in Gestión Global de Matricería Subgroup. This Subgroup is accounted for in Gestamp Automoción Group using the equity
method.
Company Address Country Direct shareholdingIndirect
shareholdingActivity Consolidation method Auditors
IxCxT, S.A. Vizcaya Spain 30.00% Die cutting production Equity method (A) IZE Auditores
Gestamp Funding Luxembourg, S.A. Luxembourg Luxembourg 100.00% Portfolio management Full Ernst & Young
Gestamp Puebla II, S.A. de C.V. Puebla Mexico 70.00% Tooling and parts manufacturing Full Ernst & Young
Autotech Engineering Deutschland GmbH Bielefeld Germany 100.00% Research & Development and IT Full Ernst & Young
Autotech Engineering R&D Uk l imited Durhan United Kingdom 100.00% Research & Development and IT Full Ernst & Young
Gestamp Holding México, S.L. Madrid Spain 69.99% Portfolio management Full Ernst & Young
Gestamp Holding Argentina, S.L. Madrid Spain 10.80% 59.19% Portfolio management Full Ernst & Young
Mursolar 21, S.L. Madrid Spain 65.00% Portfolio management Full Ernst & Young
GGM Puebla, S.A. de C.V. Puebla Mexico 30.00% Tooling and parts manufacturing Equity method (A) N/A
GGM Puebla de Servicios Laborales, S.A. de C.V. Puebla Mexico 30.00% Labor services Equity method (A) N/A
Gestamp Technlogy Institute, S.L. Vizcaya Spain 99.99% 0.01% Education Full N/A
Gestamp Tooling Engineering Deutschland, GmbH Braunschweig. Germany 100.00% Die cutting production Full N/A
Gestamp Chattanooga II, Llc Chattanooga USA 70.00% Tooling and parts manufacturing Full N/A
Autotech Engineering R&D USA Delaware USA 100.00% Research & Development and IT Full N/A
Gestamp Autocomponents Wuhan, co. Ltd. Wuhan China 100.00% Tooling and parts manufacturing Full N/A
Çelik Form Gestamp Otomotive, A.S. Bursa Turkey 25.80% Tooling and parts manufacturing Full Ernst & Young
Gestamp Washtenaw, LLc. Delaware USA 70.00% Tooling and parts manufacturing Full N/A
Gestamp San Luis Potosí, S.A.P.I. de C.V. Mexico City Mexico 70.00% Labor services Full N/A
Gestamp San Luis Potosí Servicios Laborales S.A.P.I. de C.V. Mexico City Mexico 70.00% Tooling and parts manufacturing Full N/A
Gestamp Auto Components (Tianjin) Co., LTD. Tianjin China 100.00% Tooling and parts manufacturing Full N/A
Gestamp 2017, S.L. Madrid Spain 100.00% Portfolio management Full N/A
Autotech Engineering (Shangai) Co. Ltd. Shangai China 100.00% Research & Development Full N/A
Gestamp Hot Stamping Japan K.K. Tokio Japan 100.00% Tooling and parts manufacturing Full N/A
December 31, 2016
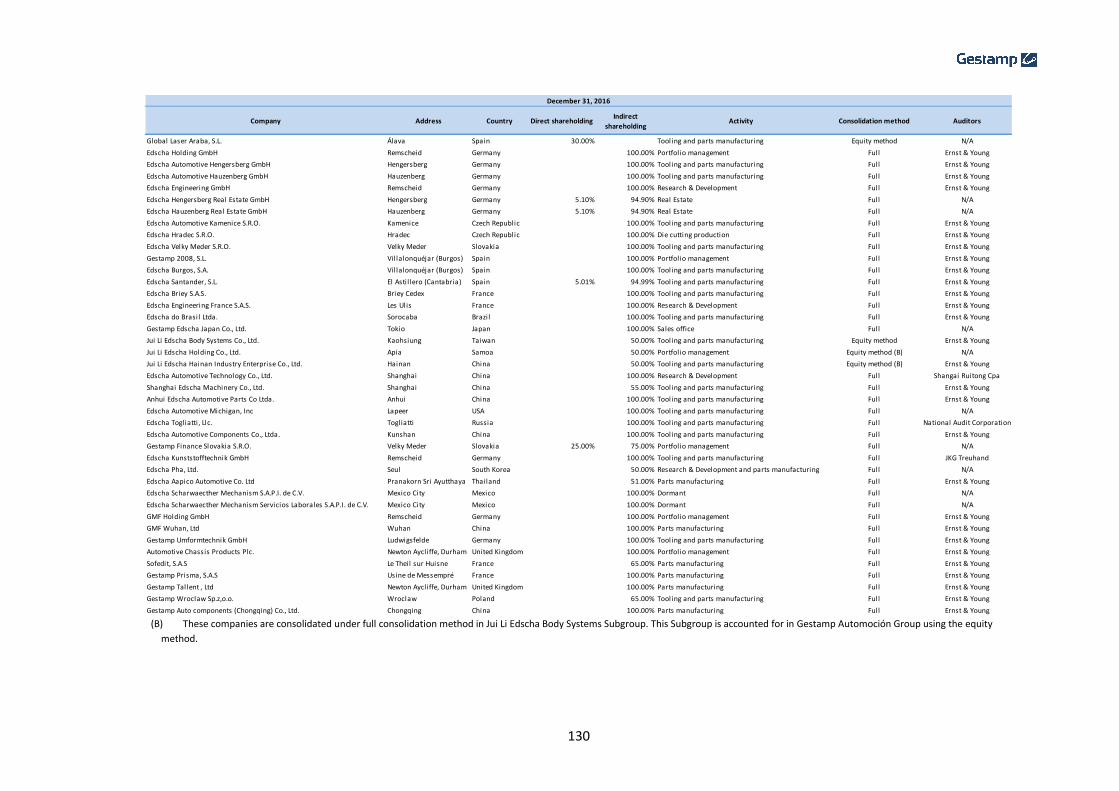
130
(B) These companies are consolidated under full consolidation method in Jui Li Edscha Body Systems Subgroup. This Subgroup is accounted for in Gestamp Automoción Group using the equity
method.
Company Address Country Direct shareholdingIndirect
shareholdingActivity Consolidation method Auditors
Global Laser Araba, S.L. Álava Spain 30.00% Tooling and parts manufacturing Equity method N/A
Edscha Holding GmbH Remscheid Germany 100.00% Portfolio management Full Ernst & Young
Edscha Automotive Hengersberg GmbH Hengersberg Germany 100.00% Tooling and parts manufacturing Full Ernst & Young
Edscha Automotive Hauzenberg GmbH Hauzenberg Germany 100.00% Tooling and parts manufacturing Full Ernst & Young
Edscha Engineering GmbH Remscheid Germany 100.00% Research & Development Full Ernst & Young
Edscha Hengersberg Real Estate GmbH Hengersberg Germany 5.10% 94.90% Real Estate Full N/A
Edscha Hauzenberg Real Estate GmbH Hauzenberg Germany 5.10% 94.90% Real Estate Full N/A
Edscha Automotive Kamenice S.R.O. Kamenice Czech Republic 100.00% Tooling and parts manufacturing Full Ernst & Young
Edscha Hradec S.R.O. Hradec Czech Republic 100.00% Die cutting production Full Ernst & Young
Edscha Velky Meder S.R.O. Velky Meder Slovakia 100.00% Tooling and parts manufacturing Full Ernst & Young
Gestamp 2008, S.L. Vil lalonquéjar (Burgos) Spain 100.00% Portfolio management Full Ernst & Young
Edscha Burgos, S.A. Vil lalonquéjar (Burgos) Spain 100.00% Tooling and parts manufacturing Full Ernst & Young
Edscha Santander, S.L. El Asti l lero (Cantabria) Spain 5.01% 94.99% Tooling and parts manufacturing Full Ernst & Young
Edscha Briey S.A.S. Briey Cedex France 100.00% Tooling and parts manufacturing Full Ernst & Young
Edscha Engineering France S.A.S. Les Ulis France 100.00% Research & Development Full Ernst & Young
Edscha do Brasi l Ltda. Sorocaba Brazi l 100.00% Tooling and parts manufacturing Full Ernst & Young
Gestamp Edscha Japan Co., Ltd. Tokio Japan 100.00% Sales office Full N/A
Jui Li Edscha Body Systems Co., Ltd. Kaohsiung Taiwan 50.00% Tooling and parts manufacturing Equity method Ernst & Young
Jui Li Edscha Holding Co., Ltd. Apia Samoa 50.00% Portfolio management Equity method (B) N/A
Jui Li Edscha Hainan Industry Enterprise Co., Ltd. Hainan China 50.00% Tooling and parts manufacturing Equity method (B) Ernst & Young
Edscha Automotive Technology Co., Ltd. Shanghai China 100.00% Research & Development Full Shangai Ruitong Cpa
Shanghai Edscha Machinery Co., Ltd. Shanghai China 55.00% Tooling and parts manufacturing Full Ernst & Young
Anhui Edscha Automotive Parts Co Ltda. Anhui China 100.00% Tooling and parts manufacturing Full Ernst & Young
Edscha Automotive Michigan, Inc Lapeer USA 100.00% Tooling and parts manufacturing Full N/A
Edscha Togliatti , Llc. Togliatti Russia 100.00% Tooling and parts manufacturing Full National Audit Corporation
Edscha Automotive Components Co., Ltda. Kunshan China 100.00% Tooling and parts manufacturing Full Ernst & Young
Gestamp Finance Slovakia S.R.O. Velky Meder Slovakia 25.00% 75.00% Portfolio management Full N/A
Edscha Kunststofftechnik GmbH Remscheid Germany 100.00% Tooling and parts manufacturing Full JKG Treuhand
Edscha Pha, Ltd. Seul South Korea 50.00% Research & Development and parts manufacturing Full N/A
Edscha Aapico Automotive Co. Ltd Pranakorn Sri Ayutthaya Thailand 51.00% Parts manufacturing Full Ernst & Young
Edscha Scharwaecther Mechanism S.A.P.I. de C.V. Mexico City Mexico 100.00% Dormant Full N/A
Edscha Scharwaecther Mechanism Servicios Laborales S.A.P.I. de C.V. Mexico City Mexico 100.00% Dormant Full N/A
GMF Holding GmbH Remscheid Germany 100.00% Portfolio management Full Ernst & Young
GMF Wuhan, Ltd Wuhan China 100.00% Parts manufacturing Full Ernst & Young
Gestamp Umformtechnik GmbH Ludwigsfelde Germany 100.00% Tooling and parts manufacturing Full Ernst & Young
Automotive Chassis Products Plc. Newton Aycliffe, Durham United Kingdom 100.00% Portfolio management Full Ernst & Young
Sofedit, S.A.S Le Theil sur Huisne France 65.00% Parts manufacturing Full Ernst & Young
Gestamp Prisma, S.A.S Usine de Messempré France 100.00% Parts manufacturing Full Ernst & Young
Gestamp Tallent , Ltd Newton Aycliffe, Durham United Kingdom 100.00% Parts manufacturing Full Ernst & Young
Gestamp Wroclaw Sp.z,o.o. Wroclaw Poland 65.00% Tooling and parts manufacturing Full Ernst & Young
Gestamp Auto components (Chongqing) Co., Ltd. Chongqing China 100.00% Parts manufacturing Full Ernst & Young
December 31, 2016

131
The companies which compose the Griwe Subgroup at December 31, 2017 and December 31, 2016 are the following:
(*) In 2017 took place the merge operation between Gestamp Griwe Hot Stamping GmbH (the acquiring company) and Gestamp Griwe Haynrode GmbH (the acquired company). Gestamp Griwe Hot Stamping GmbH changed its legal denomination to Gestamp Griwe Haynrode GmbH after the merge operation was held
Company Address Country Shareholding Consolidation method
Gestamp Griwe Westerburg GmbH Westerburg Germany Parent company Full
Gestamp Griwe Haynrode GmbH * Haynrode Germany 100.00% Full
December 31, 2017
Company Address Country Shareholding Consolidation method
Gestamp Griwe Westerburg GmbH Westerburg Germany Parent company Full
Gestamp Griwe Hot Stamping GmbH Haynrode Germany 100.00% Full
Gestamp Griwe Haynrode GmbH Haynrode Germany 100.00% Full
December 31, 2016

132
ANNEX II Indirect investments at December 31, 2017
Company Company holding the indirect investment % investment
Gestamp Vigo, S.A. Gestamp Servicios, S.A. 0.010%
Gestamp Toledo, S.L. Gestamp Servicios, S.A. 0.010%
Gestamp Brasi l Industria de Autopeças, S.A. Gestamp Servicios, S.A. 70.000%
Gestamp Ingeniería Europa Sur, S.L. Gestamp Servicios, S.A. 0.040%
Gestamp Esmar, S.A. Gestamp Servicios, S.A. 99.900%
Gestamp Bizkaia, S.A. Gestamp Servicios, S.A. 14.690%
Gestamp Kartek Co., LTD Gestamp Servicios, S.A. 100.000%
Gestamp Services India Private, Ltd. Gestamp Servicios, S.A. 1.010%
Beyçel ik Gestamp Kal ip, A.S. Gestamp Servicios, S.A. 50.000%
Gestamp Holding México, S.L. Gestamp Servicios, S.A. 69.850%
Gestamp Holding Rusia, S.L. Gestamp Servicios, S.A. 7.655%
Gestamp Togliatti , LLC. Gestamp Servicios, S.A. 100.000%
Gestamp Cerveira, Lda. Gestamp Vigo, S.A. 57.750%
Gestamp Washington Uk, Limited Gestamp Vigo, S.A. 4.990%
Gestamp Noury, S.A. Gestamp Vigo, S.A. 100.000%
Gestamp Louny S.R.O. Gestamp Cerveira, Lda. 52.720%
Gestamp Aveiro, S.A. Gestamp Cerveira, Lda. 45.660%
Gestamp Pune Automotive, Pvt. Ltd. Gestamp Cerveira, Lda. 26.370%
Autotech Engineering AIE Gestamp Bizkaia, S.A. 90.000%
Gestamp Sweden, AB Gestamp Bizkaia, S.A. 55.010%
Gestamp North Europe Services, S.L. Gestamp Bizkaia, S.A. 0.030%
Autotech Engineering Deutschland GmbH Gestamp Bizkaia, S.A. 55.000%
Autotech Engineering R&D Uk limited Gestamp Bizkaia, S.A. 55.000%
Gestamp Technology Institute, S.L. Gestamp Bizkaia, S.A. 0.010%
Gestamp Global Tooling, S.L. Gestamp Bizkaia, S.A. 0.010%
Autotech Engineering R&D USA, Inc. Gestamp Bizkaia, S.A. 55.000%
Loire S.A. Franco Española Gestamp Bizkaia, S.A. 1.000%
Autotech Engineering (Shangai), Co. Ltd. Gestamp Bizkaia, S.A. 55.000%
Gestamp Autotech Japan K.K. Gestamp Bizkaia, S.A. 55.000%
Gestamp Tooling AIE Gestamp Bizkaia, S.A. 40.000%
Gestamp Levante, S.L. Gestamp Linares, S.A. 11.500%
Gestamp Hard Tech AB Gestamp Sweden, AB 100.000%
Gestamp Holding China, AB Gestamp HardTech, AB 68.940%
Gestamp Tool Hardening, S.L. Matricerías Deusto, S.L. 0.100%
Gestamp Tooling AIE Matricerías Deusto, S.L. 20.000%
SCI Tournan en Brie Gestamp Noury, S.A.S 99.900%
Gestamp Linares, S.L. Gestamp Toledo, S.A. 94.980%
Gestamp Holding Argentina, S.L. Gestamp Toledo, S.A. 43.530%
Gestamp Aveiro, S.A. Gestamp Palencia, S.A. 54.340%
Gestamp Galvanizados, S.A. Gestamp Palencia, S.A. 100.000%
Gestamp Tech, S.L. Gestamp Palencia, S.A. 99.670%
Gestamp Holding Argentina, S.L. Gestamp Palencia, S.A. 7.040%
Gestamp Autocomponents (Tianjin) Co., Ltd. Gestamp Palencia, S.A. 100.000%
Gestamp Romchamp, S.A. Gestamp Palencia, S.A. 100.000%
Gestamp Córdoba, S.A. Gestamp Argentina, S.A. 10.669%
Mursolar, 21, S.L. Gestamp Aragón, S.A. 16.924%
Gestamp Holding México, S.L. Gestamp Galvanizados, S.A. 0.150%
Gestamp Holding Argentina, S.L. Gestamp Galvanizados, S.A. 8.620%
Gestamp North America, INC Gestamp Aveiro, S.A. 70.000%
Gestamp Navarra, S.A Gestamp Metalbages, S.A. 28.630%
Ingeniería Global MB, S.A. Gestamp Metalbages, S.A. 100.000%
Gestamp Aragon, S.A. Gestamp Metalbages, S.A. 94.990%
Gestamp Abrera, S.A. Gestamp Metalbages, S.A. 94.990%
MB Aragon P21, S.L. Gestamp Metalbages, S.A. 100.000%
Gestamp Polska SP. Z.O.O. Gestamp Metalbages, S.A. 100.000%
Gestamp Ingeniería Europa Sur, S.L. Gestamp Metalbages, S.A. 99.960%
Gestamp Manufacturing Autochasis, S.L. Gestamp Metalbages, S.A. 94.990%
Griwe Subgroup Gestamp Metalbages, S.A. 100.000%
Edscha Holding Gmbh Gestamp Metalbages, S.A. 67.000%
Gestamp Palau, S.A. Gestamp Metalbages, S.A. 60.000%
GMF Holding Gmbh Gestamp Metalbages, S.A. 100.000%
Gestamp Services India private. Ltd. Gestamp Levante, S.A. 98.990%
Gestamp Holding Rusia, S.L. Gestamp Levante, S.A. 7.810%
Mursolar, 21, S.L. Gestamp Navarra, S.A. 28.535%
December 31, 2017

133
Company Company holding the indirect investment % investment
Gestamp Holding Rusia, S.L. Gestamp Solblank Navarra, S.L. 5.642%
Gestamp Severstal Vsevolozhsk Llc Todlem, S.L. 100.000%
Gestamp Severstal Kaluga, Llc Todlem, S.L. 100.000%
Mexicana Servicios Laborales, S.A. de CV Gestamp Cartera de México, S.A. de C.V. 100.000%
Gestamp Aguascalientes, S.A. de CV Gestamp Cartera de México, S.A. de C.V. 100.000%
Gestamp Puebla, S.A. de CV Gestamp Cartera de México, S.A. de C.V. 100.000%
Gestamp Mexicana Serv. Lab., S.A. de CV Gestamp Cartera de México, S.A. de C.V. 100.000%
Gestamp Toluca, S.A. de C.V. Gestamp Cartera de México, S.A. de C.V. 100.000%
Gestamp Puebla II, S.A. de C.V. Gestamp Cartera de México, S.A. de C.V. 100.000%
Gestamp San Luis Potosí, S.A.P.I. de C.V. Gestamp Cartera de México, S.A. de C.V. 99.990%
Gestamp San Luis Potosí, Servicios Laborales S.A.P.I. de C.V. Gestamp Cartera de México, S.A. de C.V. 99.990%
Gestamp Sevicios Laborales de Toluca, S.A. de C.V. Gestamp Cartera de México, S.A. de C.V. 99.900%
Gestamp Córdoba, S.A. Gestamp Brasil Industria de Autopeças, S.A. 4.272%
Gestamp Baires, S.A. Gestamp Brasil Industria de Autopeças, S.A. 6.770%
MB Solblank Navarra, S.L. Gestamp Abrera, S.A. 100.000%
Gestamp Solblank Barcelona, S.A. Gestamp Abrera, S.A. 94.990%
Gestamp Holding Rusia, S.L. Gestamp Polska, SP. Z.O.O. 24.561%
Edscha Holding Gmbh Gestamp Polska, SP. Z.O.O. 33.000%
Gestamp Automotive India Private Ltd. Gestamp Polska, SP. Z.O.O. 50.000%
Gestamp Automotive Chennai Private, Ltd. Gestamp Solblank Barcelona, S.A. 100.000%
Gestamp Holding Rusia, S.L. Gestamp Solblank Barcelona, S.A. 6.673%
Gestamp Chattanooga, LLC. Gestamp North America, INC 100.000%
Gestamp Mason, Llc. Gestamp North America, INC 100.000%
Gestamp Alabama, Llc Gestamp North America, INC 100.000%
Gestamp West Virginia, Llc. Gestamp North America, INC 100.000%
Gestamp South Carolina, LLC. Gestamp North America, INC 100.000%
Gestamp Washtenaw, LLC. Gestamp North America, INC 100.000%
Gestamp Chattanooga II, LLC. Gestamp North America, INC 100.000%
Todlem, S.L. Gestamp Holding Rusia, S.L. 74.980%
Gestamp Auto Components (Kunshan) Co., Ltd Gestamp Holding China, AB 100.000%
Industrias Tamer, S.A. Gestamp Esmar, S.A. 30.000%
Gestamp Pune Automotive, Pvt. Ltd. Gestamp Automotive Chennai Private Ltd. 73.630%
Mursolar, 21, S.L. Griwe Subgroup 19.540%
Gestamp Louny S.R.O. Griwe Subgroup 47.280%
Gestamp Palau, S.A. Gestamp Manufacturing Autochasis, S.L. 40.000%
Almussafes Mantenimiento Troqueles, S.L. Gestamp Palau, S.A. 100.000%
Matricerías Deusto, S.L. Gestamp Global Tooling, S.L. 100.000%
Gestamp Try Out Services, S.L. Gestamp Global Tooling, S.L. 100.000%
Gestamp Tooling Services, AIE Gestamp Global Tooling, S.L. 40.000%
Adral Matricería y puesta a punto, S.L. Gestamp Global Tooling, S.L. 100.000%
Gestamp Tool Hardening, S.L. Gestamp Global Tooling, S.L. 99.900%
Gestamp Tooling Engineering Deutschland GmbH Gestamp Global Tooling, S.L. 100.000%
Gestamp Argentina, S.A. Gestamp Holding Argentina, S.L. 97.000%
Gestamp Córdoba, S.A. Gestamp Holding Argentina, S.L. 51.615%
Gestamp Baires, S.A. Gestamp Holding Argentina, S.L. 93.230%
Gestamp Córdoba, S.A. Gestamp Baires, S.A. 33.443%
Autotech Engineering Deutschland GmbH Autotech Engineering AIE 45.000%
Autotec Engineering (Shangai), Co. Ltd. Autotech Engineering AIE 45.000%
Gestamp Autotech Japan K.K. Autotech Engineering AIE 45.000%
Autotech Engineering R&D Uk limited Autotech Engineering AIE 45.000%
Autotech Engineering R&D USA l imited Autotech Engineering AIE 0.45
Gestamp Tooling Erandio, S.L. Gestamp Tool Hardening, S.L. 20.000%
Gestamp Cartera de Mexico, S.A. de CV Gestamp Holding México, S.L. 100.000%
Gestamp Argentina, S.A. Gestamp Holding México, S.L. 3.000%
Gestamp Tooling Erandio, S.L. Loire Sociedad Anónima Franco Española 80.000%
Ingeniería y Construcción Matrices, S.A. Gestión Global de Matricería, S.L. 100.000%
IxCxT, S.A. Gestión Global de Matricería, S.L. 100.000%
GGM Puebla, S.A. de C.V. Gestión Global de Matricería, S.L. 0.001%
GGM Puebla de Servicios Laborales, S.A. de C.V. Gestión Global de Matricería, S.L. 0.001%
GGM Puebla, S.A. de C.V. Gestión Global de Matricería, S.L. 99.990%
GGM Puebla de Servicios Laborales, S.A. de C.V. Gestión Global de Matricería, S.L. 99.990%
Gestamp Auto Components (Shenyang), Co. Ltd. Mursolar 21, S.L. 100.000%
Gestamp Autocomponents (Dongguan) Co., Ltd. Mursolar 21, S.L. 100.000%
Gestamp San Luis Potosí, S.A.P.I. de C.V. Gestamp Puebla, S.A. de CV 0.010%
Gestamp San Luis Potosí, Servicios Laborales S.A.P.I. de C.V. Gestamp Puebla, S.A. de CV 0.010%
Celik Form Gestamp Otomotive, A.S. Beyçelik Gestamp Kal ip, A.S. 100.000%
MPO Providers Rezistent, SRL Beyçelik Gestamp Kal ip, A.S. 70.000%
Beyçel ik Gestamp Teknoloji Kalip, A.S. Beyçelik Gestamp Kal ip, A.S. 100.000%
Beyçel ik Gestamp Sasi , L.S. Beyçelik Gestamp Kal ip, A.S. 100.000%

134
Company Company holding the indirect investment % investment
Edscha Automotive Hengersberg GmbH Edscha Holding GmbH 100.000%
Edscha Automotive Hauzenberg GmbH Edscha Holding GmbH 100.000%
Edscha Engineering GmbH Edscha Holding GmbH 100.000%
Edscha Automotive Technology, Co. Ltd. Edscha Holding GmbH 100.000%
Gestamp 2008, S.L. Edscha Holding GmbH 100.000%
Anhui Edscha Automotive parts, Co. Ltd. Edscha Holding GmbH 100.000%
Edscha Hradec, S.R.O. Edscha Holding GmbH 100.000%
Gestamp edscha Japan, Co. Ltd. Edscha Holding GmbH 100.000%
Edscha Burgos, S.A. Edscha Holding GmbH 0.010%
Edscha Velky Meder, S.R.O. Edscha Holding GmbH 100.000%
Edscha Automotiv Kamenice, S.R.O. Edscha Holding GmbH 100.000%
Edscha Engineering France SAS Edscha Holding GmbH 100.000%
Edscha Hengersberg Real Estate GmbH Edscha Holding GmbH 94.900%
Edscha Hauzenberg Real Estate GmbH Edscha Holding GmbH 94.900%
Shanghai Edscha Machinery, Co. Ltd. Edscha Holding GmbH 55.000%
Edscha Automotive Michigan, Inc. Edscha Holding GmbH 100.000%
Edscha Togliatti, Llc. Edscha Holding GmbH 100.000%
Edscha Automotive Components, Co. Ltd. Edscha Holding GmbH 100.000%
Gestamp Finance Slovakia, S.R.O. Edscha Holding GmbH 75.000%
Edscha Kunststofftechnik GmbH Edscha Holding GmbH 100.000%
Edscha Pha, Ltd. Edscha Holding GmbH 50.000%
Edscha Automotive SLP, S.A.P.I. de C.V. Edscha Holding GmbH 99.990%
Edscha Automotive SLP Servicios Laborales, S.A.P.I. de C.V. Edscha Holding GmbH 99.990%
Edscha Automotive Components (Chongqing) Co. Ltd. Edscha Holding GmbH 100.000%
Jui li Edscha Body Systems Co. Ltd. Edscha Holding GmbH 60.000%
Edscha Automotive Italy Edscha Holding GmbH 100.000%
Edscha Automotive Aapico, Co. Ltd. Edscha Holding GmbH 50.990%
Jui li Edscha Holding, Co. Ltd. Jui l i Edscha Body Systems Co. Ltd. 100.000%
Jui li Edscha Hainan Industry Enterprise, Co. Ltd. Jui l i Edscha Holding, Co. Ltd. 100.000%
Edscha do Brasil , Ltd. Edscha Engineering GmbH 83.260%
Edscha Automotive SLP, S.A.P.I. de C.V. Edscha Engineering GmbH 0.010%
Edscha Automotive SLP Servicios Laborales, S.A.P.I. de C.V. Edscha Engineering GmbH 0.010%
Edscha Automotive Aapico, Co. Ltd. Edscha Engineering GmbH 0.010%
Edscha Santander, S.L. Gestamp 2008, S.L. 94.990%
Edscha Burgos, S.A. Gestamp 2008, S.L. 99.990%
Edscha Briey, S.A.S. Edscha Santander, S.L. 100.000%
Edscha do Brasil , Ltd. Edscha Santander, S.L. 16.740%
GMF Wuhan, Ltd. GMF Holding GmbH 100.000%
Gestamp Umformtechnik GmbH GMF Holding GmbH 100.000%
Automotive Chassis Products, Plc. GMF Holding GmbH 100.000%
Sofedit SAS GMF Holding GmbH 65.000%
Gestamp Auto Components (Chongqing), Co. Ltd. GMF Holding GmbH 100.000%
Gestamp (China) Holding, Co. Ltd GMF Holding GmbH 100.000%
Gestamp Prisma SAS GMF Holding GmbH 100.000%
Gestamp Tallent, Ltd. Automotive Chassis Products Plc. 100.000%
Gestamp Wroclaw, Sp. Z.o.o. Sofedit, S.A.S 100.000%
Gestamp Washington Uk, Limited Gestamp Tallent , Ltd 95.010%
Gestamp Hot Stamping Japan K.K. Gestamp Tallent , Ltd 100.000%
Gestamp Sweden, AB Gestamp Tallent , Ltd 44.990%
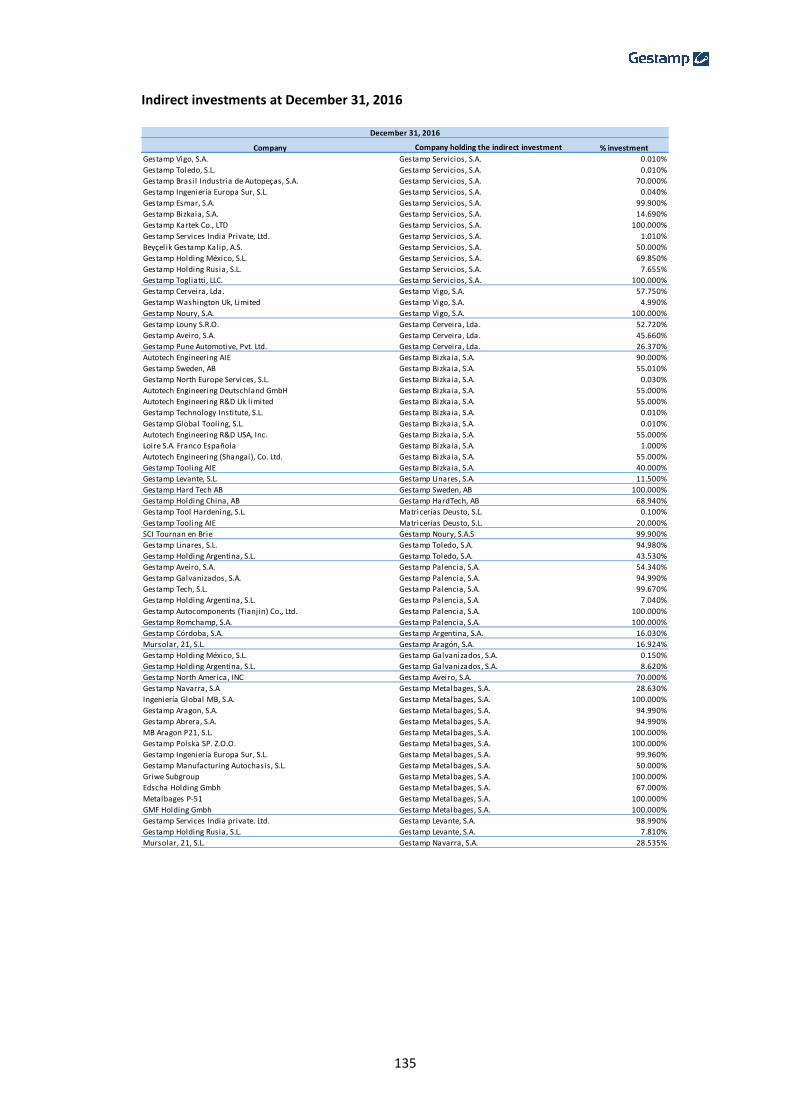
135
Indirect investments at December 31, 2016
Company % investment
Gestamp Vigo, S.A. Gestamp Servicios, S.A. 0.010%
Gestamp Toledo, S.L. Gestamp Servicios, S.A. 0.010%
Gestamp Brasi l Industria de Autopeças, S.A. Gestamp Servicios, S.A. 70.000%
Gestamp Ingeniería Europa Sur, S.L. Gestamp Servicios, S.A. 0.040%
Gestamp Esmar, S.A. Gestamp Servicios, S.A. 99.900%
Gestamp Bizkaia, S.A. Gestamp Servicios, S.A. 14.690%
Gestamp Kartek Co., LTD Gestamp Servicios, S.A. 100.000%
Gestamp Services India Private, Ltd. Gestamp Servicios, S.A. 1.010%
Beyçel ik Gestamp Kalip, A.S. Gestamp Servicios, S.A. 50.000%
Gestamp Holding México, S.L. Gestamp Servicios, S.A. 69.850%
Gestamp Holding Rusia, S.L. Gestamp Servicios, S.A. 7.655%
Gestamp Togliatti , LLC. Gestamp Servicios, S.A. 100.000%
Gestamp Cerveira, Lda. Gestamp Vigo, S.A. 57.750%
Gestamp Washington Uk, Limited Gestamp Vigo, S.A. 4.990%
Gestamp Noury, S.A. Gestamp Vigo, S.A. 100.000%
Gestamp Louny S.R.O. Gestamp Cerveira, Lda. 52.720%
Gestamp Aveiro, S.A. Gestamp Cerveira, Lda. 45.660%
Gestamp Pune Automotive, Pvt. Ltd. Gestamp Cerveira, Lda. 26.370%
Autotech Engineering AIE Gestamp Bizkaia, S.A. 90.000%
Gestamp Sweden, AB Gestamp Bizkaia, S.A. 55.010%
Gestamp North Europe Services, S.L. Gestamp Bizkaia, S.A. 0.030%
Autotech Engineering Deutschland GmbH Gestamp Bizkaia, S.A. 55.000%
Autotech Engineering R&D Uk limited Gestamp Bizkaia, S.A. 55.000%
Gestamp Technology Institute, S.L. Gestamp Bizkaia, S.A. 0.010%
Gestamp Global Tooling, S.L. Gestamp Bizkaia, S.A. 0.010%
Autotech Engineering R&D USA, Inc. Gestamp Bizkaia, S.A. 55.000%
Loire S.A. Franco Española Gestamp Bizkaia, S.A. 1.000%
Autotech Engineering (Shangai), Co. Ltd. Gestamp Bizkaia, S.A. 55.000%
Gestamp Tooling AIE Gestamp Bizkaia, S.A. 40.000%
Gestamp Levante, S.L. Gestamp Linares, S.A. 11.500%
Gestamp Hard Tech AB Gestamp Sweden, AB 100.000%
Gestamp Holding China, AB Gestamp HardTech, AB 68.940%
Gestamp Tool Hardening, S.L. Matricerías Deusto, S.L. 0.100%
Gestamp Tooling AIE Matricerías Deusto, S.L. 20.000%
SCI Tournan en Brie Gestamp Noury, S.A.S 99.900%
Gestamp Linares, S.L. Gestamp Toledo, S.A. 94.980%
Gestamp Holding Argentina, S.L. Gestamp Toledo, S.A. 43.530%
Gestamp Aveiro, S.A. Gestamp Palencia, S.A. 54.340%
Gestamp Galvanizados, S.A. Gestamp Palencia, S.A. 94.990%
Gestamp Tech, S.L. Gestamp Palencia, S.A. 99.670%
Gestamp Holding Argentina, S.L. Gestamp Palencia, S.A. 7.040%
Gestamp Autocomponents (Tianjin) Co., Ltd. Gestamp Palencia, S.A. 100.000%
Gestamp Romchamp, S.A. Gestamp Palencia, S.A. 100.000%
Gestamp Córdoba, S.A. Gestamp Argentina, S.A. 16.030%
Mursolar, 21, S.L. Gestamp Aragón, S.A. 16.924%
Gestamp Holding México, S.L. Gestamp Galvanizados, S.A. 0.150%
Gestamp Holding Argentina, S.L. Gestamp Galvanizados, S.A. 8.620%
Gestamp North America, INC Gestamp Aveiro, S.A. 70.000%
Gestamp Navarra, S.A Gestamp Metalbages, S.A. 28.630%
Ingeniería Global MB, S.A. Gestamp Metalbages, S.A. 100.000%
Gestamp Aragon, S.A. Gestamp Metalbages, S.A. 94.990%
Gestamp Abrera, S.A. Gestamp Metalbages, S.A. 94.990%
MB Aragon P21, S.L. Gestamp Metalbages, S.A. 100.000%
Gestamp Polska SP. Z.O.O. Gestamp Metalbages, S.A. 100.000%
Gestamp Ingeniería Europa Sur, S.L. Gestamp Metalbages, S.A. 99.960%
Gestamp Manufacturing Autochasis, S.L. Gestamp Metalbages, S.A. 50.000%
Griwe Subgroup Gestamp Metalbages, S.A. 100.000%
Edscha Holding Gmbh Gestamp Metalbages, S.A. 67.000%
Metalbages P-51 Gestamp Metalbages, S.A. 100.000%
GMF Holding Gmbh Gestamp Metalbages, S.A. 100.000%
Gestamp Services India private. Ltd. Gestamp Levante, S.A. 98.990%
Gestamp Holding Rusia, S.L. Gestamp Levante, S.A. 7.810%
Mursolar, 21, S.L. Gestamp Navarra, S.A. 28.535%
Company holding the indirect investment
December 31, 2016
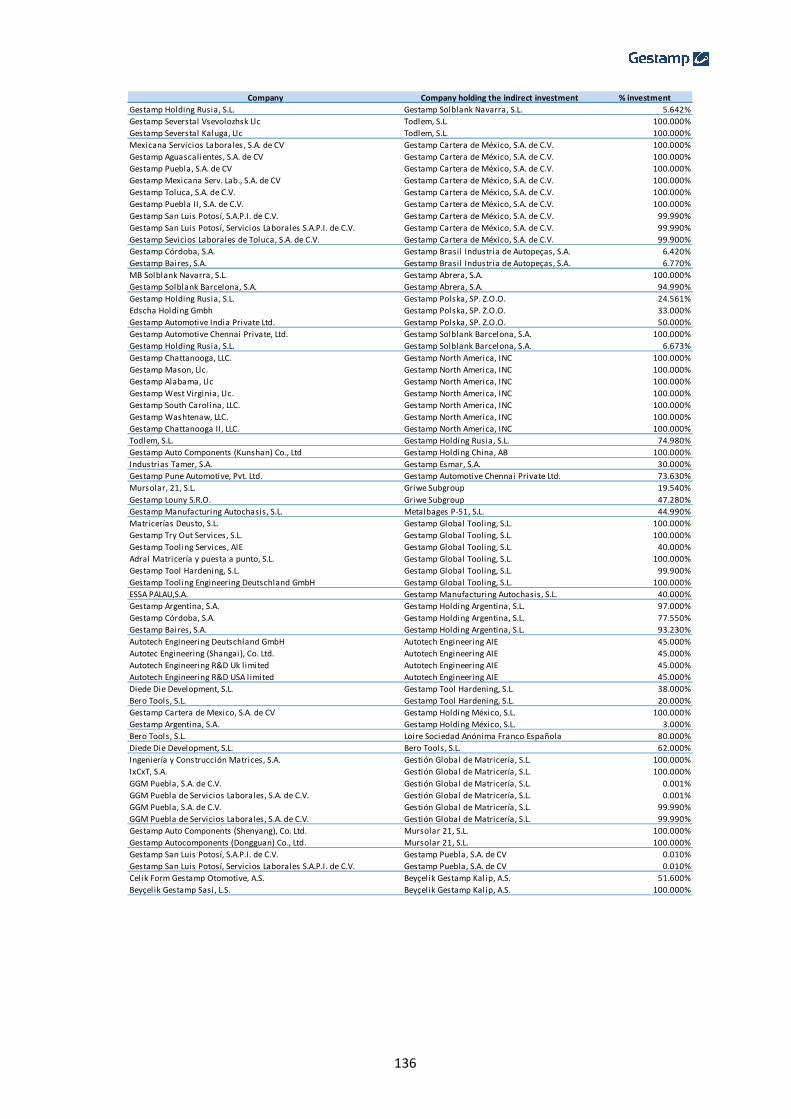
136
Company Company holding the indirect investment % investment
Gestamp Holding Rusia, S.L. Gestamp Solblank Navarra, S.L. 5.642%
Gestamp Severstal Vsevolozhsk Llc Todlem, S.L. 100.000%
Gestamp Severstal Kaluga, Llc Todlem, S.L. 100.000%
Mexicana Servicios Laborales, S.A. de CV Gestamp Cartera de México, S.A. de C.V. 100.000%
Gestamp Aguascalientes, S.A. de CV Gestamp Cartera de México, S.A. de C.V. 100.000%
Gestamp Puebla, S.A. de CV Gestamp Cartera de México, S.A. de C.V. 100.000%
Gestamp Mexicana Serv. Lab., S.A. de CV Gestamp Cartera de México, S.A. de C.V. 100.000%
Gestamp Toluca, S.A. de C.V. Gestamp Cartera de México, S.A. de C.V. 100.000%
Gestamp Puebla II, S.A. de C.V. Gestamp Cartera de México, S.A. de C.V. 100.000%
Gestamp San Luis Potosí, S.A.P.I. de C.V. Gestamp Cartera de México, S.A. de C.V. 99.990%
Gestamp San Luis Potosí, Servicios Laborales S.A.P.I. de C.V. Gestamp Cartera de México, S.A. de C.V. 99.990%
Gestamp Sevicios Laborales de Toluca, S.A. de C.V. Gestamp Cartera de México, S.A. de C.V. 99.900%
Gestamp Córdoba, S.A. Gestamp Brasil Industria de Autopeças, S.A. 6.420%
Gestamp Baires, S.A. Gestamp Brasil Industria de Autopeças, S.A. 6.770%
MB Solblank Navarra, S.L. Gestamp Abrera, S.A. 100.000%
Gestamp Solblank Barcelona, S.A. Gestamp Abrera, S.A. 94.990%
Gestamp Holding Rusia, S.L. Gestamp Polska, SP. Z.O.O. 24.561%
Edscha Holding Gmbh Gestamp Polska, SP. Z.O.O. 33.000%
Gestamp Automotive India Private Ltd. Gestamp Polska, SP. Z.O.O. 50.000%
Gestamp Automotive Chennai Private, Ltd. Gestamp Solblank Barcelona, S.A. 100.000%
Gestamp Holding Rusia, S.L. Gestamp Solblank Barcelona, S.A. 6.673%
Gestamp Chattanooga, LLC. Gestamp North America, INC 100.000%
Gestamp Mason, Llc. Gestamp North America, INC 100.000%
Gestamp Alabama, Llc Gestamp North America, INC 100.000%
Gestamp West Virginia, Llc. Gestamp North America, INC 100.000%
Gestamp South Carolina, LLC. Gestamp North America, INC 100.000%
Gestamp Washtenaw, LLC. Gestamp North America, INC 100.000%
Gestamp Chattanooga II, LLC. Gestamp North America, INC 100.000%
Todlem, S.L. Gestamp Holding Rusia, S.L. 74.980%
Gestamp Auto Components (Kunshan) Co., Ltd Gestamp Holding China, AB 100.000%
Industrias Tamer, S.A. Gestamp Esmar, S.A. 30.000%
Gestamp Pune Automotive, Pvt. Ltd. Gestamp Automotive Chennai Private Ltd. 73.630%
Mursolar, 21, S.L. Griwe Subgroup 19.540%
Gestamp Louny S.R.O. Griwe Subgroup 47.280%
Gestamp Manufacturing Autochasis, S.L. Metalbages P-51, S.L. 44.990%
Matricerías Deusto, S.L. Gestamp Global Tooling, S.L. 100.000%
Gestamp Try Out Services, S.L. Gestamp Global Tooling, S.L. 100.000%
Gestamp Tooling Services, AIE Gestamp Global Tooling, S.L. 40.000%
Adral Matricería y puesta a punto, S.L. Gestamp Global Tooling, S.L. 100.000%
Gestamp Tool Hardening, S.L. Gestamp Global Tooling, S.L. 99.900%
Gestamp Tooling Engineering Deutschland GmbH Gestamp Global Tooling, S.L. 100.000%
ESSA PALAU,S.A. Gestamp Manufacturing Autochasis, S.L. 40.000%
Gestamp Argentina, S.A. Gestamp Holding Argentina, S.L. 97.000%
Gestamp Córdoba, S.A. Gestamp Holding Argentina, S.L. 77.550%
Gestamp Baires, S.A. Gestamp Holding Argentina, S.L. 93.230%
Autotech Engineering Deutschland GmbH Autotech Engineering AIE 45.000%
Autotec Engineering (Shangai), Co. Ltd. Autotech Engineering AIE 45.000%
Autotech Engineering R&D Uk limited Autotech Engineering AIE 45.000%
Autotech Engineering R&D USA l imited Autotech Engineering AIE 45.000%
Diede Die Development, S.L. Gestamp Tool Hardening, S.L. 38.000%
Bero Tools, S.L. Gestamp Tool Hardening, S.L. 20.000%
Gestamp Cartera de Mexico, S.A. de CV Gestamp Holding México, S.L. 100.000%
Gestamp Argentina, S.A. Gestamp Holding México, S.L. 3.000%
Bero Tools, S.L. Loire Sociedad Anónima Franco Española 80.000%
Diede Die Development, S.L. Bero Tools, S.L. 62.000%
Ingeniería y Construcción Matrices, S.A. Gestión Global de Matricería, S.L. 100.000%
IxCxT, S.A. Gestión Global de Matricería, S.L. 100.000%
GGM Puebla, S.A. de C.V. Gestión Global de Matricería, S.L. 0.001%
GGM Puebla de Servicios Laborales, S.A. de C.V. Gestión Global de Matricería, S.L. 0.001%
GGM Puebla, S.A. de C.V. Gestión Global de Matricería, S.L. 99.990%
GGM Puebla de Servicios Laborales, S.A. de C.V. Gestión Global de Matricería, S.L. 99.990%
Gestamp Auto Components (Shenyang), Co. Ltd. Mursolar 21, S.L. 100.000%
Gestamp Autocomponents (Dongguan) Co., Ltd. Mursolar 21, S.L. 100.000%
Gestamp San Luis Potosí, S.A.P.I. de C.V. Gestamp Puebla, S.A. de CV 0.010%
Gestamp San Luis Potosí, Servicios Laborales S.A.P.I. de C.V. Gestamp Puebla, S.A. de CV 0.010%
Celik Form Gestamp Otomotive, A.S. Beyçelik Gestamp Kal ip, A.S. 51.600%
Beyçel ik Gestamp Sasi , L.S. Beyçelik Gestamp Kal ip, A.S. 100.000%
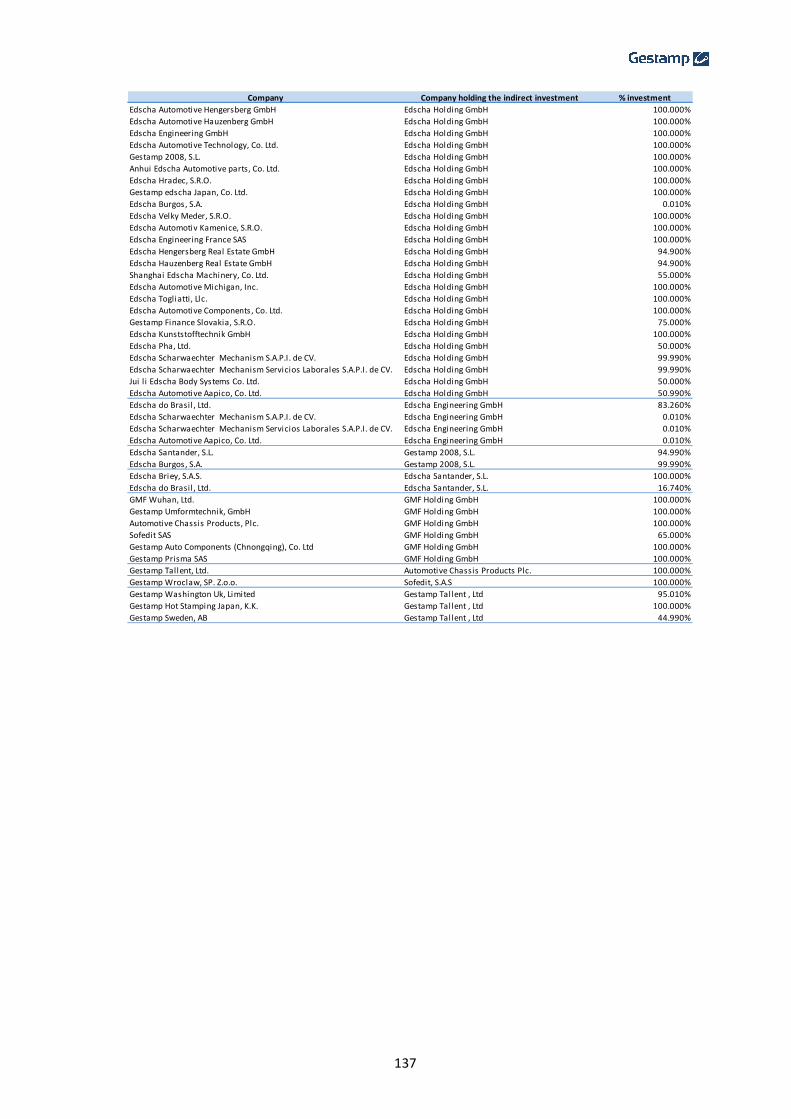
137
Company Company holding the indirect investment % investment
Edscha Automotive Hengersberg GmbH Edscha Holding GmbH 100.000%
Edscha Automotive Hauzenberg GmbH Edscha Holding GmbH 100.000%
Edscha Engineering GmbH Edscha Holding GmbH 100.000%
Edscha Automotive Technology, Co. Ltd. Edscha Holding GmbH 100.000%
Gestamp 2008, S.L. Edscha Holding GmbH 100.000%
Anhui Edscha Automotive parts, Co. Ltd. Edscha Holding GmbH 100.000%
Edscha Hradec, S.R.O. Edscha Holding GmbH 100.000%
Gestamp edscha Japan, Co. Ltd. Edscha Holding GmbH 100.000%
Edscha Burgos, S.A. Edscha Holding GmbH 0.010%
Edscha Velky Meder, S.R.O. Edscha Holding GmbH 100.000%
Edscha Automotiv Kamenice, S.R.O. Edscha Holding GmbH 100.000%
Edscha Engineering France SAS Edscha Holding GmbH 100.000%
Edscha Hengersberg Real Estate GmbH Edscha Holding GmbH 94.900%
Edscha Hauzenberg Real Estate GmbH Edscha Holding GmbH 94.900%
Shanghai Edscha Machinery, Co. Ltd. Edscha Holding GmbH 55.000%
Edscha Automotive Michigan, Inc. Edscha Holding GmbH 100.000%
Edscha Togliatti, Llc. Edscha Holding GmbH 100.000%
Edscha Automotive Components, Co. Ltd. Edscha Holding GmbH 100.000%
Gestamp Finance Slovakia, S.R.O. Edscha Holding GmbH 75.000%
Edscha Kunststofftechnik GmbH Edscha Holding GmbH 100.000%
Edscha Pha, Ltd. Edscha Holding GmbH 50.000%
Edscha Scharwaechter Mechanism S.A.P.I. de CV. Edscha Holding GmbH 99.990%
Edscha Scharwaechter Mechanism Servicios Laborales S.A.P.I. de CV. Edscha Holding GmbH 99.990%
Jui li Edscha Body Systems Co. Ltd. Edscha Holding GmbH 50.000%
Edscha Automotive Aapico, Co. Ltd. Edscha Holding GmbH 50.990%
Edscha do Brasil , Ltd. Edscha Engineering GmbH 83.260%
Edscha Scharwaechter Mechanism S.A.P.I. de CV. Edscha Engineering GmbH 0.010%
Edscha Scharwaechter Mechanism Servicios Laborales S.A.P.I. de CV. Edscha Engineering GmbH 0.010%
Edscha Automotive Aapico, Co. Ltd. Edscha Engineering GmbH 0.010%
Edscha Santander, S.L. Gestamp 2008, S.L. 94.990%
Edscha Burgos, S.A. Gestamp 2008, S.L. 99.990%
Edscha Briey, S.A.S. Edscha Santander, S.L. 100.000%
Edscha do Brasil , Ltd. Edscha Santander, S.L. 16.740%
GMF Wuhan, Ltd. GMF Holding GmbH 100.000%
Gestamp Umformtechnik, GmbH GMF Holding GmbH 100.000%
Automotive Chassis Products, Plc. GMF Holding GmbH 100.000%
Sofedit SAS GMF Holding GmbH 65.000%
Gestamp Auto Components (Chnongqing), Co. Ltd GMF Holding GmbH 100.000%
Gestamp Prisma SAS GMF Holding GmbH 100.000%
Gestamp Tallent, Ltd. Automotive Chassis Products Plc. 100.000%
Gestamp Wroclaw, SP. Z.o.o. Sofedit, S.A.S 100.000%
Gestamp Washington Uk, Limited Gestamp Tallent , Ltd 95.010%
Gestamp Hot Stamping Japan, K.K. Gestamp Tallent , Ltd 100.000%
Gestamp Sweden, AB Gestamp Tallent , Ltd 44.990%

138
ANNEX III Guarantors for 2012 (fully paid in 2017) Bank of America Loan and 2013 Syndicated Loan (modified in 2016 and 2017)
Additionally, the Group companies Gestamp Metalbages, S.A., Gestamp Bizkaia, S.A., Gestamp Vigo, S.A., Gestamp Palencia, S.A. Gestamp Servicios, S.A. and Gestamp Toledo, S.A. have shares pledge. Guarantors for May, 2013 and May, 2016 Bonds
Gestamp Navarra, S.A. Gestamp Noury, SAS
Edscha Automotive Kamenice, S.R.O. Gestamp Palencia, S.A.
Edscha Engineering, GmbH. Gestamp Polska, Sp.Z.o.o.
Edscha Briey, S.A.S. Gestamp Cerveira, Ltda
Edscha Engineering France , S.A.S. Gestamp Ronchamp, S.A.S.
Edscha Automotive Hauzenberg, GmbH Gestamp Servicios, S.A.
Edscha Hauzenberg Real Estate GmbH, & Co. Gestamp Washington UK Limited
Edscha Hengersberg Real Estate GmbH, & Co. Gestamp Vendas Novas Unipessoal, Lda.
Edscha Automotive Hengersberg, GmbH. Gestamp Vigo, S.A.
Edscha Holding, GmbH. Gestamp Umformtechnik, GmbH
Edscha Hradec, S.r.o. Griwe Subgroup
Edscha Velky Meder, S.r.o. Ingeniería Global MB, S.A.
Gestamp Bizkaia, S.A. Loire S.A. Franco Española
Gestamp Galvanizados, S.A. Gestamp Abrera, S.A.
Gestamp Automoción,S.A. Gestamp Aragón, S.A.
Gestamp Aveiro, S.A. Gestamp Metalbages, S.A.
Gestamp HardTech, AB Gestamp Prisma, S.A.S.
Gestamp Hungaria, KFT. SCI de Tournan en Brie
Gestamp Linares, S.A. Gestamp Solblank Barcelona, S.A.
Gestamp Louny, S.r.o. Gestamp Tallent Limited
Gestamp Esmar, S.A. Gestamp Sweden AB
Gestamp Wroclaw, Sp. Z.o.o Edscha Burgos, S.A
Sofedit, S.A.S. Gestamp Levante, S.A.
Gestamp Toledo, S.A. Edscha Santander, S.L.
Gestamp Navarra, S.A. Gestamp Noury, SAS
Edscha Automotive Kamenice, S.R.O. Gestamp Palencia, S.A.
Edscha Engineering, GmbH. Gestamp Polska, Sp.Z.o.o.
Edscha Briey, S.A.S. Gestamp Cerveira, Ltda
Edscha Engineering France , S.A.S. Gestamp Ronchamp, S.A.S.
Edscha Automotive Hauzenberg, GmbH Gestamp Servicios, S.A.
Edscha Hauzenberg Real Estate GmbH, & Co. Gestamp Washington UK Limited
Edscha Hengersberg Real Estate GmbH, & Co. Gestamp Vendas Novas Unipessoal, Lda.
Edscha Automotive Hengersberg, GmbH. Gestamp Vigo, S.A.
Edscha Holding, GmbH. Gestamp Umformtechnik, GmbH
Edscha Hradec, S.r.o. Griwe Subgroup
Edscha Velky Meder, S.r.o. Ingeniería Global MB, S.A.
Gestamp Bizkaia, S.A. Loire S.A. Franco Española
Gestamp Galvanizados, S.A. Gestamp Aragón, S.A.
Gestamp Automoción, S.A. Gestamp Abrera, S.A.
Gestamp Aveiro, S.A. Gestamp Metalbages, S.A.
Gestamp HardTech, AB Gestamp Prisma, S.A.S.
Gestamp Hungaria, KFT. SCI de Tournan en Brie
Gestamp Linares, S.A. Gestamp Solblank Barcelona, S.A.
Gestamp Louny, S.r.o. Gestamp Tallent Limited
Gestamp Esmar, S.A. Gestamp Sweden AB
Gestamp Wroclaw, Sp. Z.o.o Edscha Burgos, S.A.
Sofedit, S.A.S. Gestamp Levante, S.A.
Gestamp Toledo, S.A. Edscha Santander, S.L.
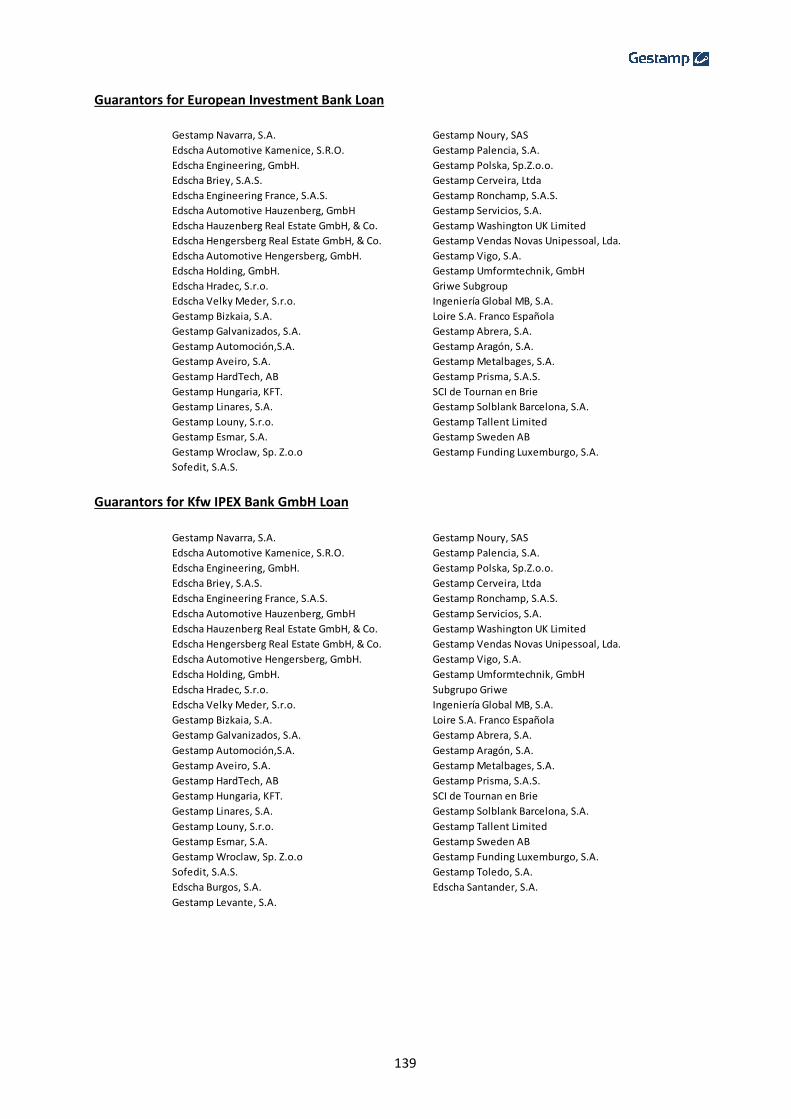
139
Guarantors for European Investment Bank Loan
Guarantors for Kfw IPEX Bank GmbH Loan
Gestamp Navarra, S.A. Gestamp Noury, SAS
Edscha Automotive Kamenice, S.R.O. Gestamp Palencia, S.A.
Edscha Engineering, GmbH. Gestamp Polska, Sp.Z.o.o.
Edscha Briey, S.A.S. Gestamp Cerveira, Ltda
Edscha Engineering France, S.A.S. Gestamp Ronchamp, S.A.S.
Edscha Automotive Hauzenberg, GmbH Gestamp Servicios, S.A.
Edscha Hauzenberg Real Estate GmbH, & Co. Gestamp Washington UK Limited
Edscha Hengersberg Real Estate GmbH, & Co. Gestamp Vendas Novas Unipessoal, Lda.
Edscha Automotive Hengersberg, GmbH. Gestamp Vigo, S.A.
Edscha Holding, GmbH. Gestamp Umformtechnik, GmbH
Edscha Hradec, S.r.o. Griwe Subgroup
Edscha Velky Meder, S.r.o. Ingeniería Global MB, S.A.
Gestamp Bizkaia, S.A. Loire S.A. Franco Española
Gestamp Galvanizados, S.A. Gestamp Abrera, S.A.
Gestamp Automoción,S.A. Gestamp Aragón, S.A.
Gestamp Aveiro, S.A. Gestamp Metalbages, S.A.
Gestamp HardTech, AB Gestamp Prisma, S.A.S.
Gestamp Hungaria, KFT. SCI de Tournan en Brie
Gestamp Linares, S.A. Gestamp Solblank Barcelona, S.A.
Gestamp Louny, S.r.o. Gestamp Tallent Limited
Gestamp Esmar, S.A. Gestamp Sweden AB
Gestamp Wroclaw, Sp. Z.o.o Gestamp Funding Luxemburgo, S.A.
Sofedit, S.A.S.
Gestamp Navarra, S.A. Gestamp Noury, SAS
Edscha Automotive Kamenice, S.R.O. Gestamp Palencia, S.A.
Edscha Engineering, GmbH. Gestamp Polska, Sp.Z.o.o.
Edscha Briey, S.A.S. Gestamp Cerveira, Ltda
Edscha Engineering France, S.A.S. Gestamp Ronchamp, S.A.S.
Edscha Automotive Hauzenberg, GmbH Gestamp Servicios, S.A.
Edscha Hauzenberg Real Estate GmbH, & Co. Gestamp Washington UK Limited
Edscha Hengersberg Real Estate GmbH, & Co. Gestamp Vendas Novas Unipessoal, Lda.
Edscha Automotive Hengersberg, GmbH. Gestamp Vigo, S.A.
Edscha Holding, GmbH. Gestamp Umformtechnik, GmbH
Edscha Hradec, S.r.o. Subgrupo Griwe
Edscha Velky Meder, S.r.o. Ingeniería Global MB, S.A.
Gestamp Bizkaia, S.A. Loire S.A. Franco Española
Gestamp Galvanizados, S.A. Gestamp Abrera, S.A.
Gestamp Automoción,S.A. Gestamp Aragón, S.A.
Gestamp Aveiro, S.A. Gestamp Metalbages, S.A.
Gestamp HardTech, AB Gestamp Prisma, S.A.S.
Gestamp Hungaria, KFT. SCI de Tournan en Brie
Gestamp Linares, S.A. Gestamp Solblank Barcelona, S.A.
Gestamp Louny, S.r.o. Gestamp Tallent Limited
Gestamp Esmar, S.A. Gestamp Sweden AB
Gestamp Wroclaw, Sp. Z.o.o Gestamp Funding Luxemburgo, S.A.
Sofedit, S.A.S. Gestamp Toledo, S.A.
Edscha Burgos, S.A. Edscha Santander, S.A.
Gestamp Levante, S.A.
Management Report for the twelve months period ended December 31st, 2017 Gestamp Automoción, S.A. February 26th, 2018
141
2017 Management Report
Index 1. GESTAMP AUTOMOCIÓN GROUP SITUATION .................................................................. 142
1.1 Business Model ......................................................................................................... 142
1.2 Organizational structure ........................................................................................... 143
2. COMPANY PERFORMANCE AND RESULTS ......................................................................... 144
2.1 Macroeconomic and sector evolution during 2017 .................................................. 144
2.2 Financial Results Overview ........................................................................................ 145
2.3 Non-Financial Results Overview ................................................................................ 148
2.3.1 Ethic and Human Rights .................................................................................... 149
2.3.2 Employees ......................................................................................................... 150
2.3.3 Environmental Issues ........................................................................................ 152
2.3.4 Society ............................................................................................................... 154
2.3.5 Corporate Governance ...................................................................................... 155
3. DEBT AND LIQUIDITY ......................................................................................................... 156
4. MAIN RISKS AND UNCERTAINTIES ..................................................................................... 157
5. SUBSEQUENT EVENTS ....................................................................................................... 159
6. FORESEABLE EVOLUTION OF THE COMPANY .................................................................... 159
7. R&D ACTIVITIES ................................................................................................................. 159
8. OPERATIONS WITH OWN SHARES ..................................................................................... 161
9. OTHER RELEVANT INFORMATION ..................................................................................... 161
9.1 Stock Exchange Evolution .......................................................................................... 161
9.2 Dividend policy .......................................................................................................... 162
9.3 Credit Rating .............................................................................................................. 162
9.4 Average period for payment to suppliers ................................................................. 163
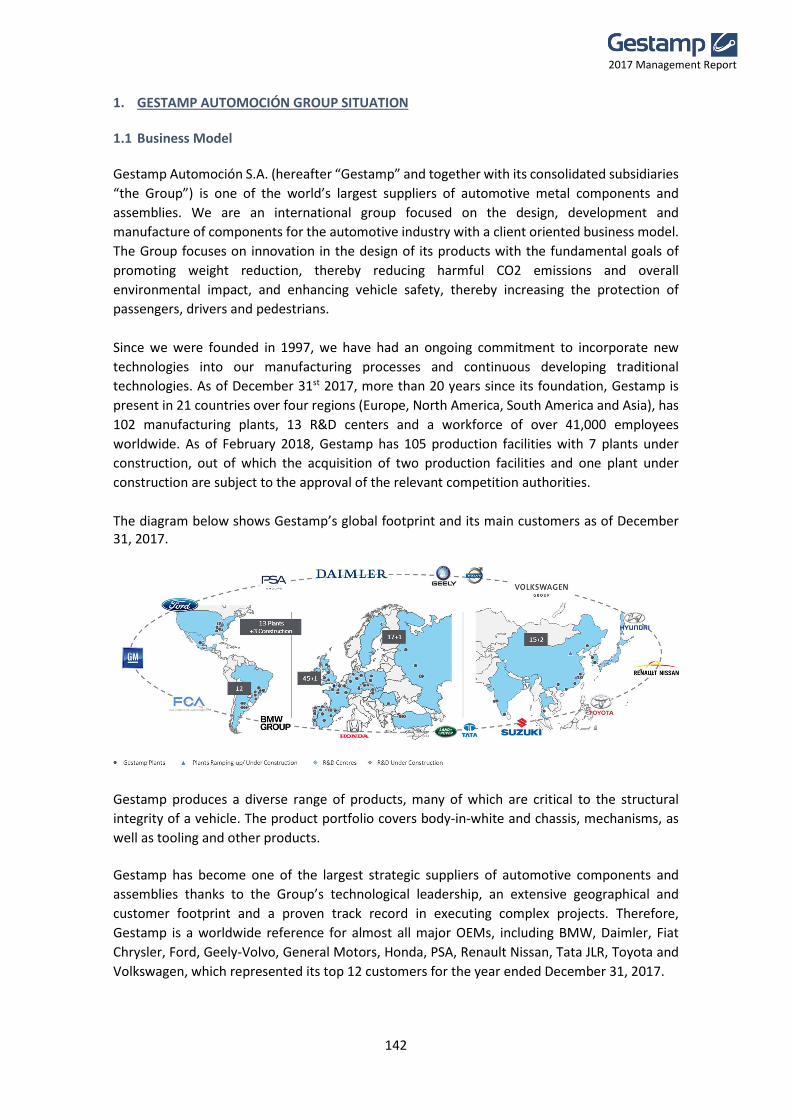
142
2017 Management Report
1. GESTAMP AUTOMOCIÓN GROUP SITUATION 1.1 Business Model Gestamp Automoción S.A. (hereafter “Gestamp” and together with its consolidated subsidiaries
“the Group”) is one of the world’s largest suppliers of automotive metal components and
assemblies. We are an international group focused on the design, development and
manufacture of components for the automotive industry with a client oriented business model.
The Group focuses on innovation in the design of its products with the fundamental goals of
promoting weight reduction, thereby reducing harmful CO2 emissions and overall
environmental impact, and enhancing vehicle safety, thereby increasing the protection of
passengers, drivers and pedestrians.
Since we were founded in 1997, we have had an ongoing commitment to incorporate new
technologies into our manufacturing processes and continuous developing traditional
technologies. As of December 31st 2017, more than 20 years since its foundation, Gestamp is
present in 21 countries over four regions (Europe, North America, South America and Asia), has
102 manufacturing plants, 13 R&D centers and a workforce of over 41,000 employees
worldwide. As of February 2018, Gestamp has 105 production facilities with 7 plants under
construction, out of which the acquisition of two production facilities and one plant under
construction are subject to the approval of the relevant competition authorities.
The diagram below shows Gestamp’s global footprint and its main customers as of December 31, 2017.
Gestamp produces a diverse range of products, many of which are critical to the structural
integrity of a vehicle. The product portfolio covers body-in-white and chassis, mechanisms, as
well as tooling and other products.
Gestamp has become one of the largest strategic suppliers of automotive components and
assemblies thanks to the Group’s technological leadership, an extensive geographical and
customer footprint and a proven track record in executing complex projects. Therefore,
Gestamp is a worldwide reference for almost all major OEMs, including BMW, Daimler, Fiat
Chrysler, Ford, Geely-Volvo, General Motors, Honda, PSA, Renault Nissan, Tata JLR, Toyota and
Volkswagen, which represented its top 12 customers for the year ended December 31, 2017.

143
2017 Management Report
Our customer oriented approach to expansion has been key to maximizing the growth potential
of our technological leadership and global footprint. Lastly, operational excellence is deeply
rooted in our culture, driven by reliability and efficiency.
1.2 Organizational structure The Board of Directors is the highest governing body of Gestamp Automoción Group and it is a decision-making center for the management of the Company. The composition of the Board of Directors brings together, as a whole, the necessary knowledge, skills and experience to guarantee an adequate governance of the Company, in accordance with its activities, including its main risks, and ensuring effective capacity for independent and autonomous decision-making for the benefit of the Society. Additionally, the Management Committee is composed by the president and CEO, and the CFO, both of which are executive board members of the Group, as well as by the managers of the geographical Divisions, the managers of the Business Units, the Human Resources corporate director and the Legal corporate director. The organizational structure as of December 31st, 2017 is as follows:
Client Oriented Business Model with Long-Term Strategic Pillars

144
2017 Management Report
(1) Strategic Planning, Investor Relations, Communication and Institutional Affairs, Sales Controlling and Marketing
On December 20th, 2017, the Group announced that the Board of Directors had approved the appointment of the Vice-President and CFO (Mr. Francisco López Peña) as the new CEO of the Company to become effective in 2018. As CEO he will assume the oversight of industrial operations within the Group, finance direction and other corporate duties. Francisco J. Riberas will keep his functions as Executive Chairman. From this position he will focus on Strategy and Corporate Development, including key commercial relationships with Gestamp’s customers. He will also enhance Corporate Governance and institutional representation of the Group.
2. COMPANY PERFORMANCE AND RESULTS 2.1 Macroeconomic and sector evolution during 2017 Global economic growth during 2017 has been stronger than expected, with the second half of the year confirming the recovery path seen during the first half. Signs of recovery in the US have been confirmed during the second half of the year, adding to the solid performance of the Eurozone and Japan. Political developments in Europe and the ongoing negotiations on Brexit, have had a limited impact on growth during the year. In this context, the evolution of the automotive sector has been positive. Global light vehicle production, according to IHS data as of January 2018, grew by 2.1% during 2017 compared to 2016. The growth in Gestamp’s footprint stood at 1.7%, with a strong market production in Mercosur (+20.8%) and Eastern Europe (+6.9%).
VP / CFO
FinanceIT
ControllingPurchasing
Capex & GCIO
Corporate Development
Organization
Nafta Asia
CEO Office(1)
CEO
Chassis EdschaNorth
EuropeSouth
EuropeMercosur
Internal Control
Legal
Human Resources
Technology, Tooling & Equipment
Sales
Quality, Purchasing BUG
Technical Office

145
2017 Management Report
Global OEM’s have continued to focus on “CASE” (Connectivity, Autonomous driving, Shared
mobility and Electrification), which supports the outsourcing of the components of a vehicle to global strategic suppliers, such as Gestamp. OEM’s are facing increasing capital needs to match new market requirements in relation to CASE, which generates more opportunities for key strategic suppliers. Whether a vehicle has an internal combustion engine or is electrically powered, Gestamp is well positioned to benefit from the current trends, as lightweight and safety will continue to be key for OEM’s. During 2017, several OEM’s have announced their strategy with regards to electric vehicles, including: (i) BMW’s launch of 25 models by 2025 with an electrified drive system of which 12 are expected to be pure-electric, (ii) VW’s strategy for electrification called ‘Roadmap E‘, with 80 new electric vehicles by 2025. These model launches announced by OEM’s are expected to lead to an increase in the levels of outsourcing to global suppliers, such as Gestamp. In general, macroeconomic and auto sector conditions have been positive, driving growth globally. Mature and developing markets have each been influenced by their respective trends and dynamics. The aforementioned macro and auto trends provide a solid foundation and continue to reinforce Gestamp’s vision, strategy and objectives. In summary, Gestamp’s results in 2017 were solid despite the operational project launch issues announced in September in North America, as well as the impact of foreign exchange rates, with the strengthening of the Euro during the year.
2.2 Financial Results Overview
Revenues grew by 8.6% in 2017 reaching €8,201.6 million (11.0% at constant FX), outperforming the market by more than five times (compared to market production volume growth in Gestamp production footprint as per IHS of 1.7%). In terms of profitability, EBITDA in 2017 reached 889.9 million euros with an implied growth rate of 5.8% when compared to 2016 (8.8% at constant FX). The profitability has been impacted by one-off costs in North America and higher tooling revenues. Net Income for the period grew by 8.3%, reaching €239.7 million.
Gestamp Revenue Growth at Constant FX vs. Market Production Growth in Gestamp’s Footprint
-3 ,3%-1 ,9%
20 ,8%
40,8%
Market Gestamp
0,0%
9,9%
6,9%
27,9%
Market Gestamp
2,1%
8,4%
Market Gestamp
NAFTA
Mercosur
Western Europe
Eastern Europe
Asia
Note: Gestamp’s growth at constant FX used for comparability with production volumes as this is a more accurate reflection of our underlying business activity. Market production volume growth is based on countries in Gestamp’s production footprint (IHS data for FY 2017 as of January 2018)
1 ,7%
11,0%
Market Gestamp
Total in Our Footprint
Market Gestamp
Market Gestamp
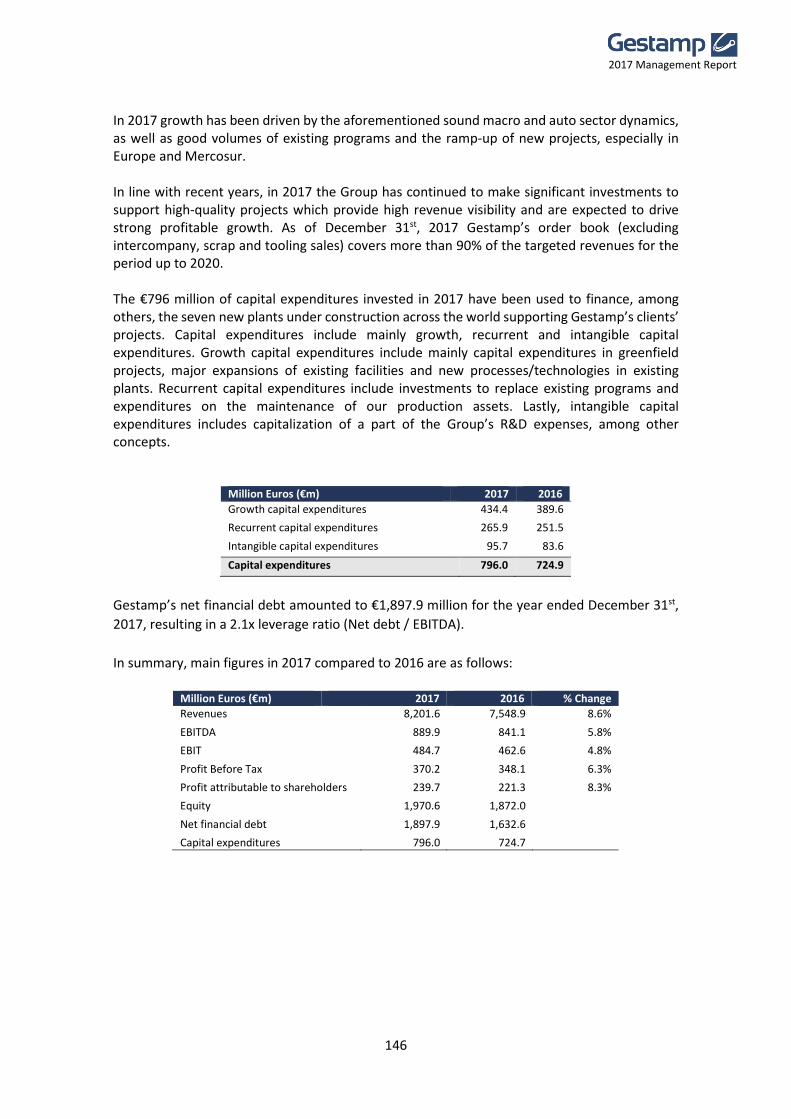
146
2017 Management Report
In 2017 growth has been driven by the aforementioned sound macro and auto sector dynamics, as well as good volumes of existing programs and the ramp-up of new projects, especially in Europe and Mercosur. In line with recent years, in 2017 the Group has continued to make significant investments to support high-quality projects which provide high revenue visibility and are expected to drive strong profitable growth. As of December 31st, 2017 Gestamp’s order book (excluding intercompany, scrap and tooling sales) covers more than 90% of the targeted revenues for the period up to 2020. The €796 million of capital expenditures invested in 2017 have been used to finance, among others, the seven new plants under construction across the world supporting Gestamp’s clients’ projects. Capital expenditures include mainly growth, recurrent and intangible capital expenditures. Growth capital expenditures include mainly capital expenditures in greenfield projects, major expansions of existing facilities and new processes/technologies in existing plants. Recurrent capital expenditures include investments to replace existing programs and expenditures on the maintenance of our production assets. Lastly, intangible capital expenditures includes capitalization of a part of the Group’s R&D expenses, among other concepts.
Million Euros (€m) 2017 2016
Growth capital expenditures 434.4 389.6
Recurrent capital expenditures 265.9 251.5
Intangible capital expenditures 95.7 83.6
Capital expenditures 796.0 724.9
Gestamp’s net financial debt amounted to €1,897.9 million for the year ended December 31st,
2017, resulting in a 2.1x leverage ratio (Net debt / EBITDA).
In summary, main figures in 2017 compared to 2016 are as follows:
Million Euros (€m) 2017 2016 % Change
Revenues 8,201.6 7,548.9 8.6%
EBITDA 889.9 841.1 5.8%
EBIT 484.7 462.6 4.8%
Profit Before Tax 370.2 348.1 6.3%
Profit attributable to shareholders 239.7 221.3 8.3%
Equity 1,970.6 1,872.0
Net financial debt 1,897.9 1,632.6
Capital expenditures 796.0 724.7

147
2017 Management Report
Revenue by geographical segment
Western Europe: Revenues in 2017 grew by €307.1 million, or 8.3% (9.9% at constant FX), to
€4,011.2 million from €3,704.1 million in 2016. The increase in revenues was mainly attributable
to a solid growth across most countries and very strong tooling revenues, offset in part by a
decline in the United Kingdom due to the depreciation of the British Pound.
Eastern Europe: During 2017, revenues grew by €183.9 million, or 21.4% (27.9% at constant FX),
to €1,043.4 million from €859.5 million in the previous year. The increase in revenues was mainly
due to continued growth in activity in almost all countries, especially in Poland as a result of the
ramp up of the new VW Crafter, in Turkey with FCA and Ford, and in Hungary with Audi. A new
subsidiary in Romania was acquired in January 2017, which has also contributed to the increase
in revenues.
Mercosur: Revenues in 2017 grew by €161.0 million, or 40.1% (40.8% at constant FX), to €562.3
million from €401.4 million in 2016. Growth, which was above-market in both Argentina and
Brazil, fueled by new program wins entering ramp-up phase, especially strong increase of market
production volumes in both countries and higher tooling revenues.
North America: During 2017, revenues decreased by €63.3 million, or -4.1% (-1.9% at constant
FX), to €1,482.8 million from €1,546.1 million during 2016. The evolution of revenues, in line
with expectations, was largely affected by the change-over in large programs in the USA and
Mexico resulting in lower volumes, the negative impact of the depreciation of the US Dollar and
lower tooling revenues both in the fourth quarter.
Asia: Revenues in 2017 increased by €64.0 million, 6.2% (8.4% at constant FX) to €1,101.8 million
from €1,037.9 million in 2016. The evolution of revenues was fueled by good performance in
India in our Pune plants and a moderate growth in China negatively impacted by the
depreciation of Chinese Yuan and lower volumes in Wuhan.
Revenue by product
Body-in-White and Chassis: During 2017 revenues increased by €371.9 million, or 6.1%, to
€6,439.3 million from €6,067.4 million in 2016. This increase was attributable primarily to an
increase of sales in Eastern Europe, Western Europe and Mercosur.
Revenues in Million Euros (€m) 2017 2016 % Change
Western Europe 4,011.2 3,704.1 8.3%
Eastern Europe 1,043.4 859.5 21.4%
Mercosur 562.3 401.3 40.1%
North America 1,482.8 1,546.1 -4.1%
Asia 1,101.8 1,037.9 6.2%
Total 8,201.6 7,548.9 8.6%
Revenues in Million Euros (€m) 2017 2016 % Change
Body-in-White and Chassis 6,439.3 6,067.4 6.1%
Mechanisms 1,015.9 902.4 12.6%
Tooling and Other 746.4 579.1 28.9%
Total 8,201.6 7,548.9 8.6%
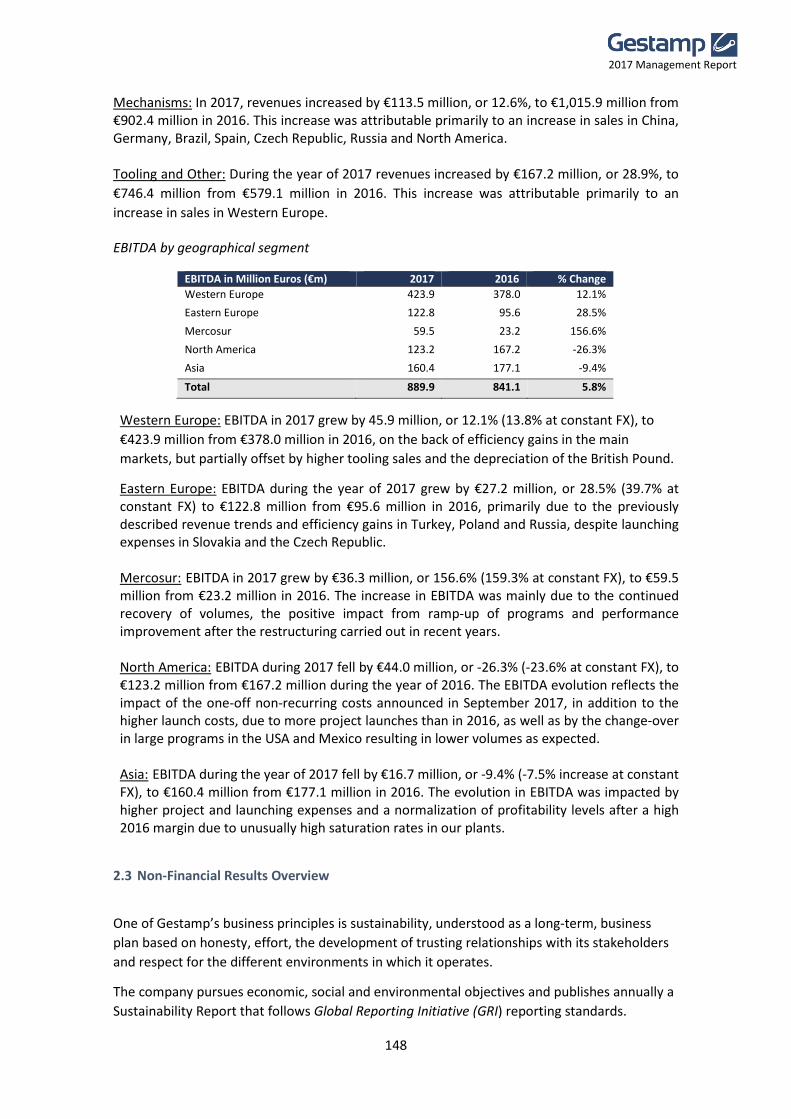
148
2017 Management Report
Mechanisms: In 2017, revenues increased by €113.5 million, or 12.6%, to €1,015.9 million from €902.4 million in 2016. This increase was attributable primarily to an increase in sales in China, Germany, Brazil, Spain, Czech Republic, Russia and North America. Tooling and Other: During the year of 2017 revenues increased by €167.2 million, or 28.9%, to
€746.4 million from €579.1 million in 2016. This increase was attributable primarily to an
increase in sales in Western Europe.
EBITDA by geographical segment
Western Europe: EBITDA in 2017 grew by 45.9 million, or 12.1% (13.8% at constant FX), to
€423.9 million from €378.0 million in 2016, on the back of efficiency gains in the main
markets, but partially offset by higher tooling sales and the depreciation of the British Pound.
Eastern Europe: EBITDA during the year of 2017 grew by €27.2 million, or 28.5% (39.7% at constant FX) to €122.8 million from €95.6 million in 2016, primarily due to the previously described revenue trends and efficiency gains in Turkey, Poland and Russia, despite launching expenses in Slovakia and the Czech Republic. Mercosur: EBITDA in 2017 grew by €36.3 million, or 156.6% (159.3% at constant FX), to €59.5 million from €23.2 million in 2016. The increase in EBITDA was mainly due to the continued recovery of volumes, the positive impact from ramp-up of programs and performance improvement after the restructuring carried out in recent years. North America: EBITDA during 2017 fell by €44.0 million, or -26.3% (-23.6% at constant FX), to €123.2 million from €167.2 million during the year of 2016. The EBITDA evolution reflects the impact of the one-off non-recurring costs announced in September 2017, in addition to the higher launch costs, due to more project launches than in 2016, as well as by the change-over in large programs in the USA and Mexico resulting in lower volumes as expected. Asia: EBITDA during the year of 2017 fell by €16.7 million, or -9.4% (-7.5% increase at constant FX), to €160.4 million from €177.1 million in 2016. The evolution in EBITDA was impacted by higher project and launching expenses and a normalization of profitability levels after a high 2016 margin due to unusually high saturation rates in our plants.
2.3 Non-Financial Results Overview
One of Gestamp’s business principles is sustainability, understood as a long-term, business
plan based on honesty, effort, the development of trusting relationships with its stakeholders
and respect for the different environments in which it operates.
The company pursues economic, social and environmental objectives and publishes annually a
Sustainability Report that follows Global Reporting Initiative (GRI) reporting standards.
EBITDA in Million Euros (€m) 2017 2016 % Change
Western Europe 423.9 378.0 12.1%
Eastern Europe 122.8 95.6 28.5%
Mercosur 59.5 23.2 156.6%
North America 123.2 167.2 -26.3%
Asia 160.4 177.1 -9.4%
Total 889.9 841.1 5.8%
149
2017 Management Report
Pursuant to Royal Decree Law 18/2017 on matters of non-financial information and diversity,
Gestamp would like to highlight the following aspects for the 2017 financial year:
2.3.1 Ethic and Human Rights
Ethics: Code of Conduct
Gestamp has had a Code of Conduct since 2011. This code is the common reference framework
for the ethical and respectful behavior of employees in all countries in which it operates. The
Code includes a number of Rules of Conduct based on the Corporate Principles and on the ten
principles of the United Nations Global Compact concerning human rights, labor and
environmental standards as well as the fight against corruption.
This Code applies to 100% of the perimeter of Gestamp, including all the organizational areas
and affecting all employees contractually linked with Group companies, or any of the
subsidiaries in which Gestamp is a majority shareholder.
The Ethics Committee is the body responsible for the implementation and interpretation of the
Code of Conduct. The Ethics Committee’s Rules establish its functions and composition, the
channels and the communication process for complaints, as well as the internal investigation
process to assess whether breaches of the Code take place.
The Compliance Office reports to the Ethics Committee and is responsible for receiving,
channeling, monitoring, properly informing and documenting the communications received
through the various means established.
In order to respond to communications regarding the Code of Conduct, whether they are
suggestions, enquiries, queries or breaches, Gestamp has an internal communications channel
([email protected]) and an external one implemented towards the end of
2016 called SpeakUp Line, which employees and people who are connected to the Group can
use.
During 2017, we continued with the rotating external audit plan, managed by independent
experts to try to verify the degree of implementation and employees’ knowledge of the Code,
and to emphasize the message on its importance to Gestamp. Specifically, this year they were
conducted at all workplaces in the United States and France, adding these to those done in
Germany, Argentina, Brazil, China, Mexico and Russia in previous years.
Within the specific rules established to cover certain aspects of the Code, the “Rules on Gifts
and Hospitality” is worthy of mention. This measure intends to prevent corruption and bribery
between employees and third parties, in both directions.
Human Rights
Gestamp considers the respect for human rights to be fundamental. The company endorses
“The Guiding Principles on Business and Human Rights” adopted by the United Nations which
promote the concepts of: Protect, Respect and Remedy.
In 2017, Gestamp carried out a study aimed at analyzing the human rights situation at all its
workplaces worldwide.
With this project, the company was able to successfully:
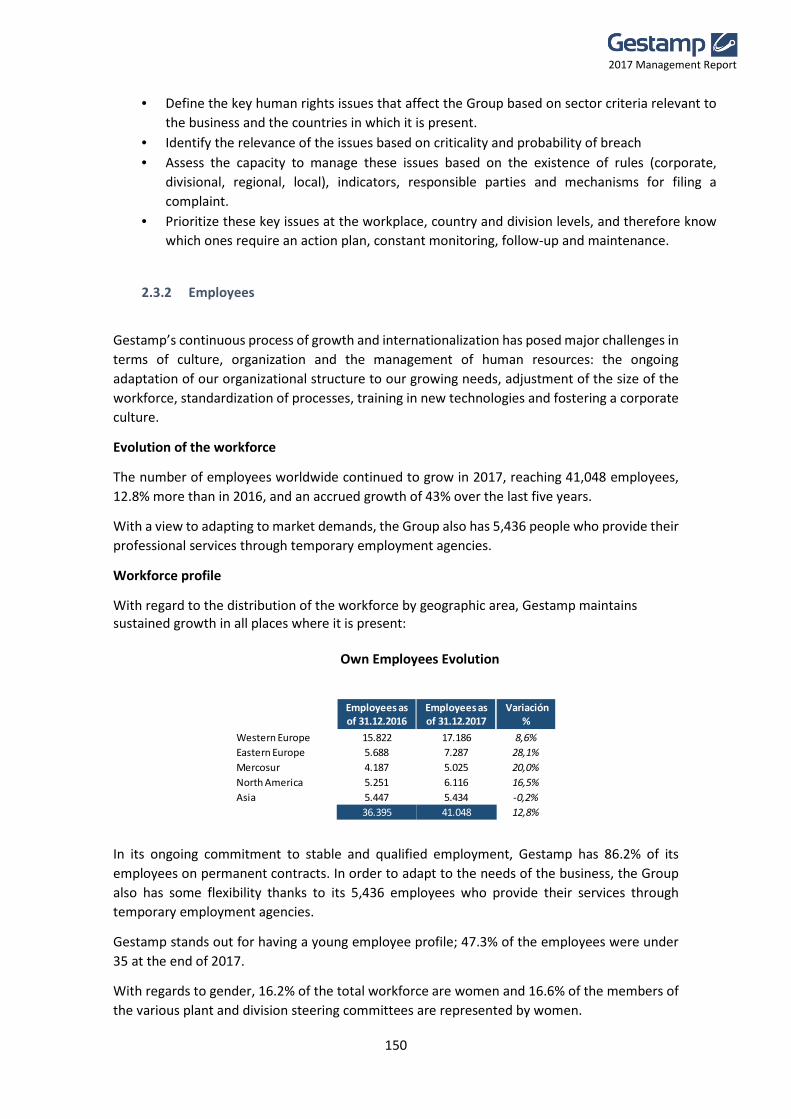
150
2017 Management Report
• Define the key human rights issues that affect the Group based on sector criteria relevant to
the business and the countries in which it is present.
• Identify the relevance of the issues based on criticality and probability of breach
• Assess the capacity to manage these issues based on the existence of rules (corporate,
divisional, regional, local), indicators, responsible parties and mechanisms for filing a
complaint.
• Prioritize these key issues at the workplace, country and division levels, and therefore know
which ones require an action plan, constant monitoring, follow-up and maintenance.
2.3.2 Employees
Gestamp’s continuous process of growth and internationalization has posed major challenges in
terms of culture, organization and the management of human resources: the ongoing
adaptation of our organizational structure to our growing needs, adjustment of the size of the
workforce, standardization of processes, training in new technologies and fostering a corporate
culture.
Evolution of the workforce
The number of employees worldwide continued to grow in 2017, reaching 41,048 employees,
12.8% more than in 2016, and an accrued growth of 43% over the last five years.
With a view to adapting to market demands, the Group also has 5,436 people who provide their
professional services through temporary employment agencies.
Workforce profile
With regard to the distribution of the workforce by geographic area, Gestamp maintains sustained growth in all places where it is present:
Own Employees Evolution
In its ongoing commitment to stable and qualified employment, Gestamp has 86.2% of its
employees on permanent contracts. In order to adapt to the needs of the business, the Group
also has some flexibility thanks to its 5,436 employees who provide their services through
temporary employment agencies.
Gestamp stands out for having a young employee profile; 47.3% of the employees were under
35 at the end of 2017.
With regards to gender, 16.2% of the total workforce are women and 16.6% of the members of
the various plant and division steering committees are represented by women.
Employees as of 31.12.2016
Employees as of 31.12.2017
Variación %
Western Europe 15.822 17.186 8,6%
Eastern Europe 5.688 7.287 28,1%
Mercosur 4.187 5.025 20,0%
North America 5.251 6.116 16,5%
Asia 5.447 5.434 -0,2% 36.395 41.048 12,8%
151
2017 Management Report
Equal opportunities and non-discrimination are part of the rules included in Gestamp’s Code of
Conduct and in addition, at the local level, each workplace has the freedom to develop specific
equality plans.
Management of labor relations
At Gestamp, the management of labor relations is carried out in accordance with the labor and
trade union legislation in effect in each geographical area.
All aspects related to the employees’ trade union, workforce and contractual aspects are
negotiated with each plant’s trade union representatives.
In geographical areas which, due to history, culture or legal requirements, it is required, there
are inter-workplace committees that complement the plant-based negotiations framework.
The company has a European Works Council that represents all the countries in its perimeter.
Gestamp places particular emphasis on issues that are essential for the Group: respect for trade
union and labor legislation, anti-discrimination policies, compliance with the Code of Conduct,
occupational health and safety and training and development in key areas to ensure the correct
implementation of the business strategy, always following the framework of fundamental labor
rights contained in the International Labor Organization (ILO) conventions.
Occupational Health and Safety
Gestamp is committed to offering its employees, and any company working at its facilities, a
safe and healthy environment. To this end, it has an ambitious occupational risk prevention
policy and a comprehensive management system called GHSS (Gestamp Health and Safety
System).
Within the general system, Gestamp has developed a tool (GHSI) that allows it to analyze equally
in all the Groups plants, 77 factors relating to:
• Traditional Indicators: Frequency Index, Serious Accidents and Severity Index.
• Working Conditions: internal traffic routes, safety conditions for different types of machinery, warehouse conditions, etc.
• Prevention Management: Management of external companies, specific training, work at heights, etc.
This is an in-house tool, designed and tailored to the characteristics of the Company’s activity,
and reaches more stringent levels than those required by international standards.
The analysis and evaluation of the factors encourages the adoption of measures for
improvement. All plants must report quarterly on the improvements made and all plants are
audited ever two years.
Despite the Group’s growth, in both business and number of people, the Company has improved
its accident rates as a reflection of its efforts in the field of prevention.
Training and Development
The need to have highly skilled professionals requires: development of talent, comprehensive
training in Gestamp’s technologies, and the international mobility of its expert teams.
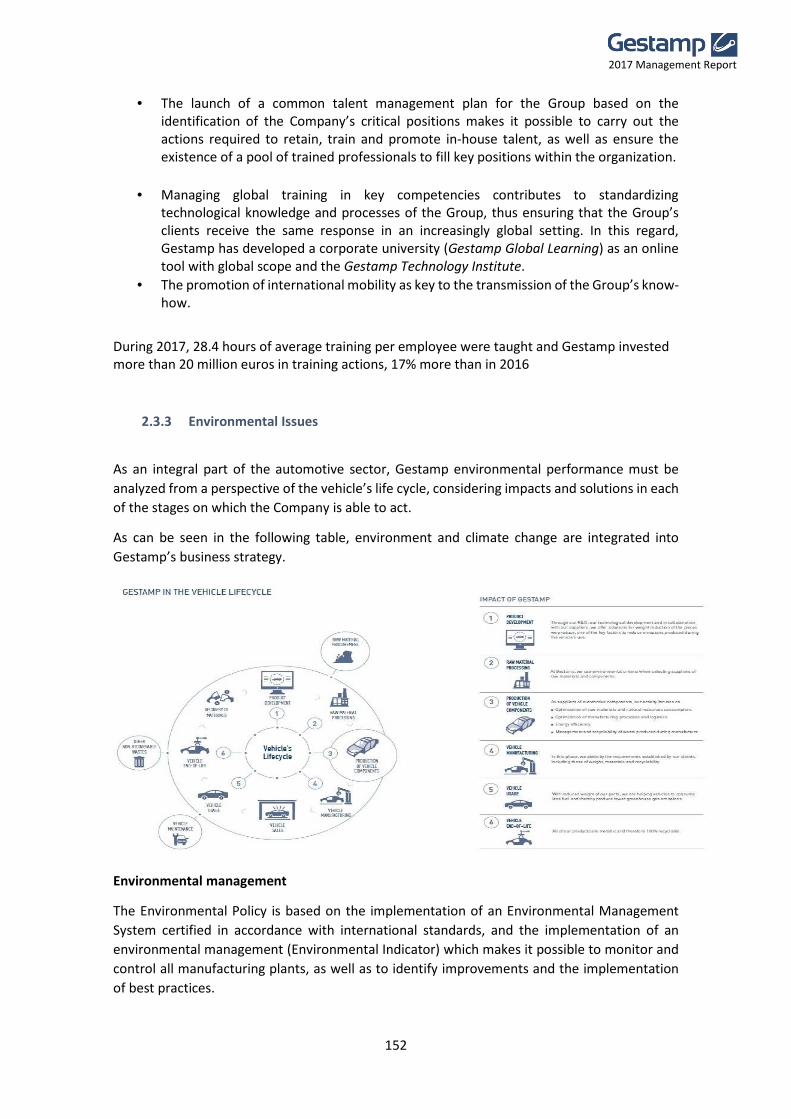
152
2017 Management Report
• The launch of a common talent management plan for the Group based on the identification of the Company’s critical positions makes it possible to carry out the actions required to retain, train and promote in-house talent, as well as ensure the existence of a pool of trained professionals to fill key positions within the organization.
• Managing global training in key competencies contributes to standardizing technological knowledge and processes of the Group, thus ensuring that the Group’s clients receive the same response in an increasingly global setting. In this regard, Gestamp has developed a corporate university (Gestamp Global Learning) as an online tool with global scope and the Gestamp Technology Institute.
• The promotion of international mobility as key to the transmission of the Group’s know-how.
During 2017, 28.4 hours of average training per employee were taught and Gestamp invested more than 20 million euros in training actions, 17% more than in 2016
2.3.3 Environmental Issues
As an integral part of the automotive sector, Gestamp environmental performance must be
analyzed from a perspective of the vehicle’s life cycle, considering impacts and solutions in each
of the stages on which the Company is able to act.
As can be seen in the following table, environment and climate change are integrated into
Gestamp’s business strategy.
Environmental management
The Environmental Policy is based on the implementation of an Environmental Management
System certified in accordance with international standards, and the implementation of an
environmental management (Environmental Indicator) which makes it possible to monitor and
control all manufacturing plants, as well as to identify improvements and the implementation
of best practices.
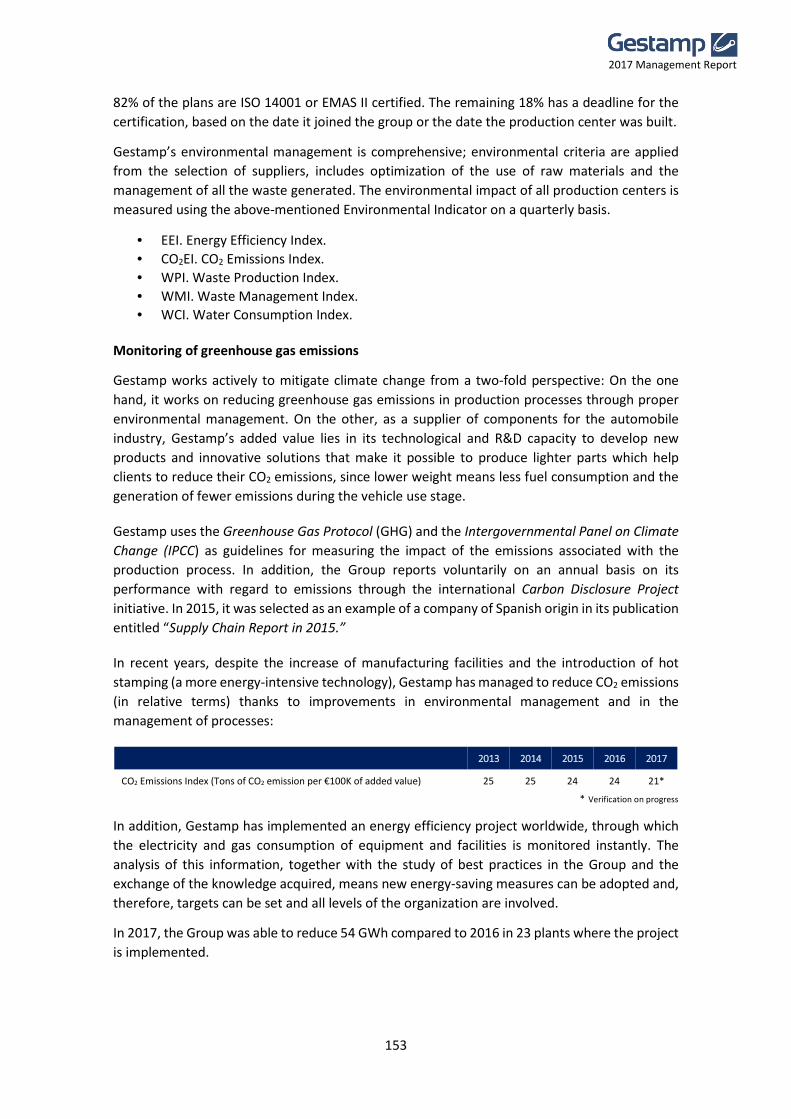
153
2017 Management Report
82% of the plans are ISO 14001 or EMAS II certified. The remaining 18% has a deadline for the
certification, based on the date it joined the group or the date the production center was built.
Gestamp’s environmental management is comprehensive; environmental criteria are applied
from the selection of suppliers, includes optimization of the use of raw materials and the
management of all the waste generated. The environmental impact of all production centers is
measured using the above-mentioned Environmental Indicator on a quarterly basis.
• EEI. Energy Efficiency Index.
• CO2EI. CO2 Emissions Index.
• WPI. Waste Production Index.
• WMI. Waste Management Index.
• WCI. Water Consumption Index. Monitoring of greenhouse gas emissions
Gestamp works actively to mitigate climate change from a two-fold perspective: On the one
hand, it works on reducing greenhouse gas emissions in production processes through proper
environmental management. On the other, as a supplier of components for the automobile
industry, Gestamp’s added value lies in its technological and R&D capacity to develop new
products and innovative solutions that make it possible to produce lighter parts which help
clients to reduce their CO2 emissions, since lower weight means less fuel consumption and the
generation of fewer emissions during the vehicle use stage.
Gestamp uses the Greenhouse Gas Protocol (GHG) and the Intergovernmental Panel on Climate
Change (IPCC) as guidelines for measuring the impact of the emissions associated with the
production process. In addition, the Group reports voluntarily on an annual basis on its
performance with regard to emissions through the international Carbon Disclosure Project
initiative. In 2015, it was selected as an example of a company of Spanish origin in its publication
entitled “Supply Chain Report in 2015.”
In recent years, despite the increase of manufacturing facilities and the introduction of hot
stamping (a more energy-intensive technology), Gestamp has managed to reduce CO2 emissions
(in relative terms) thanks to improvements in environmental management and in the
management of processes:
2013 2014 2015 2016 2017
CO2 Emissions Index (Tons of CO2 emission per €100K of added value) 25 25 24 24 21*
* Verification on progress
In addition, Gestamp has implemented an energy efficiency project worldwide, through which
the electricity and gas consumption of equipment and facilities is monitored instantly. The
analysis of this information, together with the study of best practices in the Group and the
exchange of the knowledge acquired, means new energy-saving measures can be adopted and,
therefore, targets can be set and all levels of the organization are involved.
In 2017, the Group was able to reduce 54 GWh compared to 2016 in 23 plants where the project
is implemented.

154
2017 Management Report
Waste production and management
Various types of waste are generated during our production process. In its desire to minimize waste generation and the use of natural resources, Gestamp has incorporated into its business activity all methodologies, processes, technologies and best practices related to the management, reuse and recycling of the materials it uses.
Gestamp has identified the main categories of hazardous and non-hazardous waste produced by the plants and the amounts generated are monitored quarterly using the Group’s environmental indicator.
Of all waste, 98% is not hazardous; 98% of this is scrap metal. Scrap metal is 100 % recyclable and re-enters the steel production process, helping to close the life cycle of the product following a circular economy model. With regard to hazardous waste, these are most frequently polluted water, sludge, used oils and contaminated materials (mainly oil-stained rags and gloves).
As for the destination of the waste generated in our plants, it depends on the type of waste, the location of the plant and the legislation of the country and local authorized managers are used to handle it. Furthermore, waste reduction targets are set annually as part of the environmental plans.
Water
Water consumption is not a significant environmental aspect at Gestamp but, as it is an essential natural resource, its use and management is monitored.
In general, water consumption at Gestamp’s production plants is for sanitary use. Only plants that have surface treatment processes or welding facilities and machines that require cooling consume water for industrial use. In all cases, these are closed-circuit systems and so the water is reused for long periods of time.
2.3.4 Society
Gestamp believes that its commitment to sustainability is not limited solely to its operations,
but that it is part of a value chain completed with the activity and the performance of its
suppliers, without which it could not meet the requirements of its clients. To the extent that
Gestamp empowers them and supports them locally, the Company contributes to the
development of communities, their industries and the overall economy because of its
multiplying effect in terms of wealth and maintaining employment.
In addition, Gestamp contributes to the training and technical instruction of the local population
as a result of its collaboration with universities, business schools and vocational training centers.
In 2017, Gestamp gave opportunities to 649 youths, between internship and apprenticeship
programs.
Another area in which the Group contributes to society is through its social activities. Since 2013,
Gestamp has been using the LBG (London Benchmarking Group) methodology with the aim of
identifying, classifying and assessing the not-for-profit contributions made by each of its work
centers in the communities they operate in.
155
2017 Management Report
In addition, Gestamp’s social activities are in line with the United Nations Sustainable
Development Goals on which it is going to focus its social strategy in the coming years.
2.3.5 Corporate Governance
Rules
Gestamp’s Corporate Governance is currently based on the following rules, all of which are
available on our website:
• Company Bylaws
• Regulations of the General Shareholders’ Meeting
• Regulations of the Board of Directors, which include rules for the Audit Committee and
the Nomination and Compensation Committee
• Code of Conduct
• Internal code of conduct in Securities Markets
• Certain corporate policies
The Corporate Governance rules were reviewed by the relevant authority upon the Initial Public
Offering in April 2017 and since then are reviewed and updated from time to time. The contents
are inspired and based on our commitment to the best practices in good corporate governance.
Governing bodies
Governing bodies that carry out differentiated strategy and oversight functions, and leadership
and management functions:
• The General Shareholders’ Meeting: this is the main way shareholders take part in Gestamp
and its highest decision-making body. Through this body, its shareholders deliberate and
decide through voting, subject to the majorities applicable by law or the by-laws, on the
matters within their remit.
• The Board of Directors: this focuses its activity on the definition, oversight and follow-up of
the policies, strategies and general guidelines that the Company and the companies of its
consolidated group must follow. The Board of Directors comprises 12 members, of whom 5
are independent directors, 3 are proprietary, 2 are executive, and 2 are other external
directors.
• Committees of the Board of Directors: to carry out its work, the Board of Directors has the
support of specialized internal committees. In this regard, the Board of Directors has set up
an Audit Committee and a Nomination and Compensation Committee, both comprising non-
executive directors and chaired by an independent director.
• The Management Committee: this is responsible for the Group’s organization and strategic
coordination, by disseminating, implementing and monitoring the business strategy and
guidelines.

156
2017 Management Report
Diversity in the Board of Directors
The composition and profiles of the members of Gestamp’s Board of Directors are available on
the Company’s website.
The selection and nomination of members is carried out according to Gestamp’s Director
Selection Policy as well as the Guidelines on the knowledge, skills and experiences of the Board
of Directors. Both documents include criteria for promoting diversity in governance bodies. The
Nomination and Compensation Committee is the body that, on an annual basis, shall conduct
an assessment in which it explicitly takes into account the diversity of the representation of the
members on the Board.
3. DEBT AND LIQUIDITY Gestamp has maintained a solid financial position during 2017. As of December 31, 2017, net
financial debt amounted to €1,898.9 million resulting in a 2.13x leverage ratio (Net Debt /
EBITDA), compared to 1.94x as of December 31, 2016.
Thousand Euros 2017 2016
Interest bearing loans and borrowings 2,710,880 1,967,599
Financial leasing 32,672 33,574
Borrowings from group companies 59,294 70,162
Other financial debt 34,183 34,991
Gross debt 2,837,029 2,106,326
Net financial debt 1,897,895 1,632,635
EBITDA 889,877 841,150
Leverage ratio (Net debt / EBITDA) 2.13x 1.94x
Our long-term indebtedness primarily consists of €479.0 million in senior secured notes; €852.5 million in long-term portion of a funded senior secured amortizing Term Loan (part of the Senior Financing Agreement, or “SFA”, originally syndicated on April 19, 2013), €160.0 million in long term debt with the European Investment Bank and €675.4 million of aggregate principal amount in other long-term bilateral financing. On May 11, 2016 we issued € 500 million of new senior secured notes due May 15, 2023 and on
May 20, 2016 we signed an amendment and restatement of our SFA according to which, among
other things, we agreed an increase in the availability of the Term Loan component of the SFA
by € 340 million and extended the maturity of the Term Loans and the RCF to May 31, 2021. On
June 6 and June 20, 2016 respectively we fully redeemed the remaining outstanding Euro and
USD senior secured notes due May 2020 with proceeds from the aforementioned new senior
secured notes and the increase in the SFA. On July 25, 2017 we signed another amendment of
the SFA, extending its maturity to July 15, 2022.

157
2017 Management Report
Thousand Euros 2017 2016
Cash and cash equivalents 860,238 430,463
Current debt securities 5,376 338
Revolving credit facilities 280,000 280,000
Undrawn credit facilities 642,962 457,287
Total Liquidity 1,788,576 1,168,088
Gestamp´s main source of liquidity is its operating cash flow. Net cash flows from operating activities were €683.7 million in 2017. In addition, as part of its Senior Facilities, Gestamp has an undrawn revolving credit facility amounting to €280.0 million with maturity in 2021, as well as €676.9 million in credit lines, of which €34.0 million were drawn as of December 31, 2017. These credit lines are generally renewed each year, do not have any security and have customary covenants.
4. MAIN RISKS AND UNCERTAINTIES Risk Management is an essential part of our corporate culture and principles. Gestamp has an
Integral Risk Management System (IRMS) in place. It is defined as a process driven by the Board
of Directors and Senior Management, which aim is to develop the organization’s capacity to
properly detect measure, control and mitigate the significant risks; but, as an integrated system,
it is the responsibility of each and every member of the Group. It helps us to accomplish our
general goals, enhance sustainability and increase the confidence of investors, consumers and
society in general.
This IRMS, which Gestamp continued to develop and evolve in 2017, is based on the COSO ERM
model (a detailed, systematic approach that allows us to identify events, assess, prioritize and
respond to risks related to the accomplishment of our business goals), on the best practices
defined in the Good Governance Code of Listed Companies and on the Technical Guide 3/2017
on Audit Committees at Public Interest Entities.
To facilitate and promote an effective, integrated and uniform management, the Group has
established the Integrated Risk Management System Policy (henceforth, the “IRMS Policy”),
which is applicable to all the companies belonging to the Group, and its scope includes all
activities, processes, projects and lines of business, as well as all the geographic areas in which
the Group operates.
The IRMS Policy was approved by the Gestamp Board of Directors and establishes the main
principles, guidelines and general framework for systematically and uniformly detecting
financial and non-financial risks (including environmental, social, labor-related and human
rights-related risks, as well as those related to the fight against corruption and bribery),
preventing them and mitigating any existing or potential negative effects; thereof, keeping them
within the risk levels (tolerance) accepted by Gestamp in line with the due diligence procedures
set forth in Royal Decree-Law 18/2017.
While the IRMS is a process that affects and involves all the Group’s employees, the parties
that are in charge of ensuring that it functions smoothly and their main duties are as follows:
• The Specific Risk Owners, in charge of identifying, assessing and monitoring risks that pose a threat to achievement of their goals.

158
2017 Management Report
• The Risk Committees, which ensure that the risks are kept aligned with the accepted risk appetite and inform the Audit Committee.
• The Board of Directors and the Audit Committee, in their approval, monitoring and supervision of the IRMS.
• The Internal Audit and Risk Management Function, which provides support to the Audit Committee and coordinates the risk identification and assessment processes, in addition to coordinating the Risk Committees.
Gestamp is exposed to diverse risks inherent to the countries and markets in which it operates,
which could jeopardize the accomplishment of its goals and the successful implementation of
its strategies. Our Risk Map, which was updated in 2017, constitutes a management tool that
enables us to identify and contextualize potential risks, fostering and facilitating decision-making
on the mitigation actions to be taken. Senior managers representing all the Divisions, Business
Units and Corporate Functions in the Group were involved in the identification and assessment
process. In this process, the following risks were considered, for which the organization has
defined measures, controls and supervision plans:
Personal safety and health risk, due to the characteristics of the activities performed at our plants
Business concentrated in few clients that each contribute a high percentage of the business
Stoppage of our clients’ activities due to diverse internal and external factors, such as:
Supply-chain issues due to incidents with suppliers
Internal problems: labor conflicts, prolonged breakdowns, serious accidents
Other unexpected factors (such as weather-related disasters, for example)
Deviations in the profitability of projects, which could potentially occur during the launch and in the subsequent production phase
Incidents related to the quality of our products, with potential both cost and reputational repercussions
Difficulty in hiring or replacing key staff members, in terms of both managers holding strategic positions and highly qualified employees
Complexity of decisions related to technological changes and adoption of the technology, materials and processes that are appropriate and necessary in order to maintain our competitive advantages
Risks related to fluctuations in financial markets, mainly exchange rates, interest rates and commodities
Risks related to the legislation and regulations to which the Group is subject and potential amendments that could be made to them
Environmental risks: as an integral part of the automotive industry, we believe our environmental impact must be analyzed from the perspective of the vehicle life cycle, moving beyond the direct impact created in the mere manufacturing process
Political and economic instability in the countries in which Gestamp operates
Operational Strategic Financial Compliance Internal External
O
S
O
S
O
O
S
F
C
O
S
O S F C
159
2017 Management Report
In 2017, a number of risks inherent to the Group’s activities have arisen: the IRMS, along with
Gestamp’s policies and risk control and management systems that develop it, have enabled us
to respond adequately and proactively to them and establish, where needed, appropriate action
plans. In this regard, there are two different levels of response to risks:
• General mechanisms for responding to risk: Specific Risk Owners, Risk Committees, the Board of Directors, the Audit Committee and the Internal Audit and Risk Management Division.
• Additionally, Gestamp has various units that perform analyses, continuous monitoring and provide response in specialized risk management fields, including internal control over financial reporting, compliance with regulations, corporate social responsibility, quality, operational control, corporate safety, information systems, occupational and environmental risk prevention, tax and insurance-related risks, to name a few. These units have been integrated into the Group’s IRMS.
• Individual control, management and supervision mechanisms implemented at operational level, which function constantly on a daily basis, and are performed by each and every member of the Group; they are ingrained into the Group's systems and processes, and ensure that the operating activities are ultimately consistent with Gestamp’s goals and targets.
5. SUBSEQUENT EVENTS There have been no material subsequent events as of 31st December, 2017.
6. FORESEABLE EVOLUTION OF THE COMPANY
For 2018, global economic growth is expected to confirm the pace gathered in 2017, which according to International Monetary Fund’s January 2018 World Economic Outlook will stand at approximately 3.9%. The higher growth is expected to bring inflationary pressure, as first signs of price and wage increases appear, particularly in the United States. With an improvement in economic activity, Gestamp expects a good performance in the automotive sector globally. According to IHS January 2018 data, global light vehicle production is expected to increase by 1.9% in 2018. In a favorable environment, and on the back of the strong investments made in recent years in projects that will ramp up this year, Gestamp expects a positive performance of its operations in 2018. In line with the last few years, the Group expects solid revenue and income growth, well above that of the market, at constant FX. Gestamp will continue to focus its efforts on improving the efficiency of its processes and adequate management of the large number of projects the Group is working on.
7. R&D ACTIVITIES Through innovation, Gestamp seeks to improve fundamental characteristics of a vehicle such as weight, safety, strength, durability and stiffness, by monitoring complete crash performance, deformation and energy absorption, while providing additional comfort. As it continues to invest in R&D, Gestamp develops proprietary technology innovations while helping our OEM
160
2017 Management Report
customers to improve vehicle safety, meet emissions targets and optimize costs, which together ultimately allows us to be a key supplier for OEMs globally. As a result of Gestamp’s long standing and strategic relationship with OEM’s, Gestamp has over 250 co-development programs in place with its clients in BIW, chassis and mechanisms. Working closely with our customers enables Gestamp to strengthen its reputation as a technological leader in the industry. Furthermore, Gestamp is at the forefront of developing technological capabilities, manufacturing processes and new materials for use in our product portfolio. To this end, Gestamp seeks ways to apply new materials with a consistent quality, to establish manufacturing processes which are effective and flexible throughout the production chain, and all at a reasonable cost. The close work between Gestamp’s R&D department and its customers in incorporating these new materials and processes in the design of the product has allowed the Group to achieve in 2017 important businesses awards both in BiW as well as in Chassis in the field of electric vehicles. Gestamp R&D has developed in 2017 an innovative concept of Battery Box, a new product within electric vehicles in which Gestamp has collaborated directly with the engineering departments of the OEM’s. Sensors in vehicles are increasingly becoming the technological standard and Gestamp has been able to develop solutions with strong competitive advantages in terms of safety and comfort for doors and hoods. These developments are in line with the new regulations on pedestrian security that are being implemented in more countries every year. During 2017, Gestamp announced in November the opening of a new R&D center in Asia, located in Shanghai (China). The main objective of this new Gestamp facility is to strengthen its collaboration with both with international as well as with local OEMs in China. The aim is to co-develop on site together with them in order to improve manufacturing processes, products and costs. Additionally, during 2017 in Gestamp’s continuous effort to improve our R&D facilities, two other R&D centers were announced in Asia and NAFTA which replace already existing facilities. In this sense, a new R&D center was inaugurated in Auburn Hills, Michigan, in May. This facility houses robotic prototype assembly cells, a laser cell, a durability performance test lab and complementary metallurgical and metrology labs. Designed bearing its customers in mind, the Auburn Hills R&D center ensures faster response and access to technical information required to meet automotive customers’ program needs. Furthermore, in June, a new R&D center was opened in Japan to improve the company’s previous R&D capabilities in the country. Located in downtown Tokyo, the center is equipped with simulation resources, including virtual crash tests and advanced simulation of hot stamping processes. This offers Gestamp comprehensive vehicle development capabilities for Chassis and Body in White (bodywork) with top-notch standards within the global R&D network. As of December 31, 2017, Gestamp had more than 1,500 R&D professionals, spread over its 13 R&D centers as well as at manufacturing sites. These R&D centers are located in 9 countries: Spain, Germany, France, UK, Sweden, USA, Brazil, China and Japan. Hot stamping
Gestamp is one of the pioneers and leaders in the hot stamping manufacturing process, one of the most advanced technologies for reducing the weight of a vehicle’s body structure and improving passenger safety in case of collision.
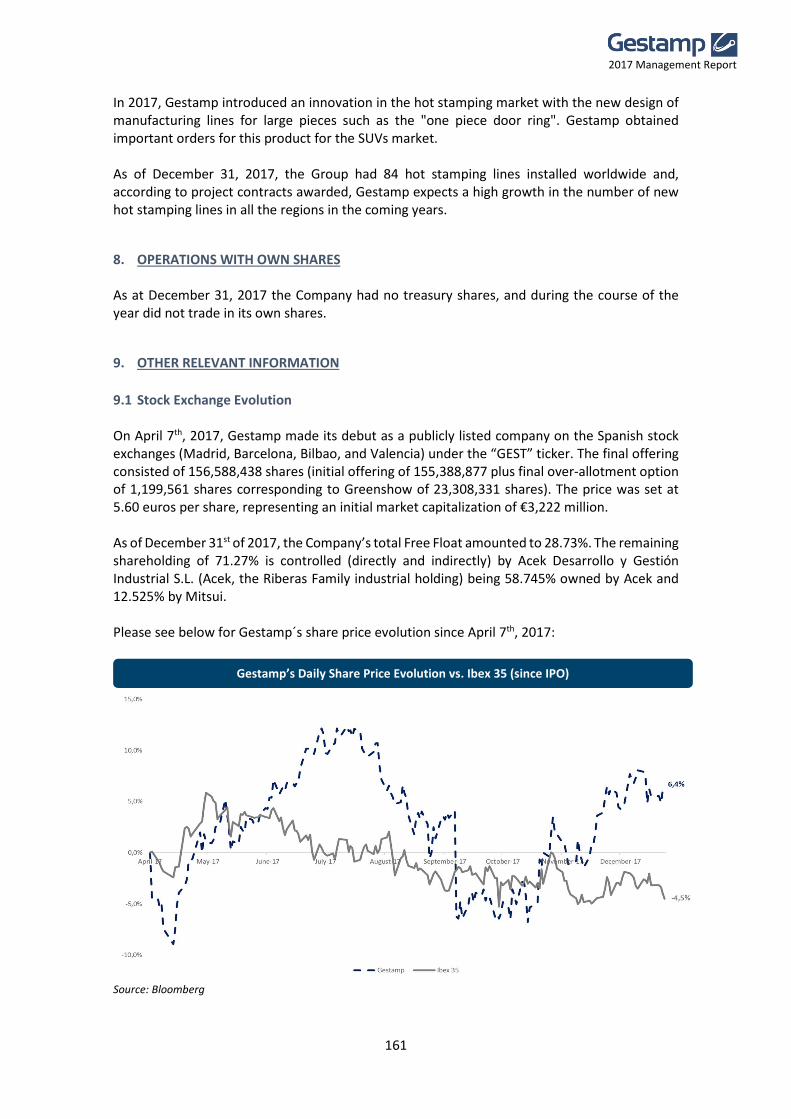
161
2017 Management Report
In 2017, Gestamp introduced an innovation in the hot stamping market with the new design of manufacturing lines for large pieces such as the "one piece door ring". Gestamp obtained important orders for this product for the SUVs market. As of December 31, 2017, the Group had 84 hot stamping lines installed worldwide and, according to project contracts awarded, Gestamp expects a high growth in the number of new hot stamping lines in all the regions in the coming years.
8. OPERATIONS WITH OWN SHARES
As at December 31, 2017 the Company had no treasury shares, and during the course of the year did not trade in its own shares.
9. OTHER RELEVANT INFORMATION
9.1 Stock Exchange Evolution On April 7th, 2017, Gestamp made its debut as a publicly listed company on the Spanish stock exchanges (Madrid, Barcelona, Bilbao, and Valencia) under the “GEST” ticker. The final offering consisted of 156,588,438 shares (initial offering of 155,388,877 plus final over-allotment option of 1,199,561 shares corresponding to Greenshow of 23,308,331 shares). The price was set at 5.60 euros per share, representing an initial market capitalization of €3,222 million. As of December 31st of 2017, the Company’s total Free Float amounted to 28.73%. The remaining shareholding of 71.27% is controlled (directly and indirectly) by Acek Desarrollo y Gestión Industrial S.L. (Acek, the Riberas Family industrial holding) being 58.745% owned by Acek and 12.525% by Mitsui. Please see below for Gestamp´s share price evolution since April 7th, 2017:
Source: Bloomberg
Gestamp’s Daily Share Price Evolution vs. Ibex 35 (since IPO)
162
2017 Management Report
Gestamp’s shares increased by +6.4% since IPO, implying a market capitalization of €3,428 million. Total volume traded during 2017 was 275m shares or €1,550.5m. The shares hit a high for the year on July 17th 2017 (€6.29) and a low on April 18th 2017 (€5.10). Since IPO, our average share price has been €5.75. The Company’s shares were included in the IBEX Medium Cap index in December 2017. The Group reported earnings per share of €0.42 in 2017. The most relevant information regarding the stock’s evolution in 2017 is shown in the table below:
(€) 2017 2016*
Total Number of Shares 575.514.360 -
Share Price 5,96 -
Market Cap. (in Thousands) 3.428 -
Maximum Price in 2017 6,29 -
Date of Max. Price 17/07/2017 -
Minimum Price in 2017 5,10 -
Date of Min. Price 18/04/2017 -
Average Price in 2017 5,75 -
Total Volume (in Shares) 231.549.084 -
Average of Daily Volume Traded (in Shares) 1.244.888 -
Total Turnover (in Millions) 1.321,08 -
Average of Turnover Traded (in Thousands) 7.102,58 -
* The Company was listed on April 7th, 2017. There is no information regarding 2016.
Data as of December 31st, 2017. Source: Bloomberg & BME (Bolsa y Mercados Españoles)
9.2 Dividend policy
In 2017 the Company maintained its policy to distribute dividends corresponding to 30%
Consolidated Profit Attributable to Equity holders of the Company.
9.3 Credit Rating On May 2013, the Group completed an issuance of bonds through its subsidiary Gestamp Funding Luxembourg, S.A., a company belonging to the Western Europe segment. This issuance was carried out in two tranches, one amounting to 500 million euros at an interest rate of 5.875%, and the other amounting to 350 million dollars with a 5.625% interest rate.
On May 11th, 2016 the Group issued a new bond, through the subsidiary Gestamp Funding Luxembourg, S.A. for €500 million with an interest rate of 3.5%. The issuance was used to fully refinance the May 2013 Euro bond and accrued interest. The US dollar bonds issued in May 2013 were fully refinanced on June 17th, 2016 with the tranche A2 of the new syndicated loan granted on May 20th, 2016. The maturity date of the new bonds is May 15th, 2023.
163
2017 Management Report
As of December 31st, 2017 Gestamp’s corporate credit rating was “BB /stable outlook” by Standard & Poor’s and “Ba2/ stable outlook” by Moody’s. These ratings were confirmed on June 16th, 2017 by Standard & Poor’s and on September 13th, 2017 by Moody’s.
Corporate Credit Ratings Current Rating Outlook Last Review
Standard & Poor’s BB Stable 03/05/2016
Moody’s Ba2 Stable 28/04/2016
Senior Secured Notes Current Rating Outlook Last Review
Standard & Poor’s BB+ Stable 29/01/2016
Moody’s Ba3 Stable 28/04/2016
9.4 Average period for payment to suppliers The internal processes and payment policy terms of the Spanish companies of the Group comply with the legal provision of the Law 15/2010, which establishes actions against late payment in commercial transactions. As a result, the contractual conditions in the year 2017 with commercial suppliers for parts manufactured in Spain have included periods of payment equal to or less than 60 days in 2017 and in 2016, according to the second transitory legal provision of the Law. (Refer to Note 34). For efficiency reasons and in line with common standards, the Spanish subsidiaries of the Group have in place a schedule for payments to suppliers, under which payments are made on fixed days, and twice a month in the case of the larger entities.
In general terms, during the fiscal periods 2017 and 2016, payments, for contracts agreed after the entry into force the Law 15/2010 made by Spanish entities to suppliers have not exceeded the legal limits of payment terms. Payments to Spanish suppliers which have exceeded the legal deadline for years 2017 and 2016 have been negligible in quantitative terms and are derived from circumstances or incidents beyond the established payment policy, which primarily include the closing of agreements with suppliers at the delivery of goods or provision of services or handling specific processes.
Additionally, as of December 31, 2017 and 2016 there were no outstanding amounts to suppliers located in Spanish territory that exceeded the legal term of payment.

STATEMENT OF RESPONSIBILITY FOR THE ANNUAL FINANCIAL INFORMATION
2017
The Directors of the Board of Directors of GESTAMP AUTOMOCIÓN, S.A. state that, to the best of their knowledge, the Individual Annual Financial Statements of GESTAMP AUTOMOCIÓN, S.A. and the Consolidated Annual Financial Statements of GESTAMP AUTOMOCIÓN, S.A. and its subsidiaries for Fiscal Year 2017, drawn up by the Board of Directors at its meeting of February 26, 2018 and prepared in accordance with applicable accounting standards, present a fair view of the assets, financial condition and results of operations of GESTAMP AUTOMOCIÓN, S.A. and of the companies included in its scope of consolidation, taken as a whole, and that the Individual and Consolidated Management Reports contain a true assessment of the corporate performance and results and the position of GESTAMP AUTOMOCIÓN, S.A. and of the companies included in its scope of consolidation taken as a whole, as well as a description of the principal risks and uncertainties facing them.
Madrid, February 26, 2018.
_____________________________________ Mr. Francisco José Riberas Mera (Executive Chairman)
________________________________________ Mr. Francisco López Peña (CEO)
_______________________________________ Mr. Juan María Riberas Mera (Director)
_____________________________________ Mr. Noboru Katsu (Director)
________________________________________ Mr. Tomofumi Osaki (Director)
________________________________________ Mr. Alberto Rodríguez-Fraile Díaz (Director)
________________________________________ Mr. Javier Rodríguez Pellitero (Director)
________________________________________ Mr. Pedro Sainz de Baranda Riva (Director)
______________________________________ Mrs. Ana García Fau (Director)
________________________________________ Mr. César Cernuda Rego (Director)
_______________________________________ Mr. Gonzalo Urquijo Fernández de Araoz (Director)
_______________________________________ Mr. Geert Maurice Van Poelvoorde (Director)
The Secretary of the Board of Directors states for the record that the Director Mr. Geert Maurice van Poelvoorde does not set his signature on this document because he is absent due to unavoidable professional commitments and that he have given a proxy and delegated his voting powers to the Director Mr. D. Juan María Riberas Mera, in connection with the matters set forth in the Agenda for the meeting the Board of Directors of 26 February 2018 (which includes the approval of the individual and consolidated Annual Financial Statements and of the individual and consolidated Management Reports for Fiscal Year 2017).
Secretary
__________________________
Mr. David Vázquez Pascual
GESTAMP AUTOMOCIÓN, S.A. Y SUBSIDIARIES The previous Consolidated Annual Financial Statements for the fiscal year 2017 of GESTAMP AUTOMOCIÓN, S.A. and subsidiaries included in preceding pages 1 to 139 inclusive, and the Consolidated Management Report for the year 2017 included in the preceding pages 140 to 163, both inclusive of the accompanying Annual Corporate Governance Report included in the preceding pages 1 to 90, have been sign off by the members of the Board of Directors at their meeting on February 26, 2018. _________________________________ _________________________________ Don Francisco José Riberas Mera Don Juan María Riberas Mera President Vicepresident _________________________________ _________________________________ Don Francisco López Peña Don Noboru Katsu Vocal Vocal _________________________________ _________________________________ Don Tomofumi Osaki Don Alberto Rodríguez Fraile Díaz Vocal Vocal _________________________________ _________________________________ Don Javier Rodríguez Pellitero Don Pedro Sainz de Baranda Riva Vocal Vocal
GESTAMP AUTOMOCIÓN, S.A. Y SUBSIDIARIES _________________________________ _________________________________ Doña Ana García Fau Don César Cernuda Rego Vocal Vocal _________________________________ _________________________________ Don Gonzalo Urquijo Fernández de Araoz Don Geert Maurice Van Poelvoorde Vocal Vocal