· 3 employees in mexico, brazil, and canada are much happier about their work/life balance...
TRANSCRIPT

THE INTERNATIONAL SOCIETY FOR OPTICS AND PHOTONICS
www.SPIECareerCenter.org

Introduction The optics and photonics community includes workers and students on every continent, engaged in disciplines ranging from aerospace to semiconductor to biotechnology. The Optics and Photonics Global Salary Report provides the community with up-to-date information on pay, job satisfaction, and other important workplace topics. A key goal of this report is to provide a reference for employees, students, and managers interested in understanding compensation across the career landscape: How does my pay compare with that of my colleagues? What is a typical mid-career salary in my country? What can I expect to earn in industry versus academia?
SPIE delivers the report each year, free of charge, as part of its mission as a not-for-profit educational society supporting the science and application of light. The report builds on data from over 7,000 individuals in 102 countries1 who shared career information in a short online survey. This is the eighth annual survey and report, the largest such study in the optics and photonics community.
Unless otherwise noted, all results are based on full-time workers. For a complete list of participant countries and other details on survey methodology, please see Methodology and Endnotes on page 25.
KEY FINDINGS: • The median salary for full-time employees is $71,748, up over ten percent from $65,000 last year.2
This increase likely reflects the growing global economy and tight labor markets for the highly-skilled workers in our community.
• Salaries paid in Chinese yuan are up 25% versus last year, and have increased an impressive 67% since 2011. Euro salaries were flat, while earnings are up three percent in U.S. dollars, up one percent in Japanese yen, and down two percent in British pounds.
• Early-career pay for PhDs is highest in Switzerland, where employees with 1 to 2 years of experience earn a median salary of $84,082. The United States, Germany, and Canada follow, with respective salaries of $83,500, $66,965, and $58,225.
• The highest-paid discipline is aerospace, with a median income of $112,764. Aerospace has held the top spot for all eight years that the survey has been conducted.
• Median salaries are 28% higher overall for men than for women, though gaps in median pay are smaller during early career stages. 71% of women feel that they are paid fairly, versus 79% of men.
• Survey respondents are highly satisfied with their jobs overall: 96% enjoy their work, 95% find their work meaningful, and 93% feel that their work is respected by their peers.
• 31% of workers in higher-income Asian countries work 50 or more hours per week versus 22% in North America and 14% in higher-income European countries.
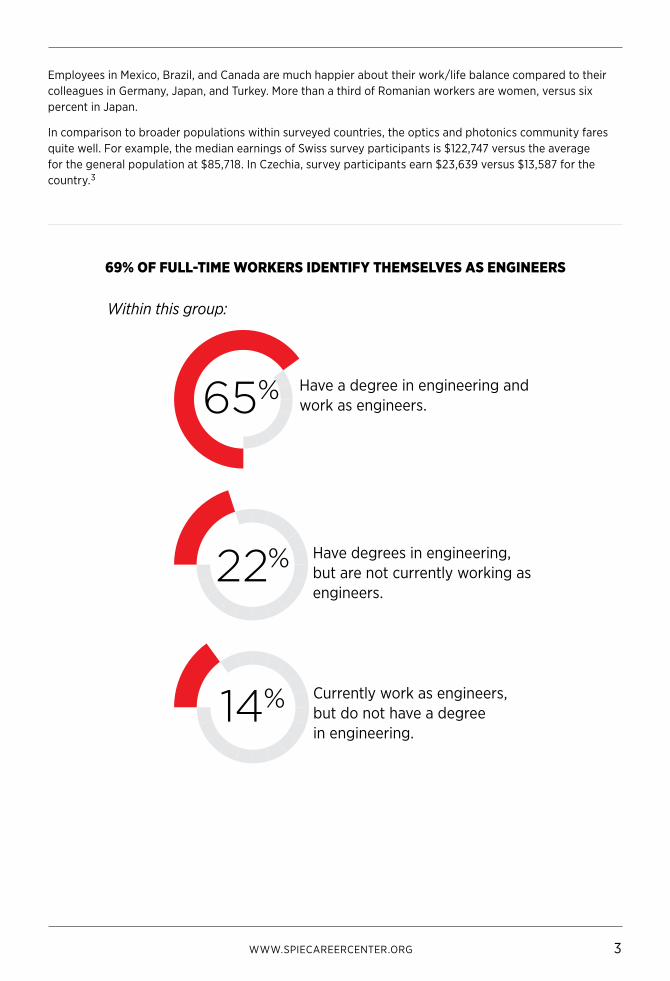
• Most full-time workers (69%) identify as engineers. Within this group, 65% have engineering degrees and are working as engineers, 22% have engineering degrees but are not currently working as engineers, and 14% work as engineers without having engineering degrees.
• Startups account for just over 16% of workers at for-profit organizations. These workers earn median salaries of $80,787, versus $96,000 for those at traditional companies.
• Almost two thirds of student respondents (61%) are working towards a PhD, followed by 25% pursuing master’s degrees, and 11% seeking a bachelor’s degree.
2018 OPTICS & PHOTONICS GLOBAL SALARY SURVEY

DISTRIBUTION OF FULL-TIME SALARIES
DATA OVERVIEW
500
400
300
200
100
0.0$1,000,000$100,000$10,000$1,000
Log scale
Full-time Salary Summary Statistics Response Demographics
Mean = $89,843
Median = $71,748
Percentiles:
• 5th = $9,219
• 25th = $39,863
• 75th = $117,189
• 95th = $200,000
• 99th = $350,000
n = 4919
7,035 Valid responses
4,919 Full-time employees
206 Part-time employees
146 Unemployed
97 Retired
5,437 Men
1,289 Women
1,667 Students
WWW.SPIECAREERCENTER.ORG 1

2 2018 OPTICS & PHOTONICS GLOBAL SALARY SURVEY
Country OverviewThe countries in the survey represent a broad range of incomes, job satisfaction, and gender balance. Workers in Switzerland, the United States, and Israel enjoy the highest median salaries. Within these high-earning countries, the United States has the highest percentage of women in the workforce, and the highest level of satisfaction with work/life balance.
Country Median Salary “I have an excellent work/life balance” Women Workers
Switzerland (n=69) $122,747 67% 12%
United States (n=1826) $120,000 75% 17%
Israel (n=63) $90,457 66% 13%
Germany (n=318) $82,510 61% 12%
Australia (n=43) $81,608 68% 26%
Japan (n=225) $75,132 57% 6%
Sweden (n=37) $74,440 77% 16%
Canada (n=128) $72,582 79% 14%
South Korea (n=78) $72,411 74% 8%
Netherlands (n=62) $71,748 74% 7%
Belgium (n=37) $60,822 73% 14%
United Kingdom (n=189) $59,454 63% 11%
France (n=177) $53,811 71% 20%
Spain (n=107) $53,811 63% 26%
Singapore (n=40) $53,239 65% 13%
Brazil (n=40) $51,201 79% 18%
Italy (n=161) $44,245 61% 21%
Taiwan (n=71) $43,241 77% 13%
Lithuania (n=38) $29,895 62% 19%
Mexico (n=45) $26,974 83% 21%
Poland (n=54) $25,063 78% 23%
Turkey (n=47) $23,676 52% 11%
Czechia (n=44) $23,639 64% 18%
Peoples Republic of China (n=321) $23,048 72% 19%
Romania (n=25) $21,524 65% 36%
India (n=114) $15,689 78% 18%
Russia (n=146) $13,146 64% 20%
Table includes all countries with a sample size of 25 or more full-time workers. For work/life balance, the percentage is the sum of respondents who agree or strongly agree with the statement “I have an excellent work/life balance.”
MEDIAN SALARY, WORK/LIFE BALANCE, AND GENDER, BY COUNTRY
WWW.SPIECAREERCENTER.ORG 3
Employees in Mexico, Brazil, and Canada are much happier about their work/life balance compared to their colleagues in Germany, Japan, and Turkey. More than a third of Romanian workers are women, versus six percent in Japan.
In comparison to broader populations within surveyed countries, the optics and photonics community fares quite well. For example, the median earnings of Swiss survey participants is $122,747 versus the average for the general population at $85,718. In Czechia, survey participants earn $23,639 versus $13,587 for the country.3
69% OF FULL-TIME WORKERS IDENTIFY THEMSELVES AS ENGINEERS
65%
22%
14%
Have a degree in engineering and work as engineers.
Have degrees in engineering, but are not currently working as engineers.
Currently work as engineers, but do not have a degree in engineering.
Within this group:
4 2018 OPTICS & PHOTONICS GLOBAL SALARY SURVEY
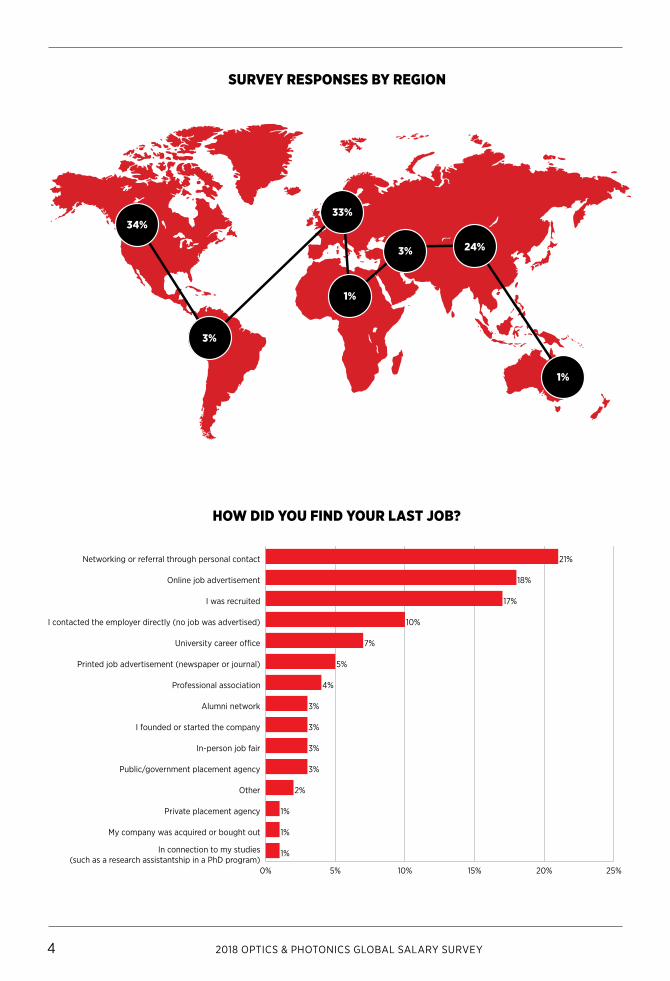
HOW DID YOU FIND YOUR LAST JOB?
SURVEY RESPONSES BY REGION
34%33%
3%
1%
3% 24%
1%
0% 5% 10% 15% 20% 25%
In connection to my studies(such as a research assistantship in a PhD program)
My company was acquired or bought out
Private placement agency
Other
Public/government placement agency
In-person job fair
I founded or started the company
Alumni network
Professional association
Printed job advertisement (newspaper or journal)
University career o�ce
I contacted the employer directly (no job was advertised)
I was recruited
Online job advertisement
Networking or referral through personal contact
1%
1%
1%
2%
3%
3%
3%
3%
4%
5%
7%
10%
17%
18%
21%

WWW.SPIECAREERCENTER.ORG 5
Job Satisfaction and Workplace Large majorities of optics and photonics workers enjoy their work (96%), find it meaningful (95%), and feel that their peers respect their work (93%). Most would recommend their field to their child or a friend (82%), feel they are paid fairly (78%), and perceive that promotions are handled fairly in their workplaces (71%).
JOB SATISFACTION
“I ENJOY MY WORK”: MEDIAN SALARIES BY ENJOYMENT OF WORK
0% 20% 40% 60% 80% 100%
I am happy with the amount I am paid
I have an excellent work/life balance
Decisions about my promotions/advancement are handled fairly
I am paid fairly compared to others at my organization
I would recommend my field to my child or a friend
My work is respected by my peers
My work is meaningful
I enjoy my work
Strongly agree (n=2222) $75,633
Agree (n=2399) $70,000
Disagree (n=176) $61,482
Strongly disagree (n=35) $62,698
While 78% of workers say they are paid fairly, only 61% are happy with their pay. The highest earners also enjoy their work the most—the median salary for the happiest respondents is $75,633 versus $62,698 for the least satisfied.
More than two-thirds of respondents feel they have an excellent work/life balance. Workers at 30-39 hours per week fall into the “sweet spot” for the balance between career and private life, with over 80% deeming it excellent. At the other end of the spectrum, only 44% of people working 55-59 hours per week agree that they have an excellent work/life balance.
Agree
Strongly Agree

6 2018 OPTICS & PHOTONICS GLOBAL SALARY SURVEY
“I HAVE AN EXCELLENT WORK/LIFE BALANCE” BY HOURS WORKED PER WEEK
0% 20% 40% 60% 80% 100%
60 hours or more
55-59 hours
50-54 hours
45-49 hours
40-44 hours
35-39 hours
30-34 hours
Less than 30 hours
“I love the company I work for. I could go somewhere else to make a little more but the culture that I am a part of is incomparable to anywhere else.”
“I do like my research work, but I am dissappointed with the salary.”
“Jobs in my organisation are underpaid by about 10%. However the work/life balance is particularly good and many colleagues agree this is fair.”

WWW.SPIECAREERCENTER.ORG 7
Wage GrowthWages grew for three out of five of the largest currency groups, with median salaries paid in Chinese yuan, U.S. dollars, and Japanese yen increasing 25%, 3%, and 1% respectively. Euro salaries were flat, while salaries paid in British pounds declined 2% over the last year.4
CHANGE IN MEDIAN SALARIES 2011–2017, LARGEST CURRENCY GROUPS
Over the longer term, median salaries have increased in all five currency groups. Pay in Chinese yuan has increased the most, rising 67% since 2011.
2011 = 100
100
150
200
Japanese yen
British pound
Euro
United States dollar
Chinese yuan
2017201620152014201320122011
Currencies with sample sizes of 250 or greater are displayed.
GROWTH IN MEDIAN SALARIES 2011-2017, LARGEST CURRENCY GROUPS
2011 Median Salary 2017 Median Salary Growth 2011–2017
Chinese yuan ¥90,000 ¥150,000 67%
United States dollar $106,000 $120,000 13%
Euro € 47,200 € 50,000 6%
British pound £42,000 £44,000 5%
Japanese yen ¥8,000,000 ¥8,370,000 5%

8 2018 OPTICS & PHOTONICS GLOBAL SALARY SURVEY
Workload Most survey respondents work between 40 and 50 hours per week (64%), while just over one in five spend 50 or more hours per week at their jobs (21%). Higher workloads align with higher salaries from lower through middle ranges, then drop off at 55-59 and 60+ hour levels.
HOURS WORKED PER WEEK
PERCENTAGE OF RESPONDENTS WORKING 50 HOURS OR MORE PER WEEK
Respondents from higher-income Asian countries spend the most time in their offices and labs, with 32% working 50 hours or more per week and only 8% working less than 40 hours per week.
0% 10% 20% 30% 40% 50%
60 hours or more
55-59 hours
50-54 hours
45-49 hours
40-44 hours
35-39 hours
30-34 hours
Less than 30 hours
0% 5% 10% 15% 20% 25% 30% 35%
Latin America and the Caribbean
Europe, higher income
Europe, lower income
Africa
Middle East
Oceania
North America
Asia, lower income
Asia, higher income

WWW.SPIECAREERCENTER.ORG 9
MEDIAN SALARY BY HOURS WORKED PER WEEK
0 $20,000 $40,000 $60,000 $80,000 $100,000
60 hours or more
55-59 hour
50-54 hours
45-49 hours
40-44 hours
35-39 hours
30-34 hours
Less than 30 hours
$71,000
$85,137
$90,000
$80,460
$70,000
$55,007
$39,461
$21,524
“It is a meaningful career, and I am glad that I chose it.”
“I love working on the leading edge of technology!”
10 2018 OPTICS & PHOTONICS GLOBAL SALARY SURVEY
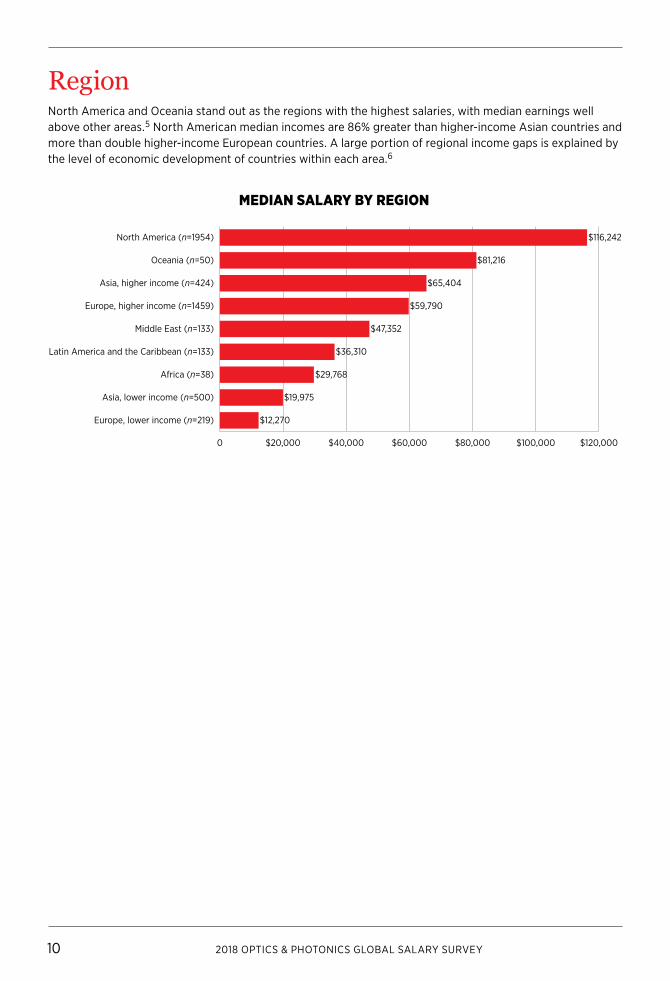
RegionNorth America and Oceania stand out as the regions with the highest salaries, with median earnings well above other areas.5 North American median incomes are 86% greater than higher-income Asian countries and more than double higher-income European countries. A large portion of regional income gaps is explained by the level of economic development of countries within each area.6
MEDIAN SALARY BY REGION
0 $20,000 $40,000 $60,000 $80,000 $100,000 $120,000
Europe, lower income (n=219)
Asia, lower income (n=500)
Africa (n=38)
Latin America and the Caribbean (n=133)
Middle East (n=133)
Europe, higher income (n=1459)
Asia, higher income (n=424)
Oceania (n=50)
North America (n=1954)
$12,270
$19,975
$29,768
$36,310
$47,352
$59,790
$65,404
$81,216
$116,242

WWW.SPIECAREERCENTER.ORG 11
Employer Type Median salaries are greatest in civilian government, followed by for-profit companies. Universities, colleges, and other educational institutions pay the least.7
MEDIAN SALARY BY EMPLOYER TYPE
Region For-profit Government/Military Academic
North America $125,000 $123,000 $90,000
Middle East $76,743 $31,569 $25,255
Asia, higher income $74,747 $68,669 $54,051
Oceania $73,761 $69,838 $84,455
Europe, higher income $72,346 $53,811 $56,259
Latin America and the Caribbean
$42,328 $36,310 $36,310
Africa $29,350 $56,851 $17,352
Asia, lower income $21,511 $23,048 $18,438
Europe, lower income $21,139 $9,755 $12,270
Percentage of Respondents Median Salary
Traditional companies 84% $96,000
Startup companies 16% $80,787
The question was seen only by respondents indicating “Company or corporation” or “Private laboratory or research institute” for organization type.
MEDIAN SALARY BY REGION: FOR-PROFIT, GOVERNMENT/MILITARY, AND ACADEMIC EMPLOYERS
MEDIAN SALARIES AT STARTUP VERSUS TRADITIONAL COMPANIES
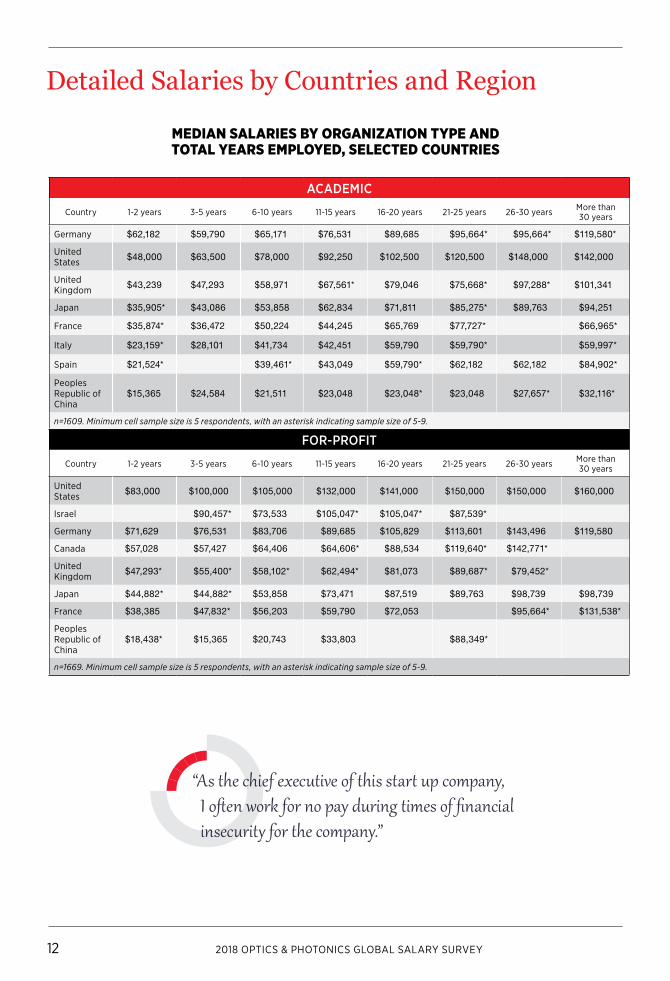
For-profit pay is higher than academic pay in most countries at most career stages, but the gap narrows with higher levels of experience. Earnings in North America are highest in both academia and for-profits, across regions and career stages.
0 $20,000 $40,000 $60,000 $80,000 $100,000 $120,000
University, college, or other educational institution (n=1535)
Government laboratory or research institute (n=723)
Other research institute (n=62)
Private laboratory or research institute (n=90)
Military or defense (n=104)
Not-for-profit organization orintergovernmental organization (n=126)
Company or corporation (n=2156)
Civilian government (n=54)
Self-employed or consultant (n=48)
$50,000
$53,811
$53,931
$59,790
$84,061
$89,685
$95,582
$105,500
$110,000
Startups account for just over 16% of workers at for-profit organizations. These entrepreneurs earn median salaries of $80,787, versus $96,000 for their colleagues at traditional companies.
12 2018 OPTICS & PHOTONICS GLOBAL SALARY SURVEY
MEDIAN SALARIES BY ORGANIZATION TYPE AND TOTAL YEARS EMPLOYED, SELECTED COUNTRIES
ACADEMIC
Country 1-2 years 3-5 years 6-10 years 11-15 years 16-20 years 21-25 years 26-30 years More than 30 years
Germany $62,182 $59,790 $65,171 $76,531 $89,685 $95,664* $95,664* $119,580*
United States $48,000 $63,500 $78,000 $92,250 $102,500 $120,500 $148,000 $142,000
United Kingdom $43,239 $47,293 $58,971 $67,561* $79,046 $75,668* $97,288* $101,341
Japan $35,905* $43,086 $53,858 $62,834 $71,811 $85,275* $89,763 $94,251
France $35,874* $36,472 $50,224 $44,245 $65,769 $77,727* $66,965*
Italy $23,159* $28,101 $41,734 $42,451 $59,790 $59,790* $59,997*
Spain $21,524* $39,461* $43,049 $59,790* $62,182 $62,182 $84,902*
Peoples Republic of China
$15,365 $24,584 $21,511 $23,048 $23,048* $23,048 $27,657* $32,116*
n=1609. Minimum cell sample size is 5 respondents, with an asterisk indicating sample size of 5-9.
FOR-PROFIT
Country 1-2 years 3-5 years 6-10 years 11-15 years 16-20 years 21-25 years 26-30 years More than 30 years
United States $83,000 $100,000 $105,000 $132,000 $141,000 $150,000 $150,000 $160,000
Israel $90,457* $73,533 $105,047* $105,047* $87,539*
Germany $71,629 $76,531 $83,706 $89,685 $105,829 $113,601 $143,496 $119,580
Canada $57,028 $57,427 $64,406 $64,606* $88,534 $119,640* $142,771*
United Kingdom $47,293* $55,400* $58,102* $62,494* $81,073 $89,687* $79,452*
Japan $44,882* $44,882* $53,858 $73,471 $87,519 $89,763 $98,739 $98,739
France $38,385 $47,832* $56,203 $59,790 $72,053 $95,664* $131,538*
Peoples Republic of China
$18,438* $15,365 $20,743 $33,803 $88,349*
n=1669. Minimum cell sample size is 5 respondents, with an asterisk indicating sample size of 5-9.
Detailed Salaries by Countries and Region
“As the chief executive of this start up company, I often work for no pay during times of financial insecurity for the company.”

WWW.SPIECAREERCENTER.ORG 13
MEDIAN SALARIES BY ORGANIZATION TYPE, TOTAL YEARS EMPLOYED, AND REGION
ACADEMIC
Country 1-2 years 3-5 years 6-10 years 11-15 years 16-20 years 21-25 years 26-30 years More than 30 years
North America $48,000 $59,820 $77,400 $92,250 $100,000 $119,700 $143,000 $143,250
Europe, higher income
$40,265 $45,201 $52,718 $50,822 $68,056 $75,668 $76,531 $97,120
Latin America and the Caribbean
$35,631* $25,936 $31,123 $30,385 $45,652 $51,061 $46,476* $51,872*
Asia, higher income $33,782 $37,492 $49,706 $61,821 $69,687 $89,486 $89,763 $98,739
Middle East $21,045* $31,627* $28,202* $50,644* $21,703 $21,045* $107,069*
Asia, lower income $12,292 $19,206 $16,861 $18,677 $19,401 $20,937 $25,612 $30,730
Europe, lower income
$15,775* $11,393 $9,465 $11,266 $18,404* $12,270* $12,892
n=725. Minimum cell sample size is 5 respondents, with an asterisk indicating sample size of 5-9.
FOR-PROFIT
Country 1-2 years 3-5 years 6-10 years 11-15 years 16-20 years 21-25 years 26-30 years More than 30 years
North America $79,000 $95,000 $103,000 $130,000 $140,000 $150,000 $150,000 $158,600
Europe, higher income
$47,293 $55,400 $66,045 $66,367 $88,757 $108,818 $106,311 $119,580
Asia, higher income $43,586 $52,430 $62,834 $71,811 $89,763 $89,763 $98,739 $95,912
Middle East $35,262 $71,028 $102,858* $102,129 $87,539*
Asia, lower income $16,902 $15,365 $23,048 $25,265 $65,302*
n=2074. Minimum cell sample size is 5 respondents, with an asterisk indicating sample size of 5-9.
“The three most decisive factors in my career were: education, network and luck.”

14 2018 OPTICS & PHOTONICS GLOBAL SALARY SURVEY
MEDIAN SALARY BY TOTAL YEARS EMPLOYED FOR RESPONDENTS WITH PHD, SELECTED COUNTRIES
1-2 years 3-5 years 6-10 years 11-15 years 16-20 years 21-25 years 26-30 years More than 30 years
Switzerland $84,082* $84,389* $107,404* $127,862* $151,388* $153,434*
United States $83,500 $100,000 $109,263 $135,000 $150,000 $151,000 $167,500 $175,000
Germany $66,965 $71,748 $77,727 $81,912 $95,664 $104,035 $107,622 $119,580
Canada $58,225* $59,820 $63,808* $79,760* $87,736* $115,652* $131,604* $107,198*
United Kingdom $44,117 $47,293 $59,454 $67,561 $81,073 $73,641 $97,288 $97,120
Japan $38,814 $44,882 $53,858 $68,669 $80,787 $89,763 $89,763 $98,739
France $35,874 $41,853 $53,512 $47,832 $65,769 $65,769 $72,286
Spain $42,451 $41,853 $59,132 $65,171 $62,182* $84,902*
Italy $25,829* $27,503 $39,461 $45,440 $59,790 $59,790 $69,357 $68,699
Peoples Republic of China
$15,365 $30,730 $23,048 $23,048 $24,584 $30,730 $38,413* $61,460*
India $5,785 $10,983 $18,827 $20,396 $20,396 $25,103 $31,379
Russia $17,528 $13,146 $14,513 $21,034 $15,775* $12,270* $17,090
n=2136. Minimum cell sample size is 5 respondents, with an asterisk indicating sample size of 5-9.
“I highly recommend optical engineering as a career path. SPIE should make sure to engage students starting in elementary school as part of educational outreach programs.”

WWW.SPIECAREERCENTER.ORG 15
MEDIAN SALARY BY PRIMARY DISCIPLINE
Discipline Aerospace and semiconductor disciplines enjoy the highest median earnings, at $112,764 and $102,777, respectively. Civil/environmental falls at the opposite end of the spectrum, with a median salary of $49,893.
The two most important factors driving salary gaps across disciplines are organization type and country income level. The highest-paying disciplines have much higher representation at for-profit companies: The top three disciplines by pay (aerospace, semiconductor, and chemical) have 335 people at for-profits versus 190 combined in government/military and academia.
0 $20,000 $40,000 $60,000 $80,000 $100,000 $120,000
Civil or environmental (n=26)
Nanotechnology (n=149)
Computer science, software, or information technology (n=176)
Photonics (n=418)
Electrical or electronics (n=197)
Physics (n=311)
Remote sensing (n=242)
Mechanical (n=66)
Materials (n=171)
Lasers (n=426)
Biomedical, medical, biology, biophysics,or biotechnology (n=435)
Optical design (n=152)
Other (n=151)
Astronomy or astrophysics (n=275)
Manufacturing (n=257)
Systems engineering or research (n=141)
Interdisciplinary engineering or research (n=173)
Illumination (n=40)
Optical systems (n=483)
Chemical (n=60)
Semiconductor (n=338)
Aerospace (n=227)
$49,893
$53,811
$56,702
$57,014
$58,594
$58,594
$60,493
$60,923
$65,129
$67,951
$70,169
$71,748
$71,784
$73,300
$76,299
$77,300
$77,727
$79,880
$80,000
$92,382
$102,777
$112,764
16 2018 OPTICS & PHOTONICS GLOBAL SALARY SURVEY
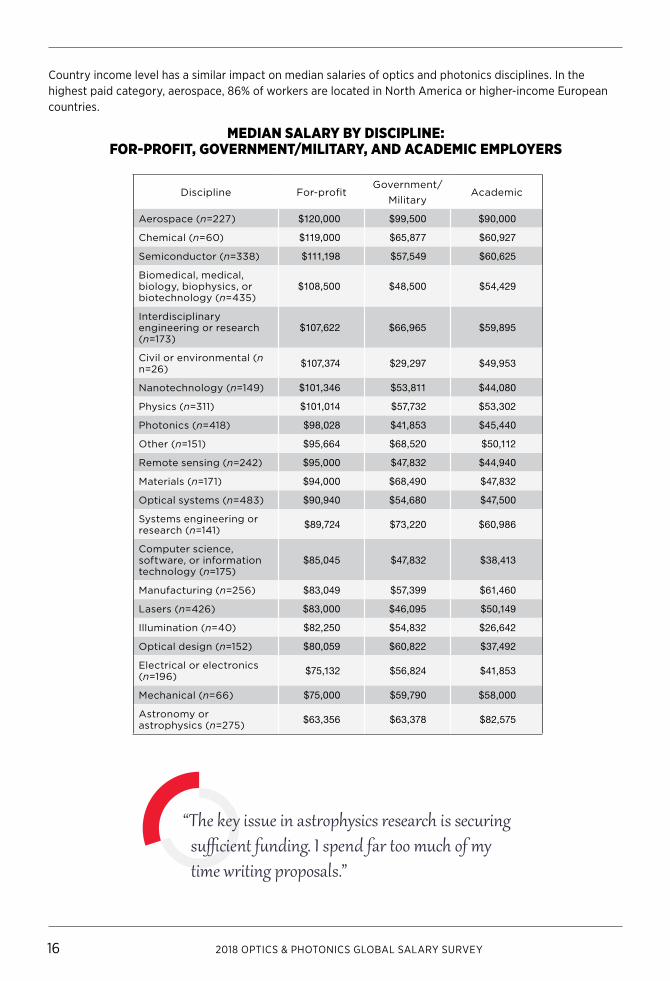
Country income level has a similar impact on median salaries of optics and photonics disciplines. In the highest paid category, aerospace, 86% of workers are located in North America or higher-income European countries.
MEDIAN SALARY BY DISCIPLINE: FOR-PROFIT, GOVERNMENT/MILITARY, AND ACADEMIC EMPLOYERS
Discipline For-profitGovernment/
MilitaryAcademic
Aerospace (n=227) $120,000 $99,500 $90,000
Chemical (n=60) $119,000 $65,877 $60,927
Semiconductor (n=338) $111,198 $57,549 $60,625
Biomedical, medical, biology, biophysics, or biotechnology (n=435)
$108,500 $48,500 $54,429
Interdisciplinary engineering or research (n=173)
$107,622 $66,965 $59,895
Civil or environmental (n n=26) $107,374 $29,297 $49,953
Nanotechnology (n=149) $101,346 $53,811 $44,080
Physics (n=311) $101,014 $57,732 $53,302
Photonics (n=418) $98,028 $41,853 $45,440
Other (n=151) $95,664 $68,520 $50,112
Remote sensing (n=242) $95,000 $47,832 $44,940
Materials (n=171) $94,000 $68,490 $47,832
Optical systems (n=483) $90,940 $54,680 $47,500
Systems engineering or research (n=141) $89,724 $73,220 $60,986
Computer science, software, or information technology (n=175)
$85,045 $47,832 $38,413
Manufacturing (n=256) $83,049 $57,399 $61,460
Lasers (n=426) $83,000 $46,095 $50,149
Illumination (n=40) $82,250 $54,832 $26,642
Optical design (n=152) $80,059 $60,822 $37,492
Electrical or electronics (n=196) $75,132 $56,824 $41,853
Mechanical (n=66) $75,000 $59,790 $58,000
Astronomy or astrophysics (n=275) $63,356 $63,378 $82,575
“The key issue in astrophysics research is securing sufficient funding. I spend far too much of my time writing proposals.”

WWW.SPIECAREERCENTER.ORG 17
0 $20,000 $40,000 $60,000 $80,000 $100,000 $120,000
Europe, lower Income
Oceania
Europe, higher Income
Latin America & Caribbean
Asia, higher Income
North America
Middle East
Asia, lower IncomeWomen
Men
MEDIAN SALARY BY GENDER AND REGION
Gender Women make up 19% of the respondents to the survey, 28% of students, and 16% of full-time workers. Women earn less than men overall, with respective median salaries of $58,542 and $75,000.
The largest wage differences are associated with lower-income Asian and Middle East countries, employment at not-for-profit organizations, and employment of more than 30 years. Wage gaps persist in most demographic subsets of the data, though differences are lower in early career stages. Women in military/defense and at “other research institutes” earn more than men.
MEDIAN SALARY BY GENDER AND REGION
MEDIAN SALARY BY GENDER AND YEARS EMPLOYED
Women Men
1-2 years $41,435 $47,293
3-5 years $47,293 $52,697
5-10 years $50,224 $59,790
11-15 years $62,834 $65,769
16-20 years $77,876 $85,127
21-25 years $76,299 $105,231
26-30 years $85,049 $118,500
More than 30 years $82,500 $123,750
n=758 women, 3970 men.
n=773 women, 3994 men.

18 2018 OPTICS & PHOTONICS GLOBAL SALARY SURVEY
MEDIAN SALARY BY GENDER AND EMPLOYER TYPE
Women and men report similar levels of job satisfaction in most categories. The largest difference of opinion concerns fairness of pay and promotion: 71% or women feel that they are paid fairly, versus 79% of men. Equal percentages of women and men (85%) enjoy their work
0 $20,000 $40,000 $60,000 $80,000 $100,000 $120,000
Military or defense
Other research institute
Government laboratory or research institute
University, college, or other educational institution
Private laboratory or research institute
Company or corporation
Civilian government
Not-for-profit organization orintergovernmental organization Women
Men
0% 20% 40% 60% 80% 100%
I would recommend my fieldto my child or a friend
My work is meaningful
I enjoy my work
My work is respected by my peers
I have an excellent work/life balance
I am happy with my pay
Promotions at my organization are handled fairly
I am paid fairlyWomen
Men
JOB SATISFACTION BY GENDER
“Though initially I felt like the only girl in the lab, my fascination in the field warded off the thoughts. My lab members have been very kind as well to help me out with my work.”

WWW.SPIECAREERCENTER.ORG 19
Other Factors Other factors that influence salary include job level and job role. Top organizational leaders enjoy the highest salaries, while teaching assistants and basic researchers anchor the bottom of the range.
MEDIAN SALARY BY JOB LEVEL
MEDIAN SALARY BY JOB LEVEL, SELECTED COUNTRIES
Full professor
Lead or senior level (including engineers and researchers)
Supervisor or manager (including engineers
and researchers)
Staff (including
engineers and researchers)
Postdoc Associate professor
Assistant professor Director
United States $155,000 $135,000 $130,000 $98,000 $51,000 $100,000 $89,250 $180,000
Canada $143,568 $87,736 $77,766 $59,820 $39,880* $81,754* $103,688*
Germany $107,622 $96,860 $100,447 $72,077 $65,171 $171,598
Italy $107,622* $54,409 $60,388 $43,350 $29,895 $59,790 $47,832* $71,748*
United Kingdom $97,120 $66,210 $71,615 $51,346 $44,590 $77,019 $64,858* $104,719*
Japan $89,763 $89,763 $89,763 $61,039 $39,496 $71,811 $53,858
Spain $75,336 $46,038 $59,790* $46,636 $35,874 $59,790 $35,874*
France $71,748 $58,594 $80,717 $47,832 $35,874 $47,832 $102,241*
Taiwan $60,808* $50,673* $64,186* $40,538 $24,323* $43,917* $112,494*
Peoples Republic of China
$30,730 $38,413 $30,730 $18,438 $23,816 $23,048 $18,438 $92,190*
India $22,350* $23,534 $15,689* $15,689 $8,347* $21,965 $11,375
Russia $16,652 $17,528 $13,058* $12,270 $12,270 $15,425 $9,465*
Minimum cell sample size is 5 respondents, with an asterisk indicating sample size of 5-9.
0 $50,000 $100,000 $150,000 $200,000
Teaching assistant (n=22)
Research assistant (n=153)
Student (n=45)
Assistant professor (n=263)
Instructor or adjunct professor (n=42)
Postdoc (n=415)
Associate professor (n=308)
Technician, operator, or lab tech (including engineers and researchers) (n=214)
Fellow (n=71)
Other (n=91)
Sta� (including engineers and researchers) (n=937)
Full professor (n=382)
Academic dean or provost (n=20)
Supervisor or manager (including engineers and researchers) (n=504)
Lead or senior level (including engineers and researchers) (n=1006)
Director (n=200)
Owner (n=67)
Vice-president (n=87)
C-level or senior executive (n=81)
$15,365
$24,000
$38,266
$38,413
$43,434
$44,245
$46,321
$47,832
$51,417
$58,359
$71,748
$85,423
$96,382
$100,000
$100,000
$138,080
$140,000
$152,019
$160,000

20 2018 OPTICS & PHOTONICS GLOBAL SALARY SURVEY
MEDIAN SALARY BY JOB ROLE
0 $50,000 $100,000 $150,000 $200,000
Basic research or science (n=734)
College professor, teacher, or other educator (n=578)
Technical or lab (n=146)
Applied research (n=1021)
Marketing (n=64)
Medical doctor or clinician (n=20)
Production, manufacturing, or quality assurance (n=140)
Other (n=84)
Administrative (n=75)
Application or product development (n=321)
Engineering or design (n=930)
Sales (n=163)
Purchasing (n=15)
Project or program management (n=241)
Consultant (n=26)
Business development (n=89)
Executive, leadership, or owner (n=233)
$53,794
$53,955
$59,014
$60,000
$61,904
$69,374
$70,597
$71,766
$77,727
$83,706
$83,706
$89,763
$95,000
$95,000
$99,850
$110,000
$160,000
“I have thoroughly enjoyed working in the optics industry for over 30 years and would recommend optics as a career to any student who is just starting out.”
WWW.SPIECAREERCENTER.ORG 21
DEGREE BEING PURSUED
PRIMARY TOPIC STUDIED
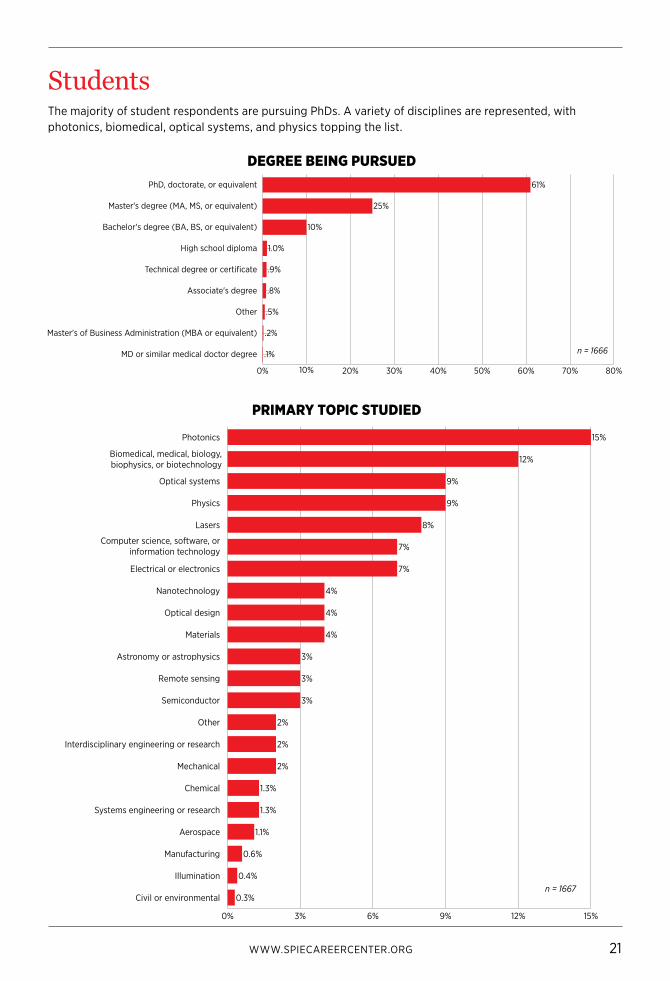
StudentsThe majority of student respondents are pursuing PhDs. A variety of disciplines are represented, with photonics, biomedical, optical systems, and physics topping the list.
0% 3% 6% 9% 12% 15%
Civil or environmental
Illumination
Manufacturing
Aerospace
Systems engineering or research
Chemical
Mechanical
Interdisciplinary engineering or research
Other
Semiconductor
Remote sensing
Astronomy or astrophysics
Materials
Optical design
Nanotechnology
Electrical or electronics
Computer science, software, orinformation technology
Lasers
Physics
Optical systems
Biomedical, medical, biology,biophysics, or biotechnology
Photonics
n = 16670.3%
0.4%
0.6%
1.1%
1.3%
1.3%
2%
2%
2%
3%
3%
3%
4%
4%
4%
7%
7%
8%
9%
9%
12%
15%
0% 10% 20% 30% 40% 50% 60% 70% 80%
MD or similar medical doctor degree
Master's of Business Administration (MBA or equivalent)
Other
Associate's degree
Technical degree or certificate
High school diploma
Bachelor's degree (BA, BS, or equivalent)
Master's degree (MA, MS, or equivalent)
PhD, doctorate, or equivalent
n = 1666.1%
.2%
.5%
.8%
.9%
1.0%
10%
25%
61%

22 2018 OPTICS & PHOTONICS GLOBAL SALARY SURVEY WWW.SPIECAREERCENTER.ORG 22
Notes

WWW.SPIECAREERCENTER.ORG 23
LAND THE PERFECT JOB
Find targeted engineering and technical jobs,
post your CV/resume online, set up job alerts,
access career-related articles and more, all for free.
WWW.SPIECAREERCENTER.ORG

24 2018 OPTICS & PHOTONICS GLOBAL SALARY SURVEY
Explore the new and improved Digital Library
spiedl.org
» Enhanced usability » Improved search functionality » Expanded proprietary taxonomy » Full-text HTML proceedings and eBooks » Presentation recording videos from
SPIE conferences » Mobile-friendly design

WWW.SPIECAREERCENTER.ORG 25
Methodology and Endnotes In December of 2017 and January of 2018, SPIE sent email survey invitations to a large subset of its global customer database. Response was voluntary and open. An iPad raffle and early access to this report were offered as incentives to encourage participation. Surveys were completed online using SurveyGizmo’s enterprise survey tool. Results were filtered for duplicates and invalid data to yield 7,035 valid responses. Microsoft Excel and SPSS were utilized for summary statistics and related analyses
NOTES: 1. This list includes valid responses from full-time, part-time, student, and retiree respondents. United States (2179),
Peoples Republic of China (668), Germany (441), India (296), Japan (290), United Kingdom (257), France (226), Russia (220), Italy (207), Canada (195), Spain (139), Taiwan (124), South Korea (119), Switzerland (88), Israel (87), Netherlands (84), Poland (77), Mexico (74), Australia (73), Brazil and Turkey (72), Czechia (60), Singapore (53), Belgium and Lithuania (48), Sweden (47), Ukraine (34), Denmark (33), Portugal (32), Austria (30), Finland and Ireland (29), Colombia and Romania (28), Pakistan (26), Egypt and Greece (24), Chile and South Africa (22), Malaysia (21), Argentina (18), Thailand (17), Hungary (15), New Zealand and Philippines (14), Hong Kong SAR, Indonesia, and Latvia (13), Algeria and Bulgaria (11), Slovenia and Tunisia (10), Armenia and Norway (9), Belarus, Nigeria, Saudi Arabia, and Vietnam (8), Slovakia (6), Bangladesh, Cameroon, Jordan, Moldova, and Serbia (5), Bolivia and Lebanon (4), Croatia, Ecuador, Estonia, Iraq, Luxembourg, Morocco, and Senegal (3), Brunei, Chad, Cyprus, Iran, Kazakhstan, Kenya, Kyrgyzstan, Libya, Tanzania, and Venezuela (2), Bahrain, Bosnia and Herzegovina, Iceland, Kuwait, Liechtenstein, Macau SAR, Malta, Mongolia, Oman, State of Palestine, Peru, Rwanda, Sri Lanka, Swaziland, Tajikistan, United Arab Emirates, Uruguay, and Zimbabwe (1).
2. U.S. dollars are used throughout. Local currencies were converted using January 2018 market exchange rates. Salary figures include total yearly compensation, both base pay and bonuses. Full-time employees are those who indicated working 35 or more hours per week. Unless otherwise noted, all data on pay is drawn from full-time employees.
3. Data for broader populations within countries are average annual wages per full-time and full-year equivalent employees in the total economy, 2016 USD exchange rates and constant prices, from https://stats.oecd.org/Index.aspx?DataSetCode=AV_AN_WAGE. Retrieved 16 January 2018.
4. Yearly growth was computed by comparing same-currency results for each year.
5. Oceania is comprised of Australia and New Zealand. North America is comprised of the United States and Canada. Mexico is included in the Latin America and Caribbean category.
6. Europe and Asia are composed of countries spanning a wide range of income levels, even when subdivided into higher- and lower-income groups. For example, the European higher-income category includes the Czechia and Norway, at $17,540 and $82,440 per capita Gross National Income (GNI), respectively for 2016.
Higher- and lower-income subcategories are based on the World Bank’s threshold for high-income countries, $12,236 per capita GNI in 2016. This threshold is used throughout this report when referring to “higher-income” and “lower-income” countries.
For data on per capita GNI, see http://data.worldbank.org/indicator/NY.GNP.PCAP.CD/countries. For World Bank country income categories, see http://data.worldbank.org/about/country-classifications
7. The category “for-profit” is composed of company/corporation, self-employed/consultant, and open text “other” entries that indicate for-profit affiliation. “Academic” is composed of university/college, private lab or research institute, not-for-profit, intergovernmental, other research institute, and open text “other” entries that indicate academic organizations. “Government/military” is composed of government lab or research institute, civilian government, and military/defense.

www.SPIECareerCenter.org
THE 2018 OPTICS & PHOTONICS GLOBAL SALARY REPORT IS SPONSORED BY SPIE CAREER CENTER
SPIE is the international society for optics and photonicsCONNECTING MINDS. ADVANCING LIGHT.
SPIE is the international society for optics and photonics, an educational not-for-profit organization founded in 1955 to advance light-based science and technology. The Society serves nearly 264,000 constituents from approximately 166 countries, offering conferences and their published proceedings, continuing education, books, journals, and the SPIE Digital Library in support of interdisciplinary information exchange, professional networking, and patent precedent. SPIE provided more than $4 million in support of education and outreach programs in 2017.
2018
Glo
bal
Sal
ary
Rep
ort
pre
-rel
ease
SPIE INTERNATIONAL HEADQUARTERS PO Box 10 Bellingham, WA 98227-0010 USA Tel: +1 360 676 3290 / Fax: +1 360 647 1445 [email protected] / www.SPIE.org
SPIE EUROPE OFFICES 2 Alexandra Gate Ffordd Pengam, Cardiff, CF24 2SA UK Tel: +44 29 2089 4747 / Fax: +44 29 2089 4750 [email protected] / www.SPIE.org
FOR QUESTIONS, COMMENTS, OR SUGGESTIONS, CONTACT REPORT AUTHOR ADAM RESNICK AT:[email protected]
Copyright © 2018 Society of Photo-Optical Instrumentation Engineers (SPIE), all rights reserved.
No part of this publication may be reproduced or distributed in any form or by any means without written permission of the publisher.