© 2012 cascade energy, inc. draft presentation of five standard protocols presented by: zach...
TRANSCRIPT

© 2012 Cascade Energy, Inc.© 2012 Cascade Energy, Inc.
Draft Presentation of Five Standard
ProtocolsPresented by: Zach Podell-EberhardtRob Travis Craig PhillipsSteve KoskiCascade Energy, Inc.

© 2012 Cascade Energy, Inc.2
Scope of Work
• Convert five existing calculators to Standard Protocols compliant with Guidelines for RTF Savings Estimation Methods– Premium Efficiency Motors– Voltage Optimization Protocol– Transformer De-Energizing– Scientific Irrigation Scheduling– Dairy Plate Heat Exchanger

© 2012 Cascade Energy, Inc.3
Key Guidelines
• Define and validate best practice• Determine “simplest reliable” method• Aim for unbiased +/- 20% accuracy from
best practice method.• Specify precise eligibility• Independent of program design/delivery

4
Transformer De-Energizing
© 2012 Cascade Energy, Inc.

© 2012 Cascade Energy, Inc.5
Best Practice vs. Simplest Reliable Method
Best Practice Savings Estimate1. Measure the power of the transformer when it is energized, but does not have an
electrical load in order to determine the no load losses.2. Collect transformer data (type, kVA rating, and manufacturer data sheet if available). 3. Determine the number of hours per year the transformer is de-energized based on
utility record of date(s) of de-energization and date(s) of re-energization.4. Savings is calculated as the product of hours of de-energization and no load power
draw.5. Savings are to be determined in this manner each year the transformer is de-
energized.
Simplest Reliable Savings Estimate6. Determine no-load loss by:
a) Manufacturer ratingb) Default rated capacity by utilizing NEMA TP-1 transformer efficiency ratings if manufacturer
rating is unavailable.c) No-load loss power measurement can be used in lieu of #1 or #2.
7. Remaining steps follow the Best Practice.

© 2012 Cascade Energy, Inc.6
Protocol Summary
Eligibility • Liquid-filled or dry-type transformers• Single phase between 3 kVA – 167 kVA• Three phase between 15 kVA – 1,000 kVA• Low voltage (<= 600V)
Baseline Existing energized transformer with periods of no-load
Upgrade De-energize the transformer for periods of no-load
Key equations • Only to be used if transformer no-load loss rating is not available.
• No-load loss equation reference: Supplement to the “Determination Analysis” (ORNL-6847) and Analysis of the NEMA Efficiency Standards for Distribution Transformers, Oak Ridge National Laboratory (ORNL), September 1997
© 2012 Cascade Energy, Inc.7
No-Load Losses
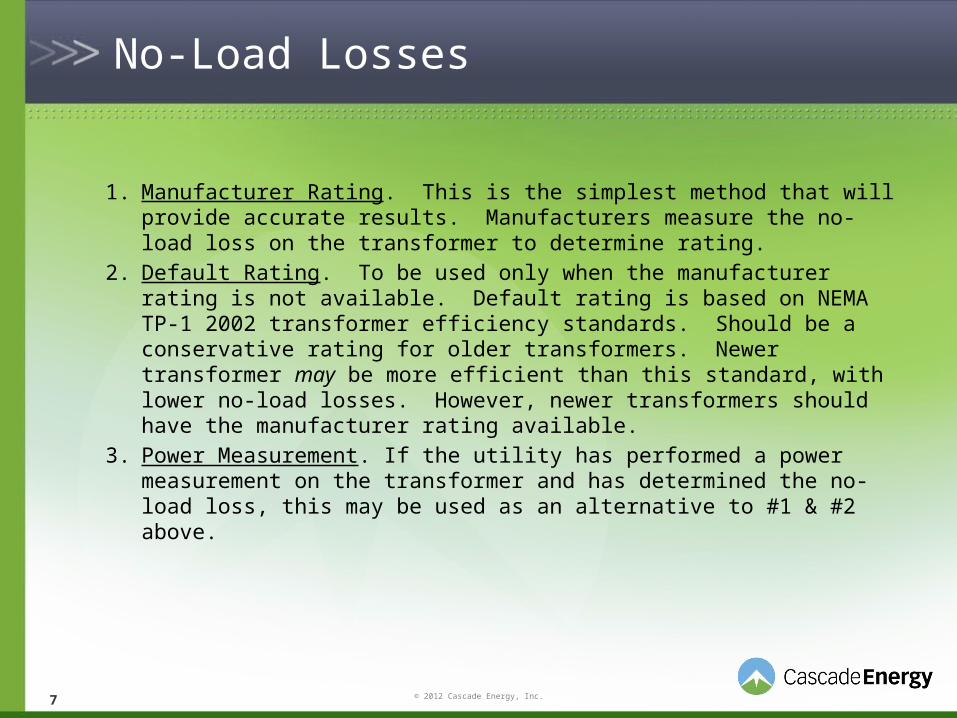
1. Manufacturer Rating. This is the simplest method that will provide accurate results. Manufacturers measure the no-load loss on the transformer to determine rating.
2. Default Rating. To be used only when the manufacturer rating is not available. Default rating is based on NEMA TP-1 2002 transformer efficiency standards. Should be a conservative rating for older transformers. Newer transformer may be more efficient than this standard, with lower no-load losses. However, newer transformers should have the manufacturer rating available.
3. Power Measurement. If the utility has performed a power measurement on the transformer and has determined the no-load loss, this may be used as an alternative to #1 & #2 above.

8
Voltage Optimization
© 2012 Cascade Energy, Inc.

9
Best Practice vs. Simplest Reliable Method
Best Practice Savings Estimate1. Conduct alternating day voltage regulation for a period of one year. 2. Determine project specific VO-Factor(s) by surveying distribution system customers in
the voltage control zone(s), similar to the 2007 NEEA DEI Project Load Research Survey Reported Results.
Simplest Reliable Savings Estimate3. Use the seven day (168 hour) minimum threshold measurement period for baseline
pre-VO and post-VO system implementation. Use of this method has been validated in paper, Robustness of Simplified VO M&V Protocol Measurement Period of 7 days, by Robert H. Fletcher, PhD, P.E., Utility Planning Solutions, PLLC
4. Use the VO-Factor(s) presented in the 2007 NEEA DEI Project Load Research Survey Reported Results.
© 2012 Cascade Energy, Inc.

10
Protocol Summary
Eligibility • Utilities serving mostly residential and light commercial load customers
• Meets minimum operating performance thresholds during seven day measurement period
Baseline System improvements, such as line load losses, transformer no-load losses, and end use consumption have been made, but no voltage optimization has been implemented.
Upgrade Voltage optimization to achieve energy savings through system improvements listed above.
Key equations • The energy savings is calculated by multiplying the change in voltage by the VO Factor. The VO Factor is calculated using tables from NEEA research, and is a function of residential load characteristics.
• The change in voltage is calculated using the same method as the 2010 M&V protocol, which uses industry standard calculations to determine the average voltage before and after optimization.
© 2012 Cascade Energy, Inc.

11
Voltage Optimization
– Simplified Voltage Optimization (VO) Measurement and Verification Protocol approved by RTF in 2010. No known issues with existing protocol.
– Existing protocol sections arranged into new Standard Protocol format. Additional definitions and clarifications have been added based on input received from Bob Fletcher at Utility Planning Solutions.
– Allows for seven day (168 hour) measurement period.– Utilizes 2007 NEEA DEI Project Load Research Survey Reported Results
for end-use VO Factors according to climate heating and cooling zones (presented in Appendix A)
© 2012 Cascade Energy, Inc.

12
Ultra-Premium Efficiency Motors
© 2012 Cascade Energy, Inc.

© 2012 Cascade Energy, Inc.13
Best Practice Method
LF (Load Factor): Measured using a power snapshot at normal loading, and the following equation:
Hours (operating hours): Input by practitioner.
: Efficiency at load factor. Interpolated from baseline and upgrade motor spec sheets.

© 2012 Cascade Energy, Inc.14
Simplest Reliable Method
Eligibility 1-500 hp general purpose motors
Baseline 1-200 hp: Install a NEMA Premium Efficiency Motor.250-500 hp: Install a motor with the average efficiency of all motors that meet or exceed EPAct standard.
Upgrade Nameplate efficiency must be at least one efficiency band over baseline
Key equations
LF (Load Factor): Assumed from NW Industrial Motors Database; averaged by hp and end use. No override input.
Hours (operating hours): Input by practitioner. No default assumption.
: Efficiency at load factor. Calculated from nameplate efficiency, load factor, and interpolation from MotorMaster+ part load efficiency ratings.

© 2012 Cascade Energy, Inc.15
NW Motors Database
– Assembled by the OSU-IAC, contains 22,000 industrial motors in OR, WA, ID.
– Motor run hours show minimal correlation to motor size or end use.
– Cannot assume motor run hours based on size and end use.
– Protocol testing over entire 22,000 motor database gave 25% error using run hours averaged by nameplate hp and end use load.
End Use Load Motor Hours (bin)
0K 1K 2K 3K 4K 5K 6K 7K 8K 9K
Air Compressor
Fan
Material Handling
Material Processing
Other
Pump
Refrigeration/HVAC Compressor
Vacuum pump
0
20
40
60
80
Count of Hours
0
100
200
Count of Hours
0
50
100
Count of Hours
0
100
200
Count of Hours
0
5
10
15
Count of Hours
0
20
40
60
Count of Hours
0
10
20
Count of Hours
0
5
10
Count of Hours

© 2012 Cascade Energy, Inc.16
NW Motors Database
– 3,500 motors contain load factor measurements.
– Protocol testing shows no bias when excluding load factors under 0.4.
– Low load factor motors cause bias.
– ASSUMPTION: Motors under 40% loading drive variable processes; they periodically run loaded but mostly run unloaded.
– PROPOSED SOLUTION: Protocol should exclude motors with multiple distinct loading conditions.
End Use Load Load Factor (bin)
0.1 0.3 0.5 0.7 0.9 1.1 1.3 1.5
Air Compressor
Fan
Material Handling
Material Processing
Other
Pump
Refrigeration/HVAC Compressor
Vacuum pump
0
50
100
Count of LF
0
50
100
150
Count of LF
20
40
60
80
Count of LF
0
50
100
Count of LF
0
5
10
15
Count of LF
0
20
40
60
Count of LF
0
10
20
30
Count of LF
0
5
10
Count of LF

© 2012 Cascade Energy, Inc.17
Effect of excluding low load factors
Protocol Error (bin)
0.45-0.40-0.35-0.30-0.25-0.20-0.15-0.10-0.05-0.000.050.100.150.200.250.300.350.400.450.500.550.600.650.700.750.85
0
20
40
60
80
100
120
140
160
180
200
220
240
260
280
300
Count of Protocol Error Bias is removed

18
Dairy Plate Heat Exchanger
© 2012 Cascade Energy, Inc.

© 2012 Cascade Energy, Inc.19
Process Flow Diagram
Project may include VFD
Water loop and glycol loop may be housed in one body

© 2012 Cascade Energy, Inc.20
Measure Definition
Eligibility Plate and frame heat exchangerNew construction or retrofitWater is the cooling fluid, and has constant flowKnown milk outlet temperature or modeled heat rejection
Baseline Mechanical refrigeration system to cool milkMay or may not have existing milk pre-cooler
Upgrade Add milk-to-water plate and frame heat exchanger or replace existing. Optional: install VFD on milk transfer pump

© 2012 Cascade Energy, Inc.21
Best Practice Method
COP: Gathered from compressor-specific manufacturer’s ratings at measured average suction and discharge pressures. Constant between baseline and post.
: Obtained from 1 year of dairy records (very accurate).
T: measured directly using an installed temperature probe.
© 2012 Cascade Energy, Inc.22
Simplest Reliable Method – same equations, different data collection
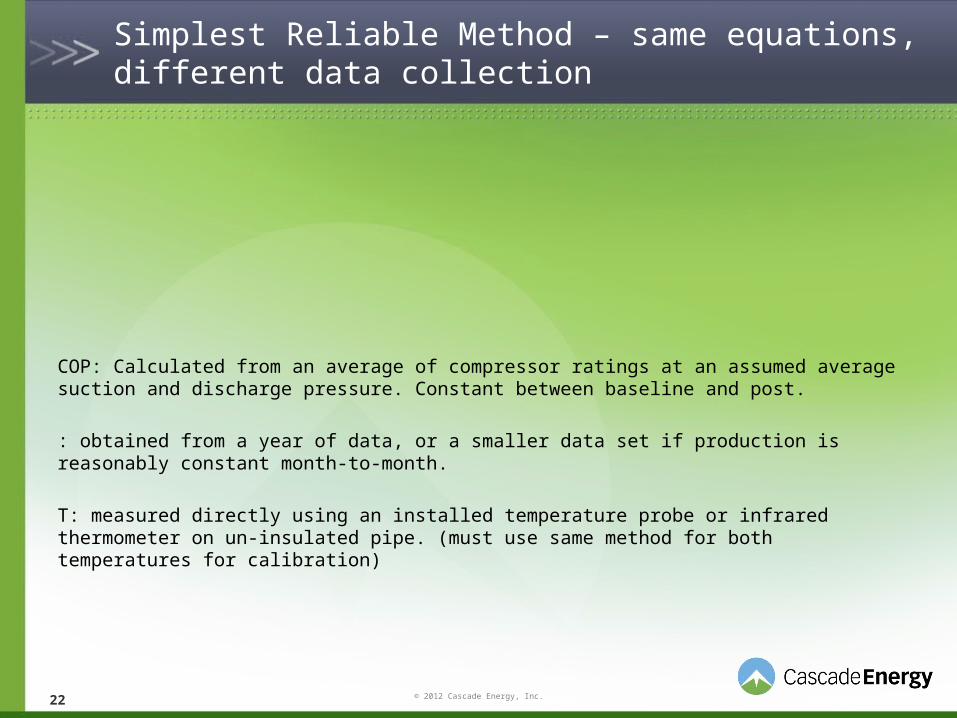
COP: Calculated from an average of compressor ratings at an assumed average suction and discharge pressure. Constant between baseline and post.
: obtained from a year of data, or a smaller data set if production is reasonably constant month-to-month.
T: measured directly using an installed temperature probe or infrared thermometer on un-insulated pipe. (must use same method for both temperatures for calibration)

© 2012 Cascade Energy, Inc.23
In reality…
• 12 of 14 recent projects had baseline water-cooled HXR.• Analyzing 14 projects cannot predict the 15th
• can be impossible to measure.
List of recent Cascade Energy milk HXR projectsBaseline EEM % Difference in Predicted vs. Actual EEM Savings
ProjectBaseline HE?
(Y/N)
Well Water Temp(°F)
Milk into Chiller Temp
(°F)
Milk Leaving Chiller Temp
(°F)
Baseline HE Approach (°F)
Milk Into Chiller Temp
(°F)
EEM HE Approach (°F)
With 3°F Approach Temp
With 18°F Approach Temp
3°F Tapp (B/L HXr)9°F Tapp (No B/L HXr)
1 Y 59 78 38 19 61 2 4.3% -2.5% 4.3%2 Y 52 85 38 33 64 12 -34.6% -31.9% -34.6%3 Y 55 75 38 20.0 57 2.0 5.3% -5.4% 5.3%4 N 59 98 38 N/A 71 12.0 -27.3% 18.2% -9.1%5 Y 59 68 38 9.0 61 2.0 4.3% 30.0% 4.3%6 Y 58 80 38 22.0 60 2.0 4.5% -9.5% 4.5%7 Y 58 76 38 18.0 60 2.0 4.5% 0.0% 4.5%8 N 56 98 38 42.0 62.5 6.5 -14.3% 46.9% 10.2%9 Y 56 76 38 20.0 58 2.0 5.0% -5.3% 5.0%10 Y 55 76 38 21.0 61.5 6.5 -14.9% -7.9% -14.9%11 Y 58 75 38 17.0 60 2.0 4.5% 2.7% 4.5%12 Y 53 80 36 27.0 54 1.0 11.1% -20.5% 11.1%13 Y 58 81.5 38 23.5 61.5 3.5 -2.1% -12.6% -2.1%14 Y 58 74 38.8 16.0 59 1.0 9.9% 5.7% 9.9%
Average -2.8% 0.6% 0.2% w/ existing HXr0.6% w/o existing HXr

© 2012 Cascade Energy, Inc.24
Simplest Reliable method, cont.
• can be impossible to measure.• Easier to measure water heat gain rate than milk heat loss for
baseline and post water-cooled HXR.
• Need to measure transfer pump runtime per quantity of milk
• Question: Do we also want to allow calc’d from vendor-driven HXR modeling?
Total heat rejection
Portion removed by water

25
Scientific Irrigation Scheduling (SIS)
© 2012 Cascade Energy, Inc.

© 2012 Cascade Energy, Inc.26
Protocol Summary
Eligibility Growers using one of two acceptable SIS methods:1. SIS A: Specific recommendations based on water balance2. SIS B: Grower sees charts of soil moisture and precipitation
Baseline Calculation of theoretical water and pump energy requirement
Upgrade 10% water and energy savings for SIS A6.67% water and energy savings for SIS BOnly one calculation method – Simplest Reliable Method
Key equations
Pump station efficiency estimated using pump size, type and TDH

© 2012 Cascade Energy, Inc.27
SIS A
– 2005 Quantec Phase II Study indicating 10% water savings was based on active soil water balance modeling and significant consultant involvement and recommendations. This is SIS A method.
– Best practice is to perform Quantec study procedure on each field.– Simplest reliable method is to use the 10% average from the study.– For SIS A, is the Simplest Reliable Savings Procedure accurate to within
20% of best practice? • Probably, but only in bulk. • No reliable data since the Phase II report to confirm 10% estimate.• Individual growers using SIS A sometimes increase water and energy usage.

© 2012 Cascade Energy, Inc.28
SIS B
– ETO program accepts real time soil moisture monitoring with periodic reports to grower. A lower threshold than Phase II study. Efficacy is not known. This is SIS B method.
– SIS B best practice is performing the same water balance calculations as SIS A on fields using SIS B.
– Cascade recommends a simplest reliable method of using 6.67% water savings for SIS B until further data is available.
– For SIS B, is the Simplest Reliable Savings Procedure accurate to within 20%?
• Unknown. 2/3 of SIS A savings is an estimate only.• Other issues from SIS A remain, savings estimates are bulk values, across many projects.
No recent data to confirm.
© 2012 Cascade Energy, Inc.29
Next steps
• Cascade will present final protocols at November RTF meeting
• We welcome any feedback between now and then
Zach Podell-Eberhardt [email protected] Travis [email protected] Phillips [email protected] Koski [email protected]