© 2008 pearson addison-wesley. all rights reserved 8-3-1 chapter 1 section 8-3 equations of lines...
TRANSCRIPT

© 2008 Pearson Addison-Wesley. All rights reserved
8-3-1
Chapter 1
Section 8-3Equations of Lines and Linear Models
© 2008 Pearson Addison-Wesley. All rights reserved
8-3-2
Equations of Lines and Linear Models
• Point-Slope Form
• Slope-Intercept Form
• Summary of Forms and Linear Equations
• Linear Models
© 2008 Pearson Addison-Wesley. All rights reserved
8-3-3
Point-Slope Form
The equation of the line through (x1, y1) with slope m is written in point-slope form as
1 1( ).y y m x x

© 2008 Pearson Addison-Wesley. All rights reserved
8-3-4
Example: Finding an Equation Given the Slope and a Point
Find the standard form of an equation of the line with slope 1/3, passing through the point (–3, 2).
Solution
1 1( )y y m x x 1
2 ( ( 3))3
y x
3 6 3y x
3 9x y Standard form
Multiply by 3
© 2008 Pearson Addison-Wesley. All rights reserved
8-3-5
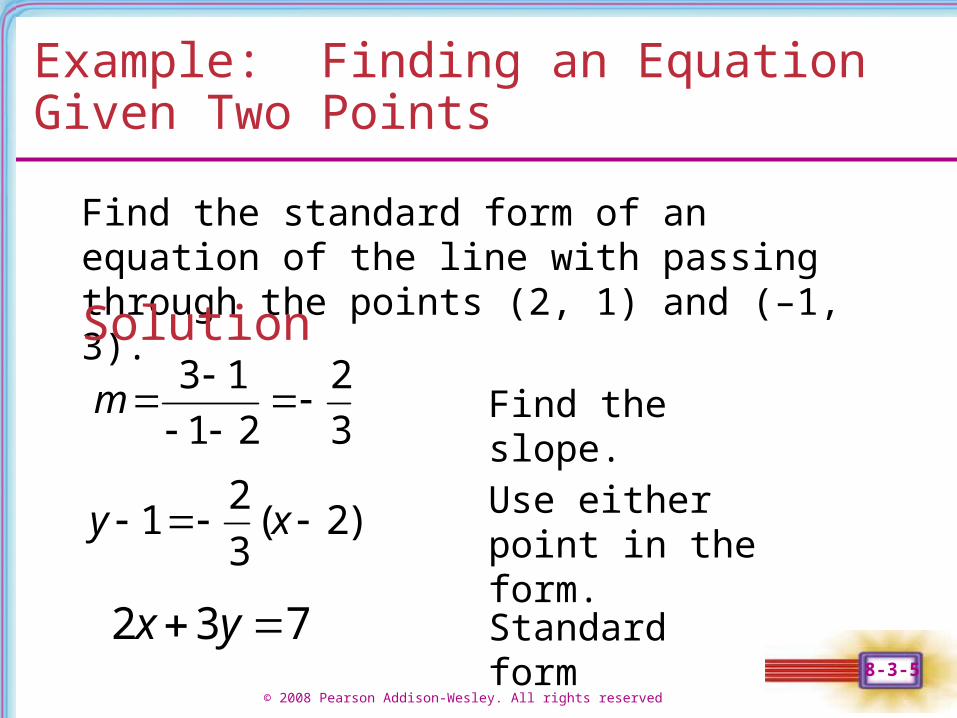
Example: Finding an Equation Given Two Points
Find the standard form of an equation of the line with passing through the points (2, 1) and (–1, 3).
Solution3 1 2
1 2 3m
21 ( 2)
3y x
2 3 7x y Standard form
Find the slope.
Use either point in the form.
© 2008 Pearson Addison-Wesley. All rights reserved
8-3-6
Slope-Intercept Form
The equation of the line with slope m and y-intercept (0, b) is written in slope-intercept form as
.y mx b
Slope y-intercept
© 2008 Pearson Addison-Wesley. All rights reserved
8-3-7
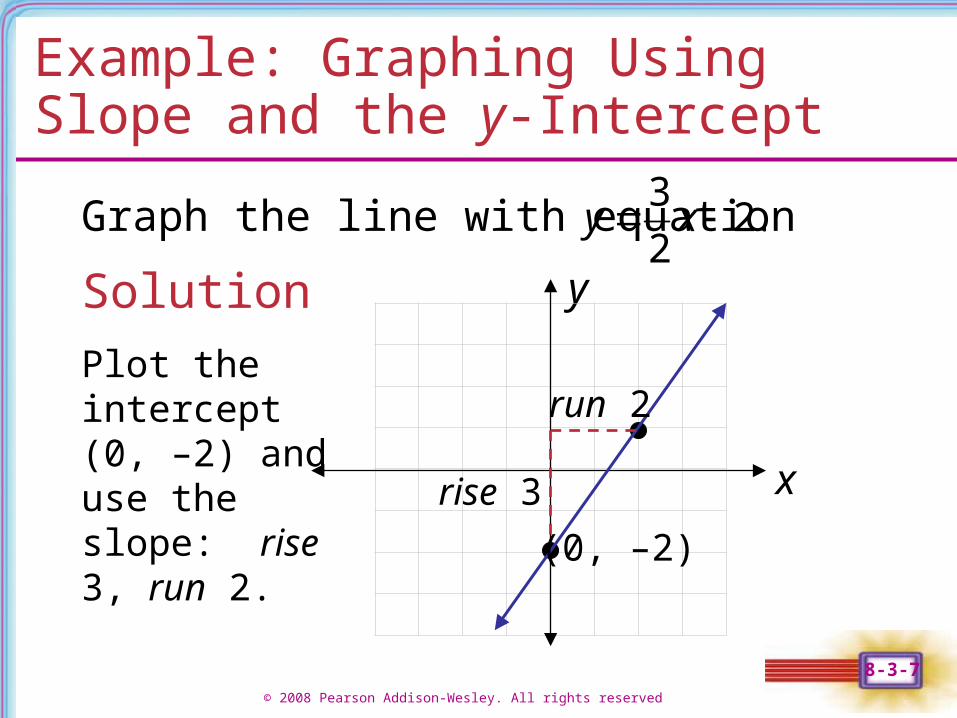
Example: Graphing Using Slope and the y-Intercept
y
x
Graph the line with equation
Solution
32.
2y x
Plot the intercept (0, –2) and use the slope: rise 3, run 2.
rise 3
run 2
(0, –2)

© 2008 Pearson Addison-Wesley. All rights reserved
8-3-8
Summary of Forms of Linear Equations
y mx b
y b
x a
1 1( )y y m x x
Ax By C Standard form
Horizontal line
Vertical line
Slope-intercept form
Point-Slope form

© 2008 Pearson Addison-Wesley. All rights reserved
8-3-9
Linear Models
Earlier examples gave equations that described real data. The process of writing an equation to fit a graph is called curve-fitting. The next example illustrates this concept for a straight line. The resulting equation is called a linear model.
© 2008 Pearson Addison-Wesley. All rights reserved
8-3-10
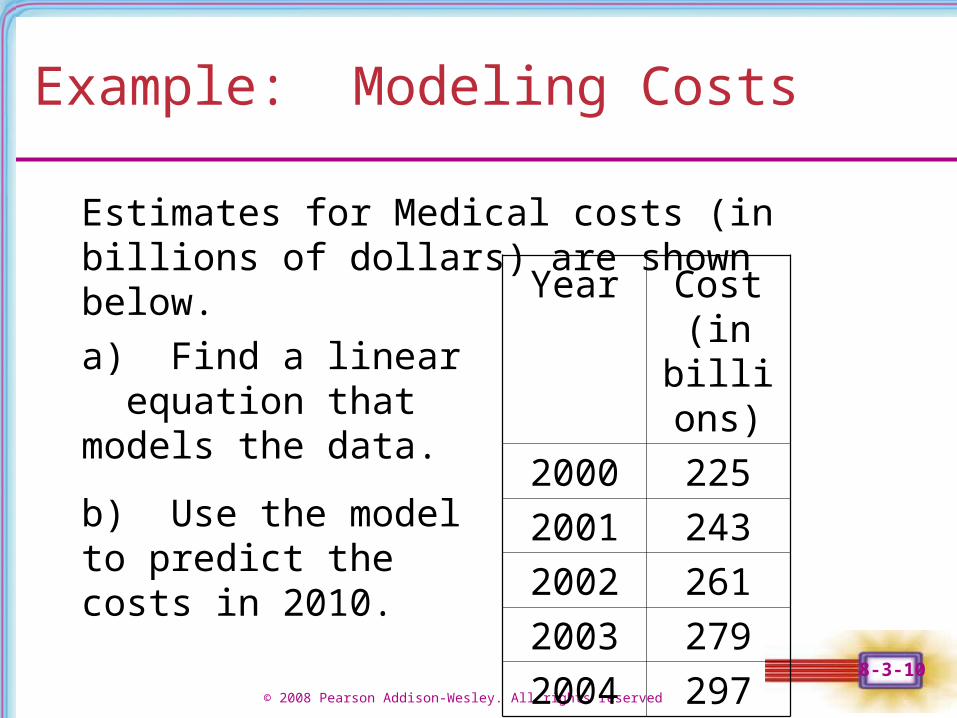
Example: Modeling Costs
Estimates for Medical costs (in billions of dollars) are shown below.
Year Cost (in billions)
2000 225
2001 243
2002 261
2003 279
2004 297
a) Find a linear equation that models the data.
b) Use the model to predict the costs in 2010.

© 2008 Pearson Addison-Wesley. All rights reserved
8-3-11
Example: Medical Costs
SolutionLet x = 0 correspond to 2000, x = 1 correspond to 2001, and so on. We can express the data as ordered pairs:
(0, 225), (1, 243), (2, 261), (3, 279), and (4, 297).
a) To find a linear equation through the data we choose two points to get the slope. Using (0, 225) and (3, 279): 279 225 54
18.3 0 3
m

© 2008 Pearson Addison-Wesley. All rights reserved
8-3-12
Example: Medical Costs
Solution (continued)
Now since we have the y-intercept (0, 225) we have the equation
b) The value x = 10 corresponds to the year 2010. When x = 10,
18 225.y x
18(10) 225 405y
The model predicts that the costs will be $405 billion in 2010.