© 2008 michael smitka 1 japan’s bubble economics 102 winter 2008 michael smitka professor of...
Post on 19-Dec-2015
228 views
TRANSCRIPT

© 2008 Michael Smitka 1
Japan’s Bubble
Economics 102Winter 2008
Michael SmitkaProfessor of Economics
Washington and Lee University

© 2008 Michael Smitka 2
Two Three key causes
• Management geared for high growth
Interacting with
• Macroeconomic policy mistakes
– Including failure to improve regulation in the face of innovation in the financial sector
• Savings imbalance generated large shifts in flow-of-funds, swamping capability of financial system
© 2008 Michael Smitka 3
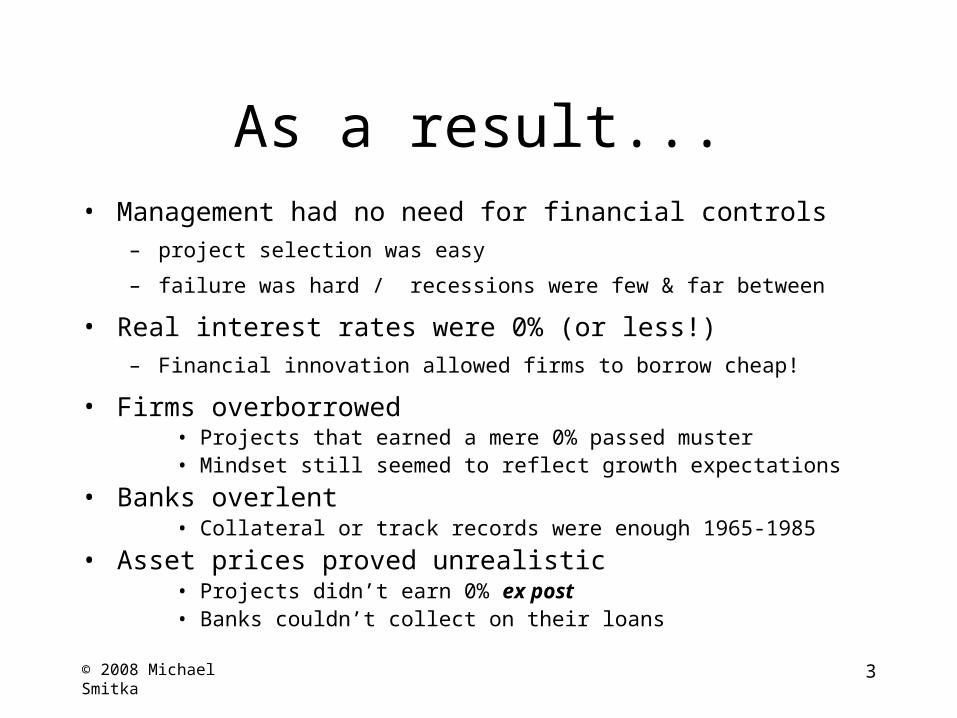
As a result...• Management had no need for financial controls
– project selection was easy
– failure was hard / recessions were few & far between
• Real interest rates were 0% (or less!)– Financial innovation allowed firms to borrow cheap!
• Firms overborrowed• Projects that earned a mere 0% passed muster• Mindset still seemed to reflect growth expectations
• Banks overlent• Collateral or track records were enough 1965-1985
• Asset prices proved unrealistic• Projects didn’t earn 0% ex post • Banks couldn’t collect on their loans

© 2008 Michael Smitka 4
Confounding factor
• Pricing long-lived assets is hard– Real estate grew faster than economy 1974-1991
– Stock prices grew faster than economy 1965-1989
– Growth industries grew very fast indeed!!
• Real growth averaged 9.3% during 1956-1973
• Unrealistic price expectations dominated
– Prices on real estate were distorted
• No relation to rents, only expected price appreciation
– Prices on stocks were distorted
• Little relation to dividend levels, rather assets and past growth

© 2008 Michael Smitka 5
Why the “bubble”?- the lending side -
• Change undermines rules of thumb for banks
– Change in types of industry / borrowers
– Change in strategic environment / flow of funds
– Change in regulatory environment
• Mistakes are made …
– … and a shock produces crisis

© 2008 Michael Smitka 6
Primary shockslower growth after 1971
• Industry no longer needs funds• 1970s: 10% of GDP drop in corporate funding needs!!
• But households keep saving• Past savings were when incomes were low
• So accumulated wealth was modest
• So people needed to keep saving to fund old age
• Who then will borrow this funds?• Paradox of Thrift!!
– No discipline by banks…

© 2008 Michael Smitka 7
Japanese GDP GrowthReal Seasonally Adjusted Year-on-Year, SNA68 thru 1995, SNA93 thereafter, 2000 chained from 1995
-3.0%
-2.0%
-1.0%
0.0%
1.0%
2.0%
3.0%
4.0%
5.0%
6.0%
7.0%
8.0%
9.0%
10.0%
11.0%
12.0%
13.0%
14.0%
15.0%
1956195719581959196019611962196319641965196619671968196919701971197219731974197519761977197819791980198119821983198419851986198719881989199019911992199319941995199619971998199920002001200220032004200520062007

© 2008 Michael Smitka 8
Japanese GDP GrowthReal Seasonally Adjusted Year-on-Year, SNA68 thru 1995, SNA93 thereafter, 2000 chained from 1995
-3.0%
-2.0%
-1.0%
0.0%
1.0%
2.0%
3.0%
4.0%
5.0%
6.0%
7.0%
8.0%
9.0%
10.0%
11.0%
12.0%
13.0%
14.0%
15.0%
1956195719581959196019611962196319641965196619671968196919701971197219731974197519761977197819791980198119821983198419851986198719881989199019911992199319941995199619971998199920002001200220032004200520062007

© 2008 Michael Smitka 9

© 2008 Michael Smitka 10
Shifts in Japanese Savings Flows
1961-65 1966-70 1970 1971-75 1976 1976-80 1981-85 1986-92I (business) 17.0 16.7 19.6 15.2 8.8 8.3 8.5 11.1
S (business) 5.2 8.7 10.7 4.0 0.8 2.7 2.9 2.3S - I -11.7 -8.0 -8.9 -11.2 -8 -5.7 -5.5 -8.8
I (household) 2.8 4.3 4.5 4.0 7 6.1 2.8 1.3S (household) 12.1 12.0 12.8 16.4 19.9 17.1 13.6 11.6S - I 9.2 7.7 8.3 12.4 12.9 11.0 10.8 10.3
S - I Private -2.5 -0.3 -0.6 1.2 4.9 5.3 5.3 1.5
I (Center 5.5 5.7 5.7 6.9 6.5 7.5 6.8 6.4S & Local) 6.9 6.6 7.6 6.7 2.3 2.4 3.6 8.3T - G 1.4 0.9 1.9 -0.2 -4.2 -5.1 -3.2 1.9
T - G + S - I -1.1 0.6 1.3 1.0 0.7 0.3 2.0 3.4

© 2008 Michael Smitka 11
Reactions to slowdown
• High “S” so “C” did not rise to offset “I” – “paradox of thrift”
• Reactions:– In the 1970s, fiscal stimulus
• From 1976-80 helped by trade
– From 1980 monetary policy kicked in• Trade dominated as fiscal stimulus ended• Especially during 1980-1987
– From 1987-1991 the “bubble” took over• I rose, S fell (C rose) … but the bubble popped
– Thereafter massive fiscal stimulus

© 2008 Michael Smitka 12
Interregnum
• Japanese fiscal deficits• created a new borrower for banks• MOF policy stopped that by 1982
• Reaganomics: US consumption boom• Export-led growth in Japan from 1982• ¥ rise (Plaza Accord) ended that from 1986
• So how adapt?• Easy money!!!• But in the interim financial markets evolved…

© 2008 Michael Smitka 13
Secondary Shock
• Bad monetary policy– with hindsight
– Easy money from 1986, following Plaza Accord • Kept low after Oct 19, 1987 US stock market crash
– Only hiked interest rates from May 1989• Low rates for 3-1/2 years
– Then overdid it: repeated boosts thru Aug 1990• Didn’t cut until July 1991, with both stock and real estate
markets plummeting

© 2008 Michael Smitka 14
Financial evolution & deregulation
• Starting point• regulated deposit rates• segmented markets (cf. Glass-Steagal)
• Deficits led to bond markets• Deposit rates gradually liberalized
– Other rules as well (international flows)
• Large firms became multinational– Could borrow directly in London
• Disintermediation resulted– dikes broke– Banks had to scramble

© 2008 Michael Smitka 15
0
5
10
15
20
25
30
35
40
45
1960 1965 1970 1975 1980 1985 1990 1995 2000 2005
Bank loans
Bonds
Retained earnings
Paid-in capital
Contemporary Financing Sources(% of total assets, large manufacturing firms)
Source: MOF, Financial Statements Statistics of Corporations

© 2008 Michael Smitka 16
QuickTime™ and aTIFF (Uncompressed) decompressor
are needed to see this picture.
Bank Lending: Total & Ratio to GDP

© 2008 Michael Smitka 17
Bubble psychology
• “Japan as Number One” psychology• Growth and profits will remain high• But slow growth meant historic debt levels suicidal!
• Just as banks sought new borrowers• Real estate … and more real estate!
– Small business
– Also international loans
• Sectors where banks had little or no experience…• Collateral & reputation as basis for loans
– cash flow-based credit analysis not done (or done poorly).

© 2008 Michael Smitka 18
Impact• “Bubble” economy
– Stock prices doubled– Urban real estate prices rose even more
• Example: Onoue– Only $2 billion in a $5 trillion economy
• But repeated many, many times over– pencil buildings, golf, stocks
• Fiscal policy mistakes accentuated• On-again, off-again policy built up debt• Created fear of using fiscal policy aggressively
• Regulatory policy errors accentuated• Banks allowed to make more bad loans

© 2008 Michael Smitka 19
100
150
200
250
300
350
400
450
500
550
600
1980 1983 1986 1989 1992 1995 1998 2001 2004 2007
Index, 1980=100
Share prices (Nikkei)
Property-based loans
GDP
Land prices
Lending and Asset Prices1980=100

© 2008 Michael Smitka 20
In the end…
• Lots of poor-quality investments got funded• Projects didn’t even earn 0% ex post
• Lots of poor-quality borrowers got money• Banks’ inexperience led to disastrous lending
• Asset prices proved unrealistic• Collateral proved inadequate or even worthless• Banks’ equity (including unrealized capital gains on
investments in companies) shrank rapidly
• Major recession• 2nd bout of negative growth since 1955
© 2008 Michael Smitka 21
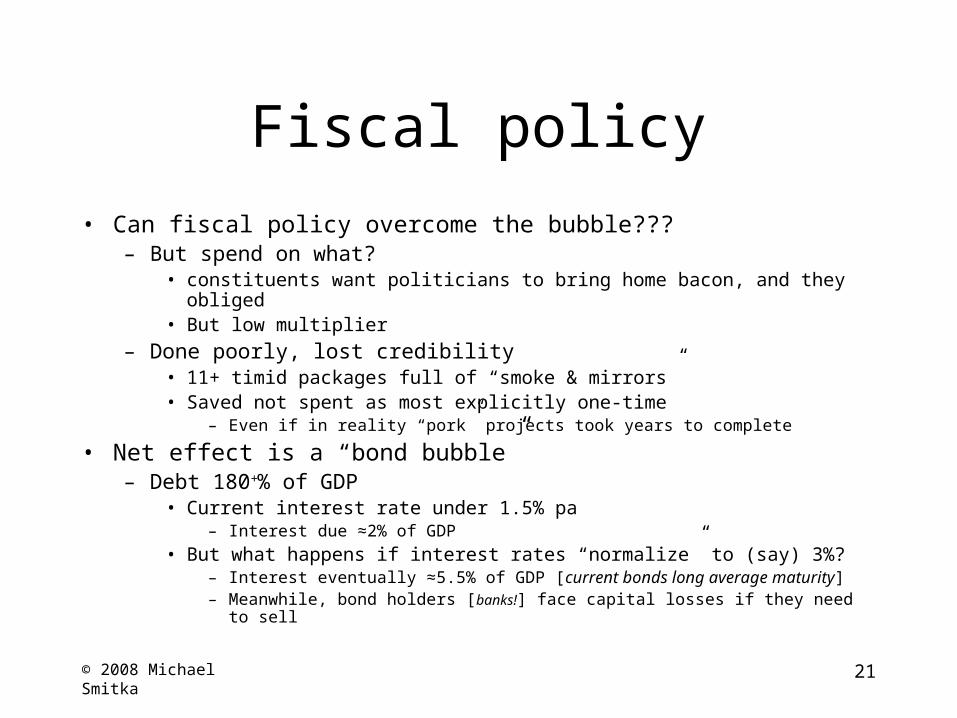
Fiscal policy
• Can fiscal policy overcome the bubble???– But spend on what?
• constituents want politicians to bring home bacon, and they obliged• But low multiplier
– Done poorly, lost credibility• 11+ timid packages full of “smoke & mirrors”• Saved not spent as most explicitly one-time
– Even if in reality “pork” projects took years to complete
• Net effect is a “bond bubble”– Debt 180+% of GDP
• Current interest rate under 1.5% pa– Interest due ≈2% of GDP
• But what happens if interest rates “normalize” to (say) 3%?– Interest eventually ≈5.5% of GDP [current bonds long average maturity] – Meanwhile, bond holders [banks!] face capital losses if they need to sell

© 2008 Michael Smitka 22
deficits
QuickTime™ and aTIFF (Uncompressed) decompressor
are needed to see this picture.

© 2008 Michael Smitka 23
Monetary Policyif FP didn’t work, how about MP?
• Banks had lots of “zombie” borrowers• But little capital as value of stock holdings collapsed
– So reluctant to push dud firms into bankruptcy• Plus few lawyers or workout specialists
• How pump up capital ratio?– Stop making new loans!
• Shrinks denominator, as long as don’t have to write down for bad loans
• “Credit crunch”• Visible in many sectors in 1998-99

© 2008 Michael Smitka 24
Bank panic
• Gradual write-downs by large banks– US$300 billion between 1992 & 1998
– Japan’s GDP is about $5 trillion
– Several failures of specialized banks in 1995– Mishandled, made regulators slow to support large banks
– Series of dramatic bank failures in 1997– 4 major banks– 1 major life insurer– #2 stock broker
– ¥6 trillion capital injection by govt in March 1999– Helped offset continued writedown of bad loans– Mergers from 2000 left 3 large nationwide banking groups
© 2008 Michael Smitka 25
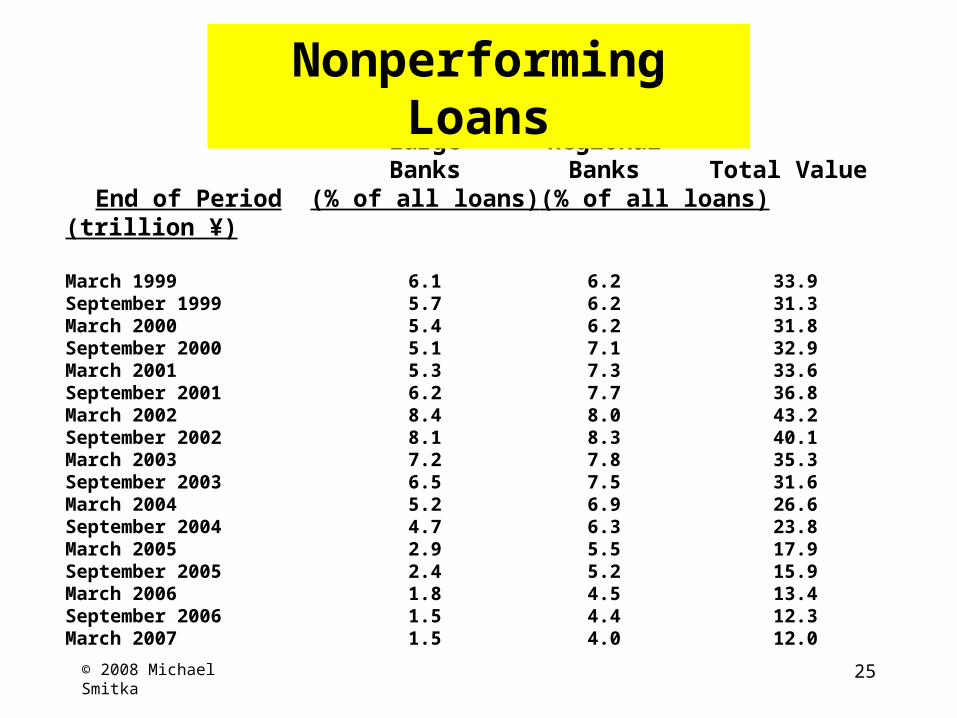
Large RegionalBanks Banks Total Value
End of Period (% of all loans) (% of all loans) (trillion ¥)
March 1999 6.1 6.2 33.9September 1999 5.7 6.2 31.3March 2000 5.4 6.2 31.8September 2000 5.1 7.1 32.9March 2001 5.3 7.3 33.6September 2001 6.2 7.7 36.8March 2002 8.4 8.0 43.2September 2002 8.1 8.3 40.1March 2003 7.2 7.8 35.3September 2003 6.5 7.5 31.6March 2004 5.2 6.9 26.6September 2004 4.7 6.3 23.8March 2005 2.9 5.5 17.9September 2005 2.4 5.2 15.9March 2006 1.8 4.5 13.4September 2006 1.5 4.4 12.3March 2007 1.5 4.0 12.0
Nonperforming Loans
© 2008 Michael Smitka 26
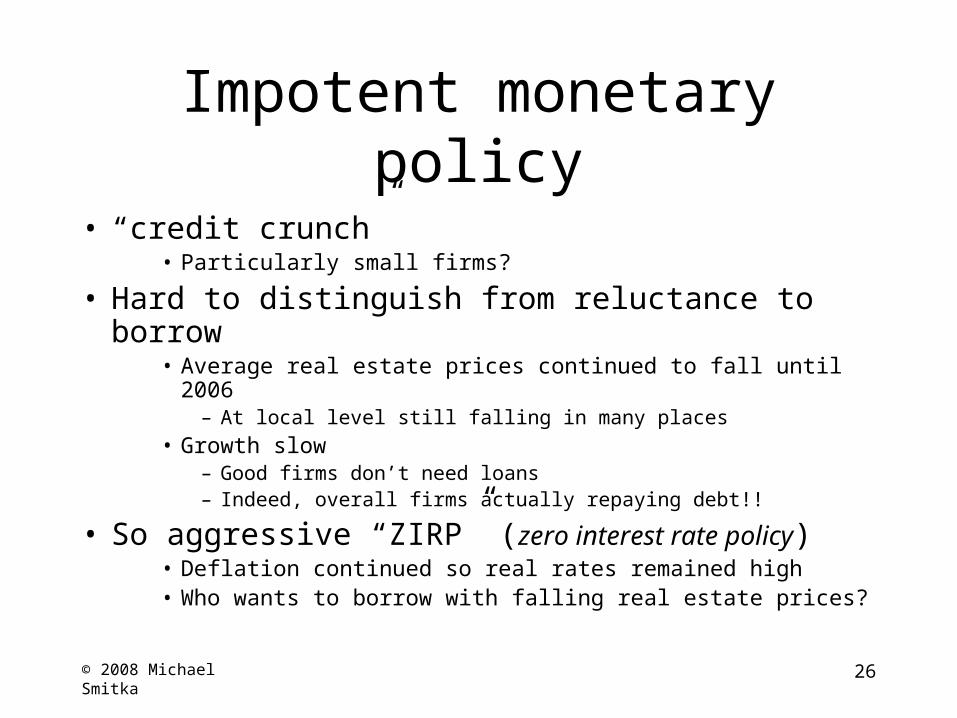
Impotent monetary policy
• “credit crunch” • Particularly small firms?
• Hard to distinguish from reluctance to borrow• Average real estate prices continued to fall until 2006
– At local level still falling in many places
• Growth slow– Good firms don’t need loans– Indeed, overall firms actually repaying debt!!
• So aggressive “ZIRP” (zero interest rate policy)• Deflation continued so real rates remained high• Who wants to borrow with falling real estate prices?
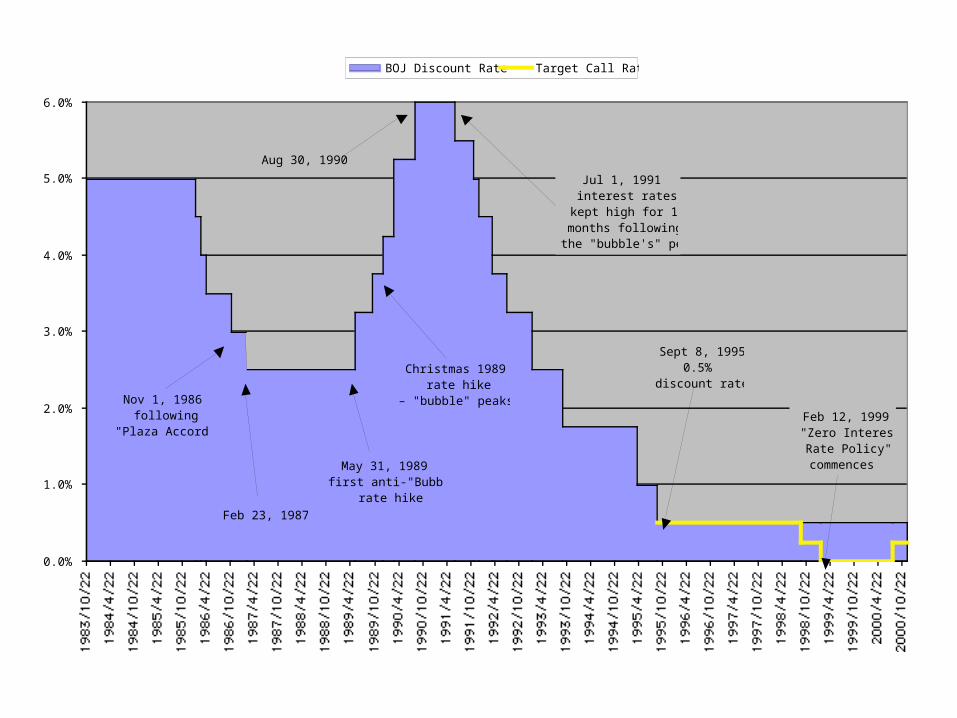
0.0%
1.0%
2.0%
3.0%
4.0%
5.0%
6.0%
1983/10/221984/4/22
1984/10/221985/4/22
1985/10/221986/4/22
1986/10/221987/4/22
1987/10/221988/4/22
1988/10/221989/4/22
1989/10/221990/4/22
1990/10/221991/4/22
1991/10/221992/4/22
1992/10/221993/4/22
1993/10/221994/4/22
1994/10/221995/4/22
1995/10/221996/4/22
1996/10/221997/4/22
1997/10/221998/4/22
1998/10/221999/4/22
1999/10/222000/4/22
2000/10/22
BOJ Discount Rate Target Call Rate
Nov 1, 1986following
"Plaza Accord"
Feb 23, 1987
May 31, 1989first anti-"Bubble"
rate hike
Aug 30, 1990
Jul 1, 1991interest rates
kept high for 18months following
the "bubble's" peak
Sept 8, 19950.5%
discount rate!!
Feb 12, 1999"Zero InterestRate Policy"commences
Christmas 1989rate hike
– "bubble" peaks –
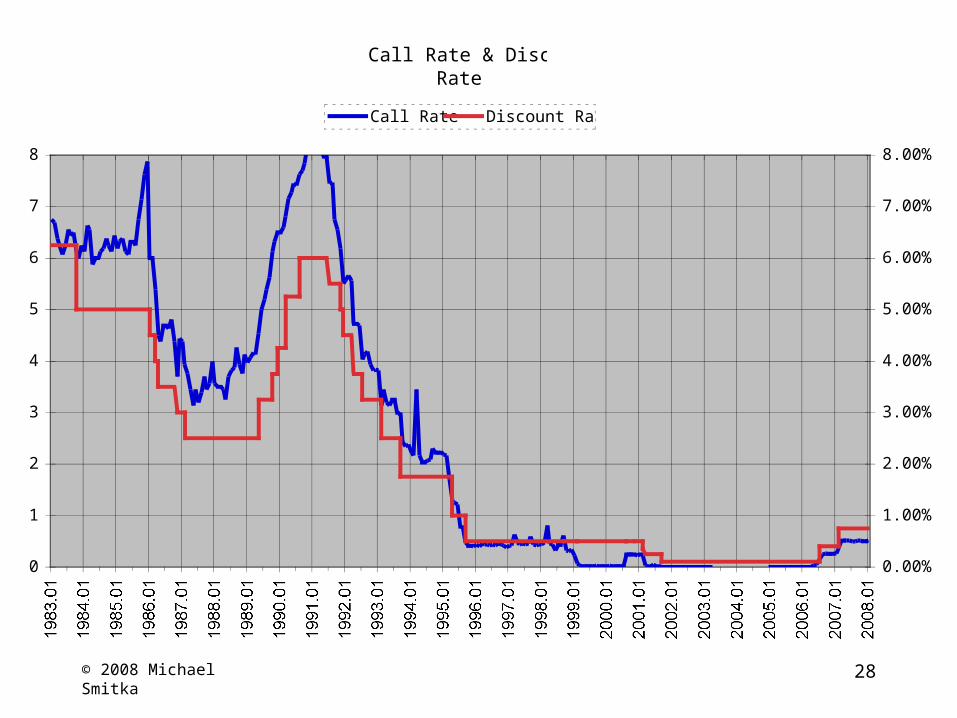
© 2008 Michael Smitka 28
Call Rate & Discount Rate
0
1
2
3
4
5
6
7
8
1983.011984.011985.011986.011987.011988.011989.011990.011991.011992.011993.011994.011995.011996.011997.011998.011999.012000.012001.012002.012003.012004.012005.012006.012007.012008.01
0.00%
1.00%
2.00%
3.00%
4.00%
5.00%
6.00%
7.00%
8.00%
Call Rate Discount Rate

© 2008 Michael Smitka 29
CPI Inflation in Japannational avg excluding imputed rent
-2.0%
-1.5%
-1.0%
-0.5%
0.0%
0.5%
1.0%
1.5%
2.0%
2.5%
3.0%
3.5%
4.0%
4.5%
5.0%
1982 Jan1982 Jul1983 Jan1983 Jul1984 Jan1984 Jul1985 Jan1985 Jul1986 Jan1986 Jul1987 Jan1987 Jul1988 Jan1988 Jul1989 Jan1989 Jul1990 Jan1990 Jul1991 Jan1991 Jul1992 Jan1992 Jul1993 Jan1993 Jul1994 Jan1994 Jul1995 Jan1995 Jul1996 Jan1996 Jul1997 Jan1997 Jul1998 Jan1998 Jul1999 Jan1999 Jul2000 Jan2000 Jul2001 Jan2001 Jul2002 Jan2002 Jul2003 Jan2003 Jul2004 Jan2004 Jul2005 Jan2005 Jul2006 Jan2006 Jul2007 Jan2007 Jul2008 Jan
Bubble peak

© 2008 Michael Smitka 30
Today’s Dilemmas
• Monetary policy doesn’t work• Interest rates can’t be pushed below 0%• But prices are falling ==> real rates are positive
• Banks (rightly) fear bad assets• Outstanding loans are shrinking!• Money growth is of cash…
• “Liquidity Trap”• If monetary policy doesn’t work, how about fiscal??
• Labor markets still have slack• “Lost Generation”? - participation rates drop…

© 2008 Michael Smitka 31

© 2008 Michael Smitka 32
Male LF Participation
93.5
94.0
94.5
95.0
95.5
96.0
96.5
97.0
97.5
98.0
98.5
1968* 1969* 1970* 1971* 1972* 1973*19731974197519761977197819791980198119821983198419851986198719881989199019911992199319941995199619971998199920002001200220032004200520062007
25 29
30 34
35 39
50 54

© 2008 Michael Smitka 33
Future of the Economy
• Some financial sector problems remain– Low profitability so vulnerable to shocks
• Working age population is shrinking– Supply-side potential growth is thus 1-1.5% pa
• Population shrinking, so higher per capita!
• Aging population structure– Will need to boost taxes / transfers
• But starting point is high deficit and high debt!

© 2008 Michael Smitka 34
Japanese GDP GrowthReal Seasonally Adjusted Year-on-Year, SNA68 thru 1995, SNA93 thereafter, 2000 chained from 1995
-3.0%
-2.0%
-1.0%
0.0%
1.0%
2.0%
3.0%
4.0%
5.0%
6.0%
7.0%
8.0%
9.0%
10.0%
11.0%
12.0%
13.0%
14.0%
15.0%
1956195719581959196019611962196319641965196619671968196919701971197219731974197519761977197819791980198119821983198419851986198719881989199019911992199319941995199619971998199920002001200220032004200520062007

© 2008 Michael Smitka 35
QuickTime™ and aTIFF (Uncompressed) decompressor
are needed to see this picture.
OECDComparison
OfMultipleBubble
Experiences:::
Impact ofEquity vs HousingBubbles
––GDP & C

© 2008 Michael Smitka 36
QuickTime™ and aTIFF (Uncompressed) decompressor
are needed to see this picture.
OECDComparison
OfMultipleBubble
Experiences:::
Impact ofEquity vs HousingBubbles
––Bank Loans
& Equity