© 2007 mcgraw-hill higher education. all rights reserved. growth and maturation chapter 6
TRANSCRIPT

© 2007 McGraw-Hill Higher Education. All rights reserved.
Growth and Maturation
Chapter 6
© 2007 McGraw-Hill Higher Education. All rights reserved.
Objectives
• Describe techniques for measuring body length and stature across the human lifespan
• Describe techniques for measuring body weight in ambulatory and nonambulatory individuals
• Describe the anticipated changes in body weight across the human lifespan
• Describe techniques for measuring body length and stature
• Describe anticipated changes in body length and stature across the human life span
• Describe techniques for measuring body weight in ambulatory and nonambulatory individuals
• Describe anticipated changes in body weight across the human life span
• Calculate body mass index (BMI) and describe changes in BMI across the human life span
• Describe gender differences associated with “adolescent awkwardness”
• Describe techniques for measuring changes in body proportionsticipated changes in body weight across the human lifespan
© 2007 McGraw-Hill Higher Education. All rights reserved.
Objectives • Describe anticipated changes in proportional body growth for
head length to total body length, head circumference, sitting height, shoulder and hip width, and physique classifications
• Describe the relationship between somatic body proportions and motor performance
• Describe instrumentation used to assess skeletal health• Describe the normal course of skeletal development and the two
mechanisms that operate in the development of bone postnatally
• Explain the role of exercise in development and maintenance of skeletal health
• Describe the difference between chronological age and developmental age and explain four methods for determining developmental age
• Explain the relationship between maturation (developmental age) and motor performance

© 2007 McGraw-Hill Higher Education. All rights reserved.
Level of maturation can influence motor
performance

© 2007 McGraw-Hill Higher Education. All rights reserved.
Measuring Growth in Length and Stature
• Recumbent length is measured from birth until a child is able to stand– Measured from the vertex (highest point on skull) to
the soles of the feet
© 2007 McGraw-Hill Higher Education. All rights reserved.
Measuring Growth in Length and Stature
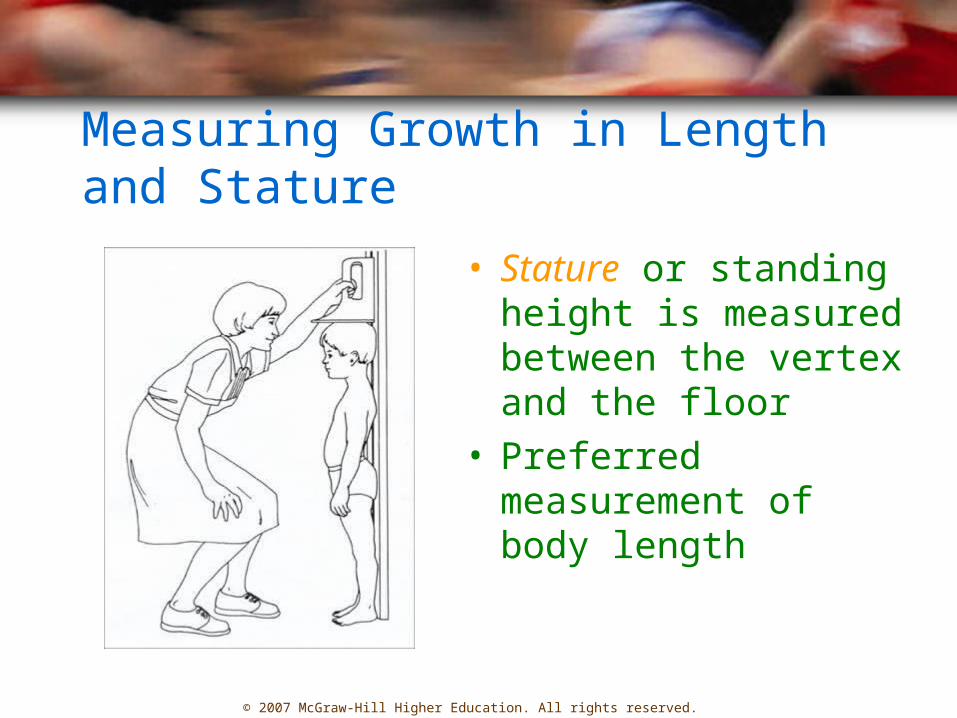
• Stature or standing height is measured between the vertex and the floor
• Preferred measurement of body length
© 2007 McGraw-Hill Higher Education. All rights reserved.
Measuring Growth in Length and Stature
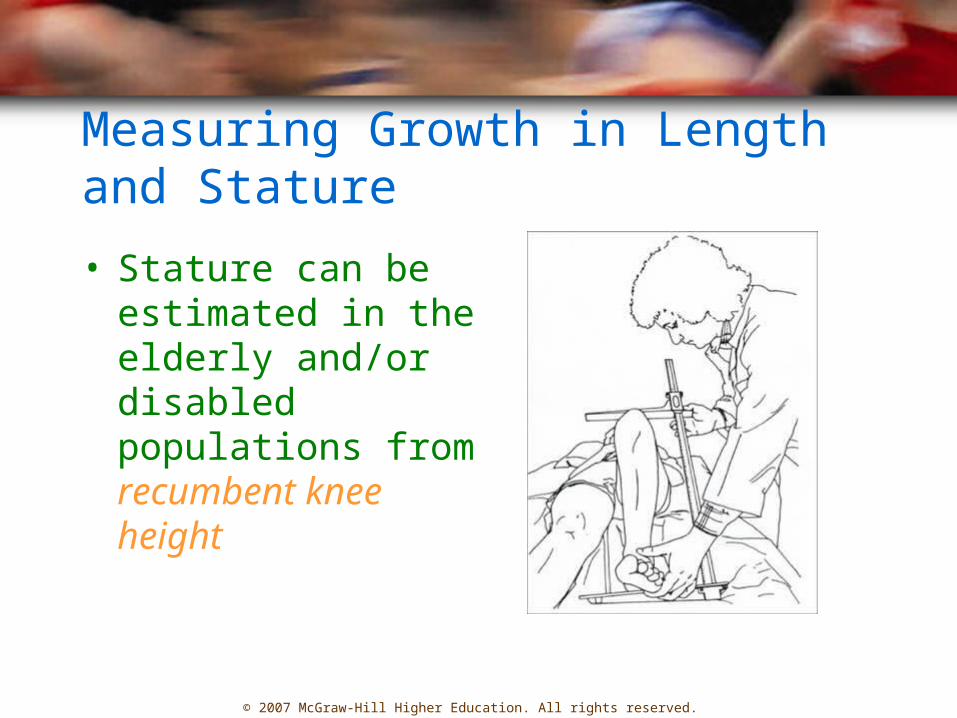
• Stature can be estimated in the elderly and/or disabled populations from recumbent knee height
© 2007 McGraw-Hill Higher Education. All rights reserved.
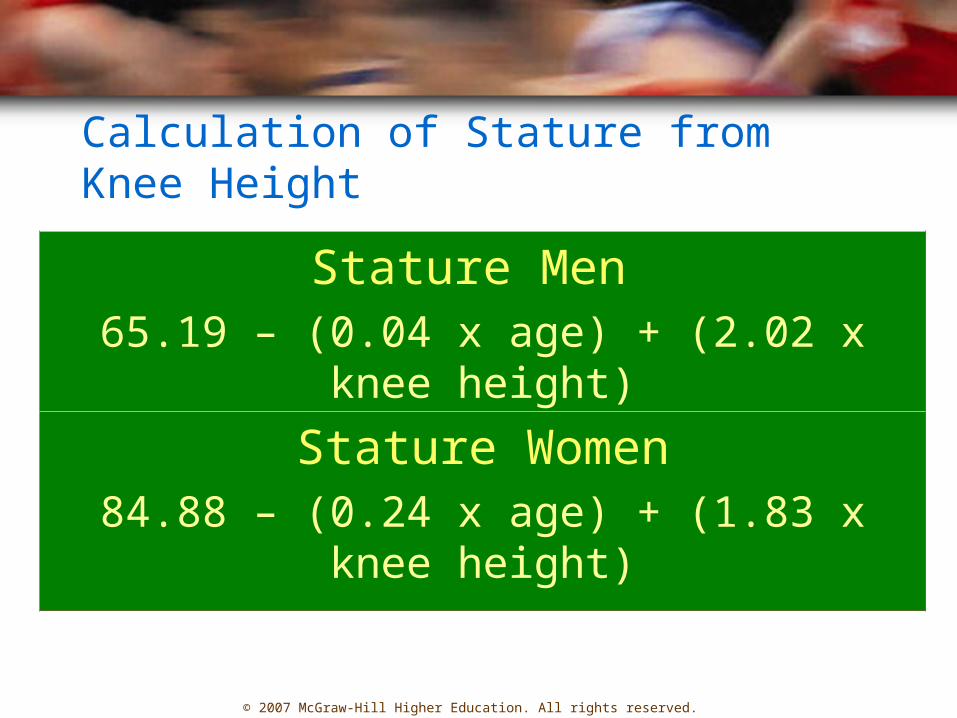
Calculation of Stature from Knee Height
Stature Men 65.19 – (0.04 x age) + (2.02 x knee height)
Stature Women84.88 – (0.24 x age) + (1.83 x knee height)
© 2007 McGraw-Hill Higher Education. All rights reserved.
Growth in Length and Stature
• Zygote ~ 0.14 mm in diameter
• Birth– Boys ~ 20 in– Girls ~ 19.75 in
• Year 1– Boys ~ 30 in– Girls ~ 29.25 in

© 2007 McGraw-Hill Higher Education. All rights reserved.
Growth in Length and Stature
• Year 2– Length increases about 4.75 in
• Year 3-5– Decelerated growth rate to 2.75 in/year
• Year 6-adolescence– Decelerated growth rate to 2.25 in/year
• Midgrowth spurt in height– Between 6.5 and 8.5 years– More common in girls

© 2007 McGraw-Hill Higher Education. All rights reserved.
Growth in Length and Stature
• Adolescence– 20% of adult stature is attained during this 2 ½ to 3
year period– 4 in /yr growth for boys– 3 in/yr growth for girls
• 17.3 years– Median age in females when growth in stature
ceases
© 2007 McGraw-Hill Higher Education. All rights reserved.
Growth in Length and Stature
• 21.2 years– Median age in males when growth in stature ceases– Females attain final 2% of growth in stature
• 20-30 years– Growth of vertebral column may add another 1/8 in
to stature
• 30-45 years– Stature is stable

© 2007 McGraw-Hill Higher Education. All rights reserved.
Growth in Length and Stature
• Above 45 years ~ decrease in stature– Intervertebral disk degeneration– Joint cartilage in lower extremities becomes
thin
© 2007 McGraw-Hill Higher Education. All rights reserved.
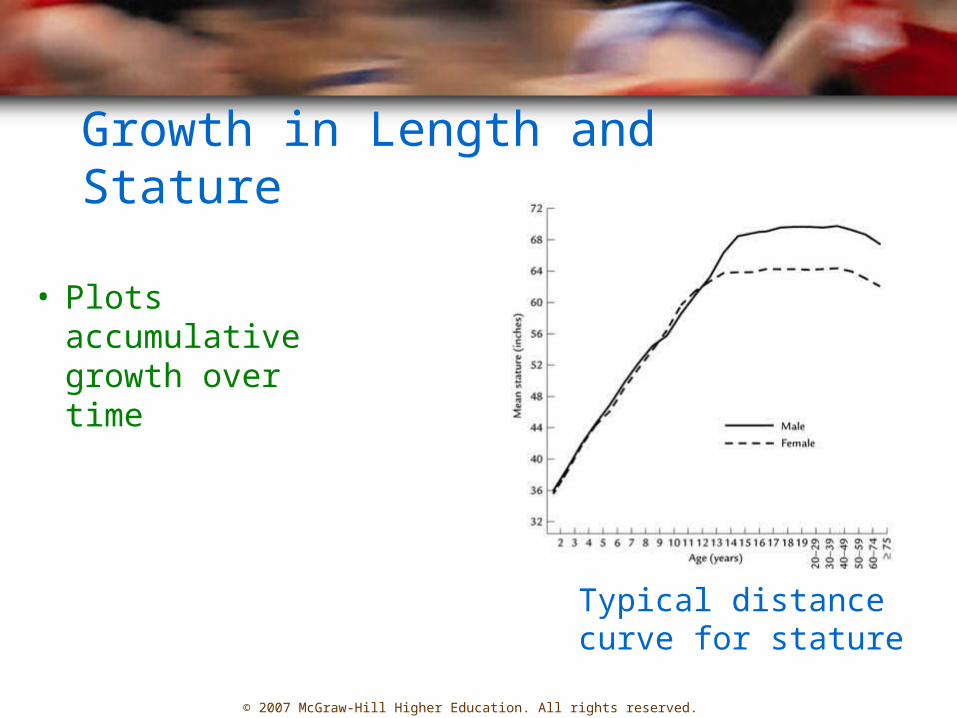
Growth in Length and Stature
• Plots accumulative growth over time
Typical distancecurve for stature

National Center for Health Statistics growthvelocity charts for girlson variable stature
•Plots increments of changeper unit of time•Can determine periods offast and slow growth

http://www.cdc.gov/nccdphp/dnpa/growthcharts/training/modules/module3/text/page3d.htm
Stature-for-Age
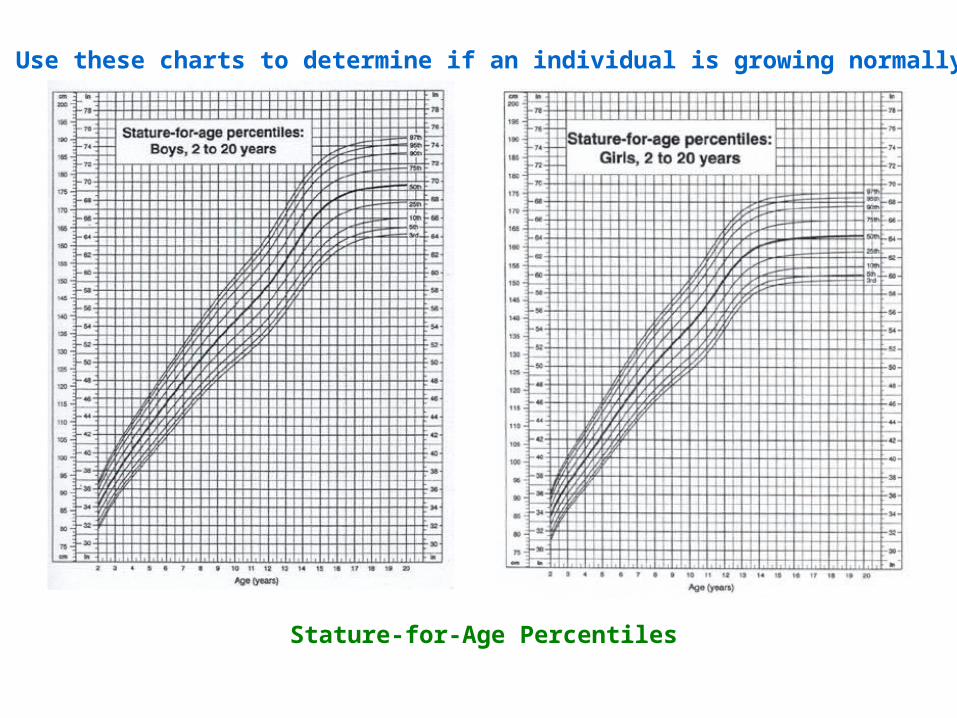
Stature-for-Age Percentiles
Use these charts to determine if an individual is growing normally
© 2007 McGraw-Hill Higher Education. All rights reserved.
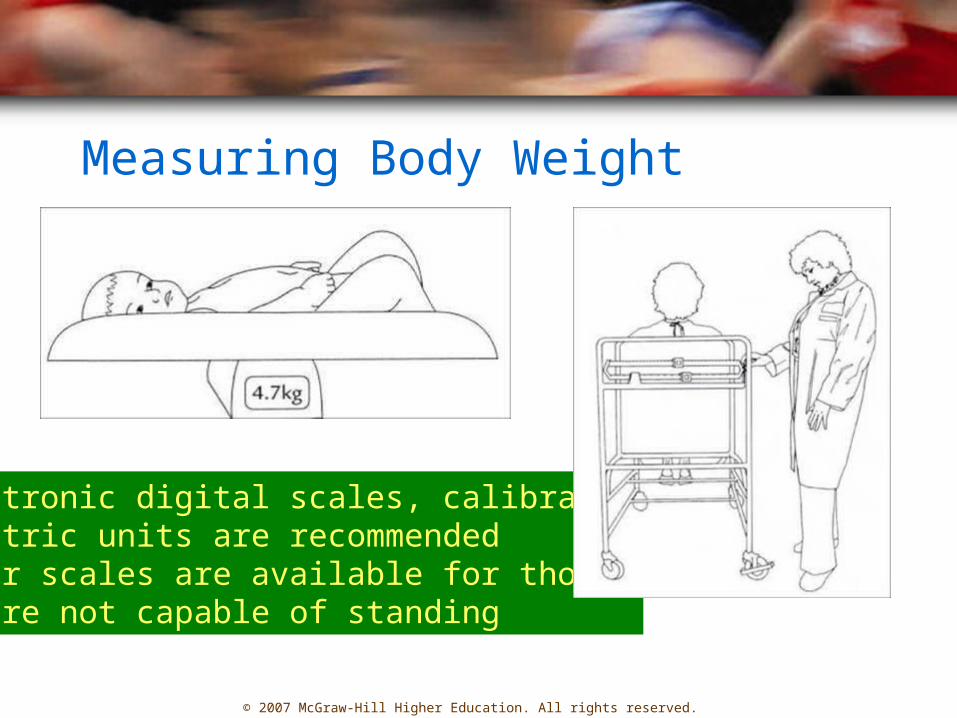
Measuring Body Weight
•Electronic digital scales, calibratedin metric units are recommended •Chair scales are available for thosewho are not capable of standing
© 2007 McGraw-Hill Higher Education. All rights reserved.
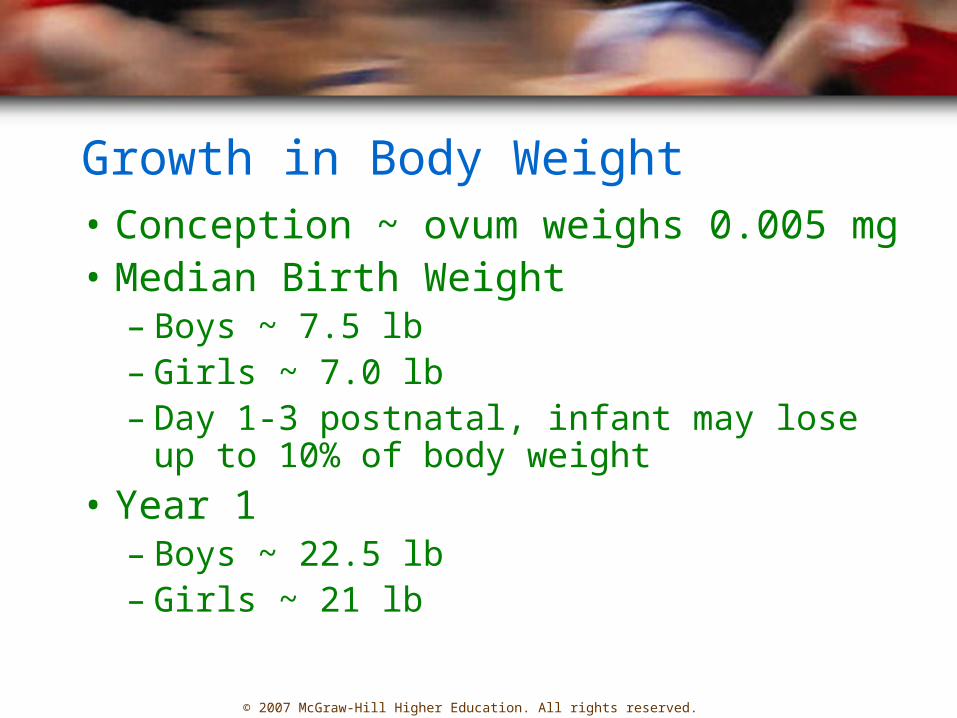
Growth in Body Weight• Conception ~ ovum weighs 0.005 mg• Median Birth Weight
– Boys ~ 7.5 lb– Girls ~ 7.0 lb– Day 1-3 postnatal, infant may lose up to 10%
of body weight
• Year 1– Boys ~ 22.5 lb– Girls ~ 21 lb
© 2007 McGraw-Hill Higher Education. All rights reserved.
Growth in Body Weight
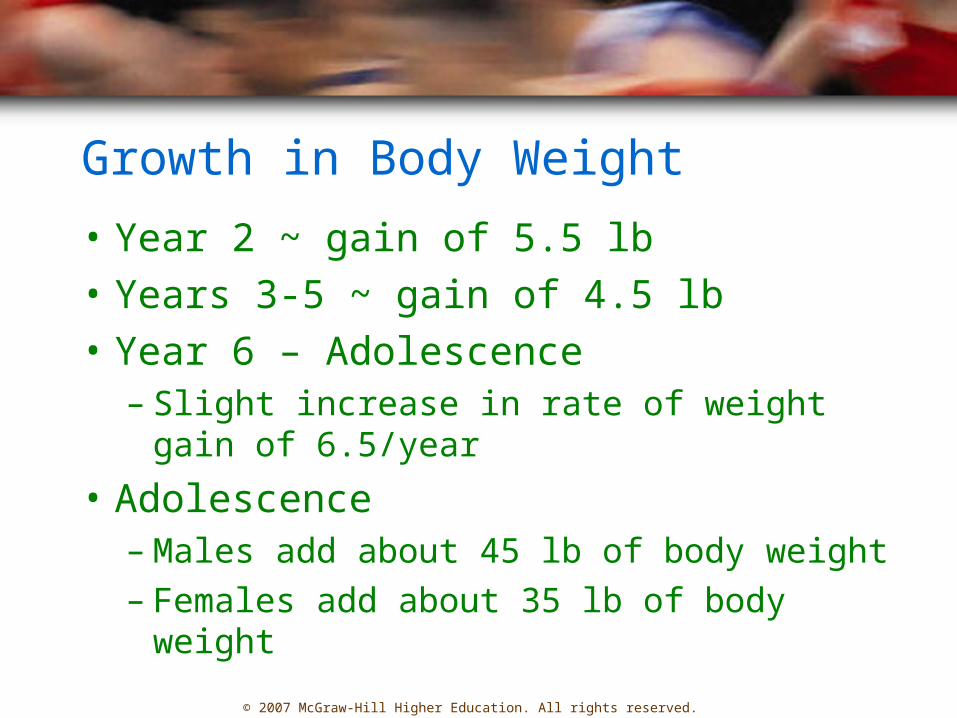
• Year 2 ~ gain of 5.5 lb
• Years 3-5 ~ gain of 4.5 lb
• Year 6 – Adolescence– Slight increase in rate of weight gain of
6.5/year
• Adolescence– Males add about 45 lb of body weight– Females add about 35 lb of body weight
© 2007 McGraw-Hill Higher Education. All rights reserved.
Growth in Body Weight
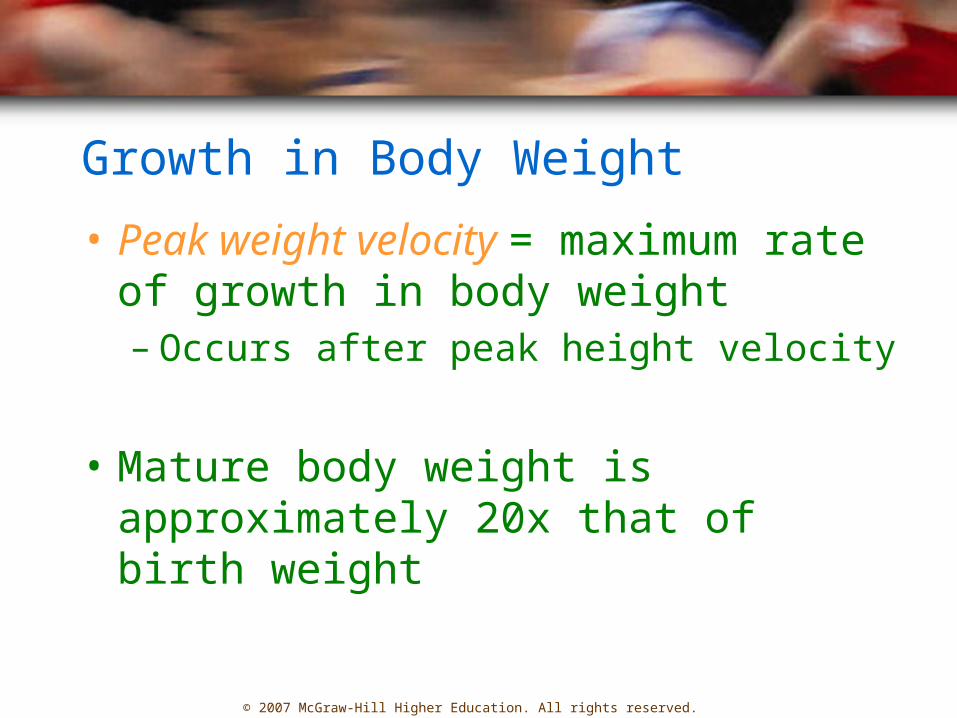
• Peak weight velocity = maximum rate of growth in body weight– Occurs after peak height velocity
• Mature body weight is approximately 20x that of birth weight
© 2007 McGraw-Hill Higher Education. All rights reserved.
Growth in Body Weight
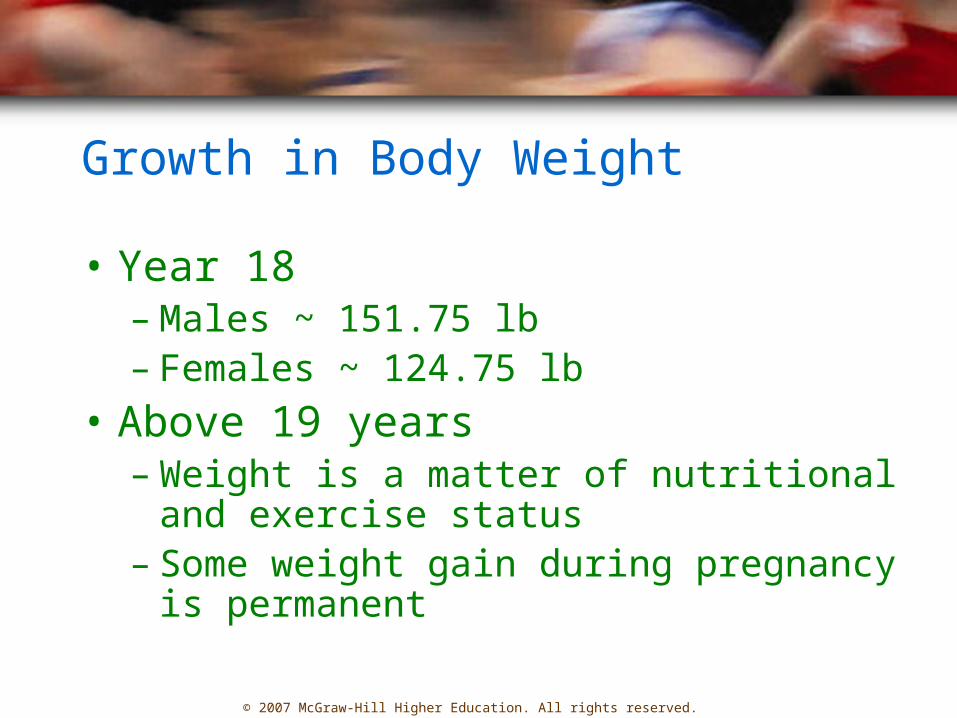
• Year 18– Males ~ 151.75 lb– Females ~ 124.75 lb
• Above 19 years– Weight is a matter of nutritional and exercise
status– Some weight gain during pregnancy is
permanent
© 2007 McGraw-Hill Higher Education. All rights reserved.
Growth in Body Weight
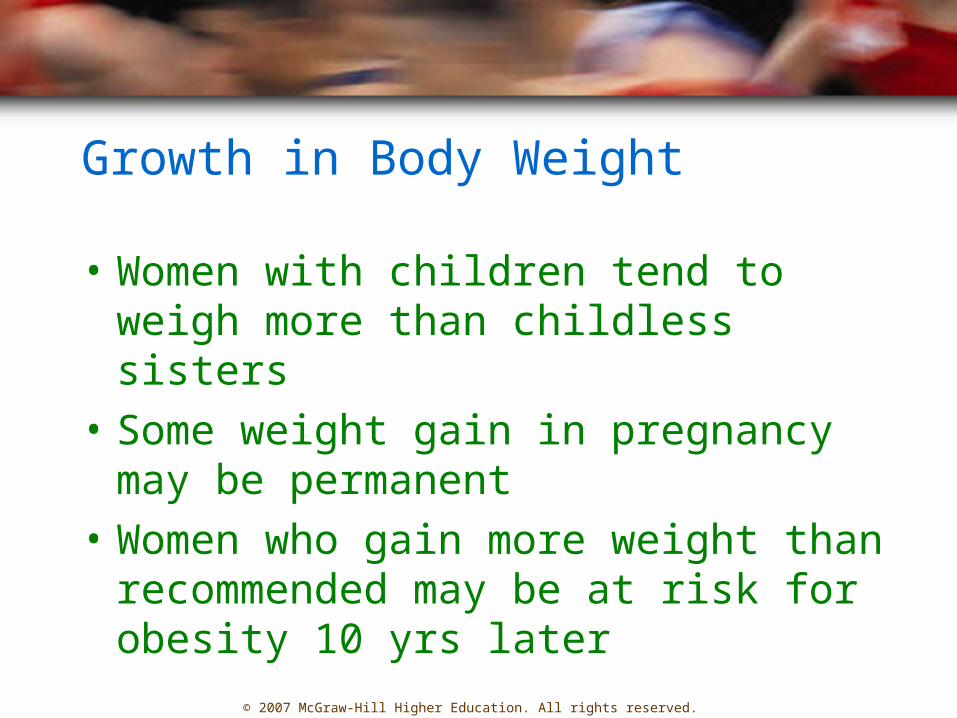
• Women with children tend to weigh more than childless sisters
• Some weight gain in pregnancy may be permanent
• Women who gain more weight than recommended may be at risk for obesity 10 yrs later

© 2007 McGraw-Hill Higher Education. All rights reserved.
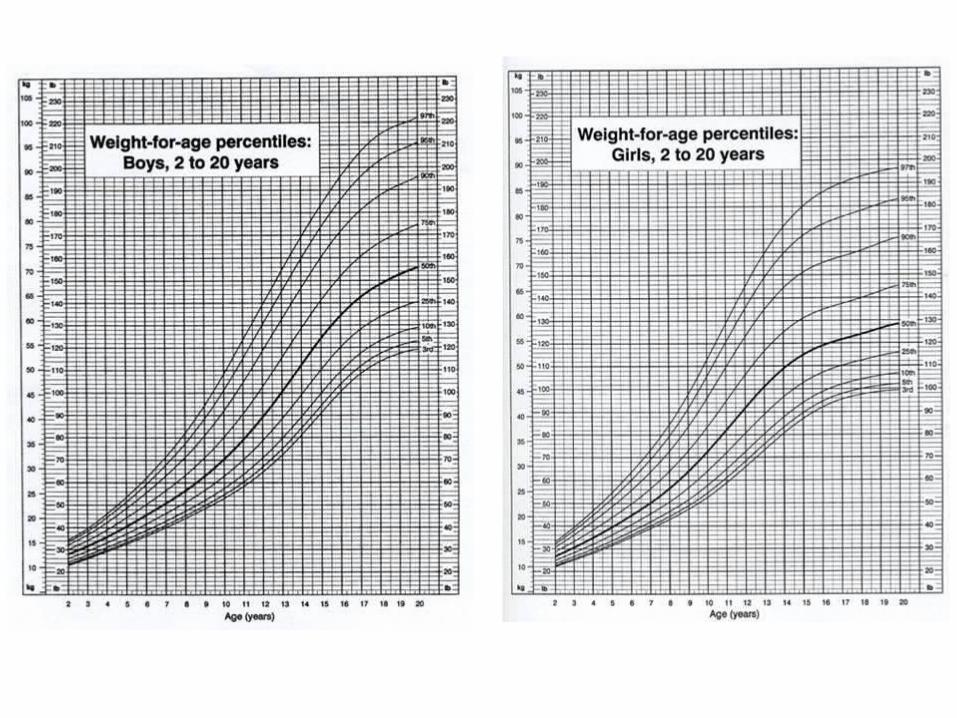
Growth in Body Weight
Typical distancecurve for bodyweight

National Center for HealthStatistics growth velocity charts for boys and girls on variable body weight

© 2007 McGraw-Hill Higher Education. All rights reserved.
Body Mass Index (BMI)
• Calculating BMI• Healthy adult = 18.5-24.9• Underweight = <18.5• Overweight = 25-29.9• Obese = >30
)(
)(2mht
kgwtBMI

© 2007 McGraw-Hill Higher Education. All rights reserved.
Mary is a 46-year-old woman who weighs 132 pounds and is 65 in. tall. Calculate Mary’s BMI.Is Mary overweight?

© 2007 McGraw-Hill Higher Education. All rights reserved.
Solution
)(
)(
65.10254.065
602.2
132
2mheight
kgweightBMI
mxin
heightConvert
kglb
weightConvert
2
2
/1.22
65.1
60
mkgBMI
BMI
© 2007 McGraw-Hill Higher Education. All rights reserved.
BMI Chart
• Is Mary overweight?
• NO, her BMI is normal
• <18.5 = underweight
• 18.5-24.9 = normal weight
• 25-29.9 = overweight
• >30 = obese

© 2007 McGraw-Hill Higher Education. All rights reserved.
BMI-for-Age
• In children and adolescents, BMI-for-age is best used as a guide to determine individual nutritional status
• BMI-for-age between 85th percentile and 95th percentile is classified as risk for becoming overweight
• BMI-for-age greater than 95th percentile, overweight is a concern
© 2007 McGraw-Hill Higher Education. All rights reserved.
BMI-for-Age
• Adiposity rebound: upward trend occurring after the low point on the BMI percentile curve– The earlier the adiposity rebound occurs in a
child, the more likely BMI will be high in adulthood

© 2007 McGraw-Hill Higher Education. All rights reserved.
BMI-for-Age
• NHANES, between 1960 and 2000– Children and adults are fatter
• In adults– Mean height has increased 1 in– Mean body weight has increased 24 lb!
• In children– 6-11 yr, both boys and girls are 9 lb heavier– 12-17 yr, boys are 15 lb heavier and girls are 12 lb
heavier
© 2007 McGraw-Hill Higher Education. All rights reserved.
Stature and Weight: Motor Performance
• The interrelationship between weight and height is task specific during adolescence and adulthood
• Increased body weight is an asset in some sports
• Increased body fat exerts a negative influence on performance in sports where the body needs to be supported
© 2007 McGraw-Hill Higher Education. All rights reserved.
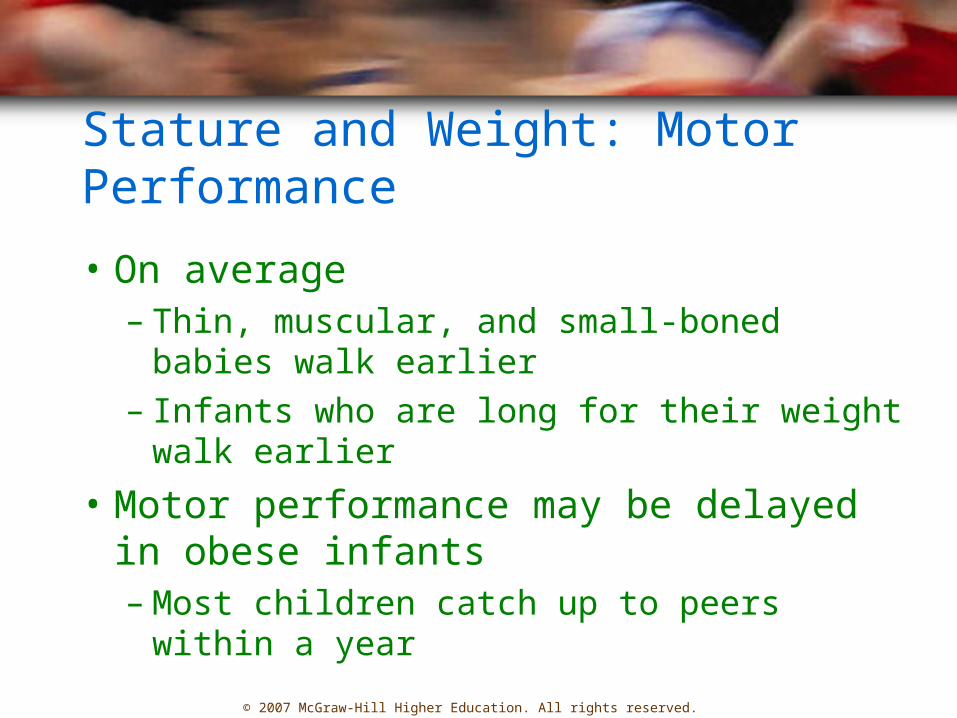
Stature and Weight: Motor Performance
• On average– Thin, muscular, and small-boned babies walk
earlier– Infants who are long for their weight walk
earlier
• Motor performance may be delayed in obese infants– Most children catch up to peers within a year
© 2007 McGraw-Hill Higher Education. All rights reserved.
Adolescent Awkwardness• This refers to a period during the growth
spurt where motor performance is disrupted– Peak height velocity
• Estimated age for boys = 13.7 yr– Most common in best performers at start of
peak height velocity
• Estimated age for girls = 11.8 yr• The phenomenon is not universal

© 2007 McGraw-Hill Higher Education. All rights reserved.
Changes in Head Circumference
• Ratio of head size to overall body length– Head contributes 25% to body length
• Head circumference– Indicative of brain development
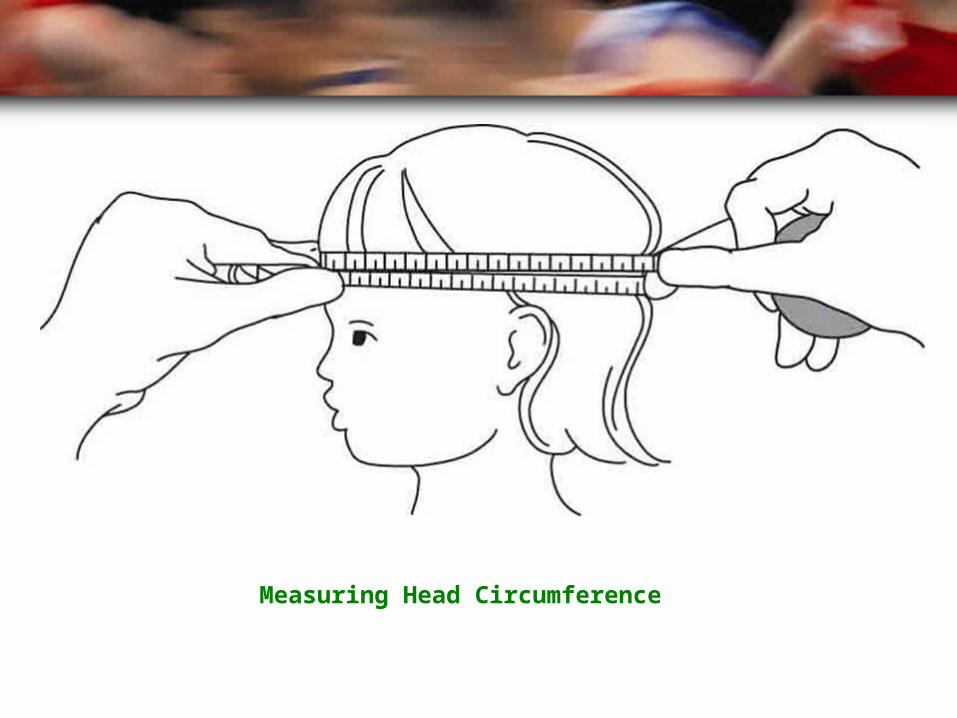
Measuring Head Circumference

© 2007 McGraw-Hill Higher Education. All rights reserved.
Changes in Head Circumference
• Birth – head is ¼ of total body length– Head circumference is greater than chest
circumference– Head circumference ~ 35 cm
• By year 1, head circumference increases 12 cm• Year 2, head circumferences increases 5 cm• Between ages 3 and 20 yr, head circumference
only increases 5-6 cm
© 2007 McGraw-Hill Higher Education. All rights reserved.
Changes in Sitting Height
• Birth – sitting height = 85% of total length
• Age 6 – sitting height = 55% of total length
• Adult – sitting height = 50% of total length

© 2007 McGraw-Hill Higher Education. All rights reserved.
Changes in Stature
• 55-60% of stature increase due to leg growth
• Ratio between sitting height and stature– Describes the contribution of the legs and
trunk to total height

© 2007 McGraw-Hill Higher Education. All rights reserved.
Changes in Body Proportions• Sitting
height/stature ratio
© 2007 McGraw-Hill Higher Education. All rights reserved.
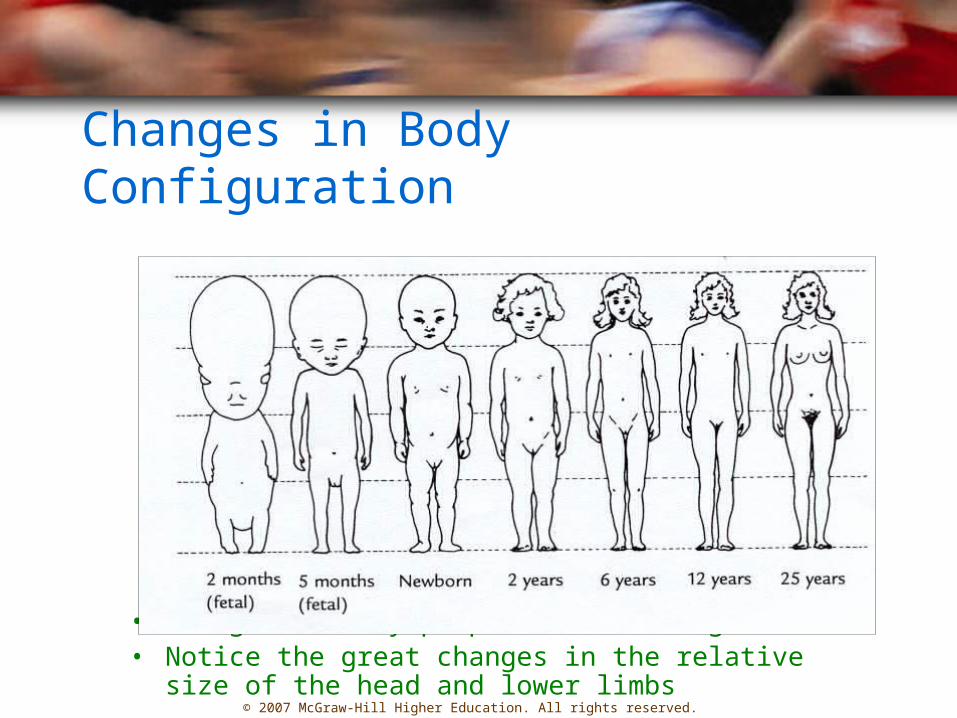
Changes in Body Configuration
• Changes in body proportions with age• Notice the great changes in the relative size of the head and
lower limbs
© 2007 McGraw-Hill Higher Education. All rights reserved.
Changes in Shoulder and Hip Width
• Ratio between biacromial and bicristal breadths– Shoulder width to hip width
© 2007 McGraw-Hill Higher Education. All rights reserved.
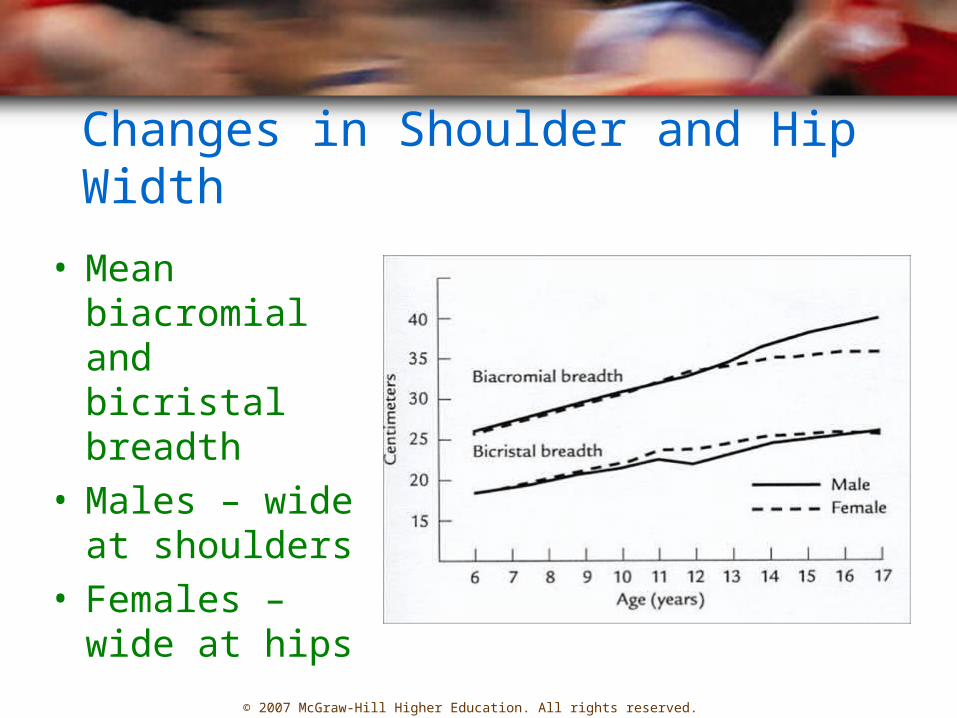
Changes in Shoulder and Hip Width
• Mean biacromial and bicristal breadth
• Males – wide at shoulders
• Females – wide at hips
© 2007 McGraw-Hill Higher Education. All rights reserved.
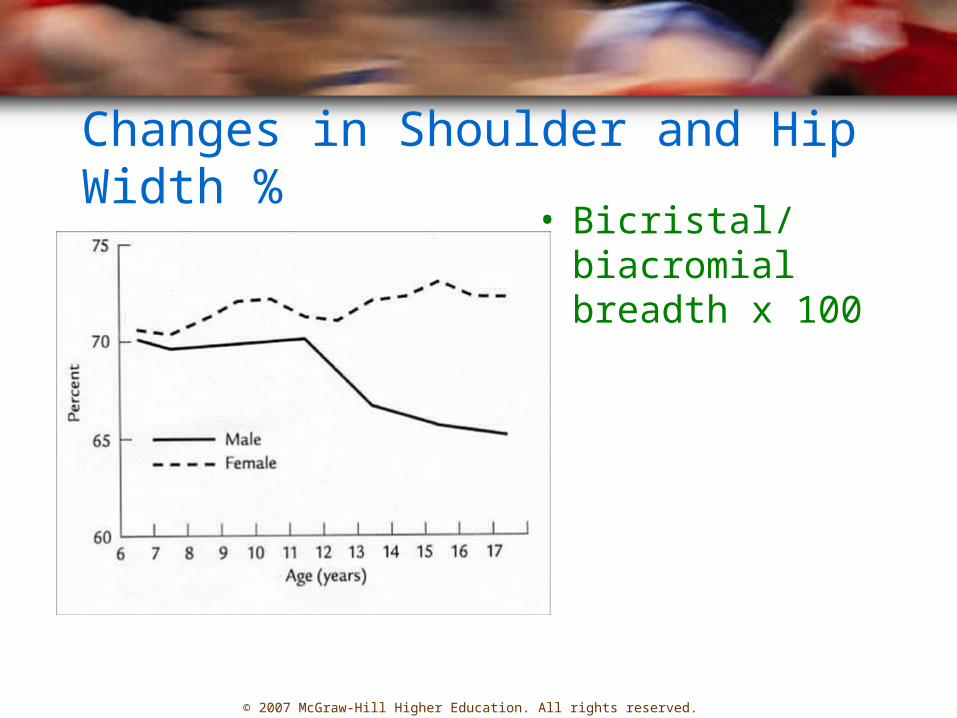
Changes in Shoulder and Hip Width %• Bicristal/biacromial
breadth x 100

© 2007 McGraw-Hill Higher Education. All rights reserved.
Changes in the Center of Gravity
• A child’s center of gravity varies greatly because the head, trunk, and legs do not grow proportionally
• The center of gravity is high in children because a large proportion of their weight is in the upper body– Affects stability

© 2007 McGraw-Hill Higher Education. All rights reserved.
Changes in the Center of Gravity
• For the adult, the center of gravity to total height is 53-59%– Males have a higher center of gravity than
females do– Center of gravity is associated with the
center of mass• Men – chest• Women – hips

© 2007 McGraw-Hill Higher Education. All rights reserved.
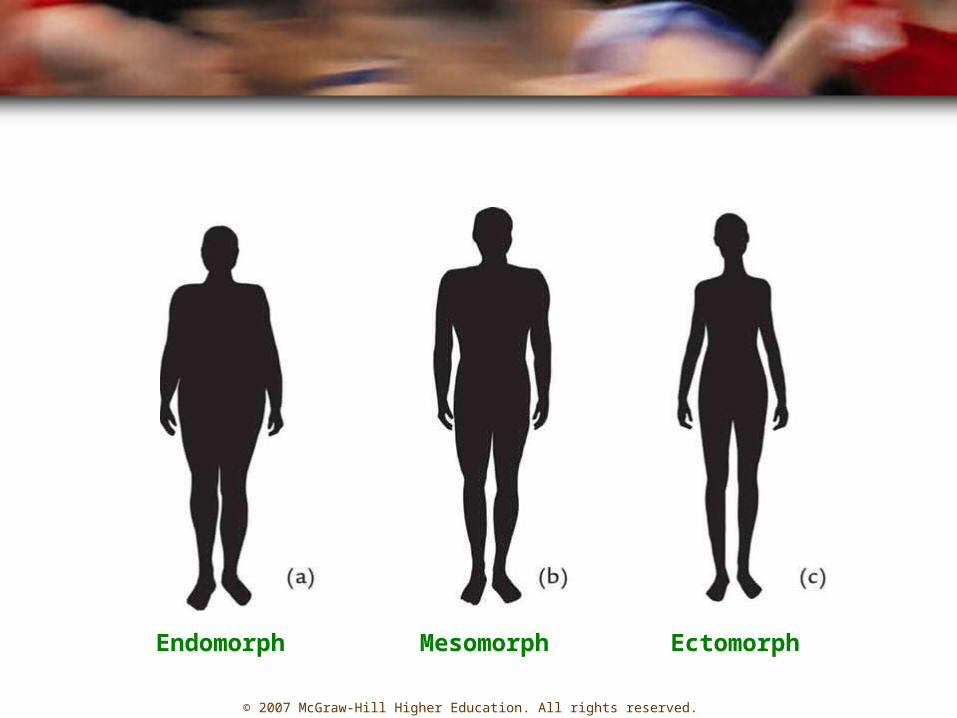
Physique
• Overall body form
• W.H. Sheldon (1940) rated physique by three components– Endomorphic (round)– Mesomorphic (muscle)– Ectomorphic (thin)
© 2007 McGraw-Hill Higher Education. All rights reserved.
Endomorph Mesomorph Ectomorph
© 2007 McGraw-Hill Higher Education. All rights reserved.
Physique
• Heath and Carter (1967) Somatotype– Modified Sheldon’s method by adding
anthropometry– Rating form includes measurement of
skinfolds (endomorphic), height, breadth of bone, arm and calf circumferences (mesomorphic), and a ponderal index (ectomorphic)

© 2007 McGraw-Hill Higher Education. All rights reserved.
Physique
– Ponderal index = a way of characterizing height to mass
– Typical numbers are 21-25 in adults
3
)(
)(1000
cmheight
kgmassPI

© 2007 McGraw-Hill Higher Education. All rights reserved.
Heath-Carter Somatotype
© 2007 McGraw-Hill Higher Education. All rights reserved.
Body Proportion and Motor Performance
• Stability (balance) is a problem for young children due to their higher center of gravity and small base of support
• Balance is superior in women and girls due to their shorter legs and wider pelvis– Lowers center of gravity

© 2007 McGraw-Hill Higher Education. All rights reserved.
Body Proportion and Motor Performance
• Wide hips, short legs, and a low center of gravity make running and jumping tasks difficult for girls
• Wider shoulders and longer arms in boys and men is an advantage for throwing events
© 2007 McGraw-Hill Higher Education. All rights reserved.
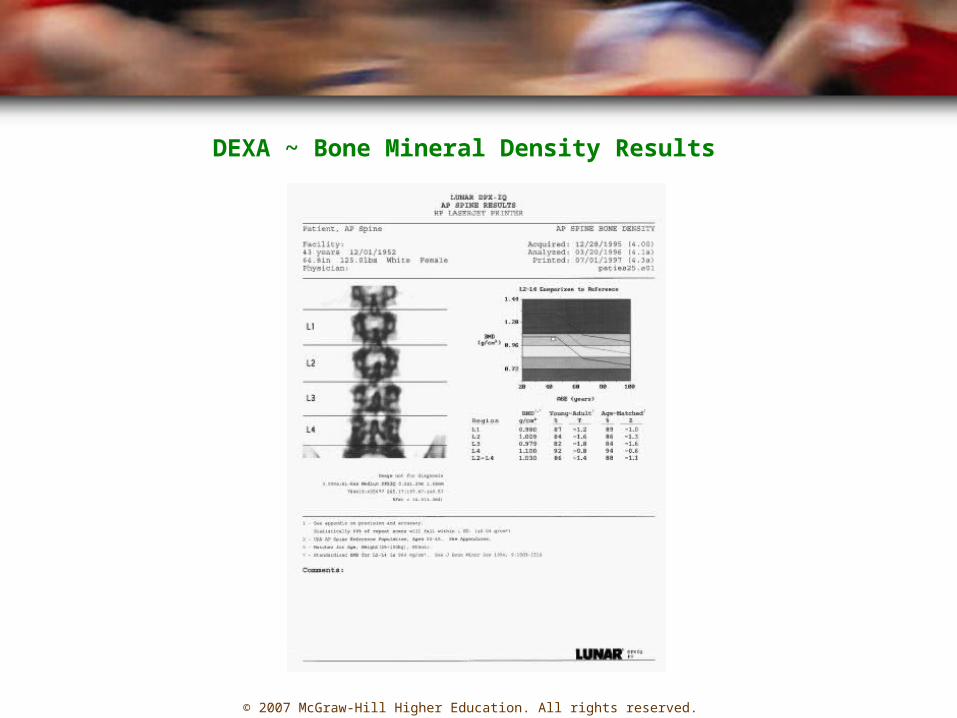
Measuring Skeletal Health
• Dual-energy X-ray absorptiometry (DEXA)– Can measure differences among lean soft
tissue, fat soft tissue, and bone tissue– Determines BMD – bone mineral density
• US is an aging society– More concern for bone diseases like
osteoporosis

© 2007 McGraw-Hill Higher Education. All rights reserved.
DEXA ~ Dual-Energy X-ray Apsorptiometry
© 2007 McGraw-Hill Higher Education. All rights reserved.
DEXA ~ Bone Mineral Density Results
© 2007 McGraw-Hill Higher Education. All rights reserved.
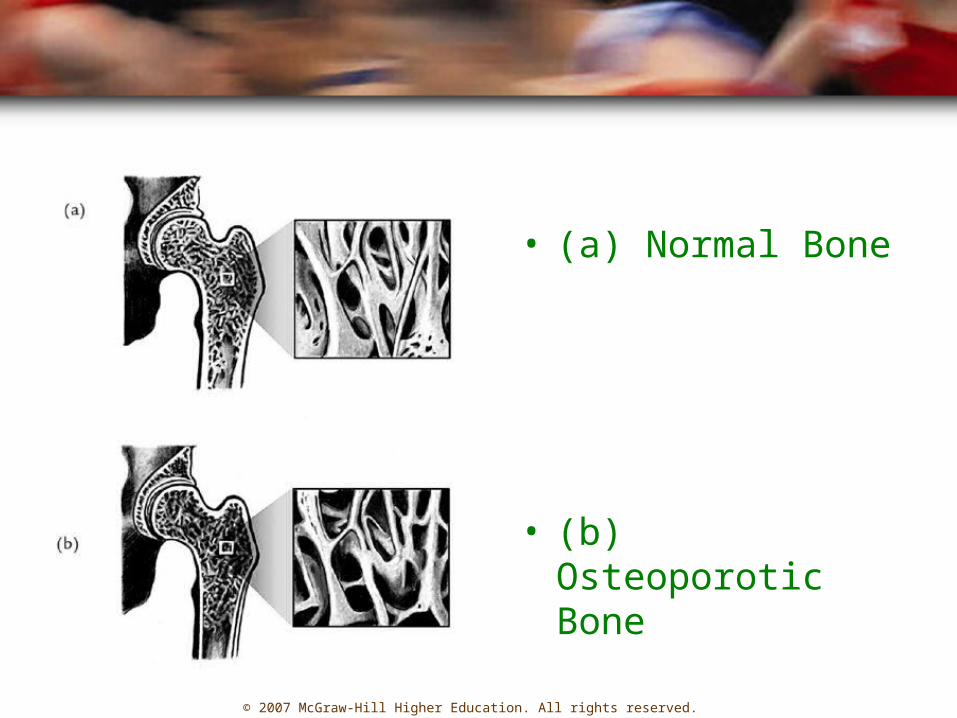
• (a) Normal Bone
• (b) Osteoporotic Bone

© 2007 McGraw-Hill Higher Education. All rights reserved.
Skeletal Development
• Appositional growth– Long bones grow in width by bone apposition
on the outer surface of the bone– Short, flat, and irregular bones increase size
by this method
• Endochondral growth– Involves the interstitial growth of cartilage
followed by calcification of this cartilage– The result is increased bone length

© 2007 McGraw-Hill Higher Education. All rights reserved.
Skeletal Development
• In utero– Intramembranous bone formation
• Embryonic membranes begin to ossify
• All long bones begin to ossify by birth• Bone remodeling
– Occurs throughout the lifespan– Osteoblasts (building)– Osteoclasts (chewing)
© 2007 McGraw-Hill Higher Education. All rights reserved.
Skeletal Development
• From birth to 35 yr – osteoblast activity > osteoclast activity– Gaining bone
• After 35 yr, osteoclast activity > osteoblast activity– Exercise and stress on the bones becomes
important

© 2007 McGraw-Hill Higher Education. All rights reserved.
Skeletal Development
• Endochondral growth occurs at the epiphyseal plate (growth plate)
• Bone growth in length occurs when the epiphyseal plate becomes ossified and forms the epiphyseal line– Osteoblastic (bone building cell) activity

© 2007 McGraw-Hill Higher Education. All rights reserved.
Exercise and Skeletal Health
• Interaction among activity, nutrition, genetics, and lifestyle
• Exercise increases bone density• Inactivity is associated with bone
decalcification (bone loss)• Long periods in space reduce bone mass
unless a vigorous exercise program is followed (treadmill)
© 2007 McGraw-Hill Higher Education. All rights reserved.
Exercise and Skeletal Health
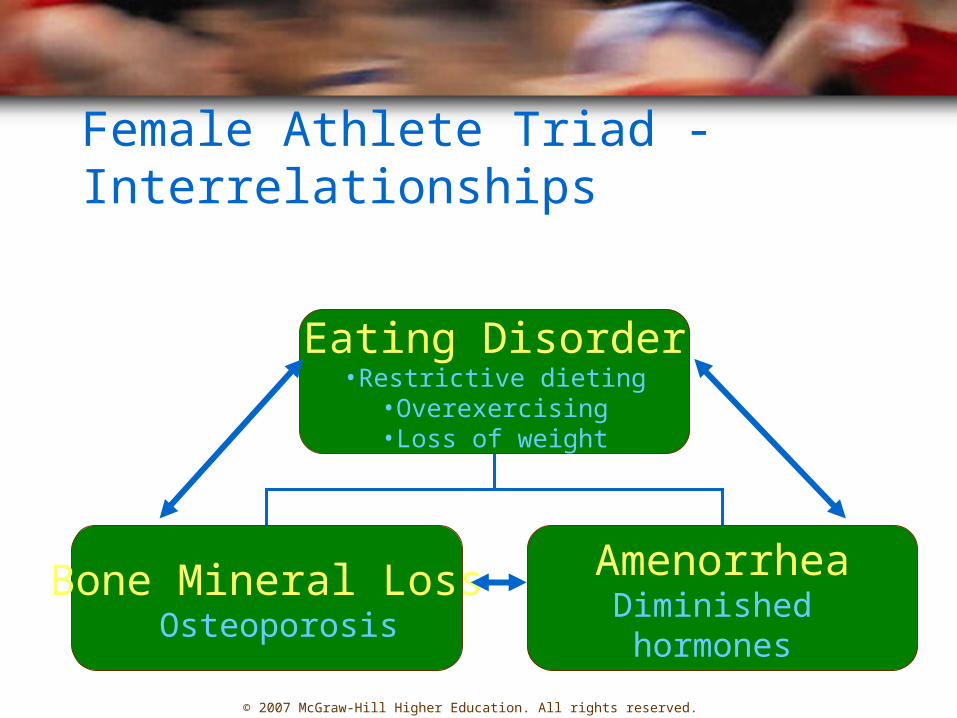
• Female athlete triad– Amenorrhea– Eating disorders– Bone mineral loss
• These problems are interrelated and this interrelationship is not completely understood in young women athletes
© 2007 McGraw-Hill Higher Education. All rights reserved.
Female Athlete Triad - Interrelationships
Eating Disorder•Restrictive dieting
•Overexercising•Loss of weight
Bone Mineral Loss Osteoporosis
AmenorrheaDiminished hormones
© 2007 McGraw-Hill Higher Education. All rights reserved.
Maturation & Developmental Age
• Chronological age– Often used to denote maturity, but is a poor
indicator
• Developmental age– Much better indicator of maturity– e.g., adolescence– Addresses variations in rate of maturation
© 2007 McGraw-Hill Higher Education. All rights reserved.
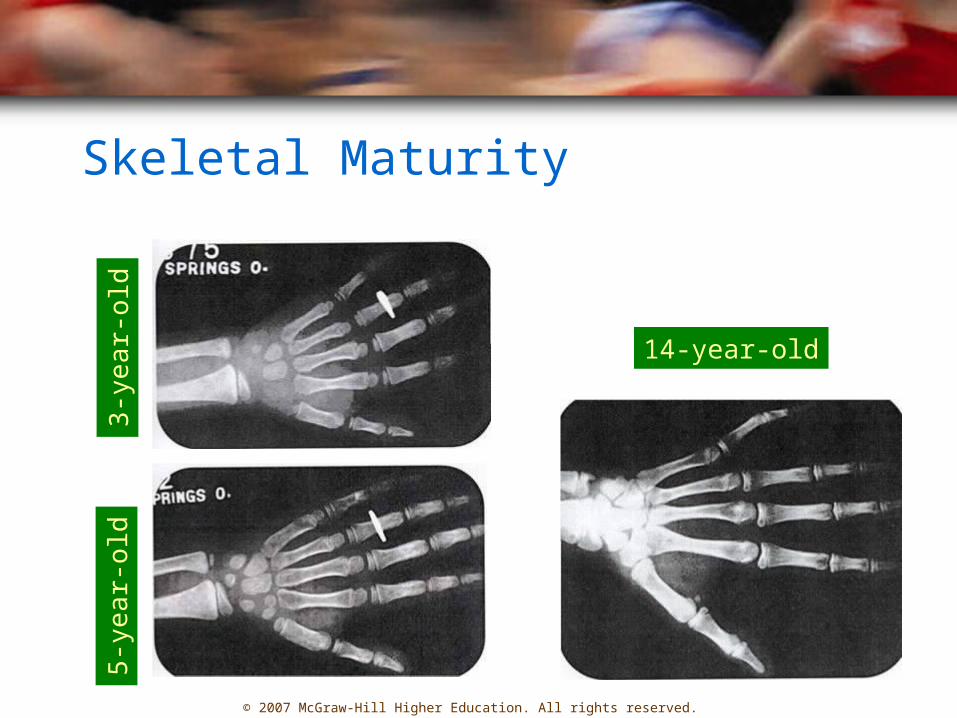
Skeletal Maturity3
-year-
old
5-y
ear-
old
14-year-old

© 2007 McGraw-Hill Higher Education. All rights reserved.
Dental Maturity
• Dental maturation– Count the number of teeth that have
emerged
• Dental age– Radiographs determine stage of bone
calcification– Technique of choice– Can compare developmental stages

© 2007 McGraw-Hill Higher Education. All rights reserved.
Age of Menarche
• The onset of menstruation
• Mean age in developed countries is 13.2 yr– Often occurs earlier in American girls
• Signifies uterine maturity, not reproductive maturity

© 2007 McGraw-Hill Higher Education. All rights reserved.
Age of Menarche
• To determine the age of menarche ask questions– Do you know what menstruation means?– Have you already menstruated?– Can you remember the exact date of your
first menstruation?– What grade were you in?– Was the event close to you birthday?

© 2007 McGraw-Hill Higher Education. All rights reserved.
Genitalia Maturity
• Stages of pubertal development
• Girls– Assess pubic hair and breast development
• Boys– Assess pubic hair and reproductive organ
development

© 2007 McGraw-Hill Higher Education. All rights reserved.
Maturation and Motor Performance
• The level of maturation can affect motor performance
• Postpubescent boys initially outperform prepubescent boys
• Once the late-maturing boys reach adolescence, the advantage is no longer evident

© 2007 McGraw-Hill Higher Education. All rights reserved.
Maturation and Motor Performance
• Early maturation in not associated with superior motor performance in girls, except in swimming
• Late-maturing girls have superior motor performance– Longer arms and legs– Narrower hips

© 2007 McGraw-Hill Higher Education. All rights reserved.