© 2004 by the mcgraw-hill companies, inc. all rights reserved. lecture 29 enhancing presentations...
TRANSCRIPT

© 2004 by the McGraw-Hill Companies, Inc. All rights reserved.
Lecture 29
Enhancing Presentations with Graphics (2)

© 2004 by the McGraw-Hill Companies, Inc. All rights reserved.
Objectives
• Add images from files to content placeholders
• Create and place WordArt
• Build and format PowerPoint tables
• Create bar charts, pie charts, and other numeric graphs in a presentation
© 2004 by the McGraw-Hill Companies, Inc. All rights reserved.
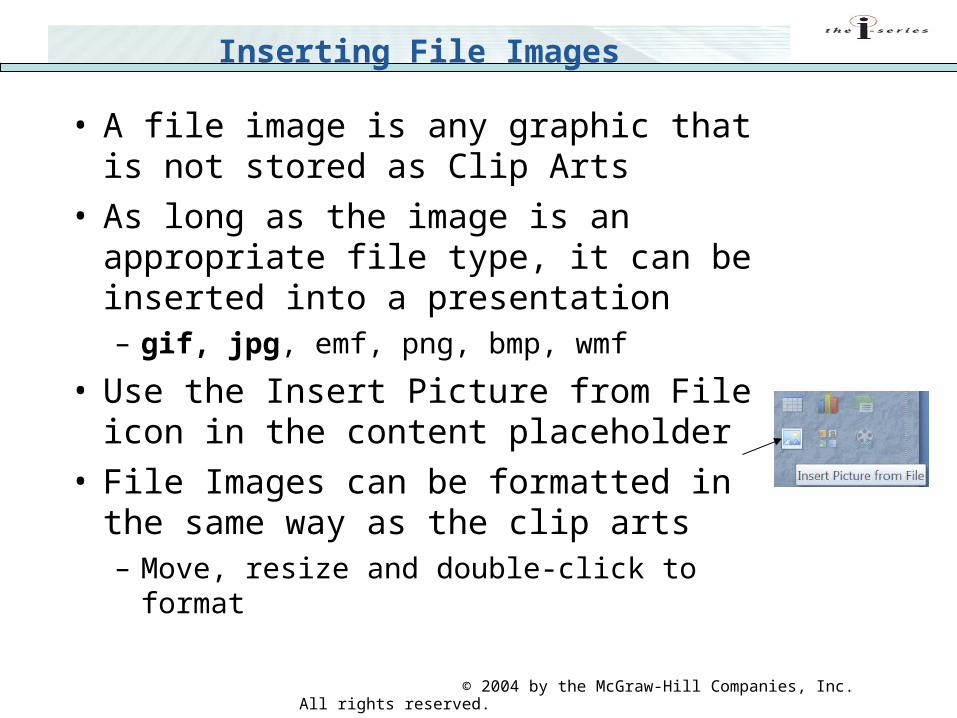
Inserting File Images
• A file image is any graphic that is not stored as Clip Arts
• As long as the image is an appropriate file type, it can be inserted into a presentation– gif, jpg, emf, png, bmp, wmf
• Use the Insert Picture from File icon in the content placeholder
• File Images can be formatted in the same way as the clip arts– Move, resize and double-click to format

© 2004 by the McGraw-Hill Companies, Inc. All rights reserved.
Creating WordArt
• WordArt is a drawing object type available in all Office applications– Used to create text with special effects– We have learned it in Word
• Use the WordArt button in the Text group on the Insert tab
• Like other drawing objects, WordArt can be copied, pasted, sized and edited
• The WordArt Styles group in the WordArt group on the Format tab of Drawing Tools contains operations that make it easy to format WordArt objects

© 2004 by the McGraw-Hill Companies, Inc. All rights reserved.
Building Tables
• Tables can be built in PowerPoint, but the formatting capabilities are not as complete as in Word
• Complex tables can be created in Word and Copy/Paste into a presentation
• Data from an Excel workbook or Access table can be displayed in a table

© 2004 by the McGraw-Hill Companies, Inc. All rights reserved.
Inserting a Table
• Insert a table– Use the Insert Table icon in the content placeholder
• Format a table (the same as in Word)– Each cell in a table can have its own formatting including
background, border, font, and alignment
• Draw complex tables (Not recommended)– Click on the Table button in the Tables group on the Insert
tab– Select Draw Table in the menu– Use the pencil tool to create a new table in the slide– Click on the Draw Table button in the Draw Borders group
on the Design tab of Table Tools– Use the pencil tool to draw borders in the new table
Switch for the pencil tool

© 2004 by the McGraw-Hill Companies, Inc. All rights reserved.
Using Charts
• Charts are used to represent numeric data graphically– We have learned it in Excel
• Click the Insert Chart icon in the content placeholder to create a chart
• A chart in PowerPoint includes:– Datasheet- composed of cells that contain data
used to generate a chart– Chart area

© 2004 by the McGraw-Hill Companies, Inc. All rights reserved.
Chart Types and Sub-types
• Supports a number of standard chart types– Examples: pie, line, column, bar
• Each type has at least 2 subtypes for controlling layout
Relationships between different categories of data
Bar, Column
Trends over time or across categories
Area, Line
Relating each value in series to total of all value
Pie
SuitabilityChart Type

© 2004 by the McGraw-Hill Companies, Inc. All rights reserved.
Choosing a Chart Type
• The most appropriate chart type and sub-type depends on the audience and the information contained in the chart.
• Using a 3-D chart improves the visual impact of charts but can be detracting when there are too many data values
Selected chart type

© 2004 by the McGraw-Hill Companies, Inc. All rights reserved.
• After a chart type is selected, you need to enter the data for the chart in an Excel worksheet
• Note that you need to enter both labels and numeric values in the worksheet. You can close the Excel window after entering the data
• After the chart is created, you can still update the data by right-clicking on the chart and selecting Edit Data in the shortcut menu
Entering Data for a Chart

© 2004 by the McGraw-Hill Companies, Inc. All rights reserved.
Customizing a Chart
Simple changes to a chart include adding title and selecting another chart type or sub-type. More complex options are used to control the 3-D rotation and apply custom colors and fills to chart objects
− Similar to those in Excel, you can use the Design, Layout, and Format tabs of Chart Tools to customize the chart in a placeholder
© 2004 by the McGraw-Hill Companies, Inc. All rights reserved.
Customizing a Chart (cont’d)
• For example, to make a chart complete, add a chart title and axis titles using the Labels group on the Layout tab of Chart Tools
• Any component of the chart can be formatted by right-clicking on that component and select Format in the shortcut menu– Fonts: size, color, type
– Shape: fill colors, border colors
– Chart area: custom color, fill or pattern