© 2004 by steven james presley - university of...
TRANSCRIPT

© 2004 by Steven James Presley

ii
ACKNOWLEDGMENTS
Foremost, I thank my major professor, Dr. Michael Willig, for his continual
support, encouragement, criticism, and enthusiasm. Mike provided many and varied
opportunities for me to grow as a researcher, thinker, educator, and person; hopefully
those opportunities were not wasted. Under his guidance I have become a well-rounded
scientist, critical thinker, proficient writer, and capable statistician.
I am indebted to my committee, Drs. Don Gettinger, Mark McGinley, Daryl
Moorhead, Robert Owen, and Richard Strauss. Each has contributed significantly to my
growth as a scientist and this dissertation would be lacking if not for their collective
guidance. I also thank many faculty members of Texas Tech University, who have
provided guidance and enriched my doctoral experience, including Drs. Ray Jackson,
Kent Rylander, Michael San Francisco, Charlie Werth, Gene Wilde, and John Zak. I
thank Dr. Michael Dini for helping to develop my skills as an instructor.
Many fellow graduate students made my time at Texas Tech enjoyable and
productive. Stephen Cox was influential in my early development as a doctoral student;
we had many discussions over a well-packed bowl that broadened my outlook of the
world and biology. Christopher Bloch has been an invaluable office mate during the
course of the analysis and writing of my dissertation, being a patient listener and
sounding board for my ideas. In addition, I am indebted to Richard Stevens, Celia
López-González, Carl Dick, Joel Brant, Chris Higgins, P. Marcos Gorreson, Ed Sobek,
Michael Cramer, Kate Lyons, Michelle Secrest, Diane Hall, Brian Croyle, Javier Alvarez,
Jeff Roberts, Don Yee, Carla Guthrie, and Kelly Johnson for their friendship, guidance,
and support during various epochs of my doctoral studies. I am indebted to Jacy Lewis
for her love, support, and encouragement during a critical time when I had abandoned my
studies and may not have returned if not for her insistence; thank you.
This research generously was supported by grants from the National Science
Foundation (NSF) to R. D. Owen and M. R. Willig entitled “Paraguayan Mammals and
Their Ectoparasites: an Intensive Survey in a Temperate-Subtropical Interface” (DEB-

iii
9400926, DEB-9741543, DEB-9741134). The Office of the Vice-President for Research
and Graduate Studies and Office of Research Services at Texas Tech University (D.
Schmidly and R. Sweazy) provided substantial financial support during the course of the
project. Additional support was provided by the Texas Tech University Graduate School
(Summer Research Awards), Department of Biological Sciences (Summer Research
Awards and teaching assistantships), and the American Association of Mammalogists
(Grant-in-Aid of Research Awards). The Ministério de Agricultura y Ganadería provided
significant financial and logistic support. Personnel of the Museo National de Historia
Natural del Paraguay and the Convention for International Trade of Endangered Species
of Paraguay provided continual encouragement, support, and cooperation, especially
noteworthy was the diversity of support that was graciously provided by A. L. Aquino.
The Dirección de Parques Nacionales y Vida Silvestre also contributed significantly to
the success of the project. The Department of Biological Sciences (J. Burns, M. San
Francisco) and the Museum (R. Baker, R. Monk) of Texas Tech University, the
Fundación Moises Bertoni (R. Gauto, A. Van Humbeeck), and the Universidad Católica
Nuestra Señora de la Asunción (J. Usher) also provided assistance. For access to their
land and provision of accommodations while in the field, I especially thank the many
owners and administrators of estancias that we visited, personnel of Yaguareté Forests (P.
Mueller) and Refugio Faunístico Atingy (M. Cubas), and especially the Fuerzas Armadas
de la Republica del Paraguay. For assistance in the field or with logistic arrangements, I
thank Heidi Amarilla, Sylvia Frutos, Steven Mezik, Margarita Mieres, and Guillermo
Terol. For their dedication to the project and conscientious efforts in the field, I am
extremely grateful to Ismael “Pajarito” Mora and Francisco “Mbaracayá” Pintos. I also
owe a very large debt of gratitude to Lucy Aquino and her family for making my time in
Paraguay as enriching and rewarding personally as it was professionally.
Lastly, I need to thank my family for their love, patience and understanding
during the seemingly interminable time required to finish “my paper.” In particular, I
thank my mother and father for their sacrifice and insistence that I go to college;
hopefully, they feel their sacrifice was rewarded sufficiently.

iv
TABLE OF CONTENTS
ACKNOWLEDGMENTS. . . . . . . . . . . . . . . . . . . . . . . . . . . . . . . . . . . . . . . . . . . . . . . . . . ii LIST OF TABLES. . . . . . . . . . . . . . . . . . . . . . . . . . . . . . . . . . . . . . . . . . . . . . . . . . . . . . . x LIST OF FIGURES. . . . . . . . . . . . . . . . . . . . . . . . . . . . . . . . . . . . . . . . . . . . . . . . . . . . . .xvi CHAPTER
I. INTRODUCTION. . . . . . . . . . . . . . . . . . . . . . . . . . . . . . . . . . . . . . . . . . . . 1
Literature Cited. . . . . . . . . . . . . . . . . . . . . . . . . . . . . . . . . . . . . . . . .4 II. NATURAL HISTORY OF ARTHROPODS ECTOPARASITIC ON THE BATS OF PARAGUAY. . . . . . . . . . . . . . . . . . . . . . . . . . . . . . . . . . . . . . . . . . . . . . . . 5
Introduction. . . . . . . . . . . . . . . . . . . . . . . . . . . . . . . . . . . . . . . . . . . 5 Bats and Their Ectoparasites as Model Systems. . . . . . . . . . . . . . . . . . . . . . . . . . . . . . . . . . . 5 Study Area and Bat Fauna . . . . . . . . . . . . . . . . . . . . . . . . . .7 Vegetative Setting. . . . . . . . . . . . . . . . . . . . . . . . . . 7 Host Assemblage. . . . . . . . . . . . . . . . . . . . . . . . . . . 8 Ectoparasite Assemblage. . . . . . . . . . . . . . . . . . . . . 9 Ectoparasite Natural History-Insecta. . . . . . . . . . . . . . . . . . 9 Streblidae and Nycteribiidae. . . . . . . . . . . . . . . . . 10 Polyctenidae. . . . . . . . . . . . . . . . . . . . . . . . . . . . . . 11
Ischnopsyllidae. . . . . . . . . . . . . . . . . . . . . . . . . . . .11 Ectoparasite Natural History-Acarina. . . . . . . . . . . . . . . . 11 Spinturnicidae. . . . . . . . . . . . . . . . . . . . . . . . . . . . 12

v
Macronyssidae. . . . . . . . . . . . . . . . . . . . . . . . . . . . 12 Argasidae. . . . . . . . . . . . . . . . . . . . . . . . . . . . . . . . 13 Trombiculidae. . . . . . . . . . . . . . . . . . . . . . . . . . . . 14 Chirodiscidae. . . . . . . . . . . . . . . . . . . . . . . . . . . . . 15 Myobiidae. . . . . . . . . . . . . . . . . . . . . . . . . . . . . . . 15 Materials and Methods. . . . . . . . . . . . . . . . . . . . . . . . . . . . . . . . . . 16 Field Methods. . . . . . . . . . . . . . . . . . . . . . . . . . . . . . . . . . .16 Laboratory Work. . . . . . . . . . . . . . . . . . . . . . . . . . . . . . . . 17 Results. . . . . . . . . . . . . . . . . . . . . . . . . . . . . . . . . . . . . . . . . . . . . . 23 Ectoparasite Assemblages on the Noctilionidae. . . . . . . . . . . . . . . . . . . . . . . . . . . . . . . . . . . 24 Ectoparasite Assemblages on the Phyllostomidae. . . . . . . . . . . . . . . . . . . . . . . . . . . . . . . . . . 24 Ectoparasite Assemblages on the Natalidae. . . . . . . . . . . . . . . . . . . . . . . . . . . . . . . . . . . . . . .26 Ectoparasite Assemblages on the Vespertilionidae . . . . . . . . . . . . . . . . . . . . . . . . . . . . . . . . .26 Ectoparasite Assemblages on the Molossidae. . . . . . . . . . . . . . . . . . . . . . . . . . . . . . . . . . . . . 27 Host Specificity. . . . . . . . . . . . . . . . . . . . . . . . . . . . . . . . . 29 Ectoparasite Species Abundance Distributions . . . . . . . . . . . . . . . . . . . . . . . . . . . . . . . . . . . 30 Discussion. . . . . . . . . . . . . . . . . . . . . . . . . . . . . . . . . . . . . . . . . . . .30 Host-Parasite Associations and Infestation Levels. . . . . . . . . . . . . . . . . . . . . . . . . . . . . . . . 30 Host Specificity. . . . . . . . . . . . . . . . . . . . . . . . . . . . . . . . . 37

vi
Ectoparasites and Safe Spaces. . . . . . . . . . . . . . . . . . . . . . 39 Streblids and Safe Spaces on Noctilio. . . . . . . . . . . . . . . . . . . . . . . . . . . . . . . . . .42 Resource Partitioning on Molossids. . . . . . . . . . . . . . . . . .44 Implications of Host Phylogeny Based on Ectoparasites. . . . . . . . . . . . . . . . . . . . . . . . . . . .44 Subfamilial Status of Sturnira. . . . . . . . . . . . . . . . 45 Relationships Among the Vampires, Glossophaga and Carollia. . . . . . . . . . . . . . . . . . . . . . . . . . . . . . . . . 46 Species Abundance Distributions and Resource Partitioning. . . . . . . . . . . . . . . . . . . . . . . . . . . . . 46 Of Birds and Bats. . . . . . . . . . . . . . . . . . . . . . . . . . . . . . . . 49 Conclusions. . . . . . . . . . . . . . . . . . . . . . . . . . . . . . . . . . . . 52 Literature Cited. . . . . . . . . . . . . . . . . . . . . . . . . . . . . . . . . . . . . . . 54
III. FLYING ISLANDS I: THE EFFECT OF HOST BODY SIZE ON ECTOPARASITE ASSEMBLAGE BIODIVERSITY. . . . . . . . . . . . . . . . . . . . . . . . . . . . . 140 Introduction. . . . . . . . . . . . . . . . . . . . . . . . . . . . . . . . . . . . . . . . . 140 Bats and Their Ectoparasites as Model Systems. . . . . . . . . . . . . . . . . . . . . . . . . . . . . . . . . 142 A Host Is an Island, Entire of Itself. . . . . . . . . . . . . . . . . 145 Limiting Factors. . . . . . . . . . . . . . . . . . . . . . . . . . . . . . . . 145
Materials and Methods. . . . . . . . . . . . . . . . . . . . . . . . . . . . . . . . . 146 Field Methods. . . . . . . . . . . . . . . . . . . . . . . . . . . . . . . . . .146

vii
Host and Parasite Systematics. . . . . . . . . . . . . . . . . . . . . 147 Statistical Methods. . . . . . . . . . . . . . . . . . . . . . . . . . . . . . 148 Analysis of Ectoparasite Abundance. . . . . . . . . . . . . . . . . . . . . . . . . . . . . . 148 Analysis of Ectoparasite Biodiversity. . . . . . . . . . . . . . . . . . . . . . . . . . . . . 149 Results. . . . . . . . . . . . . . . . . . . . . . . . . . . . . . . . . . . . . . . . . . . . . 152 Total Ectoparasite Abundance. . . . . . . . . . . . . . . . . . . . . 152 Familial Ectoparasite Abundance. . . . . . . . . . . . . . . . . . .152 ANCOVA Results for FEA. . . . . . . . . . . . . . . . . . . . . . . 154 Specific Ectoparasite Abundance. . . . . . . . . . . . . . . . . . .154 ANCOVA Results for SEA. . . . . . . . . . . . . . . . . . . . . . . 155 Ectoparasite Biodiversity. . . . . . . . . . . . . . . . . . . . . . . . . 155 Discussion. . . . . . . . . . . . . . . . . . . . . . . . . . . . . . . . . . . . . . . . . . 156 Methodological Considerations. . . . . . . . . . . . . . . . . . . . 156 Effects of Host Size on Ectoparasite Biodiversity. . . . . . . . . . . . . . . . . . . . . . . . . . . . . . . . . . . 157 Effects of Host Ecology on Ectoparasite Biodiversity. . . . . . . . . . . . . . . . . . . . . . . . . 158 Species Rich, Species Poor. . . . . . . . . . . . . . . . . . . . . . . 163 Conclusions. . . . . . . . . . . . . . . . . . . . . . . . . . . . . . . . . . . 165 Literature Cited. . . . . . . . . . . . . . . . . . . . . . . . . . . . . . . . . . . . . . 167
IV. FLYING ISLANDS II: THE EFFECT OF HOST ABUNDANCE ON ECTOPARASITE ASSEMBLAGE BIODIVERSITY. . . . . . . . . . . . . . . . . . . . . . . . . . . . . 199

viii
Introduction. . . . . . . . . . . . . . . . . . . . . . . . . . . . . . . . . . . . . . . . . 199 Bats and Their Ectoparasites as Model Systems. . . . . . . . . . . . . . . . . . . . . . . . . . . . . . . . . 201 A Host Is an Island, Entire of Itself. . . . . . . . . . . . . . . . . 204 Limiting Factors. . . . . . . . . . . . . . . . . . . . . . . . . . . . . . . . 204
Materials and Methods. . . . . . . . . . . . . . . . . . . . . . . . . . . . . . . . . 207 Field Methods. . . . . . . . . . . . . . . . . . . . . . . . . . . . . . . . . .207 Host and Parasite Systematics. . . . . . . . . . . . . . . . . . . . . 207 Statistical Methods. . . . . . . . . . . . . . . . . . . . . . . . . . . . . . 208 Results. . . . . . . . . . . . . . . . . . . . . . . . . . . . . . . . . . . . . . . . . . . . . 212 Regional Host Abundance. . . . . . . . . . . . . . . . . . . . . . . . 212 Local Host Abundance. . . . . . . . . . . . . . . . . . . . . . . . . . . 212 Discussion. . . . . . . . . . . . . . . . . . . . . . . . . . . . . . . . . . . . . . . . . . 213 Host Species Abundance and Ectoparasite Biodiversity. . . . . . . . . . . . . . . . . . . . . . . . . 213 Host Family Abundance and Ectoparasite Biodiversity. . . . . . . . . . . . . . . . . . . . . . . . . 216 Host Abundance and ETIB. . . . . . . . . . . . . . . . . . . . . . . 217 Evolution of Specificity Versus Maintenance of Transience. . . . . . . . . . . . . . . . . . . . . . . 219 Conclusions. . . . . . . . . . . . . . . . . . . . . . . . . . . . . . . . . . . 220 Literature Cited. . . . . . . . . . . . . . . . . . . . . . . . . . . . . . . . . . . . . . 222
V. CONCLUSIONS. . . . . . . . . . . . . . . . . . . . . . . . . . . . . . . . . . . . . . . . . . . 241
Literature Cited. . . . . . . . . . . . . . . . . . . . . . . . . . . . . . . . . . . . . . 246
ix
APPENDICES
A. DESCRIPTION OF COLLECTION LOCALITIES. . . . . . . . . . . . . . . . 247
B. HOST—PARASITE LIST. . . . . . . . . . . . . . . . . . . . . . . . . . . . . . . . . . . .250
C. PARASITE—HOST LIST. . . . . . . . . . . . . . . . . . . . . . . . . . . . . . . . . . . .264
D. ECTOPARASITE SPECIES ABUNDANCE DISTRIBUTIONS. . . . . . . . . . . . . . . . . . . . . . . . . . . . . . . . . . . . . . . . . . 280
E. MATLAB FUNCTIONS FOR CALCULATING
SPECIES RICHNESS ESTIMATE LOGS. . . . . . . . . . . . . . . . . . . . . . . 320 Literature Cited. . . . . . . . . . . . . . . . . . . . . . . . . . . . . . . . . . . . . . 326

x
LIST OF TABLES
2.1 Ecological characteristics of the 7 biomes (Fig. 1) that occur in Paraguay (Hayes 1995). . . . . . . . . . . . . . . . . . . . . . . . . . . . . . . . . . . . . . 68 2.2 Bat species known from Paraguay and their primary feeding preferences. . . . . . . . . . . . . . . . . . . . . . . . . . . . . . . . . . . . . . . . . . . . . . . . 69 2.3 The geographical distribution and host families of insects ectoparasitic on bats (Marshall, 1982a). . . . . . . . . . . . . . . . . . . . . . . . . . . . . . . . . 71 2.4 Species composition of bat assemblages in the 7 biomes of Paraguay (Willig et al. 2000). . . . . . . . . . . . . . . . . . . . . . . . . . . . . . . . . . . . . . . . . 73 2.5 Summary of ectoparasite assemblage composition for each host family and species. . . . . . . . . . . . . . . . . . . . . . . . . . . . . . . . . . . . . . . . . . . . . .76 2.6 Incidence, prevalence, density, and specificity index (SI) of ectoparasites of Noctilio albiventris. . . . . . . . . . . . . . . . . . . . . . . . . . . . . . . . . . . .78 2.7 Incidence, prevalence, density, and specificity index (SI) of ectoparasites of Noctilio leporinus. . . . . . . . . . . . . . . . . . . . . . . . . . . . . . . . . . . . .79 2.8 Incidence, prevalence, density, and specificity index (SI) of ectoparasites of Chrotopterus auritus. . . . . . . . . . . . . . . . . . . . . . . . . . . . . . . . . . 80 2.9 Incidence, prevalence, density, and specificity index (SI) of ectoparasites of Tonatia bidens. . . . . . . . . . . . . . . . . . . . . . . . . . . . . . . . . . . . . . . 81 2.10 Incidence, prevalence, density, and specificity index (SI) of ectoparasites of Tonatia brasiliense. . . . . . . . . . . . . . . . . . . . . . . . . . . . . . . . . . . .82 2.11 Incidence, prevalence, density, and specificity index (SI) of ectoparasites of Glossophaga soricina. . . . . . . . . . . . . . . . . . . . . . . . . . . . . . . . . .83 2.12 Incidence, prevalence, density, and specificity index (SI) of ectoparasites of Carollia perspicillata. . . . . . . . . . . . . . . . . . . . . . . . . . . . . . . . . . 84 2.13 Incidence, prevalence, density, and specificity index (SI) of ectoparasites of Desmodus rotundus. . . . . . . . . . . . . . . . . . . . . . . . . . . . . . . . . . . 85 2.14 Incidence, prevalence, density, and specificity index (SI) of ectoparasites of Diaemus youngi. . . . . . . . . . . . . . . . . . . . . . . . . . . . . . . . . . . . . . 86

xi
2.15 Incidence, prevalence, density, and specificity index (SI) of ectoparasites of Artibeus fimbriatus. . . . . . . . . . . . . . . . . . . . . . . . . . . . . . . . . . . . 87 2.16 Incidence, prevalence, density, and specificity index (SI) of ectoparasites of Artibeus jamaicensis. . . . . . . . . . . . . . . . . . . . . . . . . . . . . . . . . . 88 2.17 Incidence, prevalence, density, and specificity index (SI) of ectoparasites of Artibeus lituratus. . . . . . . . . . . . . . . . . . . . . . . . . . . . . . . . . . . . . 89 2.18 Incidence, prevalence, density, and specificity index (SI) of ectoparasites of Chiroderma doriae. . . . . . . . . . . . . . . . . . . . . . . . . . . . . . . . . . . . 90 2.19 Incidence, prevalence, density, and specificity index (SI) of ectoparasites of Platyrrhinus lineatus. . . . . . . . . . . . . . . . . . . . . . . . . . . . . . . . . . 91 2.20 Incidence, prevalence, density, and specificity index (SI) of ectoparasites of Pygoderma bilabiatum. . . . . . . . . . . . . . . . . . . . . . . . . . . . . . . . . 92 2.21 Incidence, prevalence, density, and specificity index (SI) of ectoparasites of Sturnira lilium. . . . . . . . . . . . . . . . . . . . . . . . . . . . . . . . . . . . . . . 93 2.22 Incidence, prevalence, density, and specificity index (SI) of ectoparasites of Natalus stramineus. . . . . . . . . . . . . . . . . . . . . . . . . . . . . . . . . . . .94 2.23 Incidence, prevalence, density, and specificity index (SI) of ectoparasites of Eptesicus brasiliensis. . . . . . . . . . . . . . . . . . . . . . . . . . . . . . . . . . 95 2.24 Incidence, prevalence, density, and specificity index (SI) of ectoparasites of Eptesicus diminutus. . . . . . . . . . . . . . . . . . . . . . . . . . . . . . . . . . . 96 2.25 Incidence, prevalence, density, and specificity index (SI) of ectoparasites of Eptesicus furinalis. . . . . . . . . . . . . . . . . . . . . . . . . . . . . . . . . . . . 97 2.26 Incidence, prevalence, density, and specificity index (SI) of ectoparasites of Histiotus macrotus. . . . . . . . . . . . . . . . . . . . . . . . . . . . . . . . . . . . 98 2.27 Incidence, prevalence, density, and specificity index (SI) of ectoparasites of Lasiurus blossevillii. . . . . . . . . . . . . . . . . . . . . . . . . . . . . . . . . . . 99 2.28 Incidence, prevalence, density, and specificity index (SI) of ectoparasites of Lasiurus cinereus. . . . . . . . . . . . . . . . . . . . . . . . . . . . . . . . . . . . 100 2.29 Incidence, prevalence, density, and specificity index (SI) of

xii
ectoparasites of Lasiurus ega. . . . . . . . . . . . . . . . . . . . . . . . . . . . . . . . . . . . . . . . 101 2.30 Incidence, prevalence, density, and specificity index (SI) of ectoparasites of Myotis albescens. . . . . . . . . . . . . . . . . . . . . . . . . . . . . . . . . . . . .102 2.31 Incidence, prevalence, density, and specificity index (SI) of ectoparasites of Myotis nigricans. . . . . . . . . . . . . . . . . . .. . . . . . . . . . . . . . . . . . 103 2.32 Incidence, prevalence, density, and specificity index (SI) of ectoparasites of Myotis riparius. . . . . . . . . . . . . . . . . . . . . . . . . . . . . . . . . . . . . . 104 2.33 Incidence, prevalence, density, and specificity index (SI) of ectoparasites of Myotis simus. . . . . . . . . . . . . . . . . . . . . . . . . . . . . . . . . . . . . . . .105 2.34 Incidence, prevalence, density, and specificity index (SI) of ectoparasites of Eumops bonariensis. . . . . . . . . . . . . . . . . . . . . . . . . . . . . . . . . . 106 2.35 Incidence, prevalence, density, and specificity index (SI) of ectoparasites of Eumops dabbenei. . . . . . . . . . . . . . . . . . . . . . . . . . . . . . . . . . . . 107 2.36 Incidence, prevalence, density, and specificity index (SI) of ectoparasites of Eumops glaucinus. . . . . . . . . . . . . . . . . . . . . . . . . . . . . . . . . . . 108 2.37 Incidence, prevalence, density, and specificity index (SI) of ectoparasites of Eumops patagonicus. . . . . . . . . . . . . . . . . . . . . . . . . . . . . . . . . 109 2.38 Incidence, prevalence, density, and specificity index (SI) of ectoparasites of Eumops perotis. . . . . . . . . . . . . . . . . . . . . . . . . . . . . . . . . . . . . .110 2.39 Incidence, prevalence, density, and specificity index (SI) of ectoparasites of Molossops abrasus. . . . . . . . . . . . . . . . . . . . . . . . . . . . . . . . . . . 111 2.40 Incidence, prevalence, density, and specificity index (SI) of ectoparasites of Molossops planirostris. . . . . . . . . . . . . . . . . . . . . . . . . . . . . . . . 112 2.41 Incidence, prevalence, density, and specificity index (SI) of ectoparasites of Molossops temminckii. . . . . . . . . . . . . . . . . . . . . . . . . . . . . . . . 113 2.42 Incidence, prevalence, density, and specificity index (SI) of ectoparasites of Molossus ater. . . . . . . . . . . . . . . . . . . . . . . . . . . . . . . . . . . . . . . 114 2.43 Incidence, prevalence, density, and specificity index (SI) of ectoparasites of Molossus currentium. . . . . . . . . . . . . . . . . . . . . . . . . . . . . . . . . 115

xiii
2.44 Incidence, prevalence, density, and specificity index (SI) of ectoparasites of Molossus molossus. . . . . . . . . . . . . . . . . . . . . . . . . . . . . . . . . . . 116 2.45 Incidence, prevalence, density, and specificity index (SI) of ectoparasites of Nyctinomops laticaudatus. . . . . . . . . . . . . . . . . . . . . . . . . . . . . 117 2.46 Incidence, prevalence, density, and specificity index (SI) of ectoparasites of Promops centralis. . . . . . . . . . . . . . . . . . . . . . . . . . . . . . . . . . . 118 2.47 Incidence, prevalence, density, and specificity index (SI) of ectoparasites of Promops nasutus. . . . . . . . . . . . . . . . . . . . . . . . . . . . . . . . . . . . .119 2.48 Host specificity of arthropods ectoparasitic on bats of Paraguay using all observed associations from this study. . . . . . . . . . . . . . . . . . 120 2.49 Host specificity of arthropods ectoparasitic on bats of Paraguay using only primary host associations. . . . . . . . . . . . . . . . . . . . . . . . . . 125 2.50 Species abundance distributions of the ectoparasite communities on each of 39 host species. . . . . . . . . . . . . . . . . . . . . . . . . . . . . . . 130 2.51 Comparisons of the primary ectoparasite species abundance distributions (SADs) of 24 host species with the predictions of the geometric series and broken stick models. . . . . . . . . . . . . . . . . . . . . . . . . 134 2.52 Comparison of spinturnicid infestation rates on chiropteran hosts from Venezuela and Paraguay. . . . . . . . . . . . . . . . . . . . . . . . . . . . . . . . . . 135 2.53 Comparison of Periglischrus host specificity on chiropteran hosts from Venezuela and Paraguay. . . . . . . . . . . . . . . . . . . . . . . . . . . . . . . . . . 138 3.1 For the 22 common host species, the average forearm length, mass, and sample size, total number of ectoparasites collected and 9 measures of ectoparasite diversity. . . . . . . . . . . . . . . . . . . . . . . 176 3.2 Results of simple and multiple regression analyses determining the effect of host body size on total ectoparasite abundance (TEA) for all hosts, host families, and host species. . . . . . . . . . . . . . . . . . . . . . . . . . . . . . . . . . . . . . . . . . . . . . . . . . 179 3.3 Significance of multivariate (MANOVA) and univariate (ANOVA) analyses of sexual dimorphism in size for each of 19 common host species. . . . . . . . . . . . . . . . . . . . . . . . . . . . . . . . . . . . . . . . . 181

xiv
3.4 Results of simple and multiple regression analyses determining the effect of host body size on familial ectoparasite abundance (FEA) for all hosts as a group, for each primary host species, and for each primary host family. . . . . . . . . . . . . . . 182 3.5 Significance levels and correlation coefficients for analyses of covariance determining the effect of host sex on familial ectoparasite abundance after removing the effect of host size. . . . . . . . . . . . . . .186 3.6 Results of simple and multiple regression analyses determining the effect of host body size on specific ectoparasite abundance (SEA) for all hosts as a group, for each primary host species, and for each primary host family. . . . . . . . . . . . . . . 189 3.7 Significance levels and correlation coefficients for analyses of covariance determining the effect of host sex on specific ectoparasite abundance after removing the effect of host size. . . . . . . . . . . . . . .194 3.8 Results of simple and multiple regression analyses determining the effect of host body size on ectoparasite biodiversity for all hosts as a group and for each host family. . . . . . . . . . . . . . . 197 4.1 Results of simple regression analyses determining the effect of regional host abundance on the biodiversity of ectoparasite assemblages from all hosts as a group and for each host family. . . . . . . . . . . . . . . . . . . . . . . . . . . . . . . . . . . . . . . . . . . . . . . . . . 230 4.2 Results of simple regression analyses determining the effect of local host abundance on the biodiversity of ectoparasite assemblages from common, wide-spread species of phyllostomid bat. . . . . . . . . . . . . . . . . . . . . . . . . . . . . . . . . . . . . . . . . . . . . . . . . .232 4.3 Results of simple regression analyses determining the effect of local host abundance on the biodiversity of ectoparasite assemblages from common, wide-spread species of vespertilionid bat. . . . . . . . . . . . . . . . . . . . . . . . . . . . . . . . . . . . . . . . . . . . . . . . . 234 4.4 Results of simple regression analyses determining the effect of local host abundance on the biodiversity of ectoparasite assemblages from common, wide-spread species of molossid bat. . . . . . . . . . . . . . . . . . . . . . . . . . . . . . . . . . . . . . . . . . . . . . . . . . . . . 236 4.5 Results of simple regression analyses determining the effect of local host abundance on the biodiversity of ectoparasite

xv
assemblages from the entire host assemblage and for each common host family. . . . . . . . . . . . . . . . . . . . . . . . . . . . . . . . . . . . . . . . . . . . . . .238 4.6 Results of simple regression analyses determining the relationships between host abundance, host species richness, and number of rare host species from the entire host assemblage and for each common host family. . . . . . . . . . . . . . . . . . . . . . . . . . 240 A.1 Description of 28 sites at which bats were collected from Paraguay. . . . . . . . . . . . . . . . . . . . . . . . . . . . . . . . . . . . . . . . . . . . . . . . . . . . . . . . 248

xvi
LIST OF FIGURES
2.1 Map of the locations of the 28 collection sites throughout Paraguay. . . . . . . . . . . . . . . . . . . . . . . . . . . . . . . . . . . . . . . . . . . . . . . . . . . . . . . . 139 D.1 Species abundance distribution of the ectoparasite species collected from Noctilio albiventris. . . . . . . . . . . . . . . . . . . . . . . . . . . . . . . . . . . .281 D.2 Species abundance distribution of the ectoparasite species collected from Noctilio leporinus. . . . . . . . . . . . . . . . . . . . . . . . . . . . . . . . . . . . .282 D.3 Species abundance distribution of the ectoparasite species collected from Chrotopterus auritus. . . . . . . . . . . . . . . . . . . . . . . . . . . . . . . . . . 283 D.4 Species abundance distribution of the ectoparasite species collected from Tonatia bidens. . . . . . . . . . . . . . . . . . . . . . . . . . . . . . . . . . . . . . . 284 D.5 Species abundance distribution of the ectoparasite species collected from Tonatia brasiliense. . . . . . . . . . . . . . . . . . . . . . . . . . . . . . . . . . . .285 D.6 Species abundance distribution of the ectoparasite species collected from Glossophaga soricina. . . . . . . . . . . . . . . . . . . . . . . . . . . . . . . . . 286 D.7 Species abundance distribution of the ectoparasite species collected from Carollia perspicillata. . . . . . . . . . . . . . . . . . . . . . . . . . . . . . . . . .287 D.8 Species abundance distribution of the ectoparasite species collected from Desmodus rotundus. . . . . . . . . . . . . . . . . . . . . . . . . . . . . . . . . . . 288 D.9 Species abundance distribution of the ectoparasite species collected from Diaemus youngi. . . . . . . . . . . . . . . . . . . . . . . . . . . . . . . . . . . . . . 289 D.10 Species abundance distribution of the ectoparasite species collected from Artibeus fimbriatus. . . . . . . . . . . . . . . . . . . . . . . . . . . . . . . . . . . 290 D.11 Species abundance distribution of the ectoparasite species collected from Artibeus jamaicensis. . . . . . . . . . . . . . . . . . . . . . . . . . . . . . . . . . 291 D.12 Species abundance distribution of the ectoparasite species collected from Artibeus lituratus. . . . . . . . . . . . . . . . . . . . . . . . . . . . . . . . . . . . . 292 D.13 Species abundance distribution of the ectoparasite species collected from Platyrrhinus lineatus. . . . . . . . . . . . . . . . . . . . . . . . . . . . . . . . . . 293

xvii
D.14 Species abundance distribution of the ectoparasite species collected from Pygoderma bilabiatum. . . . . . . . . . . . . . . . . . . . . . . . . . . . . . . . . 294 D.15 Species abundance distribution of the ectoparasite species collected from Sturnira lilium. . . . . . . . . . . . . . . . . . . . . . . . . . . . . . . . . . . . . . . 295 D.16 Species abundance distribution of the ectoparasite species collected from Natalus stramineus. . . . . . . . . . . . . . . . . . . . . . . . . . . . . . . . . . . .296 D.17 Species abundance distribution of the ectoparasite species collected from Eptesicus brasiliensis. . . . . . . . . . . . . . . . . . . . . . . . . . . . . . . . . . 297 D.18 Species abundance distribution of the ectoparasite species collected from Eptesicus diminutus. . . . . . . . . . . . . . . . . . . . . . . . . . . . . . . . . . . 298 D.19 Species abundance distribution of the ectoparasite species collected from Eptesicus furinalis. . . . . . . . . . . . . . . . . . . . . . . . . . . . . . . . . . . . 299 D.20 Species abundance distribution of the ectoparasite species collected from Histiotus macrotus. . . . . . . . . . . . . . . . . . . . . . . . . . . . . . . . . . . . 300 D.21 Species abundance distribution of the ectoparasite species collected from Lasiurus blossevillii. . . . . . . . . . . . . . . . . . . . . . . . . . . . . . . . . . . 301 D.22 Species abundance distribution of the ectoparasite species collected from Lasiurus ega. . . . . . . . . . . . . . . . . . . . . . . . . . . . . . . . . . . . . . . . .302 D.23 Species abundance distribution of the ectoparasite species collected from Myotis albescens. . . . . . . . . . . . . . . . . . . . . . . . . . . . . . . . . . . . . 303 D.24 Species abundance distribution of the ectoparasite species collected from Myotis nigricans. . . . . . . . . . . . . . . . . . . . . . . . . . . . . . . . . . . . . .304 D.25 Species abundance distribution of the ectoparasite species collected from Myotis riparius. . . . . . . . . . . . . . . . . . . . . . . . . . . . . . . . . . . . . . . 305 D.26 Species abundance distribution of the ectoparasite species collected from Myotis simus. . . . . . . . . . . . . . . . . . . . . . . . . . . . . . . . . . . . . . . . .306 D.27 Species abundance distribution of the ectoparasite species collected from Eumops bonariensis. . . . . . . . . . . . . . . . . . . . . . . . . . . . . . . . . . . 307 D.28 Species abundance distribution of the ectoparasite species

xviii
collected from Eumops dabbenei. . . . . . . . . . . . . . . . . . . . . . . . . . . . . . . . . . . . . 308 D.29 Species abundance distribution of the ectoparasite species collected from Eumops glaucinus. . . . . . . . . . . . . . . . . . . . . . . . . . . . . . . . . . . . 309 D.30 Species abundance distribution of the ectoparasite species collected from Eumops patagonicus. . . . . . . . . . . . . . . . . . . . . . . . . . . . . . . . . . 310 D.31 Species abundance distribution of the ectoparasite species collected from Eumops perotis. . . . . . . . . . . . . . . . . . . . . . . . . . . . . . . . . . . . . . .311 D.32 Species abundance distribution of the ectoparasite species collected from Molossops abrasus. . . . . . . . . . . . . . . . . . . . . . . . . . . . . . . . . . . . 312 D.33 Species abundance distribution of the ectoparasite species collected from Molossops planirostris. . . . . . . . . . . . . . . . . . . . . . . . . . . . . . . . .313 D.34 Species abundance distribution of the ectoparasite species collected from Molossops temminckii. . . . . . . . . . . . . . . . . . . . . . . . . . . . . . . . . 314 D.35 Species abundance distribution of the ectoparasite species collected from Molossus ater. . . . . . . . . . . . . . . . . . . . . . . . . . . . . . . . . . . . . . . . 315 D.36 Species abundance distribution of the ectoparasite species collected from Molossus currentium. . . . . . . . . . . . . . . . . . . . . . . . . . . . . . . . . . 316 D.37 Species abundance distribution of the ectoparasite species collected from Molossus molossus. . . . . . . . . . . . . . . . . . . . . . . . . . . . . . . . . . . . 317 D.38 Species abundance distribution of the ectoparasite species collected from Nyctinomops laticaudatus. . . . . . . . . . . . . . . . . . . . . . . . . . . . . . 318 D.39 Species abundance distribution of the ectoparasite species collected from Promops centralis. . . . . . . . . . . . . . . . . . . . . . . . . . . . . . . . . . . . 319

1
CHAPTER I
INTRODUCTION
Community ecology fundamentally addresses two interrelated questions: (1)
what determines the number of species in a community, and (2) what processes are
responsible for the identity of those species (Strong et al. 1984). Community may be
defined broadly as “a collection of species occurring in the same place at the same time”
(Fauth et al. 1996). Accordingly, assemblages are “phylogenetically related groups
within a community” (Fauth et al. 1996). Ecological and evolutionary determinants (e.g.,
competition, productivity) and the availability of species (i.e., species pool) combine to
determine the number, identity, and relative abundances of species that occur in a
community or assemblage. Collectively, these characteristics define community
structure. Indeed, structure implies that patterns of species coexistence depart from
patterns derived from stochastic processes, such as those produced by null models
(Poulin 1997). However, mechanisms that structure communities may operate at several
scales of time and space. In addition, patterns at one scale may be a result of mechanisms
operating at a different scale (Pickett et al. 1994). Therefore, it is often necessary to look
for patterns at local and regional scales, as well as in ecological and evolutionary time, to
understand which mechanisms determine community structure.
Systematics, ecology, and paleontology must be integrated in biogeographic
studies that endeavor to define patterns and identify causal mechanisms at regional,
continental, or global scales. Biogeographic processes per se may not exist; however,
large scale geoclimatic (e.g., tectonic plate movements, changes in sea level, climate, and
oceanic circulation), evolutionary (e.g., adaptation, speciation, extinction), and ecological
(e.g., predation, competition) processes operate in concert to produce biogeographic
patterns. Indeed, dispersal, the geographic translocation of individuals, may be the only
truly biogeographic process (Myers and Giller 1988).
The equilibrium theory of island biogeography (MacArthur and Wilson 1963,
1967) is a mechanistic theory which provides a framework within which ecological

2
processes, biogeographical patterns, and paleontological data are merged in a synthetic
manner (Myers and Giller 1988). Islands possess many tractable qualities that make
them attractive research foci. An island is less complex than a continent or ocean, and is
visibly discreet so that resident populations may be distinguished more easily. In
addition, by their abundance, as well as variation in shape, size, degree of isolation, and
ecology, islands provide the replication necessary to conduct natural or non-manipulative
experiments. The equilibrium theory of island biogeography (ETIB) predicts that larger
islands maintain greater species richness than do smaller islands, and that islands more
distant from a source area support fewer species than do islands closer to a source area
(MacArthur and Wilson 1963, 1967). Distance affects richness primarily by molding
immigration rates, whereas area affects richness primarily by molding extinction rates.
The ETIB makes predictions about species richness and turnover, but predicts
nothing about relative species abundances. Nonetheless, qualitative predictions about
species compositions on islands are possible based on evolutionary theory. Low primary
diversity on islands (i.e., species diversity due to immigration) promotes in situ
diversification, with more isolated islands evincing larger adaptive radiations. Whether
intra-island or inter-island speciation is more important depends on dispersal ability of
taxa and opportunities for isolation from parent populations (Paulay 1994). Compared to
continents, small areas and increased isolation of islands result in relatively small
populations, which make island species especially vulnerable to local extinction.
Consequently, islands provide biotas with opportunities for larger radiations and more
frequent in situ diversification than occur on mainlands, while simultaneously exposing
island species to greater risk of extinction. Understanding of patterns of species richness
has benefited from application of ETIB to island systems including habitat patches, lakes,
caves, mountaintops, and host-parasite systems. The application of ETIB to host-
ectoparasite systems seemed natural it ectoparasitologists because two of the primary
factors that determine ectoparasite diversity are host body size and distance to a source of
infestation, which are analogous to island size and distance to a source population
(Dritschilo et al. 1975, Kuris et al. 1980).

3
Arthropod ectoparasites infest most vertebrate species. Because each host
individual harbors an assemblage of ectoparasites, these systems provide opportunities to
use non-manipulative experiments to study factors that structure assemblages (or
communities). Hosts are habitat patches (i.e., islands) to their ectoparasites. In addition
host individuals differ in size and age, and are members of populations and communities
that vary in density, behavior, social organization, and phylogenetic affinity. Because
variation in host traits are analogous to that observed on islands or across landscapes,
ectoparasite assemblages provide opportunities to understand phenomena that are
difficult to study at larger scales.
Host phylogeny, body size, and morphology interact to determine patterns of
coexistence as well as the geographic distributions of arthropod ectoparasites (Freeland
1983, Gettinger and Ernest 1995). The close association of arthropod ectoparasites, most
of which are obligate parasites, with their mammalian hosts often leads to specialization
and host specificity. Host-specific adaptations often prevent ectoparasite species from
successfully infesting alternate host species. In addition, chiropteran biology provides
mechanisms that allow bats to serve as isolated evolutionary units (i.e., islands), such that
their ectoparasite assemblages follow distinct evolutionary trajectories.
A multi-faceted approach is required to understand comprehensively factors that
contribute to the structure of arthropod ectoparasite assemblages on bats. Therefore, I
investigated assemblages at multiple taxonomic levels from the perspective of both host
and ectoparasite species. First, I quantitatively describe the arthropod assemblages on
bats of Paraguay, present patterns of host specificity, and investigate resource partitioning
and species abundance distributions of ectoparasite assemblages for common species of
bats (Chapter II). Second, I assess the importance of host body size on ectoparasite
biodiversity (e.g. abundance, richness, and diversity) within the context of ETIB (Chapter
III). Third, I assess the effect of host abundance on ectoparasite biodiversity within the
context of ETIB (Chapter IV). I conclude with a synthesis concerning the effect of host
traits on ectoparasite assemblages, and discuss ramifications for studies of biogeography
and landscape ecology.
4
Literature Cited
Dritschilo, W., H. Cornell, D. Nafus, and B. O’Connor. 1975. Of mice and mites. Science 190:467-469.
Fauth, J. E., J. Bernardo, M. Camara, W. J. Resetarits, Jr., J. Van Buskirk, and S. A.
McCollum. 1996. Simplifying the jargon of community ecology: a conceptual approach. The American Naturalist 147:282-286.
Freeland, W. J. 1983. Parasites and the coexistence of animal host species. The
American Naturalist 121:223-236. Gettinger, D., and K. A. Ernest. 1995. Small-mammal community structure and the
specificity of ectoparasite associations in central Brazil. Revista Brasiliera de Biologia 55:331-341.
Kuris, A. M., A. R. Blaustein, and J. J. Alió. 1980. Hosts as islands. The American
Naturalist 116:570-586. MacArthur, R. H., and E. O. Wilson. 1967. The theory of island biogeography.
Princeton University Press, Princeton, New Jersey. MacArthur, R. H., and E. O. Wilson. 1963. An equilibrium theory of insular
zoogeography. Evolution 17:373-387. Myers, A. A., and P. S. Giller. 1988. Process, pattern and scale in biogeography. Pp 3-
21, in Analytical biogeography: an integrated approach to the study of animal and plant distributions (A. A. Myers and P. S. Giller eds.). Chapman and Hall, New York, New York.
Paulay, G. 1994. Biodiversity on oceanic islands: its origin and extinction. American
Zoologist 34:134-144. Pickett, S. T. A., J. Kolasa, and C. G. Jones. 1994. Integration in ecology. Pp. 3-25, in
Ecological understanding: the nature of theory and the theory of nature. Academic Press, New York, New York.
Poulin, R. 1997. Species richness of parasite assemblages: evolution and patterns.
Annual Review of Ecology and Systematics 28:341-358. Strong, D. R., Jr., D. Simberloff, L. G. Abele, and A. B. Thistle (eds.). 1984. Ecological
communities: conceptual issues and the evidence. Princeton University Press, Princeton, New Jersey, New York.

5
CHAPTER II
NATURAL HISTORY OF ARTHROPODS ECTOPARASITIC
ON THE BATS OF PARAGUAY
Introduction
Bats and Their Ectoparasites as Model Systems
Assemblages of arthropod ectoparasites on bats provide an exemplary system for
assessing the effects of ecological and evolutionary mechanisms on patterns of species
richness, community structure, and diversity. Host phylogeny, body size, and
morphology interact to determine patterns of coexistence as well as the geographic
distributions of arthropod ectoparasites (Freeland 1983, Gettinger and Ernest 1995).
Ectoparasites evince different levels of host specificity, the tendency of parasites to be
restricted to particular host species (Margolis et al. 1982), and may be monoxenous
(inhabit a single host species), oligoxenous (inhabit > 2 host species of the same genus),
pleioxenous (inhabit > 2 genera in the same subfamily), or polyxenous (inhabit hosts
from different subfamilies). Specificity may be related to ecological factors associated
with host individuals (e.g., physical isolation, climatic restriction, host predation),
evolutionary factors associated with host lineages (e.g., morphological or physiological
adaptations), or interspecific competition among ectoparasites. The degree to which
these factors influence host specificity is affected by the life history characteristics of
ectoparasites (i.e., ectoparasites that rarely leave the host are more susceptible to factors
leading to specificity; Wenzel and Tipton 1966b).
When species of a host assemblage (e.g., a bat assemblage) evince little niche
overlap, opportunities for exchange of ectoparasites among host species are rare,
predisposing host-specific ectoparasitic assemblages. In contrast, the opportunity for
ectoparasite exchange is greater in species-rich host communities that comprise species
that share resources and microhabitats, especially those associated with roosts. This
selects against species-specific ectoparasitic assemblages (Gettinger and Ernest 1995). In

6
addition, high host species richness and likely elevated numbers of host individuals may
result in a more species-rich ectoparasite assemblage because of an increase in resources.
Four generalizations can be made about ectoparasites that infest communities of
similar host species (Freeland 1983). First, most parasite species successfully parasitize
relatively few of the potential host species. Second, the more common parasites of one
host species are usually not the more common parasites of other host species. Third,
different host species do not harbor the same sets of parasite species. Finally, species of
parasites that are shared by different host species usually do not infest them at similar
frequencies.
Differences in body size, morphology, and feeding behavior among coexisting
host species may be responsible for determining which of the available parasites a host is
likely to acquire in nature (Freeland 1983). Although, closely related hosts may be
susceptible to invasion by similar parasites, only host species that are adapted to cope
with parasitic infestation survive. Therefore, when alternate host species invade a
community, they may be infested and killed by parasites contracted from established
hosts that serve as transmission vectors but are not affected as negatively by the parasites.
Thus, parasite assemblages may structure host communities by precluding syntopy
(Freeland 1983, Gaston 1996). In addition, observational data on ectoparasites of New
World molossids (i.e., host species with polyctenids harbor no nycteribiids or streblids,
and nycteribiids and streblids do not occur on the same host individual) suggest that
competition may structure ectoparasite communities (Marshall 1982a, Wenzel and Tipton
1966b). Many catalogs and taxonomic works exist concerning New World bat
ectoparasites, especially for the family Streblidae (e.g., Guerrero 1993, 1994a, 1994b,
1995a, 1995b, 1996, 1997, Wenzel 1976, Wenzel and Tipton 1966b). However,
ecological aspects of these communities largely have been ignored, in part because most
studies of ectoparasites are born of opportunity and not of design. Generally, biologists
make ectoparasite collections as an ancillary consequence of studying a vertebrate host.
This results in haphazard collections of ectoparasites from already dead specimens,
increasing the chance of contamination and inaccurate assignment of host-parasite

7
associations. Such ectoparasite collections may be biased and are far from
comprehensive (Marshall 1982, Wenzel and Tipton 1966a).
Study Area and Bat Fauna
Paraguay is a small country (406,752 km2), approximately the size of the state of
California, located in the heart of South America, where it is transected by the Tropic of
Capricorn (Figure 2.1). It occurs at an interface of temperate and subtropical climates,
and comprises a diverse suite of biomes, ranging from mesic (e.g., Atlantic Rainforest,
Pantanal) to xeric (e.g., Chaco) habitats. Topography is relatively flat and low-lying,
especially in the west (Bertoni and Gorham 1973, Fariña Sanchez 1973, Gorham 1973).
Based on floral and geographic features, the country includes seven phytogeographic
regions or biomes (Table 2.1): Matogrosense, Alto Chaco, Bajo Chaco, Ñeembucú,
Campos Cerrados, Central Paraguay, and Alto Paraná (Hayes 1995, Willig et al. 2000).
Much of the country, especially areas to the east of the Río Paraguay, has experienced
extensive deforestation and fragmentation (Unruh 1973, Gorresen and Willig 2004),
especially in the last two decades, and is dominated by agricultural landscapes (Gorresen
and Willig 2004, Universidad Nacional de Asunción 1994).
Vegetative Setting. Three biomes compose the Chaco of western Paraguay
(Figure 2.1). The Matogrosense biome is characterized by medium height (10 - 20 m)
trees and sub-humid forests with dense undergrowth (e.g., bromeliads). It often is
inundated, not only as a result of local rainfall, but more generally as a consequence of
rains in the Brazilian Pantanal, which drain into the Río Paraguay. The Alto Chaco
biome constitutes more than half of western Paraguay and despite its flat topography, is
seldom inundated because rainfall is low and edaphic features facilitate water percolation.
It is semi-arid and dominated by relatively short (5 - 10 m), dense, xerophytic thorn-scrub
forest with a well-developed understory (terrestrial bromeliads and arborescent cacti).
The Bajo Chaco biome comprises extensive palm savannas interdigitating with medium
height (8 - 15 m), xerophytic, scrub forest on slightly elevated terrain. Corridors of taller
(10 - 20 m), sub-humid, riparian forest parallel a series of meandering rivers and

8
intermittent streams that flow slowly eastward to the Río Paraguay. Extensive
marshlands dominate areas adjacent to the riparian zones and the entire area is inundated
seasonally for many months.
Eastern Paraguay comprises four biomes (Figure 2.1) that are the most
topographically heterogeneous and humid regions of the country. The Campos Cerrados
biome is a savanna formation characterized by a mosaic of dense forests, xerophytic
woodlands (8 - 20 m), and grasslands. The topography is gently rolling, with the
highlands supporting sub-humid forests (20 - 50m), and areas to the west containing
patches of xerophytic forest, sub-humid forest, and palm savanna reminiscent of adjacent
Chaco formations. The Central Paraguay biome is ecologically the most heterogeneous
biome in Paraguay. In the west, along the Río Paraguay, it contains marshes, palm
savannas, and patches of low humid deciduous forest, with more hilly terrain to the east
supporting taller humid forests that are now fragmented as a consequence of timber
management practices. Rivers in this biome are sluggish, bordered by marshes, and drain
to the Río Paraguay. The Alto Paraná biome is characterized by rolling hills that are
deeply cut by fast-flowing tributaries of the Río Paraná. Although historically dominated
by tall (> 25 m), humid, deciduous forests, the region has been subject to severe
deforestation and extensive flooding as a result of large and permanent impoundments
(e.g., Represa de Itaipú). Nonetheless, several areas (e.g., Parque Nacional San Rafael,
Estancia Rivas, Estancia Golondrina – Figure 1, Table A.1) have been protected and are
relatively undisturbed. The Ñeembucú biome is dominated by extensive, seasonally
inundated, wetlands associated with the confluence of the Río Paraguay and Río Paraná,
and grasslands in flat, low terrain with slow moving rivers. Palm savannas typical of the
Chaco and patches of low (8 - 15 m), sub-humid, Chaco-like forest are interspersed with
formations more typical of eastern Paraguay. This biome represents a transition between
the Chaco to the west and the taller humid forests of the eastern biomes (Hueck 1972).
Host Assemblage. Fifty-four species of bat are known from Paraguay (López-
González 1998, 2005, Willig et al. 2000) representing six families and a diverse suite of
feeding guilds including frugivores, insectivores, nectarivores, piscivores, and

9
sanguinivores (Table 2.2). This diversity of foraging strategies, combined with specific
roost requirements of many species, effectively isolates many host species from each
other, ostensibly facilitating host-specific ectoparasite assemblages. In addition, bats
belonging to different guilds may be isolated geographically; insectivores are dominant in
xeric regions and frugivores in mesic regions (Willig et al. 2000).
Ectoparasite Assemblage. In the New World, five families of insects are
ectoparasitic on bats (Marshall 1982a), and most (four) are exclusively associated with
bats (Table 2.3). Similarly, ten of 13 families of mites found on New World bats are
exclusive to bats (Webb and Loomis 1977). Despite the cosmopolitan nature of many
ectoparasite families, most species occur on a single host species or genus (Kim 1985,
Marshall 1982a, Wenzel and Tipton 1966a).
The evolution of phylogenetically old and morphologically well-adapted groups
of permanent ectoparasites occurred in parallel with that of their host (Dusbábek 1969a).
Although these evolutionary processes (e.g., speciation, extinction, natural selection)
should produce distinctive patterns of organization in parasite communities on mammals
(Kim 1985), most work on ectoparasites remains focused on the description of species,
taxonomy, and systematics, nearly always focusing on the ectoparasites themselves while
referring to hosts only briefly. Recently, investigators have begun to examine patterns of
ectoparasite assemblages on rodents (Gettinger and Ernest 1995) or bats (Gannon and
Willig 1995) in attempts to investigate the role of host species and environmental factors
in structuring these assemblages. The high diversity of bats and their ectoparasites in
Paraguay, where tropical and temperate species reach their southern and northern termini,
respectively, make this an ideal system to study ecological and evolutionary effects of
isolation on ectoparasite assemblages.
Ectoparasite Natural History – Insecta
Insects ectoparasitic on bats spend their entire lives on the bodies or in the roosts
of their hosts (Marshall 1982a). Because most bat species are tropical, most bat
ectoparasites live in relatively amenable environments. These ectoparasitic insects range

10
in size from 1 - 27 mm and are flattened, either laterally or dorso-ventrally, so they can
move easily through dense pelage or press themselves close to the body of their hosts. In
addition, they are equipped with numerous setae and powerful claws that reduce abrasive
damage, aid in locomotion, and help to maintain a firm grip on hosts (Marshall 1982a).
Moreover, ectoparasites have behavioral adaptations that reduce the chance of
dislodgement and ensure that they pass most of their lives in sites with low risk of
mortality. All stages of insects that are parasitic on bats feed solely on host blood, with
the exception of larval fleas that live in host guano. Survivorship without a meal for
adult flies is < 30 hours and for larva is < 7 hours. Adult fleas can survive up to four
days without food. Reproduction may occur year-round in all insects with reduced rates
on hibernating hosts in temperate regions. Host grooming activity is a major cause of
mortality in permanent ectoparasitic insects (Marshall 1982a). If hosts are ineffective at
grooming due to poor health or deformities, ectoparasite populations can increase quickly
(Marshall 1982a). Such high populations rarely cause poor host health, but are
consequences of it (Marshall 1982a).
Streblidae and Nycteribiidae. Streblids and nycteribiids have three nymphal
instars within the adult female, pupae are deposited in the roost, and adults live almost
entirely on the host (Marshall 1982a). Bat flies undergo adrenotrophic vivaparity (i.e.,
the complete larval life cycle occurs within the female uterus). Females leave the host to
deposit the 3rd instar, in the roost away from the immediate vicinity of the host so as to
protect it from host-induced mortality (Marshall 1982a). Increases in ambient
temperature, which typically occur during the day, likely trigger instar deposition.
Streblid reproductive rates are thought to be lower than those of nycteribiids, which
produce an offspring every nine days with a maximum of 16 per female. Adults feed as
soon as they find a host and thereafter every few hours. Newly emerged adults live up to
three days without a first meal, but flies that already have fed usually die in < 1 day.
These flies move well by walking, jumping, or flying short distances, and thus do not
require direct body contact for host transfer. Their life cycle is about one month in
duration, allowing up to 12 generations per year, as these insects are largely tropical.

11
Adult nycteribiids range in size from 1.5 – 5.0 mm in length. Generally, streblids infest
phyllostomids or noctilionids, whereas nycteribiids infest vespertilionids (Marshall
1982a).
Polyctenidae. These bat bugs are viviparous with three nymphal instars; adults
always reside on the host. Reproductive rates are thought to be considerably lower than
those of nycteribiids. Polyctenids may reach sexual maturity and mate before molting to
the adult stage (Hagan 1951). They require blood meals every few hours, only inhabit
colonial hosts that roost in caves or tree holes, and require body contact to transfer from
host to host. In addition, polyctenids never have been found off the host body and appear
incapable of locomotion elsewhere (Marshall 1971, 1982a, 1982b). In the New World,
polyctenids are restricted to molossids and emballonurids (Marshall 1982a).
Ischnopsyllidae. Fleas are oviparous with three larval instars; pupae live in the
roost and adults reside on the host (Marshall 1982a). Unlike other oviparous insects
parasitic on bats, which deposit eggs in the host’s roost, fleas deposit eggs haphazardly,
most falling to the ground where they hatch and larvae develop. Ischnopsyllid
reproductive rates are not available; however, based on the biology of other fleas, they
probably lay many eggs per day and hundreds in a lifetime. Adults take a blood meal as
soon as they find a host and then once every few hours. Whereas 94% of the 2000 plus
species of known fleas parasitize mammals, only 5% of these are known from bats.
Moreover, bat fleas are seldom common or abundant on host individuals. The reliance of
immature flea stages on a stable host home (e.g., rodent or bird nests) may account for
their relatively low rates of occurrence on bats, which may change roost location more
frequently than do other hosts. Generally, fleas are found on molossids and
vespertilionids (Marshall 1982a).
Ectoparasite Natural History – Acarina
Arachnids (i.e., mites and ticks) ectoparasitic on bats may spend their entire lives
on the bodies of their hosts, as in the Spinturnicidae (Rudnick 1960) and Macronyssidae
(Radovsky 1966), or may feed once and drop off of the host, as in the Argasidae (Oliver

12
1989), with the potential to spend each stage of their life cycle on a different host species.
Unlike ectoparasitic insects, which are all obligate parasites throughout their life cycle
and are highly host-specific, arachnids may be parasitic during only a single stage in their
life cycle (e.g., Trombiculidae) or a single individual may parasitize animals of different
classes (e.g., Argasidae). Ectoparasitic arachnids that occur on bats range in size from
150 microns to over 3 mm, and are usually dorso-ventrally flattened so they can move
easily through dense pelage, adhere to patagia, or press themselves close to the host’s
body. In addition, they are equipped with numerous setae and powerful claws that reduce
abrasive damage, aid in locomotion, and help maintain a firm grip on the host. Some
mites die within a couple of days of removal from the host, whereas ticks may survive
over four years without feeding.
Spinturnicidae. Spinturnicids are exclusively parasitic on bats and inhabit the
wing and tail membranes (Rudnick 1960). These mites have strong legs with immovable
coxae and are dorso-ventrally flattened to facilitate adherence to smooth hairless patagia.
In addition, they adhere to and move over wing and tail membranes equally well, whether
their dorsal or ventral side is against the host. They locomote poorly when not on patagia
and die within two days of removal from the host. The life cycle of spinturnicids is
reduced greatly, with the egg and larval stages occurring within an adult female, which
gives birth directly to the protonymph. All independent life stages (protonymph,
deutonymph, and adult) feed on blood and possibly lymphatic fluids. Mormoopids,
phyllostomids, and vespertilionids are the primary hosts for New World spinturnicids
(Rudnick 1960, Herrin and Tipton 1975).
Macronyssidae. Macronyssids parasitize bats, marsupials, rodents, and birds, and
are known vectors of murine typhus, rickettsial pox, equine encephalitis, and coxsackie
virus disease, which they may transmit to humans (Saunders 1975). The Macronyssidae
likely evolved from the Laelapidae, which commonly parasitize rodents and birds, and
have been documented on Old World bats (Radovsky 1966). Macronyssids have
undergone a number of adaptive radiations, including the early times of Neotropical bat
diversification. This likely led to several endemic genera on the Phyllostomoidea (e.g.,

13
Parichoronyssus, Radfordiella, Macronyssoides – Saunders 1975). A second radiation
involved the invasion of the ornithonyssines from the north and gave rise to
Chiroptonyssus, which infest molossids.
Engorged females produce single unembryonated eggs and lay them in the host’s
roost (Radovsky 1967). Larvae hatch and molt into protonymphs without feeding.
Protonymphs must find a host and obtain a blood meal. After engorging, they leave the
host, pass through a quiescent period, and molt into deutonymphs, which are inactive and
do not feed before molting into adults (Radovsky 1967). Adults may mate soon after the
last molt; females engorge greatly, whereas males take smaller meals and change little in
size. Non-engorged adults are 500 - 600 microns; engorged females reach up to 1,200
microns. In addition to several families of bats (e.g., Emballonuridae, Nycteridae,
Noctilionidae, Phyllostomidae, Vespertilionidae, Molossidae), in the New World
macronyssids occur on reptiles, birds, marsupials, and rodents (Radovsky 1967, Saunders
1975).
Argasidae. Argasids (soft ticks) comprise about 170 species belonging to four
genera, with Ornithodoros (100 species) and Argas (56 species) being most common
(Crampton et al. 1996, Oliver 1989). The general argasid life cycle includes egg, larva, 2
- 8 (usually 3 - 4) nymphal instars, and the adult male and female.
Like all ticks, argasids are obligate sanguinivores. Individuals of each
developmental stage usually ingest a single blood meal before molting. Adults feed
several times and produce a group of eggs or sperm after each feeding. Nymphal and
adult argasids feed rapidly, usually requiring only 30 minutes to a few hours, whereas
larvae may require as long as ten days to engorge (Oliver 1989). Among the species that
have slow feeding larvae are those ticks that infest birds and bats. The same individual
may serve as host for successive developmental stages, but this probably occurs rarely.
In general, ticks are opportunistic and a single species can feed on hosts belonging to
different classes. Nonetheless, ticks show rhythms of feeding and drop-off that coincide
with periods of rest or sleep in the host (Oliver 1989). In laboratory colonies, 70-80% of
Ornithodoros concanensis survived four years without a meal (Oliver 1989). After

14
feeding, argasids typically do not use all of the blood meal for gamete production, but
rather store some as a reserve. This facilitates survival for great lengths of time (i.e.,
many years). In addition, such behavior permits argasids to act as reservoirs of infectious
diseases (Hoskins 1991). In nature, most argasid species produce one generation per
year. Argasids do not mate on the host.
Many argasids are habitat specialists, living in protected areas such as caves, rock
crevices, burrows, or hollow trees. Consequently, they feed on animals that rest in those
locales. Indeed, 55 species of soft ticks are classified as strict bat parasites (Oliver 1989).
These ticks are strongly and negatively phototactic and geotrophic, with the exception of
females during oviposition periods, which last from a few days to several weeks,
depending on species and environmental conditions, especially temperature. Argasids do
not produce thousands of eggs as do most ixodid ticks; rather, they produce fewer, larger
eggs. In addition, some argasids make considerable parental investments. For example,
some argasids that parasitize bats brood eggs. Moreover, Argas boueti transport newly
hatched larvae to roosting bats for feeding (Hoogstrall 1985). Argasids express a more
“k-selective strategy” (sensu Pianka 1970) than do ixodid ticks, perhaps in part because
they infest hosts that are more difficult for immature stages of ticks to locate.
Trombiculidae. Chiggers are a diverse group with the larvae of over 3000 species
described between 1929 and 1977 (Brennan and Goff 1977). Only 10% of these larvae
have been associated with adult stages. The larval stage of trombiculids is the only
parasitic stage of chiggers, infesting many groups of vertebrates; post larval stages are
free-living sediment dwellers (Baker et al. 1956). Developmental stages include egg,
deutovum, larva, nymphochrysalis, nymph, imagochrysalis, and adult. Larvae, which are
150 - 300 microns long, crawl on the soil until they find a suitable host, to which they
attach and feed on lymph and skin tissues. Blood is not important to trombiculids.
Larvae feed once; engorgement takes three days. When a larva is replete, it detaches,
enters the soil, becomes quiescent, and forms a nymphochrysalis (Baker et al. 1956). A
600 - 1,000 micron nymph emerges and preys on eggs and instars of other arthropods.
When fully fed, the nymph become quiescent and forms an imagochrysalis. An adult

15
mite emerges, which resembles the nymph but is much larger, sexually mature and more
hirsute. Adults have diets similar to those of nymphs. The entire life cycle takes 2 - 12
months, with 1 - 3 generations per year in temperate zones and up to six generations in
tropical areas. Trombiculids are opportunistic parasites infesting reptiles, birds, and
mammals (Reed and Brennan 1975).
Chirodiscidae. Most of the chirodiscids only infest bats and belong to the
subfamily Labidocarpinae, which contains at least 15 genera and 70 species (Fain 1982a,
1982b; McDaniel 1970). Little has been published about chirodiscid biology; therefore
most of the details about their life history remain uncertain. Chirodiscids have a nymphal
reproductive form with rudimentary legs, which is fertilized by an adult male
(Pinichpongse 1963a). This fertilized individual molts into an 8-legged unchitinized
female, which must molt 1 - 2 more times to achieve maturity. A larval stage passes
within mature females, which give birth to 6-legged larvae that molt into either 8-legged
chitinized females or males (McDaniel 1970). These larvae mature after 1 more molt.
The origin of the copulatory nymphal female is unknown. These mites have limited
locomotion because their 1st and 2nd pairs of legs are modified for grasping and maintain
firm holds at the base of host hair, where chirodiscids feed on sebaceous secretions
(Pinichpongse 1963a).
Myobiidae. Twenty-two genera of myobiids comprise hundreds of species that
infest bats (Dusbábek 1969b, Uchikawa 1988). Females attach eggs to the pelage of the
host, however larvae and adults attach to the skin of the host (Lukoschus et al. 1981).
Myobiids have two larval stages, each with three pairs of legs; a protonymph, with a
rudimentary 4th pair of legs; a deutonymph, with four pairs of legs; and the adult stage,
which has genitalia. Myobiids feed on blood of the host, and transfer of individuals from
one host to another probably requires direct body contact (Baker et al. 1956). With few
exceptions, each genus of myobiid mite is restricted to a single family or subfamily of
host (Uchikawa1988). Myobiids infest the Marsupialia, Insectivora, Rodentia, and
Chiroptera. Among New World bats, myobiids occur on emballonurids, mormoopids,
phyllostomids, and vespertilionids (Dusbábek 1960, 1969).

16
Materials and Methods
Field Methods
Mammals and their associated ectoparasites were collected from July 1995 to
June 1997, and again from July to August in 1998, as part of an investigation entitled
“Paraguayan Mammals and Their Ectoparasites: an Intensive Survey in a Temperate-
Subtropical Interface.” Bats were surveyed at 28 sites (Table A.1), representing all major
biomes, including many protected areas, and spanning gradients of moisture and
temperature in Paraguay (Figure 2.1). Because of the potential importance of the Río
Paraguay as a biogeographic barrier (Myers 1982), approximately one-half of the sites
were on each side (east or west) of the river. In general, mist nets were erected in all
habitats at a site and were monitored for captures from dusk until 0100 h. Much of the
time, nets were monitored until dawn. Rates of capture for bats in the field depend on a
variety of factors including net characteristics (e.g., mesh size, length, condition,
placement, configuration), temporal factors (e.g., length of time, particular hours of the
night, period in the lunar cycle – Gannon and Willig 1997), local weather conditions
(especially with respect to temperature and precipitation), and history (i.e., number of
consecutive nights at a site – Simmons and Voss 1998). Captured bats were sacrificed
and prepared as standard museum specimens. Specific bat identification was initiated in
the field but verified by C. López-González after comparison with systematic reference
materials (López-González 1998, 2005). The systematic recommendations of López-
González (1998, 2005) were followed for bat taxa in Paraguay. Ectoparasites were
collected from most host specimens. However, if more than 50 individuals of a host
species were collected at a site, nearly all subsequent individuals were released without
examination for ectoparasites. Half of the bat collection was deposited at the Museum of
Texas Tech University (TTU) and half at the Museo Nacional de Historia Natural del
Paraguay (MNHNP).
Most studies of ectoparasites are of limited value because specimens are collected
haphazardly or from already dead host specimens, increasing opportunities for

17
contamination that result in inaccurate host associations. Because of the emphasis on
ectoparasites during this study, all mammal specimens were collected live, maintained in
separate containers, anesthetized, and brushed for ectoparasites before further processing.
Hosts that died before processing were not inspected for ectoparasites. Upon
anesthetization, mammalian hosts were brushed and inspected visually for ectoparasites.
Ectoparasites from each host were then placed in labeled vials containing 70% ethanol.
After collecting ectoparasites from each host, the brush, collection chamber, and all
objects that serve as vectors of cross-host contamination during processing, were washed
thoroughly. In addition, hosts were processed in taxonomic blocks (i.e., all Artibeus
lituratus were processed, followed by Artibeus fimbriatus) to reduce the likelihood of
contamination among host taxa. Indeed, all aspects of the protocol for mammal
collection, specimen processing and preparation, and ectoparasite collection were
designed to reduce the possibility of significant horizontal contamination (i.e.,
assignment of ectoparasites to the wrong host species).
Laboratory Work
Before specific identification of ectoparasites was undertaken, each ectoparasite
sample was sorted into families and counted; each family of parasite from each host
individual was placed in a separate vial. Samples containing no ectoparasites were
recorded as negative. Subsequently, members of each family of ectoparasites were
identified using the most recent, comprehensive information about South American
representatives for each family including Wenzel (1976) and Wenzel et al. (1966) for the
Streblidae; Guimarães (1966, 1972) for the Nycteribiidae; Ueshima (1972), Ferris and
Usinger (1939, 1945), and Ronderos (1959, 1962) for the Polyctenidae; Rudnick (1960),
Machado-Allison (1965), and Herrin and Tipton (1975) for the Spinturnicidae; Radovsky
(1967) and Saunders (1975) for the Macronyssidae; Dusbábek (1969b, 1969c) and Fain
(1978) for the Myobiidae; Jones et al. (1972) and Fairchild et al. (1966) for the Ixodidae
and Argasidae; Reed and Brennan (1975), Brennan and Reed (1974, 1975), Brennan and
Yunker (1966), and Brennan and Goff (1977) for the Trombiculidae; McDaniel (1970,

18
1973), Pinichpongse (1963a, 1963b, 1963c, 1963d), de la Cruz (1969) and Dusbábek and
de la Cruz (1966) for the Chirodiscidae. Other publications were used as required for
more recently described taxa of many of these families (i.e., Brennan 1958, 1970, Loomis
and Wrenn 1984, Matheson 1935, 1941).
Streblid identifications were confirmed during collaborative work between Carl
Dick (Texas Tech University) and the personnel of the University of Illinois, Chicago (R.
L. Wenzel and M. Dean). All fleas (Siphonaptera) were identified by Robert E. Lewis
(Iowa State University). Polyctenids were identified by Donald Gettinger (University of
Central Arkansas) and Carl Dick. All other taxa were identified preliminarily by the
author. Subsequently, identifications of macronyssid and spinturnicid mites were
reviewed by Donald Gettinger.
The insects (e.g., Streblidae, Nycteribiidae, Polyctenidae, Siphonaptera) were
identified using a dissecting scope. Slides were made of a representative collection of
individuals (Wenzel et al. 1966). Mites (e.g., Macronyssidae, Spinturnicidae,
Trombiculidae, Chirodiscidae, Myobiidae) and ticks (e.g., Argasidae, Ixodidae) have
diagnostic characters too small to view reliably with a dissecting scope. Therefore, these
specimens were cleared in either potassium hydroxide or a lactic acid-phenol mixture to
allow closer inspection of the ectoskeleton (Krantz 1970). Each specimen was prepared
in PVA Mounting Medium, Hoyer’s Solution, or Canada Balsam under a round cover
slip and dried on a drying plate (Wenzel et al. 1966, Krantz 1970). Specimens were
examined under a phase-contrast light microscope. Slides were rung using insulating
varnish to prevent re-hydration of the mounting medium. Each slide was labeled with
host identification number, ectoparasite family, and slide number. All mounted and fluid
preserved specimens are stored at the University of Central Arkansas under the care of
Donald Gettinger.
The taxonomy and systematics of insects ectoparasitic on neotropical bats are
well known (e.g., Guerrero 1993, 1994a, 1994b, 1995a, 1995b, 1996, 1997, Ueshima
1972, Wenzel 1976, Wenzel et al. 1966). As a result, identification to the species level
was possible in most cases. The exception is the Nycteribiidae, which is represented by a

19
single genus (Basilia) in South America. However, male specimens of different species
of Basilia are indistinguishable using phenotypic characters. In addition, taxonomic
work on nycteribiids is confounded by numerous synonomies associated with some
species (Guimarães 1966, 1972). In general, the taxonomy of this group is not well
established. Consequently, I only described females as morphospecies. Males from the
same host individual as females were assumed to belong to the same species as the
females. No more than one species of Basilia was ever found on a host individual based
on consideration of females. Male Basilia on host individuals with no female Basilia
were simply identified as Basilia spp.
Mite taxa with larger individuals (e.g., Macronyssidae, Spinturnicidae) were
identified to species. Those taxa with small (< 450 microns) individuals (e.g.,
Trombiculidae, Myobiidae, Chirodiscidae) often were difficult to resolve to the specific
level. Nonetheless, most individuals in these taxa were identified successfully to species.
Where individuals could be identified to genus and possessed sufficient diagnostic
characters to be distinguished from other members of the genus, species were given
numeric designations (e.g., Basilia sp. 4). Three species of polyctenid that fit these
criteria appear to be undescribed and were designated as “new species” (e.g.,
Hesperoctenes n. sp. 1). Where individuals could be identified to genus but no species-
diagnostic characters were discernable, no specific designation was applied (e.g.,
Labidocarpus sp.). A number of mites and ticks could be identified only to family; these
individuals were given “unknown” status (e.g., unknown spinturnicid). New taxa that
closely resemble known species may have been assigned to known designations in
current keys. One such case has been discovered already; streblids originally assigned to
Metelasmus paucisetus were assigned to a new species, M. wenzeli (Graciolli and Dick
2004). This represents a simple name change and does not affect infestation metrics or
indices of biodiversity. The effect of the use of morphospecies in ecological studies was
investigated for terrestrial invertebrates (Oliver and Beattie 1996, Pik et al. 1999).
Estimates of richness and diversity differed little between data sets classified to
morphospecies (i.e., arthropods identified by non-specialists) and those based on well
20
documented species inventories (i.e., arthropods identified by specialists). Moreover,
ranking of diversity for habitats was identical using both identification methods.
Three host-parasite parameters (Gettinger and Earnest 1995, Gannon and Willig
1995) were estimated separately for each ectoparasite species on each host species.
Incidence is the percent of inspected host individuals that were infested by a particular
ectoparasite species. Prevalence is the mean number of ectoparasites per inspected host.
Density is the mean number of ectoparasites per infested host. In addition, a specificity
index (SI) was calculated for each host-ectoparasite association. SI ranges from 0 (i.e.,
no individuals of an ectoparasite species occur on a particular host species) to 1.0 (all
individuals of an ectoparasite species occur on a particular host species). For each
ectoparasite species, SI is the proportion of the total number of individuals of the
ectoparasite species that occurred on a particular host species. For example, if an
ectoparasite is monoxenous it has an SI of 1.0 on the primary host species because 100%
of the individuals of that ectoparasite species occur on the same host species.
Alternatively, an ectoparasite species for which 10 individuals were collected from each
of 10 host species for a total of 100 individuals, has an SI of 0.1 on each of those host
species.
Host specificity was assigned to ectoparasite species in two fashions. First,
specificity was defined in the most general sense, which included all observed
associations regardless of probable contamination or the apparent transient nature of the
association. Second, specificity was defined in a strict sense ignoring associations that
were likely due to contamination or transitory relationships (i.e., all associations with an
incidence of < 0.05). These were defined as primary associations, with hosts and
parasites of these associations referred to as primary hosts and primary ectoparasites,
respectively. An exception to this rule was made for small mite taxa (e.g., Myobiidae,
Chirodiscidae, Trombiculidae) that were rare on all host species. The host on which
these parasites most often were found was considered to be the primary association.
Species that comprise a small portion of a host’s ectoparasite fauna may not
represent contamination or transient associations, but instead may be naturally rare. A

21
common definition (e.g. Chalcraft et al. 2004, Stevens and Willig 2000, Willig et al.
2003) considers a species to be rare if its abundance is < 1/S of the total individuals of a
community or assemblage, where S = species richness (Camargo 1992). However,
problems characterize this definition of rarity. First, use of 1/S for a species-poor
assemblage, like those of ectoparasites on host individuals, could result in the assignment
of relatively abundant species as rare. For example, in an assemblage with S = 5, a
species that comprises 19% of the assemblage is rare although it represents a large
portion of the assemblage. Second, because all assemblages do not have equal species
richness, 1/S defines rareness at different relative abundances for assemblages with
different species richness. Third, 1/S requires at least one species be rare in all but the
most even of assemblages. Defining rareness using the 5% criterion eliminates these
problems.
The definitions of transience and rarity are similar and confused easily, in part
because of the operational necessity of a quantitative criterion, such as the 5% rule.
Rarity is defined by considerations of incidence: ectoparasite species that occur on < 5%
of inspected hosts are rare in that assemblage. In contrast, transience is defined by
considerations of relative abundances of ectoparasites: species that comprise < 5% of all
individuals in ectoparasite assemblages are transient. Because rareness and transience are
defined with respect to different bases, all transient species are not rare and all rare
species are not transient. More specifically, the abundance of a particular ectoparasite
and the total abundance of all ectoparasites influence its transience, whereas the
abundance of a particular ectoparasite and its distribution among host individuals
influence its rarity.
Ectoparasite species abundance distributions (SADs) were compiled for each host
taxon by pooling all ectoparasite individuals from the same host species into a single
sample. Those host taxa whose SAD included > 3 primary ectoparasites were analyzed
to determine whether a broken stick (BS) or geometric series (GS) model better
characterized the empirical SAD. The GS and BS models represent extremes in the
context of commonly used models of SADs, including the log series (LS) and log normal

22
(LN) models (Magurran 1988). It is within this context that the BS and GS models are
described and applied to ectoparasite assemblages of bats in Paraguay. The GS model
represents the least equitable distribution of individuals among ectoparasite species (i.e.,
high dominance) and usually is found in species-poor, harsh environments (Magurran
1988). The BS model predicts a more equitable distribution of individuals among
ectoparasite species (i.e., high evenness; May 1975, Pielou 1969) and is a “biologically
realistic expression of a uniform distribution” (Magurran 1988). Relatively even SADs
occur most frequently in communities that are defined from narrow taxonomic, trophic,
or geographic perspectives. Ectoparasite assemblages from Paraguayan bats are defined
narrowly from all three of these perspectives. The LS and LN models predict
intermediate levels of evenness and dominance. Neither of these models was employed
for two reasons. First, LS and LN models perform poorly when applied to communities
with relatively few species (Pielou 1969), such as those of obligate parasites (e.g., bat
ectoparasite assemblages in Paraguay). Second, the application of four (or more) models
to 24 empirical SADs (i.e., the number of ectoparasitic assemblages from common and
wide-spread bat species) necessitates a large suite of analyses that prove statistically
problematic because of inflated error rates. To reduce error rates, I could remove models
or SADs from the experimental design. Because I was more interested in examining the
SADs of ectoparasites from each of the common bats species, removal of models was
preferred to elimination of SADs.
Functions were written in Matlab for the Macintosh V. 4.2c.1 to compare
empirical SADs of primary ectoparasites from each of 24 host species to the
corresponding BS or GS models. I followed the methodology of Magurran (1988) and
used data therein to confirm that the Matlab functions worked properly. A Chi-square
goodness-of-fit test compared the empirical distribution to an expected distribution based
on the theoretical model in question (i.e., broken stick or geometric series). Because the
null hypotheses in these analyses are based on a particular model, and not randomness,
significance indicates failure to conform to the theoretical model. For example,
significant results (i.e., p < 0.05) represent empirical distributions that are not

23
characterized by the underlying distribution. Alternatively, non-significant results (i.e., p
> 0.05) represent empirical SADs that adequately conform to (i.e., do not significantly
differ from) the theoretical model in question.
Results
Ectoparasites were collected from 2,909 of the 4,143 bats captured during the
study, representing 44 species and five families of hosts (Table 2.4). Bat assemblages
were defined for each of 28 sites, distributed throughout all major biomes of Paraguay
(Figure 2.1, Table A.1, Appendix B). Ectoparasites were not collected from dead hosts
or specimens that were prepared as entire specimens (wrapped in gauze and injected with
formalin). These latter specimens still have their ectoparasite communities preserved
with the host specimen for future, more detailed study.
Over 17,500 ectoparasites were collected, representing 104 species and 11
families (Appendix C). In abundance, five of these families (Insecta: Streblidae;
Arachnida: Spinturnicidae, Macronyssidae, Chirodiscidae, and Argasidae) accounted for
94.5% of all ectoparasites (Table 2.5, Appendix C). For insects, streblids were found on
the majority of noctilionids, phyllostomids, and natalids. However, different insects
appeared on vespertilionids (nycteribiids) and molossids (polyctenids), both of which
were nearly devoid of streblids. Streblids were highly host-specific. Twenty-two of the
27 streblid species were monoxenous and three were oligoxenous. No streblid occurred
on more than two primary host species. Whereas competition may occur within the
Arachnida, it has not lead to interspecific exclusion on host species, perhaps because of
smaller ectoparasite body sizes. Co-occurrence was common for the arachnids, as nearly
all host species were inhabited by macronyssids in addition to at least one other family of
arachnid.
In general, the arthropod ectoparasite assemblages of Paraguayan bats are
dominated by macronyssid mites, which represented 23 species and 55% of all collected
ectoparasites. It is likely that the number of recognized species will increase once these
specimens are examined in detail by taxonomic specialists.

24
Ectoparasite Assemblages on the Noctilionidae
Noctilio possessed an abundance of ectoparasites, averaging > 20 individuals per
bat. The primary species composing the ectoparasite assemblage of N. albiventris (host
N = 68, ectoparasite N = 1460, Table 2.6) were two streblids (Noctiliostrebla maai and
Paradyschiria parvula), a chirodiscid (Lawrenceocarpus sp.), and an argasid
(Ornithodoros hasei). Both streblids were monoxenous. The ectoparasite assemblage of
N. leporinus (host N = 28, ectoparasite N = 553, Table 2.7) was similar to that of its
congener and was dominated by three monoxenous streblids (Noctiliostrebla aitkeni, N.
dubia, and Paradyschiria fusca) and O. hasei. In addition, a macronyssid (Steatonyssus
sp. 1) that appears to be an undescribed species occurred regularly on N. leporinus.
Ectoparasite Assemblages on the Phyllostomidae
Only three specimens of Chrotopterus auritus (host N = 3, ectoparasite N = 151,
Table 2.8) were captured and these individuals were rife with ectoparasites (> 50 per bat).
High abundances may account for how a streblid (Strebla chrotopteri) and trombiculid
(Trombicula sp. 1) that infest only this relatively uncommon host species persist through
ecological time. Such high infestation rates reduce the chance of local extinction (i.e., all
ectoparasites on a host individual dying), which may be an important factor if the only
host of an ectoparasite is a rare, long-lived species.
Tonatia possess modest abundances of ectoparasites, with mean numbers between
12 and 14 individuals. T. bidens (host N = 3, ectoparasite N = 42, Table 2.9) harbored a
monoxenous spinturnicid (Periglischrus tonatii) and was home to 70% of all obtained
Parichoronyssus crassipes, despite the rarity of this host species in Paraguay. Similarly,
T. brasiliense (host N = 1, ectoparasite N = 12, Table 2.10) was quite rare, but had a
monoxenous association with a spinturnicid (Mastoptera minuta) and was infested by one
of only three Parichoronyssus sclerus identified from the bats of Paraguay.
Glossophaga soricina (host N = 54, ectoparasite N = 64, Table 2.11) nearly were
devoid of ectoparasites. On average, a host was infested by a single individual.

25
Nonetheless, three streblids (Speiseria ambigua, Trichobius dugesii, and T. uniformis)
and a spinturnicid (Periglischrus caligus) had monoxenous associations with G. soricina.
In addition, 90% of all Pseudolabidocarpus were found on G. soricina.
Carollia (host N = 75, ectoparasite N = 124, Table 2.12) were infested by slightly
higher densities (1.65 individuals/bat) of ectoparasites than were G. soricina; however, C.
perspicillata did not house an assemblage of endemics. C. perspicillata were home to
81% and 96% of all Strebla guajiro and Trichobius joblingi, respectively.
Desmodus rotundus (host N = 51, ectoparasite N = 407, Table 2.13) were infested
by an average of eight individuals. This assemblage was dominated by four monoxenous
parasites: two streblids (Strebla weidemanni, Trichobius parasiticus), a spinturnicid
(Periglischrus herrerai), and a macronyssid (Radfordiella desmodi).
Diaemus youngi (host N = 11, ectoparasite N = 114, Table 2.14) were infested by
two monoxenous streblids (Strebla diaemi and Trichobius diaemi) and a monoxenous
macronyssid (Radfordiella oudemansi). Curiously, T. diaemi only occurred on host
individuals that also were infested by S. diaemi.
Artibeus possessed meager ectoparasite populations, with A. fimbriatus, A.
jamaicensis, and A. lituratus averaging 7.1, 7.3, and 3.2 individuals per bat, respectively.
A. lituratus was by far the most abundant species of Artibeus in Paraguay. All
ectoparasite species commonly found on the remaining species of Artibeus also inhabited
A. lituratus. Nonetheless, each species of Artibeus harbored a distinctive ectoparasite
assemblage. A majority of each of three streblid species (Aspidoptera phyllostomatis,
Megistopoda aranea, and Metelasmus pseudopterus) inhabited A. fimbriatus (host N =
79, ectoparasite N = 561, Table 2.15). In addition, 85% of the remaining M. aranea were
found on A. jamaicensis. Compared to congeners, A. jamaicensis (host N = 42,
ectoparasite N = 306, Table 2.16) had the highest incidence of chiggers (trombiculids).
Six species of streblid were found on A. lituratus (host N = 351, ectoparasite N = 1123,
Table 2.17), however, only the monoxenous Paratrichobius longicrus were common.
Although Periglischrus iheringi, which probably represents a species complex, occurred

26
on 12 host species representing three families, 59% of all individuals occurred on A.
lituratus.
All Chiroderma doriae (host N = 3, ectoparasite N = 6, Table 2.18) were infested
with Periglischrus iheringi. Platyrrhinus lineatus (host N = 90, ectoparasite N = 394,
Table 2.19) hosted an average of 4.4 individuals, most of which were a spinturnicid
(Periglischrus iheringi) or a monoxenous macronyssid (Macronyssoides conciliatus). In
addition, Platyrrhinus lineatus were home to a monoxenous streblid (Trichobius
angulatus). Pygoderma bilabiatum (host N = 53, ectoparasite N = 13, Table 2.20) were
nearly devoid of ectoparasites, averaging 0.25 individuals per bat and rarely harbored
more than one individual on a host. These associations are likely transient.
The greatest ectoparasite richness (23 species) occurred on Sturnira lilium (host N
= 404, ectoparasite N = 2023, Table 2.21) despite an average of only five individuals per
bat. S. lilium hosted eight monoxenous ectoparasites including three streblids
(Aspidoptera falcata, Megistopoda proxima, Metelasmus paucisetus), one spinturnicid
(Periglischrus ojasti), one macronyssid (Parichoronyssus euthysternum), two
trombiculids (Eutrombicula sp. and Perisopalla precaria), and one myobiid
(Eudusbabekia lepidoseta).
Ectoparasite Assemblages on the Natalidae
Only one Natalus stramineus (host N = 1, ectoparasite N = 7, Table 2.22) was
captured during the study. It was infested by two monoxenous ectoparasites; a streblid
(Trichobius galei) and a spinturnicid (Periglischrus natali).
Ectoparasite Assemblages on the Vespertilionidae
The only species of ectoparasite occurring on Eptesicus with any frequency was
Steatonyssus joaquimi, which composed over 85% of all individuals found on this host
genus. All ectoparasites on E. brasiliensis (host N = 12, ectoparasite N = 78, Table 2.23)
and E. diminutus (host N = 2, ectoparasite N = 13, Table 2.24) also were on the more
common E. furinalis (host N = 69, ectoparasite N = 790, Table 2.25). E. furinalis were

27
infested by four monoxenous species including a nycteribiid (Basilia sp. 4), two
spinturnicids (Spinturnix orri and S. surinamensis), and a macronyssid (Parichoronyssus
cyrtosternum).
Histiotus macrotus (host N = 6, ectoparasite N = 120, Table 2.26) were infested
heavily, averaging 20 individuals per host. Eighty percent of these individuals were
Steatonyssus joaquimi, which is common on other vespertilionid genera. Also, H.
macrotus harbored appreciable numbers of Chiroptonyssus haematophagus, which were
common on the molossids that dominate bat assemblages in the Chaco where these H.
macrotus were captured.
Over 95% of all ectoparasites collected from Lasiurus were the oligoxenous
Steatonyssus furmani. Nearly half of all L. blossevillii (host N = 11, ectoparasite N = 20,
Table 2.27) were not parasitized; those bats that had parasites hosted only one species per
individual. Macronyssus meridionalis occurred on one of two L. cinereus (host N = 2,
ectoparasite N = 1, Table 2.28) captured during the study. L. ega (host N = 72,
ectoparasite N = 411, Table 2.29) was host to 95% of all S. furmani.
All species of Myotis had similar ectoparasite assemblages. Ectoparasite
assemblages of both common species of Myotis (M. albescens and M. nigricans) were
dominated by a diversity of nycteribiids, a spinturnicid (Spinturnix americanus) and two
macronyssids (Macronyssus crosbyi and Steatonyssus joaquimi). However, M. albescens
(host N = 87, ectoparasite N = 1550, Table 2.30) had ectoparasite populations over four
times as prevalent as those of M. nigricans (host N = 128, ectoparasite N = 557, Table
2.31). In addition, M. albescens were host to two monoxenous species, Spinturnix banksi
and a flea, Myodopsylla wolffsohni. The rarer species of Myotis in Paraguay, M. riparius
(host N = 11, ectoparasite N = 52, Table 2.32) and M. simus (host N = 1, ectoparasite N =
18, Table 2.33), harbored a subset of parasites found on more common congeners.
Ectoparasite Assemblages on the Molossidae
In general, bats of the genus Eumops (Tables 2.34 – 2.38) had ectoparasite
assemblages dominated by macronyssids, in particular those of the genus Chiroptonyssus.

28
Eumops auripendulus (host N = 2) were host to no ectoparasites (Appendix B). E.
bonariensis (host N = 5, ectoparasite N = 8, Table 2.34) possessed few ectoparasites, but
one individual harbored nearly half of all Labidocarpus sp. collected during the study.
The two largest species of Eumops, E. dabbenei (host N = 4, ectoparasite N = 48, Table
2.35) and E. perotis (host N = 3, ectoparasite N = 35, Table 2.38), harbored much greater
ectoparasite numbers per bat (i.e., prevalence), 12.8 and 11.7, respectively, than did the
smaller E. bonariensis (1.60) or E. patagonicus (3.22), with the medium sized E.
glaucinus (5.96) having intermediate numbers. E. glaucinus (host N = 56, ectoparasite N
= 334, Table 2.36) were the primary host of an undescribed polyctenid, Hesperoctenes n.
sp. 1 (Table 2.36). The ectoparasite assemblage of E. patagonicus (host N = 526,
ectoparasite N = 1693, Table 2.37) was dominated by C. haematophagus, which
accounted for 82% of parasites collected from this host, and a monoxenous polyctenid, H.
longiceps.
Bats of the genus Molossops had low levels of parasite infestation. Nonetheless,
each species of Molossops had an associated monoxenous polyctenid bat fly:
Hesperoctenes cartus on M. abrasus (host N = 14, ectoparasite N = 55, Table 2.39), H.
minor on M. planirostris (host N = 12, ectoparasite N = 20, Table 2.40), and H. parvulus
on M. temminckii (host N = 160, ectoparasite N = 541, Table 2.41). Aside from the
polyctenids, macronyssids (Chiroptonyssus haematophagus and C. venezolanus) and
argasids (Ornithodoros hasei) were common in ectoparasite assemblages on Molossops.
Molossus are the primary host to the only streblid (Trichobius jubatus) found on
molossids in Paraguay. The ectoparasite assemblage of M. ater (host N = 100,
ectoparasite N = 911, Table 2.42) was dominated by the monoxenous C. robustipes
(Table 2.42), whereas those of M. currentium (host N = 27, ectoparasite N = 64, Table
2.43) and M. molossus (host N = 228, ectoparasite N = 2426, Table 2.44) were dominated
by C. haematophagus. All three species of Molossus commonly hosted the oligoxenous
Hesperoctenes fumarius.
Nyctinomops laticaudatus (host N = 42, ectoparasite N = 182, Table 2.45) were
host to four monoxenous ectoparasites, a polyctenid (Hesperoctenes setosus), a myobiid

29
(Ewingana sp. 2), and two ischnopsyllids (Hormopsylla fosteri and Rothschildopsylla
noctilionis). However, Chiroptonyssus venezolanus were the most abundant ectoparasite
on Nyctinomops.
Promops centralis (host N = 4, ectoparasite N = 14, Table 2.46) were host to the
monoxenous polyctenid, Hesperoctenes angustatus. All P. nasutus (host N = 8,
ectoparasite N = 227, Table 2.47) were infested with C. haematophagus; most individuals
were infested heavily, carrying 19 or more parasites.
Host Specificity
Patterns of host specificity were similar regardless of inclusion or omission of
ectoparasites that represent contamination and transient taxa; however, inclusion of
contamination and transient associations (Table 2.48) may obscure more ecologically
important relationships. Consequently, I only will discuss associations under the stricter
definition of primary host-ectoparasite relationships (Table 2.49).
Twenty-two of 27 streblids were monoxenous. Of those occurring on more than
one host species, two (Aspidoptera phyllostomatis and Megistopoda aranea) were
oligoxenous on Artibeus and another (Trichobius jubatus) was oligoxenous on Molossus.
Two streblid species were polyxenous.
Seven of the ten species of polyctenids were monoxenous. The remaining three
species were oligoxenous, with two species parasitizing Molossus and one species
parasitizing Eumops.
Nycteribiids were less host-specific than were other families of ectoparasitic
insects. Half of the six species were monoxenous. Two species were oligoxenous on
Myotis. One species was pleioxenous. All ischnopsyllids were monoxenous.
Eight of the ten identified species of spinturnicids were monoxenous. Spinturnix
americanus were oligoxenous on Myotis. Periglischrus iheringi were pleioxenous on
stenodermatine bats.
Of the 22 species of macronyssids identified from bats of Paraguay, only nine
were monoxenous. Three species were oligoxenous, four were pleioxenous, and six were

30
polyxenous. Among those arthropods specializing as ectoparasites of bats, macronyssids
are among the least host specific.
All argasid ticks and chirodiscids mites were polyxenous. Half of the eight
trombiculid species were monoxenous on phyllostomids, whereas the other four species
were polyxenous, occupying both phyllostomids and molossids. Although myobiids are
small (< 450 microns), rarely collected, and probably under represented in these
collections, four of the five species were monoxenous and the other was oligoxenous.
Ectoparasite Species Abundance Distributions
Species abundance distributions were compiled for all host species on which > 3
ectoparasite species occurred (Table 2.50, Figs. D.1—D.39). Of the 24 host species
whose ectoparasite SAD was compared to the BS and GS models, ten fit neither model,
four fit both models, nine fit the BS only, and one fit the GS only (Table 2.51). Of the
four that fit both models, three fit the GS better than the BS. Within a bat family, host
species were heterogeneous with respect to SADs of their ectoparasite assemblages. Of
the three ectoparasite assemblages from species of vespertilionids, one fit the BS and two
fit neither model. Of the 11 ectoparasite assemblages from species of phyllostomids, five
fit the BS, one fit the GS, two fit both models, and three fit neither model. Of the eight
ectoparasite assemblages from species of molossids, two fit the BS, two fit both models,
and 4 fit neither model.
Discussion
Host – Parasite Associations and Infestation Levels
The literature is teeming with isolated reports of host-parasite associations. In
general, the primary host-parasite relationships between bats and arthropod ectoparasites
documented in Paraguay (Tables 2.6 – 2.47) reiterate associations reported numerous
times elsewhere (Brennan and Goff 1977, Brennan and Reed 1974, 1975, Brennan and
Yunker 1966, de la Cruz 1969, Dusbábek 1969b, 1969c, Dusbábek and de la Cruz 1966,
Fain 1978, Fairchild et al. 1966, Ferris and Usinger 1939, 1945, Guerrero 1993, 1994a,

31
1994b, 1995a, 1995b, 1996, 1997, Guimarães 1966, 1972, Herrin and Tipton 1975, Jones
et al. 1972, McDaniel 1970, 1973, Machado-Allison 1965, Pinichpongse 1963a, 1963b,
1963c, 1963d, Radovsky 1967, Reed and Brennan 1975, Ronderos 1959, 1962, Rudnick
1960, Saunders 1975, Ueshima 1972, Wenzel 1976, Wenzel et al. 1966). However, few
of these references included material from Paraguay, and none of them were restricted to
it.
The streblids are the best known group of mammalian ectoparasites (Guerrero
1993, 1994a, 1994b, 1995a, 1995b, 1996, 1997). The culmination of Guerrero’s work
was a list of host-parasite associations that also contained a list of streblid species
recorded from each country or island in the New World. Ten host-parasite associations
were documented in Paraguay beyond those reported by Guerrero (1997); however, only
two of those represent more than a single infestation. Metelasmus paucisetus occurred on
Sturnira lilium (Table 2.21) and Strebla weidemanni occurred frequently on Desmodus
rotundus (Table 2.13). Twenty-seven species of streblid occurred in Paraguay, seven of
these were reported previously (Guerrero 1997).
Despite the substantial literature dedicated to the natural history of bat
ectoparasites, reports of ectoparasite infestation levels are limited in depth and breadth,
impairing any ability to make comparisons among taxa (either host or ectoparasite) or
regions. Most research reports infestation levels of a single ectoparasite species on a
single host species. Some report densities or prevalences of a single parasite for many
host species or of many parasite species on a single host species. The most
comprehensive reports to date are those of Herrin and Tipton (1975), who reported the
density, prevalence, and incidence of all spinturnicids occurring on every species of bat
collected during a study in Venezuela and Gannon and Willig (1995), who reported the
same information for streblids and spinturnicids occurring on bats of Puerto Rico.
Cimicids infesting bats reportedly feed an average of 22 times per day (Overal
and Wingate 1976). Although no cimicids were recorded during this study, they are
primarily roost dwellers and rarely are found on their host (Marshall 1982a), which
makes cimicid collection from hosts captured by mist nets improbable. Nonetheless,

32
cimicids feed on emballonurids, noctilionids, and molossids (Marshall 1982a), all of
which occur in Paraguay. Failure to detect such roost dwelling ectoparasites would
underestimate ectoparasite loads for bats. However, this sampling error is consistent and
does not bias ectoparasite assemblage comparisons among Paraguayan bats that are
infested by cimicids (i.e., noctilionids and molossids). However, in analyses involving
all hosts, the ectoparasite assemblage diversity may be underestimated for these two host
families.
Little is known about the ecology of polyctenids. In the only published record,
Marshal (1982b) documented a density of 13.7 individuals per host for the megadermatid
bat, Megaderma spasma, in Malaysia. Although molossids and megadermatids share
similar autecologies (i.e., both are insectivores and roost in caves or tree cavities), the
infestation rate of polyctenids on Paraguayan molossids is quite low, ranging from 0.25
to 3.0 individuals per bat. The difference in infestation rates between megadermatid and
molossid bats may be related to the differences in size between host species. More
specifically, M. spasma weigh about 25 g whereas the more common molossids in
Paraguay weigh between 5 g and 13 g. Ecological densities (number of parasites per unit
area or biomass) are much more similar than suggested by comparisons of individuals per
host.
Many studies have reported prevalences and densities of nycteribiids in South
America (see Marshall 1982a and sources therein). In general, most hosts are uninfested
and prevalences are less than one fly per host individual. Large-bodied genera, such as
Basilia, have especially low prevalences. Staying on a flying host may be especially
difficult for larger bat flies; therefore, Basilia may remain in the roost more frequently
than do smaller nycteribiids. Infestation rates of nycteribiids in Paraguay are consistent
with prior observations: incidence rarely exceeded 10% and prevalence < 1 fly per host.
In general, streblids have higher densities and prevalences than do nycteribiids.
Trichobius corynorhini had a prevalence of 2.6 flies per bat on Corynorhinus townsendii
(Kunz 1976), and prevalences of 0.8 (Overal 1980) and 0.55 (Gannon and Willig 1995)
flies per bat were reported for Megistopoda aranea on Artibeus jamaicensis from Panama

33
and Puerto Rico, respectively. In addition, 0.37 Aspidoptera phyllostomatis per bat
parasitized the same Puerto Rican A. jamaicensis (Gannon and Willig 1995) resulting in
nearly one streblid per A. jamaicensis. In Paraguay, M. aranea and A. phyllostomatis
commonly occurred on two host species, A. fimbriatus and A. jamaicensis, and were
present at similar densities and prevalences to those reported previously (Tables 2.15 and
2.16). Prevalence for Trichobius intermedius on Monophyllus redmani are reported for
Puerto Rico (Gannon and Willig 1995). Although Monophyllus does not occur in
Paraguay, a member (Glossophaga soricina) of the same subfamily (Glossophaginae) is
common there and is host to a species of Trichobius. Reported infestation rates (< 1 fly
per bat) of Trichobius on glossophagine bats are consistent with observations for
Paraguay. In this study, streblid prevalences ranged from 0.1 to 4 flies per bat for
phyllostomids. However, infestation rates on noctilionids were much higher, with
Noctilio albiventris hosting > 9 flies per bat and N. leporinus > 11 flies per bat (Tables
2.6 and 2.7).
Periglischrus iheringi are pleioxenous spinturnicid mites found on stenodermatine
bats, but also have frequent, transient associations with vespertilionids and molossids. P.
iheringi were reported from two stenodermatine bats and one glossophagine bat in Puerto
Rico (Gannon and Willig 1995). In Paraguay, a monoxenous congener, P. caligus,
infested glossophagines (i.e., Glossophaga soricina). In contrast, P. iheringi occurred on
all stenodermatine bats of Paraguay, with between 1.88 and 2.39 mites per bat on each
primary host species (Tables 2.15 – 2.19). These infestation levels occur between those
reported for Stenoderma rufum (1.48 mites per bat) and A. jamaicensis (4.96 mites per
bat) of Puerto Rico (Gannon and Willig 1995).
Incidence rates were reported for a collection of Periglischrus collected from bats
near Brasília, Brazil (Gettinger and Gribel 1989). Four species (P. caligus, P. herrerai,
P. iheringi, and P. ojasti) infested the same host species as in Paraguay, but each
occurred at higher rates of incidence in Brazil (0.83, 0.50, 0.71, 0.57) than in Paraguay
(0.11, 0.05, 0.56, 0.48).

34
Incidence and prevalence values were reported for spinturnicids from
phyllostomid bats of Michoacán, Mexico (Sheeler-Gordon and Owen 1999). Four
species (Periglischrus caligus, P. herrerai, P. iheringi, and P. ojasti) occurred on the
same host species as in Paraguay. P. herrerai, P. iheringi, and P. ojasti occurred at
similar rates of incidence and prevalence in Paraguay and Mexico (Table 2.52); however,
P. caligus was more common on Glossophaga in Mexico than in Paraguay.
Infestation rates of spinturnicid mites on chiropteran hosts are known from
Venezuela (Herrin and Tipton 1975). Noteworthy differences exist between Venezuela
and Paraguay (Table 2.52). First, the number of associations that would be considered
transient or the result of contamination was more than three times greater in Venezuela
than in Paraguay. Host samples in the Venezuelan project were larger than in that for
Paraguay, affording more opportunities for detection of transient associations. However,
levels of incidence in Venezuela were lower than in Paraguay, which resulted in a higher
rate of contamination or transient observation. Although the Venezuelan mammal
project had collection of ectoparasites as one of its primary goals, their collection
methodology appears to have been less efficient in controlling contamination than was
that employed in the Paraguay project. Detailed ectoparasite collection methodology was
not published, therefore comparison of specific differences in collection techniques used
in Venezuela and Paraguay is not possible. The methodology employed in Paraguay
followed that of Sheeler-Gordon and Owen (1999), who reported only one transient
association for Periglischrus (P. iheringi on two Desmodus rotundus) from a collection
of 305 ectoparasites from 274 hosts representing 18 species.
Rates of infestation for primary associations between collections in Venezuela
and Paraguay were not consistent. Incidences and prevalences were higher for species of
Periglischrus in Paraguay than in Venezuela. In contrast, both metrics were lower for
species of Spinturnix in Paraguay than in Venezuela.
In a study of ectoparasites that infest mammals of Paraguay, including six bat
species, host associations were reported along with data to calculate prevalence and
incidence of macronyssids (Whitaker and Abrell 1987). Incidence and prevalence values

35
were similar to those reported here with three exceptions. First, much greater infestation
rates for chiggers were reported (0.64 chiggers per bat) in Whitaker and Abrell 1987 than
in this study (0.069 chiggers per bat). Second, in a transient association, Chiroptonyssus
haematophagus had a higher rate of incidence on Artibeus lituratus than did the primary
macronyssid (Macronyssus kochi) associated with that host. Third, P. iheringi infested
67% of Sturnira lilium, whereas the primary macronyssid ectoparasite of Sturnira, P.
ojasti, was not observed. P. ojasti is the most common and abundant spinturnicid
reported from S. lilium and is almost exclusively reported from species of Sturnira
(Herrin and Tipton 1975, Machado-Allison 1965). Moreover, when reported from
species of Sturnira, P. iheringi does not reach incidence or prevalence levels reported by
Whitaker and Abrell, (1987) but is observed as a rare transient. Indeed, all reported
infestation rates of spinturnicids from Sturnira that are similar to those of Whitaker and
Abrell are P. ojasti (Furman 1966, Gettinger and Gribel 1989, Herrin and Tipton 1975,
Machado-Allison 1964, 1965). Most likely, the P. iheringi reported by Whitaker and
Abrell (1987) were misidentified P. ojasti; however, specimens from those collections
have not been reviewed and this assertion cannot be verified. These species of
Periglischrus are very similar and easily misidentified; the relative size and spacing of
the first three podosomal setae are the primary distinctive characteristics (Herrin and
Tipton 1975).
Ticks found on mammals of Venezuela, documented host associations, and
frequency of occurrences on each host species were reported by Jones et al. (1972).
However, it is unclear if the authors included all host individuals that were inspected for
ticks or only those individuals on which ticks occurred in their calculations of
ectoparasite density. Assuming the authors included only hosts from which ticks were
found, I compare ectoparasite densities in Paraguay to those reported from Venezuela.
Ornithodoros hasei occurred in greatest density (10 – 25 individuals per host individual)
on Noctilio albiventris and N. leporinus in Venezuela and Paraguay. All other host
species have average densities of 1 - 5 individuals per bat, with a modal value of one tick
per bat in each country. Similar to the data from Paraguay, most Venezuelan records of

36
Amblyomma, Ixodes, and Rhipicephalus from bats were of single ticks infesting one host
individual per host species (Jones et al. 1972). All of these associations are transient.
Trombiculid infestation levels reported in bats appear lower than those in other
mammals (Brennan and Reed 1974, 1975, Brennan and Yunker 1966, and Brennan and
Goff 1977, Reed and Brennan 1975). Wrenn and Loomis (1984) presented the incidence
of chiggers on reptilian, avian, and mammalian hosts for ten regions throughout the New
World. Bats were among the least infested in all regions (incidence = 0.4 to 2.8%),
whereas mammals as a group were infested between 6.8 and 97.3% of the time. In
Paraguay, chiggers were found on 1% of all bats; incidence of chiggers from Paraguayan
rodents or marsupials from the project has not been studied. The immature parasitic
stage in chiggers crawls on the soil in search of hosts, which may predispose terrestrial
vertebrates to higher infestation rates compared to bats.
In Paraguay myobiids occurred on only 12 of 2909 inspected hosts (Appendix C).
Myobiids are common and abundant residents of bats (Dusbábek 1969b, 1973, Uchikawa
1987, 1988, Uchikawa and Harada 1981); however there are no reports of prevalence or
incidence values for these associations. Ninety-seven individuals and 242 eggs were
collected from a small lesion on a single Artibeus phaeotis (Lukoschus et al. 1981). Six
new species of Eudusbabekia, each collected from different bat species, were described
by Dusbábek and Lukoschus (1974). Each type series ranged from 7 to 33 individuals
( X = 16.17). Unfortunately, only individuals for the type host were listed. No mention
of incidence or density for hosts in general is available.
Myobiid mites remain embedded in mammal skins long after the deaths of host
and mite (Fain 1978, Uchikawa and Baker 1993). Mites were collected from already
prepared museum specimens that were collected 0 to 79 years before inspection, and
generally numbered 1 to 8 ectoparasites per infested bat. However, these numbers
represent only specimens still attached to host skins after handling, specimen preparation,
and years of storage. It is likely that many myobiids are lost from prepared specimens;
therefore, these collections probably represent only a fraction of the myobiids present at
the time of host collection. The number of hosts inspected was not listed in either study,

37
host individuals were only noted if they harbored a new species of myobiid. As a result,
it is impossible to estimate incidence, prevalence, or density in these studies. Despite the
small numbers of myobiids found in this study, obviously they can reach high densities
on hosts. Myobiids are small (0.2 – 0.4 mm), even for ectoparasites. The lack of
myobiid documentation in Paraguay likely reflects methodological efficacy and is not an
accurate indication of infestation levels.
Host Specificity
Parasitism is an extreme mode of specialization. For every adaptation for
parasitism there is a corresponding loss of versatility and increasing dependence on the
host; ultimately leading to strict host specificity (i.e., monoxenous parasites). Except for
ticks and chiggers, ectoparasites of bats are highly host specific (i.e., monoxenous or
pleioxenous). Although some authors (e.g., Wenzel 1976) identify host-parasite
associations, and differentiate between primary associations and transient observations or
contamination, few assign levels of host specificity to ectoparasites. As such,
comparison of host specificity between studies is difficult. Indeed, if transient
associations or probable contamination are not removed from consideration, care taken
during collection becomes all-important in comparative studies. Moreover, host sample
size affects the likelihood of discovering non-primary associations.
Herrin and Tipton (1975), Machado-Allison (1965), and Sheeler-Gordon and
Owen (1999) reported host specificity for the genus Periglischrus in Venezuela,
Venezuela, and Mexico, respectively. All reported similar levels of host specificity to
that found in Paraguay (Table 2.53). However, some species (e.g., P. herrerai) are
reported by Herrin and Tipton (1975) as polyxenous as a result of the inclusion of non-
primary associations with Anoura spp., Sturnira lilium, and S. ludovici. P. herrerai
would have been classified polyxenous in Paraguay if all documented association were
considered (Table 2.48). However, this ectoparasite has only one primary association
(Desmodus rotundus as host) and is functionally monoxenous throughout its distribution.
Another complexity arises when comparing host assemblages from different regions.

38
Differences in the structure of host communities (e.g., number of species in a genus or
genera in a subfamily) can affect designations of specificity. For example, P. tonatii and
P. caligus are pleioxenous in Venezuela (Herrin and Tipton 1975). Each infests a single
genus represented by multiple species in Venezuela (i.e., P. tonatii on Tonatia and P.
caligus on Glossophaga). However, only one species of Glossophaga occurs in
Paraguay. In addition, whereas three species of Tonatia occur in Paraguay, each is rare,
affording few chances for detecting P. tonatii. As a consequence, the designation of
these ectoparasites as monoxenous in Paraguay may represent sampling biases or the
biogeographic distribution of potential host species.
Tick assemblages on Paraguayan bats were species poor. Over 99.5% of ticks
collected from Paraguayan bats were Ornithodoros hasei (Appendix C). Single
individuals of other species of ticks were rare, occurred on five different bat genera, and
represent transient associations. O. hasei are specific to bats and occurred on 19 bat
species in Paraguay. Ten of those associations are primary, and include four host
families (Noctilionidae, Phyllostomidae, Vespertilionidae, Molossidae). In Paraguay,
ticks exhibit no host specificity on bats. Indeed, it would have been surprising to find
high levels of host specificity given that consecutive feedings of individual argasids often
are on different host species (Hoogstrall and Aeschlimann 1982, Oliver 1989). Jones et
al. (1972) reported O. hasei from numerous bat species that included representatives of
each of the four host families from which it was recorded in Paraguay.
Although half of the trombiculid species collected from bats in Paraguay were
found from a single host species, it more probable that these ectoparasites are polyxenous
than monoxenous. Most likely, chiggers were under sampled because of their small size.
Studies focused on chiggers (e.g., Brennan and Reed 1974, 1975) document most
trombiculid species from two or more vertebrate orders (e.g., Aves, Reptilia, Amphibia).
Therefore, the likelihood that chiggers on bats are more specific than polyxenous is low
despite documented occurrences here.

39
Chirodiscids rarely exhibit host specificity (McDaniel 1973). Although restricted
to bats, the common taxa (e.g., Beamerella sp., Trombicula sp.) usually occur on hosts
from > 1 family, as was true in Paraguay (Appendix C).
Myobiids are extremely host specific (Dusbábek 1969b, 1973, Uchikawa 1987,
1988, Uchikawa and Baker 1993). Most often, each mite genus is restricted to a single
host family and each mite species is restricted to a single host genus. At the ectoparasite
taxonomic levels of genus and species, primary host associations were consistent with
previous records (Dusbábek 1969b, 1973, Uchikawa 1987, 1988, Uchikawa and Baker
1993) for both myobiid genera occurring in Paraguay; Eudusbabekia and Ewingana were
restricted to phyllostomid and molossid bats, respectively. Moreover, each species of
myobiid occurred on a different host genus.
Ectoparasites and Safe Spaces
Streblids and nycteribiids have well-developed, flexible legs that allow them to
walk rapidly forward, backward, and sideways while clinging to the host, even to flying
hosts (Marshall 1982a). Nycteribiids and many streblids are wingless; however,
modified hind wings used for balance are present in both families. Streblids may be
found anywhere on a host, whereas nycteribiids are found only on pelage; both families
feed on naked areas (e.g., patagia, ears, lips). Bats are capable of grooming all body
parts, and hosts do capture, kill, and consume bat flies (Fritz 1983). Observed flies rarely
moved during grooming, even when grooming activity was close to the fly’s location.
Most fly movements involved intraspecific interactions and were not a response to host
initiated stimuli. On roosting hosts, nycteribiids congregate in difficult to groom areas
(e.g., between scapulae, under the chin, in the axilla). In contrast, while the host is in
flight, nycteribiids move to the dorsal side of the tail (Marshall 1982a). Streblids differ
in site preference depending on species, season, and roosting habits of the host; some
species prefer pelage and other patagia (Kunz 1976, Marshall 1982a, Wenzel et al. 1966).
Given the complexity of bat fly movements on hosts in response to host behavior or the

40
environment, multiple safe spaces may be required for each species of bat fly, which may
reduce potential bat fly richness.
There are three distinct niches for bat flies based on microhabitat distribution on
hosts (i.e, in the fur, on the fur, or on the patagia). In Paraguay, streblids occupy each of
these niches, whereas nycteribiids and polyctenids are restricted to niches on the fur and
in the fur, respectively. Regardless of ectoparasite taxon, if safe spaces are limiting, no
more than three species of bat fly (i.e., one for each distinct niche) should occur on a host
species at equilibrium.
Species that occupy any one of these three niches have distinctive adaptations to
facilitate movement and attachment to the host. Fur swimmers move within the host
pelage and are dorso-ventrally (e.g., Metelasmus, Strebla) or laterally (e.g.,
Nycterophilia) flattened to facilitate movement. Fur runners move across the surface of
host pelage and have greatly elongated hind legs that maintain the abdomen above host
fur during rapid movements. Wing crawlers prefer patagia and have a generalized fly
morphology (i.e., legs of modest and equal length). Although some genera of streblids
have greatly reduced wings, wing development does not affect habitat preference on the
host; species from each ecomorphological group may have fully developed or greatly
reduced wings. Nycteribiids belong to two ecomorphological groups: fur swimmers and
fur runners (Marshall 1982a). Smaller species are fur swimmers and larger species are
fur runners. All nycteribiids in Paraguay are fur running, large flies of the genus Basilia.
Competition for safe spaces should limit bat fly species richness on hosts. Polyctenids
have modified forelegs with weak claws that part the host’s hair to aid in locomotion and
two pairs of backward pointing legs. These insects move through the fur with a
swimming motion (Marshall 1982a). Polyctenids are restricted to pelage and wander
widely over the host body. Areas with longer hair that are difficult to groom (e.g.,
between the scapulae) are preferred (Marshall 1982b, Schuh and Slater 1995).
Spinturnicids have two sets of adaptations that facilitate adherence to and
movement on bat patagia: 1) strong, thick legs with heavy claws and immovable coxae
and 2) dorso-ventrally flattened and slightly concave bodies (Rudnick 1960).

41
Spinturnicids never leave the host and are incapable of locomotion when not on patagia.
Nonetheless, all parts of patagia are not inhabited equally. Spinturnicids occurred most
often on the ventral side of the wings, in particular from the angles created by the
forearm, metacarpals, and phalanges that appear to be preferred safe spaces.
Macronyssids possess many traits (e.g., flattened bodies, unidirectionally pointing
setae, caudally directed spines, coxal spurs, large tarsal claws) that aid in movement
through pelage and adhering to the host (Saunders 1975). Host body locations are
species-specific for macronyssids. Moreover, one macronyssid species may inhabit
distinct host body locations at different developmental stages. For example, larval
Chiroptonyssus robustipes generally feed on the dorsal surface of the wing, facing
anteriorly, whereas adults occur in the pelage (Radovsky 1967). In contrast, all stages of
Steatonyssus antrozoi remained in the pelage with the preferred location on the lower
back of the host (Radovsky 1967).
Predation of ectoparasites by the host limits habitable spaces. Indeed, places on
the host where ectoparasites can avoid host grooming (i.e., safe spaces) likely are the
limiting resource for which ectoparasites compete. In addition, because of the high
degree of specialization required to exploit safe spaces, once a safe space is occupied it is
likely that incumbent ectoparasite species prevent successful infestation of additional
ectoparasite species via interference competition. Moreover, adaptations that are
advantageous for one safe space are unfavorable for other safe spaces, preventing a single
ectoparasite species for exploiting all available safe spaces. All of these factors (i.e., host
predation, competition, specialization, and limited safe spaces) conspire to constrain both
abundance and richness of ectoparasite assemblages on bats. If these mechanisms
operate as described, one would expect to observe species poor communities with
relatively even SADs. Ectoparasite assemblages from bats of Paraguay conform to these
expectations. Assemblages of ectoparasites were species-poor, with individual bats
harboring an average of 1.28 primary species of ectoparasite. In addition, the majority of
ectoparasite assemblage SADs conformed to the BS model (Table 2.50), which
represents a relatively equitable distribution of individuals among ectoparasite species

42
(i.e., high evenness) and is most commonly found in situations where one resource is
being shared fairly evenly in the community.
Streblids and Safe Spaces on Noctilio. Noctilio have short, sparse fur that lies flat
and does not provide habitat for fur swimmers. In addition, the major adaptation (i.e.,
greatly elongated hind legs) for fur runners is not required for effective movement over
Noctilio pelage. As a result, Noctilio only harbor streblids with the general bat fly
ecomorphology typical of wing crawlers. However, each species of Noctilio harbors
three streblid species (Tables 2.6 and 2.7) that all have wing crawler morphology and
prefer patagia to pelage (Carl Dick pers. comm.). Noctilio are among the largest
Paraguayan bats and may provide sufficient patagial space to reduce competition between
wing crawling streblids or provide distinct patagial safe spaces.
The most common and abundant fly on Noctilio albiventris is Paradyschiria
parvula, which occurred on 89% of Noctilio albiventris in Paraguay (Table 2.6).
Noctiliostrebla maai occurred on only 66% of Noctilio albiventris, but P. parvula
occurred on all 45 of the Noctilio albiventris that had Noctiliostrebla maai.
Paradyschiria and Noctiliostrebla are morphologically similar and should be
competitors; however these fly species do not exhibit competitive exclusion and appear to
prosper when sharing a host. Noctilio albiventris are also host to a tick (Ornithodoros
hasei), with a mean prevalence of 11.4 ticks per bat (Table 2.6). Interestingly, Noctilio
albiventris with < 4 Noctiliostrebla maai had significantly more O. hasei (F = 4.41, p =
0.039, df = 1,65) than did Noctilio albiventris with > 4 Noctiliostrebla maai. No Noctilio
albiventris with > 5 Noctiliostrebla maai (n = 15) had > 2 ticks, whereas 38% (n = 42) of
Noctilio albiventris with < 4 Noctiliostrebla maai harbored > 10, and as many as 94 ticks.
Moreover, there is a significant, negative relationship between the number of
Noctiliostrebla maai and O. hasei on Noctilio albiventris (p = 0.027, r2 = 0.07).
Similarly, O. hasei were less abundant on Noctilio leporinus in the presence of
Noctiliostrebla than on hosts without Noctiliostrebla; however the differences were not
significant, perhaps because of small sample sizes (n = 23). Noctiliostrebla and O. hasei
may compete on Noctilio, with Noctiliostrebla being competitively dominant.

43
Noctilio leporinus had similar patterns of streblid co-occurrence among its three
streblid species (Noctiliostrebla aitkeni, Noctiliostrebla dubia, and Paradyschiria fusca).
With the exception of one Noctiliostrebla dubia, the streblid assemblages on Noctilio
leporinus were perfectly nested. If a Noctilio leporinus harbored only one species of
streblid, it always was P. fusca. Noctiliostrebla aitkeni did not occur without P. fusca;
62% percent of all Noctilio leporinus with P. fusca also harbored Noctiliostrebla aitkeni.
Moreover, 46% of Noctilio leporinus with P. fusca and Noctiliostrebla aitkeni also
harbored Noctiliostrebla dubia. Instead of illustrating competitive exclusion these flies
co-exist frequently and occur in greater abundances when sympatric. For example, P.
fusca had a prevalence of 3.3 flies per bat on hosts without Noctiliostrebla, whereas P.
fusca had a prevalence of 14.6 flies per bat on hosts with Noctiliostrebla. The two most
likely explanations for these patterns of co-existence and ectoparasite density are: 1) that
the presence of Paradyschiria facilitates infestation by Noctiliostrebla which facilitates
increases in Paradyschiria densities, creating a positive feedback loop leading to greater
fly densities, or 2) some characteristic of host individuals affects susceptibility to streblid
infestation. Although all streblid species on Noctilio have wing crawler ecomorphology,
short host pelage may allow species of wing crawler ecomorphology to use furred parts
of the host effectively. Nonetheless, personal observations (Carl Dick, pers. comm.) of
the streblids on Noctilio collected from Paraguay, Peru, Honduras, and Venezuela
indicate that all of these species usually are found on patagia and not the trunk. The
biology of streblids is too poorly studied to explain how one fly species could facilitate
the infestation of another. Preliminary analyses of likely host factors (e.g., host sex, host
size, host age, collection location) that may affect host susceptibility to streblids were
non-significant for assemblages on both species of Noctilio. Host health, size of roosting
group, and roost type are factors that could affect Noctilio vulnerability to streblid
infestations that were not measured and are difficult to measure. This ectoparasite
assemblage and the interactions among Noctiliostrebla, Paradyschiria, and Ornithodoros
warrant further study.

44
Resource Partitioning on Molossids
In general, weak interspecific competitive interactions characterize ectoparasite
assemblages of bats (Marshall 1982a and citations therein); however, indirect evidence
suggests that families of bat flies exclude one another from particular host species or
individuals (Wenzel and Tipton 1966b, Marshall 1982a). A distinct pattern characterizes
bat fly associations on New World bats. Host species with polyctenids harbor neither
nycteribiids nor streblids. Similarly, although nycteribiids and streblids may occur on the
same host species, both do not occur on the same host individual. These patterns exist for
bat ectoparasites in Paraguay with one notable exception. The primary hosts for streblids
in Paraguay were generally phyllostomids, however, Trichobius jubatus, a wing crawler,
occurred only on molossids, and often coexisted on the same host individuals with
polyctenids, which are dorso-ventrally flattened fur swimmers. Hesperoctenes longiceps
occurred with T. jubatus on Eumops patagonicus, and H. fumarius occurred with T.
jubatus on Molossus ater and M. molossus. T. jubatus occurred on 59 host individuals
and co-occurred with a polyctenid on 17 of those hosts. Trichobius prefer naked
membranes over haired parts of the body (Kunz 1976, Ross 1961). By using a safe space
on molossids (i.e., patagia) that is not used by polyctenids, co-existence is facilitated.
Implications to Host Phylogeny Based on Ectoparasites
Specializations resulting from close associations with particular host species make
ectoparasites obligate parasites of those hosts. Most often, this reliance increases levels
of host specificity. Over evolutionary time, close associations between hosts and
ectoparasites make ectoparasites useful tools for understanding host phylogenies. The
Spinturnicidae, Macronyssidae, and Myobiidae are ectoparasite families most often used
to elucidate host phylogenies at specific to ordinal levels (Dusbábek 1969a). Uchikawa
and Harada (1981) found myobiids to be more divergent than their hosts (karyotypes),
suggesting that these ectoparasites are at least as efficient indicators of bat taxonomy and
phylogeny as are karyotypes. Analyses based on myobiid mites produced a phylogeny of

45
bat hosts comparable to that based on karyologic studies. Moreover, closely related
species of myobiids infest closely related species of hosts (Uchikawa and Baker 1993).
Ectoparasite studies have led to the discovery of new host taxa that were cryptic
based on considerations of morphology. Eurasian Miniopterus were reexamined and
seven new species described (Maeda 1982) because of work associated with ectoparasites
(Uchikawa 1984)). Similarly, work on the ectoparasites of Noctilio indicates that more
than two species may exist in the genus (Wenzel 1976, Wenzel et al. 1966, Carl Dick
unpub. data).
A study of the myobiids suggested two changes to pteropodid phylogeny
(Uchikawa 1986). One suggestion, reassigning Megaglossus from the Macroglossinae to
the Pteropodinae, was supported by a recent study of bat phylogeny (Jones et al. 2002),
whereas the other, reassigning Eonycteris from the Macroglossinae to the Pteropodinae,
was not. Studies (Uchikawa 1987, Machado-Allison 1967) on two ectoparasite families
(i.e., Myobiidae and Spinturnicidae) suggested that the Desmodidae should be relegated
to a subfamily within the Phyllostomidae. This arrangement was adopted subsequently
and generally is accepted by mammal taxonomists (Jones et al. 2002, Koopman 1993).
Subfamilial Status of Sturnira. Artibeus fimbriatus, A. jamaicensis and Sturnira
lilium in Paraguay (Tables 2.15, 2.16, and 2.21, Appendices B and C) have primary
associations with a streblid from each ecomorphological group; a fur swimmer
(Metelasmus spp.), fur runner (Megistopoda spp.), and wing crawler (Aspidoptera spp.).
By using different safe spaces, three species from the same ectoparasite family avoid
competition and co-exist on the same host. Two species of Artibeus (A. fimbriatus and A.
jamaicensis) and S. lilium have primary associations with the same three genera of
streblids. Interestingly, A. lituratus have a primary association with none of these streblid
genera, but do have a primary association with Paratrichobius longicrus, a fur runner
(Table 2.17, Appendices B and C). Moreover, all three species of Artibeus have primary
associations with the same macronyssid (Macronyssoides kochi) and spinturnicid
(Periglischrus iheringi), whereas Sturnira have a primary association with a different
macronyssid and spinturnicid, Parichoronyssus euthysternum and Periglischrus ojasti,

46
respectively. No explanation for the divergence between streblids on Artibeus lituratus
and those on other species of Artibeus is forthcoming. All three species of Artibeus are
ecologically similar. In addition, A. lituratus and A. jamaicensis have nearly identical
geographic distributions, whereas the distribution of A. fimbriatus is restricted to southern
Brazil and Paraguay (Eisenberg 1989, Koopman 1982, Redford and Eisenberg 1992, Reid
1997). The subfamilial status of Sturnira is uncertain. Some authors (e.g., Redford and
Eisenberg 1992) place Sturnira in a separate subfamily, Sturnirinae, however, more
recent works (e.g., Jones et al. 2002, Baker et al. 2003) include Sturnira in the same
subfamily as Artibeus, Stenodermatinae. That ectoparasite assemblages of Artibeus are
more similar to those from Sturnira than to those of other stenodermatine bats is evidence
that Sturnira belongs in the Stenodermatinae.
Relationships among the Vampires, Glossophaga and Carollia. In Paraguay,
Carollia perspicillata, Glossophaga soricina, and the vampires, Desmodus rotundus and
Diaemus youngi, each harbor fur swimmers of the genus Strebla and wing crawlers of the
genus Trichobius (Tables 2.11-2.14). Desmodontinae is a sister taxon to all other
phyllostomid subfamilies as a group (Baker et al. 2003, Jones et al. 2002). Although the
streblids of Carollia and Glossophaga are more similar to those of vampires than their
respective sister groups, it is more likely that Trichobius and Strebla are primitive genera
that infested phyllostomid ancestors before speciation than it is that carolline and
glossophagine bats are more closely related to desmodontine bats than to stenodermatine
and lonchophylline bats, respectively (Jones et al. 2002).
Species Abundance Distributions and Resource Partitioning
In its most basic sense, biodiversity means “life on earth” (Huston 1994).
However, the concept of biodiversity is not simple to measure, includes variation at all
taxonomic levels, and has genetic, phenotypic, functional, and ecological attributes
(Stevens and Willig 2000, Willig 2002a, Zak et al. 1994). Measurement of biodiversity
began as a simple idea; the number of species in an area. Despite apparent simplicity,
even this basic measure presented problems (e.g., taxonomic difficulties, effect of sample

47
size or area). Measures of biodiversity were expanded to include estimates of relative
abundance (e.g., Shannon and Simpson diversity indices – Magurran 1988). Nonetheless,
attempts to estimate biodiversity in a single metric (e.g. species richness, Simpson’s
diversity Index) are criticized because much information is lost (Willig 2002b). As data
sets containing species richness and relative abundances were accumulated, patterns of
species abundance distributions (SADs) were recognized (Magurran 1988). Species
abundances are not distributed evenly, rather few species are common, few occur at
intermediate abundances, and most are rare. Species abundance models (e.g., broken
stick, geometric series) were developed and advocated as the best basis for examination
of taxonomic components of biodiversity because SADs use all of the information
gathered about a community or assemblage (May 1975, Southwood 1978). SADs usually
are compared to four models (i.e., geometric series (GS), logseries, lognormal, and
broken stick (BS)), which represent a continuum from less even (GS) to the more even
(BS) distributions.
The lognormal distribution is the most common model used to describe SADs
(May 1975). However, “the lognormal distribution reflects the statistical Central Limit
Theorem; conversely, in those special circumstances where broken-stick, geometric
series, or logseries distributions are observed, they reflect features of the community
biology.” (May 1975). This interpretation of the lognormal may be somewhat
misleading, as the lognormal may suggest that many independent and additive factors
contribute to observed abundance distributions within a group of species. Nonetheless
these factors are difficult to distinguish in the present study. By fitting an empirical SAD
of the ectoparasite assemblage of each of the 24 common host species to the GS and BS
models, I can evaluate whether: (1) hosts are harsh environments that promote species-
poor assemblages with high levels of dominance (i.e., consistent with the GS model), or
(2) a single limiting resource is shared relatively evenly by ectoparasite species (i.e.,
consistent with the BS model). Ectoparasite assemblage richness is usually low (i.e.,
fewer than six species); therefore analyses of these assemblages lack power. Generally,

48
SADs that fit both models are examples of situations for which analyses were not
powerful enough to distinguish between competing models.
Visual inspection of the SADs of ectoparasites from common bat hosts of
Paraguay (Figs. D1 – D39) evince two noteworthy patterns. First, SADs that fit a BS
model had one or more of the following traits: A) co-dominant species (i.e., species with
high and similar abundances), B) co-subdominant species (i.e., multiple species with
similar and intermediate abundances), and C) several rare species (i.e., species
composing < 5% of the total number of individuals). Second, SADs that fit the GS
model had one dominant species, one subdominant species, and few rare species.
If empirical SADs fit the BS model, the interpretation often is that species are
sharing a single limiting resource in a relatively even manner compared to SADs that fit
the other three common theoretical models (i.e., LS, LN, and GS). The resource for
which bat ectoparasites compete likely is space on the host, in particular locations where
mortality from grooming is unlikely (i.e., safe space). The “sharing” of a resource
implies that participating species are not engaged in intense competition or that
competition has led to niche partitioning in the past. A generally accepted view of
parasite coexistence considers most parasite communities to be unsaturated; interspecific
competition does not play a major structuring role as seen in demographics (Mouillot et
al. 2003). In Paraguay, 13 of the 24 SADs for bat ectoparasites fit the BS model. There
are three probable explanations: 1) these assemblages are not structured by competitive
interactions, 2) competitors already have been excluded from the assemblage, or 3)
competitors have diverged to take advantage of distinct safe spaces.
Only one assemblage fit the GS model but not the BS model. The k-value (% of
remaining niche space pre-empted by each species) for the five SADs that fit the GS
model ranged from 0.45 – 0.73 ( k = 0.59). In general, assemblages with higher k-values
have fewer species because higher rates of niche space pre-emption leave less niche
space for subsequent species (Magurran 1988). The assemblage of primary ectoparasites
for those SADs that fit the GS averaged 4.4 species per assemblage. In contrast, a
relatively simple marine fish assemblage had 70 species and a k of 0.14 (Fujita et al.

49
1993), whereas an assemblage of epiphytic chironomids had nine species and a k of 0.507
(Tokeshi 1986, 1990). Ectoparasite species partition safe spaces relatively evenly, as
described by the BS, and not by dominant species pre-empting a constant proportion of
the available safe space, as in the GS. Because each type of safe space requires
distinctive specialization, all available safe space cannot be used by a single ectoparasite
species as modeled by the GS. For example, bat flies, spinturnicids (wing mites), and
macronyssids each have unique safe spaces to which they are adapted (i.e., a safe space
for a spinturnicid is not safe for a streblid or macronyssid), which in turn leads to a
relatively even SAD. Trade-offs exist. Because each safe space requires a particular
suite of adaptations, each parasite species may only effectively avail itself of one safe
space, leaving other niches open for other specialists. In addition, priority rules (e.g.,
Paine 1977) likely are in effect (i.e., the first ectoparasite species to use a particular safe
space has a distinct advantage over new colonizers) in ecological and evolutionary
contexts. Evolutionarily, once safe spaces on host species are occupied, it likely is
difficult for alternative ectoparasite species to evict well-adapted species or evade a
hosts’ grooming activity, effectively leading to competitive exclusion. Ecologically,
immigration rates are sufficiently low so that early colonists can reproduce and saturate a
safe space prior to the arrival of potential competitors.
Of Birds and Bats
Few investigations (e.g., Gannon and Willig 1995) have attempted to determine
the effect of host ecology or morphology on bat ectoparasite assemblages; however,
many studies of the effect of bird biology on avian parasite assemblages have been
published. Ecologically, birds and bats are similar and present ectoparasites with
comparable host opportunities. Many birds and bats roost in trees, many species are
colonial for at least part of the year, some species of each migrate, and both are volant
homeotherms. Therefore, bat ectoparasite assemblages may be more comparable to those
of birds than to other mammalian taxa.

50
Although bird ectoparasite assemblages have been more thoroughly studied than
those of bats, basic information (e.g., incidence, prevalence, density) is published rarely.
The effect of ectoparasite infestations on avian hosts include investigations of breeding
success (e.g. Allander 1998, Darlová et al. 1997, Santos Alves 1997), long-term survival
(Brown et al. 1995), nest-site choice (e.g., Loye and Carrol 1991, Mappes et al. 1994),
mate choice (e.g., Spurrier et al. 1991), mating behavior (e.g., Møller 1991a, 1991b), and
the cost of colonial living (e.g., Brown and Brown 1986, Poulin 1991). Despite the
tremendous quantity of data concerning avian hosts, few studies focus on ectoparasites or
their assemblage structure. Even less is available concerning comparative ecology of
ectoparasite assemblages on different bird species. This is unfortunate, considering that
birds harbor the most studied ectoparasite communities on wild animals.
Pruett-Jones and Pruett-Jones (1991) analyzed tick burdens of 115 bird species
from New Guinea and concluded little other than adult ticks do not parasitize birds, with
> 95% of individuals harboring < 1 tick, and only one tick species was present on the
entire host assemblage. Similar to the situation characterizing ectoparasite assemblages
of bats, ticks are not key components of avian ectoparasite assemblages, are not host
specific or abundant, and lack taxonomic richness (Pruett-Jones and Pruett-Jones 1991).
The most noteworthy difference between ectoparasite assemblages on bats and
birds is that the latter may host orders of magnitude more individuals that do the former.
Indeed, infestations of over 30,000 mites per nest have been documented to have no
effect on fledgling mortality in passerines (Burtt et al. 1991). Most studies find only
minor differences in fledgling survivorship and weight as a function of parasite load
(Loye and Zuk 1991 and sources therein).
There are many reasons birds harbor more species rich and dense ectoparasite
assemblages than do bats. Feathers provide a more complex habitat than does hair. This
allows for more specialization in bird ectoparasites than in bat ectoparasites (Crompton
1991). The complex anatomical structure of feathers allows parasites to live on, among,
and inside feathers. Indeed, many feather types have shafts large enough to house
51
ectoparasites (Proctophyllodids) that spend nearly their entire lives inside a feather, only
exiting during molting phases.
In terms of ambient temperature, birds provide a more stable habitat than do bats.
Bats are capable of heterothermy; most bat species are torpid (Altringham 1996, Crichton
and Krutzsch 2000, Findley 1993, Fleming 1988, Hill and Smith 1984, Humphrey and
Cope 1976) and many bat species hibernate (Altringham 1996, Findley 1993, Hill and
Smith 1984, Humphrey and Cope 1976) for extended periods of time (Fleming and Eby
2003). Compared to bird ectoparasites, bat ectoparasites must deal with greater
temperature fluctuations for longer periods.
Most birds build nests with complex structure providing “off-host” refuges for
ectoparasites. Moreover, nests are integral to birds for protection and rearing young.
Birds use the same nest throughout egg incubation and rearing of the young (Gill 1990),
which lasts several months and is longer than the life cycle of most ectoparasites. In
addition, many bird species use the same nest for consecutive years. All of these factors
(e.g., complex structure, reliable return, extended use) make birds more reliable hosts
than bats for ectoparasites that spend time off-host. In contrast, foliage roosting bats use
multiple (usually 3-7) locations for roosting during short time intervals and frequently
switch roosts (i.e., use different day-roosts on consecutive days), which results in roosts
being unoccupied for several days at a time (Kunz 1982, Kunz and Lumsden 2003).
Indeed, most bats that roost in foliage, tree cavities, or beneath exfoliated bark switch
roosts daily, often never returning to a roost (Kunz and Lumsden 2003). Because most
bat ectoparasites survive < 2 days without a meal, roost switching habits enhance risk for
nest-parasites of bats. Nest-parasites are an appreciable component of bird ectoparasite
assemblages (Allander 1998, Brown and Brown 1986, Darlová et al. 1997, Loye and
Carrol 1991, Mappes et al. 1994, Møller 1991a, 1991b, Poulin 1991, Santos Alves 1997);
however, bats (even relatively roost-faithful cave-dwelling bats) have few ectoparasites
(e.g., trombiculids and some bat flies) that do not spend nearly all of their time on the
host. Because space on the host is a limiting resource for bat ectoparasites, the lack of a

52
nest or reliable roost location further reduces the number of ectoparasite species and
individuals in bat ectoparasite assemblages.
Conclusions
The ectoparasite collection methodology employed during this study resulted in
less cross-host contamination (< 1/3 the contamination rate) than in previous studies
(Herrin and Tipton 1975). Nonetheless, families of smaller ectoparasites (e.g.,
Myobiidae, Chirodiscidae) are under-represented here because their collection requires
more time-consuming, careful inspection than the method employed in Paraguay. In
general, host-parasite associations in Paraguay corroborate previously reported
associations. Analysis of the SADs of ectoparasite assemblages (restricted to primary
associations) revealed that the limiting resource for ectoparasites (i.e., space on the host)
is relatively evenly divided among component taxa, within the context of commonly used
models of SADs such as the broken stick, geometric series, log normal, and log series
models. Ectoparasite SADs are not consistent with models (i.e., geometric series) based
on niche preemption hypotheses. Observations of insects ectoparasitic on bats
demonstrate that competition is reduced by specializations for locomotion on particular
parts of the host (i.e., microhabitats). Three suites of ecomorphological specializations
(e.g., fur swimmers, fur runners, wing crawlers) characterize streblids. Co-existence of
multiple fly species on individual hosts often is attained by microhabitat specialization in
this taxon. Host grooming activity is a major cause of bat fly mortality. Nonetheless,
observations of bat flies on live hosts indicate that most ectoparasite movements result
from inter- and intra-specific interactions among ectoparasites, and are not responses to
host grooming. Therefore, competition may play a major role in limiting ectoparasite
diversity on bat hosts. Indeed, there is evidence that some bat flies protect their host from
infestation by other ectoparasite species. Ecological understanding of microhabitat use
by arachnid ectoparasites of bats is minimal. Therefore, it is difficult to hypothesize
ecological mechanisms that limit ectoparasitic arachnid richness or abundance.
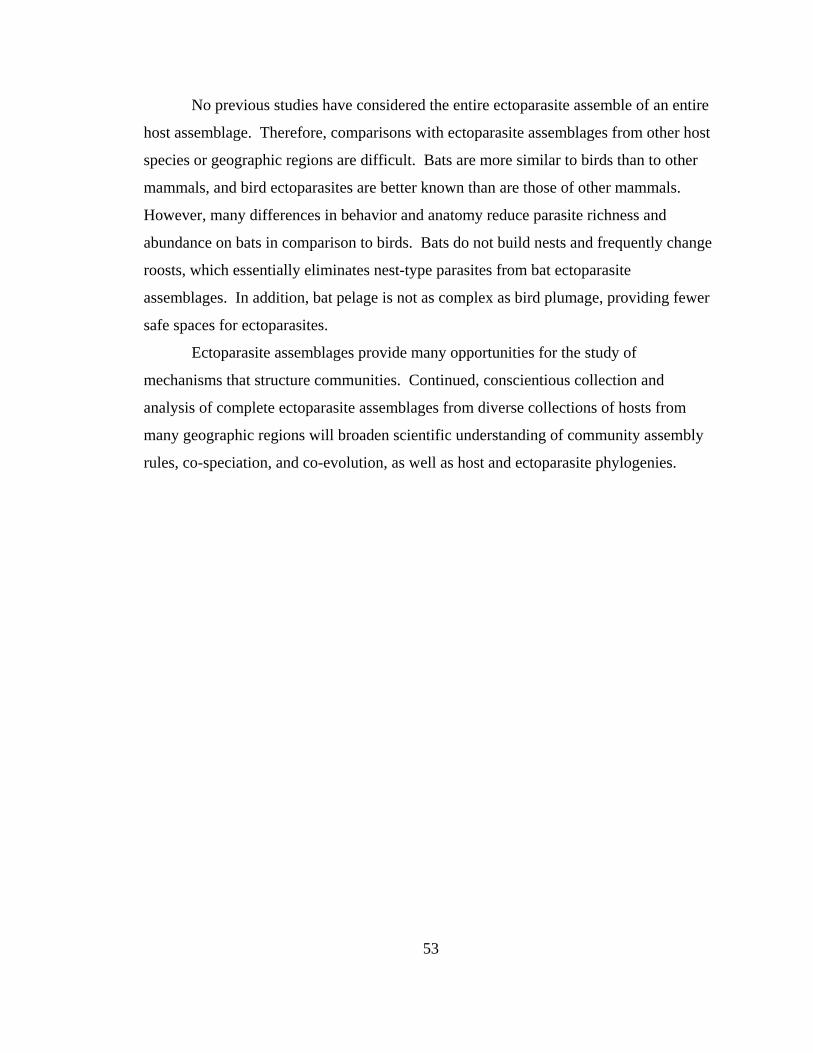
53
No previous studies have considered the entire ectoparasite assemble of an entire
host assemblage. Therefore, comparisons with ectoparasite assemblages from other host
species or geographic regions are difficult. Bats are more similar to birds than to other
mammals, and bird ectoparasites are better known than are those of other mammals.
However, many differences in behavior and anatomy reduce parasite richness and
abundance on bats in comparison to birds. Bats do not build nests and frequently change
roosts, which essentially eliminates nest-type parasites from bat ectoparasite
assemblages. In addition, bat pelage is not as complex as bird plumage, providing fewer
safe spaces for ectoparasites.
Ectoparasite assemblages provide many opportunities for the study of
mechanisms that structure communities. Continued, conscientious collection and
analysis of complete ectoparasite assemblages from diverse collections of hosts from
many geographic regions will broaden scientific understanding of community assembly
rules, co-speciation, and co-evolution, as well as host and ectoparasite phylogenies.

54
Literature Cited
Allander, K. 1998. The effects of an ectoparasite on reproductive success in the great tit: a 3-year experimental study. Canadian Journal of Zoology 76:19-25.
Altringham, J. D. 1996. Bats: biology and behaviour. Oxford University Press, New
York, New York. Anderson, S. 1997. Mammals of Bolivia, taxonomy and distribution. Bulletin of the
American Museum of Natural History 231:1-652. Baker, E. W., T. M. Evans, D. J. Gould, W. B. Hull, and H. L. Keegan. 1956. A manual
of parasitic mites of medical or economic importance. National Pest Control Association, Inc., Washington D. C.
Baker, R. J., S. R. Hoofer, C. A. Porter, and R. A. Van Den Bussche. 2003.
Diversification among New World leaf-nosed bats: an evolutionary hypothesis and classification inferred from digenomic congruence of DNA sequence. Occasional Papers, Museum of Texas Tech University 230:1-32.
Baker, R. J., J. C. Patton, H. H. Genoways, and J. W. Bickham. 1988. Genetic studies of
Lasiurus (Chiroptera: Vespertilionidae). Occasional Papers, The Museum, Texas Tech University 117:1-15.
Barquez, R. M., M. A. Mares, and J. K. Braun. 1999. The bats of Argentina. Special
Publications, The Museum, Texas Tech University 42:1-275. Bertoni, G. T., and J. R. Gorham. 1973. The geography of Paraguay. Pp. 9-31 in
Paraguay: ecological essays (J. R. Gorham, ed.), Academy of Arts and Sciences of the Americas, Miami, Florida.
Brennan, J. M. 1958. Beamerella and Kaaia, two new genera of chiggers from South
America (Acarina, Trombiculidae). Journal of Kansas Entomological Society 31:71-75
Brennan, J. M. 1970. Chiggers from the Bolivian-Brazilian border (Acarina:
Trombiculidae). The Journal of Parasitology 56:807-812. Brennan, J. M., and M. L. Goff. 1977. Keys to the genera of chiggers of the Western
Hemisphere (Acarina: Trombiculidae). The Journal of the Parasitology 63:554-566.

55
Brennan, J. M., and J. T. Reed. 1974. The genus Eutrombicula in Venezuela (Acarina: Trombiculidae). The Journal of Parasitology 60:699-711.
Brennan, J. M., and J. T. Reed. 1975. A list of Venezuela chiggers, particularly of small
mammalian hosts (Acarina: Trombiculidae). Brigham Young University Science Bulletin, Biological Series 20(1):45-75.
Brennan, J. M., and C. E. Yunker. 1966. The chiggers of Panama (Acarina:
Trombiculidae). Pp. 221-266 in Ectoparasites of Panama (R. L. Wenzel and V. J. Tipton, eds.). Field Museum of Natural History, Chicago, Illinois.
Brown, C. R., and M. B. Brown. 1986. Ectoparasitism as a cost of coloniality in cliff
swallows (Hirundo pyrrhonota). Ecology 67:1206-1218. Brown, C. R., M. B. Brown, and B. Rannala. 1995. Ectoparasites reduce long-term
survival of their avian host. Proceedings of the Royal Society of London, Series B 262:313-319.
Burtt, E. H., Jr., W. Chow, and G. A. Babbitt. 1991. Occurrence and demography of
mites of tree swallow, house wren, and eastern bluebird nests. Pp. 104-122 in Bird-parasite interactions: ecology, evolution, and behaviour (J. E. Loye and M Zuk, eds.). Oxford University Press, Oxford, Great Britain.
Camargo, J. A. 1992. Can dominance influence stability in competitive interactions?
Oikos 64:605-609. Chalcraft, D. R., J. W. Williams, M. D. Smith, and M. R. Willig. 2004. Scale
dependence in the relationship between species richness and productivity: the role of spatial and temporal turnover. Ecology (In Press).
Crampton, A., I. McKay, and S. C. Barker. 1996. Phylogeny of ticks (Ixodida) inferred
from nuclear ribosomal DNA. International Journal of Parasitology 26:511-517. Crichton, E. G., and P. H. Krutsch. 2000. Reproductive biology of bats. Academic
Press, Cambridge, Great Britain. Crompton, D. W. T. 1991. Birds as habitat for parasites. Pp. 253-270 in Bird-parasite
interactions: ecology, evolution, and behaviour (J. E. Loye and M Zuk, eds.). Oxford University Press, Oxford, Great Britain.
Darlová, A., H. Hoi, and B. Schleicher. 1997. The effect of ectoparasite nest load on the
breeding biology of the Punduline tit Remiz pendulinus. Ibis 139:115-120.

56
de la Cruz, J. 1969. Nueva especie de acaro (Acarina: Listrophoridae) parásito de murciélagos cubanos. Poeyana, Seria A 62:1-8.
Dusbábek, F. 1969a. To the phylogeny and zoogeography of bats (Chiroptera) based on
the study of their parasitic mites (Acarina). Proceedings of the First International Bat Conference 19-24.
Dusbábek, F. 1969b. To the phylogeny of genera of the family Myobiidae. Acarologia
11:537-574. Dusbábek, F. 1969c. Generic revision of the myobiid mites (Acarina: Myobiidae)
parasitic on bats. Folia Parasitologica 16:1-17. Dusbábek, F. 1973. A sytematic review of the genus Pteracarus (Acariformes:
Myobiidae). Acarologia 15:240-288. Dusbábek, F., and J. de la Cruz. 1966. Nuevos géneros y espécies de acaros (Acarina:
Listrophoridae) parásitos de murciélagos cubanos. Poeyana, Seria A 31:1-20. Dusbábek, F., and F. S. Lukoschus. 1974. Parasitic mites of Surinam XXVI. Mites of
the genus Eudusbabekia (Myobiidae: Trombidiformes) of the leaf-nosed bat subfamily Phyllostominae. Acarologia 16:476-499.
Eisenberg, J. F. 1989. Mammals of the neotropics: the northern neotropics. Volume 1,
Panamá, Colombia, Venezuela, Guyana, Suriname, French Guiana. University of Chicago Press, Chicago, Illinois.
Fain, A. 1978. Mites of the family Myobiidae (Acarina: Prostigmata) from mammals in
the collection of the British Museum (Natural History). Bulletin of the British Museum of Natural History, Zoological Series 33:193-229.
Fain, A. 1982a. The labidocarpine mites (Acari, Chirodiscidae) from oriental bats. III.
Genera Paralabidocarpus Pinichpongse, 1963, Labidocarpoides Fain, 1970, Labidocarpus Troussart, 1895, and Alabidocarpus Ewing, 1929. Systematic Parasitology 4:303-336.
Fain, A. 1982b. The labidocarpine mites (Acari, Chirodiscidae) from oriental bats. IV.
Genera Olabidocarpus Lawrence, 1948, Dentocarpus Dusbábek & Cruz, 1966, Labidocarpellus Fain, 1976, and Pteropiella Fain, 1970, with a key to the genera of Chirodiscidae. Systematic Parasitology 4:337-360.
Fairchild, G. B., G. M. Kohls, and V. J. Tipton. 1966. The ticks of Panama (Acarina:
Ixodoidea). Pp. 167-220 in Ectoparasites of Panama (R. L. Wenzel and V. J. Tipton, eds.). Field Museum of Natural History, Chicago, Illinois.

57
Fariña Sanchez, T. 1973. The climate of Paraguay. Pp. 33-38 in Paraguay: ecological
essays (J. R. Gorham, ed.), Academy of Arts and Sciences of the Americas, Miami, Florida.
Ferris, G. F., and R. L. Usinger. 1939. The family Polyctenidae (Hemiptera:
Heteroptera). Microentomology 4:1-50. Ferris, G. F., and R. L. Usinger. 1945. Notes and descriptions of American Polyctenidae
(Hemiptera). Pan Pacific Entomologist 21:121-124. Findley, J. S. 1993. Bats: a community perspective. Cambridge University Press,
Cambridge, Great Britain. Fleming, T. H. 1988. The short-tailed fruit bat: a study in plant-animal interactions. The
University of Chicago Press, Chicago, Illinois. Fleming, T. H., and P. Eby. 2003. Ecology of bat migration. Pp. 156-208 in Bat
ecology (T. H. Kunz and M. B. Fenton, eds). University of Chicago Press, Chicago, Illinois.
Freeland, W. J. 1983. Parasites and the coexistence of animal host species. The
American Naturalist 121:223-236. Fritz, G. N. 1983. Biology and ecology of bat flies (Diptera: Streblidae) on bats in the
genus Carollia. Journal of Medial Entomology 20:1-10. Fujita, T., T. Inada, and Y. Ishito. 1993. Density, biomass, and community structure of
demersal fishes off the Pacific coast of northeastern Japan. Journal of Oceanography 49:211-229.
Furman, D. P. 1966. The spinturnicid mites of Panama (Acarina: Spinturnicidae). Pp.
125-166 in Ectoparasites of Panama (R. L. Wenzel and V. J. Tipton, eds.). Field Museum of Natural History, Chicago, Illinois.
Gannon, M. R., and M. R. Willig. 1995. Ecology of ectoparasites from tropical bats.
Environmental Entomology 25:1495-1503. Gannon, M.R., and M.R. Willig. 1997. The effect of lunar illumination on movement
and activity of the red fig-eating bat (Stenoderma rufum). Biotropica 29:525-529. Gaston, K. 1996. Species-range-size distributions: patterns, mechanisms and
implications. Trends in Ecology and Evolution 11:197-200.

58
Gettinger, D., and K. A. Ernest. 1995. Small-mammal community structure and the specificity of ectoparasite associations in central Brazil. Revista Brasiliera de Biologia 55:331-341.
Gettinger, D., and R. Gribel. 1989. Spinturnicid mites (Gamasida: Spinturnicidae)
associated with bats in central Brasil. Journal of Medical Entomology 26:491-493.
Gill, Frank B. 1990. Ornithology. W. H. Freeman and Company, New York, New
York. Gorham, J. R. 1973. The Paraguayan Chaco and its rainfall. Pp. 39-60 in Paraguay:
ecological essays (J. R. Gorham, ed.), Academy of Arts and Sciences of the Americas, Miami, Florida.
Gorresen, P. M., and M. R. Willig. 2004. Landscape responses of bats to habitat
fragmentation in Atlantic forest of Paraguay. Journal of Mammalogy 85:688-697. Graciolli, G., and C. W. Dick. 2004. A new species of Metelasmus (Diptera: Streblidae:
Streblinae) from southern South America. Zootaxa 509:1-8. Guerrero, R. 1993. Catálogo de los Streblidae (Diptera: Pupipara) parásitos de
murciélagos (Mammalia: Chiroptera) del Nuevo Mundo. I. Clave para los géneros y Nycterophiliinae. Acta Biológica Venezuelica 14 (4):61-75.
Guerrero, R. 1994a. Catálogo de los Streblidae (Diptera: Pupipara) parásitos de
murciélagos (Mammalia: Chiroptera) del Nuevo Mundo. II. Los grupos: pallidus, caecus, major, uniformis y longipes del género Trichobius Gervais, 1844. Acta Biológica Venezuelica 15 (1):1-18.
Guerrero, R. 1994b. Catálogo de los Streblidae (Diptera: Pupipara) parásitos de
murciélagos (Mammalia: Chiroptera) del Nuevo Mundo. IV. Trichobiinae con alas desarrolladas. Boletín de Entomología Venezolana 9 (2):161-192.
Guerrero, R. 1995a. Catálogo de los Streblidae (Diptera: Pupipara) parásitos de
murciélagos (Mammalia: Chiroptera) del Nuevo Mundo. III. Los grupos: dugesii, dunni, y phyllostomae del género Trichobius Gervais, 1844. Acta Biológica Venezuelica 15 (3/4):1-27.
Guerrero, R. 1995b. Catálogo de los Streblidae (Diptera: Pupipara) parásitos de
murciélagos (Mammalia: Chiroptera) del Nuevo Mundo. V. Trichobiinae con alas reducidas o ausentes y miscelaneos. Boletín de Entomología Venezolana 10 (2):135-160.

59
Guerrero, R. 1996. Catálogo de los Streblidae (Diptera: Pupipara) parásitos de murciélagos (Mammalia: Chiroptera) del Nuevo Mundo. VI. Streblinae. Acta Biológica Venezuelica 16 (2):1-26.
Guerrero, R. 1997. Catálogo de los Streblidae (Diptera: Pupipara) parásitos de
murciélagos (Mammalia: Chiroptera) del Nuevo Mundo. VII. Lista de espécies, hospedadores y paises. Acta Biológica Venezuelica 17 (1):9-24.
Guimarães, L. R. 1966. Nycteribiid bat flies from Panama (Diptera: Nycteribiidae). Pp.
393-404 in Ectoparasites of Panama (R. L. Wenzel and V. J. Tipton, eds.). Field Museum of Natural History, Chicago, Illinois.
Guimarães, L. R. 1972. Venezuelan nycteribiid batflies (Diptera: Nycteribiidae).
Brigham Young University Science Bulletin, Biological Series 17 (1):1-11. Hagan, H. R. 1951. Embryology of the viviparous insects. Ronald Press, New York,
New York. Handley, C. O., Jr. 1987. New species of mammals from northern South America: fruit-
eating bats, genus Artibeus Leach. Pp. 163-172 in Studies in neotropical mammalogy: essays in honor of Philip Hershkovitz (B. D. Patterson and R. M. Timm, eds.). Fieldiana, Zoology (New Series) 39:1-506.
Hayes, F. E. 1995. Status, distribution and biogeography of the birds of Paraguay.
Monographs in Field Ornithology No. 1, 1-230. Herrin, C. S., and V. J. Tipton. 1975. Spinturnicid mites of Venezuela. Brigham Young
University Science Bulletin, Biological Series 20 (2):1-72. Hill, J. E., and J. D. Smith. 1984. Bats: a natural history. Heffers Printers Ltd.,
Cambridge, Great Britain. Hoogstraal, H. 1985. Argasid and nuttalliellid ticks as parasites and vectors. Advances
in Parasitology 24:135-238. Hoogstraal, H., and A. Aeschlimann. 1982. Tick-host specificity. Bulletin de la Société
Entomologique Suisse 55:5-32. Hoskins, J. D. 1991. Ixodid and argasid ticks: keys to their identification. Veterinary
Clinics of North America: Small Animal Practice 21:185-196. Hueck, K. 1972. As florestas da América do Sul: ecologia, composição e importância
econômica. Editôra da Universidade de Brasília, Editôra Polígono S. A., São Paulo, Brazil.

60
Humphrey, S. R., and J. B. Cope. 1976. Population ecology of the little brown bat,
Myotis lucifugus, in Indiana and North-central Kentucky. The American Society of Mammalogists, Special Publications 4:1-81.
Huston, Michael, A. 1994. Biological diversity: the coexistence of species on changing
landscapes. Cambridge University Press, Cambridge, New York. Jones, E. K, C. M. Clifford, J. E. Keirans, and G. M. Kohls. 1972. Ticks of Venezuela
(Acarina: Ixodoidea) with a key to the species of Amblyomma in the Western Hemisphere. Brigham Young University Science Bulletin, Biological Series 17(4):1-40.
Jones, K. E., A. Purvis, A. MacLarnon, O. R. P. Bininda-Emonds, and N. B. Simmons.
2002. A phylogenetic supertree of the bats (Mammalia: Chiroptera). Biological Review 77:223-259.
Kim, K. C. 1985. Evolutionary relationships of parasitic arthropods and mammals. Pp.
3-82 in Coevolution of parasitic arthropods and mammals (K. C. Kim, ed.). John Wiley & Sons, New York, New York.
Koopman, K. F. 1982. Biogeography of the bats of South America. Pp. 273-302 in
Mammalian Biology in South America (M. A. Mares and H. H. Genoways, eds.). Special Publications of Pymatuning Laboratory of Ecology, University of Pittsburgh, Pittsburgh 6:1-539.
Koopman, K. F. 1993. Order Chiroptera. Pp. 137-241 in Mammal species of the world:
a taxonomic and geographic reference (D. E. Wilson and D. M. Reeder, eds.). Smithsonian Institution Press, Washington, D. C.
Krantz, G. W. 1970. A manual of acarology, First edition. Oklahoma State University.
Book Stores, Inc., Corvalis, Oregon. Kunz, T. H. 1976. Observations on the winter ecology of the bat fly Trichobius
corynorhini Chockerell (Diptera: Streblidae). Journal of Medical Entomology 12:631-636
Kunz, T. H. 1982. Roosting ecology. Pp. 1-56 in Ecology of bats. (T. H. Kunz, ed.).
Plenum Press, New York, New York. Kunz, T. H., and L. F. Lumsden. 2003. Ecology of cavity and foliage roosting bats. Pp.
3-89 in Bat ecology (T. H. Kunz and M. B. Fenton, eds). University of Chicago Press, Chicago, Illinois.

61
Loomis, R. B., and W. J. Wrenn. 1984. Systematics of the pest chigger genus Eutrombicula (Acari: Trombiculidae). Pp. 152-165 in Acarology VI (D. A. Griffiths and C. E. Bowman, eds.). Chichester: E. Horwood, Halsted Press, New York, New York.
López-González, C. 1998. Systematics and Zoogeography of the Bats of Paraguay.
Ph.D. dissertation, Texas Tech University, Lubbock, Texas. López-González, C. 2005. Los murciélagos de Paraguay. Publicaciones Comité
Español MAB y Red Ibero MAB (in press). Loye, J. E., and S. P. Carrol. 1991. Nest ectoparasite abundance and cliff swallow
colony site selection, nestling development, and departure time. Pp. 222-241 in Bird-parasite interactions: ecology, evolution, and behaviour (J. E. Loye and M Zuk, eds.). Oxford University Press, Oxford, Great Britain.
Loye, J. E., and M. Zuk. 1991. Bird-parasite interactions: ecology, evolution, and
behaviour. Oxford University Press, Oxford, Great Britain. Lukoschus, F. S., G. Scheperboer, E. Méndez, and A. Fain. 1981. Eudusbabekia
(Synoecomyobia) artibei, new subgenus, new species (Acarina: Prostigmata: Myobiidae), infesting the phyllostomids bat Artibeus phaeotis in Panama. Pacific Insects 23:478-486.
McDaniel, B. 1970. The labidocarpid batmites of Nicaragua (Listrophoroidea :
Labidocarpidae). Acarologia 12:803-823. McDaniel, B. 1973. Labidocarpid bat-mites of Venezuela (Listophoroidea:
Labidocarpidae). Brigham Young University Science Bulletin, Biological Series 17(2):15-32.
Machado-Allison, C. E. 1964. Notas sobre Mesostigmata Neotropicales. II. Cuatro
nuevas especies de Periglischrus Kolenati, 1857. (Acarina, Spinturnicidae). Revista de la Sociedad Mexicana de Historia Natural 25:193-207.
Machado-Allison, C. E. 1965. Las espécies Venezolanas del género Periglischrus
Kolenati 1857. Acta Biología Venezuelica 4:259-348. Machado-Allison, C. E. 1967. The systematic position of the bats Desmodus and
Chilonycteris, based on host-parasite relationships (Mammalia; Chiroptera). Proceedings of the Biological Society of Washington 80:223-226.
Maeda, K. 1982. Studies on the classification of Miniopterus in Eurasia, Australia and
Melanesia. Mammalian Science Supplement 1: 1-176.

62
Magurran, A. E. 1988. Ecological diversity and its measurement. Princeton University
Press, Princeton, New Jersey. Mappes, T., J. Mappes, and J. Kotiaho. 1994. Ectoparasites, nest site choice and
breeding success in the pied flycatcher. Oecologia 98:147-149. Margolis, L., R. Anderson, and J. Holmes. 1982. The use of ecological terms in
parasitology. (Report of an ad-hoc committee of the American Society of Parasitologists). Journal of Parasitology 68:131-133.
Marshall, A. G. 1970. The life cycle of Basilia hispida Theodor 1967 (Diptera:
Nycteribiidae) in Malaysia. Parasitology 61:1-18. Marshall, A. G. 1971. The ecology of Basilia hispida (Diptera: Nycteribiidae) in
Malaysia. Journal of Animal Ecology 40:141-154. Marshall, A. G. 1976. Host-specificity amongst arthropods ectoparasitic upon mammals
and birds in the New Hebrides. Ecological Entomology 1:189-199. Marshall, A. G. 1982a. Ecology of insects ectoparasitic on bats. Pp. 369-401 in
Ecology of bats (T. H. Kunz, ed.). Plenum Press, New York, New York. Marshall, A. G. 1982b. The ecology of Eoctenes spasmae (Hemiptera: Polyctenidae) in
Malaysia. Biotropica 14:50-55. Matheson, R. 1935. Three new species of ticks, Ornithodorus (Acarina: Ixodoidea).
The Journal of Parasitology 21:347-353. Matheson, R. 1941. A new species of tick, Ornithodoros anduzei (Ixodoidea, Argasidae)
from bat caves in Venezuela. Boletín de Entomología Venezolana 1:3-5. May, R. M. 1975. Patterns of species abundance and diversity. Pp. 81-120 in Ecolgy
and evolution of communities (M. L. Cody and J. M. Diamond, eds.). Belknap Press of Harvard University, Cambridge, Massachusetts.
Møller, A. P. 1991a. Parasites, sexual ornaments, and mate choice in the barn swallow.
Pp. 328-343 in Bird-parasite interactions: ecology, evolution, and behaviour (J. E. Loye and M Zuk, eds.). Oxford University Press, Oxford, Great Britain.
Møller, A. P. 1991b. Parasite load reduces song output in a passerine bird. Animal
Behaviour 41:723-730.

63
Mouillet, D., M. George-Nascimento, and R. Poulin. 2003. How parasites divide resources: a test of the niche apportionment hypothesis. Journal of Animal Ecology 72:757-764.
Myers, P. 1982. Origins and affinities of the mammal fauna of Paraguay. Pp. 85-93 in
Mammalian biology in South America (M. A. Mares and H. H. Genoways, eds.). Special Publications, Pymatuning Laboratory of Ecology 6:1-539.
Oliver, I., and A. J. Beattie. 1996. Invertebrate morphospecies as surrogates for species:
a case study. Conservation Biology 10:99-109. Oliver, J. H. Jr. 1989. Biology and systematics of ticks (Acari: Ixodida). Annual
Review of Ecology and Systematics 20:397-430. Overal, W. L. 1980. Host-relations of the batfly Megistopoda aranea (Diptera:
Streblidae) in Panama. University of Kansas Science Bulletin 51:1-20. Overal, W. L., and L. R. Wingate. 1976. The biology of the batbug Stricticimex
antennatus (Hemiptera: Cimicidae) in South Africa. Annals of the National Museum 22:821-828.
Paine, R. T. 1977. Controlled manipulations in the marine intertidal zone, and their
contributions to ecological theory. Special Publications of the Academy of Natural Sciences, Philadelphia 12:245-270.
Pianka, E. R. 1970. On r- and k-selection. The American Naturalist 104:592-597. Pielou, E. C. 1969. An introduction to mathematical ecology. John Wiley & Sons, New
York, New York. Pielou, E. C. 1975. Ecological Diversity. John Wiley & Sons, New York, New York. Pik, A. J., I. Oliver, and A. J. Beattie. 1999. Taxonomic sufficiency in ecological studies
of terrestrial invertebrates. Australian Journal of Ecology 24:555-562. Pinichpongse, S. 1963a. A review of the Chirodiscinae with descriptions of new taxa
(Acarina : Listrophoridae) (1st series). Acarologia 5:81-91. Pinichpongse, S. 1963b. A review of the Chirodiscinae with descriptions of new taxa
(Acarina : Listrophoridae) (Part Two). Acarologia 5:266-278. Pinichpongse, S. 1963c. A review of the Chirodiscinae with descriptions of new taxa
(Acarina : Listrophoridae) (Part three). Acarologia 5:397-404.

64
Pinichpongse, S. 1963d. A review of the Chirodiscinae with descriptions of new taxa (Acarina : Listrophoridae) (Part four). Acarologia 5:620-627.
Poulin, R. 1991. Group-living and infestation by ectoparasites in passerines. The
Condor 93:418-423. Pruett-Jones, M., and S. Pruett-Jones. 1991. Analysis and ecological correlates of tick
burdens in a New Guinea avifauna. Pp. 154-176 in Bird-parasite interactions: ecology, evolution, and behaviour (J. E. Loye and M. Zuk, eds.). Oxford University Press, Oxford, Great Britain.
Radovsky, F. J. 1966. Revision of the macronyssid and laelapid mites of bats: outline of
classification with descriptions of new genera and new type species. Journal of Medical Entomology 3:93-99.
Radovsky, F. J. 1967. The Macronyssidae and Laelapidae (Acarina: Mesostigmata)
parasitic on bats. University of California Publications in Entomology 46:1-288. Redford, K. H., and J. F. Eisenberg. 1992. Mammals of the Neotropics: the southern
cone. Volume 2, Chile, Argentina, Uruguay, Paraguay. The University of Chicago Press, Chicago, Illinois.
Reed, J. T., and J. M. Brennan. 1975. The subfamily Leeuwenhoekinae in the
Neotropics (Acarina: Trombiculidae). Brigham Young University Science Bulletin, Biological Series 20(1):1-42.
Reid, F. A. 1997. A field guide to the mammals of Central America and southeast
Mexico. Oxford University Press, New York, New York. Ronderos, R. A. 1959. Polycténidae americanos. I. (Hemiptera). Actas y Trabajos del
Primer Congreso Sudamericano de Zoologia 3:173-180. Ronderos, R. A. 1962. Polycténidae americanos. II. (Hemiptera). Acta Zoologica
Lilloana 18:259-262. Ross, A. 1961. Biological studies on bat ectoparasites of the genus Trichobius (Diptera:
Streblidae) in North America, North of Mexico. The Wasmann Journal of Biology 19:229-246.
Rudnick, A. 1960. A revision of the mites of the family Spinturnicidae (Acarina).
University of California Publications in Entomology 17: 157-283. Santos Alves, M. A. 1997. Effects of ectoparasites on the sand martin Riparia riparia
nestlings. Ibis 139:494-496.

65
Saunders, R. C. 1975. Venezuelan Macronyssidae (Acarina: Mesostigmata). Brigham
Young University Science Bulletin, Biological Series 20 (2):75-90. Schuh, R. T., and J. A. Slater. 1995. True bugs of the world (Hemiptera: Heteroptera):
Classification and Natural History. Cornell University Press, Ithaca, New York. Sheeler-Gordon, L. L., and R. D. Owen. 1999. Host tracking or resource tracking? The
case of Periglischrus wing mites (Acarina: Spinturnicidae) of leaf-nosed bats (Chiroptera: Phyllostomidae) from Michoacan, Mexico. Acta Zoológica Mexicana (nueva serie) 76:85-102.
Simmons, N. B., and R. S. Voss. 1998. The mammals of Paracou, French Guiana: a
Neotropical lowland rainforest fauna. Part 1. Bats. Bulletin of the American Museum of Natural History 237:1-219.
Southwood, T. R. E. 1978. Ecological Methods. Chapman and Hall, London, Great
Britain. Spurrier, M. F., M. S. Boyce, and B. F. J. Manly. 1991. Effects of parasites on mate
choice by captive sage grouse. Pp. 389-399 in Bird-parasite interactions: ecology, evolution, and behaviour (J. E. Loye and M Zuk, eds.). Oxford University Press, Oxford, Great Britain.
Stevens, R. D., and M. R. Willig. 2000. Community structure, abundance, and
morphology. Oikos 88:48-56. Tokeshi, M. 1986. Resource utilization, overlap and temporal community dynamics: a
null model analysis of an epiphytic chironomid community. Journal of Animal Ecology 55:491-506.
Tokeshi, M. 1990. Niche apportionment or random assortment: species abundance
patterns revisited. Journal of Animal Ecology 59:1129-1146. Uchikawa, K. 1984. Revision of the genus Calcarmyobia Radford (Trombidiformes:
Myobiidae) and application of the mites to the systematics of their hosts (Chiroptera). Pp. 196-201 in Acarology VI (D. A. Griffiths and C. E. Bowman, eds.). Chichester: E. Horwood, Halsted Press, New York, New York.
Uchikawa, K. 1986. Myobiid mites of the genus Pteropimyobia Fain (Trombidiformes,
Myobiidae) and information on host taxonomy deduced from them. Journal of Parasitology 72:249-256.

66
Uchikawa, K. 1987. Myobiid mites (Trombidiformes: Myobiidae) associated with vampire bats (Chiroptera: Phyllostomatidae) and information on host taxonomy deduced from them. Journal of Parasitology 73:640-645.
Uchikawa, K. 1988. Myobiidae (Acarina, Trombidiformes) associated with minor
families of Chiroptera (Mammalia) and a discussion of phylogeny of chiropteran myobiid genera. Journal of Parasitology 74:159-176.
Uchikawa, K. and A. Baker. 1993. A new classification for the subgenera of the genus
Acanthophthirius Perkins, with descriptions of twelve new taxa (Acarina, Trombidiformes, Myobiidae). Systematic Parasitology 25:81-108.
Uchikawa, K., and M. Harada. 1981. Evaluation of bat-infesting Myobiidae (Acarina,
Trombidiformes) as indicators in taxonomy and phylogeny of host bats (Chiroptera). Zoological Magazine 90:351-361.
Ueshima N. 1972. New World Polyctenidae (Hemiptera), with special reference to
Venezuelan species. Brigham Young University Science Bulletin, Biological Series 17 (1):13-21.
Universidad Nacional de Asuncion. 1994. Uso de la tierra y deforestación en la region
oriental del Paraguay periodo 1984-1991. Vol. 1. Facultad de Ingenieria Agronómica, Carrera de Ingenieria Forestal, San Lorenzo, Paraguay.
Unruh, R. G. 1973. Colonization and agriculture in the Paraguayan Chaco. Pp. 105-108
in Paraguay: ecological essays (J. R. Gorham, ed.). Academy of Arts and Sciences of the Americas, Miami, Florida.
Webb, J. P., and R. B. Loomis. 1977. Ectoparasites. Pp. 57-119 in Biology of bats of
the New World family Phyllostomatidae. Part II (R. J. Baker, J. K. Jones, Jr., D. C. Carter, eds.). Special Publications, The Museum, Texas Tech University 13:1-364.
Wenzel, R. L. 1976. The streblid batflies of Venezuela (Diptera: Streblidae). Brigham
Young University Science Bulletin, Biological Series 20 (4):1-177. Wenzel, R. L., and V. J. Tipton, editors. 1966a. Ectoparasites of Panama. Field
Museum of Natural History, Chicago, Illinois. Wenzel, R. L., and V. J. Tipton. 1966b. Some relationships between mammal hosts and
their ectoparasites. Pp. 677-723 in Ectoparasites of Panama (R. L. Wenzel and V. J. Tipton, eds.). Field Museum of Natural History, Chicago, Illinois.

67
Wenzel, R. L., V. J. Tipton, and A. Kiewlicz. 1966. The streblid batflies of Panama (Diptera: Streblidae). Pp. 405-675 in Ectoparasites of Panama (R. L. Wenzel and V. J. Tipton, eds.). Field Museum of Natural History, Chicago, Illinois.
Whitaker, J. O., Jr, and D. B. Abrell. 1987. Notes on some ectoparasites from mammals
of Paraguay. Entomological News 98:198-204. Willig, M.R. 2002a. Exploring biodiversity in time and space: profitable directions for
mammalogy in the 21st century. Mastozoologia Neotropical 8:107-109. Willig, M.R. 2002b. Challenges to understanding dynamics of biodiversity in time and
space. Paleobiology 29:30-33. Willig, M. R., D. M. Kaufman, and R. D. Stevens. 2003. Latitudinal gradients of
biodiversity: pattern, process, scale, and synthesis. Annual Review of Ecology, Evolution and Systematics 34: 273-309.
Willig, M. R., S. J. Presley, R. D. Owen, and C. López-González. 2000. Composition
and structure of bat assemblages in Paraguay: a subtropical – temperate interface. Journal of Mammalogy 81:386-401.
Wrenn, W. J., and R. B. Loomis. 1984. Host selectivity in the Genus Eutromicula
(Acari: Trombicula). Pp. 160-165 in Acarology VI: volume 1 (D. A. Griffiths and C. E. Bowman, eds.). Halsted Press, New York, New York.
Zak, J.C., M.R. Willig, D.L. Moorhead, and H.G. Wildman. 1994. Functional diversity
of microbial communities: a quantitative approach. Soil Biology and Biochemistry 26:1101-1108.

Biome Topography Vegetation Precipitation Inundation HumidityWest
Matogrosense (MG) Flat Forest Medium Seasonal Sub-humid
Alto Chaco (AC) Flat Forest Low None Semi-arid
Bajo Chaco (BC) Flat Palm Medium Seasonal Semi-humid
East Campos Cerrados (CC) Hills Forest High None Semi-humid
Central Paraguay (CP) Hills Forest High None Humid
Alto Paraná (AP) Hills Forest Very high None Humid
Ñeembucú (NE) Hills Grassland High Seasonal Semi-humid
Table 2.1. Ecological characteristics of the seven biomes (Figure 2.1) that occur in Paraguay (Hayes 1995); east and west designate locations of biomes with respect to the Río Paraguay.

Taxon Feeding preferenceFamily Emballonuridae
Pteropteryx macrotis Insectivore
Family NoctilionidaeNoctilio albiventris InsectivoreNoctilio leporinus Piscivore
Family PhyllostomidaeAnoura caudifer NectarivoreArtibeus fimbriatus FrugivoreArtibeus jamaicensis FrugivoreArtibeus lituratus FrugivoreCarollia perspicillata FrugivoreChiroderma doriae FrugivoreChrotopterus auritus CarnivoreDesmodus rotundus SanguinivoreDiaemus youngi SanguinivoreGlossophaga soricina NectarivoreMacrophyllum macrophullum InsectivorePhyllostomus discolor InsectivorePhyllostomus hastatus InsectivorePlatyrrhinus lineatus FrugivorePygoderma bilabiatum FrugivoreSturnira lilium FrugivoreTonatia bidens InsectivoreTonatia brasiliense InsectivoreTonatia sylvicola InsectivoreVampyressa pusilla Frugivore
Family NatalidaeNatalus stramineus Insectivore
Table 2.2. Bat species known from Paraguay (López-González 1998, Willig et al. 2000) and their primary feeding preferences (Eisenberg 1989, Redford and Eisenberg 1992, Anderson 1997).

Table 2.2. ContinuedTaxon Feeding preferenceFamily Vespertilionidae
Eptesicus brasiliensis InsectivoreEptesicus diminutus InsectivoreEptesicus furinalis InsectivoreHistiotus macrotus InsectivoreHistiotus velatus InsectivoreLasiurus blossevillii InsectivoreLasiurus cinereus InsectivoreLasiurus ega InsectivoreMyotis albescens InsectivoreMyotis nigricans InsectivoreMyotis riparius InsectivoreMyotis ruber InsectivoreMyotis simus Insectivore
Family MolossidaeEumops auripendulus InsectivoreEumops bonariensis InsectivoreEumops dabbenei InsectivoreEumops glaucinus InsectivoreEumops patagonicus InsectivoreEumops perotis InsectivoreMolossops abrasus InsectivoreMolossops planirostris InsectivoreMolossops temminckii InsectivoreMolossus ater InsectivoreMolossus currentium InsectivoreMolossus molossus InsectivoreNyctinomops laticaudatus InsectivoreNyctinomops macrotis InsectivorePromops centralis InsectivorePromops nasutus InsectivoreTadarida brasiliensis Insectivore

Insect family Geographic distribution Host familyArixeniidae Oriental Molossidae
Cimicidae Cosmopolitan Emballonuridae*Molossidae*
Noctilionidae*Pteropodidae
RhinolophidaeVespertilionidae*
Polyctenidae Cosmopolitan Emballonuridae*Megadermatidae
Molossidae*Nycteridae*
Rhinolophidae
Nycteribiidae Cosmopolitan Emballonuridae*Phyllostomidae*
PteropodidaeRhinolophidaeThyropteridae
Vespertilionidae*
Streblidae Cosmopolitan Emballonuridae*Fruipteridae*
MegadermatidaeMolossidae*
Mormoopidae*Natalidae*
Noctilionidae*Nycteridae*
Phyllostomidae*
Table 2.3. The geographical distribution and host families of insects ectoparasitic on bats (Marshall, 1982a ). Asterisks indicate New World Associations.

Insect family Geographic distribution Host familyIschnopsyllidae Cosmopolitan Emballonuridae*
MegadermatidaeMolossidae*
Noctilionidae*Pteropodidae
RhinolophidaeRhinopomatidaeVespertilionidae*
Table 2.3. Continued

Taxon BiomesWest East
Mato- Bajo Campos Central Alto Ñeembucúgrosense Chaco Chaco Cerrados Paraguay Paraná
Family Noctilionidae Noctilio albiventris 30.37 9.21 0.34 11.44 Noctilio leporinus 1.40 0.84 0.85
Family Phyllostomidae Artibeus fimbriatus 0.85 2.61 10.22 3.39 Artibeus jamaicensis 6.47 1.05 0.34 Artibeus lituratus 13.29 35.54 34.17 5.08 Carollia perspicillata 2.56 3.48 9.05 Chiroderma doriae 0.52 Chrotopterus auritus 0.52 Desmodus rotundus 4.44 0.73 1.02 4.88 1.27 Diaemus youngi 0.37 4.18 Glossophaga soricina 11.93 4.88 2.54 Platyrrhinus lineatus 0.84 14.48 2.96 0.17 1.69 Pygoderma bilabiatum 1.36 6.79 2.01 0.42 Sturnira lilium 0.06 21.47 29.62 36.18 18.22 Tonatia bidens 0.18 Tonatia brasiliense 0.42
Alto
Table 2.4. Species composition of bat assemblages in the seven biomes of Paraguay (Willig et al. 2000). Proportional abundances (as percentages) of each species within each biome are provided based on the total number of captured specimens; nomenclature generally follows Koopman (1993; for exceptions, see text).

Table 2.4. ContinuedTaxon Biomes
West EastMato- Bajo Campos Central Alto Ñeembucú
grosense Chaco Chaco Cerrados Paraguay ParanáFamily Natalidae Natalus stramineus 0.17
Family Vespertilionidae Eptesicus brasiliensis 0.37 1.02 Eptesicus diminutus 0.12 Eptesicus furinalis 1.16 4.60 3.92 1.05 0.17 5.08 Histiotus macrotus 0.37 Lasiurus blossevillii 0.12 0.84 0.51 0.52 0.17 0.42 Lasiurus cinereus 0.34 0.42 Lasiurus ega 1.48 2.01 12.55 0.34 2.97 Myotis albescens 21.48 1.22 12.97 2.97 Myotis nigricans 7.41 2.20 21.34 1.70 1.05 0.34 5.08 Myotis riparius 0.85 0.70 0.17 0.42 Myotis simus 0.42
Family Molossidae Eumops auripendulus 0.06 0.17 Eumops bonariensis 0.84 0.17 0.34 Eumops dabbenei 0.18 0.42 Eumops glaucinus 1.83 1.70 2.85 Eumops patagonicus 9.26 60.12 9.21 3.58 0.35 1.68 15.25 Eumops perotis 0.12 Molossops abrasus 0.85 0.17 3.39
Alto

Table 2.4. ContinuedTaxon Biomes
West EastMato- Bajo Campos Central Alto Ñeembucú
grosense Chaco Chaco Cerrados Paraguay Paraná Molossops planirostris 0.30 0.34 2.12 Molossops temminckii 0.74 7.87 4.18 2.73 1.74 1.17 1.69 Molossus ater 10.74 1.59 7.11 0.17 1.05 14.83 Molossus currentium 13.70 Molossus molossus 14.57 10.88 7.16 0.52 0.17 Nyctinomops laticaudatus 2.87 Promops centralis 0.06 0.17 0.17 0.17 0.42 Promops nasutus 0.49
Number of individuals 270 1640 239 587 574 597 236
Alto

Mean Total Streblidae Polyctenidae Nycteribiidae Spinturnicidae MacronyssidNoctilionidae 96 0.98 44 6 6
Noctilio albiventris 68 2.50 11 3 6 Noctilio leporinus 28 2.36 8 3 2
Phyllostomidae 1220 1.43 59 20 7 15Phyllostominae
Chrotopterus auritus 3 1.67 3 1 1 Tonatia bidens 3 2.33 3 1 1 1 Tonatia brasiliense 1 2.00 2 1 1
Glossophaginae Glossophaga soricina 54 0.48 10 4 2 2
Carollinae Carollia perspicillata 75 0.99 14 3 3 6
Desmodontinae Desmodus rotundus 51 1.04 8 2 2 3 Diaemus youngi 11 1.91 5 2 3
Stenodermatinae Artibeus fimbriatus 79 2.27 12 6 2 2 Artibeus jamaicensis 42 2.00 12 3 1 2 Artibeus lituratus 351 1.19 17 6 2 5 Chiroderma doriae 3 1.00 1 1 Platyrrhinus lineatus 90 1.18 14 4 3 7 Pygoderma bilabiatum 53 0.23 7 2 4
Sturnirinae Sturnira lilium 404 1.87 23 6 2 6
Natalidae 1 2.00 2 1 1 Natalus stramineus 1 2.00 2 1 1
Ectoparasite richness Number of species of each of common ectoparasite family
Table 2.5. Summary of ectoparasite assemblage composition for each host family and species.
Taxon
Number of hosts
inspected

Mean Total Streblidae Polyctenidae Nycteribiidae Spinturnicidae Macronyssid
Family Vespertilionidae 401 1.15 33 7 6 13 Eptesicus brasiliensis 12 1.17 5 2 2 Eptesicus diminutus 2 2.00 3 1 1 Eptesicus furinalis 69 1.33 16 5 3 6 Histiotus macrotus 6 1.00 3 1 2 Lasiurus blossevillii 11 0.55 3 3 Lasiurus cinereus 2 0.50 1 1 Lasiurus ega 72 0.68 5 1 Myotis albescens 87 1.70 15 5 2 5 Myotis nigricans 128 0.99 16 3 2 9 Myotis riparius 11 1.27 6 2 1 3 Myotis simus 1 2.00 2 1 1
Family Molossidae 1192 0.98 44 2 10 1 3 12 Eumops auripendulus 2 0.00 Eumops bonariensis 5 0.60 3 2 Eumops dabbenei 4 2.00 5 1 2 Eumops glaucinus 56 1.16 8 1 1 1 2 Eumops patagonicus 526 0.81 17 2 1 2 4 Eumops perotis 3 1.00 2 1 1 Molossops abrasus 14 1.14 5 1 3 Molossops planirostris 12 0.67 4 1 2 Molossops temminckii 160 0.88 15 1 1 1 6 Molossus ater 100 1.30 16 1 2 1 5 Molossus currentium 27 1.04 4 1 2 Molossus molossus 228 1.26 15 1 2 1 5 Nyctinomops laticaudatus 42 0.95 9 1 2 Promops centralis 4 0.75 2 1 1 Promops nasutus 8 1.00 1 1
Table 2.5. ContinuedNumber of hosts
inspected
Ectoparasite richness Number of species of each of common ectoparasite family
Taxon

Ectoparasite Taxon Incidence (%) SIMean SD Mean SD
Noctiliostrebla maai 66.18 3.13 3.60 4.73 3.47 1.00Paradyschiria parvula 89.71 6.38 8.07 7.11 8.21 1.00Xenotrichobius noctilionis 8.82 0.09 0.29 1.00 0.00 1.00Chiroptonyssus haematophagus 1.47 0.03 0.24 2.00 -- 0.00Chiroptonyssus robustipes 8.82 0.19 0.72 2.17 1.33 0.02Macronyssus crosbyi 1.47 0.01 0.12 1.00 -- 0.00Steatonyssus sp. 1 1.47 0.01 0.12 1.00 -- 0.09Steatonyssus sp. 2 2.94 0.03 0.17 1.00 0.00 0.08Unknown macronyssid 1.47 0.01 0.12 1.00 -- 0.01Ornithodoros hasei 61.76 11.35 20.19 18.38 23.11 0.65Lawrenceocarpus sp. 5.88 0.22 0.91 3.75 0.96 0.79
Prevalence Density
Table 2.6. Incidence, prevalence, density, and specificity index (SI) of ectoparasites of Noctilio albiventris (n = 68). SD = standard deviation.

Ectoparasite taxon Incidence (%) SIMean SD Mean SD
Noctiliostrebla aitkeni 46.43 2.82 4.89 6.08 5.69 0.99Noctiliostrebla dubia 25.00 0.57 1.20 2.29 1.38 1.00Paradyschiria fusca 75.00 8.11 10.84 10.81 11.31 1.00Chiroptonyssus haematophagus 10.71 0.57 2.30 5.33 5.77 0.00Steatonyssus sp. 1 10.71 0.36 1.25 3.33 2.52 0.91Ornithodoros hasei 57.14 6.14 10.78 10.75 12.51 0.14Parkosa tadarida 7.14 1.14 4.23 16.00 2.83 0.03Unknown mites 3.57 0.04 0.19 1.00 -- 0.08
Prevalence Density
Table 2.7. Incidence, prevalence, density, and specificity index (SI) of ectoparasites of Noctilio leporinus (n = 28). SD = standard deviation.

Ectoparasite taxon Incidence (%) SIMean SD Mean SD
Strebla chrotopteri 66.67 5.00 7.00 7.50 7.78 1.00Unknown macronyssid 33.33 22.33 38.68 67.00 -- 0.85Trombicula sp. 1 66.67 23.00 38.12 34.50 45.96 1.00
Prevalence Density
Table 2.8. Incidence, prevalence, density, and specificity index (SI) of ectoparasites of Chrotopterus auritus (n = 3). SD = standard deviation.

Ectoparasite taxon Incidence (%) SIMean SD Mean SD
Trichobius joblingi 66.67 1.00 1.00 1.50 0.71 0.04Periglischrus tonatii 66.67 2.00 2.00 3.00 1.41 1.00Parichoronyssus crassipes 100.00 11.00 12.29 11.00 12.29 0.70
Prevalence Density
Table 2.9. Incidence, prevalence, density, and specificity index (SI) of ectoparasites of Tonatia bidens (n = 3). SD = standard deviation.

Ectoparasite taxon Incidence (%) SIMean SD Mean SD
Mastoptera minuta 100.00 11.00 -- 11.00 -- 1.00Parichoronyssus sclerus 100.00 1.00 -- 1.00 -- 0.33
Prevalence Density
Table 2.10. Incidence, prevalence, density, and specificity index (SI) of ectoparasites of Tonatia brasiliense (n = 1). SD = standard deviation.

Ectoparasite taxon Incidence (%) SIMean SD Mean SD
Speiseria ambigua 1.85 0.02 0.14 1.00 -- 1.00Strebla guajiro 5.56 0.09 0.45 1.67 1.15 0.16Trichobius dugesii 9.26 0.15 0.49 1.60 0.55 1.00Trichobius uniformis 11.11 0.15 0.45 1.33 0.52 1.00Periglischrus caligus 11.11 0.19 0.65 1.67 1.21 1.00Periglischrus ojasti 1.85 0.02 0.14 1.00 -- 0.00Chiroptonyssus venezolanus 1.85 0.02 0.14 1.00 -- 0.00Unknown macronyssid 1.85 0.02 0.14 1.00 -- 0.01Pseudolabidocarpus sp. 1.85 0.50 3.67 27.00 -- 0.90Unknown mites 1.85 0.04 0.27 2.00 -- 0.15
Prevalence Density
Table 2.11. Incidence, prevalence, density, and specificity index (SI) of ectoparasites of Glossophaga soricina (n = 54). SD = standard deviation.

Ectoparasite taxon Incidence (%) SIMean SD Mean SD
Megistopoda proxima 2.67 0.03 0.16 1.00 0.00 0.01Strebla guajiro 22.67 0.33 0.70 1.47 0.72 0.81Trichobius joblingi 44.00 0.85 1.30 1.94 1.32 0.96Periglischrus iheringi 2.67 0.03 0.16 1.00 0.00 0.00Periglischrus ojasti 1.33 0.01 0.12 1.00 -- 0.00Unknown spinturnicid 1.33 0.01 0.12 1.00 -- 0.33Macronyssoides conciliatus 1.33 0.03 0.23 2.00 -- 0.01Macronyssoides kochi 2.67 0.04 0.26 1.50 0.71 0.00Macronyssus sp. 3 1.33 0.04 0.35 3.00 -- 0.50Parichoronyssus crassipes 5.33 0.05 0.23 1.00 0.00 0.09Parichoronyssus euthysternum 8.00 0.15 0.61 1.83 1.33 0.01Unknown macronyssid 2.67 0.03 0.16 1.00 0.00 0.03Unknown ixodid 1.33 0.01 0.12 1.00 -- 1.00Pseudolabidocarpus sp. 1.33 0.04 0.35 3.00 -- 0.10
Prevalence Density
Table 2.12. Incidence, prevalence, density, and specificity index (SI) of ectoparasites of Carollia perspicillata (n = 75). SD = standard deviation.

Ectoparasite taxon Incidence (%) SIMean SD Mean SD
Strebla weidemanni 23.53 1.49 3.91 6.33 5.99 1.00Trichobius parasiticus 31.37 4.29 9.13 13.69 11.86 1.00Periglischrus herrerai 5.88 0.06 0.24 1.00 0.00 0.60Unknown spinturnicid 1.96 0.02 0.14 1.00 -- 0.33Parichoronyssus euthysternum 1.96 0.04 0.28 2.00 -- 0.00Parichoronyssus sclerus 1.96 0.04 0.28 2.00 -- 0.67Radfordiella desmodi 35.29 2.02 4.37 5.72 5.82 0.98Ornithodoros hasei 1.96 0.02 0.14 1.00 -- 0.00
Prevalence Density
Table 2.13. Incidence, prevalence, density, and specificity index (SI) of ectoparasites of Desmodus rotundus (n = 51). SD = standard deviation.

Ectoparasite taxon Incidence (%) SIMean SD Mean SD
Strebla diaemi 72.73 3.36 3.26 4.63 2.92 0.97Trichobius diaemi 27.27 0.45 0.82 1.67 0.58 1.00Macronyssus crosbyi 9.09 0.18 0.60 2.00 -- 0.00Radfordiella desmodi 9.09 0.18 0.60 2.00 -- 0.02Radfordiella oudemansi 72.73 6.18 6.95 8.50 6.82 1.00
Prevalence Density
Table 2.14. Incidence, prevalence, density, and specificity index (SI) of ectoparasites of Diaemus youngi (n = 11). SD = standard deviation.

Ectoparasite taxon Incidence (%) SIMean SD Mean SD
Aspidoptera falcata 1.27 0.01 0.11 1.00 -- 0.00Aspidoptera phyllostomatis 18.99 0.24 0.58 1.27 0.70 0.66Megistopoda aranea 53.16 0.78 0.90 1.48 0.71 0.58Megistopoda proxima 2.53 0.03 0.16 1.00 0.00 0.01Metelasmus pseudopterus 18.99 0.22 0.47 1.13 0.35 0.81Strebla guajiro 1.27 0.01 0.11 1.00 -- 0.03Periglischrus iheringi 69.62 2.39 2.73 3.44 2.67 0.17Periglischrus ojasti 1.27 0.01 0.11 1.00 -- 0.00Macronyssoides kochi 54.43 3.35 5.56 6.16 6.29 0.37Parichoronyssus euthysternum 2.53 0.03 0.16 1.00 0.00 0.00Beamerella acutascuta 1.27 0.01 0.11 1.00 -- 0.04Eudusbabekia viguerasi 1.27 0.01 0.11 1.00 -- 0.25
Prevalence Density
Table 2.15. Incidence, prevalence, density, and specificity index (SI) of ectoparasites of Artibeus fimbriatus (n = 79). SD = standard deviation.

Ectoparasite taxon Incidence (%) SIMean SD Mean SD
Aspidoptera phyllostomatis 14.29 0.19 0.51 1.33 0.52 0.28Megistopoda aranea 38.10 0.93 1.70 2.44 2.00 0.36Metelasmus pseudopterus 4.76 0.07 0.34 1.50 0.71 0.14Periglischrus iheringi 61.90 2.07 2.59 3.35 2.56 0.08Chiroptonyssus haematophagus 2.38 0.12 0.77 5.00 -- 0.00Macronyssoides kochi 52.38 2.83 6.21 5.41 7.79 0.17Ornithodoros hasei 9.52 0.69 2.56 7.25 5.12 0.02Beamerella acutascuta 7.14 0.19 0.94 2.67 2.89 0.30Trombicula dicrura 2.38 0.10 0.62 4.00 -- 0.06Trombicula sp. 2.38 0.05 0.31 2.00 -- 0.07Parkosa maxima 2.38 0.02 0.15 1.00 -- 0.01Eudusbabekia viguerasi 2.38 0.02 0.15 1.00 -- 0.25
Prevalence Density
Table 2.16. Incidence, prevalence, density, and specificity index (SI) of ectoparasites of Artibeus jamaicensis (n = 42). SD = standard deviation.

Ectoparasite taxon Incidence (%) SIMean SD Mean SD
Aspidoptera falcata 0.28 0.00 0.05 1.00 -- 0.00Aspidoptera phyllostomatis 0.57 0.01 0.08 1.00 0.00 0.07Megistopoda aranea 0.57 0.01 0.12 1.50 0.71 0.03Megistopoda proxima 0.57 0.01 0.08 1.00 0.00 0.01Metelasmus pseudopterus 0.28 0.00 0.05 1.00 -- 0.05Paratrichobius longicrus 23.93 0.44 0.97 1.85 1.17 0.97Periglischrus iheringi 56.41 1.88 2.74 3.33 2.91 0.59Periglischrus ojasti 0.28 0.02 0.37 7.00 -- 0.01Chiroptonyssus haematophagus 0.28 0.00 0.05 1.00 -- 0.00Chiroptonyssus venezolanus 0.57 0.01 0.15 2.00 0.00 0.01Macronyssoides kochi 31.91 0.77 2.12 2.41 3.19 0.38Parichoronyssus euthysternum 1.14 0.01 0.14 1.25 0.50 0.01Steatonyssus joaquimi 0.28 0.01 0.21 4.00 -- 0.00Euschoengastia megastyrax 0.28 0.00 0.05 1.00 -- 1.00Parkosa maxima 0.57 0.01 0.19 2.50 0.71 0.03Eudusbabekia viguerasi 0.57 0.01 0.08 1.00 0.00 0.50Unknown mites 0.28 0.00 0.05 1.00 -- 0.08
Prevalence Density
Table 2.17. Incidence, prevalence, density, and specificity index (SI) of ectoparasites of Artibeus lituratus (n = 351). SD = standard deviation.

Ectoparasite taxon Incidence (%) SIMean SD Mean SD
Periglischrus iheringi 100.00 2.00 1.00 2.00 1.00 0.01
Prevelance Density
Table 2.18. Incidence, prevalence, density, and specificity index (SI) of ectoparasites of Chiroderma doriae (n = 3). SD = standard deviation.

Ectoparasite taxon Incidence (%) SIMean SD Mean SD
Aspidoptera falcata 1.11 0.01 0.11 1.00 -- 0.00Megistopoda proxima 1.11 0.01 0.11 1.00 -- 0.00Paratrichobius longicrus 3.33 0.03 0.18 1.00 0.00 0.02Trichobius angulatus 6.67 0.11 0.48 1.67 1.03 1.00Periglischrus iheringi 52.22 1.88 3.31 3.60 3.85 0.15Periglischrus ojasti 2.22 0.03 0.23 1.50 0.71 0.01Spinturnix orri 1.11 0.01 0.11 1.00 -- 0.07Chiroptonyssus haematophagus 1.11 0.02 0.21 2.00 -- 0.00Macronyssoides conciliatus 28.89 1.52 4.22 5.27 6.56 0.98Macronyssoides kochi 13.33 0.54 1.90 4.08 3.68 0.07Macronyssus crosbyi 1.11 0.02 0.21 2.00 -- 0.00Parichoronyssus crassipes 3.33 0.10 0.67 3.00 2.65 0.19Steatonyssus furmani 1.11 0.01 0.11 1.00 -- 0.00Steatonyssus joaquimi 1.11 0.07 0.63 6.00 -- 0.00
Prevalence Density
Table 2.19. Incidence, prevalence, density, and specificity index (SI) of ectoparasites of Platyrrhinus lineatus (n = 90). SD = standard deviation.

Ectoparasite taxon Incidence (%) SIMean SD Mean SD
Periglischrus iheringi 3.77 0.06 0.30 1.50 0.71 0.00Unknown spinturnicid 1.89 0.02 0.14 1.00 -- 0.33Chiroptonyssus haematophagus 3.77 0.04 0.19 1.00 0.00 0.00Macronyssoides kochi 3.77 0.04 0.19 1.00 0.00 0.00Macronyssoides sp. 1 1.89 0.02 0.14 1.00 -- 1.00Parichoronyssus euthysternum 3.77 0.04 0.19 1.00 0.00 0.00Eudusbabekia sp. 3.77 0.04 0.19 1.00 0.00 1.00
Prevalence Density
Table 2.20. Incidence, prevalence, density, and specificity index (SI) of ectoparasites of Pygoderma bilabiatum (n = 53). SD = standard deviation.

Ectoparasite taxon Incidence (%) SIMean SD Mean SD
Aspidoptera falcata 29.95 0.57 1.22 1.90 1.56 0.99Megistopoda aranea 0.25 0.01 0.15 3.00 -- 0.03Megistopoda proxima 48.27 0.88 1.27 1.83 1.27 0.98Metelasmus paucisetus 0.99 0.01 0.13 1.25 0.50 1.00Noctiliostrebla aitkeni 0.25 0.00 0.05 1.00 -- 0.01Paratrichobius longicrus 0.25 0.00 0.05 1.00 -- 0.01Periglischrus iheringi 0.25 0.00 0.05 1.00 -- 0.00Periglischrus ojasti 48.27 1.21 1.96 2.51 2.16 0.97Chiroptonyssus haematophagus 0.50 0.01 0.16 2.00 1.41 0.00Macronyssoides kochi 0.25 0.01 0.15 3.00 -- 0.00Parichoronyssus crassipes 0.25 0.00 0.05 1.00 -- 0.02Parichoronyssus euthysternum 53.47 2.04 4.52 3.81 5.61 0.95Steatonyssus joaquimi 0.74 0.03 0.43 4.33 3.06 0.01Unknown macronyssid 0.25 0.01 0.15 3.00 -- 0.04Ornithodoros hasei 0.25 0.01 0.15 3.00 -- 0.00Rhipicephalus sp. 0.25 0.00 0.05 1.00 -- 0.50Beamerella acutascuta 0.25 0.00 0.05 1.00 -- 0.04Eutrombicula sp. 0.25 0.00 0.05 1.00 -- 1.00Hooperella vesperuginus 0.50 0.00 0.07 1.00 0.00 0.50Perisopalla precaria 0.25 0.00 0.05 1.00 -- 1.00Trombicula dicrura 0.74 0.15 2.62 20.33 27.65 0.87Trombicula sp. 0.25 0.04 0.80 16.00 -- 0.59Eudusbabekia lepidoseta 0.74 0.01 0.09 1.00 0.00 1.00
Table 2.21. Incidence, prevalence, density, and specificity index (SI) of ectoparasites of Sturnira lilium (n = 404). SD = standard deviation.
Prevalence Density

Ectoparasite taxon Incidence (%) SIMean SD Mean SD
Trichobius galei 100.00 6.00 -- 6.00 -- 1.00Periglischrus natali 100.00 1.00 -- 1.00 -- 1.00
Prevalence Density
Table 2.22. Incidence, prevalence, density, and specificity index (SI) of ectoparasites of Natalus stramineus (n = 1). SD = standard deviation.

Ectoparasite taxon Incidence (%) SIMean SD Mean SD
Basilia sp. 5 8.33 0.50 1.73 6.00 -- 0.55Chiroptonyssus venezolanus 8.33 0.08 0.29 1.00 -- 0.00Steatonyssus joaquimi 75.00 5.83 7.13 7.78 7.28 0.04Ornithodoros hasei 8.33 0.08 0.29 1.00 -- 0.00
Prevalence Density
Table 2.23. Incidence, prevalence, density, and specificity index (SI) of ectoparasites of Eptesicus brasiliensis (n = 12). SD = standard deviation.

Ectoparasite taxon Incidence (%) SIMean SD Mean SD
Basilia spp. (males only) 50.00 0.50 0.71 1.00 -- 0.02Steatonyssus joaquimi 100.00 5.50 2.12 5.50 2.12 0.01Ornithodoros hasei 50.00 0.50 0.71 1.00 -- 0.00
Prevalence Density
Table 2.24. Incidence, prevalence, density, and specificity index (SI) of ectoparasites of Eptesicus diminutus (n = 2). SD = standard deviation. Male specimens of different species are indistinguishable using phenotypic traits, therefore Basilia on hosts with only males were simply identified as Basilia spp.

Ectoparasite taxon Incidence (%) SIMean SD Mean SD
Basilia sp. 1 1.45 0.03 0.24 2.00 -- 0.40Basilia sp. 3 1.45 0.01 0.12 1.00 -- 0.02Basilia sp. 4 8.70 0.17 0.62 2.00 0.89 1.00Basilia sp. 5 2.90 0.07 0.43 2.50 0.71 0.45Basilia spp. (males only) 11.59 0.13 0.38 1.13 0.35 0.21Periglischrus iheringi 1.45 0.01 0.12 1.00 -- 0.00Spinturnix orri 7.25 0.20 0.80 2.80 1.30 0.93Spinturnix surinamensis 7.25 0.41 1.78 5.60 4.16 1.00Chiroptonyssus haematophagus 1.45 0.03 0.24 2.00 -- 0.00Chiroptonyssus venezolanus 1.45 0.12 0.96 8.00 -- 0.01Macronyssus crosbyi 2.90 0.07 0.49 2.50 2.12 0.00Parichoronyssus cyrtosternum 1.45 0.03 0.24 2.00 -- 1.00Steatonyssus furmani 1.45 0.09 0.72 6.00 -- 0.01Steatonyssus joaquimi 72.46 9.93 15.54 13.98 16.86 0.40Ornithodoros hasei 8.70 0.12 0.40 1.33 0.52 0.01Beamerella acutascuta 1.45 0.03 0.24 2.00 -- 0.07
Prevalence Density
Table 2.25. Incidence, prevalence, density, and specificity index (SI) of ectoparasites of Eptesicus furinalis (n = 69). SD = standard deviation. Male specimens of different species are indistinguishable using phenotypic traits, therefore Basilia on hosts with only males were simply identified as Basilia spp.

Ectoparasite taxon Incidence (%) SIMean SD Mean SD
Basilia spp. (males only) 16.67 0.17 0.41 1.00 -- 0.02Chiroptonyssus haematophagus 33.33 3.83 6.59 11.50 6.36 0.01Steatonyssus joaquimi 50.00 16.00 33.05 32.00 44.31 0.06
Prevalence Density
Table 2.26. Incidence, prevalence, density, and specificity index (SI) of ectoparasites of Histiotus macrotus (n = 6). SD = standard deviation. Male specimens of different species are indistinguishable using phenotypic traits, therefore Basilia on hosts with only males were simply identified as Basilia spp.

Ectoparasite taxon Incidence (%) SIMean SD Mean SD
Chiroptonyssus haematophagus 18.18 0.18 0.40 1.00 0.00 0.00Steatonyssus furmani 27.27 1.09 2.07 4.00 2.00 0.03Steatonyssus joaquimi 9.09 0.55 1.81 6.00 -- 0.00
Prevalence Density
Table 2.27. Incidence, prevalence, density, and specificity index (SI) of ectoparasites of Lasiurus blossevillii (n = 11). SD = standard deviation.

Ectoparasite taxon Incidence (%) SIMean SD Mean SD
Macronyssus meridionalis 50.00 0.50 0.71 1.00 -- 0.02
Prevalence Density
Table 2.28. Incidence, prevalence, density, and specificity index (SI) of ectoparasites of Lasiurus cinereus (n = 2). SD = standard deviation.

Ectoparasite taxon Incidence (%) SIMean SD Mean SD
Steatonyssus furmani 62.50 5.56 8.82 8.89 9.76 0.95Labidocarpus sp. 1.39 0.10 0.82 7.00 -- 0.54Parkosa tadarida 1.39 0.03 0.24 2.00 -- 0.00Unknown mites 2.78 0.03 0.17 1.00 0.00 0.15
Prevalence Density
Table 2.29. Incidence, prevalence, density, and specificity index (SI) of ectoparasites of Lasiurus ega (n = 72). SD = standard deviation.

Ectoparasite taxon Incidence (%) SIMean SD Mean SD
Basilia sp. 1 1.15 0.03 0.32 3.00 -- 0.60Basilia sp. 2 1.15 0.03 0.32 3.00 -- 0.14Basilia sp. 3 13.79 0.29 0.78 2.08 0.79 0.40Basilia sp. 6 1.15 0.01 0.11 1.00 -- 1.00Basilia spp. (males only) 16.09 0.21 0.53 1.29 0.61 0.43Spinturnix americanus 18.39 0.28 0.74 1.50 1.10 0.38Spinturnix banksi 6.90 0.07 0.25 1.00 0.00 1.00Chiroptonyssus haematophagus 1.15 0.01 0.11 1.00 -- 0.00Macronyssus crosbyi 54.02 9.70 14.13 17.96 14.89 0.77Parichoronyssus euthysternum 1.15 0.18 1.72 16.00 -- 0.02Steatonyssus joaquimi 33.33 6.53 18.54 19.59 28.12 0.33Steatonyssus sp. 2 1.15 0.15 1.39 13.00 -- 0.50Ornithodoros hasei 3.45 0.03 0.18 1.00 0.00 0.00Myodopsylla wolffsohni 16.09 0.28 0.79 1.71 1.20 0.92Unknown mites 1.15 0.01 0.11 1.00 -- 0.08
Prevalence Density
Table 2.30. Incidence, prevalence, density, and specificity index (SI) of ectoparasites of Myotis albescens (n = 87). SD = standard deviation. Male specimens of different species are indistinguishable using phenotypic traits, therefore Basilia on hosts with only males were simply identified as Basilia spp.

Ectoparasite taxon Incidence (%) SIMean SD Mean SD
Basilia sp. 2 7.03 0.14 0.66 2.00 1.66 0.82Basilia sp. 3 7.81 0.22 0.88 2.80 1.69 0.45Basilia spp. (males only) 5.47 0.08 0.37 1.43 0.79 0.24Periglischrus ojasti 0.78 0.02 0.18 2.00 -- 0.00Spinturnix americanus 11.72 0.21 0.78 1.80 1.57 0.43Chiroptonyssus haematophagus 2.34 0.04 0.26 1.67 0.58 0.00Chiroptonyssus robustipes 0.78 0.01 0.09 1.00 -- 0.00Macronyssus crosbyi 25.00 1.52 4.27 6.09 6.78 0.18Macronyssus meridionalis 3.13 0.14 1.07 4.50 4.73 0.38Macronyssus sp. 2 0.78 0.02 0.27 3.00 -- 1.00Steatonyssus furmani 0.78 0.02 0.18 2.00 -- 0.00Steatonyssus joaquimi 25.00 1.71 5.29 6.84 8.86 0.13Steatonyssus sp. 2 1.56 0.09 0.89 5.50 6.36 0.42Unknown macronyssid 3.13 0.03 0.17 1.00 0.00 0.05Ornithodoros hasei 2.34 0.09 0.82 4.00 4.36 0.01Myodopsylla wolffsohni 1.56 0.02 0.12 1.00 0.00 0.08
Prevalence Density
Table 2.31. Incidence, prevalence, density, and specificity index (SI) of ectoparasites of Myotis nigricans (n = 128). SD = standard deviation. Male specimens of different species are indistinguishable using phenotypic traits, therefore Basilia on hosts with only males were simply identified as Basilia spp.

Ectoparasite taxon Incidence (%) SIMean SD Mean SD
Basilia sp. 2 9.09 0.09 0.30 1.00 -- 0.05Basilia sp. 3 36.36 0.73 1.19 2.00 1.15 0.13Spinturnix americanus 9.09 0.09 0.30 1.00 -- 0.02Macronyssus crosbyi 9.09 0.82 2.71 9.00 -- 0.01Macronyssus meridionalis 54.55 2.55 3.36 4.67 3.27 0.58Steatonyssus joaquimi 9.09 0.45 1.51 5.00 -- 0.00
Prevalence Density
Table 2.32. Incidence, prevalence, density, and specificity index (SI) of ectoparasites of Myotis riparius (n = 11). SD = standard deviation.

Ectoparasite taxon Incidence (%) SIMean SD Mean SD
Spinturnix americanus 100.00 10.00 -- 10.00 -- 0.16Macronyssus sp. 1 100.00 8.00 -- 8.00 -- 1.00
Prevalence Density
Table 2.33. Incidence, prevalence, density, and specificity index (SI) of ectoparasites of Myotis simus (n = 1). SD = standard deviation.

Ectoparasite taxon Incidence (%) SIMean SD Mean SD
Chiroptonyssus haematophagus 20.00 0.20 0.45 1.00 -- 0.00Parichoronyssus euthysternum 20.00 0.20 0.45 1.00 -- 0.00Labidocarpus sp. 20.00 1.20 2.68 6.00 -- 0.46
Prevalence Density
Table 2.34. Incidence, prevalance, density, and specificity index (SI) of ectoparasites of Eumops bonariensis (n = 5). SD = standard deviation.

Ectoparasite taxon Incidence (%) SIMean SD Mean SD
Hesperoctenes n. sp. 1 75.00 3.00 2.94 4.00 2.65 0.07Chiroptonyssus haematophagus 75.00 6.50 9.81 8.67 10.79 0.01Chiroptonyssus venezolanus 25.00 1.75 3.50 7.00 -- 0.01Ornithodoros hasei 25.00 0.50 1.00 2.00 -- 0.00Parkosa tadarida 25.00 1.00 2.00 4.00 -- 0.00
Prevalence Density
Table 2.35. Incidence, prevalence, density, and specificity index (SI) of ectoparasites of Eumops dabbenei (n = 4). SD = standard deviation.

Ectoparasite taxon Incidence (%) SIMean SD Mean SD
Trichobius jubatus 1.79 0.02 0.13 1.00 -- 0.01Hesperoctenes n. sp. 1 42.86 2.73 11.80 6.65 17.91 0.93Periglischrus iheringi 3.57 0.04 0.19 1.00 0.00 0.00Chiroptonyssus haematophagus 55.36 2.20 4.40 3.84 5.27 0.04Chiroptonyssus robustipes 1.79 0.16 1.20 9.00 -- 0.02Ornithodoros hasei 3.57 0.09 0.44 1.67 1.15 0.00Beamerella acutascuta 1.79 0.11 0.80 6.00 -- 0.22Parkosa tadarida 5.36 0.63 3.16 11.67 9.02 0.03
Prevalence Density
Table 2.36. Incidence, prevalence, density, and specificity index (SI) of ectoparasites of Eumops glaucinus (n = 56). SD = standard deviation.

Ectoparasite taxon Incidence (%) SIMean SD Mean SD
Strebla diaemi 0.19 0.00 0.04 1.00 -- 0.03Trichobius jubatus 4.37 0.06 0.29 1.26 0.69 0.36Hesperoctenes longiceps 16.92 0.28 0.78 1.65 1.15 1.00Periglischrus herrerai 0.19 0.00 0.09 2.00 -- 0.40Periglischrus iheringi 0.19 0.00 0.04 1.00 -- 0.00Chiroptonyssus haematophagus 49.43 2.64 9.49 5.33 12.96 0.42Chiroptonyssus venezolanus 0.57 0.01 0.13 1.67 0.58 0.01Macronyssus crosbyi 0.19 0.01 0.22 5.00 -- 0.00Macronyssus sp. 3 0.19 0.00 0.04 1.00 -- 0.17Ornithodoros hasei 3.80 0.05 0.29 1.35 0.75 0.02Rhipicephalus sp. 0.19 0.00 0.04 1.00 -- 0.50Beamerella acutascuta 0.19 0.01 0.13 3.00 -- 0.11Trombicula dicrura 0.19 0.01 0.22 5.00 -- 0.07Trombicula sp. 0.76 0.01 0.12 1.25 0.50 0.19Parkosa maxima 0.57 0.01 0.13 1.67 0.58 0.03Parkosa tadarida 2.28 0.13 1.23 5.58 6.23 0.06Ewingana sp. 1 0.38 0.00 0.06 1.00 0.00 1.00
Prevalence Density
Table 2.37. Incidence, prevalence, density, and specificity index (SI) of ectoparasites of Eumops patagonicus (n = 526). SD = standard deviation.

Ectoparasite taxon Incidence (%) SIMean SD Mean SD
Hesperoctenes n. sp. 2 33.33 1.67 2.89 5.00 -- 1.00Chiroptonyssus haematophagus 66.67 10.00 8.72 15.00 1.41 0.01
Prevalence Density
Table 2.38. Incidence, prevalence, density, and specificity index (SI) of ectoparasites of Eumops perotis (n = 3). SD = standard deviation.

Ectoparasite taxon Incidence (%) SIMean SD Mean SD
Hesperoctenes cartus 35.71 0.50 0.76 1.40 0.55 1.00Chiroptonyssus robustipes 21.43 0.64 1.65 3.00 2.65 0.02Chiroptonyssus venezolanus 28.57 1.00 1.84 3.50 1.73 0.02Steatonyssus joaquimi 7.14 0.21 0.80 3.00 -- 0.00Ornithodoros hasei 21.43 1.57 3.92 7.33 6.03 0.02
Prevalence Density
Table 2.39. Incidence, prevalence, density, and specificity index (SI) of ectoparasites of Molossops abrasus (n = 14). SD = standard deviation.

Ectoparasite taxon Incidence (%) SIMean SD Mean SD
Hesperoctenes minor 25.00 0.75 1.42 3.00 1.00 1.00Chiroptonyssus venezolanus 25.00 0.75 1.76 3.00 2.65 0.00Chiroptonyssus sp. 1 8.33 0.08 0.29 1.00 -- 0.50Ornithodoros hasei 8.33 0.08 0.29 1.00 -- 0.00
Prevalence Density
Table 2.40. Incidence, prevalence, density, and specificity index (SI) of ectoparasites of Molossops planirostris (n = 12). SD = standard deviation.

Ectoparasite taxon Incidence (%) SIMean SD Mean SD
Trichobius jubatus 0.63 0.01 0.16 2.00 -- 0.03Hesperoctenes parvulus 18.75 0.33 1.11 1.77 2.03 1.00Spinturnix americanus 0.63 0.01 0.08 1.00 -- 0.02Chiroptonyssus haematophagus 4.38 0.28 2.16 6.29 8.90 0.01Chiroptonyssus robustipes 0.63 0.01 0.16 2.00 -- 0.00Chiroptonyssus venezolanus 45.63 2.31 4.39 5.05 5.34 0.64Macronyssus crosbyi 0.63 0.01 0.08 1.00 -- 0.00Macronyssus meridionalis 0.63 0.01 0.08 1.00 -- 0.02Steatonyssus joaquimi 1.88 0.06 0.50 3.00 2.65 0.01Ornithodoros hasei 10.63 0.34 1.35 3.18 2.90 0.05Amblyomma sp. 0.63 0.01 0.08 1.00 -- 0.33Trombicula sp. 0.63 0.01 0.08 1.00 -- 0.04Unknown mites 1.88 0.02 0.14 1.00 0.00 0.23
Prevalence Density
Table 2.41. Incidence, prevalence, density, and specificity index (SI) of ectoparasites of Molossops temminckii (n = 160). SD = standard deviation.

Ectoparasite taxon Incidence (%) SIMean SD Mean SD
Trichobius jubatus 17.00 0.27 0.74 1.59 1.06 0.34Hesperoctenes fumarius 13.00 0.41 1.49 3.15 3.00 0.25Hesperoctenes n. sp. 3 2.00 0.02 0.14 1.00 0.00 0.67Periglischrus iheringi 2.00 0.02 0.14 1.00 0.00 0.00Chiroptonyssus robustipes 67.00 5.26 11.16 7.85 12.89 0.94Chiroptonyssus venezolanus 1.00 0.07 0.70 7.00 -- 0.01Chiroptonyssus sp. 1 1.00 0.01 0.10 1.00 -- 0.50Macronyssus crosbyi 1.00 0.01 0.10 1.00 -- 0.00Unknown macronyssid 1.00 0.01 0.10 1.00 -- 0.01Ornithodoros hasei 17.00 0.60 2.10 3.53 4.05 0.05Hooperella vesperuginus 1.00 0.02 0.20 2.00 -- 0.50Trombicula sp. 1.00 0.02 0.20 2.00 -- 0.07Lawrenceocarpus sp. 1.00 0.04 0.40 4.00 -- 0.31Parkosa maxima 1.00 0.01 0.10 1.00 -- 0.01Parkosa tadarida 3.00 2.33 16.29 77.67 66.08 0.21Unknown mites 1.00 0.01 0.10 1.00 -- 0.08
Prevalence Density
Table 2.42. Incidence, prevalence, density, and specificity index (SI) of ectoparasites of Molossus ater (n = 100). SD = standard deviation.

Ectoparasite taxon Incidence (%) SIMean SD Mean SD
Hesperoctenes fumarius 7.41 0.07 0.27 1.00 0.00 0.01Chiroptonyssus haematophagus 81.48 2.00 2.25 2.45 2.26 0.02Steatonyssus joaquimi 3.70 0.07 0.38 2.00 -- 0.00Ornithodoros hasei 11.11 0.22 0.80 2.00 1.73 0.01
Prevalence Density
Table 2.43. Incidence, prevalence, density, and specificity index (SI) of ectoparasites of Molossus currentium (n = 27). SD = standard deviation.

Ectoparasite taxon Incidence (%) SIMean SD Mean SD
Trichobius jubatus 7.46 0.09 0.38 1.24 0.75 0.26Hesperoctenes fumarius 26.75 0.53 1.14 1.97 1.43 0.74Hesperoctenes n. sp. 3 0.44 0.00 0.07 1.00 -- 0.33Chiroptonyssus haematophagus 56.58 5.68 11.33 10.03 13.54 0.40Macronyssoides conciliatus 0.44 0.00 0.07 1.00 -- 0.01Macronyssus crosbyi 2.63 0.11 0.76 4.33 2.07 0.02Macronyssus sp. 3 0.44 0.01 0.13 2.00 -- 0.33Steatonyssus furmani 0.44 0.00 0.07 1.00 -- 0.00Ornithodoros hasei 3.07 0.05 0.35 1.71 1.11 0.01Beamerella acutascuta 1.32 0.03 0.28 2.00 1.73 0.22Parkosa maxima 11.84 0.76 3.11 6.41 6.86 0.94Parkosa tadarida 13.60 3.36 14.27 24.74 31.52 0.68Unknown mites 0.88 0.01 0.09 1.00 0.00 0.15
Prevalence Density
Table 2.44. Incidence, prevalence, density, and specificity index (SI) of ectoparasites of Molossus molossus (n = 228). SD = standard deviation.

Ectoparasite taxon Incidence (%) SIMean SD Mean SD
Hesperoctenes setosus 9.52 0.10 0.30 1.00 0.00 1.00Chiroptonyssus haematophagus 7.14 0.26 1.06 3.67 2.08 0.00Chiroptonyssus venezolanus 54.76 3.69 8.47 6.74 10.59 0.27Ornithodoros hasei 7.14 0.07 0.26 1.00 0.00 0.00Amblyomma sp. 2.38 0.02 0.15 1.00 -- 0.33Trombicula sp. 2.38 0.02 0.15 1.00 -- 0.04Ewingana sp. 2 2.38 0.02 0.15 1.00 -- 1.00Hormopsylla fosteri 2.38 0.02 0.15 1.00 -- 1.00Rothschildopsylla noctilionis 7.14 0.12 0.50 1.67 1.15 1.00
Prevalence Density
Table 2.45. Incidence, prevalence, density, and specificity index (SI) of ectoparasites of Nyctinomops laticaudatus (n = 42). SD = standard deviation.

Ectoparasite taxon Incidence (%) SIMean SD Mean SD
Hesperoctenes angustatus 25.00 0.75 1.50 3.00 -- 1.00Chiroptonyssus haematophagus 50.00 2.75 4.86 5.50 6.36 0.00
Prevelence Density
Table 2.46. Incidence, prevalence, density, and specificity index (SI) of ectoparasites of Promops centralis (n = 4). SD = standarad deviation.

Ectoparasite taxon Incidence (%) SIMean SD Mean SD
Chiroptonyssus haematophagus 100.00 28.38 25.29 28.38 25.29 0.07
Prevelence Density
Table 2.47. Incidence, prevalence, density, and specificity index (SI) of ectoparasites of Promops nasutus (n = 8). SD = standard deviation.

Ectoparasite family Ectoparasite species Host specificity Species Genera FamiliesStreblidae Aspidoptera falcata Polyxenous 4 3 1
Aspidoptera phyllostomatis Oligoxenous 3 1 1Mastoptera minuta Monoxenous 1 1 1Megistopoda aranea Polyxenous 4 2 1Megistopoda proxima Polyxenous 5 4 1Metelasmus pseudopterus Oligoxenous 3 1 1Metelasmus paucisetus Monoxenous 1 1 1Noctiliostrebla aitkeni Polyxenous 2 2 2Noctiliostrebla dubia Monoxenous 1 1 1Noctiliostrebla maai Monoxenous 1 1 1Paradyschiria fusca Monoxenous 1 1 1Paradyschiria parvula Monoxenous 1 1 1Paratrichobius longicrus Polyxenous 3 3 1Speiseria ambigua Monoxenous 1 1 1Strebla chrotopteri Monoxenous 1 1 1Strebla diaemi Polyxenous 2 2 2Strebla guajiro Polyxenous 3 3 1Strebla weidemanni Monoxenous 1 1 1Trichobius angulatus Monoxenous 1 1 1Trichobius diaemi Monoxenous 1 1 1Trichobius dugesii Monoxenous 1 1 1Trichobius galei Monoxenous 1 1 1Trichobius joblingi Polyxenous 2 2 1Trichobius jubatus Pleioxenous 5 3 1Trichobius parasiticus Monoxenous 1 1 1Trichobius uniformis Monoxenous 1 1 1
Table 2.48. Host specificity of arthropods ectoparasitic on bats of Paraguay using all observed associations from this studyNumber of hosts

Table 2.48. Continued
Ectoparasite family Ectoparasite species Host specificity Species Genera FamiliesXenotrichobius noctilionis Monoxenous 1 1 1
Polyctenidae Hesperoctenes angustatus Monoxenous 1 1 1Hesperoctenes cartus Monoxenous 1 1 1Hesperoctenes fumarius Oligoxenous 3 1 1Hesperoctenes longiceps Monoxenous 1 1 1Hesperoctenes minor Monoxenous 1 1 1Hesperoctenes parvulus Monoxenous 1 1 1Hesperoctenes setosus Monoxenous 1 1 1Hesperoctenes n. sp. 1 Oligoxenous 2 1 1Hesperoctenes n. sp. 2 Monoxenous 1 1 1Hesperoctenes n. sp. 3 Oligoxenous 2 1 1
Nycteribiidae Basilia sp. 1 Pleioxenous 2 2 1Basilia sp. 2 Oligoxenous 3 1 1Basilia sp. 3 Pleioxenous 4 2 1Basilia sp. 4 Monoxenous 1 1 1Basilia sp. 5 Oligoxenous 2 1 1Basilia sp. 6 Monoxenous 1 1 1
Ischnopsyllidae Hormopsylla fosteri Monoxenous 1 1 1Myodopsylla wolffsohni Oligoxenous 2 1 1Rothschildopsylla noctilionis Monoxenous 1 1 1
Spinturnicidae Periglischrus caligus Monoxenous 1 1 1Periglischrus herrerai Polyxenous 2 2 2
Number of hosts

Table 2.48. Continued
Ectoparasite family Ectoparasite species Host specificity Species Genera FamiliesPeriglischrus iheringi Polyxenous 12 9 3Periglischrus natali Monoxenous 1 1 1Periglischrus ojasti Polyxenous 7 6 2Periglischrus tonatii Monoxenous 1 1 1Spinturnix americanus Polyxenous 5 2 2Spinturnix banksi Monoxenous 1 1 1Spinturnix orri Polyxenous 2 2 2Spinturnix surinamensis Monoxenous 1 1 1
Macronyssidae Chiroptonyssus haematophagus Polyxenous 23 14 4Chiroptonyssus robustipes Polyxenous 6 5 3Chiroptonyssus venezolanus Polyxenous 11 7 3Chiroptonyssus sp. 1 Pleioxenous 2 2 1Macronyssoides conciliatus Polyxenous 3 3 2Macronyssoides kochi Polyxenous 7 5 1Macronyssoides sp. 1 Monoxenous 1 1 1Macronyssus crosbyi Polyxenous 11 8 4Macronyssus meridionalis Polyxenous 4 3 2Macronyssus sp. 1 Monoxenous 1 1 1Macronyssus sp. 2 Monoxenous 1 1 1Macronyssus sp. 3 Polyxenous 3 3 2Parichoronyssus crassipes Polyxenous 4 4 1Parichoronyssus cyrtosternum Monoxenous 1 1 1Parichoronyssus euthysternum Polyxenous 8 7 3Parichoronyssus sclerus Polyxenous 2 2 1Radfordiella desmodi Pleioxenous 2 2 1
Number of hosts

Table 2.48. Continued
Ectoparasite family Ectoparasite species Host specificity Species Genera FamiliesRadfordiella oudemansi Monoxenous 1 1 1Steatonyssus furmani Polyxenous 6 5 3Steatonyssus joaquimi Polyxenous 14 9 3Steatonyssus sp. 1 Oligoxenous 2 1 1Steatonyssus sp. 2 Polyxenous 3 2 2
Argasidae Ornithodoros hasei Polyxenous 19 10 4Amblyomma sp. Polyxenous 3 3 2Rhipicephalus sp. Polyxenous 2 2 2
Ixodidae Unknown ixodid Monoxenous 1 1 1
Trombiculidae Beamerella acutascuta Polyxenous 7 5 3Euschoengastia megastyrax Monoxenous 1 1 1Eutrombicula sp. Monoxenous 1 1 1Hooperella vesperuginus Polyxenous 2 2 2Trombicula dicrura Polyxenous 3 3 2Trombicula sp. 1 Monoxenous 1 1 1Trombicula sp. Polyxenous 6 6 2
Chirodiscidae Labidocarpus sp. Polyxenous 2 2 2Lawrenceocarpus sp. Polyxenous 2 2 2Perisopalla precaria Monoxenous 1 1 1Parkosa maxima Polyxenous 5 3 2Parkosa tadarida Polyxenous 7 4 3Pseudolabidocarpus sp. Polyxenous 2 2 1
Number of hosts

Table 2.48. Continued
Ectoparasite family Ectoparasite species Host specificity Species Genera Families
Myobiidae Eudusbabekia lepidoseta Monoxenous 1 1 1Eudusbabekia viguerasi Oligoxenous 3 1 1Eudusbabekia sp. Monoxenous 1 1 1Ewingana sp. 1 Monoxenous 1 1 1Ewingana sp. 2 Monoxenous 1 1 1
Number of hosts

Ectoparasite family Ectoparasite species Host specificity Species Genera FamiliesStreblidae Aspidoptera falcata Monoxenous 1 1 1
Aspidoptera phyllostomatis Oligoxenous 2 1 1Mastoptera minuta Monoxenous 1 1 1Megastopoda aranea Oligoxenous 2 1 1Megastopoda proxima Monoxenous 1 1 1Metelasmus pseudopterus Monoxenous 1 1 1Metelasmus paucisetus Monoxenous 1 1 1Noctiliostrebla aitkeni Monoxenous 1 1 1Noctiliostrebla dubia Monoxenous 1 1 1Noctiliostrebla maai Monoxenous 1 1 1Paradyschiria fusca Monoxenous 1 1 1Paradyschiria parvula Monoxenous 1 1 1Paratrichobius longicrus Monoxenous 1 1 1Speiseria ambigua Monoxenous 1 1 1Strebla chrotopteri Monoxenous 1 1 1Strebla diaemi Monoxenous 1 1 1Strebla guajiro Polyxenous 2 2 1Strebla weidemanni Monoxenous 1 1 1Trichobius angulatus Monoxenous 1 1 1Trichobius diaemi Monoxenous 1 1 1Trichobius dugesii Monoxenous 1 1 1Trichobius galei Monoxenous 1 1 1Trichobius joblingi Polyxenous 2 2 1Trichobius jubatus Oligoxenous 2 1 1Trichobius parasiticus Monoxenous 1 1 1
Table 2.49. Host specificity of arthropods ectoparasitic on bats of Paraguay using only primary host associations (i.e., ignoring probable transient relationships and contamination).
Number of hosts

Table 2.49. Continued
Ectoparasite family Ectoparasite species Host specificity Species Genera FamiliesTrichobius uniformis Monoxenous 1 1 1Xenotrichobius noctilionis Monoxenous 1 1 1
Polyctenidae Hesperoctenes angustatus Monoxenous 1 1 1Hesperoctenes cartus Monoxenous 1 1 1Hesperoctenes fumarius Oligoxenous 3 1 1Hesperoctenes longiceps Monoxenous 1 1 1Hesperoctenes minor Monoxenous 1 1 1Hesperoctenes parvulus Monoxenous 1 1 1Hesperoctenes setosus Monoxenous 1 1 1Hesperoctenes n. sp. 1 Oligoxenous 2 1 1Hesperoctenes n. sp. 2 Monoxenous 1 1 1Hesperoctenes n. sp. 3 Oligoxenous 2 1 1
Nycteribiidae Basilia sp. 1 Pleioxenous 2 2 1Basilia sp. 2 Oligoxenous 2 1 1Basilia sp. 3 Oligoxenous 3 1 1Basilia sp. 4 Monoxenous 1 1 1Basilia sp. 5 Monoxenous 1 1 1Basilia sp. 6 Monoxenous 1 1 1
Ischnopsyllidae Hormopsylla fosteri Monoxenous 1 1 1Myodopsylla wolffsohni Monoxenous 1 1 1Rothschildopsylla noctilionis Monoxenous 1 1 1
Spinturnicidae Periglischrus caligus Monoxenous 1 1 1
Number of hosts

Table 2.49. Continued
Ectoparasite family Ectoparasite species Host specificity Species Genera FamiliesPeriglischrus herrerai Monoxenous 1 1 1Periglischrus iheringi Pleioxenous 5 3 1Periglischrus natali Monoxenous 1 1 1Periglischrus ojasti Monoxenous 1 1 1Periglischrus tonatii Monoxenous 1 1 1Spinturnix americanus Oligoxenous 4 1 1Spinturnix banksi Monoxenous 1 1 1Spinturnix orri Monoxenous 1 1 1Spinturnix surinamensis Monoxenous 1 1 1
Macronyssidae Chiroptonyssus haematophagus Polyxenous 13 7 3Chiroptonyssus robustipes Polyxenous 3 3 2Chiroptonyssus venezolanus Polyxenous 6 4 2Chiroptonyssus sp. 1 Pleioxenous 2 2 1Macronyssoides conciliatus Monoxenous 1 1 1Macronyssoides kochi Pleioxenous 4 2 1Macronyssoides sp. 1 Monoxenous 1 1 1Macronyssus crosbyi Oligoxenous 3 1 1Macronyssus meridionalis Pleioxenous 2 2 1Macronyssus sp. 1 Monoxenous 1 1 1Macronyssus sp. 2 Monoxenous 1 1 1Macronyssus sp. 3 Polyxenous 3 3 2Parichoronyssus crassipes Polyxenous 2 2 1Parichoronyssus cyrtosternum Monoxenous 1 1 1Parichoronyssus euthysternum Monoxenous 1 1 1Parichoronyssus sclerus Monoxenous 1 1 1
Number of hosts

Table 2.49. Continued
Ectoparasite family Ectoparasite species Host specificity Species Genera FamiliesRadfordiella desmodi Monoxenous 1 1 1Radfordiella oudemansi Monoxenous 1 1 1Steatonyssus furmani Oligoxenous 2 1 1Steatonyssus joaquimi Pleioxenous 8 4 1Steatonyssus sp. 1 Oligoxenous 2 1 1Steatonyssus sp. 2 Polyxenous 3 2 2
Argasidae Ornithodoros hasei Polyxenous 11 7 4Amblyomma sp. Polyxenous 3 3 2Rhipicephalus sp. Polyxenous 2 2 2
Ixodidae Unknown ixodid Monoxenous 1 1 1
Trobiculidae Beamerella acutascuta Polyxenous 7 5 3Euschoengastia megastyrax Monoxenous 1 1 1Eutrombicula sp. Monoxenous 1 1 1Hooperella vesperuginus Polyxenous 2 2 2Trombicula dicrura Polyxenous 3 3 2Trombicula sp. 1 Monoxenous 1 1 1Trombicula sp. Polyxenous 6 6 2
Chirodiscidae Labidocarpus sp. Polyxenous 2 2 2Lawrenceocarpus sp. Polyxenous 2 2 2Perisopalla precaria Monoxenous 1 1 1Parkosa maxima Polyxenous 5 3 2Parkosa tadarida Polyxenous 7 4 3
Number of hosts

Table 2.49. Continued
Ectoparasite family Ectoparasite species Host specificity Species Genera FamiliesPseudolabidocarpus sp. Polyxenous 2 2 1
Myobiidae Eudusbabekia lepidoseta Monoxenous 1 1 1Eudusbabekia viguerasi Oligoxenous 3 1 1Eudusbabekia sp. Monoxenous 1 1 1Ewingana sp. 1 Monoxenous 1 1 1Ewingana sp. 2 Monoxenous 1 1 1
Number of hosts

Host familyHost species S1 S2 S3 S4 S5 S6 S7 S8 S9 S10 S11 S12 S13
NoctilionidaeNoctilio albiventris 772 434 213 15 13 6 2* 2* 1* 1* 1*Noctilio leporinus 227 172 79 32 16 16 10 1*
PhyllostomidaeChrotopterus auritus 69 67 15Tonatia bidens 33 6 3Tonatia brasiliense 11 1Glossophaga soricina 27 10 8 8 5 2* 1 1* 1* 1*Carollia perspicillata 64 25 11* 4 3 3* 3* 2* 2* 2* 2* 1* 1*Desmodus rotundus 219 103 76 3 2* 2* 1* 1*Diaemus youngi 68 37 5 2* 2*Artibeus fimbriatus 265 189 62 19 17 2* 2* 1 1* 1* 1* 1*Artibeus jamaicensis 119 87 39 29 8 8 5* 4* 3* 2* 1 1*Artibeus lituratus 659 270 155 7* 5* 5* 4* 4* 3* 2 2* 2* 1Platyrrhinus lineatus 169 137 49 10 9* 6* 3* 3* 2* 2* 1* 1* 1*Pygoderma bilabiatum 3* 2* 2* 2* 2* 1* 1*Sturnira lilium 823 489 357 230 61 16 13* 5 4* 3 3* 3* 3*
NatalidaeNatalus stramineus 6 1
Ectoparasite species
Table 2.50. Empirical species abundance distributions of the ectoparasite communities on each of 39 host species. Numbers are absolute abundances and arranged from most to least abundant within each host species such that S1 is the most abundant ectoparasite species from a given host and S23 the least abundant. S1 need not represent the same ectoparasite species for different host species. Ectoparasite N = total number of ectoparasites collected from all individualof a host species. Asterisks indicate non-primary associations.

Host family TotalHost species S14 S15 S16 S17 S18 S19 S20 S21 S22 S23 ectoparasite N
NoctilionidaeNoctilio albiventris 1460Noctilio leporinus 553
PhyllostomidaeChrotopterus auritus 151Tonatia bidens 42Tonatia brasiliense 12Glossophaga soricina 64Carollia perspicillata 1* 124Desmodus rotundus 407Diaemus youngi 114Artibeus fimbriatus 561Artibeus jamaicensis 306Artibeus lituratus 1* 1* 1* 1* 1123Platyrrhinus lineatus 1* 394Pygoderma bilabiatum 13Sturnira lilium 3* 2 1 1 1 1* 1* 1* 1* 1* 2023
NatalidaeNatalus stramineus 7
Ectoparasite speciesTable 2.50. Continued

Host familyHost species S1 S2 S3 S4 S5 S6 S7 S8 S9 S10 S11 S12 S13
VespertilionidaeEptesicus brasiliensis 70 6 2* 1* 1*Eptesicus diminutus 11 1* 1*Eptesicus furinalis 685 28 14 12 9* 8* 8 6* 5 5* 2 2 2*Histiotus macrotus 96 23 1*Lasiurus blossevillii 12 6 2Lasiurus ega 400 7 2* 2*Myotis albescens 844 568 25 24 24 18* 16* 13* 6 3 3* 3* 1Myotis nigricans 219 195 28 27 18 18 12* 11 10* 5* 4* 3* 2*Myotis riparius 28 9* 8 5* 1* 1*Myotis simus 10 8
MolossidaeEumops bonariensis 6* 1* 1*Eumops dabbenei 26 12 7 4 2Eumops glaucinus 156 122 35 9* 6* 4* 2* 1*Eumops patagonicus 1387 147 67 29 27* 5* 5* 5* 5* 5* 3* 2 2*Eumops perotis 30 5Molossops abrasus 22 14 9 7 3Molossops planirostris 9* 9* 1* 1*Molossops temminckii 369 54 53 44* 9* 3* 2* 2* 1* 1* 1* 1* 1*Molossus ater 526 233 60 41 27 7* 4 2 2 2* 2* 1* 1*Molossus currentium 54 6 2* 2*Molossus molossus 1294 767 173 120 26* 21 12* 6 2* 2* 1* 1* 1*Nyctinomops laticaudatus 155 11 5 4 3 1* 1* 1* 1*Promops centralis 11 3
Ectoparasite speciesTable 2.50. Continued

Host family TotalHost species S14 S15 S16 S17 S18 S19 S20 S21 S22 S23 ectoparasite N
VespertilionidaeEptesicus brasiliensis 80Eptesicus diminutus 13Eptesicus furinalis 2* 1* 1* 790Histiotus macrotus 120Lasiurus blossevillii 20Lasiurus ega 411Myotis albescens 1* 1* 1550Myotis nigricans 2* 2* 1* 557Myotis riparius 52Myotis simus 18
MolossidaeEumops bonariensis 8Eumops dabbenei 51Eumops glaucinus 335Eumops patagonicus 1 1* 1* 1* 1693Eumops perotis 35Molossops abrasus 55Molossops planirostris 20Molossops temminckii 541Molossus ater 1* 1* 1* 911Molossus currentium 64Molossus molossus 1* 2427Nyctinomops laticaudatus 182Promops centralis 14
Ectoparasite speciesTable 2.50. Continued

Host speciesX2 df p-value X2 df p-value
Noctilio albiventris* 138.8 5 0.0000 34.13 9 0.0001Noctilio leporinus 20 6 0.0028 13.8 7 0.0549Chrotopterus auritus 29.9 2 0.0000 4.4 6 0.6227Tonatia bidens** 1.64 2 0.4404 7.3 5 0.1993Glossophaga soricina** 10.98 5 0.0518 3.46 4 0.4840Carollia perspicillata 2.48 3 0.4789 14.95 5 0.0106Desmodus rotundus* 319.3 3 0.0000 17.4 7 0.0150Diaemus youngi 16.4 2 0.0003 4.75 6 0.5763Artibeus fimbriatus 164.8 5 0.0000 13.8 8 0.0871Artibeus jamaicensis 54.6 6 0.0000 7.97 6 0.2403Artibeus lituratus* 658 4 0.0000 108 9 0.0000Platyrrhinus lineatus 70 3 0.0000 4.96 7 0.6648Sturnira lilium* 138.4 11 0.0000 127.8 9 0.0000Eptesicus furinalis* 428 7 0.0000 67.1 9 0.0000Myotis albescens* 244 7 0.0000 51.4 9 0.0000Myotis nigricans 82.8 6 0.0000 13.48 7 0.0612Eumops dabbenei** 0.18 4 0.9962 0.47 4 0.9764Eumops glaucinus 26.6 2 0.0000 1.05 7 0.9940Eumops patagonicus* 103.5 5 0.0000 127.8 10 0.0000Molossops abrasus** 0.97 4 0.9143 1.35 4 0.8528Molossops temminckii 57.98 2 0.0000 9.59 8 0.2950Molossus ater* 27.2 7 0.0003 56.1 9 0.0000Molossus molossus* 245.2 5 0.0000 24.99 10 0.0054Nyctinomops laticaudatus* 57.4 4 0.0000 29.4 7 0.0001
Broken stick
significance (p-value). If SADs conformed to a particular model, the values are in bold. One asterisk indicates host species whose ectoparasite SAD conformed to neither model; two asterisks indicate those that conformed to both.
Geometric series
Table 2.51. Comparisons of the primary ectoparasite species abundance distributions (SADs) of 24 each of host species with the predictions of the geometric series and broken broken stick models showing the Chi-square statistic (X2), degrees of freedom (df) and

Host taxon Ectoparasite taxon Host N Inc (%) Prev Host N Inc (%) Prev Host N Inc (%) PrevNoctilio albiventris 535 68 Periglischrus iheringi 0.37 0.01 -- --Noctilio leporinus 87 28 Periglischrus ojastii 1.15 0.02 -- --Tonatia bidens 19 3 Periglischrus paratorrealbai 5.26 0.32 -- -- Periglischrus tonatii 5.26 0.05 66.67 11.00Glossophaga soricina 866 54 18 Periglischrus caligus 10.62 0.29 11.11 0.19 27.78 0.8 Periglischrus iheringi 0.23 0.00 1.85 0.02 -- -- Periglischrus ojastii 0.23 0.00 -- -- -- --Carollia perspicillata 4305 75 Cameronieta elongatus 0.02 0.00 -- -- Periglischrus sp. 0.02 0.00 1.33 0.01 Periglischrus acutisternus 0.02 0.00 -- -- Periglischrus iherringi 0.14 0.00 2.67 0.04 Periglischrus ojastii 0.07 0.00 1.33 0.04 Periglischrus torrealbai 0.09 0.00 -- --Desmodus rotundus 964 51 15 Periglischrus sp. -- -- 1.96 0.02 -- -- Periglischrus acutisternus 0.52 0.01 -- -- -- -- Periglischrus caligus 0.21 0.00 -- -- -- -- Periglischrus gameroi 0.10 0.00 -- -- -- -- Periglischrus herrerai 6.33 0.12 5.88 0.06 6.67 0.0
Venezuela Paraguay
Table 2.52. Comparison of spinturnicid infestation rates (incidence and prevalence) on chiropteran hosts from Venezuela (Herrin and Tipton 1975), Mexico (Sheeler-Gordon and Owen 1999), and Paraguay. Host N = number of host individuals inspected for ectoparasites. Inc (%) = ectoparasite incidence. Prev = ectoparasite prevalence. See text for definitions.
Mexico

Host taxon Ectoparasite taxon Host N Inc (%) Prev Host N Inc (%) Prev Host N Inc (%) Prev Periglischrus iherringi 0.31 0.01 -- -- 13.33 0.5 Periglischrus ojastii 0.41 0.01 -- -- -- -- Periglischrus tonatii 0.10 0.00 -- -- -- -- Periglischrus torrealbai 0.31 0.01 -- -- -- --Artibeus jamaicensis 2302 42 20 Periglischrus acutisternus 0.22 0.00 -- -- -- -- Periglischrus caligus 0.09 0.00 -- -- -- -- Periglischrus gameroi 0.04 0.00 -- -- -- -- Periglischrus iherringi 15.20 0.49 61.90 2.07 40.00 0.9 Periglischrus ojastii 0.26 0.00 -- -- -- -- Periglischrus torrealbai 0.09 0.00 -- -- -- --Artibeus lituratus 1620 351 Periglischrus iherringi 25.19 0.67 56.41 1.88 Periglischrus ojastii 0.12 0.00 0.28 0.02Sturnira lilium 363 404 39 Cameronieta elongatus 0.13 0.00 -- -- -- -- Periglischrus sp. 0.17 0.00 -- -- -- -- Periglischrus acutisternus 0.04 0.00 -- -- -- -- Periglischrus caligus 0.04 0.00 -- -- -- -- Periglischrus herrerai 0.04 0.00 -- -- -- -- Periglischrus iherringi 0.44 0.01 0.25 0.00 -- -- Periglischrus ojastii 21.87 0.62 48.27 1.21 33.33 0.5Eptesicus brasiliensis 64 12 Spinturnix surinamensis 10.94 0.20 -- --
Table 2.52. ContinuedVenezuela Paraguay Mexico

Host taxon Ectoparasite taxon Host N Inc (%) Prev Host N Inc (%) Prev Host N Inc (%) PrevEptesicus furinalis 16 69 Periglischrus gameroi 6.25 0.06 -- -- Periglischrus iherringi -- -- 1.45 0.01 Spinturnix orri -- -- 7.25 0.20 Spinturnix surinamensis -- -- 7.25 0.41Myotis albescens 86 87 Periglischrus iherringi 1.16 0.01 -- -- Spinturnix americanus 39.53 0.72 18.39 0.28 Spinturnix banksi -- -- 6.90 0.07Myotis nigricans 153 128 Periglischrus iherringi 0.65 0.01 -- -- Periglischrus ojastii -- -- 0.78 0.01 Spinturnix americanus 50.98 1.64 11.72 0.21Eumops glaucinus 81 56 Periglischrus iherringi 1.23 0.01 3.57 0.04 Spinturnix americanus 1.23 0.01 -- --Molossops planirostris 241 12 Periglischrus acutisternus 0.41 0.00 -- -- Periglischrus torrealbai 0.41 0.00 -- --Molossus ater 410 100 Periglischrus iherringi 0.24 0.00 2.00 0.02 Periglischrus sp. 0.24 0.00 -- --
MexicoVenezuela ParaguayTable 2.52. Continued

Paraguay MexicoEctoparasite taxon HT MAP . caligus Oligoxenous Monoxenous OligoxenousP . herrerai Monoxenous Monoxenous Monoxenous MonoxenousP . iheringi Pleioxenous Pleioxenous Pleioxenous PleioxenousP . natali Monoxenous MonoxenousP . ojastii Oligoxenous Oligoxenous Monoxenous OligoxenousP . tonatii Oligoxenous Monoxenous
VenezuelaHost specificity
Table 2.53. Comparison of Periglischrus host specificity on chiropteran hosts from Venezuela (Herrin and Tipton 1975, Machado-Allison 1965), Mexico (Sheeler-Gordon and Owen 1999), and Paraguay using only primary associations. HT = Herrin and Tipton, MA = Machado-Allsion.

140
CHAPTER III
FLYING ISLANDS I: THE EFFECT OF HOST BODY SIZE ON ECTOPARASITE
ASSEMBLAGE BIODIVERSITY
Introduction
Biogeography is an integrated discipline that requires understanding of ecological
and evolutionary elements to define patterns and identify causal mechanisms at regional,
continental, and global scales. Biogeographic processes per se may not exist; rather,
large-scale geoclimatic (e.g., tectonic plate movements, changes in sea level, climate, and
oceanic circulation), evolutionary (e.g., adaptation, speciation, extinction), and ecological
(e.g., predation, competition) processes operate in concert to produce biogeographic
patterns. These processes do not operate in isolation. For example, as geoclimatic
characteristics change overtime, species must adapt (i.e., evolve) to remain competitive
or avoid predation. These interactions may result in extinction or speciation.
Consequently, the dynamic nature of interactions at large scales of space and time make
it difficult to determine which mechanisms are dominant driving forces in structuring
communities.
Islands possess many tractable qualities that make them attractive foci for
biogeographic study (Shoener 1988). An island is a more feasible study unit than is a
continent or ocean, and is visibly discreet so that resident populations may be
distinguished more easily along natural boundaries. In addition, islands are abundant and
differ in shape, size, degree of isolation, history, and ecology; consequently they provide
the replication necessary to conduct non-manipulative experiments. Low primary
diversity on islands (i.e., species richness due to immigration) promotes in situ
diversification, with the most isolated islands evincing the largest adaptive radiations
(Paulay, 1994). Whether intra-island or inter-island speciation is more important depends
on the dispersal ability of the taxon and opportunities for isolation from parent
populations (Paulay, 1994). The small size and isolation of islands results in relatively
small populations, which makes island species especially vulnerable to local extinction.

141
Therefore, islands provide biotas with opportunities for larger radiations and more
frequent in situ diversification than occur on mainlands, while simultaneously subjecting
them to higher extinction rates. Because of these phenomena, islands provide insight into
assemblage rules.
In the 1960s, MacArthur and Wilson (1963, 1967) proposed the equilibrium
theory of island biogeography (ETIB) in an attempt to explain patterns of species
richness on islands. The primary predictions of ETIB are two fold: 1) larger islands
maintain greater species richness than do smaller islands, and 2) islands more distant
from a source of colonization support fewer species than do closer islands. Distance
from a source population primarily affects richness by molding immigration rates,
whereas island size primarily affects richness by molding extinction rates.
The ETIB has been much debated (for review see Whitaker 1998). Despite
executing one of the more successful tests of ETIB (Simberloff and Wilson 1970),
Simberloff (1976) was foremost among the critics claiming that ETIB gained paradigm
status despite numerous studies that failed to conform to its predictions. These failures
often are explained by faulting deductive logic or by “willful suspension of belief in the
experimental result” (Simberloff 1976). Early work (Simberloff 1983) with development
and application of null models attempted to discount the dynamic equilibrium facet of
ETIB (i.e., that extinction and immigration rates converge to form a stable equilibrium).
Unfortunately, the design of Simberloff’s model predisposes a finding of randomness and
is not an unbiased test of dynamic equilibria (Colwell and Winkler 1984). Many (Gilbert
1980, Schrader-Frechette and McCoy 1993, Simberloff 1976) remain frustrated by the
continued application of ETIB to various types of islands (e.g., habitat patches, lakes,
parasite hosts) in diverse theoretical and applied situations. Nonetheless, prominent
biologists have endorsed it as being useful and insightful despite simplifying assumptions
(Brown 1971, Rosenzweig 1995). Contention has lasted for decades because of the
different ways that researchers employ ETIB. Detractors often test predictions of ETIB
based on natural history data (e.g., Gilbert 1980, Johnson and Simberloff 1974, Bush and
Whittaker 1991) and discredit the theory because data fail to conform to predictions.

142
However, the failure of these tests should not be surprising given the simplicity of the
theory and the complexity of natural systems (Sismondo 2000). A different perspective
(Haila and Järvinen 1982) views ETIB as a heuristic model that provides opportunities to
explore patterns rather than as a suite of hypotheses to falsify.
Although the ETIB has been applied to a multitude of taxa, few investigations
have focused on ectoparasite assemblages. In evolutionary studies, the focus often is on a
single ectoparasite species and its co-evolutionary relationship with a host and not the
community or assemblage. I use ETIB as a model for understanding host characteristics
that determine community structure of arthropod ectoparasite assemblages on chiropteran
hosts.
Bats and Their Ectoparasites as Model Systems
Generally, bats come in contact with few non-bats, thereby isolating bat
ectoparasites from potential non-bat hosts. In addition, bat species rarely come into
contact with each other, except in multispecific colonies, which usually contain species
from the same family (Kunz 1982), restricting potential inter-specific host transfer of
ectoparasites to members of the same host family. Finally, with the exception of colonial
species, individual bats may be in contact with conspecifics only during periods of
mating and rearing, reducing opportunities for ectoparasite transfer among individuals.
Prolonged periods of host isolation in solitary bat species may increase the likelihood of
local extinction of ectoparasites on the host.
Four host characteristics affect parasite species richness within the context of
ETIB (Kuris et al. 1980): 1) host size, 2) host age, 3) habitat complexity (often correlated
with host age or size), and 4) distance to potential sources of infestation. Host size, and
its relationship to habitat complexity, is evaluated in this chapter, whereas host
population density is considered in chapter IV. Because bats essentially reach adult size
in a few (4 – 7) months (Barclay and Harder 2003), which is only a small fraction of
average life expectancy of bats (11 – 15 years), the effect of size and age can be de-
coupled. This is not possible in work on ectoparasites of fishes (Kennedy 1978a, 1978b,

143
Newbound and Knott 1999), because these hosts exhibit indeterminate growth.
Moreover, bats have long life expectancies compared to animals of similar size (Barclay
and Harder 2003). Such long life may provide ectoparasite assemblages on individual
hosts with opportunities to experience processes similar to those on habitat or oceanic
islands (e.g., local extinction, colonization, rescue effect).
When considering individuals as islands, five aspects of host biology must be
addressed to accommodate traditional interpretations of ETIB (Kuris et al. 1980). First,
inter-island distances fluctuate over time. These fluctuations may occur over short time
frames for vagile hosts such as bats and may create only sporadic opportunities for
infestation. Although host individuals and species are like islands in being discrete and
easily identifiable units, they are not like islands in that the level of isolation is dynamic.
Indeed, considering hosts as islands is complicated because the distances among islands
are changing continually and some islands even make temporary physical contact.
Moreover, physical contact differs in frequency, regularity, and duration depending on
season, as well as host species identity, age, sex, and mating and social systems.
Second, seasonal changes in behavior or physiology may affect the presence of
parasites. Host behavior could have a significant effect on distance to source populations
for bat species that form maternity colonies as well as for those that hibernate
individually or in colonies. Conversely, physiological peculiarities of bats may expose
ectoparasites to phenomena similar to those experienced by inhabitants of temperate
islands. For example, daily changes in bat body temperature (from torpor to activity) are
analogous to daily fluctuations in ambient temperature. Similarly, seasonal changes in
bat body temperature related to hibernation in temperate species or to extended periods of
torpor in sub-tropical or tropical species are analogous to seasonal changes in climate that
are characteristic of temperate islands. Seasonal or daily changes in bat behavior do not
require modification of theory applied to oceanic islands.
Third, quality of the host island changes over ecological time as a result of growth
and aging. Host islands may change over much shorter time frames than do those that
characterize true islands; however, the effects of these changes with respect to invading

144
species are similar. Indeed, fewer complications arise due to age of hosts than due to
successional changes related to the age of islands On true islands, early colonizers may
facilitate invasion by other species, leading to a more predictable order of invasion and
community structure than may occur on host islands. Because all hosts, from birth to
death, are inhabitable islands for potential parasites, evaluations of ETIB for host-parasite
systems are not complicated by host (i.e., island) age.
Fourth, presence of certain parasites may affect characteristics of host islands,
including survival. Characteristics of true islands change with the presence of every
species, either enhancing or diminishing the chance of other species establishing
populations on the island. Still, it is difficult to imagine a scenario where an invading
species would cause the “death” of an island. Furthermore, it is unlikely that the
presence of ectoparasite species commonly facilitates the infestation of others.
Fortunately, little evidence suggests that species ectoparasitic on bats have deleterious
effects on their hosts as to commonly cause death of an otherwise healthy individual.
Indeed, bat host survival is affected marginally by ectoparasite load, although energy
demands may be significantly increased by heavy ectoparasite loads (Marshall 1982).
Nonetheless, all hosts die. How death of an island affects evaluations of ETIB in host-
parasite systems is unclear.
Finally, Kuris et al. (1980) consider hosts to be sufficiently ephemeral to prevent
parasite assemblages from reaching equilibrium. Nonetheless, bats have remarkably long
life spans, with species documented to live 20 years or longer (Barclay and Harder 2003).
Because the life-span of most ectoparasite species is only a few months, bat hosts may be
sufficiently long-lived as to support equilibrial assemblages.
In summary, the only characteristic of bats that may require significant
modification of ETIB for application to ectoparasite assemblages is the potential for
distance from sources to fluctuate quickly and with varying frequency and regularity.
Whereas ectoparasite residency was considered the host individual from which it was
collected, it is possible that individuals residing on one host communicate with other
hosts via direct invasion or the dispersal of offspring, especially species that are vagile

145
and regularly leave the host (e.g., streblids). As such, extinction (i.e., no ectoparasites on
a host individual) and extinction rates, which are fundamental to the equilibrium theory
of island biogeography, may be difficult to define. This is also true of highly interactive
islands (Coleman et al. 1982), such as archipelagos in which mobile members of biotas
move among islands on a daily or monthly basis.
A Host Is an Island, Entire of Itself
Islands have large adaptive radiations of species and high levels of in situ
diversification compared to mainland communities (Paulay 1994). Bat ectoparasite
assemblages exhibit both of these island characteristics, implying that they may have
evolved as isolated evolutionary units. Ectoparasite faunas of mammalian hosts contain
relatively few species, many of which are monoxenous (i.e., occur on only one host
species), indicating evolution of ectoparasite species on the host island (i.e., in situ
diversification). In addition, many ectoparasite families contain hundreds of species, but
all are restricted to a single family of host, indicating relatively recent and large adaptive
radiations. Together, these observations are evidence, albeit circumstantial, that
ectoparasite faunas on bat hosts experience similar ecological and evolutionary
mechanisms to those of biotas on true islands.
Limiting Factors
The most important factor inhibiting ectoparasites from interspecific host transfer
is physical isolation (Kuris et al. 1980, Marshall 1971, 1982, Wenzel and Tipton 1966).
Indeed, many ectoparasite species have virtually no chance to move to another host
species because direct body contact likely is rare between host species. Moreover,
survival away from the host is brief (< 1 day for most bat ectoparasites). Hence, even
ectoparasites that do not require direct body contact of hosts for transfer would have only
brief windows of opportunity to infest alternative host species. When opportunities for
infestation do exist, many factors inhibit successful infestation (i.e., survival and
reproduction) of new host species. In experimental transfers of ectoparasitic insects to

146
non-primary bat host species, nycteribiids starved and bat flies fell victim to predation by
hosts (Marshall 1971, 1982). Often, ectoparasites even find potential host species that are
closely related to their typical host to be unsuitable. Two sets of ideas account for these
observations. First, ectoparasites have specialized adaptations for life on their host and
these may be unsuitable on other host species. More specifically, claws may be
unsuitable for attachment, or body form, setae, and combs may be inappropriate for
movement through hair. Failure to match proper morphological adaptations to the
microhabitat will enhance exposure to predation. Second, parasites may starve because
their mouthparts are unsuitable for feeding or the host’s blood may be inadequate
nutritionally (Marshall 1982).
I used host (i.e., bat) morphology and ecology to explore questions about
biodiversity of ectoparasite assemblages within the framework of the ETIB. A suite of
analyses was designed to determine: 1) the number of ectoparasites that inhabit a host
individual of a particular size and 2) the diversity (e.g., measures of richness, evenness,
dominance) of the ectoparasite assemblage that inhabits a host individual of particular
size.
Materials and Methods
Field Methods
Mammals and their associated ectoparasites were collected from July 1995 to
June 1997, and again from July to August in 1998, as part of a scientific expedition
entitled “Paraguayan Mammals and Their Ectoparasites: an Intensive Survey in a
Temperate-Subtropical Interface” (Willig et al. 2000). Bats were surveyed at 28 sites
(Table A.1), representing all major biomes, including many protected areas, and spanning
gradients of moisture and temperature in Paraguay (Figure 2.1). Because of the potential
importance of the Río Paraguay as a biogeographic barrier (Myers 1982), approximately
one-half of the sites were on each side (east or west) of the river. In general, mist nets
were erected in all habitats at a site and were monitored from dusk until 0100 h. Much of
the time, nets were monitored until dawn. Rates of capture for bats in the field depend on

147
a variety of factors including net characteristics (e.g., mesh size, length, condition,
placement, configuration), temporal factors (e.g., length of time, particular hours of the
night, period in the lunar cycle; Gannon and Willig 1997), local weather conditions
(especially with respect to temperature and precipitation), and history (i.e., number of
consecutive nights at a site; Simmons and Voss 1998). Captured bats were sacrificed and
prepared as standard museum specimens. Specific bat identification was initiated in the
field but verified after comparison with systematic reference materials by C. López-
González (López-González 1998, 2005).
Host and Parasite Systematics
The systematic recommendations of López-González (1998, 2005) were followed
for bat taxa in Paraguay. Ectoparasites were identified using the most recent,
comprehensive information about South American representatives for each family
including Wenzel (1976) and Wenzel et al. (1966) for the Streblidae; Guimarães (1966,
1972) for the Nycteribiidae; Ueshima (1972), Ferris and Usinger (1939, 1945), and
Ronderos (1959, 1962) for the Polyctenidae; Rudnick (1960), Machado-Allison (1965),
and Herrin and Tipton (1975) for the Spinturnicidae; Radovsky (1967) and Saunders
(1975) for the Macronyssidae; Dusbábek (1969a, 1969b) and Fain (1978) for the
Myobiidae; Jones et al. (1972) and Fairchild et al. (1966) for the Ixodidae and Argasidae;
Reed and Brennan (1975), Brennan and Reed (1974, 1975), Brennan and Yunker (1966),
and Brennan and Goff (1977) for the Trombiculidae; McDaniel (1970, 1973),
Pinichpongse (1963a, 1963b, 1963c, 1963d), de la Cruz (1969) and Dusbábek and de la
Cruz (1966) for the Chirodiscidae. Details about field and laboratory methods appear in
chapter II.
At the individual level, I used host body size as a surrogate for island area.
Because of the exploratory nature of these analyses and differences in body and wing
shapes among host species, especially those in different families, host mass (MA) and
forearm length (FA) were used to estimate host body size. All analyses in this chapter
consider host individuals to be “islands.”

148
Host-parasite associations with an incidence > 0.05 were considered primary,
with hosts and parasites of these associations referred to as primary hosts and primary
ectoparasites, respectively. An exception to this rule was made for small mite taxa (e.g.,
Myobiidae, Chirodiscidae, Trombiculidae) that were rare on all host species. The host on
which these parasites most often were found was considered to be the primary
association.
Statistical Methods
Analysis of Ectoparasite Abundance. To evaluate the effect of host body size on
ectoparasite abundance, analyses were performed at multiple taxonomic levels within the
context of ectoparasites and of hosts. For each host individual, three levels of
ectoparasite abundance were calculated: 1) total number of ectoparasites, 2) number of
ectoparasites for each ectoparasite family, and 3) number of ectoparasites for each
ectoparasite species. These three levels of ectoparasite abundance were evaluated with
respect to each of three distinct host pools: 1) all host individuals, 2) host individuals for
a particular family, and 3) host individuals for each of the 22 host species that had > 25
individuals inspected for ectoparasites. Desmodus rotundus, Glossophaga soricina, and
Pygoderma bilabiatum were not analyzed beyond the level of total ectoparasite
abundance, despite more than 50 captures each, because each taxon had low ectoparasite
abundances per host individual. Within host families or species, analyses were
performed only for those ectoparasite families or species that have primary relationships
with the particular host group. For example, streblid abundance was analyzed for the
Noctilionidae and both species of Noctilio, but not for any vespertilionids because in
Paraguay, vespertilionids are not primary hosts for streblids. In cases where host size
significantly affected ectoparasite abundance among individuals within a host species, the
observed relationship could have resulted from a variety of host-related factors including,
but not limited to, sexual dimorphism, age, or body size. In addition to size measures,
data on the sex of each host individual were available, whereas host age was unknown.
To better determine host characteristics that lead to differences in ectoparasite load, I

149
employed a multivariate analysis of variance (MANOVA) to determine if sexual size
dimorphism (using MA and FA) existed for a particular host species and an analysis of
covariance (ANCOVA) to evaluate the effect of sex on ectoparasite abundance, while
accounting for sex-related differences in size. In the ANCOVAs, ectoparasite abundance
was the dependent variable, sex the treatment factor, and FA and MA the covariates.
Bat ectoparasites have relatively strict host associations at multiple taxonomic
levels. Therefore, multiple levels of analysis, from the perspective of both the host and
ectoparasite, were necessary to provide a comprehensive assessment of the role of host
size on the structure of ectoparasite communities. Although such detailed analyses may
seem redundant, they elucidate ecological and evolutionary factors that may go unnoticed
with more simple analytical designs.
Analysis of Ectoparasite Biodiversity. A suite of analyses evaluated the effect of
host body size on biodiversity of ectoparasites. Biodiversity comprises a variety of
attributes (Brower et al. 1990, Peet 1974): diversity, richness, evenness, dominance, and
rarity (Table 3.1). These evince various degrees of correlation and are each estimated by
a number of metrics (Camargo 1993, 1995, Magurran 1988, May 1975, Southwood
1978).
Four indices estimated richness. MeanS was defined as the average ectoparasite
richness on host individuals of a particular host species. Accumulative S (AccumS) was
defined as the total number of ectoparasite species found on all individuals of a particular
host species. Chao1 is an abundance-based estimate of cumulative species richness
(Chao 1984) calculated using EstimateS (Colwell 2001). LogS was calculated using
Matlab ver. 4.2c.1 for the Macintosh (The Math Works, Inc. 1994; script files available
from the author, Appendix E) as an alternative abundance-based cumulative estimate of
richness. This function used a jackknife sampling regime to produce a mean species-
accumulation curve from 1000 random permutations of individuals based on the
ectoparasite species-abundance distribution (SAD) from a particular host species. In each
iteration, individuals were ordered randomly and sampled without replacement. An
iterative process was used to determine the best-fit logistic curve to the mean species-
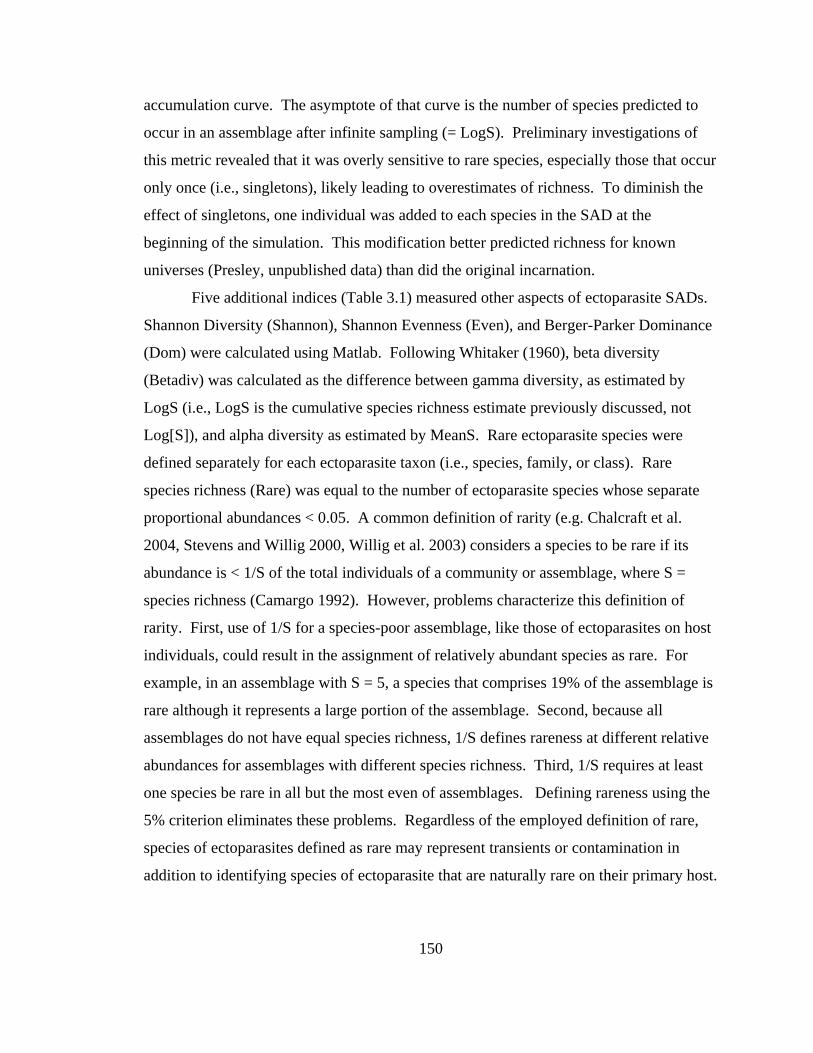
150
accumulation curve. The asymptote of that curve is the number of species predicted to
occur in an assemblage after infinite sampling (= LogS). Preliminary investigations of
this metric revealed that it was overly sensitive to rare species, especially those that occur
only once (i.e., singletons), likely leading to overestimates of richness. To diminish the
effect of singletons, one individual was added to each species in the SAD at the
beginning of the simulation. This modification better predicted richness for known
universes (Presley, unpublished data) than did the original incarnation.
Five additional indices (Table 3.1) measured other aspects of ectoparasite SADs.
Shannon Diversity (Shannon), Shannon Evenness (Even), and Berger-Parker Dominance
(Dom) were calculated using Matlab. Following Whitaker (1960), beta diversity
(Betadiv) was calculated as the difference between gamma diversity, as estimated by
LogS (i.e., LogS is the cumulative species richness estimate previously discussed, not
Log[S]), and alpha diversity as estimated by MeanS. Rare ectoparasite species were
defined separately for each ectoparasite taxon (i.e., species, family, or class). Rare
species richness (Rare) was equal to the number of ectoparasite species whose separate
proportional abundances < 0.05. A common definition of rarity (e.g. Chalcraft et al.
2004, Stevens and Willig 2000, Willig et al. 2003) considers a species to be rare if its
abundance is < 1/S of the total individuals of a community or assemblage, where S =
species richness (Camargo 1992). However, problems characterize this definition of
rarity. First, use of 1/S for a species-poor assemblage, like those of ectoparasites on host
individuals, could result in the assignment of relatively abundant species as rare. For
example, in an assemblage with S = 5, a species that comprises 19% of the assemblage is
rare although it represents a large portion of the assemblage. Second, because all
assemblages do not have equal species richness, 1/S defines rareness at different relative
abundances for assemblages with different species richness. Third, 1/S requires at least
one species be rare in all but the most even of assemblages. Defining rareness using the
5% criterion eliminates these problems. Regardless of the employed definition of rare,
species of ectoparasites defined as rare may represent transients or contamination in
addition to identifying species of ectoparasite that are naturally rare on their primary host.

151
Simple linear regressions quantified the effect of host body size on each of these
nine indices of biodiversity. Analyses were performed for all bats, as well as for
molossids, phyllostomids, and vespertilionids, separately. Unless otherwise stated,
regression analyses, MANOVAs, and ANCOVAs for all experiments were conducted
using SPSS 4.0 for the Macintosh (SPSS, Inc. 1990).
An ongoing debate characterizes the ecological literature on the use of methods to
maintain type I error rate at a reasonable level for suites of analyses (Hurlbert 2003,
Moran 2003). Chief among the misconceptions that lead to the idea of a need to account
for multiple tests is the view that every test increases overall likelihood of a Type I error.
In actuality, the likelihood of such an error only increases in instances for which the null
hypothesis is rejected (Hurlbert 2003). The Bonferroni sequential adjustment (BSA) is a
common method used to maintain experiment-wise error rate (EWER) at a
predetermined, albeit arbitrary, rate (i.e., alpha). However, this method is conservative
and leads to elevated type II error rates (i.e., failure to reject a null hypothesis that is
false). An alternate approach to the use of BSA is to present exact p-values and make
“reasonable” interpretations of results based on experimental design, differences in
treatment responses, and logic based on experience and scientific understanding (Moran
2003). Hurlbert (2003) stated, “Without knowing how many, if any, of the null
hypotheses being tested are true, it is not possible to calculate the probability of making
one or more Type I errors. For most investigations that probability is likely to be zero.”
Nonetheless, most statisticians and ecologists prefer to maintain EWER at a
predetermined level (i.e., alpha). Therefore, I applied BSA separately to each
independent variable (e.g., host forearm length and mass) in each suite of analyses (i.e.,
table of analyses) and included those results in each table. I was more concerned about
the consequences of ignoring results that could have biological implications than about
the potential for type I errors. Because of the exploratory nature of analyses, I interpreted
results before application of the BSA, with the understanding that a few significant
results contributing to the overall pattern in each discussion may represent type I errors.

152
In most cases, general patterns are the same, just not as strong, when EWER is
maintained at alpha (i.e., 0.05).
Results
Total Ectoparasite Abundance. In the analysis for all bat species as a group, total
ectoparasite abundance (TEA) did not respond significantly to body size (Table 3.2).
However, analyses restricted to phyllostomids and to molossids, the two most abundant
and species-rich families of Paraguayan bats, larger species of bat did harbor more
ectoparasites than did smaller species of bat. There was no effect of size at the familial
level for noctilionids or vespertilionids. At the level of host species, host size did not
affect TEA for 17 species. On two host species, Sturnira lilium and Molossus ater,
smaller bats had greater TEA, whereas on three host species, Artibeus fimbriatus, Myotis
albescens and Molossops temminckii, larger bats had greater TEA. Three of the host
species (S. lilium, M. albescens, and M. ater) for which body size affected TEA were
dimorphic (Table 3.3). When the effect of size was removed via ANCOVA, only S.
lilium had a significant relationship between sex and ectoparasite infestation, with males
harboring significantly fewer ectoparasites than did females (p = 0.008). That neither M.
albescens nor M. ater had significant effects of sex in ANCOVAs, and that A. fimbriatus
and M. temminckii were not sexually dimorphic, implies that the difference in
ectoparasite load between smaller and larger individuals of those species is size- and not
sex-related.
Familial Ectoparasite Abundance. For all bats as a group, the effect of host body
size on familial ectoparasite abundance (FEA) was significant in 17 of 24 analyses (Table
3.4). Significance reflected the body size of the primary host species of each ectoparasite
family, and not an effect of host size, per se. For example, the Streblidae occur mostly
on phyllostomids and noctilionids, which include most of the larger bat species in
Paraguay. Therefore, host size had a significant positive effect on streblid FEA.
Alternatively, nycteribiids occur on vespertilionids, and thus had a significant negative
response to host body size. Of the eight common ectoparasite families, only the

153
Polyctenidae did not have a significant response to host size. Nonetheless, large species
of Eumops (e.g., E. dabbenei, Table 2.35, and E. glaucinus, Table 2.36) had polyctenid
prevalences > 2.0, whereas other molossids had prevalences < 1.0 (Tables 2.39 – 2.47).
Spinturnicids occur mostly on phyllostomids and had a positive response to host body
size. Macronyssids inhabit small molossids and vespertilionids and had a negative
response to host body size. Argasids dwell mostly on noctilionids and had a positive
response to host body size.
For each host family, the effect of host body size on FEA was significant in 16 of
42 analyses (Table 3.4). Significance reflected the body size of the primary host species
of each ectoparasite family, and was not an effect of host size, per se. For example,
among phyllostomids, streblids were most abundant on Sturnira lilium, which is a
relatively small phyllostomid. Therefore, FEA evinced a significant negative response to
host size. Alternatively, for phyllostomids, spinturnicids occurred mostly on species of
Artibeus, which are among the largest and most common phyllostomids in Paraguay. As
a result, there was a significant positive response of spinturnicid FEA to phyllostomid
body size. FEA was not significant if ectoparasites occurred on all members of a host
family regardless of body size (e.g., macronyssids on molossids).
Body size affected FEA in eight host species (Noctilio albiventris, Artibeus
lituratus, Sturnira lilium, Myotis albescens, Myotis nigricans, Eumops patagonicus
Molossops temminckii, and Molossus molossus; Table 3.4). Three families of
ectoparasite on Sturnira lilium had significant responses to host body size, and two
families of ectoparasite on Myotis albescens had significant responses to host body size
(Table 3.4). Of those host species with at least one significant response of FEA to body
size, males were larger than females in Noctilio albiventris, Sturnira lilium, and Molossus
molossus, whereas females were larger than males in Artibeus lituratus, Myotis
albescens, and Myotis nigricans. Eumops patagonicus and Molossops temminckii were
not dimorphic (Table 3.3). Quite unexpectedly, in six of 11 cases, smaller bats had
significantly greater ectoparasite abundances than did larger bats. In instances where
more ectoparasites were found on larger bats, sex was not significant (i.e., larger bats,

154
regardless of sex, possessed higher ectoparasite abundances). Where smaller bats had
greater ectoparasite loads, female hosts generally were significantly smaller than males.
On Noctilio albiventris, ecological interactions between two ectoparasite families appear
to have resulted in one family occurring in greater abundance on females and the other on
males (see chapter II).
ANCOVA Results for FEA. Four host species evinced significant effects of host
sex on FEA while accounting for host size (Table 3.5). Streblids occurred on female
Noctilio albiventris at densities twice that found on males, whereas ticks occurred on
males at densities three times that on females. Macronyssids and spinturnicids were more
abundant on female Artibeus fimbriatus and female A. lituratus, respectively, than on
males of corresponding species. Similarly, female Lasiurus ega harbored more
macronyssids than did males.
Specific Ectoparasite Abundance. For all bats as a group, the effect of host body
size on specific ectoparasite abundance (SEA) was significant in 68 of 84 analyses (Table
3.6). If the primary host species of an ectoparasite species was smaller than 30 g, host
body size had a significant negative effect on SEA. Alternatively, if the primary host
species was larger than 30 g, host body size had a significant positive effect. However,
significance in these analyses reflected the body size of the primary host species of each
ectoparasite species and was not a response of ectoparasite abundance to host body size,
per se.
Analyses of the effects of host body size on SEA that included all host species
within particular host families were nearly all significant, with the direction (negative or
positive) of the response indicating the body size of the primary host species of each
ectoparasite species (i.e., negative responses indicate smaller hosts and positive responses
indicate larger hosts). Results for SEA at the specific host level mirrored those of FEA,
and identified the particular ectoparasite species that was responsible for relationships at
the level of FEA. For example, FEA of streblids on Artibeus lituratus had a significant
positive response. Paratrichobius longicrus, which had a significant positive response to

155
host body size at the SEA level, likely is the principle species responsible for the
differences in streblid abundances on A. lituratus.
ANCOVA Results for SEA. Host sex affected SEA of 13 ectoparasite species on
nine host species while accounting for host size (Table 3.7). In 11 of 13 cases, females
harbored significantly more ectoparasites than did males. Two cases represent possible
resource partitioning of hosts by ectoparasite species or competitive exclusion. Tick
(Ornithodoros hasei) abundances on male Noctilio albiventris averaged more than three
times that of females. In contrast, abundance of Paradyschiria parvula on female N.
albiventris was more than twice that of males. Myotis nigricans is primary host to two
species of macronyssid, Macronyssus crosbyi and Steatonyssus joaquimi. However, M.
crosbyi occurred almost exclusively on female M. nigricans, whereas S. joaquimi
occurred almost exclusively on males.
Ectoparasite Biodiversity. For simple regression analyses of all bat species as a
group, average richness (MeanS) was the only metric of ectoparasite biodiversity that had
a significant response: larger bats exhibited higher MeanS than did smaller bats (Table
3.8). Within the Phyllostomidae, host size did not affect ectoparasite biodiversity (Table
3.8). Indeed, no analysis even approached significance. In analyses restricted to
vespertilionids, smaller bats had higher Shannon diversity than did larger bats.
Alternatively, larger vespertilionids had higher Berger-Parker dominance than did smaller
vespertilionids. These results reflect the greater biodiversity of ectoparasite assemblages
on Myotis than on either Lasiurus or Eptesicus. For molossids, host size significantly
affected MeanS, with larger bats having greater MeanS than did smaller bats (Table 3.8).
Multi-level analyses in this chapter introduce two forms of bias that require
consideration. Some analyses (i.e., those for all host species as a group) necessarily have
larger sample sizes than others (i.e., those that are taxonomically restricted to a particular
host family or species). Because statistical power is greater for analyses with larger
sample sizes, increases in sample size predispose analyses to be statistically significant.
For example, in analyses of the effect of host body size on FEA (Table 3.4), most
analyses for all bats as well as common families and species were significant, whereas

156
analyses of less abundant host species (i.e., those with smaller sample sizes were mostly
non-significant). Similarly, analyses of all host species as a group span a greater range of
host body sizes than does any taxonomically restricted analysis. Reduced variation in the
independent variable (i.e., body size) predisposes analyses to non-significance (e.g.,
analyses restricted to individual host species).
Discussion
Methodological Considerations
Mass (MA) and forearm length (FA) were chosen to estimate the effects of host
body size on ectoparasite abundance and diversity. Host body size reflects habitat area
available to ectoparasites. However, these measures (i.e., MA or FA) are not two
dimensional and do not have a linear relationship with area. In general, body surface area
should scale as MA2/3, and wing surface area as FA2; such transformations should induce
linear relationships between body and wing area and MA or FA, respectively (Emerson et
al. 1994). Nonetheless, such transformations may not improve (i.e., linearize) the
relationships between estimates of body size and ectoparasite abundance or biodiversity.
Bat body and wing shapes are complex and differ among species so that any general
transformation may not improve the ability of MA or FA to estimate body or wing
surface area. Moreover, that the relationships between length, area, and mass are positive
and monotonic may be sufficient to justify not transforming MA and FA into two
dimensional equivalents. Indeed, species-area curves have many forms including the
exponential, power, and logistic curves (Scheiner 2003). In general, species-area curves
are positive and monotonic, but non-linear (Scheiner 2003, Scheiner et al. 2000).
However, many species-area curves are linear in log-log space (Rosenzweig 1995).
Finally, visual inspection of the data revealed that diversity-body size plots were linear
and flat, or linear with a positive or negative slope. No plots suggested that a linear
model was inappropriate. Consequently, data were not transformed prior to analyses.

157
With no evidence of a more complex relationship between ectoparasite diversity and host
body size, I chose to use a linear model for its simplicity and ease of interpretation.
Effects of Host Size on Ectoparasite Biodiversity
Although analyses for all ectoparasite species regardless of host species showed
that larger bats harbor more ectoparasite individuals and species than do smaller bats,
these effects were weak (Tables 3.2 and 3.8). In fact, larger hosts within bat species did
not harbor more ectoparasite individuals or species than did smaller hosts. Significance
arose because larger host species harbored more ectoparasite individuals and species
(Tables 3.2 and 3.8) than did smaller host species. Greater surface area on larger host
species may allow larger populations of ectoparasites to live on a single host. Moreover,
larger host individuals may provide opportunities for greater niche partitioning among
ectoparasite species, thereby leading to greater ectoparasite richness. The data support
these interpretations when comparing ectoparasite assemblages among bat species.
If larger host individuals within a host species harbor greater ectoparasite loads
(i.e., greater ectoparasite abundance) by providing more habitat, all significant responses
of ectoparasite abundance to host body size should be positive. However, more than half
of significant responses were negative (i.e., smaller hosts had significantly greater
ectoparasites abundances than did larger hosts). Therefore, within the context of ETIB,
increases in host size (i.e., island size) do not lead to increases in ectoparasite abundance
that would reduce extinction rates, and may not be the most important host character in
determining ectoparasite abundance within a host species. Females were larger in most
host species in which larger hosts had greater ectoparasite abundances and were smaller
in all host species in which smaller hosts had greater ectoparasite abundance. This
suggests that size captures sex-specific differences in host quality or behavior that affect
ectoparasite abundance and diversity, and that females are preferred hosts regardless of
host body size.
When considering all Paraguayan bats as a group, larger host individuals had
greater ectoparasite average richness (MeanS) than did smaller individuals. Four of the

158
largest common species of bat (i.e., Noctilio albiventris, N. leporinus, Artibeus
fimbriatus, and A. jamaicensis) were the only taxa to average > 2.0 ectoparasite species
per individual. Larger bats provide more surface area (i.e., habitat) for ectoparasites.
Increased surface area of host individuals may affect MeanS in two ways. First,
increased surface area allows for increased population sizes, thereby reducing the
probability of stochastic extinction. Second, greater host body size may relax
interspecific competition and allow more ectoparasite species to maintain sufficient
population sizes to avoid local extinction.
Within the Vespertilionidae, ectoparasite assemblages of smaller bat species (i.e.,
Myotis) have greater Shannon diversity and lesser Berger-Parker dominance (Table 3.8)
than do those of larger vespertilionids (i.e., Eptesicus and Lasiurus). Myotis were
captured more often than were other vespertilionids. If capture rates for vespertilionid
species are an adequate measure of relative abundance, larger population sizes of Myotis
may permit smaller host species to harbor more diverse ectoparasite assemblages than do
larger host species with similar morphology and ecology.
Effects of Host Ecology on Ectoparasite Biodiversity
Ecology, morphology, life history, and behavior of mammalian hosts interact to
influence structure of parasite assemblages (Altizer et al. 2003). Because of their strong
correlation, disentangling the effects of host body size, demographics, phylogeny, and
social organization is complex. In addition, sampling deficiencies and contamination can
confound attempts to understand patterns of ectoparasite abundance and diversity. Verily,
a myriad of factors (e.g., host evolutionary age, host roosting ecology) may provide
insights regarding patterns of ectoparasite diversity. The effects of habitat area (i.e.,
patagial area, trunk surface area) as estimated by host mass and forearm length on
ectoparasite abundance and diversity were difficult to interpret. In analyses for all bats as
a group or for all bats of a particular host family, host specificity obfuscates potential
effects of body size. In analyses within host species, host body size is less important than

159
other host-related characteristics (e.g., sex, age, mating system) that may affect
ectoparasite abundance or diversity.
The majority of investigations concerning factors that affect assemblage structure
of ectoparasites has focused on birds. A number of studies document the effects of host
size on abundance and diversity of ectoparasite assemblages. Although swallow mass
had no effect on ectoparasite assemblage biodiversity, group-living species evinced
greater mite prevalence compared to solitary species (Poulin 1991). Similarly, swift mass
had no effect on lice density or richness (Lee and Clayton 1995), and host mass had no
effect on tick densities in birds of New Guinea (Pruett-Jones and Pruett-Jones 1991). In
a detailed study of four species of seabirds (Choe and Kim 1987), kittiwakes harbored
more diverse ectoparasite assemblages (i.e., greater richness and evenness) than did
murres. Kittiwakes are larger than are murres; wings of kittiwakes have 40% more wing
surface area than do those of murres. Nonetheless, differences in ectoparasite diversity
were more a consequence of host nesting, foraging, and migratory behavior than of host
size. For example, kittiwakes build nests whereas murres nest on bare rock. This allows
parasites that require nest habitat for part of their life cycle to infest kittiwakes but not
murres. In addition, murres are under water feeders that dive to depths of 60 m, whereas
kittiwakes feed at the water’s surface. Therefore, murre ectoparasites must be adapted to
underwater situations. Such demands may affect ectoparasite persistence on murres.
Moreover, differences in migratory activity (i.e., black-legged kittiwakes migrate over the
Bering Sea whereas red-legged kittiwakes are sedentary) may account for the more
diverse ectoparasite fauna on the migratory species. Migration can expose birds to
diverse parasite faunal pools, resulting in increased parasite richness. Two salient
features characterize all of these studies, including this one. First, the effect of host size
on ectoparasite assemblage structure is weak or non-existent. Second, host ecology, life
history, demography, and behavior may be more important in structuring ectoparasite
assemblages than is host body size. This observation is consistent with those for bat
ectoparasites.

160
Successful species (i.e., those that are common and widespread), whether free-
living or parasitic, avail themselves of abundant and reliable resources. For ectoparasites,
measuring resource reliability is difficult because the host is not killed and therefore is
constantly “available”. In addition, the host is longer lived than the ectoparasite, so once
a host is located, one need not be found again for a number of ectoparasite generations.
However, space on the host is limited. Therefore, location of new resources (i.e., other
host individuals or species) for dispersal of offspring is of utmost importance. The social
structure and mating system of host species determine the opportunities for horizontal
(i.e., interspecific) or vertical (i.e., intraspecific) host transfer. In most bat social systems,
all host individuals do not provide equal transfer opportunities. Therefore, ectoparasites
should select those hosts with the greatest prospects for reliable host transfer. Many bat
ectoparasites require bodily contact of hosts to achieve transfer. However, even those
ectoparasites that are vagile (e.g., streblids) can exist without feeding for only several
hours. Thus, host transfer that does not involve body contact is risky for all bat
ectoparasites. A common social and mating system in Neotropical phyllostomids and
noctilionids is the harem, which usually consists of one adult male, several adult females,
and their young. Similarly, female Myotis form maternity colonies that are nearly devoid
of males (Humphrey and Cope, 1976). In Paraguay, Myotis and Eptesicus have two
breeding seasons; therefore, maternity colonies may be maintained much of the year
(Myers 1976). Based on transmission opportunities, female bats in harems or maternity
colonies should be preferred by ectoparasites; adult male bats should be sub-optimal
hosts; and sub-adult male bats (usually solitary) should be least desirable. Analyses
showed 11 species of Paraguayan bat to be sexually dimorphic (Table 3.3) with males
larger in five cases and females larger in six cases. Nonetheless, while accounting for
sex-related differences in body size, females harbored more ectoparasites in 11 of 13
instances where ectoparasite abundance responded significantly to host sex (Table 3.7).
The remaining two cases in which males harbored greater ectoparasite abundances than
did females may involve interspecific competition among the ectoparasites. In the first
case, a tick, Ornithodoros hasei, was three times more abundant on male Noctilio

161
albiventris than on females, whereas a bat fly, Paradyschiria parvula, was two times
more abundant on female N. albiventris than on males. In the second case, Steatonyssus
joaquimi was more abundant on male Myotis nigricans than on females, whereas
Macronyssus crosbyi was more abundant on female M. nigricans than on males. These
two cases may represent (resource) partitioning of the by ectoparasites to reduce
competition.
Results of the FEA analysis for streblids on N. albiventris contradict the above
scenario (Table 3.5). Male N. albiventris are larger than females, and harbor half as
many streblids as do females. However, streblids are significantly more abundant on
larger than on smaller N. albiventris. In addition to being abundant on female N.
albiventris, streblids are abundant on larger adult males, which likely have harems. This
is additional support for the hypothesis that the social status of a host is important to host
selection by ectoparasites.
In general, migratory and hibernation activities, as well as mating systems and
roosting ecology, are potential factors that affect ectoparasite assemblage structure. For
example, bats that hibernate effectively eliminate ectoparasite species incapable of
enduring prolonged cold temperatures, thereby reducing ectoparasite diversity. In
contrast, migrations may expose bats to a greater diversity of bat species in multispecific
roosts, which increases opportunities for invasion by new ectoparasite species. Bats
exhibit social systems that can be classified broadly as colonial or solitary. Because
colonial bats frequently make physical contact with one another, ectoparasite species that
have gone extinct on host individuals may subsequently reestablish populations on those
individuals. Therefore, greater ectoparasite richness and abundance should result from
rescue effects (Brown and Kodric-Brown 1977) in which continual reestablishment of
ectoparasite populations enhance biodiversity of colonial hosts (Altizer et al. 2003).
Moreover, colonial bats are more faithful to roosts and use more permanent structures
(e.g., buildings, caves, tree cavities) than do solitary bats (Kunz and Lumsden 2003).
Reliable use of roosts by bats enhances the likelihood that ectoparasite species that make
use of roosts during part of their life cycle successfully find a host. Any aspect of roost

162
ecology that enhances host availability will result in increased ectoparasite diversity and
abundance. Whereas roost type may be responsible for differences in ectoparasite
assemblage structure between host species, mating systems can affect host selection of
ectoparasites within host species. Individuals that are not part of a harem are usually
juvenile or adult bachelor males (Ortega and Arita 1999). Harem members are more
roost faithful than are non-harem bats (Kunz et al. 1983, Ortega and Arita 1999). Roost
fidelity is important for ectoparasite reproductive success, as well as for host infestation
or vertical transmission (i.e., between hosts of the same species). Adult females usually
are found in harems, and therefore have desirable host characteristics compared to
solitary bats. Consequently, adult females should be preferred to other host individuals
of the same species. These arguments may be extended to compare host species with
different mating systems. For example, colonial host species may harbor more diverse
and abundant ectoparasite assemblages than do solitary bat species (Altizer et al. 2003).
Of those bat species for which ectoparasite abundances varied with host body
size, Sturnira lilium presents one of the most interesting cases. The three most common
species of ectoparasites of S. lilium are more abundant on females than on males (Tables
3.4 and 3.6). This implies a difference between males and females that make the latter
more desirable hosts. Because male S. lilium are significantly larger than females,
selective advantages associated with female hosts must be strong enough to overcome
potential benefits of greater body size in males. Differences in roosting ecology may
make females more reliable hosts. Unfortunately, little is known about the roosting
ecology or mating system of S. lilium (Gannon et al. 1989, Kunz 1982, Kunz and
Lumsden 2003, McCracken and Wilkinson 2000). However, male S. lilium have potent
scent glands on their shoulders that emit a strong odor (Altringham and Fenton 2003,
Gannon et al. 1989). In addition, Altringham and Fenton (2003) reported “wing flapping
associated with calling” in males that may serve as a visual cue to females in addition to
dispersing glandular secretions. These secretions probably serve as a means for females
to evaluate potential mates and for males to evaluate potential competitors. In Paraguay,
S. lilium use buildings and tree hollows for roosts when caves are not available (Gannon

163
et al. 1989). Harems could be established in any of these structures. Because harem
members are more site-faithful than are solitary bats (Kunz and Lumsden 2003, Kunz and
McCracken 1996, Morrison 1979, Ortega and Arita 1999), harems provide ectoparasites
with opportunities for dispersal to other host individuals and furnish a reliable source
pool for ectoparasite species that are not permanent host residents (e.g., streblids). If
male S. lilium are effectively solitary, whereas females are colonial, preferential selection
of female hosts by ectoparasites explains how smaller hosts (i.e., females) have more
ectoparasite species and individuals than do larger hosts (i.e., males).
A similar scenario has been documented for Desmodus rotundus in Costa Rica
(Wilkinson 1985). Colony size was a significant factor in the number of Trichobius
found on Desmodus. Larger host groups had higher ectoparasite densities and
prevalences than did smaller groups.
Species Rich, Species Poor
In general, ectoparasite families are species-rich because most ectoparasite
species are monoxenous and close host-parasite associations result in specialization and
speciation. In contrast, ectoparasite assemblages on individual bats are species poor with
average ectoparasite species richness on Paraguayan bat species ranging from 0.23 to 2.5
species per individual. Reasons are two-fold. First, many obstacles prevent infestation of
new host species. Second, ectoparasites may be particularly susceptible to extinction.
Infestation of new host species is difficult for ectoparasites of bats. Bat
ectoparasites experience various levels of physical isolation from hosts (see introduction
above) that limit opportunities for transient associations that can become, over
evolutionary time, primary associations. The effect of physical isolation is amplified
because most bat ectoparasites survive less than two days without feeding. When
ectoparasites infest a new host species (i.e., horizontal transfer), physical limitations
related to specializations for life on their primary host species often result in death by
starvation or host predation. Moreover, priority effects (Paine 1977) exist when transient

164
ectoparasites must compete with established ectoparasite species that likely are better
adapted to survive on the newly infested host species.
Particular demographic and life history traits make some species more prone to
extinction than others. Species that naturally occur at low abundances, with a high
degree of specialization, are large-bodied, have small or fragmented geographic
distributions, or occupy high trophic levels are more subject to extinction than common,
generalist, wide-ranging, or small-bodied counterparts (Davies et al. 2000, 2004, Fagan et
al. 2002). Ectoparasites of bats possess many of the qualities that make them susceptible
to extinction (locally or globally). In general, they occur at low abundances, are ultimate
specialists, and occupy high trophic levels (i.e., secondary or tertiary consumers). In
addition, geographic ranges of ectoparasites are dependent on those of their host (i.e.,
they may be small or fragmented).
Successful horizontal transfer (i.e., transfers that result in formation of viable
ectoparasite populations on newly infested host species), the proverbial “foot in the
door”, likely is the greatest obstacle to establishing new primary host-parasite
associations. Any aspect of host biology that facilitates initial infestation or relaxes the
demanding conditions of life on an unfamiliar host could lead to greater ectoparasite
diversity on a particular host species. For example, colonial species of hosts, by
occurring in large aggregates, may provide more favorable conditions for new infestation
than would solitary roosting host species. In addition, large colonies are more roost
faithful than are smaller colonies or solitary bats. Hosts that consistently return to the
same roost provide ectoparasites that are not highly specialized (i.e., adapted to spend
their entire life on the host) a greater opportunity to form new associations, which may
lead to adaptation and speciation. To spend their entire life on a host requires extensive
specialization by an ectoparasite. Such specialization limits the ability of ectoparasites to
infest new host species that are not closely related to their primary host. Indeed,
extensive specialization by some ectoparasite species has made hosts that are closely
related to their primary host species (i.e., members of the same genus) unsuitable
alternatives.

165
Conclusions
The use of body size as a surrogate for island area in the context of ETIB is
practical and seems reasonable. However, the range of body sizes for bats of Paraguay is
relatively small, spanning only one order of magnitude, compared to traditional islands
which span several orders of magnitude and that have been the subject of biogeographic
analysis. The range of body sizes in bats may not be great enough to allow the
mechanisms associated with ETIB to operate at a detectible level. If a similar study were
conducted with respect to all Paraguayan mammal species, for which the range of body
sizes spans five orders of magnitude, body size might emerge as a more important
determinant of ectoparasite diversity. Such dependence on scale or hierarchy is common
in ecological studies of biodiversity (Scheiner et al. 2000, Willig et al. 2003).
Alternatively, sex-related differences in behavior, particularly roosting habits, may be a
more important factor for predicting ectoparasite diversity than is host size, per se.
Because bats are small and do not provide unlimited space for population growth,
opportunities for transfer are important. Therefore, host individuals may not be the most
appropriate scale to consider ectoparasite assemblages to be isolated evolutionary units.
Nonetheless, ectoparasite assemblages on groups of host individuals (i.e., colonies or
populations) may be evolutionarily isolated and better conform to predictions of ETIB.
In this context, bat colony size may be a realistic surrogate for island area.
Correspondingly, inter-colony distance may be an appropriate measure of distance to a
source population. Some patterns (e.g., increased nycteribiid abundance on smaller
vespertilionids) observed here are not adequately explained by either host size or social
system. These cases may be better explained by investigating differences in host
abundances. The effect of host abundance on ectoparasite abundance and diversity is
explored in the following chapter.
Ectoparasite assemblages on bats have many qualities that make them attractive
systems for study: 1) hosts are easily defined units of study, 2) each host individual
harbors an assemblage of ectoparasites, 3) many bat species are common so many

166
replicate samples are available, and 4) bats are species-rich and differ in morphology,
ecology, and behavior, facilitating analysis of the effects of hosts on ectoparasite
assemblages. In addition, a host and its ectoparasites appear to constitute a simple system
that is ideal for study. However, many ectoparasites of bats are host specific and may
respond to variables at multiple scales (e.g., within host species, among host species).
Moreover, ectoparasites and hosts often have congruent phylogenies which may
complicate interpretation of analyses (Brooks and McLennan 1993). The detailed
analyses employed here elucidated responses of ectoparasites to host characters at
multiple scales and provided evidence that may explain why some host individuals have
more diverse ectoparasite assemblages than do others (e.g., harem members versus non-
harem members). In addition, by analyzing ectoparasite assemblages at multiple scales
of host taxonomy, it became evident that at one focal scale (i.e., all host species as a
group) body size is an important determinant of ectoparasite biodiversity, whereas at
another scale (i.e., all host individuals within a particular species) ectoparasite
biodiversity may be more affected by elements of host ecology (e.g., roosting behavior)
than by host body size.

167
Literature Cited
Altizer, S., C. L. Nunn, P. H. Thrall, J. L. Gittleman, J. Antonovics, A. A. Cunningham, A. P. Dobson, V. Ezenwa, K. E. Jones, A. B. Pedersen, M. Poss, and J. R. C. Pulliam. 2003. Social organization and parasite risk in mammals: integrating theory and empirical studies. Annual Review of Ecology, Evolution and Systematics 34:417-547.
Altringham, J. D., and M. B. Fenton. 2003. Sensory ecology and communication in the
Chiroptera. Pp. 90-127 in Bat ecology (T. H. Kunz and M. B. Fenton, eds.). University of Chicago Press, Chicago, Illinois.
Baker, R. J., J. C. Patton, H. H. Genoways, and J. W. Bickham. 1988. Genetic studies of
Lasiurus (Chiroptera: Vespertilionidae). Occasional Papers, The Museum, Texas Tech University 117:1-15.
Barquez, R. M., M. A. Mares, and J. K. Braun. 1999. The bats of Argentina. Special
Publications, The Museum, Texas Tech University 42:1-275. Barclay, R. M. R., and L. D. Harder. 2003. Life histories of bats: life in the slow lane.
Pp. 209-253 in Bat ecology (T. H. Kunz and M. B. Fenton, eds.). University of Chicago Press, Chicago, Illinois.
Brennan, J. M., and M. L. Goff. 1977. Keys to the genera of chiggers of the Western
Hemisphere (Acarina: Trombiculidae). The Journal of Parasitology 63:554-566. Brennan, J. M., and J. T. Reed. 1974. The genus Eutrombicula in Venezuela (Acarina:
Trombiculidae). The Journal of Parasitology 60:699-711. Brennan, J. M., and J. T. Reed. 1975. A list of Venezuela chiggers, particularly of small
mammalian hosts (Acarina: Trombiculidae). Brigham Young University Science Bulletin, Biological Series 20 (1):45-75.
Brennan, J. M., and C. E. Yunker. 1966. The chiggers of Panama (Acarina:
Trombiculidae). Pp. 221-266 in Ectoparasites of Panama (R. L. Wenzel and V. J. Tipton, eds.). Field Museum of Natural History, Chicago, Illinois.
Brooks, D. R., and D. A. McLennan. 1993. Parascript: parasites and the language of
evolution. Smithsonian Institution Press, Washington, D. C. Brower, J. E., J. H. Zar, and C. N. von Ende. 1990. Field and laboratory methods for
general ecology. Wm. C. Brown Publishers, Dubuque, Iowa.

168
Brown, J. H. 1971. Mammals on mountaintops: nonequilibrium insular biogeography. The American Naturalist 105:467-478.
Brown, J. H., and A. Kodric-Brown. 1977. Turnover rates in insular biogeography:
effect of immigration on extinction. Ecology 58:445-449. Bush, M. B., and R. J. Whittaker. 1991. Krakatau: colonization patterns and hierarchies.
Journal of Biogeography 18:341-356. Camargo, J. A. 1993. Must dominance increase with the number of subordinate species
in competitive interactions. Journal of Theoretical Biology 161:537-542. Camargo, J. A. 1995. On measuring species evenness and other associated parameters of
community structure. Oikos 74:538-542. Chao, A. 1984. Non-parametric estimation of the number of classes in a population.
Scandinavian Journal of Statistics 11:265-270. Choe, J. C., and K. C. Kim. 1987. Community structure of arthropod ectoparasites on
Alaskan seabirds. Canadian Journal of Zoology 65:2998-3005. Coleman, B. D., M. A. Mares, M. R. Willig, and Y.-H. Hsieh. 1982. Randomness, area,
and species richness. Ecology 63:1121-1133. Colwell, R. K., and D. W. Winkler. 1984. A null model for null models. Pp. 344 - 359
in Ecological communities: conceptual issues and the evidence (D. Strong, D. Simberloff, L. Abele, and A. Thistle, eds.). Princeton University Press, Princeton, New Jersey.
Colwell, R. K. 2001. EstimateS: statistical estimation of species richness and shared
species from samples for the Macintosh (V 6.0b1). Available online at http://viceroy.eeb.uconn.edu/EstimateS.
Davies, K. F., C. R. Margules, and J. F. Lawrence. 2000. Which traits of species predict
population declines in experimental forest fragments? Ecology 81:1450-1461. Davies, K. F., C. R. Margules, and J. F. Lawrence. 2004. A synergistic effect puts rare,
specialized species at greater risk of extinction. Ecology 85:265-271. De Alckmin Marques, E. S., P. W. Price, and N. S. Cobb. 2000. Resource abundance
and insect herbivore diversity on woody fabaceous desert plants. Environmental Entomology 29:696-703.

169
de la Cruz, J. 1969. Nueva espécie de acaro (Acarina: Listrophoridae) parásito de murciélagos cubanos. Poeyana, Seria A 62:1-8.
Dusbábek, F. 1969a. To the phylogeny of genera of the family Myobiidae. Acarologia
11:537-574. Dusbábek, F. 1969b. Generic revision of the myobiid mites (Acarina: Myobiidae)
parasitic on bats. Folia Parasitologica 16:1-17. Dusbábek, F., and J. de la Cruz. 1966. Nuevos géneros y espécies de acaros (Acarina:
Listrophoridae) parásitos de murciélagos cubanos. Poeyana, Seria A 31:1-20. Emerson, S. B., H. W. Greene, and E. L. Charnov. 1994. Allometric aspects of predator-
prey interactions. Pp. 123-139 in Ecological morphology: integrative organismal biology (P. C. Wainwright and S. M. Reilly, eds.). The University of Chicago Press, Chicago, Illinois.
Fagan, W. F., P. J. Unmack, C. Burgess, and W. L. Minckley. 2002. Rarity,
fragmentation, and extinction in desert fishes. Ecology 83:3250-3256. Fain, A. 1978. Mites of the family Myobiidae (Acarina: Prostigmata) from mammals in
the collection of the British Museum (Natural History). Bulletin of the British Museum of Natural History, Zoological Series 33:193-229.
Fairchild, G. B., G. M. Kohls, and V. J. Tipton. 1966. The ticks of Panama (Acarina:
Ixodoidea). Pp. 167-220 in Ectoparasites of Panama (R. L. Wenzel and V. J. Tipton, eds.). Field Museum of Natural History, Chicago, Illinois.
Ferris, G. F., and R. L. Usinger. 1939. The family Polyctenidae (Hemiptera:
Heteroptera). Microentomology 4:1-50. Ferris, G. F., and R. L. Usinger. 1945. Notes and descriptions of American Polyctenidae
(Hemiptera). Pan Pacific Entomologist 21:121-124. Frenzel, M., and R. Brandl. 1998. Diversity and composition of phytophagous insect
guilds on Brassicaceae. Oecologia 113:391-399. Gannon, M. R., and M. R. Willig. 1997. The effect of lunar illumination on movement
and activity of the red fig-eating bat (Stenoderma rufum). Biotropica 29:525-529. Gannon, M. R., M. R. Willig, and J. K. Jones, Jr. 1989. Sturnira lilium. Mammalian
Species 333:1-5.

170
Gilbert, F. S. 1980. The equilibrium theory of island biogeography, fact or fiction? Journal of Biogeography 7:209-235.
Guimarães, L. R. 1966. Nycteribiid bat flies from Panama (Diptera: Nycteribiidae). Pp.
393-404 in Ectoparasites of Panama (R. L. Wenzel and V. J. Tipton, eds.). Field Museum of Natural History, Chicago, Illinois.
Guimarães, L. R. 1972. Venezuelan nycteribiid batflies (Diptera: Nycteribiidae).
Brigham Young University Science Bulletin, Biological Series 17 (1):1-11. Haila, Y., and O. Järvinen. 1982. The role of theoretical concepts in understanding the
ecological theatre: a case study on island biogeography. Pp. 261-278 in Conceptual issues in ecology (E. Saarinen, ed.). D. Reidel, Dordrecht, The Netherlands.
Handley, C. O., Jr. 1987. New species of mammals from northern South America: fruit-
eating bats, genus Artibeus Leach. Pp. 163-172 in Studies in neotropical mammalogy: essays in honor of Philip Hershkovitz (B. D. Patterson and R. M. Timm, eds.). Fieldiana, Zoology (New Series) 39:1-506.
Humphrey, S. R., and J. B. Cope. 1976. Population ecology of the little brown bat,
Myotis lucifugus, in Indiana and North-central Kentucky. The American Society of Mammalogists, Special Publications 4:1-81.
Herrin, C. S., and V. J. Tipton. 1975. Spinturnicid mites of Venezuela. Brigham Young
University Science Bulletin, Biological Series 20 (2):1-72. Hurlbert, S. H. 2003. Design and analysis: uncertain intent, uncertain result. Ecology
84:810-812. Johnson, M. P., and D. S. Simberloff. 1974. Environmental determinants of island
species numbers in the British Isles. Journal of Biogeography 1:149-154. Jones, E. K, C. M. Clifford, J. E. Keirans, and G. M. Kohls. 1972. Ticks of Venezuela
(Acarina: Ixodoidea) with a key to the species of Amblyomma in the Western Hemisphere. Brigham Young University Science Bulletin, Biological Series 17 (4):1-40.
Kennedy, C. R. 1978a. An analysis of the metazoan parasitocoenoses of brown trout
Salmo trutta from British lakes. Journal of Fish Biology 13:255-263. Kennedy, C. R. 1978b. The parasite fauna of resident char Salvelinus alpinus from
Arctic islands, with special reference to Bear Island. Journal of Fish Biology 13:457-466.

171
Koopman, K. F. 1993. Order Chiroptera. Pp. 137-241 in Mammal species of the world:
a taxonomic and geographic reference (D. E. Wilson and D. M. Reeder, eds.). Smithsonian Institution Press, Washington, D. C.
Kunz, T. H. 1982. Roosting ecology. Pp. 1-56 in Ecology of bats (T. H. Kunz, ed.). Plenum Press, New York, New York.
Kunz, T. H., P. V. August, and C. D. Burnett. 1983. Harem social organization in cave
roosting Artibeus jamaicensis (Chiroptera: Phyllostomidae). Biotropica 15:133-138.
Kunz, T. H., and L. F. Lumsden. 2003. Ecology of cavity and foliage roosting bats. Pp.
3-89 in Bat ecology (T. H. Kunz and M. B. Fenton, eds.). University of Chicago Press, Chicago, Illinois.
Kunz, T. H., and G. F. McCracken. 1996. Tents and harems: apparent defence of foliage
roosts by tent-making bats. Journal of Tropical Ecology 12:121-137. Kuris, A. M., A. R. Blaustein, and J. J. Alió. 1980. Hosts as islands. The American
Naturalist 116:570-586. Lee, P. L. M., and D. H. Clayton. 1995. Population biology of swift (Apus apus)
ectoparasites in relation to host reproductive success. Ecological Entomology 20:43-50.
Lewinsohn, T. M. 1991. Insects in flower heads of Asteraceae in southeast Brazil: a case
study of tropical species richness. Pp. 525-559 in Plant-Animal interactions: evolutionary ecology in tropical and temperate regions (P. Price, T. Lewinsohn, G Fernandes, and W. Benson, eds.). Wiley & Sons, New York, New York.
López-González, C. 1998. Systematics and zoogeography of the bats of Paraguay.
Ph.D. dissertation, Texas Tech University, Lubbock. López-González, C. 2005. Los murciélagos de Paraguay. Publicaciones Comité
Español MAB y Red Ibero MAB (in press). MacArthur, R. H., and E. O. Wilson. 1963. An equilibrium theory of insular
zoogeography. Evolution 17:373-387. MacArthur, R. H., and E. O. Wilson. 1967. The theory of island biogeography.
Princeton University Press, Princeton, New Jersey.

172
McCracken, G. F., and G. S. Wilkinson. 2000. Bat mating systems. Pp. 321-362 in Reproductive biology of bats (E. G. Crichton and P. H. Krutzsch, eds.). Academic Press, New York, New York.
McDaniel, B. 1970. The labidocarpid batmites of Nicaragua (Listrophoroidea :
Labidocarpidae). Acarologia 12:803-823. McDaniel, B. 1973. Labidocarpid bat-mites of Venezuela (Listophoroidea:
Labidocarpidae). Brigham Young University Science Bulletin, Biological Series 17 (2):15-32.
Machado-Allison, C. E. 1965. Las espécies Venezolanas del género Periglischrus
Kolenati 1857. Acta Biología Venezuelica 4:259-348. Magurran, A. E. 1988. Ecological diversity and its measurement. Princeton University
Press, Princeton, New Jersey. Marshall, A. G. 1971. The ecology of Basilia hispida (Diptera: Nycteribiidae) in
Malaysia. Journal of Animal Ecology 40:141-154. Marshall, A. G. 1982. Ecology of insects ectoparasitic on bats. Pp. 369-401 in Ecology
of bats (T. H. Kunz, ed.). Plenum Press, New York, New York. The Math Works, Inc. 1994. Matlab for Macintosh, ver. 4.2c.1. Prentice Hall,
Englewood Cliffs, New Jersey. May, R. M. 1975. Patterns of species abundance and diversity. Pp. 81-120 in Ecolgy
and evolution of communities (M. L. Cody and J. M. Diamond, eds.). Belknap Press of Harvard University, Cambridge, Massachusetts.
Moran, M. D. 2003. Arguments for rejecting the sequential Bonferroni in ecological
studies. Oikos 100:403-405. Morrison, D. W. 1979. Apparent male defense of tree hollows in the fruit bat, Artibeus
jamaicensis. Journal of Mammalogy 60:11-15. Myers, P. 1976. Patterns of reproduction of four species of vespertilionid bats in
Paraguay. University of California Publications in Zoology 107:1-41. Myers, P. 1982. Origins and affinities of the mammal fauna of Paraguay. Pp. 85-93 in
Mammalian biology in South America (M. A. Mares and H. H. Genoways, eds.). Special Publications, Pymatuning Laboratory of Ecology 6:1-539.

173
Newbound, D. R., and B. Knott. 1999. Parasitic copepods from pelagic sharks in western Australia. Bulletin of Marine Science 65:715-724.
Ortega, J., and H. T. Arita. 1999. Structure and social dynamics of harem groups in
Artibeus jamaicensis (Chiroptera: Phyllostomidae). Journal of Mammalogy 80:1173-1185.
Paine, R. T. 1977. Controlled manipulations in the marine intertidal zone, and their
contributions to ecological theory. Special Publications of the Academy of Natural Sciences, Philadelphia 12:245-270.
Paulay, G. 1994. Biodiversity on oceanic islands: its origin and extinction. American
Zoologist 34:134-144. Peet, R. K. 1974. The measurement of species diversity. Annual Review of Ecology
and Systematics 5:285-307. Pinichpongse, S. 1963a. A review of the Chirodiscinae with descriptions of new taxa
(Acarina : Listrophoridae) (1st series). Acarologia 5:81-91. Pinichpongse, S. 1963b. A review of the Chirodiscinae with descriptions of new taxa
(Acarina : Listrophoridae) (Part Two). Acarologia 5:266-278. Pinichpongse, S. 1963c. A review of the Chirodiscinae with descriptions of new taxa
(Acarina : Listrophoridae) (Part three). Acarologia 5:397-404. Pinichpongse, S. 1963d. A review of the Chirodiscinae with descriptions of new taxa
(Acarina : Listrophoridae) (Part four). Acarologia 5:620-627. Poulin, R. 1991. Group-living and infestation by ectoparasites in passerines. The
Condor 93:418-423. Pruett-Jones, M., and S. Pruett-Jones. 1991. Analysis and ecological correlates of tick
burdens in a New Guinea avifauna. Pp. 154-176 in Bird-parasite interactions: ecology, evolution, and behaviour (J. E. Loye and M. Zuk, eds.). Oxford University Press, Oxford, England.
Radovsky, F. J. 1967. The Macronyssidae and Laelapidae (Acarina: Mesostigmata)
parasitic on bats. University of California Publications in Entomology 46:1-288. Reed, J. T., and J. M. Brennan. 1975. The subfamily Leeuwenhoekinae in the
Neotropics (Acarina: Trombiculidae). Brigham Young University Science Bulletin, Biological Series 20 (1):1-42.

174
Ronderos, R. A. 1959. Polycténidae americanos. I. (Hemiptera). Actas y Trabajos del Primer Congreso Sudamericano de Zoologia 3:173-180.
Ronderos, R. A. 1962. Polycténidae americanos. II. (Hemiptera). Acta Zoologica
Lilloana 18:259-262. Rudnick, A. 1960. A revision of the mites of the family Spinturnicidae (Acarina).
University of California Publications in Entomology 17: 157-283. Rosenzweig, M. L. 1995. Species diversity in space and time. Cambridge University
Press, Cambridge, England. Saunders, R. C. 1975. Venezuelan Macronyssidae (Acarina: Mesostigmata). Brigham
Young University Science Bulletin, Biological Series 20 (2):75-90. Scheiner, S. M. 2003. Six types of species-area curves. Global Ecology &
Biogeography 12:441-447. Scheiner, S. M., S. B. Cox, M. R. Willig, G. G. Mittelbach, C. Osenberg, and M. Kaspari.
2000. Species density, species-area curves and Simpson's paradox. Evolutionary Ecology Research 2:791-802.
Schrader-Frechette, K. S., and E. D. McCoy. 1993. Method in ecology: strategies for
conservation. Cambridge University Press, Cambridge, England. Shoener, A. 1988. Experimental island biogeography. Pp. 485-512 in Analytical
biogeography: an integrated approach to the study of animal and plant distributions (A. Myers and P. Giller, eds.). Chapman and Hall, New York, New York.
Simberloff, D. S. 1976. Species turnover and equilibrium island biogeography. Science
194:572-578. Simberloff, D. S. 1983. When is an island community in equilibrium? Science
220:1275-1277. Simberloff, D. S., and E. O. Wilson. 1970. Experimental zoogeography of islands. A
two-year record of colonization. Ecology 51:934-937. Simmons, N. B., and R. S. Voss. 1998. The mammals of Paracou, French Guiana: a
Neotropical lowland rainforest fauna. Part 1. Bats. Bulletin of the American Museum of Natural History 237:1-219.

175
Sismondo, S. 2000. Island biogeography and the multiple domains of models. Biology and Philosophy 15:239-258.
Southwood, T. R. E. 1978. Ecological Methods. Chapman and Hall, London, Great
Britain. SPSS, Inc. 1990. The SPSS base system user’s guide. SPSS, Inc., Chicago, Illinois. Ueshima, N. 1972. New World Polyctenidae (Hemiptera), with special reference to
Venezuelan species. Brigham Young University Science Bulletin, Biological Series 17 (1):13-21.
Wenzel, R. L. 1976. The streblid batflies of Venezuela (Diptera: Streblidae). Brigham
Young University Science Bulletin, Biological Series 20 (4):1-177. Wenzel, R. L., and V. J. Tipton. 1966. Some relationships between mammal hosts and
their ectoparasites. Pp. 677-723 in Ectoparasites of Panama (R. L. Wenzel and V. J. Tipton, eds.). Field Museum of Natural History, Chicago, Illinois.
Wenzel, R. L., V. J. Tipton, and A. Kiewlicz. 1966. The streblid batflies of Panama
(Diptera: Streblidae). Pp. 405-675 in Ectoparasites of Panama (R. L. Wenzel and V. J. Tipton, eds.). Field Museum of Natural History, Chicago, Illinois.
Whittaker, R. H. 1960. Vegetation of the Kiskiyou Mountains, Oregon and California.
Ecological Monographs 30:279-338. Whitaker, R. J. 1998. Island biogeography: ecology, evolution and conservation.
Oxford University Press, Oxford, England. Wilkinson, G. S. 1985. The social organization of the common vampire bat. I. Pattern
and cause of association. Behavioral Ecology and Sociobiology 17:111-121. Willig, M. R., D. M. Kaufman, and R. D. Stevens. 2003. Latitudinal gradients of
biodiversity: pattern, process, scale, and synthesis. Annual Review of Ecology, Evolution and Systematics 34: 273-309.
Willig, M. R., S. J. Presley, R. D. Owen, and C. López-González. 2000. Composition
and structure of bat assemblages in Paraguay: a subtropical – temperate interface. Journal of Mammalogy 81:386-401.

Host species FA MA NNoctilionidae
Noctilio albiventris 62.6 31.5 133Noctilio leporinus 86.1 55.0 30
PhyllostomidaeGlossophaga soricina 35.3 8.9 104Carollia perspicillata 40.9 16.7 89Desmodus rotundus 63.4 40.9 61Artibeus fimbriatus 66.3 52.6 87Artibeus jamaicensis 60.5 43.4 45Artibeus lituratus 71.3 65.8 498Platyrrhinus lineatus 47.0 22.4 103Pygoderma bilabiatum 39.8 18.1 55Sturnira lilium 42.4 19.3 556
Family VespertilionidaeEptesicus furinalis 38.5 8.0 75Lasiurus ega 46.7 12.2 75Myotis albescens 34.2 6.0 116Myotis nigricans 32.7 4.7 137
Family MolossidaeEumops glaucinus 60.4 33.9 57Eumops patagonicus 43.9 12.9 1102Molossops temminckii 30.6 5.4 178Molossus ater 48.3 28.7 112Molossus currentium 42.8 17.8 37Molossus molossus 38.6 12.1 313Nyctinomops laticaudatus 44.1 10.9 47
Host characteristics
Table 3.1. For the 22 common host species, the average forearm length (FA) in millimeters, mass (MA) in grams, and sample size (N), as well as the total number of collected ectoparasites (EN) and 9 measures of ectoparasite biodiversity. See text for abbreviations.Host family

Host species EN MeanS AccumS Chao1 LogSNoctilionidae
Noctilio albiventris 1460 2.5 11.0 13.3 17.4Noctilio leporinus 553 2.4 8.0 0.0 8.4
PhyllostomidaeGlossophaga soricina 64 0.5 10.0 11.7 12.3Carollia perspicillata 124 1.0 14.0 1.8 17.5Desmodus rotundus 407 1.0 8.0 9.0 20.9Artibeus fimbriatus 561 2.3 12.0 18.3 23.7Artibeus jamaicensis 306 2.0 12.0 3.7 14.2Artibeus lituratus 1123 1.2 17.0 21.2 25.4Platyrrhinus lineatus 394 1.2 14.0 18.0 19.1Pygoderma bilabiatum 13 0.2 7.0 7.5 8.2Sturnira lilium 2023 1.9 23.0 55.0 59.1
Family VespertilionidaeEptesicus furinalis 812 1.3 16.0 16.5 21.6Lasiurus ega 411 0.7 5.0 4.0 5.6Myotis albescens 1550 1.7 15.0 0.0 17.5Myotis nigricans 557 1.0 16.0 16.2 18.1
Family MolossidaeEumops glaucinus 335 1.2 8.0 8.5 9.6Eumops patagonicus 1693 0.8 17.0 21.0 29.5Molossops temminckii 541 0.9 15.0 19.3 25.2Molossus ater 911 1.3 16.0 19.1 27.9Molossus currentium 64 1.0 4.0 4.0 5.0Molossus molossus 2427 1.3 15.0 18.0 23.3Nyctinomops laticaudatus 182 1.0 9.0 0.0 12.0
Richness of ectoparasitesTable 3.1. ContinuedHost family

Host species Shannon Even Dom Rare BetadivNoctilionidae
Noctilio albiventris 0.5 0.5 0.5 8 14.9Noctilio leporinus 0.6 0.7 0.4 4 6.1
PhyllostomidaeGlossophaga soricina 0.8 0.8 0.4 5 11.8Carollia perspicillata 0.7 0.6 0.5 11 16.5Desmodus rotundus 0.5 0.5 0.5 5 19.9Artibeus fimbriatus 0.6 0.5 0.5 9 21.5Artibeus jamaicensis 0.7 0.7 0.4 8 12.2Artibeus lituratus 0.5 0.4 0.6 14 24.2Platyrrhinus lineatus 0.6 0.5 0.4 11 17.9Pygoderma bilabiatum 0.8 1.0 0.2 0 8.0Sturnira lilium 0.7 0.5 0.4 19 57.2
Family VespertilionidaeEptesicus furinalis 0.3 0.2 0.9 15 20.3Lasiurus ega 0.1 0.1 1.0 3 5.0Myotis albescens 0.5 0.4 0.5 13 15.8Myotis nigricans 0.7 0.6 0.4 13 17.1
Family MolossidaeEumops glaucinus 0.5 0.6 0.5 5 8.4Eumops patagonicus 0.3 0.3 0.8 15 28.7Molossops temminckii 0.5 0.4 0.7 9 24.4Molossus ater 0.5 0.4 0.6 13 26.6Molossus currentium 0.3 0.4 0.8 2 3.9Molossus molossus 0.5 0.5 0.5 11 22.0Nyctinomops laticaudatus 0.3 0.3 0.9 7 11.0
Table 3.1. ContinuedBiodiversity of ectoparasitesHost family

Host species r2 p-value B1 r2 p-value B1
All bats 0.001 0.053 0.000 0.693
Noctilionidae 0.008 0.406 0.006 0.458Noctilio albiventris 0.006 0.537 0.016 0.307Noctilio leporinus 0.000 0.995 0.132 0.058
Phyllostomidae 0.004 0.026 0.06 0.001 0.425Glossophaginae
Glossophaga soricina 0.005 0.614 0.004 0.668Carollinae
Carollia perspicillata 0.002 0.741 0.012 0.355Desmodontinae
Desmodus rotundus 0.001 0.806 0.013 0.428Stenodermatinae
Artibeus fimbriatus 0.000 0.928 0.051 0.045 0.23Artibeus jamaicensis 0.002 0.756 0.015 0.445Artibeus lituratus 0.002 0.406 0.000 0.784Platyrrhinus lineatus 0.000 0.956 0.001 0.831Pygoderma bilabiatum 0.022 0.293 0.002 0.773
SturnirinaeSturnira lilium 0.002 0.351 0.055 < 0.001 -0.23
Table 3.2. Results of simple regression analyses determining the effect of host body size (FA and MA) on total ectoparasite abundance (TEA) for all hosts as a group, for each host family, and for each host species. Significant results are bold. Significant results after Bonferroni sequential adjustment are underlined. See text for abbreviations.
MAFAHost family

Table 3.2. Continued
Host species r2 p-value B1 r2 p-value B1
Vespertilionidae 0.000 0.789 0.000 0.853Eptesicus furinalis 0.009 0.443 0.000 0.875Lasiurus ega 0.005 0.565 0.017 0.272Myotis albescens 0.050 0.038 0.22 0.046 0.045 0.22Myotis nigricans 0.000 0.834 0.017 0.137
Molossidae 0.000 0.569 0.003 0.061Eumops glaucinus 0.008 0.507 0.019 0.309Eumops patagonicus 0.000 0.707 0.002 0.330Molossops temminckii 0.024 0.054 0.031 0.026 0.18Molossus ater 0.013 0.262 0.042 0.042 -0.20Molossus currentium 0.006 0.696 0.033 0.368Molossus molossus 0.000 0.819 0.014 0.073Nyctinomops laticaudatus 0.047 0.173 0.006 0.612
Host family FA MA

MANOVA LargerHost species FA MA sex
NoctilionidaeNoctilio albiventris 0.009 0.967 0.013 MalesNoctilio leporinus 0.037 0.439 0.014 Males
PhyllostomidaeCarollia perspicillata 0.042 0.892 0.024 FemalesArtibeus fimbriatus 0.426 0.515 0.414Artibeus jamaicensis 0.493 0.245 0.996Artibeus lituratus < 0.001 0.029 < 0.001 FemalesPlatyrrhinus lineatus 0.018 0.590 0.005 FemalesSturnira lilium < 0.001 0.052 < 0.001 Males
VespertilionidaeEptesicus furinalis 0.101 0.118 0.471Lasiurus ega < 0.001 < 0.001 < 0.001 FemalesMyotis albescens 0.001 0.004 0.002 FemalesMyotis nigricans 0.001 0.208 < 0.001 Females
MolossidaeEumops glaucinus 0.302 0.088 0.095Eumops patagonicus 0.641 0.709 0.448Molossops temminckii 0.334 0.168 0.973Molossus ater 0.021 0.466 0.011 MalesMolossus currentium 0.077 0.217 0.031 MalesMolossus molossus < 0.001 0.031 < 0.001 MalesNyctinomops laticaudatus 0.289 0.700 0.133
Table 3.3. Significance of multivariate (MANOVA) and univariate (ANOVA) analyses of sexual size dimorphism for each of 19 common host species. Significant results in bold. Significant results after Bonferroni sequential adjustment are underlined. See text for abbreviations.Host family ANOVA

Ectoparasite family r2 p-value B1 r2 p-value B1
All batsStreblidae 0.055 < 0.001 0.23 0.024 < 0.001 0.16Polyctenidae 0.000 0.993 0.000 0.648Nycteribiidae 0.019 < 0.001 -0.14 0.016 < 0.001 -0.12Spinturnicidae 0.067 < 0.001 0.26 0.094 < 0.001 0.31Macronyssids 0.013 < 0.001 -0.11 0.015 < 0.001 -0.12Argasidae 0.013 < 0.001 0.11 0.002 0.007 0.05Trombiculidae 0.001 0.055 0.001 0.050 0.04Chirodiscidae 0.035 0.064 0.001 0.040 -0.04
NoctilionidaeStreblidae 0.009 0.368 0.056 0.020 0.24Argasidae 0.031 0.089 0.008 0.401
Noctilio albiventrisStreblidae 0.088 0.015 0.30 0.056 0.052Argasidae 0.040 0.107 0.001 0.774
Noctilio leporinusStreblidae 0.051 0.257 0.137 0.052
PhyllostomidaeStreblidae 0.000 0.555 0.003 0.045 -0.60Spinturnicidae 0.036 < 0.001 0.19 0.028 < 0.001 0.17
MAFAHost family
Host species
Table 3.4. Results of simple regression analyses determining the effect of host body size (FA and MA) on familial ectoparasite abundance (FEA) for all hosts as a group, for each primary host family and each primary host species Significant results are bold. Significant results after Bonferroni sequential adjustment are underlined. See text for abbreviations.

Ectoparasite family r2 p-value B1 r2 p-value B1
Macronyssidae 0.000 0.686 0.000 0.617Carollinae
Carollia perspicillataStreblidae 0.000 0.964 0.012 0.354
StenodermatinaeArtibeus fimbriatus
Streblidae 0.012 0.339 0.022 0.191Spinturnicidae 0.002 0.692 0.017 0.249Macronyssidae 0.002 0.725 0.024 0.177
Artibeus jamaicensisSpinturnicidae 0.010 0.519 0.001 0.820
Artibeus lituratusStreblidae 0.000 0.764 0.038 < 0.001 0.19Spinturnicidae 0.003 0.275 0.008 0.088Macronyssidae 0.000 0.947 0.000 0.925
Platyrrhinus lineatusSpinturnicidae 0.007 0.443 0.037 0.072Macronyssidae 0.002 0.694 0.007 0.427
SturnirinaeSturnira lilium
Streblidae 0.006 0.126 0.023 0.002 -0.15Spinturnicidae 0.001 0.665 0.076 < 0.001 -0.28Macronyssidae 0.021 0.004 0.14 0.015 0.014 -0.12
Host familyTable 3.4. Continued
Host species FA MA

Ectoparasite family r2 p-value B1 r2 p-value B1
Family VespertilionidaeNycteribiidae 0.032 < 0.001 -0.18 0.024 0.002 -0.16Spinturnicidae 0.008 0.081 0.005 0.153Macronyssidae 0.000 0.906 0.001 0.590
Eptesicus furinalisMacronyssidae 0.022 0.233 0.003 0.675
Lasiurus egaMacronyssidae 0.006 0.522 0.014 0.327
Myotis albescensNycteribiidae 0.086 0.006 -0.29 0.031 0.103Macronyssidae 0.057 0.027 0.24 0.040 0.062
Myotis nigricansNycteribiidae 0.027 0.065 0.078 < 0.001 0.28Macronyssidae 0.000 0.762 0.004 0.455
Family MolossidaeStreblidae 0.002 0.126 0.006 0.008 0.08Polyctenidae 0.013 < 0.001 0.11 0.021 < 0.001 0.15Macronyssidae 0.001 0.410 0.002 0.102Argasidae 0.001 0.350 0.002 0.119Trombiculidae 0.002 0.163 0.003 0.055Chirodiscidae 0.001 0.437 0.000 0.801
Eumops glaucinusPolyctenidae 0.009 0.482 0.062 0.064Macronyssidae 0.015 0.374 0.001 0.832
MAHost familyTable 3.4. Continued
Host species FA

Ectoparasite family r2 p-value B1 r2 p-value B1
Eumops patagonicusStreblidae 0.003 0.248 0.000 0.830Polyctenidae 0.000 0.742 0.000 0.995Macronyssidae 0.002 0.367 0.003 0.209Argasidae 0.000 0.995 0.014 0.006 -0.12
Molossops temminckiiPolyctenidae 0.014 0.134 0.001 0.734Macronyssidae 0.045 0.008 0.21 0.031 0.027 0.18
Molossus aterMacronyssidae 0.000 0.838 0.038 0.051
Molossus currentiumMacronyssidae 0.004 0.754 0.040 0.316
Molossus molossusPolyctenidae 0.020 0.036 -0.140 0.068 < 0.001 -0.260Macronyssidae 0.000 0.971 0.007 0.194Chirodiscidae 0.001 0.660 0.009 0.161
Nyctinomops laticaudatusMacronyssidae 0.056 0.137 0.006 0.624
Table 3.4. ContinuedHost family
Host species FA MA

Ectoparasite family Covariates Sex r p-value r p-valueNoctilionidae
Noctilio albiventrisStreblidae 0.003 < 0.001 0.778 0.384 0.969 0.029Argasidae 0.212 0.032 -0.958 0.099 -0.344 0.612
Noctilio leporinusStreblidae 0.318 0.764 0.703 0.800 0.986 0.281
PhyllostomidaeCarollia perspicillata
Streblidae 0.918 0.078 -0.131 0.827 0.847 0.683Artibeus fimbriatus
Streblidae 0.500 0.134 0.487 0.883 0.992 0.305Spinturnicidae 0.617 0.958 0.074 0.764 0.952 0.329Macronyssidae 0.099 0.022 -0.240 0.204 0.810 0.037
Artibeus jamaicensisSpinturnicidae 0.895 0.339 0.963 0.683 0.485 0.899
Artibeus lituratusStreblidae 0.006 0.474 0.198 0.543 0.982 0.002Spinturnicidae 0.012 0.015 0.291 0.058 -0.775 0.004Macronyssidae 0.839 0.308 -0.272 0.947 -0.994 0.569
Table 3.5. Significance levels for analyses of covariance determining the effect of host sex on familial ectoparasite abundance while removing the effect of host size (FA and MA). Correlation coefficients and p-values are provided for separate correlation analyses of the association between body size (FA and MA) and familial ectoparasite abundances. Significant results are bold. Significant results after Bonferroni sequential adjustment are underlined. See text for abbreviations.
MAFAp-valueHost family
Host speciesPearson product-moment correlation analysis

Ectoparasite family Covariates Sex r p-value r p-valuePlatyrrhinus lineatus
Spinturnicidae 0.252 0.988 -0.459 0.714 -0.976 0.141Macronyssidae 0.958 0.158 0.450 0.951 0.978 0.795
Sturnira liliumStreblidae 0.006 0.780 -0.175 0.994 -1.000 0.002Spinturnicidae < 0.001 0.154 -0.260 0.659 -0.996 < 0.001 Macronyssidae 0.001 0.585 0.699 0.002 -0.581 0.005
VespertilionidaeEptesicus furinalis
Macronyssidae 0.471 0.118 0.824 0.450 0.788 0.487Lasiurus ega
Macronyssidae 0.103 0.042 -0.715 0.249 -0.844 0.134Myotis albescens
Nycteribiidae 0.010 0.573 -0.740 0.009 0.508 0.038Macronyssidae 0.036 0.603 0.846 0.062 0.694 0.165
Myotis nigricansNycteribiidae 0.020 0.471 0.453 0.814 0.997 0.012Macronyssidae 0.282 0.798 -0.706 0.143 0.388 0.260
MolossidaeEumops glaucinus
Polyctenidae 0.095 0.088 0.494 0.234 0.840 0.059Macronyssidae 0.743 0.481 -0.930 0.466 -0.318 0.777
Pearson product-moment correlation analysisHost species p-value FA MA
Table 3.5. ContinuedHost family

Ectoparasite family Covariates Sex r p-value r p-valueEumops patagonicus
Streblidae 0.276 0.093 0.925 0.114 -0.167 0.542Polyctenidae 0.138 0.691 -0.956 0.047 0.076 0.558Macronyssidae 0.361 0.568 0.275 0.493 -0.877 0.170Argasidae 0.020 0.280 -0.423 0.550 -0.977 0.011
Molossops temminckiiPolyctenidae 0.321 0.801 -0.988 0.140 -0.203 0.812Macronyssidae 0.010 0.312 0.879 0.044 0.754 0.143
Molossus aterMacronyssidae 0.083 0.246 0.121 0.511 0.956 0.027
Molossus currentiumMacronyssidae 0.596 0.733 -0.471 0.522 0.775 0.373
Molossus molossusPolyctenidae < 0.001 0.202 -0.095 0.520 -0.987 < 0.001 Macronyssidae 0.111 0.596 -0.582 0.106 0.640 0.088Chirodiscidae 0.806 0.318 0.462 0.561 0.975 0.884
Nyctinomops laticaudatusMacronyssidae 0.321 0.599 0.951 0.148 0.259 0.640
Host family Pearson product-moment correlation analysisHost species p-value FA MA
Table 3.5. Continued

Ectoparasite species r2 p-value B1 r2 p-value B1
All batsAspidoptera falcata 0.004 < 0.001 -0.06 0.001 0.040 -0.04Megistopoda aranea 0.024 < 0.001 0.16 0.023 < 0.001 0.15Megistopoda proxima 0.007 < 0.001 -0.08 0.002 0.013 -0.05Noctiliostrebla maai 0.016 < 0.001 0.12 0.002 0.023 0.42Paradyschiria fusca 0.030 < 0.001 0.17 0.012 < 0.001 0.11Paradyschiria parvula 0.014 < 0.001 0.12 0.002 0.008 0.05Paratrichobius longicrus 0.072 < 0.001 0.27 0.113 < 0.001 0.34Trichobius joblingi 0.002 0.025 -0.04 0.001 0.125Trichobius jubatus 0.001 0.103 0.001 0.068Trichobius parasiticus 0.005 < 0.001 0.07 0.002 0.018 0.04Hesperoctenes fumarius 0.004 < 0.001 -0.06 0.002 0.010 -0.05Hesperoctenes longiceps 0.001 0.046 -0.04 0.006 < 0.001 -0.08Hesperoctenes parvulus 0.008 < 0.001 -0.09 0.004 < 0.001 -0.06Hesperoctenes n. sp. 1 0.002 0.036 0.04 0.001 0.110Periglischrus iheringi 0.136 < 0.001 0.37 0.167 < 0.001 0.41Periglischrus ojasti 0.005 < 0.001 -0.07 0.003 0.007 -0.05Chiroptonyssus haematophagus 0.003 0.002 -0.06 0.008 < 0.001 -0.09Chiroptonyssus robustipes 0.000 0.673 0.001 0.119Chiroptonyssus venezolanus 0.011 < 0.001 -0.10 0.008 < 0.001 -0.09Macronyssoides conciliatus 0.000 0.920 0.000 0.933Macronyssoides kochi 0.046 < 0.001 0.21 0.061 < 0.001 0.25Macronyssus crosbyi 0.015 < 0.001 -0.12 0.011 < 0.001 -0.10
Table 3.6. Results of simple regression analyses determining the effect of host body size (FA and MA) on specific ectoparasite abundance (SEA) for all hosts as a group, for each primary host family, and for each primary host species. Significant results are bold. Significant results after Bonferroni sequential adjustment are underlined. See text for abbreviations.Host family
Host species FA MA

Table 3.6. Continued
Ectoparasite species r2 p-value B1 r2 p-value B1
Parichoronyssus euthysternum 0.003 0.004 -0.05 0.002 0.037 -0.04Steatonyssus furmani 0.000 0.622 0.003 0.004 -0.05Steatonyssus joaquimi 0.008 < 0.001 -0.09 0.010 < 0.001 -0.10Ornithodoros hasei 0.013 < 0.001 0.12 0.003 0.007 0.05Parkosa maxima 0.002 0.034 -0.04 0.001 0.045 -0.04Parkosa tadarida 0.001 0.136 0.001 0.097
NoctilionidaeNoctiliostrebla maai 0.123 < 0.001 -0.35 0.104 < 0.001 -0.34Paradyschiria fusca 0.286 < 0.001 0.53 0.304 < 0.001 0.55Paradyschiria parvula 0.113 0.001 -0.34 0.050 0.028 -0.22Ornithodoros hasei 0.031 0.089 0.008 0.401
Noctilio albiventrisNoctiliostrebla maai 0.077 0.023 0.28 0.001 0.785Paradyschiria parvula 0.041 0.102 0.063 0.040 0.25Ornithodoros hasei 0.040 0.103 0.001 0.774
Noctilio leporinusParadyschiria fusca 0.080 0.153 0.117 0.075
PhyllostomidaeAspidoptera falcata 0.044 < 0.001 -0.21 0.041 < 0.001 -0.20Megistopoda aranea 0.020 < 0.001 0.14 0.010 < 0.001 0.10Megistopoda proxima 0.082 < 0.001 -0.29 0.074 < 0.001 -0.27Paratrichobius longicrus 0.080 < 0.001 0.28 0.112 < 0.001 0.33Trichobius joblingi 0.016 < 0.001 -0.13 0.015 < 0.001 -0.12Trichobius parasiticus 0.004 0.029 0.06 0.000 0.750
Host familyHost species FA MA

Table 3.6. Continued
Ectoparasite species r2 p-value B1 r2 p-value B1
Periglischrus iheringi 0.132 < 0.001 0.36 0.117 < 0.001 0.34Periglischrus ojasti 0.064 < 0.001 -0.25 0.066 < 0.001 -0.26Macronyssoides conciliatus 0.002 0.112 0.003 0.048 -0.46Macronyssoides kochi 0.041 < 0.001 0.20 0.041 < 0.001 0.20Parichoronyssus euthysternum 0.036 < 0.001 -0.19 0.039 < 0.001 -0.20
CarollinaeCarollia perspicillata
Trichobius joblingi 0.002 0.719 0.006 0.517Stenodermatinae
Artibeus fimbriatusMegistopoda aranea 0.013 0.334 0.005 0.556Periglischrus iheringi 0.002 0.670 0.018 0.234Macronyssoides kochi 0.002 0.734 0.024 0.17
Artibeus jamaicensisPeriglischrus iheringi 0.010 0.520 0.001 0.820
Artibeus lituratusParatrichobius longicrus 0.000 0.763 0.038 < 0.001 0.20Periglischrus iheringi 0.003 0.340 0.006 0.134Macronyssoides kochi 0.000 0.929 0.000 0.965
Platyrrhinus lineatusPeriglischrus iheringi 0.009 0.384 0.037 0.069Macronyssoides conciliatus 0.001 0.762 0.006 0.467
SturnirinaeSturnira lilium
Aspidoptera falcata 0.005 0.175 0.021 0.003 -0.15Megistopoda proxima 0.003 0.310 0.008 0.076
Host familyHost species FA MA

Table 3.6. Continued
Ectoparasite species r2 p-value B1 r2 p-value B1
Periglischrus ojasti 0.000 0.669 0.077 < 0.001 -0.28Parichoronyssus euthysternum 0.020 0.005 0.14 0.013 0.022 -0.11
VespertilionidaeMacronyssus crosbyi 0.039 < 0.001 -0.20 0.013 0.020 -0.12Steatonyssus furmani 0.142 < 0.001 0.38 0.138 < 0.001 0.37Steatonyssus joaquimi 0.000 0.874 0.000 0.825
Eptesicus furinalisSteatonyssus joaquimi 0.024 0.208 0.002 0.687
Lasiurus egaSteatonyssus furmani 0.006 0.512 0.014 0.327
Myotis albescensMacronyssus crosbyi 0.006 0.485 0.097 0.003 0.31Steatonyssus joaquimi 0.045 0.051 0.000 0.961
Myotis nigricansMacronyssus crosbyi 0.003 0.535 0.014 0.169Steatonyssus joaquimi 0.000 0.973 0.001 0.781
MolossidaeTrichobius jubatus 0.002 0.132 0.006 0.007 0.08Hesperoctenes fumarius 0.002 0.107 0.001 0.278Hesperoctenes longiceps 0.002 0.107 0.002 0.100Hesperoctenes parvulus 0.032 < 0.001 -0.18 0.013 < 0.001 -0.11Hesperoctenes n. sp. 1 0.021 < 0.001 0.14 0.025 < 0.001 0.16Chiroptonyssus haematophagus 0.001 0.248 0.000 0.804Chiroptonyssus robustipes 0.011 < 0.001 0.10 0.056 < 0.001 0.24
Host familyHost species FA MA

Table 3.6. Continued
Ectoparasite species r2 p-value B1 r2 p-value B1
Chiroptonyssus venezolanus 0.028 < 0.001 -0.17 0.016 < 0.001 -0.13Ornithodoros hasei 0.001 0.374 0.002 0.107Parkosa maxima 0.003 0.084 0.002 0.167Parkosa tadarida 0.000 0.614 0.000 0.969
Eumops glaucinusHesperoctenes n. sp. 1 0.009 0.482 0.062 0.064Chiroptonyssus haematophagus 0.013 0.404 0.003 0.681
Eumops patagonicusTrichobius jubatus 0.002 0.292 0.000 0.818Hesperoctenes longiceps 0.000 0.742 0.000 0.995Chiroptonyssus haematophagus 0.002 0.354 0.003 0.203Ornithodoros hasei 0.000 0.989 0.015 0.005 -0.12
Molossops temminckiiHesperoctenes parvulus 0.014 0.134 0.001 0.734Chiroptonyssus venezolanus 0.003 0.490 0.000 0.785
Molossus aterChiroptonyssus robustipes 0.000 0.911 0.035 0.064
Molossus currentiumChiroptonyssus haematophagus 0.000 0.946 0.066 0.196
Molossus molossusHesperoctenes fumarius 0.020 0.036 -0.14 0.071 < 0.001 -0.27Chiroptonyssus haematophagus 0.000 0.994 0.007 0.206Parkosa maxima 0.000 0.945 0.019 0.035 -0.14Parkosa tadarida 0.001 0.668 0.016 0.060
Nyctinomops laticaudatusChiroptonyssus venezolanus 0.044 0.186 0.010 0.522
Host familyHost species FA MA

Ectoparasite species Covariates Sex r p-value r p-valueNoctilionidae
Noctilio albiventrisNoctiliostrebla maai 0.058 0.091 0.938 0.022 0.284 0.402Paradyschiria parvula 0.006 < 0.001 0.539 0.813 0.997 0.007Ornithodoros hasei 0.212 0.032 -0.958 0.099 -0.344 0.612
Noctilio leporinusParadyschiria fusca 0.246 0.576 0.836 0.532 0.93 0.353
PhyllostomidaeCarollia perspicillata
Trichobius joblingi 0.910 0.045 -0.766 0.677 0.266 0.781Artibeus fimbriatus
Megistopoda aranea 0.434 0.458 0.694 0.239 -0.408 0.352Periglischrus iheringi 0.615 0.976 0.434 0.948 0.998 0.376Macronyssoides kochi 0.096 0.023 -0.233 0.206 0.815 0.036
Artibeus jamaicensisPeriglischrus iheringi 0.895 0.339 0.963 0.683 0.485 0.899
Artibeus lituratusParatrichobius longicrus 0.002 0.718 0.031 0.217 0.936 < 0.001 Periglischrus iheringi 0.005 < 0.001 0.184 0.078 -0.839 0.002Macronyssoides kochi 0.781 0.094 -0.129 0.857 -0.967 0.486
Table 3.7. Significance levels for analyses of covariance determining the effect of host sex on specific ectoparasite abundance while removing the effect of host size (FA and MA). Correlation coefficients and p-values are provided for separate correlation analyses of the association between body size (FA and MA) and familial ectoparasite abundances. Significant results are bold. Significant results after Bonferroni sequential adjustment are underlined. See text for abbreviations.
MAHost family
Host speciesPearson product-moment correlation analysis
FAp-value

Ectoparasite species Covariates Sex r p-value r p-valuePlatyrrhinus lineatus
Periglischrus iheringi 0.231 0.970 -0.492 0.659 -0.967 0.137Macronyssoides conciliatus 0.980 0.013 0.792 0.853 -0.390 0.902
Sturnira liliumAspidoptera falcata 0.022 0.224 -0.418 0.486 -0.968 0.012Megistopoda proxima 0.368 0.079 -0.583 0.542 -0.903 0.251Periglischrus ojasti < 0.001 0.029 -0.118 0.767 -0.998 < 0.001 Parichoronyssus euthysternum 0.001 0.214 0.761 0.001 -0.504 0.014
VespertilionidaeEptesicus furinalis
Steatonyssus joaquimi 0.395 0.126 0.933 0.285 0.619 0.624Lasiurus ega
Steatonyssus furmani 0.103 0.042 -0.715 0.249 -0.844 0.134Myotis albescens
Macronyssus crosbyi 0.063 0.164 0.019 0.658 0.983 0.019Steatonyssus joaquimi 0.074 0.231 0.991 0.023 0.071 0.758
Myotis nigricansMacronyssus crosbyi 0.387 0.020 -0.685 0.211 0.415 0.316Steatonyssus joaquimi 0.899 0.028 0.611 0.902 0.964 0.716
MolossidaeEumops glaucinus
Hesperoctenes n. Sp.1 0.095 0.088 0.494 0.234 0.840 0.059Chiroptonyssus haematophagus 0.762 0.179 -0.734 0.571 -0.637 0.618
Host family Pearson product-moment correlation analysisTable 3.7. Continued
Host species p-value FA MA

Ectoparasite species Covariates Sex r p-value r p-valueEumops patagonicus
Trichobius jubatus 0.479 0.033 0.891 0.240 -0.246 0.582Hesperoctenes longiceps 0.927 0.004 0.918 0.701 -0.185 0.877Chiroptonyssus haematophagus 0.181 0.012 0.517 0.200 -0.721 0.113Ornithodoros hasei 0.012 0.764 -0.007 0.526 -0.977 0.003
Molossops temminckiiHesperoctenes parvulus 0.338 0.938 -0.991 0.151 -0.215 0.843Chiroptonyssus venezolanus 0.730 0.093 -0.954 0.429 -0.047 0.812
Molossus aterChiroptonyssus robustipes 0.115 0.280 0.073 0.607 0.970 0.038
Molossus currentiumChiroptonyssus haematophagus 0.507 0.800 -0.210 0.645 0.919 0.259
Molossus molossusHesperoctenes fumarius 0.004 0.790 -0.552 0.275 -0.946 0.005Chiroptonyssus haematophagus 0.757 0.478 -0.243 0.720 0.877 0.469Parkosa maxima 0.079 0.392 0.053 0.491 -0.953 0.025Parkosa tadarida 0.077 0.194 0.198 0.896 0.998 0.026
Nyctinomops laticaudatusChiroptonyssus venezolanus 0.438 0.564 0.986 0.241 0.397 0.831
Host family Pearson product-moment correlation analysisHost species p-value FA MA
Table 3.7. Continued

TaxonBiodiversity r2 p-value B1 r2 p-value B1
All BatsAverage richness 0.149 0.015 0.39 0.127 0.026 0.36Accumulative richness 0.015 0.459 0.001 0.893Log richness 0.008 0.596 0.000 0.999Chao1 richness 0.002 0.765 0.003 0.762Shannon diversity 0.002 0.770 0.039 0.226Shannon evenness 0.020 0.394 0.045 0.196Berger-Parker dominance 0.023 0.353 0.088 0.068Rare species 0.019 0.492 0.002 0.799Beta diversity 0.012 0.513 0.000 0.910
PhyllostomidaeAverage richness 0.126 0.234 0.085 0.333Accumulative richness 0.014 0.700 0.002 0.898Log richness 0.008 0.777 0.002 0.885Chao1 richness 0.010 0.742 0.003 0.869Shannon diversity 0.083 0.339 0.045 0.489Shannon evenness 0.001 0.902 0.001 0.930Berger-Parker dominance 0.000 0.958 0.004 0.846Rare species 0.002 0.875 0.000 0.943Beta diversity 0.011 0.737 0.003 0.852
Table 3.8. Results of simple regression analyses determining the effect of host body size (FA and MA) on ectoparasite biodiversity for all hosts as a group and for each host family. Significant results are bold. No analyses were significant after Bonferroni sequential adjustment. See text for abbreviations.
MAFA

Table 3.8. Continued
TaxonBiodiversity r2 p-value B1 r2 p-value B1
VespertilionidaeAverage richness 0.200 0.195 0.272 0.122Accumulative richness 0.265 0.128 0.098 0.377Log richness 0.218 0.174 0.084 0.418Chao1 richness 0.045 0.558 0.004 0.862Shannon diversity 0.666 0.004 -0.82 0.581 0.010 -0.76Shannon evenness 0.149 0.271 0.225 0.166Berger-Parker dominance 0.515 0.020 0.72 0.451 0.033 0.67Rare species 0.181 0.220 0.049 0.540Beta diversity 0.190 0.209 0.064 0.482
MolossidaeAverage richness 0.336 0.038 0.58 0.557 0.003 0.75Accumulative richness 0.153 0.186 0.112 0.263Log richness 0.160 0.176 0.123 0.241Chao1 richness 0.075 0.364 0.039 0.516Shannon diversity 0.011 0.736 0.019 0.651Shannon evenness 0.094 0.308 0.171 0.160Berger-Parker dominance 0.003 0.861 0.028 0.582Rare species 0.110 0.269 0.110 0.269Beta diversity 0.177 0.153 0.142 0.205
FA MA

199
CHAPTER IV
FLYING ISLANDS II: THE EFFECT OF HOST ABUNDANCE ON ECTOPARASITE
ASSEMBLAGE BIODIVERSITY
Introduction
Biogeography is an integrated discipline that requires understanding of ecological
and evolutionary elements to define patterns and identify causal mechanisms at regional,
continental, and global scales. Biogeographic processes per se may not exist; rather,
large-scale geoclimatic (e.g., tectonic plate movements, changes in sea level, climate, and
oceanic circulation), evolutionary (e.g., adaptation, speciation, extinction), and ecological
(e.g., predation, competition) processes operate in concert to produce biogeographic
patterns. These processes do not operate in isolation. For example, as geoclimatic
characteristics change overtime, species must adapt (i.e., evolve) to remain competitive
or avoid predation. These interactions may result in extinction or speciation.
Consequently, the dynamic nature of interactions at large scales of space and time make
it difficult to determine which mechanisms are dominant driving forces in structuring
communities.
Islands possess many tractable qualities that make them attractive foci for
biogeographic study (Shoener 1988). An island is a more feasible study unit than is a
continent or ocean, and is visibly discreet so that resident populations may be
distinguished more easily along natural boundaries. In addition, islands are abundant and
differ in shape, size, degree of isolation, history, and ecology; consequently they provide
the replication necessary to conduct non-manipulative experiments. Low primary
diversity on islands (i.e., species richness due to immigration) promotes in situ
diversification, with the most isolated islands evincing the largest adaptive radiations
(Paulay, 1994). Whether intra-island or inter-island speciation is more important depends
on the dispersal ability of the taxon and opportunities for isolation from parent
populations (Paulay, 1994). The small size and isolation of islands results in relatively
small populations, which makes island species especially vulnerable to local extinction.

200
Therefore, islands provide biotas with opportunities for larger radiations and more
frequent in situ diversification than occur on mainlands, while simultaneously subjecting
them to higher extinction rates. Because of these phenomena, islands provide insight into
assemblage rules.
In the 1960s, MacArthur and Wilson (1963, 1967) proposed the equilibrium
theory of island biogeography (ETIB) in an attempt to explain patterns of species
richness on islands. The primary predictions of ETIB are two fold: 1) larger islands
maintain greater species richness than do smaller islands, and 2) islands more distant
from a source of colonization support fewer species than do closer islands. Distance
from a source population primarily affects richness by molding immigration rates,
whereas island size primarily affects richness by molding extinction rates.
The ETIB has been much debated (for review see Whitaker 1998). Despite
executing one of the more successful tests of ETIB (Simberloff and Wilson 1970),
Simberloff (1976) was foremost among the critics claiming that ETIB gained paradigm
status despite numerous studies that failed to conform to its predictions. These failures
often are explained by faulting deductive logic or by “willful suspension of belief in the
experimental result” (Simberloff 1976). Early work (Simberloff 1983) with development
and application of null models attempted to discount the dynamic equilibrium facet of
ETIB (i.e., that extinction and immigration rates converge to form a stable equilibrium).
Unfortunately, the design of Simberloff’s model predisposes a finding of randomness and
is not an unbiased test of dynamic equilibria (Colwell and Winkler 1984). Many (Gilbert
1980, Schrader-Frechette and McCoy 1993, Simberloff 1976) remain frustrated by the
continued application of ETIB to various types of islands (e.g., habitat patches, lakes,
parasite hosts) in diverse theoretical and applied situations. Nonetheless, prominent
biologists have endorsed it as being useful and insightful despite simplifying assumptions
(Brown 1971, Rosenzweig 1995). Contention has lasted for decades because of the
different ways that researchers employ ETIB. Detractors often test predictions of ETIB
based on natural history data (e.g., Gilbert 1980, Johnson and Simberloff 1974, Bush and
Whittaker 1991) and discredit the theory because data fail to conform to predictions.

201
However, the failure of these tests should not be surprising given the simplicity of the
theory and the complexity of natural systems (Sismondo 2000). A different perspective
(Haila and Järvinen 1982) views ETIB as a heuristic model that provides opportunities to
explore patterns rather than as a suite of hypotheses to falsify.
Although the ETIB has been applied to a multitude of taxa, few investigations
have focused on ectoparasite assemblages. In evolutionary studies, the focus often is on a
single ectoparasite species and its co-evolutionary relationship with a host and not the
community or assemblage. I use ETIB as a model for understanding host characteristics
that determine community structure of arthropod ectoparasite assemblages on chiropteran
hosts.
Bats and Their Ectoparasites as Model Systems
Generally, bats come in contact with few non-bats, thereby isolating bat
ectoparasites from potential non-bat hosts. In addition, bat species rarely come into
contact with each other, except in multispecific colonies, which usually contain species
from the same family (Kunz 1982), restricting potential inter-specific host transfer of
ectoparasites to members of the same host family. Finally, with the exception of colonial
species, individual bats may be in contact with conspecifics only during periods of
mating and rearing, reducing opportunities for ectoparasite transfer among individuals.
Prolonged periods of host isolation in solitary bat species may increase the likelihood of
local extinction of ectoparasites on the host.
Four host characteristics affect parasite species richness within the context of
ETIB (Kuris et al. 1980): 1) host size, 2) host age, 3) habitat complexity (often correlated
with host age or size), and 4) distance to potential sources of infestation. Host size, and
its relationship to habitat complexity, is evaluated in this chapter, whereas host
population density is considered in chapter IV. Because bats essentially reach adult size
in a few (4 – 7) months (Barclay and Harder 2003), which is only a small fraction of
average life expectancy of bats (11 – 15 years), the effect of size and age can be de-
coupled. This is not possible in work on ectoparasites of fishes (Kennedy 1978a, 1978b,

202
Newbound and Knott 1999), because these hosts exhibit indeterminate growth.
Moreover, bats have long life expectancies compared to animals of similar size (Barclay
and Harder 2003). Such long life may provide ectoparasite assemblages on individual
hosts with opportunities to experience processes similar to those on habitat or oceanic
islands (e.g., local extinction, colonization, rescue effect).
When considering individuals as islands, five aspects of host biology must be
addressed to accommodate traditional interpretations of ETIB (Kuris et al. 1980). First,
inter-island distances fluctuate over time. These fluctuations may occur over short time
frames for vagile hosts such as bats and may create only sporadic opportunities for
infestation. Although host individuals and species are like islands in being discrete and
easily identifiable units, they are not like islands in that the level of isolation is dynamic.
Indeed, considering hosts as islands is complicated because the distances among islands
are changing continually and some islands even make temporary physical contact.
Moreover, physical contact differs in frequency, regularity, and duration depending on
season, as well as host species identity, age, sex, and mating and social systems.
Second, seasonal changes in behavior or physiology may affect the presence of
parasites. Host behavior could have a significant effect on distance to source populations
for bat species that form maternity colonies as well as for those that hibernate
individually or in colonies. Conversely, physiological peculiarities of bats may expose
ectoparasites to phenomena similar to those experienced by inhabitants of temperate
islands. For example, daily changes in bat body temperature (from torpor to activity) are
analogous to daily fluctuations in ambient temperature. Similarly, seasonal changes in
bat body temperature related to hibernation in temperate species or to extended periods of
torpor in sub-tropical or tropical species are analogous to seasonal changes in climate that
are characteristic of temperate islands. Seasonal or daily changes in bat behavior do not
require modification of theory applied to oceanic islands.
Third, quality of the host island changes over ecological time as a result of growth
and aging. Host islands may change over much shorter time frames than do those that
characterize true islands; however, the effects of these changes with respect to invading

203
species are similar. Indeed, fewer complications arise due to age of hosts than due to
successional changes related to the age of islands On true islands, early colonizers may
facilitate invasion by other species, leading to a more predictable order of invasion and
community structure than may occur on host islands. Because all hosts, from birth to
death, are inhabitable islands for potential parasites, evaluations of ETIB for host-parasite
systems are not complicated by host (i.e., island) age.
Fourth, presence of certain parasites may affect characteristics of host islands,
including survival. Characteristics of true islands change with the presence of every
species, either enhancing or diminishing the chance of other species establishing
populations on the island. Still, it is difficult to imagine a scenario where an invading
species would cause the “death” of an island. Furthermore, it is unlikely that the
presence of ectoparasite species commonly facilitates the infestation of others.
Fortunately, little evidence suggests that species ectoparasitic on bats have deleterious
effects on their hosts as to commonly cause death of an otherwise healthy individual.
Indeed, bat host survival is affected marginally by ectoparasite load, although energy
demands may be significantly increased by heavy ectoparasite loads (Marshall 1982).
Nonetheless, all hosts die. How death of an island affects evaluations of ETIB in host-
parasite systems is unclear.
Finally, Kuris et al. (1980) consider hosts to be sufficiently ephemeral to prevent
parasite assemblages from reaching equilibrium. Nonetheless, bats have remarkably long
life spans, with species documented to live 20 years or longer (Barclay and Harder 2003).
Because the life-span of most ectoparasite species is only a few months, bat hosts may be
sufficiently long-lived as to support equilibrial assemblages.
In summary, the only characteristic of bats that may require significant
modification of ETIB for application to ectoparasite assemblages is the potential for
distance from sources to fluctuate quickly and with varying frequency and regularity.
Whereas ectoparasite residency was considered the host individual from which it was
collected, it is possible that individuals residing on one host communicate with other
hosts via direct invasion or the dispersal of offspring, especially species that are vagile

204
and regularly leave the host (e.g., streblids). As such, extinction (i.e., no ectoparasites on
a host individual) and extinction rates, which are fundamental to the equilibrium theory
of island biogeography, may be difficult to define. This is also true of highly interactive
islands (Coleman et al. 1982), such as archipelagos in which mobile members of biotas
move among islands on a daily or monthly basis.
A Host Is an Island, Entire of Itself
Islands have large adaptive radiations of species and high levels of in situ
diversification compared to mainland communities (Paulay 1994). Bat ectoparasite
assemblages exhibit both of these island characteristics, implying that they may have
evolved as isolated evolutionary units. Ectoparasite faunas of mammalian hosts contain
relatively few species, many of which are monoxenous (i.e., occur on only one host
species), indicating evolution of ectoparasite species on the host island (i.e., in situ
diversification). In addition, many ectoparasite families contain hundreds of species, but
all are restricted to a single family of host, indicating relatively recent and large adaptive
radiations. Together, these observations are evidence, albeit circumstantial, that
ectoparasite faunas on bat hosts experience similar ecological and evolutionary
mechanisms to those of biotas on true islands.
Limiting Factors
The most important factor inhibiting ectoparasites from interspecific host transfer
is physical isolation (Kuris et al. 1980, Marshall 1971, 1982, Wenzel and Tipton 1966).
Indeed, many ectoparasite species have virtually no chance to move to another host
species because direct body contact likely is rare between host species. Moreover,
survival away from the host is brief (< 1 day for most bat ectoparasites). Hence, even
ectoparasites that do not require direct body contact of hosts for transfer would have only
brief windows of opportunity to infest alternative host species. When opportunities for
infestation do exist, many factors inhibit successful infestation (i.e., survival and
reproduction) of new host species. In experimental transfers of ectoparasitic insects to

205
non-primary bat host species, nycteribiids starved and bat flies fell victim to predation by
hosts (Marshall 1971, 1982). Often, ectoparasites even find potential host species that are
closely related to their typical host to be unsuitable. Two sets of ideas account for these
observations. First, ectoparasites have specialized adaptations for life on their host and
these may be unsuitable on other host species. More specifically, claws may be
unsuitable for attachment, or body form, setae, and combs may be inappropriate for
movement through hair. Failure to match proper morphological adaptations to the
microhabitat will enhance exposure to predation. Second, parasites may starve because
their mouthparts are unsuitable for feeding or the host’s blood may be inadequate
nutritionally (Marshall 1982).
Within the context of ETIB, host abundance may be analogous to distance to a
source population. Rare host species represent more distant islands because intraspecific
contact should be less frequent for rare species than common species. Bat ectoparasites
usually maintain relatively low population densities on individual bats (Marshall, 1982).
Therefore, in situations where host individuals experience infrequent intraspecific
contact, ectoparasite populations that locally have gone extinct have a lower probability
of re-establishing (i.e., reduced rescue effect) than do those on more common host
species, resulting in an overall reduction in ectoparasite species diversity. Thus, rare host
taxa may be effectively more distant from ectoparasites source populations.
However, the effect of host abundance, per se, may be overshadowed by effects
of social group size. Bats that are solitary may represent very small islands, with harems
or colonies comprising more individuals equivalent to larger islands. Therefore, the
effects of host abundance, as measured by number of captured individuals, on
ectoparasite assemblage diversity may be difficult to determine without consideration of
host social organization.
In simplest terms, there are four possible combinations of host abundance and
social organization. Host species that are rare and solitary represent islands that are small
and far from a source population. Ectoparasite assemblages on such host species should
be among the most species poor, suffering negative effects from increased extinction

206
rates related to small population sizes and reduced immigration rates related to source
population distance. Host species that are abundant and colonial represent islands that
are large and near a source population. Ectoparasite assemblages on such host species
should be among the most species rich because of reduced extinction rates related to
larger population sizes and increased immigration rates related to the proximity of source
populations. Ectoparasite assemblages on rare, colonial host species or common, solitary
host species should have moderate levels of species richness, as responses to abundance
and social system may neutralize each other.
Host abundance (i.e., number of captured individuals) probably is a poor estimate
of host group size. Although some bats were captured while exiting day roosts, no
reliable estimates of host group size in Paraguay are available. Even in instances where
nets were placed at roost exits, many bats were observed avoiding capture. Moreover,
captures are not an accurate estimate of bat abundance. The flight characteristics (i.e.,
speed, height, directness) of all bat species are not the same. Differences in flight affect
the ability to capture bats; for example, species that fly close to the ground (e.g.,
frugivorous phyllostomids) are more susceptible to capture than those that fly at higher
altitudes (e.g., molossids). In addition, some bats (e.g., vespertilionids) display greater
awareness and subsequent avoidance of nets than do other bats (e.g., phyllostomids).
Therefore, the relative abundances of bat species may be affected greatly. Nonetheless,
number of captures is the best estimate available for bat abundances.
I used host (i.e., bat) capture numbers as an estimate of abundance to explore
questions about ectoparasite assemblage diversity within the framework of the
equilibrium theory of island biogeography. A suite of analyses was designed to
determine the effect of host abundance on ectoparasite assemblage diversity at multiple
levels of host taxonomy as well as at local and regional spatial scales. Although
information about host group size for bats of Paraguay is not available, the roosting
habits of some Paraguayan bat species are documented from other locales and this
knowledge of natural history may help interpret ectoparasite assemblage diversity
responses to host abundance (i.e., number of captures).

207
Materials and Methods
Field Methods
Mammals and their associated ectoparasites were collected from July 1995 to
June 1997, and again from July to August in 1998, as part of a scientific expedition
entitled “Paraguayan Mammals and Their Ectoparasites: an Intensive Survey in a
Temperate-Subtropical Interface” (Willig et al. 2000). Bats were surveyed at 28 sites
(Table A.1), representing all major biomes, including many protected areas, and spanning
gradients of moisture and temperature in Paraguay (Figure 2.1). Because of the potential
importance of the Río Paraguay as a biogeographic barrier (Myers 1982), approximately
one-half of the sites were on each side (east or west) of the river. In general, mist nets
were erected in all habitats at a site and were monitored from dusk until 0100 h. Much of
the time, nets were monitored until dawn. Rates of capture for bats in the field depend on
a variety of factors including net characteristics (e.g., mesh size, length, condition,
placement, configuration), temporal factors (e.g., length of time, particular hours of the
night, period in the lunar cycle; Gannon and Willig 1997), local weather conditions
(especially with respect to temperature and precipitation), and history (i.e., number of
consecutive nights at a site; Simmons and Voss 1998). Captured bats were sacrificed and
prepared as standard museum specimens. Specific bat identification was initiated in the
field but verified after comparison with systematic reference materials by C. López-
González (López-González 1998, 2005).
Host and Parasite Systematics
The systematic recommendations of López-González (1998, 2005) were followed
for bat taxa in Paraguay. Ectoparasites were identified using the most recent,
comprehensive information about South American representatives for each family
including Wenzel (1976) and Wenzel et al. (1966) for the Streblidae; Guimarães (1966,
1972) for the Nycteribiidae; Ueshima (1972), Ferris and Usinger (1939, 1945), and

208
Ronderos (1959, 1962) for the Polyctenidae; Rudnick (1960), Machado-Allison (1965),
and Herrin and Tipton (1975) for the Spinturnicidae; Radovsky (1967) and Saunders
(1975) for the Macronyssidae; Dusbábek (1969a, 1969b) and Fain (1978) for the
Myobiidae; Jones et al. (1972) and Fairchild et al. (1966) for the Ixodidae and Argasidae;
Reed and Brennan (1975), Brennan and Reed (1974, 1975), Brennan and Yunker (1966),
and Brennan and Goff (1977) for the Trombiculidae; McDaniel (1970, 1973),
Pinichpongse (1963a, 1963b, 1963c, 1963d), de la Cruz (1969) and Dusbábek and de la
Cruz (1966) for the Chirodiscidae. Details about field and laboratory methods appear in
chapter II.
Statistical Methods
Mean ectoparasite abundance (MEA) per host individual was calculated in
addition to nine metrics of different aspects of biodiversity (e.g., richness, evenness,
diversity, dominance). Four indices estimated richness. MeanS was defined as the
average ectoparasite richness on host individuals of a particular host species.
Accumulative S (AccumS) was defined as the total number of ectoparasite species found
on all individuals of a particular host species. Chao1 is an abundance-based estimate of
cumulative species richness (Chao 1984) calculated using EstimateS (Colwell 2001).
LogS was calculated using Matlab ver. 4.2c.1 for the Macintosh (The Math Works, Inc.
1994; script files available from the author, Appendix E) as an alternative abundance-
based cumulative estimate of richness. This function used a jackknife sampling regime to
produce a mean species-accumulation curve from 1000 random permutations of
individuals based on the ectoparasite species-abundance distribution (SAD) from a
particular host species. In each iteration, individuals were ordered randomly and sampled
without replacement. An iterative process was used to determine the best-fit logistic
curve to the mean species-accumulation curve. The asymptote of that curve is the
number of species predicted to occur in an assemblage after infinite sampling (= LogS).
Preliminary investigations of this metric revealed that it was overly sensitive to rare
species, especially those that occur only once (i.e., singletons), likely leading to

209
overestimates of richness. To diminish the effect of singletons, one individual was added
to each species in the SAD at the beginning of the simulation. This modification better
predicted richness for known universes (Presley, unpublished data) than did the original
incarnation.
Five additional indices (Table 3.1) measured other aspects of ectoparasite SADs.
Shannon Diversity (Shannon), Shannon Evenness (Even), and Berger-Parker Dominance
(Dom) were calculated using Matlab. Following Whitaker (1960), beta diversity
(Betadiv) was calculated as the difference between gamma diversity, as estimated by
LogS (i.e., LogS is the cumulative species richness estimate previously discussed, not
Log[S]), and alpha diversity as estimated by MeanS. Rare ectoparasite species were
defined separately for each ectoparasite taxon (i.e., species, family, or class). Rare
species richness (Rare) was equal to the number of ectoparasite species whose separate
proportional abundances < 0.05. A common definition of rarity (e.g. Chalcraft et al.
2004, Stevens and Willig 2000, Willig et al. 2003) considers a species to be rare if its
abundance is < 1/S of the total individuals of a community or assemblage, where S =
species richness (Camargo 1992). However, problems characterize this definition of
rarity. First, use of 1/S for a species-poor assemblage, like those of ectoparasites on host
individuals, could result in the assignment of relatively abundant species as rare. For
example, in an assemblage with S = 5, a species that comprises 19% of the assemblage is
rare although it represents a large portion of the assemblage. Second, because all
assemblages do not have equal species richness, 1/S defines rareness at different relative
abundances for assemblages with different species richness. Third, 1/S requires at least
one species be rare in all but the most even of assemblages. Defining rareness using the
5% criterion eliminates these problems. Regardless of the employed definition of rare,
species of ectoparasites defined as rare may represent transients or contamination in
addition to identifying species of ectoparasite that are naturally rare on their primary host.
Transient ectoparasite species were defined as those species that were not
members of primary host-ectoparasite associations (i.e., all associations with and
incidence of < 0.05). An exception to this rule was made for small mite taxa (e.g.,

210
Myobiidae, Chirodiscidae, Trombiculidae) that were rare on all host species. The host on
which these parasites most often were found was considered to be the primary
association. The definitions of rareness and transience use 5% rules, however they are
not congruent. Rare species comprise < 5% of the ectoparasite individuals of an
assemblage, whereas transients occur on < 5% of host individuals, regardless of total
number of individuals. Because host-ectoparasite associations were included in defining
transient species, transient species need not be rare and rare species need not be transient.
Nonetheless, in general, transient species were rare.
Simple linear regressions determined the effect of regional host abundance on
ectoparasite assemblage diversity, with measures of ectoparasite diversity as dependent
variables and regional host species abundances as independent variables. Ectoparasite
diversity measures for these analyses were calculated for each host species using all
ectoparasite collections across Paraguay. Because phylogenetic processes influence the
available ectoparasite species pool for each host species, analyses were conducted
separately for families of phyllostomid, vespertilionid, and molossid bats, as well as for
all bat species.
Simple linear regressions evaluated the effect of local host species abundance on
diversity of local ectoparasite assemblages. Regressions were conducted separately for
each of 13 common and wide-spread host species (i.e., those with at least five individuals
inspected for ectoparasites at three or more collection sites). For each host species,
measures of ectoparasite diversity were calculated separately for each site.
Analyses to determine the effect of abundance of local host families (i.e., total
number of host individuals from a given host family at a given site) and abundance of
local host assemblages (i.e., total number of host individuals at a given site) were similar
in design to those evaluating the effect of abundance of local host species. However,
measures of ectoparasite assemblage diversity were calculated after pooling either all
host individuals, or all host individuals of a particular host family, at each site. Analyses
of host-assemblage abundance included all sites. Analyses of host-family abundance
were conducted separately for each family and included only those sites where five or

211
more individuals of that family were inspected for ectoparasites. All regression analyses
were executed using SPSS 4.0 for the Macintosh (SPSS, Inc. 1990).
An ongoing debate characterizes the ecological literature on the use of methods to
maintain type I error rate at a reasonable level for suites of analyses (Hurlbert 2003,
Moran 2003). Chief among the misconceptions that lead to the idea of a need to account
for multiple tests is the view that every test increases overall likelihood of a Type I error.
In actuality, the likelihood of such an error only increases in instances for which the null
hypothesis is rejected (Hurlbert 2003). The Bonferroni sequential adjustment (BSA) is a
common method used to maintain experiment-wise error rate (EWER) at a
predetermined, albeit arbitrary, rate (i.e., alpha). However, this method is conservative
and leads to elevated type II error rates (i.e., failure to reject a null hypothesis that is
false). An alternate approach to the use of BSA is to present exact p-values and make
“reasonable” interpretations of results based on experimental design, differences in
treatment responses, and logic based on experience and scientific understanding (Moran
2003). Hurlbert (2003) stated, “Without knowing how many, if any, of the null
hypotheses being tested are true, it is not possible to calculate the probability of making
one or more Type I errors. For most investigations that probability is likely to be zero.”
Nonetheless, most statisticians and ecologists prefer to maintain EWER at a
predetermined level (i.e., alpha). Therefore, I applied BSA separately to each
independent variable (e.g., host forearm length and mass) in each suite of analyses (i.e.,
table of analyses) and included those results in each table. I was more concerned about
the consequences of ignoring results that could have biological implications than about
the potential for type I errors. Because of the exploratory nature of analyses, I interpreted
results before application of the BSA, with the understanding that a few significant
results contributing to the overall pattern in each discussion may represent type I errors.
In most cases, general patterns are the same, just not as strong, when EWER is
maintained at alpha (i.e., 0.05).

212
Results
Regional Host Abundance. Country-wide host abundance does not significantly
affect biodiversity of ectoparasite assemblages on host species. Although many measures
of biodiversity (Table 4.1) responded to regional host abundance (RHA), all significant
results are associated with increased opportunities to observe contamination, transients,
or rare ectoparasite species as a consequence of larger sample sizes (i.e., passive
sampling). Accumulative richness is a direct measure of this phenomenon and was
always significantly and positively affected by RHA. In addition, number of rare species
had a highly significant, positive relationship with RHA in analyses of bat species as a
group and within each of the three species-rich bat families of Paraguay. LogS and
Chao1 are richness estimators that are sensitive to number of rare species; both responded
significantly to RHA. Beta diversity was defined as the difference between LogS and
MeanS. Because MeanS was unaffected by RHA, but LogS was positively affected by
RHA, beta diversity exhibited a positive, significant response to RHA in all analyses.
Because rare species increase with host sample size, Shannon evenness exhibited
significant, negative responses to RHA. All measures insensitive to rare species (i.e.,
MEA, MeanS, Shannon, and Dom) were unaffected by RHA (Table 4.1).
Local Host Abundance. Analyses of the effect of local host abundance (LHA) on
ectoparasite assemblage biodiversity within 13 common, wide-spread host species
yielded similar conclusions to those at the regional scale (Tables 4.2 – 4.4). Significant,
positive responses were associated with the number of rare species or transients, or with
contamination associated with larger ectoparasite sample sizes. The effect of passive
sampling (i.e., the addition of rare species) was strong enough to evince significant,
negative responses in Shannon evenness for ectoparasite assemblages from Sturnira
lilium and Myotis nigricans, as well as a significant, positive response in Shannon
diversity for the ectoparasite assemblage from Sturnira lilium. Analyses of host species
(e.g., Platyrrhinus lineatus, Lasiurus ega) with sufficient collections (i.e., 5 or more
inspected hosts) at fewer sites had less power and fewer statistically significant responses

213
than did analyses of host species occurring at a greater number of sites (e.g., Sturnira
lilium, Artibeus lituratus).
Analyses that combined ectoparasite assemblages collected from common host
families and all host species at each site produced similar patterns to analyses of
ectoparasite assembles from particular host species (Table 4.5). Ectoparasite
assemblages from more abundant hosts had significantly more ectoparasite species that
are rare. Moreover, only diversity indices that are sensitive to number of rare species
(i.e., AccumS, LogS, Chao1, beta diversity) consistently evinced significant and positive
responses to host abundance. However, because these ectoparasite assemblages are from
host assemblages instead of host populations, alternative explanations should be
explored.
In addition to the potential effect of passive sampling on number of transient or
rare ectoparasite species, the effect of host abundance on ectoparasite biodiversity could
be caused by differences in host SADs. Host species richness and number of rare species
increase with host sample size. Moreover, increases in host species richness occur with
increased number of rare species. To explore the effects of host SADs on ectoparasite
biodiversity, simple linear regressions quantified the effects of host sample size on host
species richness and number of rare host species (Table 4.6). In general, as host sample
sizes increased, so did host richness and number of rare host species. Moreover,
increases in host richness resulted from the addition of rare species, and not the addition
of host species of high or moderate abundances. Host and ectoparasite SADs respond
similarly to increases in sample size. Changes in host SADs with increased sample size
may contribute to the effects of host sample size on ectoparasite biodiversity.
Discussion
Host Species Abundance and Ectoparasite Biodiversity
The effects of host abundance (i.e., sample size) on ectoparasite biodiversity were
predictable. The opportunity for contamination or to observe transients, rare species, or
species that are difficult to collect increases as sample size increases. Therefore,

214
measures of biodiversity that are sensitive to the number of rare species should respond
positively to sample size, as was observed. However, responses of Shannon diversity and
evenness did not meet expectations. Because ectoparasite richness increased with host
sample size, Shannon diversity was expected to increase as well. Shannon evenness was
expected to decrease because rare species were added to ectoparasite assemblages. The
statistical response of these metrics to sample size did not correspond to expectations.
Most host species were collected in sufficient number (i.e., > 5 individuals) at only a few
(i.e., < 6) sites, resulting in low statistical power. In addition, some host species (e.g.,
Molossops temminckii) that occurred in sufficient numbers at many sites evinced little
variation in host sample size, which reduced statistical power. Only Artibeus lituratus,
Sturnira lilium, and Eumops patagonicus occurred in sufficient numbers at 10 or more
sites, and only the ectoparasite assemblages from S. lilium responded as expected (i.e.,
Shannon diversity increased with host sample size and Shannon evenness decreased with
sample size). In general, Eumops are colonial (Best et al. 1996, 1997, 2002, Kiser 1995,
Redford and Eisenberg 1992) and colonies of E. patagonicus colonies commonly occur
in human dwellings in Paraguay (López-González 1998). Frequent body contact among
such host individuals provides ectoparasites with opportunities to move among host
individuals. This may serve to homogenize ectoparasite richness and composition among
host individuals, which could obviate the effects of increased host sample sizes.
Available natural history information does not suggest any behavioral differences
between A. lituratus and S. lilium that would account for the lack of effect of host
abundance on ectoparasite evenness and diversity for ectoparasite assemblages from A.
lituratus. Nonetheless, the ectoparasite fauna of A. lituratus differs from those of closely
related host species. A. lituratus had the fewest ectoparasites per individual of any
common stenodermatine in Paraguay and less than half those occurring on congeners.
Moreover, A. lituratus does not have primary associations with the same genera of
streblids that occur on other species of Artibeus in Paraguay (Tables 2.15 – 2.17,
Appendix B).

215
Parallels may be drawn between the effect of host abundance on ectoparasite
species richness and species-area relationships. Two primary factors account for species-
area relationships (Rosenzweig 1995, Williamson 1988). First, larger habitats have more
species than do smaller habitats. In general, assemblages are characterized by few
common species, few species of intermediate abundance, and many rare species (i.e.,
specialists). Species richness in larger habitats increases because there are more rare
species than in smaller habitats; the number of non-rare species changes little. Larger
habitats support larger populations that reduce the risk of stochastic extinction and allow
a greater number of rare species to persist. Therefore, as habitat size increases, SADs
should change by the addition of rare species.
Second, in general, as area increases the number of habitats increases, and areas
with more types of habitat have more species than do areas with fewer types of habitats
(Williamson 1988). Each habitat type should have distinct species that are abundant, of
intermediate abundance, and rare. Assuming that habitats are sampled equally, as the
number of habitats increases with area, the richness of species of all abundance levels
should increase.
If host abundance is analogous to area for ectoparasites, then host species that are
more abundant (i.e., those that represent larger areas) should have greater ectoparasite
richness than would host species that are less abundant. The ectoparasite assemblage
data from the bats of Paraguay are consistent with this prediction. Alternatively,
abundant host species do not provide a greater number of habitats. Therefore, as host
species abundance increases, ectoparasite species abundance distributions should change
by addition of rare species, which is exactly what is observed here.
The More Individuals Hypothesis (Srivastava and Lawton 1998) was developed
by Preston (1962a, 1962b) and posits that as the number of individuals in an area (or
sampled) increases, so does species richness. Three mechanisms have been invoked to
explain this pattern: speciation, random placement (also called passive sampling), and
local extinction rates (Scheiner and Willig 2004).

216
Speciation rates are thought to increase with the number of individuals
(VanderMeulen et al. 2001); more individuals provide greater opportunity for chance
mutations that lead to speciation. This mechanism is most suited for patterns at large
scales and provides the richness necessary to explain patterns at smaller scales that
sample from larger regional pools of individuals (Scheiner and Willig 2004).
At smaller scales, random placement of individuals (i.e., passive sampling)
creates positive relationships between number of individuals and number of species if
local richness is determined by random sampling from a species pool (Coleman 1981;
Coleman et al. 1982); more individuals increases the likelihood of including rare species
due to chance alone. Moreover, as the number of individuals increases, the number of
species that maintain populations above some minimum viable size increases, resulting in
reduced extinction rates.
Ectoparasite assemblages from more abundant Paraguayan bat species or families
have greater cumulative ectoparasite abundances and are more species-rich. Passive
sampling and reduced extinction rates are the most appropriate mechanism to consider for
patterns observed on ectoparasite assemblages of bats of Paraguay. Larger samples of
inspected hosts provide more opportunities to observe rare or transient species (passive
sampling) from the regional species pool. In addition, larger host population sizes
provide a greater resource base (i.e., greater productivity) that may allow more species of
ectoparasite to maintain viable population sizes and reduce extinction rates that result in
greater assemblage richness.
Host Family Abundance and Ectoparasite Biodiversity
The effects of host abundance on ectoparasite biodiversity at the host family level
were unexpected. In general, if more individuals of a host family occur at a site, more
species from that family are present. Because of host specificity, increases in host
species richness should increase ectoparasite species richness. In addition, transient
species usually are primary ectoparasites of host species from the same family. Because
ectoparasites were pooled from all members of each host family, fewer rare species

217
should emerge as ectoparasites that are rare (i.e., transient) on one host species should be
more common on other host species. Therefore, I expected ectoparasite assemblages
pooled from larger groups of host individuals to be more species-rich and even, with
relatively fewer rare species, than would characterize assemblages pooled from smaller
groups of host individuals. This was not the case. Indices of biodiversity that are
sensitive to number of rare species responded significantly to host abundance (Table 4.5),
indicating an increase in number of rare species. Alternatively, indices that are sensitive
to evenness and richness (i.e., Shannon diversity and evenness) did not respond
significantly to host abundance.
Expectations concerning the effect of host abundance on ectoparasite biodiversity
were not realized. As host sample size increases, host SADs change by increasing the
number of rare species, which results in greater species richness (Table 4.6). From the
ectoparasites perspective, each host species is a distinct type of habitat. Addition of rare
host species increases the number of “rare habitats” to the landscape. Abundant species
restricted to rare habitats will be rare from a landscape perspective. As the number of
rare host species increases, the number of rare ectoparasites increases because
monoxenous ectoparasites from rare or uncommon host species continue to augment the
ectoparasite assemblage.
Host Abundance and ETIB
Hosts may be considered “islands” at multiple scales (i.e., host individuals or host
populations) within the context of ETIB. Consequently, host abundance may be
analogous to island area or distance to a source population depending on the scale of
analysis. If host individuals are considered to be islands, host abundance may be a
measure of distance to a source population for ectoparasite assemblages. However, if
host populations or assemblages are considered to be islands, host abundance may be a
measure of island area for ectoparasite assemblages. Although this distinction does not
affect the analytical design of this study, interpretation of results within the context of
ETIB is problematic.

218
For example, if individuals of host species X have greater ectoparasite species
richness from areas of higher host abundance than from areas of lower host abundance,
multiple interpretations exist for the same pattern. If individuals of species X are
considered islands and host abundance is a measure of distance to a source population,
the interpretation within the context of ETIB is that host individuals (i.e., islands) for
which host abundance is higher (i.e., those that are closer to a source population) have
greater ectoparasite richness because of increased immigration rates. Alternatively, if
host populations of species X are considered islands and host abundance is a measure of
island area, the interpretation is that host populations (i.e., islands) that are larger have
greater ectoparasite richness because of reduced extinction rates. Consequently, two
mechanisms may operate to produce the same patterns. Disentangling the influence of
each mechanism is difficult.
Herbivorous insects that live and feed on plants represent a similar system to that
of ectoparasites on bats. A body of literature explores the effect of host plant
distribution, host plant density, host plant size, and resource (i.e., leaf and flower
abundance) abundance (de Alckmin Marques et al. 2000, Frenzel and Brandl 1998,
Lewinsohn 1991) on herbivorous insect richness. Host plant geographic range size
affects richness of generalist herbivores across the entire range of the species, but does
not affect specialist richness or local herbivore richness. Only resource abundance (i.e.,
leaf and flower mass) is correlated positively with local herbivore richness. The limiting
resource for ectoparasites of bats is space on the host. Resource abundance on individual
bats has little variation and is unimportant in determining ectoparasite richness.
However, if host resources are viewed at the population level, considerable variation
characterizes resource abundance. If resource abundance determines ectoparasite
richness, bat species abundance is a more important factor in determining ectoparasite
assemblage richness than is bat body size. Therefore, within the context of ETIB, host
populations and not host individuals should be viewed as islands. This inference is
consistent with the conclusions from chapter III. Individual bats do not provide sufficient

219
space for ectoparasite population growth and ectoparasite assemblages on groups of host
individuals are more likely to conform to predictions of ETIB.
Evolution of Specificity Versus Maintenance of Transience.
Current theory concerning the evolution of host specificity (ter Hofstede et al.
2004) states that ectoparasites of common host species should become host specific (i.e.,
monoxenous). If a host is an abundant and reliable resource, then an ectoparasite species
that evolves specializations for life on that host species (i.e., becomes more host specific)
should persist because its resource base allows for large populations and reduced
probability of stochastic extinction. Alternatively, ectoparasites whose primary host is
uncommon that evolve specializations for that host have a higher probability of
experiencing a chance extinction because they specialize on a rare resource. Therefore,
ectoparasites on uncommon host species should remain generalists with good
colonization abilities (ter Hofstede et al. 2004). This framework results in host specific,
specialists with poor colonization abilities on common host species and non-host specific,
generalists with good colonization abilities on rare host species. In addition, on their
primary hosts, ectoparasites should be competitively dominant to transient ectoparasite
species.
A logical problem exists with this scenario. When a rare host species population
declines or goes extinct the resident ectoparasites should colonize alternate host species.
Ideally, a more common host species should be colonized. However, common host
species should already be infested by monoxenous ectoparasites that are competitively
dominant to transients, which would result in failed colonization. Alternatively, other
uncommon or rare host species could be colonized; however, moving from one rare host
species to another does not improve the chances of persistence of the ectoparasites
species. Moreover, alternate rare host species may be difficult to locate because they are
rare. This suggests that ectoparasite species on rare host species may be prone to
extinction whether they become specialized or not.

220
Data from Paraguay do not support the theoretical suppositions of ter Hofstede et
al. (2004). Host species abundance did not significantly affect the number of
monoxenous ectoparasites on a host species (p = 0.28, r2 = 0.03). The six most abundant
host species harbored 1, 5, 1, 0, 1, and 0 monoxenous ectoparasite species. Host species
with the most monoxenous ectoparasites were Sturnira lilium, Desmodus rotundus, and
Noctilio albiventris, which harbored 5, 4, and 4 monoxenous ectoparasite species,
respectively. The genus Sturnira is basal within, and a sister taxon to the rest of, the
Stenodermatinae (Baker et al. 2003, Jones et al. 2002, Owen 1987). The distinctive
nature of Sturnira resulted in placing it in its own subfamily (i.e., Sturnirinae; Miller
1907). Desmodus is monospecific and a member of a subfamily with only three species.
Noctilio comprises two species and is the only genus in the Noctilionidae. Phylogenetic
isolation of host species rather than host abundance appears to be a factor that more likely
determines the number of highly host specific ectoparasites.
Conclusions
Biodiversity of ectoparasite assemblages increased with host abundance.
Although, these results may be an artifact of collection or passive sampling, parallels
exist between the effect of host abundance on ectoparasite species richness and species-
area relationships. Larger habitats harbor more rare species than do smaller habitats.
Similarly, more abundant bat species harbor a greater number of rare ectoparasite species
than do less abundant bat species. Transient ectoparasites do not prefer common host
species, and occur on all host species at similar levels of incidence regardless of host
abundance.
Biodiversity of ectoparasites increased with host abundance when ectoparasites
were combined for all host species within each host family or for all host species as a
group. This parallels results obtained in analyses at the level of host species. However,
the cause of this pattern was not related to occurrence of transients, but reflected changes
in host SADs. As the number of host individuals increased, so did the number of rare
host species. Because bat ectoparasites are highly host-specific, additional rare host

221
species result in additional rare ectoparasite species. Consequently, different mechanisms
influence the same pattern of ectoparasite biodiversity at multiple levels of host
phylogeny.
Within the context of ETIB, hosts may be considered “islands” at multiple scales
(i.e., host individuals or host populations). As a result, host abundance may be a measure
of distance to a source population or a measure of island area for ectoparasite
assemblages. Disentangling the influence of each mechanism is difficult. Regardless of
scale, ETIB predicts that more abundant hosts should support more species-rich
ectoparasite faunas, which was observed for ectoparasite assemblages on bats of
Paraguay.

222
Literature Cited
Baker, R. J., S. R. Hoofer, C. A. Porter, and R. A. Van Den Bussche. 2003. Diversification among New World leaf-nosed bats: an evolutionary hypothesis and classification inferred from digenomic congruence of DNA sequence. Occasional Papers, Museum of Texas Tech University 230:1-32.
Baker, R. J., J. C. Patton, H. H. Genoways, and J. W. Bickham. 1988. Genetic studies of
Lasiurus (Chiroptera: Vespertilionidae). Occasional Papers, The Museum, Texas Tech University 117:1-15.
Barclay, R. M. R., and L. D. Harder. 2003. Life histories of bats: life in the slow lane.
Pp. 209-253 in Bat ecology (T. H. Kunz and M. B. Fenton, eds.). University of Chicago Press, Chicago, Illinois.
Barquez, R. M., M. A. Mares, and J. K. Braun. 1999. The bats of Argentina. Special
Publications, The Museum, Texas Tech University 42:1-275. Best, T. L., J. L. Hunt, L. A. McWilliams, and K. G. Smith. 2002. Eumops
auripendulus. Mammalian Species 708:1-5. Best, T. L., W. M. Kiser, and J. C. Rainey. 1997. Eumops glaucinus. Mammalian
Species 551:1-6. Best, T. L., W. M. Kiser, and P. W. Freeman. 1996. Eumops perotis. Mammalian
Species 534:1-8. Brennan, J. M., and M. L. Goff. 1977. Keys to the genera of chiggers of the Western
Hemisphere (Acarina: Trombiculidae). The Journal of Parasitology 63:554-566. Brennan, J. M., and J. T. Reed. 1974. The genus Eutrombicula in Venezuela (Acarina:
Trombiculidae). The Journal of Parasitology 60:699-711. Brennan, J. M., and J. T. Reed. 1975. A list of Venezuela chiggers, particularly of small
mammalian hosts (Acarina: Trombiculidae). Brigham Young University Science Bulletin, Biological Series 20 (1):45-75.
Brennan, J. M., and C. E. Yunker. 1966. The chiggers of Panama (Acarina:
Trombiculidae). Pp. 221-266 in Ectoparasites of Panama (R. L. Wenzel and V. J. Tipton, eds.). Field Museum of Natural History, Chicago, Illinois.
Brown, J. H. 1971. Mammals on mountaintops: nonequilibrium insular biogeography.
The American Naturalist 105:467-478.

223
Bush, M. B., and R. J. Whittaker. 1991. Krakatau: colonization patterns and hierarchies.
Journal of Biogeography 18:341-356. Chao, A. 1984. Non-parametric estimation of the number of classes in a population.
Scandinavian Journal of Statistics 11:265-270. Coleman, B. D. 1981. On random placement and species-area relationships.
Mathematical Biosciences 54:191-215. Coleman, B. D., M. A. Mares, M. R. Willig, and Y.-H. Hsieh. 1982. Randomness, area,
and species richness. Ecology 63:1121-1133. Colwell, R. K., and D. W. Winkler. 1984. A null model for null models. Pp. 344-359 in
Ecological communities: conceptual issues and the evidence (D. Strong, D. Simberloff, L. Abele, and A. Thistle, eds.). Princeton University Press, Princeton, New Jersey.
Colwell, R. K. 2001. EstimateS: statistical estimation of species richness and shared
species from samples for the Macintosh (V 6.0b1). Available online at http://viceroy.eeb.uconn.edu/EstimateS.
de la Cruz, J. 1969. Nueva espécie de ácaro (Acarina: Listrophoridae) parásito de
murciélagos cubanos. Poeyana, Seria A 62:1-8. Dusbábek, F. 1969a. To the phylogeny of genera of the family Myobiidae. Acarologia
11:537-574. Dusbábek, F. 1969b. Generic revision of the myobiid mites (Acarina: Myobiidae)
parasitic on bats. Folia Parasitologica 16:1-17. Dusbábek, F., and J. de la Cruz. 1966. Nuevos géneros y espécies de acaros (Acarina:
Listrophoridae) parásitos de murciélagos cubanos. Poeyana, Seria A 31:1-20. Fain, A. 1978. Mites of the family Myobiidae (Acarina: Prostigmata) from mammals in
the collection of the British Museum (Natural History). Bulletin of the British Museum of Natural History, Zoological Series 33:193-229.
Fairchild, G. B., G. M. Kohls, and V. J. Tipton. 1966. The ticks of Panama (Acarina:
Ixodoidea). Pp. 167-220 in Ectoparasites of Panama (R. L. Wenzel and V. J. Tipton, eds.). Field Museum of Natural History, Chicago, Illinois.
Ferris, G. F., and R. L. Usinger. 1939. The family Polyctenidae (Hemiptera:
Heteroptera). Microentomology 4:1-50.

224
Ferris, G. F., and R. L. Usinger. 1945. Notes and descriptions of American Polyctenidae
(Hemiptera). Pan Pacific Entomologist 21:121-124. Gannon, M.R., and M.R. Willig. 1997. The effect of lunar illumination on movement
and activity of the red fig-eating bat (Stenoderma rufum). Biotropica 29:525-529. Gilbert, F. S. 1980. The equilibrium theory of island biogeography, fact or fiction?
Journal of Biogeography 7:209-235. Graciolli, G., and C. W. Dick. 2004. Metelasmus wenzeli new species (Diptera:
Streblidae: Streblinae) from southern South America. Zootaxa (submitted). Guimarães, L. R. 1966. Nycteribiid bat flies from Panama (Diptera: Nycteribiidae). Pp.
393-404 in Ectoparasites of Panama (R. L. Wenzel and V. J. Tipton, eds.). Field Museum of Natural History, Chicago, Illinois.
Guimarães, L. R. 1972. Venezuelan nycteribiid batflies (Diptera: Nycteribiidae).
Brigham Young University Science Bulletin, Biological Series 17 (1):1-11. Haila, Y., and O. Järvinen. 1982. The role of theoretical concepts in understanding the
ecological theatre: a case study on island biogeography. Pp. 261-278 in Conceptual issues in ecology (E. Saarinen, ed.). D. Reidel, Dordrecht, The Netherlands.
Handley, C. O., Jr. 1987. New species of mammals from northern South America: fruit-
eating bats, genus Artibeus Leach. Pp. 163-172 in Studies in neotropical mammalogy: essays in honor of Philip Hershkovitz (B. D. Patterson and R. M. Timm, eds.). Fieldiana, Zoology (New Series) 39:1-506.
Herrin, C. S., and V. J. Tipton. 1975. Spinturnicid mites of Venezuela. Brigham Young
University Science Bulletin, Biological Series 20 (2):1-72. Hurlbert, S. H. 2003. Design and analysis: uncertain intent, uncertain result. Ecology
84:810-812. Johnson, M. P., and D. S. Simberloff. 1974. Environmental determinants of island
species numbers in the British Isles. Journal of Biogeography 1:149-154. Jones, E. K, C. M. Clifford, J. E. Keirans, and G. M. Kohls. 1972. Ticks of Venezuela
(Acarina: Ixodoidea) with a key to the species of Amblyomma in the Western Hemisphere. Brigham Young University Science Bulletin, Biological Series 17 (4):1-40.

225
Jones, K. E., A. Purvis, A. MacLarnon, O. R. P. Bininda-Emonds, and N. B. Simmons. 2002. A phylogenetic supertree of the bats (Mammalia: Chiroptera). Biological Review 77:223-259.
Kennedy, C. R. 1978a. An analysis of the metazoan parasitocoenoses of brown trout
Salmo trutta from British lakes. Journal of Fish Biology 13:255-263. Kennedy, C. R. 1978b. The parasite fauna of resident char Salvelinus alpinus from
Arctic islands, with special reference to Bear Island. Journal of Fish Biology 13:457-466.
Kiser, W. M. 1995. Eumops underwoodi. Mammalian Species 516:1-4. Koopman, K. F. 1993. Order Chiroptera. Pp. 137-241 in Mammal species of the world:
a taxonomic and geographic reference (D. E. Wilson and D. M. Reeder, eds.). Smithsonian Institution Press, Washington, D. C.
Kunz, T. H. 1982. Roosting ecology. Pp. 1-56 in Ecology of bats. (T. H. Kunz, ed.).
Plenum Press, New York, New York. Kuris, A. M., A. R. Blaustein, and J. J. Alió. 1980. Hosts as islands. The American
Naturalist 116:570-586. López-González, C. 1998. Systematics and zoogeography of the bats of Paraguay.
Ph.D. dissertation, Texas Tech University, Lubbock, Texas. López-González, C. 2005. Los murciélagos de Paraguay. Publicaciones Comité
Español MAB y Red Ibero MAB (in press). MacArthur, R. H., and E. O. Wilson. 1963. An equilibrium theory of insular
zoogeography. Evolution 17:373-387. MacArthur, R. H., and E. O. Wilson. 1967. The theory of island biogeography.
Princeton University Press, Princeton, New Jersey. McDaniel, B. 1970. The labidocarpid batmites of Nicaragua (Listrophoroidea :
Labidocarpidae). Acarologia 12:803-823. McDaniel, B. 1973. Labidocarpid bat-mites of Venezuela (Listophoroidea:
Labidocarpidae). Brigham Young University Science Bulletin, Biological Series 17 (2):15-32.
Machado-Allison, C. E. 1965. Las espécies Venezolanas del género Periglischrus
Kolenati 1857. Acta Biología Venezuelica 4:259-348.

226
Marshall, A. G. 1971. The ecology of Basilia hispida (Diptera: Nycteribiidae) in
Malaysia. Journal of Animal Ecology 40:141-154. Marshall, A. G. 1982. Ecology of insects ectoparasitic on bats. Pp. 369-401 in Ecology
of bats. (T. H. Kunz, ed.). Plenum Press, New York, New York. The Math Works, Inc. 1994. Matlab for Macintosh, ver. 4.2c.1. Prentice Hall,
Englewood Cliffs, New Jersey. Miller, G. S., Jr. 1907. The families and genera of bats. Bulletin of the Unites States
National Museum 57:1-65. Moran, M. D. 2003. Arguments for rejecting the sequential Bonferroni in ecological
studies. Oikos 100:403-405. Myers, P. 1982. Origins and affinities of the mammal fauna of Paraguay. Pp. 85-93 in
Mammalian biology in South America (M. A. Mares and H. H. Genoways, eds.). Special Publications, Pymatuning Laboratory of Ecology 6:1-539.
Newbound, D. R., and B. Knott. 1999. Parasitic copepods from pelagic sharks in
western Australia. Bulletin of Marine Science 65:715-724. Oliver, I., and A. J. Beattie. 1996. Invertebrate morphospecies as surrogates for species:
a case study. Conservation Biology 10:99-109. Owen, R. D. 1987. Phylogenetic analyses of the bat subfamily Stenodermatinae
(Mammalia: Chiroptera). Special Publications, Museum of Texas Tech University 26:1-65.
Paulay, G. 1994. Biodiversity on oceanic islands: its origin and extinction. American
Zoologist, 34:134-144. Pik, A. J., I. Oliver, and A. J. Beattie. 1999. Taxonomic sufficiency in ecological studies
of terrestrial invertebrates. Australian Journal of Ecology 24:555-562. Pinichpongse, S. 1963a. A review of the Chirodiscinae with descriptions of new taxa
(Acarina : Listrophoridae) (1st series). Acarologia 5:81-91. Pinichpongse, S. 1963b. A review of the Chirodiscinae with descriptions of new taxa
(Acarina : Listrophoridae) (Part Two). Acarologia 5:266-278. Pinichpongse, S. 1963c. A review of the Chirodiscinae with descriptions of new taxa
(Acarina : Listrophoridae) (Part three). Acarologia 5:397-404.

227
Pinichpongse, S. 1963d. A review of the Chirodiscinae with descriptions of new taxa
(Acarina : Listrophoridae) (Part four). Acarologia 5:620-627. Preston, F. W. 1962a. The canonical distribution of commonness and rarity: part I.
Ecology 43:185-215. Preston, F. W. 1962b. The canonical distribution of commonness and rarity: part II.
Ecology 43:410-432. Radovsky, F. J. 1967. The Macronyssidae and Laelapidae (Acarina: Mesostigmata)
parasitic on bats. University of California Publications in Entomology 46:1-288. Redford, K. H., and J. F. Eisenberg. 1992. Mammals of the Neotropics: the southern
cone. Volume 2, Chile, Argentina, Uruguay, Paraguay. The University of Chicago Press, Chicago, Illinois.
Reed, J. T., and J. M. Brennan. 1975. The subfamily Leeuwenhoekinae in the Neotropics
(Acarina: Trombiculidae). Brigham Young University Science Bulletin, Biological Series 20 (1):1-42.
Ronderos, R. A. 1959. Polycténidae americanos. I. (Hemiptera). Actas y Trabajos del
Primer Congreso Sudamericano de Zoologia 3:173-180. Ronderos, R. A. 1962. Polycténidae americanos. II. (Hemiptera). Acta Zoológica
Lilloana 18:259-262. Rosenzweig, M. L. 1995. Species diversity in space and time. Cambridge University
Press, Cambridge, England. Rudnick, A. 1960. A revision of the mites of the family Spinturnicidae (Acarina).
University of California Publications in Entomology 17: 157-283. Saunders, R. C. 1975. Venezuelan Macronyssidae (Acarina: Mesostigmata). Brigham
Young University Science Bulletin, Biological Series 20 (2):75-90. Scheiner, S. M., and M. R. Willig. 2004. Toward a unified theory of diversity gradients.
The American Naturalist. (submitted). Schrader-Frechette, K. S., and E. D. McCoy (Eds.). 1993. Method in ecology: strategies
for conservation. Cambridge University Press, Cambridge, England. Shoener, A. 1988. Experimental island biogeography. Pp. 485-512 in Analytical
biogeography: an integrated approach to the study of animal and plant

228
distributions (A. Myers and P. Giller, eds.). Chapman and Hall, New York, New York.
Simberloff, D. S. 1976. Species turnover and equilibrium island biogeography. Science
194:572-578. Simberloff, D. S. 1983. When is an island community in equilibrium? Science
220:1275-1277. Simberloff, D. S., and E. O. Wilson. 1970. Experimental zoogeography of islands. A
two-year record of colonization. Ecology 51:934-937. Simmons, N. B., and R. S. Voss. 1998. The mammals of Paracou, French Guiana: a
neotropical lowland rainforest fauna. Part 1. Bats. Bulletin of the American Museum of Natural History 237:1-219.
Sismondo, S. 2000. Island biogeography and the multiple domains of models. Biology
and Philosophy 15:239-258. SPSS, Inc. 1990. The SPSS base system user’s guide. SPSS, Inc., Chicago, Illinois. Srivastava, D. S., and J. H. Lawton. 1998. Why more productive sites have more
species: an experimental test of theory using tree-hole communities. The American Naturalist 152:510-529.
ter Hofstede, H. M., M. B. Fenton, and J. O. Whitaker, Jr. 2004. Host and host-site
specificity of bat flies (Diptera: Streblidae and Nycteribiidae) of Neotropical bats (Chiroptera). Canadian Journal of Zoology 82:616-626.
Ueshima N. 1972. New World Polyctenidae (Hemiptera), with special reference to
Venezuelan species. Brigham Young University Science Bulletin, Biological Series 17 (1):13-21.
VanderMeulen, M. A., A. J. Hudson, and S. M. Scheiner. 2001. Three evolutionary
hypotheses for the hump-shaped productivity-diversity curve. Evolutionary Ecology Research 3:379-392.
Wenzel, R. L. 1976. The streblid batflies of Venezuela (Diptera: Streblidae). Brigham
Young University Science Bulletin, Biological Series 20 (4):1-177. Wenzel, R. L., V. J. Tipton, and A. Kiewlicz. 1966. The streblid batflies of Panama
(Diptera: Streblidae). Pp. 405-675 in Ectoparasites of Panama (R. L. Wenzel and V. J. Tipton, eds.). Field Museum of Natural History, Chicago, Illinois.

229
Whittaker, R. H. 1960. Vegetation of the Kiskiyou Mountains, Oregon and California. Ecological Monographs 30:279-338.
Whitaker, R. J. 1998. Island biogeography: ecology, evolution and conservation.
Oxford University Press, Oxford, England. Williamson. M. 1988. Relationships of species number to area, distance and other
variables. Pp. 91-115 in Analytical biogeography: an integrated approach to the study of animal and plant distributions (A. Myers and P. Giller, eds.). Chapman and Hall, New York, New York.
Willig, M. R., S. J. Presley, R. D. Owen, and C. López-González. 2000. Composition
and structure of bat assemblages in Paraguay: a subtropical – temperate interface. Journal of Mammalogy 81:386-401.

Bat group r2 p-value B1
Mean ectoparasite abundanceAll bats 0.061 0.130Phyllostomidae 0.106 0.277Vespertilionidae 0.055 0.514Molossidae 0.055 0.442
Average richnessAll bats 0.012 0.507Phyllostomidae 0.004 0.841Vespertilionidae 0.239 0.670Molossidae 0.021 0.635
Accumulative richnessAll bats 0.428 < 0.001 0.65Phyllostomidae 0.700 < 0.001 0.84Vespertilionidae 0.772 < 0.001 0.88Molossidae 0.449 0.012 0.67
Log richnessAll bats 0.474 < 0.001 0.69Phyllostomidae 0.719 < 0.001 0.85Vespertilionidae 0.660 0.004 0.81Molossidae 0.479 0.009 0.69
Chao1 richnessAll bats 0.432 < 0.001 0.66Phyllostomidae 0.739 < 0.001 0.86Vespertilionidae 0.363 0.065Molossidae 0.449 0.012 0.67
Shannon diversityAll bats 0.019 0.399Phyllostomidae 0.061 0.415Vespertilionidae 0.212 0.180Molossidae 0.001 0.906
Table 4.1. Results of simple regression analyses determining the effect of regional (i.e., country-wide) host abundance on the biodiversity of ectoparasite assemblages from all hosts as a group and for each host family. Significant results are bold. Significant results after Bonferroni sequential adjustment are underlined. See text for abbreviations.Bioiversity measure

Table 4.1. Continued
Bat group r2 p-value B1
Shannon evennessAll bats 0.139 0.019 -0.370Phyllostomidae 0.178 0.152Vespertilionidae 0.145 0.278Molossidae 0.331 0.040 -0.570
Berger-Parker dominanceAll bats 0.000 0.908Phyllostomidae 0.033 0.551Vespertilionidae 0.093 0.391Molossidae 0.049 0.469
Rare speciesAll bats 0.438 < 0.001 0.66Phyllostomidae 0.683 < 0.001 0.83Vespertilionidae 0.751 0.001 0.87Molossidae 0.527 0.005 0.73
Beta diversityAll bats 0.483 < 0.001 0.70Phyllostomidae 0.725 < 0.001 0.85Vespertilionidae 0.679 0.003 0.82Molossidae 0.487 0.008 0.70
Bioiversity measure

Bat species r2 p-value B1
Mean ectoparasite abundanceArtibeus fimbriatus 0.217 0.534Artibeus lituratus 0.015 0.713Platyrrhinus lineatus 0.952 0.140Sturnira lilium 0.005 0.813
Average richnessArtibeus fimbriatus 0.039 0.802Artibeus lituratus 0.028 0.622Platyrrhinus lineatus 0.989 0.066Sturnira lilium 0.007 0.786
Accumulative richnessArtibeus fimbriatus 0.872 0.066Artibeus lituratus 0.652 0.003 0.81Platyrrhinus lineatus 0.988 0.070Sturnira lilium 0.547 0.004 0.74
Log richnessArtibeus fimbriatus 0.845 0.081Artibeus lituratus 0.565 0.008 0.75Platyrrhinus lineatus 0.996 0.042 1.00Sturnira lilium 0.645 0.001 0.80
Chao1 richnessArtibeus fimbriatus 0.933 0.034 0.97Artibeus lituratus 0.315 0.072Platyrrhinus lineatus 0.986 0.075Sturnira lilium 0.617 0.002 0.79
Shannon diversityArtibeus fimbriatus 0.590 0.232Artibeus lituratus 0.042 0.548Platyrrhinus lineatus 0.642 0.409Sturnira lilium 0.318 0.045 0.56
Table 4.2. Results of simple regression analyses determining the effect of local host abundance on the biodiversity of ectoparasite assemblages from common, wide-spread species of phyllostomid bat. Significant results are bold. Significant results after Bonferroni sequential adjustment are underlined. See text for abbreviations.Biodiversity measure

Table 4.2. Continued
Bat species r2 p-value B1
Shannon evennessArtibeus fimbriatus 0.241 0.509Artibeus lituratus 0.225 0.140Platyrrhinus lineatus 0.552 0.467Sturnira lilium 0.431 0.015 -0.66
Berger-Parker dominanceArtibeus fimbriatus 0.658 0.189Artibeus lituratus 0.002 0.887Platyrrhinus lineatus 0.508 0.495Sturnira lilium 0.175 0.155
Rare speciesArtibeus fimbriatus 0.915 0.044 0.96Artibeus lituratus 0.583 0.006 0.76Platyrrhinus lineatus 0.998 0.030 1.00Sturnira lilium 0.607 0.002 0.78
Beta diversityArtibeus fimbriatus 0.847 0.080Artibeus lituratus 0.569 0.007 0.75Platyrrhinus lineatus 0.995 0.047 1.00Sturnira lilium 0.654 0.001 0.81
Biodiversity measure

Bat species r2 p-value B1
Mean ectoparasite abundanceEptesicus furinalis 0.019 0.795Lasiurus ega 0.997 0.036 -1.00Myotis abescens 0.023 0.776Myotis nigricans 0.067 0.536
Average richnessEptesicus furinalis 0.490 0.121Lasiurus ega 0.993 0.052Myotis abescens 0.249 0.314Myotis nigricans 0.001 0.957
Accumulative richnessEptesicus furinalis 0.384 0.189Lasiurus ega -- --Myotis abescens 0.829 0.012 0.91Myotis nigricans 0.556 0.034 0.75
Log richnessEptesicus furinalis 0.038 0.711Lasiurus ega -- --Myotis abescens 0.851 0.009 0.92Myotis nigricans 0.495 0.052
Chao1 richnessEptesicus furinalis 0.419 0.165Lasiurus ega -- --Myotis abescens 0.872 0.007 0.93Myotis nigricans 0.198 0.270
Shannon diversityEptesicus furinalis 0.493 0.120Lasiurus ega 0.983 0.082Myotis abescens 0.439 0.152Myotis nigricans 0.010 0.446
Table 4.3. Results of simple regression analyses determining the effect of local host abundance on the biodiversity of ectoparasite assemblages from common, wide-spread species of vespertilionid bat. Significant results are bold. No analyses were significant after Bonferroni sequential adjustment. Four diversity measures of ectoparasite assemblage diversity were constants for Lasiurus ega. See text for abbreviations. Biodiversity measure

Table 4.3. Continued
Bat species r2 p-value B1
Shannon evennessEptesicus furinalis 0.193 0.384Lasiurus ega 0.980 0.091Myotis abescens 0.108 0.525Myotis nigricans 0.719 0.008 -0.85
Berger-Parker dominanceEptesicus furinalis 0.028 0.753Lasiurus ega 0.983 0.082Myotis abescens 0.336 0.228Myotis nigricans 0.326 0.140
Rare speciesEptesicus furinalis 0.005 0.890Lasiurus ega 0.993 0.052Myotis abescens 0.790 0.018 0.89Myotis nigricans 0.732 0.007 0.86
Beta diversityEptesicus furinalis 0.012 0.838Lasiurus ega -- --Myotis abescens 0.886 0.005 0.94Myotis nigricans 0.538 0.038 0.73
Biodiversity measure

Bat species r2 p-value B1
Mean ectoparasite abundanceEumops glaucinus 0.254 0.496Eumops patagonicus 0.252 0.139Molossops temminckii 0.043 0.591Molossus ater 0.040 0.746Molossus molossus 0.030 0.745
Average richnessEumops glaucinus 0.954 0.023 0.98Eumops patagonicus 0.000 0.961Molossops temminckii 0.038 0.615Molossus ater 0.259 0.381Molossus molossus 0.001 0.941
Accumulative richnessEumops glaucinus 0.156 0.605Eumops patagonicus 0.118 0.332Molossops temminckii 0.298 0.129Molossus ater 0.101 0.602Molossus molossus 0.069 0.615
Log richnessEumops glaucinus 0.077 0.722Eumops patagonicus 0.062 0.489Molossops temminckii 0.479 0.039 0.69Molossus ater 0.159 0.506Molossus molossus 0.015 0.820
Chao1 richnessEumops glaucinus 0.068 0.739Eumops patagonicus 0.032 0.623Molossops temminckii 0.289 0.136Molossus ater 0.085 0.634Molossus molossus 0.041 0.700
Table 4.4. Results of simple regression analyses determining the effect of local host abundance on the biodiversity of ectoparasite assemblages from common, wide-spread species of molossid bat. Significant results are bold. No analyses were significant after Bonferroni sequential adjustment. See text for abbreviations.Biodiversity measure

Table 4.4. Continued
Bat species r2 p-value B1
Shannon diversityEumops glaucinus 0.017 0.869Eumops patagonicus 0.003 0.881Molossops temminckii 0.000 0.964Molossus ater 0.638 0.105Molossus molossus 0.017 0.806
Shannon evennessEumops glaucinus 0.113 0.665Eumops patagonicus 0.041 0.573Molossops temminckii 0.294 0.131Molossus ater 0.196 0.455Molossus molossus 0.137 0.471
Berger-Parker dominanceEumops glaucinus 0.655 0.191Eumops patagonicus 0.042 0.572Molossops temminckii 0.009 0.811Molossus ater 0.650 0.099Molossus molossus 0.001 0.948
Rare speciesEumops glaucinus 0.367 0.395Eumops patagonicus 0.184 0.217Molossops temminckii 0.576 0.018 0.76Molossus ater 0.137 0.539Molossus molossus 0.274 0.287
Beta diversityEumops glaucinus 0.041 0.798Eumops patagonicus 0.058 0.502Molossops temminckii 0.507 0.032 0.71Molossus ater 0.074 0.657Molossus molossus 0.016 0.814
Biodiversity measure

Bat group r2 p-value B1
Mean ectoparasite abundanceAll bats 0.051 0.250Phyllostomidae 0.102 0.211Vespertilionidae 0.012 0.678Molossidae 0.018 0.569
Average richnessAll bats 0.008 0.642Phyllostomidae 0.008 0.725Vespertilionidae 0.030 0.505Molossidae 0.002 0.848
Accumulative richnessAll bats 0.375 < 0.001 0.61Phyllostomidae 0.753 < 0.001 0.87Vespertilionidae 0.601 < 0.001 0.78Molossidae 0.305 0.012 0.55
Log richnessAll bats 0.355 < 0.001 0.60Phyllostomidae 0.653 < 0.001 0.81Vespertilionidae 0.456 0.003 0.68Molossidae 0.269 0.019 0.52
Chao1 richnessAll bats 0.272 0.004 0.52Phyllostomidae 0.678 < 0.001 0.82Vespertilionidae 0.239 0.046 0.49Molossidae 0.161 0.080
Shannon diversityAll bats 0.126 0.063Phyllostomidae 0.573 < 0.001 0.76Vespertilionidae 0.181 0.088Molossidae 0.010 0.681
Table 4.5. Results of simple regression analyses determining the effect of local host abundance on the biodiversity of ectoparasite assemblages from the entire host assemblage and for each common host family. Significant results are bold. Significant results after Bonferroni sequential adjustment are underlined. See text for abbreviations.Biodiversity measure

Table 4.5. Continued
Bat group r2 p-value B1
Shannon evennessAll bats 0.022 0.447Phyllostomidae 0.006 0.766Vespertilionidae 0.024 0.550Molossidae 0.090 0.198
Berger-Parker dominanceAll bats 0.049 0.255Phyllostomidae 0.197 0.074Vespertilionidae 0.097 0.225Molossidae 0.006 0.751
Rare speciesAll bats 0.381 < 0.001 0.62Phyllostomidae 0.718 < 0.001 0.85Vespertilionidae 0.600 < 0.001 0.77Molossidae 0.384 0.004 0.62
Beta diversityAll bats 0.358 < 0.001 0.60Phyllostomidae 0.661 < 0.001 0.81Vespertilionidae 0.476 0.002 0.69Molossidae 0.277 0.017 0.53
Biodiversity measure

Independent variableDependent variable
Host group r2 p-value B1
Host abundanceHost species richness
All bats 0.317 0.002 0.56Phyllostomidae 0.319 0.044 0.56Vespertilionidae 0.020 0.633 0.14Molossidae 0.188 0.106 0.44
Host abundanceNumber of rare host species
All bats 0.355 < 0.001 0.60Phyllostomidae 0.195 0.131 0.44Vespertilionidae 0.003 0.848 -0.06Molossidae 0.252 0.057 0.50
Host species richnessNumber of rare host species
All bats 0.885 < 0.001 0.94Phyllostomidae 0.880 < 0.001 0.94Vespertilionidae 0.000 0.959 -0.02Molossidae 0.621 < 0.001 0.79
Table 4.6. Results of simple regression analyses determining the relationships between host abundance, host species richness, and number of rare host species from the entire host assemblage and for each common host family. Significant results are bold. Significant results after Bonferroni sequential adjustment are underlined. See text for abbreviations.

241
CHAPTER V
CONCLUSIONS
Ectoparasites were collected from 2,909 of the 4,143 bats captured during the
study, representing 44 species and five families of hosts. Bat assemblages were defined
for each of 28 sites, distributed throughout all major biomes of Paraguay. Over 17,500
ectoparasites were collected, representing 104 species and 11 families (Appendix C). In
abundance, five families (Insecta: Streblidae; Arachnida: Spinturnicidae, Macronyssidae,
Chirodiscidae, and Argasidae) accounted for 94.5% of all ectoparasites.
The employed method of ectoparasite collection was developed recently (Sheeler-
Gordon and Owen 1999) and likely results in less cross-host contamination than in
previous studies (e.g., Herrin and Tipton 1975). In general, host-parasite associations in
Paraguay corroborate previously reported associations. Analysis of the species
abundance distributions (SADs) of ectoparasite assemblages (restricted to primary
associations) revealed that limiting resources for ectoparasites (i.e., space on the host) are
relatively evenly divided among component taxa, within the context of commonly used
models of SADs such as the broken stick, geometric series, log normal, and log series
models. Ectoparasite SADs are not consistent with a model (i.e., geometric series) based
on niche preemption. Observations of insects ectoparasitic on bats suggest that
competition may be reduced by specializations for locomotion on particular parts of the
host (i.e., microhabitats). Co-existence of multiple fly species on individual hosts often is
attained by microhabitat specialization in this taxon.
The use of body size as a surrogate for island area in the context of ETIB is
practical and seems reasonable. However, the range of body sizes for bats of Paraguay is
relatively small, spanning only one order of magnitude, compared to traditional islands
which span several orders of magnitude and that have been the subject of biogeographic
analysis. The range of body sizes in bats may not be sufficiently great to allow
mechanisms associated with ETIB to operate at a detectible level. If a similar study were
conducted with respect to all Paraguayan mammal species for which the range of body

242
sizes spans five orders of magnitude, then body size might emerge as a more important
determinant of ectoparasite diversity. Such dependence on scale or heirarchy is common
in ecological studies of biodiversity (Scheiner et al. 2000, Willig et al. 2003).
Alternatively, sex-related differences in behavior, specifically roosting habits, may be a
more important factor for predicting ectoparasite diversity than is host size, per se.
Because bats are small and do not provide unlimited space for population growth,
opportunities for transfer are important. Therefore, host individuals may not be the most
appropriate scale to consider ectoparasite assemblages to be isolated evolutionary units.
Ectoparasite assemblages on groups of host individuals (i.e., colonies or populations)
may be evolutionarily isolated and better conform to predictions of ETIB than do
assemblages on individual hosts. In this context, bat colony size may be a realistic
surrogate for island area. Correspondingly, inter-colony distance may be an appropriate
measure of distance to a source population. Some patterns (such as increased nycteribiid
abundance on smaller vespertilionids in Paraguay) are not explained adequately by either
host size or social system, and may be better explained by investigating the effect of host
abundance on ectoparasite biodiversity.
Biodiversity of ectoparasite assemblages increased with host abundance. These
results may be an artifact of collection or passive sampling. Nonetheless, parallels exist
between the effect of host abundance on ectoparasite species richness and species-area
relationships. Larger habitats harbor more rare species than do smaller habitats.
Similarly, more abundant bat species harbor more rare species of ectoparasites than do
less abundant bat species.
Biodiversity of ectoparasites also increased with host abundance after
ectoparasites were combined for all host species within each host family or for all host
species as a group. However, the cause of the pattern at these levels was not occurrence
of transients, but reflected changes in host SADs. As the number of host individuals
increases, so does the number of rare host species. Because bat ectoparasites are highly
host-specific, additional rare host species result in additional rare ectoparasite species.

243
Consequently, different mechanisms influence the same pattern of ectoparasite
biodiversity at multiple levels of host phylogeny.
Within the context of ETIB, hosts may be considered to be islands at multiple
scales (i.e., host individuals, host populations, or host families). As a result, host
abundance may be a measure of distance to a source population (at the host individual
level) or a measure of island area (at the host species level). Disentangling the influence
of each mechanism is difficult. Regardless of scale, ETIB predicts that larger host
populations should support more species-rich ectoparasite faunas and this does occur at
multiple scales for ectoparasite assemblages of bats in Paraguay.
Because bats are small and safe spaces for ectoparasites are limited, opportunities
for vertical transfer are important in maintaining large enough populations to avoid
stochastic extinction. Consequently, location of new resources (i.e., additional host
individuals) is paramount. Bats that have colonial roosting habits, harem mating systems,
or form maternity colonies should support more diverse ectoparasite assemblages than do
solitary bat species. In addition, common bat species should provide more transfer
opportunities than do rare bat species. Group size was not measured during the study;
however, there is evidence that ectoparasite assemblages of bats with gregarious
behaviors (e.g., female Sturnira lilium and Noctilio albiventris that are members of
harems) are more species-rich than are those of more solitary bats (e.g., sub-adult male S.
lilium and N. albiventris that are solitary). Moreover, ectoparasite assemblages on
common bat species (e.g., Artibeus lituratus, S. lilium, Eumops patagonicus, Molossus
molossus) are more species-rich than are those on rare bat species (e.g., Chiroderma
doriae, Pygoderma bilabiatum, Eumops auripendulus, Molossops planirostris).
The application of ETIB to ectoparasite assemblages at multiple scales has
provided insights into mechanisms that may structure these assemblages in space and
time. Host body size was analyzed at two extents, within host species and among host
species. Within a species, host body size did not affect the biodiversity of ectoparasite
assemblages on most host species, as smaller host individuals harbored more diverse
ectoparasite assemblages as often as did larger host individuals. Nonetheless, the use of

244
ETIB as a heuristic model was crucial in discovering the importance that host social
organization may play in host selection by ectoparasites. Moreover, variation in host
body size among species did significantly affect ectoparasite biodiversity. Larger species
of bats had more common and abundant ectoparasites than did smaller species of bats.
One factor that accounts for species-area relationships is that larger areas have more
habitats than do smaller areas and habitat diversity leads to species diversity (Rosenzweig
1995, Williamson 1988). Similarly, larger host individuals may have more microhabitats
that provide sufficient space to support viable populations of more species of ectoparasite
than do smaller host individuals.
The effect of host abundance was analyzed at threes hierarchical levels; for all
bats as a group, for all bats within each host family, and separately for each host species.
At all levels, host abundance positively affected ectoparasite biodiversity; however, the
mechanisms invoked to explain this phenomenon differed with hierarchy. At the host
species level, two mechanisms associated with the More Individuals Hypothesis explain
increases in ectoparasite biodiversity with increases in host species abundance (Scheiner
and Willig 2004). From the perspective of ectoparasites, an increase in number of host
individuals can be interpreted as either an increase in habitat area or an increase in
productivity. At local scales, an increase in area or productivity positively affects
number of individuals in two ways (Srivastava and Lawton 1998). First, more
ectoparasite individuals provide more opportunities to observe rare or transient
ectoparasite species (i.e., passive sampling; Coleman 1981; Coleman et al. 1982).
Second, more ectoparasite individuals can increase the number of species that maintain
viable population sizes, which reduces extinction rates.
At the levels of host family and of all host species, an aspect of species-area
relationships, number of habitats, explains changes in ectoparasite biodiversity. More
host individuals from a group of host species (family or all bat species) increase host
species richness through passive sampling. Each host species is a unique habitat.
Therefore, more species-rich host assemblages provide more habitats for ectoparasites.
As predicted by species-area relationships, more types of habitat increase ectoparasite

245
biodiversity. Failure to investigate host-parasite systems at multiple levels would paint
an incomplete picture of the mechanisms that structure ectoparasite assemblages.

246
Literature Cited
Coleman, B. D. 1981. On random placement and species-area relationships. Mathematical Biosciences 54:191-215.
Coleman, B. D., M. A. Mares, M. R. Willig, and Y.-H. Hsieh. 1982. Randomness, area,
and species richness. Ecology 63:1121-1133. Herrin, C. S., and V. J. Tipton. 1975. Spinturnicid mites of Venezuela. Brigham Young
University Science Bulletin, Biological Series 20(2):1-72. Rosenzweig, M. L. 1995. Species diversity in space and time. Cambridge University
Press, Cambridge, England. Scheiner, S. M., S. B. Cox, M. R. Willig, G. G. Mittelbach, C. Osenberg, and M. Kaspari.
2000. Species density, species-area curves and Simpson's paradox. Evolutionary Ecology Research 2:791-802.
Scheiner, S. M., and M. R. Willig. 2004. Toward a unified theory of diversity gradients.
The American Naturalist. (submitted). Sheeler-Gordon, L. L., and R. D. Owen. 1999. Host tracking or resource tracking? The
case of Periglischrus wing mites (Acarina: Spinturnicidae) of leaf-nosed bats (Chiroptera: Phyllostomidae) from Michoacan, Mexico. Acta Zoológica Mexicana (nueva serie) 76:85-102.
Srivastava, D. S., and J. H. Lawton. 1998. Why more productive sites have more
species: an experimental test of theory using tree-hole communities. The American Naturalist 152:510-529.
Williamson, M. 1988. Relationships of species number to area, distance and other
variables. Pp. 91-115 in Analytical biogeography: an integrated approach to the study of animal and plant distributions (A. Myers and P. Giller, eds.). Chapman and Hall, New York, New York.
Willig, M. R., D. M. Kaufman, and R. D. Stevens. 2003. Latitudinal gradients of
biodiversity: pattern, process, scale, and synthesis. Annual Review of Ecology, Evolution and Systematics 34: 273-309.

247
APPENDIX A
SITE DESCRIPTIONS FOR 28 COLLECTION LOCALITIES IN PARAGUAY

Site nameBiome code Departamento Latitude (S) Longitude (W) Sampling regime
1 Estancia La Victoria BC Presidente Hayes 23°39.03' 58°34.79' 120 95D202 Estancia San Jorge AC Boquerón 22°02.11' 60°19.93' 160 95D203 Cerro León AC Alto Paraguay 20°26.25' 60°19.19' 250 95D104 Estancia Sombrero CP Cordillera 25°04.26' 56°36.08' 100 95W37, 97W705 Lago Ypoá NE Paraguari 25°56.71' 57°26.80' 120 95W306 Estancia Cerrito CC Concepción 23°15.14' 57°29.57' 120 95W367 Fuerte Olimpo MG Alto Paraguay 21°02.37' 57°52.29' 120 95W228 Ayolas NE Misiones 27°23.42' 56°50.15' 70 96W399 Parque Nacional San
RafaelAP Itapúa 26°45.46' 55°51.67' 170 96W43
10 Bahía Negra MG Alto Paraguay 20°10.98' 58°09.42' 90 96W2511 Yaguareté Forest CP San Pedro 23°48.50' 56°07.68' 250 96W4712 Parque Nacional Cerro
CoráCC Amambay 22°37.90' 56°01.43' 280 96W86
13 Parque Nacional Serranía San Luis
CC Concepción 22°37.91' 57°21.35' 270 96D75, 96W137
14 Estacia Yacaré NE Ñeembucú 26°37.94' 58°07.46' 60 96D107, 97W9715 Reserva Natural del
Bosque MbaracayúCP Canindeyú 24°07.69' 55°30.34' 250 96D143, 96W202
16 Estancia Loma Porá BC Presidente Hayes 23°29.92' 57°32.92' 80 96D63, 97W7517 Estancia Tres Marias AC Alto Paraguay 21°16.72' 59°33.13' 70 96D139, 97D9918 Estancia Samaklay AC Presidente Hayes 23°28.81' 59°48.43' 120 96D111, 97W87
Table A.1. Description of 28 sites (Figure 2.1) at which bats were collected from Paraguay (July 1995 to May 1997; July to August 1998). Biome codes appear in Table 2.1; sampling regime includes year, season (wet, W; dry, D), and number of net nights. Wet seasons = October to March. Dry season = April to September.Site code Elevation

Site nameBiome code Departamento Latitude (S) Longitude (W) Sampling regime
19 Dr. Pedro P. Peña AC Boquerón 22°27.16' 62°20.65' 240 96D14820 Destacamento Militar
Gabino MendozaAC Alto Paraguay
and Boquerón20°05.30' 61°47.22' 390 96D71, 97D27
21 Estancia Rivas AP Canindeyú 24°30.43' 54°38.25' 300 96D136, 97W6322 Estancia Golondrina AP Caazapá 25°32.30' 55°29.02' 300 96W8723 Parque Nacional Ybycuí CP Paraguari 26°04.64' 56°50.98' 150 96W64
24 Parque Nacional Teniente Enciso
AC Boquerón 21°11.40' 61°41.81' 250 97W57, 98D87
25 Palmar de las Islas AC Alto Paraguay 19°32.91' 60°31.64' 150 97D10826 Ape Aimé AP Itapúa 26° 32.13' 54° 50.44' 150 98D14527 Estancia San José NE Ñeembucú 27° 12.08' 58° 26.89' 50 98D11628 Estancia Parabel AP Itapúa 26° 20.85' 55° 30.95' 440 98D153
Site code Elevation
Table A.1. Continued

250
APPENDIX B
HOST-PARASITE LIST
Ectoparasite species followed by an asterisk (*) indicate that this is probably a non-
primary host species association that represents a transitory relationship or the result of
contamination. In general, these relationships were defined by an incidence < 5%. For
very small mites of the Trombiculidae, Chirodiscidae, and Myobiidae that rarely were
collected in our samples, no judgment could be rendered with respect to primary host
associations. Therefore, none of these taxa were labeled with asterisks. Number of host
individuals of each host family and species (in bold) inspected for ectoparasites are in
parentheses.
Noctilionidae (96)
Noctilio albiventris (68)
Chiroptonyssus haematophagus *
Chiroptonyssus robustipes
Macronyssus crosbyi *
Steatonyssus sp. 1 *
Steatonyssus sp. 2 *
Unknown macronyssid *
Ornithodoros hasei
Lawrenceocarpus sp.
Noctiliostrebla maai
Paradyschiria parvula
Xenotrichobius noctilionis
Noctilio leporinus (28)
Chiroptonyssus haematophagus
Steatonyssus sp. 1
Parkosa tadarida
Unknown mite

251
Noctiliostrebla aitkeni
Noctiliostrebla dubia
Paradyschiria fusca
Ornithodoros hasei
Phyllostomidae (1220)
Phyllostominae
Chrotopterus auritus (3)
Unknown macronyssid
Trombicula sp. 1
Strebla chrotopteri
Tonatia bidens (3)
Parichoronyssus crassipes
Periglischrus tonatii
Trichobius joblingi
Tonatia brasiliense (1)
Parichoronyssus sclerus
Mastoptera minuta
Glossophaginae
Glossophaga soricina (54)
Chiroptonyssus venezolanus *
Unknown macronyssid *
Periglischrus caligus
Periglischrus ojasti *
Speiseria ambigua
Pseudolabidocarpus sp.
Unknown mite
Strebla guajiro
Trichobius dugesii
Trichobius uniformis

252
Carollinae
Carollia perspicillata (75)
Macronyssoides conciliatus *
Macronyssoides kochi *
Macronyssus sp. 3 *
Parichoronyssus crassipes
Parichoronyssus euthysternum *
Unknown macronyssid *
Periglischrus iheringi *
Periglischrus ojasti *
Unknown spinturnicid *
Unknown ixodid *
Pseudolabidocarpus sp.
Megistopoda proxima *
Strebla guajiro
Trichobius joblingi
Desmodontinae
Desmodus rotundus (51)
Parichoronyssus euthysternum *
Parichoronyssus sclerus *
Radfordiella desmodi
Periglischrus herrerai
Unknown spinturnicid *
Ornithodoros hasei *
Strebla weidemanni
Trichobius parasiticus
Diaemus youngi (11)
Macronyssus crosbyi *
Radfordiella desmodi *

253
Radfordiella oudemansi
Strebla diaemi
Trichobius diaemi
Stenodermatinae
Artibeus fimbriatus (79)
Macronyssoides kochi
Parichoronyssus euthysternum *
Periglischrus iheringi
Periglischrus ojasti *
Beamerella acutascuta
Eudusbabekia viguerasi
Aspidoptera falcata *
Aspidoptera phyllostomatis
Megistopoda aranea
Megistopoda proxima *
Metelasmus pseudopterus
Strebla guajiro *
Artibeus jamaicensis (42)
Chiroptonyssus haematophagus *
Macronyssoides kochi
Periglischrus iheringi
Ornithodoros hasei
Beamerella acutascuta
Trombicula dicrura
Trombicula sp.
Parkosa maxima
Eudusbabekia viguerasi
Aspidoptera phyllostomatis
Megistopoda aranea

254
Metelasmus pseudopterus *
Artibeus lituratus (351)
Chiroptonyssus haematophagus *
Chiroptonyssus venezolanus *
Macronyssoides kochi
Parichoronyssus euthysternum *
Steatonyssus joaquimi *
Periglischrus iheringi
Periglischrus ojasti *
Euschoengastia megastyrax
Parkosa maxima
Eudusbabekia viguerasi
Unknown mite
Aspidoptera falcata *
Aspidoptera phyllostomatis *
Megistopoda aranea *
Megistopoda proxima *
Metelasmus pseudopterus *
Paratrichobius longicrus
Chiroderma doriae (3)
Periglischrus iheringi
Platyrrhinus lineatus (90)
Chiroptonyssus haematophagus *
Macronyssoides conciliatus
Macronyssoides kochi
Macronyssus crosbyi *
Parichoronyssus crassipes *
Steatonyssus furmani *
Steatonyssus joaquimi *

255
Periglischrus iheringi
Periglischrus ojasti *
Spinturnix orri *
Aspidoptera falcata *
Megistopoda proxima *
Paratrichobius longicrus *
Trichobius angulatus
Pygoderma bilabiatum (53)
Periglischrus iheringi *
Unknown spinturnicid *
Chiroptonyssus haematophagus *
Macronyssoides kochi *
Macronyssoides sp. *
Parichoronyssus euthysternum *
Eudusbabekia sp.
Sturnira lilium (404)
Chiroptonyssus haematophagus *
Macronyssoides kochi *
Parichoronyssus crassipes *
Parichoronyssus euthysternum
Steatonyssus joaquimi *
Unknown macronyssid *
Periglischrus iheringi *
Periglischrus ojasti
Ornithodoros hasei *
Rhipicephalus sp. *
Beamerella acutascuta
Eutrombicula sp.
Hooperella vesperuginus

256
Perisopalla precaria
Trombicula dicrura
Trombicula sp.
Eudusbabekia lepidoseta
Aspidoptera falcata
Megistopoda aranea *
Megistopoda proxima
Metelasmus paucisetus
Noctiliostrebla aitkeni *
Paratrichobius longicrus *
Natalidae (1)
Natalus stramineus (1)
Periglischrus natali
Trichobius galei
Vespertilionidae (401)
Eptesicus brasiliensis (12)
Chiroptonyssus venezolanus
Steatonyssus joaquimi
Ornithodoros hasei
Basilia sp. 5
Basilia spp. (males only)
Eptesicus diminutus (2)
Steatonyssus joaquimi
Amblyomma sp. *
Basilia sp. (males only)
Eptesicus furinalis (69)
Chiroptonyssus haematophagus *
Chiroptonyssus venezolanus *
Macronyssus crosbyi *

257
Parichoronyssus cyrtosternum *
Steatonyssus furmani *
Steatonyssus joaquimi
Periglischrus iheringi *
Spinturnix orri
Spinturnix surinamensis
Ornithodoros hasei
Beamerella acutascuta
Basilia sp. 1 *
Basilia sp. 3 *
Basilia sp. 4
Basilia sp. 5
Basilia spp. (males only)
Histiotus macrotus (6)
Chiroptonyssus haematophagus
Steatonyssus joaquimi
Basilia spp. (males only)
Lasiurus blossevillii (11)
Chiroptonyssus haematophagus
Steatonyssus furmani
Steatonyssus joaquimi
Lasiurus cinereus (2)
Macronyssus meridionalis
Lasiurus ega (72)
Steatonyssus furmani
Labidocarpus sp.
Parkosa tadarida
Unknown mite

258
Myotis albescens (87)
Chiroptonyssus haematophagus *
Macronyssus crosbyi
Parichoronyssus euthysternum *
Steatonyssus joaquimi
Steatonyssus sp. 2 *
Spinturnix americanus
Spinturnix banksi
Ornithodoros hasei *
Unknown mite *
Basilia sp. 1
Basilia sp. 2 *
Basilia sp. 3
Basilia sp. 6
Basilia spp. (males only)
Myodopsylla wolffsohni *
Myotis nigricans (128)
Chiroptonyssus haematophagus *
Chiroptonyssus robustipes *
Macronyssus crosbyi
Macronyssus meridionalis *
Macronyssus sp. 2*
Steatonyssus furmani *
Steatonyssus joaquimi
Steatonyssus sp. 2*
Unknown macronyssid *
Periglischrus ojasti *
Spinturnix americanus
Ornithodoros hasei *

259
Basilia sp. 2
Basilia sp. 3
Basilia sp. (males only)
Myodopsylla wolffsohni *
Myotis riparius (11)
Macronyssus crosbyi *
Macronyssus meridionalis
Steatonyssus joaquimi *
Spinturnix americanus *
Basilia sp. 2 *
Basilia sp. 3
Myotis simus (1)
Macronyssus sp. 1
Spinturnix americanus
Molossidae (1192)
Eumops auripendulus (2)
None
Eumops bonariensis (5)
Chiroptonyssus haematophagus
Parichoronyssus euthysternum
Labidocarpus sp.
Eumops dabbenei (4)
Chiroptonyssus haematophagus
Chiroptonyssus venezolanus
Ornithodoros hasei
Parkosa tadarida
Hesperoctenes n. sp. 1
Eumops glaucinus (56)
Chiroptonyssus haematophagus

260
Chiroptonyssus robustipes *
Periglischrus iheringi *
Ornithodoros hasei *
Beamerella acutascuta
Parkosa tadarida
Hesperoctenes n. sp. 1
Trichobius jubatus *
Eumops patagonicus (526)
Chiroptonyssus haematophagus
Chiroptonyssus venezolanus *
Macronyssus crosbyi *
Macronyssus sp. 3 *
Periglischrus herrerai *
Periglischrus iheringi *
Ornithodoros hasei *
Rhipicephalus sp. *
Beamerella acutascuta
Trombicula dicrura
Trombicula sp.
Ewingana sp. 1
Parkosa maxima
Parkosa tadarida
Hesperoctenes longiceps
Strebla diaemi *
Trichobius jubatus *
Eumops perotis (3)
Chiroptonyssus haematophagus
Hesperoctenes n. sp. 2

261
Molossops abrasus (14)
Chiroptonyssus robustipes
Chiroptonyssus venezolanus
Steatonyssus joaquimi
Ornithodoros hasei
Hesperoctenes cartus
Molossops planirostris (12)
Chiroptonyssus venezolanus
Chiroptonyssus sp. 1
Ornithodoros hasei
Hesperoctenes minor
Molossops temminckii (160)
Chiroptonyssus haematophagus *
Chiroptonyssus robustipes *
Chiroptonyssus venezolanus
Macronyssus crosbyi *
Macronyssus meridionalis *
Steatonyssus joaquimi *
Spinturnix americanus *
Ornithodoros hasei *
Amblyomma sp. *
Trombicula sp.
Unknown mite
Hesperoctenes parvulus
Trichobius jubatus *
Molossus ater (100)
Chiroptonyssus robustipes
Chiroptonyssus venezolanus *
Chiroptonyssus sp. 1 *

262
Macronyssus crosbyi *
Unknown macronyssid *
Periglischrus iheringi *
Ornithodoros hasei
Hooperella vesperuginus
Trombicula sp.
Lawrenceocarpus sp.
Parkosa maxima
Parkosa tadarida
Unknown mite
Hesperoctenes fumarius
Hesperoctenes n. sp. 3 *
Basilia sp. (males only) *
Trichobius jubatus
Molossus currentium (27)
Chiroptonyssus haematophagus
Steatonyssus joaquimi *
Ornithodoros hasei
Hesperoctenes fumarius
Molossus molossus (228)
Chiroptonyssus haematophagus
Macronyssoides conciliatus *
Macronyssus crosbyi *
Macronyssus sp. 3 *
Steatonyssus furmani *
Ornithodoros hasei *
Beamerella acutascuta
Parkosa maxima
Parkosa tadarida

263
Unknown mite
Hesperoctenes fumarius
Hesperoctenes n. sp. 3 *
Trichobius jubatus
Nyctinomops laticaudatus (42)
Chiroptonyssus haematophagus
Chiroptonyssus venezolanus
Ornithodoros hasei
Amblyomma sp. *
Trombicula sp.
Ewingana sp. 1
Hesperoctenes setosus
Hormopsylla fosteri
Rothschildopsylla noctilionis
Promops centralis (4)
Chiroptonyssus haematophagus
Hesperoctenes angustatus
Promops nasutus (8)
Chiroptonyssus haematophagus

264
APPENDIX C
PARASITE-HOST LIST
Host species followed by an asterisk (*) indicate that this is probably a non-
primary host species association that represents a transitory relationship or the result of
contamination. In general, these relationships were defined by an incidence < 5%. For
very small mites of the Trombiculidae, Chirodiscidae, and Myobiidae that rarely were
collected in our samples, no judgment could be rendered with respect to primary host
associations. Therefore, none of these taxa were labeled with asterisks. Total number of
individuals of each ectoparasite family and species (in bold) collected over the course of
the project are in parentheses.
Macronyssidae (9766)
Chiroptonyssus haematophagus (3272)
Noctilio albiventris *
Noctilio leporinus
Artibeus jamaicensis *
Artibeus lituratus *
Platyrrhinus lineatus *
Pygoderma bilabiatum *
Sturnira lilium *
Eptesicus furinalis *
Histiotus macrotus
Lasiurus blossevillii
Myotis albescens *
Myotis nigricans *
Eumops bonariensis
Eumops dabbenei
Eumops glaucinus
Eumops patagonicus

265
Eumops perotis
Molossops temminckii *
Molossus currentium
Molossus molossus
Nyctinomops laticaudatus
Promops centralis
Promops nasutus
Chiroptonyssus robustipes (560)
Noctilio albiventris
Myotis nigricans *
Eumops glaucinus *
Molossops abrasus
Molossops temminckii *
Molossus ater
Chiroptonyssus venezolanus (580)
Glossophaga soricina *
Artibeus lituratus *
Eptesicus brasiliensis
Eptesicus furinalis *
Eumops dabbenei
Eumops patagonicus *
Molossops abrasus
Molossops planirostris
Molossops temminckii
Molossus ater *
Nyctinomops laticaudatus
Chiroptonyssus sp. 1 (2)
Molossops planirostris
Molossus ater *

266
Macronyssoides conciliatus (140)
Carollia perspicillata *
Platyrrhinus lineatus
Molossus molossus *
Macronyssoides kochi (711)
Carollia perspicillata *
Artibeus fimbriatus
Artibeus jamaicensis
Artibeus lituratus
Platyrrhinus lineatus
Pygoderma bilabiatum *
Sturnira lilium *
Macronyssoides sp. 1 (1)
Pygoderma bilabiatum *
Macronyssus crosbyi (1091)
Noctilio albiventris *
Diaemus youngi *
Platyrrhinus lineatus *
Eptesicus furinalis *
Myotis albescens
Myotis nigricans
Myotis riparius
Eumops patagonicus *
Molossops temminckii *
Molossus ater *
Molossus molossus *
Macronyssus meridionalis (48)
Lasiurus cinereus
Myotis nigricans *

267
Myotis riparius
Molossops temminckii *
Macronyssus sp. 1 (8)
Myotis simus
Macronyssus sp. 2 (3)
Myotis nigricans *
Macronyssus sp. 3 (6)
Carollia perspicillata *
Eumops patagonicus *
Molossus molossus *
Parichoronyssus crassipes (47)
Tonatia bidens
Carollia perspicillata
Platyrrhinus lineatus *
Sturnira lilium *
Parichoronyssus cyrtosternum (2)
Eptesicus furinalis *
Parichoronyssus euthysternum (862)
Carollia perspicillata *
Desmodus rotundus *
Artibeus fimbriatus *
Artibeus lituratus *
Pygoderma bilabiatum *
Sturnira lilium
Myotis albescens *
Eumops bonariensis *
Parichoronyssus sclerus (3)
Tonatia brasiliense
Desmodus rotundus *

268
Radfordiella desmodi (105)
Desmodus rotundus
Diaemus youngi *
Radfordiella oudemansi (68)
Diaemus youngi
Steatonyssus furmani (422)
Platyrrhinus lineatus *
Eptesicus furinalis *
Lasiurus blossevillii
Lasiurus ega
Myotis nigricans *
Molossus molossus *
Steatonyssus joaquimi (1719)
Artibeus lituratus *
Platyrrhinus lineatus *
Sturnira lilium *
Eptesicus brasiliensis
Eptesicus diminutus
Eptesicus furinalis
Histiotus macrotus
Lasiurus blossevillii
Myotis albescens
Myotis nigricans
Myotis riparius
Molossops abrasus *
Molossops temminckii *
Molossus currentium *
Steatonyssus sp. 1 (11)
Noctilio albiventris *

269
Noctilio leporinus *
Steatonyssus sp. 2 (26)
Noctilio albiventris
Myotis albescens *
Myotis nigricans *
Unknown macronyssid (79)
Noctilio albiventris *
Chrotopterus auritus
Glossophaga soricina *
Carollia perspicillata *
Sturnira lilium *
Myotis nigricans *
Molossus ater *
Spinturnicidae (1763)
Periglischrus caligus (10)
Glossophaga soricina
Periglischrus herrerai (5)
Desmodus rotundus
Eumops patagonicus *
Periglischrus iheringi (1122)
Carollia perspicillata *
Artibeus fimbriatus
Artibeus jamaicensis
Artibeus lituratus
Chiroderma doriae
Platyrrhinus lineatus
Pygoderma bilabiatum *
Sturnira lilium *
Eptesicus furinalis *

270
Eumops glaucinus *
Eumops patagonicus *
Molossus ater *
Periglischrus natali (1)
Natalus stramineus
Periglischrus ojasti (504)
Glossophaga soricina *
Carollia perspicillata *
Artibeus fimbriatus *
Artibeus lituratus *
Platyrrhinus lineatus *
Sturnira lilium
Myotis nigricans *
Periglischrus tonatii (6)
Tonatia bidens
Spinturnix americanus (63)
Myotis albescens
Myotis nigricans
Myotis riparius
Myotis simus
Molossops temminckii *
Spinturnix banksi (6)
Myotis albescens
Spinturnix orri (15)
Platyrrhinus lineatus *
Eptesicus furinalis
Spinturnix surinamensis (28)
Eptesicus furinalis
Unknown spinturnicid (3)

271
Carollia perspicillata *
Desmodus rotundus *
Pygoderma bilabiatum *
Argasidae (1195)
Amblyomma sp. (3)
Eptesicus diminutus *
Molossops temminckii *
Nyctinomops laticaudatus *
Ornithodoros hasei (1192)
Noctilio albiventris
Noctilio leporinus
Desmodus rotundus *
Artibeus jamaicensis
Sturnira lilium *
Eptesicus brasiliensis
Eptesicus furinalis
Myotis albescens *
Myotis nigricans *
Eumops dabbenei *
Eumops glaucinus *
Eumops patagonicus *
Molossops abrasus
Molossops planirostris
Molossops temminckii *
Molossus ater
Molossus currentium
Molossus molossus *
Nyctinomops laticaudatus
Ixodidae (3)

272
Rhipicephalus sp. (2)
Sturnira lilium *
Eumops patagonicus *
Unknown ixodid (1)
Carollia perspicillata *
Trombiculidae (200)
Beamerella acutascuta (27)
Artibeus fimbriatus
Artibeus jamaicensis
Sturnira lilium
Eptesicus furinalis
Eumops glaucinus
Eumops patagonicus
Molossus molossus
Euschoengastia megastyrax (1)
Artibeus lituratus
Eutrombicula sp. (1)
Sturnira lilium
Hooperella vesperuginus (4)
Sturnira lilium
Molossus ater
Perisopalla precaria (1)
Sturnira lilium
Trombicula dicrura (70)
Artibeus jamaicensis
Sturnira lilium
Eumops patagonicus
Trombicula sp. 1 (69)
Chrotopterus auritus

273
Trombicula sp. (27)
Artibeus jamaicensis
Sturnira lilium
Eumops patagonicus
Molossops temminckii
Molossus ater
Nyctinomops laticaudatus
Myobiidae (12)
Eudusbabekia lepidoseta (3)
Sturnira lilium
Eudusbabekia viguerasi (4)
Artibeus fimbriatus
Artibeus jamaicensis
Artibeus lituratus
Eudusbabekia sp. (2)
Pygoderma bilabiatum
Ewingana sp. 1 (2)
Eumops patagonicus
Ewingana sp. 2 (1)
Nyctinomops laticaudatus
Chirodiscidae (1387)
Labidocarpus sp. (13)
Lasiurus ega
Eumops bonariensis
Lawrenceocarpus sp. (19)
Noctilio albiventris
Molossus ater
Parkosa maxima (185)
Artibeus jamaicensis *

274
Artibeus lituratus *
Eumops patagonicus
Molossus ater
Molossus molossus
Parkosa tadarida (1140)
Noctilio leporinus
Lasiurus ega
Eumops dabbenei
Eumops glaucinus
Eumops patagonicus
Molossus ater
Molossus molossus
Pseudolabidocarpus sp. (30)
Glossophaga soricina
Carollia perspicillata
Unknown mites (13)
Noctilio leporinus
Glossophaga soricina
Artibeus lituratus
Lasiurus ega
Myotis albescens
Molossops temminckii
Molossus ater
Molossus molossus
Polyctenidae (561)
Hesperoctenes angustatus (3)
Promops centralis
Hesperoctenes cartus (7)
Molossops abrasus

275
Hesperoctenes fumarius (163)
Molossus ater
Molossus currentium
Molossus molossus
Hesperoctenes longiceps (147)
Eumops patagonicus
Hesperoctenes minor (9)
Molossops planirostris
Hesperoctenes parvulus (53)
Molossops temminckii
Hesperoctenes setosus (4)
Nyctinomops laticaudatus
Hesperoctenes n. sp. 1 (167)
Eumops dabbenei
Eumops glaucinus
Hesperoctenes n. sp. 2 (5)
Eumops perotis
Hesperoctenes n. sp. 3 (3)
Molossus ater
Molossus molossus
Nycteribiidae (155)
Basilia sp. 1 (5)
Eptesicus furinalis *
Myotis albescens
Basilia sp. 2 (22)
Myotis albescens *
Myotis nigricans
Myotis riparius
Basilia sp. 3 (62)

276
Myotis albescens
Myotis nigricans
Myotis riparius
Eptesicus furinalis *
Basilia sp. 4 (12)
Eptesicus furinalis
Basilia sp. 5 (11)
Eptesicus brasiliensis
Eptesicus furinalis *
Basilia sp. 6 (1)
Myotis albescens
Basilia spp. (males only) (42)
Eptesicus brasiliensis
Eptesicus diminutus
Eptesicus furinalis
Histiotus macrotus
Myotis albescens
Myotis nigricans
Molossus molossus *
Streblidae (2469)
Aspidoptera falcata (233)
Artibeus fimbriatus *
Artibeus lituratus *
Platyrrhinus lineatus *
Sturnira lilium
Aspidoptera phyllostomatis (29)
Artibeus fimbriatus
Artibeus jamaicensis
Artibeus lituratus *

277
Mastoptera minuta (11)
Tonatia brasiliense
Megistopoda aranea (107)
Artibeus fimbriatus
Artibeus jamaicensis
Artibeus lituratus *
Sturnira lilium *
Megistopoda proxima (364)
Artibeus fimbriatus *
Artibeus lituratus *
Carollia perspicillata *
Platyrrhinus lineatus *
Sturnira lilium
Metelasmus pseudopterus (21)
Artibeus fimbriatus
Artibeus jamaicensis *
Artibeus lituratus *
Metelasmus paucisetus (5)
Sturnira lilium
Noctiliostrebla aitkeni (80)
Noctilio leporinus
Sturnira lilium *
Noctiliostrebla dubia (16)
Noctilio leporinus
Noctiliostrebla maai (213)
Noctilio albiventris
Paradyschiria fusca (227)
Noctilio leporinus
Paradyschiria parvula (434)

278
Noctilio albiventris
Paratrichobius longicrus (159)
Artibeus lituratus
Platyrrhinus lineatus *
Sturnira lilium *
Speiseria ambigua (1)
Glossophaga soricina
Strebla chrotopteri (15)
Chrotopterus auritus
Strebla diaemi (38)
Diaemus youngi
Eumops patagonicus *
Strebla guajiro (31)
Glossophaga soricina
Carollia perspicillata
Artibeus fimbriatus *
Strebla weidemanni (76)
Desmodus rotundus
Trichobius angulatus (10)
Platyrrhinus lineatus
Trichobius diaemi (5)
Diaemus youngi
Trichobius dugesii (8)
Glossophaga soricina
Trichobius galei (6)
Natalus stramineus
Trichobius joblingi (67)
Tonatia bidens
Carollia perspicillata

279
Trichobius jubatus (80)
Eumops glaucinus *
Eumops patagonicus *
Molossops temminckii *
Molossus ater
Molossus molossus
Trichobius parasiticus (219)
Desmodus rotundus
Trichobius uniformis (8)
Glossophaga soricina
Xenotrichobius noctilionis (6)
Noctilio albiventris
Ischnopsyllidae (32)
Hormopsylla fosteri (1)
Nyctinomops laticaudatus
Myodopsylla wolffsohni (26)
Myotis albescens
Myotis nigricans *
Rothschildopsylla noctilionis (5)
Nyctinomops laticaudatus

280
APPENDIX D
SPECIES ABUNDANCE DISTRIBUTIONS OF THE ECTOPARASITES
ASSEMBLAGES FROM EACH OF 39 HOST SPECIES

Figure D.1.-- Species abundance distribution of the ectoparasite species collected from Noctilio albiventris. N = total number of ectoparasites. Shaded bars represent primary associations; unshaded bars represent transients or contamination. For comparative purposes, all species abundance distributions were graphed to the maximum number of ectoparasite species observed on a single host species (23).
Noctilio albiventris
0.0
0.1
1.0
10.0
100.0
1 3 5 7 9 11 13 15 17 19 21 23
Rank Abundance of Ectoparasite Species
Rel
ativ
e A
bund
ance
(%)
N = 1,460
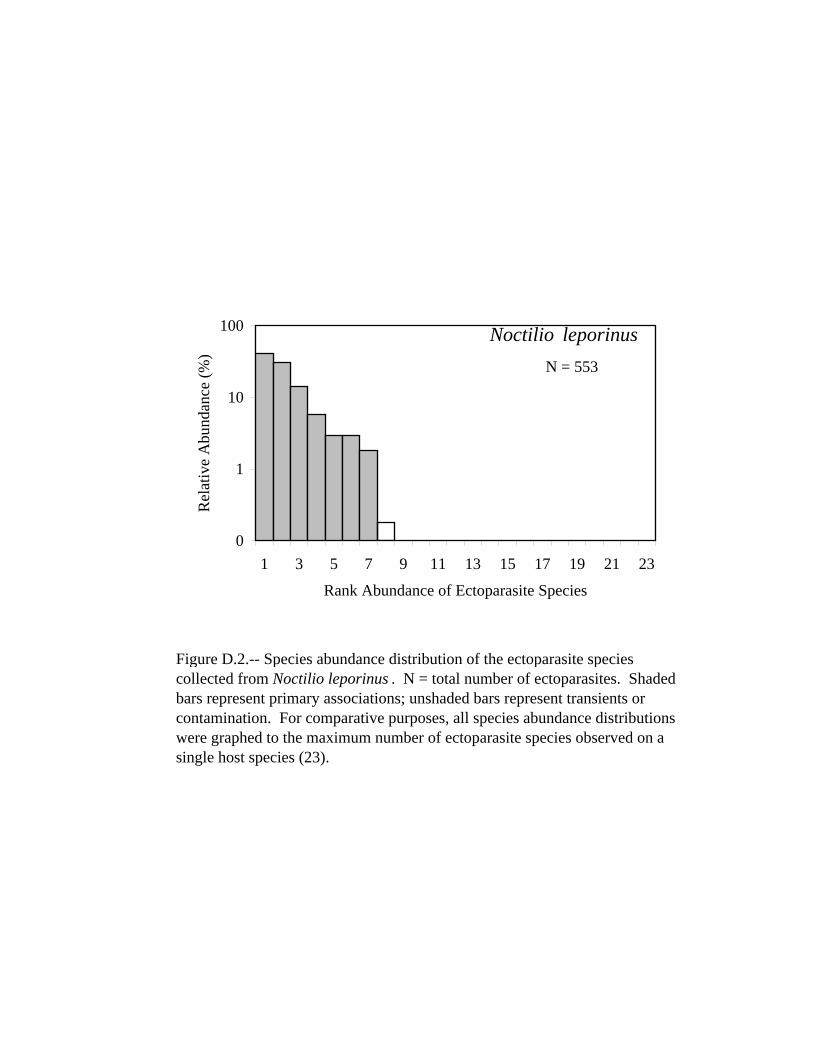
Figure D.2.-- Species abundance distribution of the ectoparasite species collected from Noctilio leporinus . N = total number of ectoparasites. Shaded bars represent primary associations; unshaded bars represent transients or contamination. For comparative purposes, all species abundance distributions were graphed to the maximum number of ectoparasite species observed on a single host species (23).
Noctilio leporinus
0
1
10
100
1 3 5 7 9 11 13 15 17 19 21 23
Rank Abundance of Ectoparasite Species
Rel
ativ
e A
bund
ance
(%)
N = 553

Figure D.3.-- Species abundance distribution of the ectoparasite species collected from Chrotopterus auritus. N = total number of ectoparasites. Shaded bars represent primary associations; unshaded bars represent transients or contamination. For comparative purposes, all species abundance distributions were graphed to the maximum number of ectoparasite species observed on a single host species (23).
Chrotopterus auritus
0
1
10
100
1 3 5 7 9 11 13 15 17 19 21 23
Rank Abundance of Ectoparasite Species
Rel
ativ
e A
bund
ance
(%)
N = 151

Figure D.4.-- Species abundance distribution of the ectoparasite species collected from Tonatia bidens. N = total number of ectoparasites. Shaded bars represent primary associations; unshaded bars represent transients or contamination. For comparative purposes, all species abundance distributions were graphed to the maximum number of ectoparasite species observed on a single host species (23).
Tonatia bidens
0
1
10
100
1 3 5 7 9 11 13 15 17 19 21 23
Rank Abundance of Ectoparasite Species
Rel
ativ
e A
bund
ance
(%)
N = 42

Figure D.5.-- Species abundance distribution of the ectoparasite species collected from Tonatia brasiliense. N = total number of ectoparasites. Shaded bars represent primary associations; unshaded bars represent transients or contamination. For comparative purposes, all species abundance distributions were graphed to the maximum number of ectoparasite species observed on a single host species (23).
Tonatia brasiliense
0
1
10
100
1 3 5 7 9 11 13 15 17 19 21 23
Rank Abundance of Ectoparasite Species
Rel
ativ
e A
bund
ance
(%)
N = 12

Figure D.6.-- Species abundance distribution of the ectoparasite species collected from Glossophaga soricina. N = total number of ectoparasites. Shaded bars represent primary associations; unshaded bars represent transients or contamination. For comparative purposes, all species abundance distributions were graphed to the maximum number of ectoparasite species observed on a single host species (23).
Glossophaga soricina
0
1
10
100
1 3 5 7 9 11 13 15 17 19 21 23
Rank Abundance of Ectoparasite Species
Rel
ativ
e A
bund
ance
(%)
N = 64

Figure D.7.-- Species abundance distribution of the ectoparasite species collected from Carollia perspicillata. N = total number of ectoparasites. Shaded bars represent primary associations; unshaded bars represent transients or contamination. For comparative purposes, all species abundance distributions were graphed to the maximum number of ectoparasite species observed on a single host species (23).
Carollia perspicillata
0
1
10
100
1 3 5 7 9 11 13 15 17 19 21 23
Rank Abundance of Ectoparasite Species
Rel
ativ
e A
bund
ance
(%)
N = 124

Figure D.8.-- Species abundance distribution of the ectoparasite species collected from Desmodus rotundus. N = total number of ectoparasites. Shaded bars represent primary associations; unshaded bars represent transients or contamination. For comparative purposes, all species abundance distributions were graphed to the maximum number of ectoparasite species observed on a single host species (23).
Desmodus rotundus
0
1
10
100
1 3 5 7 9 11 13 15 17 19 21 23
Rank Abundance of Ectoparasite Species
Rel
ativ
e A
bund
ance
(%)
N = 407

Figure D.9.-- Species abundance distribution of the ectoparasite species collected from Diaemus youngi. N = total number of ectoparasites. Shaded bars represent primary associations; unshaded bars represent transients or contamination. For comparative purposes, all species abundance distributions were graphed to the maximum number of ectoparasite species observed on a single host species (23).
Diaemus youngi
0
1
10
100
1 3 5 7 9 11 13 15 17 19 21 23
Rank Abundance of Ectoparasite Species
Rel
ativ
e A
bund
ance
(%)
N = 114

Figure D.10.-- Species abundance distribution of the ectoparasite species collected from Artibeus fimbriatus. N = total number of ectoparasites. Shaded bars represent primary associations; unshaded bars represent transients or contamination. For comparative purposes, all species abundance distributions were graphed to the maximum number of ectoparasite species observed on a single host species (23).
Artibeus fimbriatus
0
1
10
100
1 3 5 7 9 11 13 15 17 19 21 23
Rank Abundance of Ectoparasite Species
Rel
ativ
e A
bund
ance
(%)
N = 561

Figure D.11.-- Species abundance distribution of the ectoparasite species collected from Artibeus jamaicensis. N = total number of ectoparasites. Shaded bars represent primary associations; unshaded bars represent transients or contamination. For comparative purposes, all species abundance distributions were graphed to the maximum number of ectoparasite species observed on a single host species (23).
Artibeus jamaicensis
0
1
10
100
1 3 5 7 9 11 13 15 17 19 21 23
Rank Abundance of Ectoparasite Species
Rel
ativ
e A
bund
ance
(%)
N = 306

Figure D.12.-- Species abundance distribution of the ectoparasite species collected from Artibeus lituratus. N = total number of ectoparasites. Shaded bars represent primary associations; unshaded bars represent transients or contamination. For comparative purposes, all species abundance distributions were graphed to the maximum number of ectoparasite species observed on a single host species (23).
Artibeus lituratus
0.0
0.1
1.0
10.0
100.0
1 3 5 7 9 11 13 15 17 19 21 23
Rank Abundance of Ectoparasite Species
Rel
ativ
e A
bund
ance
(%)
N = 1,123

Figure D.13.-- Species abundance distribution of the ectoparasite species collected from Platyrrhinus lineatus. N = total number of ectoparasites. Shaded bars represent primary associations; unshaded bars represent transients or contamination. For comparative purposes, all species abundance distributions were graphed to the maximum number of ectoparasite species observed on a single host species (23).
Platyrrhinus lineatus
0
1
10
100
1 3 5 7 9 11 13 15 17 19 21 23
Rank Abundance of Ectoparasite Species
Rel
ativ
e A
bund
ance
(%)
N = 394
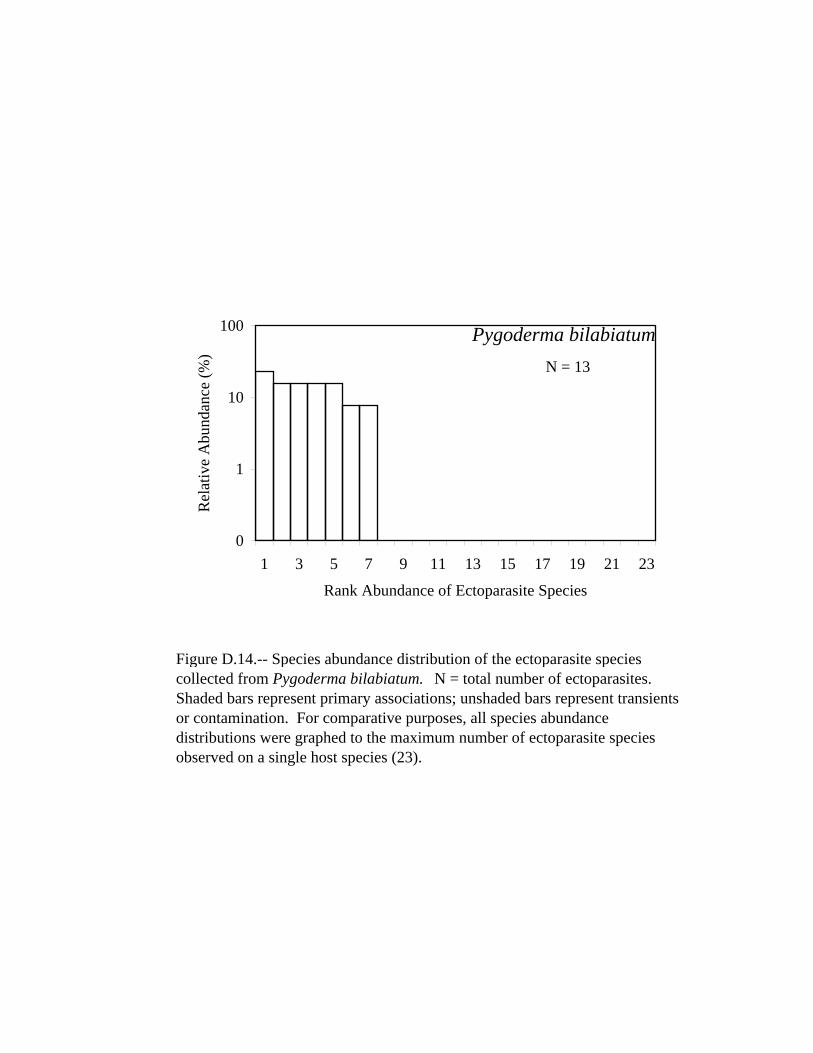
Figure D.14.-- Species abundance distribution of the ectoparasite species collected from Pygoderma bilabiatum. N = total number of ectoparasites. Shaded bars represent primary associations; unshaded bars represent transients or contamination. For comparative purposes, all species abundance distributions were graphed to the maximum number of ectoparasite species observed on a single host species (23).
Pygoderma bilabiatum
0
1
10
100
1 3 5 7 9 11 13 15 17 19 21 23
Rank Abundance of Ectoparasite Species
Rel
ativ
e A
bund
ance
(%)
N = 13

Figure D.15.-- Species abundance distribution of the ectoparasite species collected from Sturnira lilium. N = total number of ectoparasites. Shaded bars represent primary associations; unshaded bars represent transients or contamination. For comparative purposes, all species abundance distributions were graphed to the maximum number of ectoparasite species observed on a single host species (23).
Sturnira lilium
0.0
0.1
1.0
10.0
100.0
1 3 5 7 9 11 13 15 17 19 21 23
Rank Abundance of Ectoparasite Species
Rel
ativ
e A
bund
ance
(%)
N = 2,023

Figure D.16.-- Species abundance distribution of the ectoparasite species collected from Natalus stramineus. N = total number of ectoparasites. Shaded bars represent primary associations; unshaded bars represent transients or contamination. For comparative purposes, all species abundance distributions were graphed to the maximum number of ectoparasite species observed on a single host species (23).
Natalus stramineus
0
1
10
100
1 3 5 7 9 11 13 15 17 19 21 23
Rank Abundance of Ectoparasite Species
Rel
ativ
e A
bund
ance
(%)
N = 7

Figure D.17.-- Species abundance distribution of the ectoparasite species collected from Eptesicus brasiliensis. N = total number of ectoparasites. Shaded bars represent primary associations; unshaded bars represent transients or contamination. For comparative purposes, all species abundance distributions were graphed to the maximum number of ectoparasite species observed on a single host species (23).
Eptesicus brasiliensis
0
1
10
100
1 3 5 7 9 11 13 15 17 19 21 23
Rank Abundance of Ectoparasite Species
Rel
ativ
e A
bund
ance
(%)
N = 80

Figure D.18.-- Species abundance distribution of the ectoparasite species collected from Eptesicus diminutus. N = total number of ectoparasites. Shaded bars represent primary associations; unshaded bars represent transients or contamination. For comparative purposes, all species abundance distributions were graphed to the maximum number of ectoparasite species observed on a single host species (23).
Eptesicus diminutus
0
1
10
100
1 3 5 7 9 11 13 15 17 19 21 23
Rank Abundance of Ectoparasite Species
Rel
ativ
e A
bund
ance
(%)
N = 13

Figure D.19.-- Species abundance distribution of the ectoparasite species collected from Eptesicus furinalis. N = total number of ectoparasites. Shaded bars represent primary associations; unshaded bars represent transients or contamination. For comparative purposes, all species abundance distributions were graphed to the maximum number of ectoparasite species observed on a single host species (23).
Eptesicus furinalis
0
1
10
100
1 3 5 7 9 11 13 15 17 19 21 23
Rank Abundance of Ectoparasite Species
Rel
ativ
e A
bund
ance
(%)
N = 812

Figure D.20.-- Species abundance distribution of the ectoparasite species collected from Histiotus macrotus. N = total number of ectoparasites. Shaded bars represent primary associations; unshaded bars represent transients or contamination. For comparative purposes, all species abundance distributions were graphed to the maximum number of ectoparasite species observed on a single host species (23).
Histiotus macrotus
0
1
10
100
1 3 5 7 9 11 13 15 17 19 21 23
Rank Abundance of Ectoparasite Species
Rel
ativ
e A
bund
ance
(%)
N = 120

Figure D.21.-- Species abundance distribution of the ectoparasite species collected from Lasiurus blossevillii. N = total number of ectoparasites. Shaded bars represent primary associations; unshaded bars represent transients or contamination. For comparative purposes, all species abundance distributions were graphed to the maximum number of ectoparasite species observed on a single host species (23).
Lasiurus blossevillii
0
1
10
100
1 3 5 7 9 11 13 15 17 19 21 23
Rank Abundance of Ectoparasite Species
Rel
ativ
e A
bund
ance
(%)
N = 20

Figure D.22.-- Species abundance distribution of the ectoparasite species collected from Lasiurus ega. N = total number of ectoparasites. Shaded bars represent primary associations; unshaded bars represent transients or contamination. For comparative purposes, all species abundance distributions were graphed to the maximum number of ectoparasite species observed on a single host species (23).
Lasiurus ega
0
1
10
100
1 3 5 7 9 11 13 15 17 19 21 23
Rank Abundance of Ectoparasite Species
Rel
ativ
e A
bund
ance
(%)
N = 411

Figure D.23.-- Species abundance distribution of the ectoparasite species collected from Myotis albescens. N = total number of ectoparasites. Shaded bars represent primary associations; unshaded bars represent transients or contamination. For comparative purposes, all species abundance distributions were graphed to the maximum number of ectoparasite species observed on a single host species (23).
Myotis albescens
0.0
0.1
1.0
10.0
100.0
1 3 5 7 9 11 13 15 17 19 21 23
Rank Abundance of Ectoparasite Species
Rel
ativ
e A
bund
ance
(%)
N = 1,550

Figure D.24.-- Species abundance distribution of the ectoparasite species collected from Myotis nigricans. N = total number of ectoparasites. Shaded bars represent primary associations; unshaded bars represent transients or contamination. For comparative purposes, all species abundance distributions were graphed to the maximum number of ectoparasite species observed on a single host species (23).
Myotis nigricans
0
1
10
100
1 3 5 7 9 11 13 15 17 19 21 23
Rank Abundance of Ectoparasite Species
Rel
ativ
e A
bund
ance
(%)
N = 557

Figure D.25.-- Species abundance distribution of the ectoparasite species collected from Myotis riparius. N = total number of ectoparasites. Shaded bars represent primary associations; unshaded bars represent transients or contamination. For comparative purposes, all species abundance distributions were graphed to the maximum number of ectoparasite species observed on a single host species (23).
Myotis riparius
0
1
10
100
1 3 5 7 9 11 13 15 17 19 21 23
Rank Abundance of Ectoparasite Species
Rel
ativ
e A
bund
ance
(%)
N = 52

Figure D.26.-- Species abundance distribution of the ectoparasite species collected from Myotis simus. N = total number of ectoparasites. Shaded bars represent primary associations; unshaded bars represent transients or contamination. For comparative purposes, all species abundance distributions were graphed to the maximum number of ectoparasite species observed on a single host species (23).
Myotis simus
0
1
10
100
1 3 5 7 9 11 13 15 17 19 21 23
Rank Abundance of Ectoparasite Species
Rel
ativ
e A
bund
ance
(%)
N = 18

Figure D.27.-- Species abundance distribution of the ectoparasite species collected from Eumops bonariensis. N = total number of ectoparasites. Shaded bars represent primary associations; unshaded bars represent transients or contamination. For comparative purposes, all species abundance distributions were graphed to the maximum number of ectoparasite species observed on a single host species (23).
Eumops bonariensis
0
1
10
100
1 3 5 7 9 11 13 15 17 19 21 23
Rank Abundance of Ectoparasite Species
Rel
ativ
e A
bund
ance
(%)
N = 8

Figure D.28.-- Species abundance distribution of the ectoparasite species collected from Eumops dabbenei. N = total number of ectoparasites. Shaded bars represent primary associations; unshaded bars represent transients or contamination. For comparative purposes, all species abundance distributions were graphed to the maximum number of ectoparasite species observed on a single host species (23).
Eumops dabbenei
0
1
10
100
1 3 5 7 9 11 13 15 17 19 21 23
Rank Abundance of Ectoparasite Species
Rel
ativ
e A
bund
ance
(%)
N = 50

Figure D.29.-- Species abundance distribution of the ectoparasite species collected from Eumops glaucinus. N = total number of ectoparasites. Shaded bars represent primary associations; unshaded bars represent transients or contamination. For comparative purposes, all species abundance distributions were graphed to the maximum number of ectoparasite species observed on a single host species (23).
Eumops glaucinus
0
1
10
100
1 3 5 7 9 11 13 15 17 19 21 23
Rank Abundance of Ectoparasite Species
Rel
ativ
e A
bund
ance
(%)
N = 335

Figure D.30.-- Species abundance distribution of the ectoparasite species collected from Eumops patagonicus. N = total number of ectoparasites. Shaded bars represent primary associations; unshaded bars represent transients or contamination. For comparative purposes, all species abundance distributions were graphed to the maximum number of ectoparasite species observed on a single host species (23).
Eumops patagonicus
0.0
0.1
1.0
10.0
100.0
1 3 5 7 9 11 13 15 17 19 21 23
Rank Abundance of Ectoparasite Species
Rel
ativ
e A
bund
ance
(%)
N = 1,693

Figure D.31.-- Species abundance distribution of the ectoparasite species collected from Eumops perotis. N = total number of ectoparasites. Shaded bars represent primary associations; unshaded bars represent transients or contamination. For comparative purposes, all species abundance distributions were graphed to the maximum number of ectoparasite species observed on a single host species (23).
Eumops perotis
0
1
10
100
1 3 5 7 9 11 13 15 17 19 21 23
Rank Abundance of Ectoparasite Species
Rel
ativ
e A
bund
ance
(%)
N = 35

Figure D.32.-- Species abundance distribution of the ectoparasite species collected from Molossops abrasus. N = total number of ectoparasites. Shaded bars represent primary associations; unshaded bars represent transients or contamination. For comparative purposes, all species abundance distributions were graphed to the maximum number of ectoparasite species observed on a single host species (23).
Molossops abrasus
0
1
10
100
1 3 5 7 9 11 13 15 17 19 21 23
Rank Abundance of Ectoparasite Species
Rel
ativ
e A
bund
ance
(%)
N = 55

Figure D.33.-- Species abundance distribution of the ectoparasite species collected from Molossops planirostris. N = total number of ectoparasites.Shaded bars represent primary associations; unshaded bars represent transients or contamination. For comparative purposes, all species abundance distributions were graphed to the maximum number of ectoparasite species observed on a single host species (23).
Molossops planirostris
0
1
10
100
1 3 5 7 9 11 13 15 17 19 21 23
Rank Abundance of Ectoparasite Species
Rel
ativ
e A
bund
ance
(%)
N = 20

Figure D.34.-- Species abundance distribution of the ectoparasite species collected from Molossops temminckii. N = total number of ectoparasites. Shaded bars represent primary associations; unshaded bars represent transients or contamination. For comparative purposes, all species abundance distributions were graphed to the maximum number of ectoparasite species observed on a single host species (23).
Molossops temminckii
0
1
10
100
1 3 5 7 9 11 13 15 17 19 21 23
Rank Abundance of Ectoparasite Species
Rel
ativ
e A
bund
ance
(%)
N = 541

Figure D.35.-- Species abundance distribution of the ectoparasite species collected from Molossus ater. N = total number of ectoparasites. Shaded bars represent primary associations; unshaded bars represent transients or contamination. For comparative purposes, all species abundance distributions were graphed to the maximum number of ectoparasite species observed on a single host species (23).
Molossus ater
0
1
10
100
1 3 5 7 9 11 13 15 17 19 21 23
Rank Abundance of Ectoparasite Species
Rel
ativ
e A
bund
ance
(%)
N = 911

Figure D.36.-- Species abundance distribution of the ectoparasite species collected from Molossus currentium. N = total number of ectoparasites. Shaded bars represent primary associations; unshaded bars represent transients or contamination. For comparative purposes, all species abundance distributions were graphed to the maximum number of ectoparasite species observed on a single host species (23).
Molossus currentium
0
1
10
100
1 3 5 7 9 11 13 15 17 19 21 23
Rank Abundance of Ectoparasite Species
Rel
ativ
e A
bund
ance
(%)
N = 64

Figure D.37.-- Species abundance distribution of the ectoparasite species collected from Molossus molossus. N = total number of ectoparasites. Shaded bars represent primary associations; unshaded bars represent transients or contamination. For comparative purposes, all species abundance distributions were graphed to the maximum number of ectoparasite species observed on a single host species (23).
Molossus molossus
0.0
0.1
1.0
10.0
100.0
1 3 5 7 9 11 13 15 17 19 21 23
Rank Abundance of Ectoparasite Species
Rel
ativ
e A
bund
ance
(%)
N = 2,427

Figure D.38.-- Species abundance distribution of the ectoparasite species collected from Nyctinomops laticaudatus. N = total number of ectoparasites. Shaded bars represent primary associations; unshaded bars represent transients or contamination. For comparative purposes, all species abundance distributions were graphed to the maximum number of ectoparasite species observed on a single host species (23).
Nyctinomops laticaudatus
0
1
10
100
1 3 5 7 9 11 13 15 17 19 21 23
Rank Abundance of Ectoparasite Species
Rel
ativ
e A
bund
ance
(%)
N = 182

Figure D.39.-- Species abundance distribution of the ectoparasite species collected from Promops centralis. N = total number of ectoparasites. Shaded bars represent primary associations; unshaded bars represent transients or contamination. For comparative purposes, all species abundance distributions were graphed to the maximum number of ectoparasite species observed on a single host species (23).
Promops centralis
0
1
10
100
1 3 5 7 9 11 13 15 17 19 21 23
Rank Abundance of Ectoparasite Species
Rel
ativ
e A
bund
ance
(%)
N = 14

320
APPENDIX E
MATLAB FUNCTIONS FOR CALCULATING
SPECIES RICHNESS ESTIMATE LOGS
%SPEACCUM: returns [n x 1] vectors of species richness values % and plots the number of individuals by number of species given a % vector species abundances, the number of iterations and a % plot flag value. % % Usage: [richness] = speaccum(x,{iter},{plot_flag}) % % richness = a [n x 1] vector of average species richness % values (i.e., number of species) for all iter % iterations. % % ---------------------------------------------------------- % x = a vector of species abundances. % % iter = number of iterations, optional argument, default % value = 1000. % % plot = value of 1 produces a plot of average richness % by number of individuals, default value = 1. % function [richness] = speaccum(x,iter,plot_flag) tic; if nargin<2 %optional arguments iter = 1000; end; if nargin<3 plot_flag = 1; end; [r,c] = size(x); %error checking if min(r,c)>1 error('SPEACCUM:input must in a vector, not a matrix'); end; if c~=1 x=x'; end;

321
riches = zeros(sum(x),iter); ctr=0; iterations=0; for i=1:iter species_pool=[]; for k=1:length(x) %creates a vector of individuals from x individuals = k*(ones(x(k),1)); species_pool = [species_pool;individuals]; end; randnum = 1:length(species_pool); %rearranges individuals in species_pool based on a random permutation randnum = randnum(randperm(1*length(species_pool))); species_pool = species_pool(randnum,:); %rearranges observations population = []; for j=1:length(species_pool) %add individual to population population = [population;species_pool(j)]; %calculate number of species present [groups,freqs] = unique(population); riches(j,i) = length(groups); end; ctr=ctr+1; if ctr==100 %iteration counter iterations=iterations+100 ctr=0; richness = mean(riches')'; Std_richness = std(riches')'; out=[richness Std_richness]; tofile(out,'Hard:Desktop Folder:test'); tofile(iterations,'Hard:Desktop Folder:iterations'); time=toc; hours=floor(time/3600);

322
minutes=floor((time-(hours*3600))/60); seconds=floor((time-(hours*3600)-(minutes*60))); Time = [hours minutes seconds] disp(' hours mins secs'); end; end; if plot_flag==1; figure; pop_size = 1:length(richness); pop_size = pop_size'; plot(pop_size(:,1),richness(:,1),'b'); upper=richness+2*(Std_richness/sqrt(iter)); lower=richness-2*(Std_richness/sqrt(iter)); hold on; plot(pop_size(:,1),upper(:,1),'r'); plot(pop_size(:,1),lower(:,1),'r'); end; return;

323
% UNIQUE: Given a matrix, returns a vector containing of unique values, % and a vector of their respective frequencies. % % Usage: [values,frequencies] = unique(input) % % input = matrix of values. % % ------------------------------------------------------------ % values = column vector of unique labels. % frequencies = frequencies of respective unique values. % function [uniqs,freqs]=unique(in) if (any(in==NaN))|(any(in==-inf))|(any(in==inf)) error('unique: input matrix may not have non-finite values'); end; if (in==[]) uniqs=[]; freqs=[]; return; end; %--------------------------------------------------------------- in=in(:); %concatonates all columns of %matrix into one column vector uniqs=[in(1)]; %creates ouput vector beginning %with first value of input vector freqs=[1]; %creates frequency vector x=length(in); for (i=2:x) %begins for loop to survey input vector if in(i)~=(uniqs) %defines conditions for adding %values to uniqs vector uniqs=[uniqs;in(i)]; %adds unique values to ouput vector freqs=[freqs;1]; %adds freqency value for new unique value else [r,c] = size(freqs); %redefines size of frequency vector for (j=1:r) %begins for loop to search %for matching unique value if(in(i)) == (uniqs(j)) %finds location of previously

324
%added unique values freqs(j) = freqs(j)+1; %adds 1 to appropriate frequency %value in freqs vector end; %ends if loop end; %ends for loop end; %ends if statement end; %ends for loop

325
function [logistRa2,p2]=fitlog(area,sp) % function [logistRa2,p1,p2,p3]=fitlog(area,sp) % Fits the power, exponential, and logistic curves to the % species/area relationship passed to the function. It uses the % Levenberg-Marquardt nonlinear regression technigue (function % leasqr written by R.I. Shrager and modified by Jutan and Muzic). % The output are adjusted R2 values (Ra2) for each fit using the adjusted % coefficient of determination of Boecklen and Gotelli (1984), Loehle (1990), % and He & Legendre (1996). global verbose logistRa2 verbose=1; % 1 = display animation of fits and extra output % 0 = do not display n=length(area); % n = sample size (number of quadrats) % fit logistic function [f2,p2,kvg2,iter2,corp2,covp2,covr2,stdresid2,Z2,r22]=... leasqr(area,sp,[1;.5;1],'logist',.0001,20,1,[.001;.001;.001],... 'logistdfdp'); logistR2=r22; % coefficient of determination for logistic function logistRa2=1-((n-1)/(n-3))+((n-1)/(n-3))*logistR2;

326
LITERATURE CITED Boecklen, W.J., and N. Gotelli. 1984. Island biogeographic theory and conservation
practice: species-area or specious-area relationships? Biological Conservation 29:63-80.
He, F., and P. Legendre. 1996. On species-area relations. The American Naturalist
148:719-737. Loehle, C. 1990. Home range: a fractal approach. Landscape Ecology 5:39-52.