© 2003-09 the catholic university of america dept of biomedical engineering engr 104: lecture 2...
TRANSCRIPT
© 2003-09 The Catholic University of AmericaDept of Biomedical Engineering
ENGR 104: Lecture 2Statistical Analysis Using Matlab
Lecturers:
Dr. Binh Tran
EN
GR
104:
Int r
o t
o E
ng
i neer i
ng
Lab
Dept
of
Bio
medic
al En
gin
eeri
ng, C
at h
olic
Univ
ers
i ty
© 2003-09 The Catholic University of AmericaDept of Biomedical Engineering
Definitions
Statistics: Science that deals with collection, tabulation, analysis, and interpretation of data (qualitative or quantitative) in order to make objective decisions and solve problems.
EN
GR
104:
Int r
o t
o E
ng
i neer i
ng
Lab
Dept
of
Bio
medic
al En
gin
eeri
ng, C
at h
olic
Univ
ers
i ty
© 2003-09 The Catholic University of AmericaDept of Biomedical Engineering
Statistical Measures of Data
Average/(Arithmetic) Mean: The average value of all observations
Median: Middle observation Mode: Value where highest number of observations
occurs Range: Difference between max and min values (rough
measure of data dispersion) Standard Deviation: Special form of average
deviation from the Mean
EN
GR
104:
Int r
o t
o E
ng
i neer i
ng
Lab
Dept
of
Bio
medic
al En
gin
eeri
ng, C
at h
olic
Univ
ers
i ty
© 2003-09 The Catholic University of AmericaDept of Biomedical Engineering
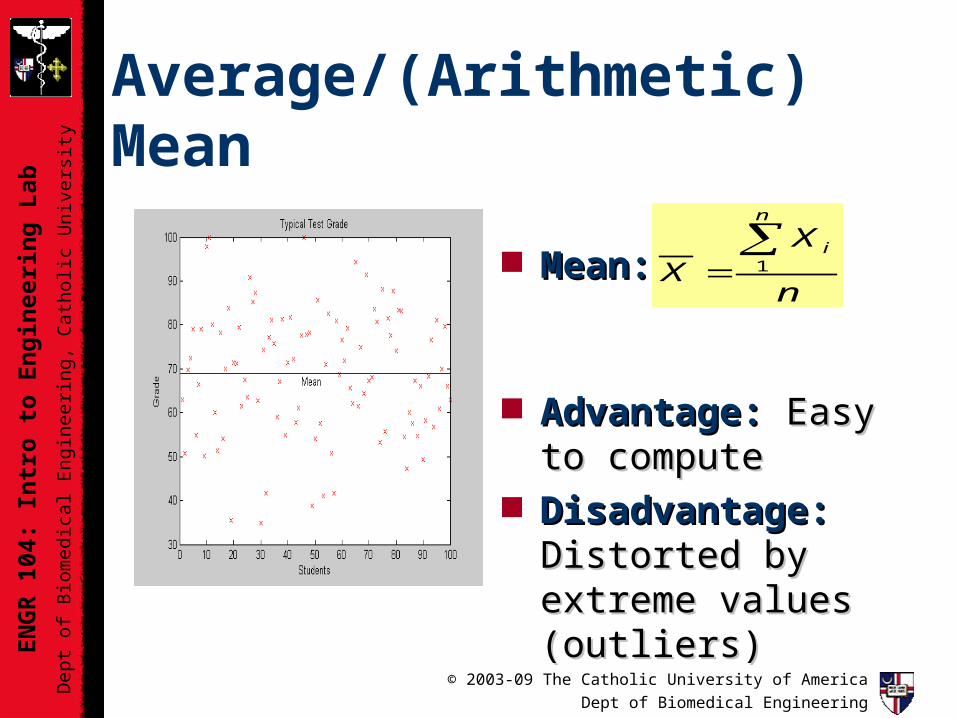
Average/(Arithmetic) Mean
Mean: Mean:
Advantage:Advantage: Easy to Easy to computecompute
Disadvantage: Disadvantage: Distorted Distorted by extreme values by extreme values (outliers)(outliers)
n
XX
n
i 1
EN
GR
104:
Int r
o t
o E
ng
i neer i
ng
Lab
Dept
of
Bio
medic
al En
gin
eeri
ng, C
at h
olic
Univ
ers
i ty
© 2003-09 The Catholic University of AmericaDept of Biomedical Engineering
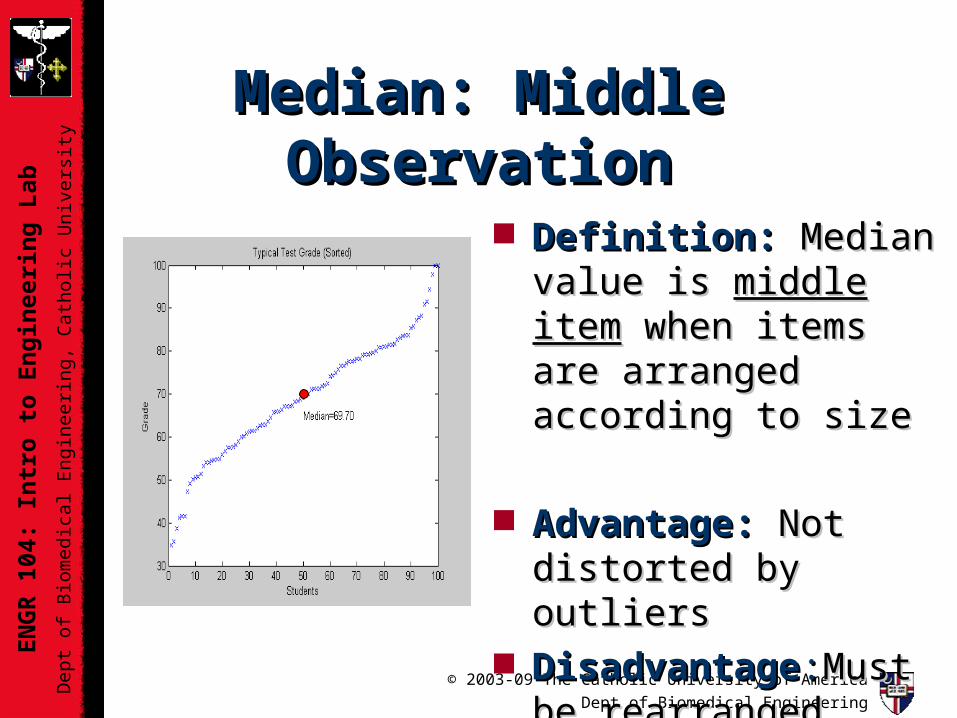
Median: Middle ObservationMedian: Middle Observation
Definition:Definition: Median value is Median value is middle itemmiddle item when items are when items are arranged according to sizearranged according to size
Advantage:Advantage: Not distorted by Not distorted by outliersoutliers
DisadvantageDisadvantage::Must be Must be rearranged according to sizerearranged according to size

EN
GR
104:
Int r
o t
o E
ng
i neer i
ng
Lab
Dept
of
Bio
medic
al En
gin
eeri
ng, C
at h
olic
Univ
ers
i ty
© 2003-09 The Catholic University of AmericaDept of Biomedical Engineering
Mode & RangeMode & Range ModeMode: : Most common value occurring in set of dataMost common value occurring in set of data
AdvantageAdvantage: : Most typicalMost typical value and independent of the value and independent of the extreme itemsextreme items
DisadvantageDisadvantage: : If values are not repeated and amount of If values are not repeated and amount of data is small, then the significance of the mode is limiteddata is small, then the significance of the mode is limited
RangeRange: : Difference between min/max values in seriesDifference between min/max values in series AdvantageAdvantage: : Easy to compute & simplest measure of Easy to compute & simplest measure of
dispersiondispersion DisadvantageDisadvantage: : No info regarding distribution of dataNo info regarding distribution of data

EN
GR
104:
Int r
o t
o E
ng
i neer i
ng
Lab
Dept
of
Bio
medic
al En
gin
eeri
ng, C
at h
olic
Univ
ers
i ty
© 2003-09 The Catholic University of AmericaDept of Biomedical Engineering
Standard Deviation
n
XXn
i 1
2
Definition: Definition:
Advantage: Advantage: Show the Show the degree of dispersion and degree of dispersion and variability variability
Disadvantage: Disadvantage: Not trivial Not trivial to computeto compute
2 = 95.5%
1 = 68.3%
EN
GR
104:
Int r
o t
o E
ng
i neer i
ng
Lab
Dept
of
Bio
medic
al En
gin
eeri
ng, C
at h
olic
Univ
ers
i ty
© 2003-09 The Catholic University of AmericaDept of Biomedical Engineering
Presentation of DataPresentation of Data
Frequency Plot: Histogram of # of occurrences. Curve Fitting: Polynomial fitting of experimental
data Time Series Analysis or Trend Plots::
– Analysis of trends in data

EN
GR
104:
Int r
o t
o E
ng
i neer i
ng
Lab
Dept
of
Bio
medic
al En
gin
eeri
ng, C
at h
olic
Univ
ers
i ty
© 2003-09 The Catholic University of AmericaDept of Biomedical Engineering
Data PresentationData Presentation::Frequency Plot or HistogramFrequency Plot or Histogram
Definition:Definition: Graphic Graphic representation of representation of frequency distributionfrequency distribution
AdvantageAdvantage: Quick : Quick visualization of datavisualization of data
Disadvantage:Disadvantage: Difficult to Difficult to analyze data, unless data is analyze data, unless data is grouped systematicallygrouped systematically

EN
GR
104:
Int r
o t
o E
ng
i neer i
ng
Lab
Dept
of
Bio
medic
al En
gin
eeri
ng, C
at h
olic
Univ
ers
i ty
© 2003-09 The Catholic University of AmericaDept of Biomedical Engineering
Data PresentationData Presentation:: Polynomial Curve Fitting
Best fit curve for dataBest fit curve for data Polynomial Equation:Polynomial Equation:
AdvantageAdvantage: Large set of data : Large set of data can be represented by a known can be represented by a known equationequation
DisadvantageDisadvantage: m>2, process : m>2, process becomes very laboriousbecomes very laborious
max
ma
mxamxay
1
110
EN
GR
104:
Int r
o t
o E
ng
i neer i
ng
Lab
Dept
of
Bio
medic
al En
gin
eeri
ng, C
at h
olic
Univ
ers
i ty
© 2003-09 The Catholic University of AmericaDept of Biomedical Engineering
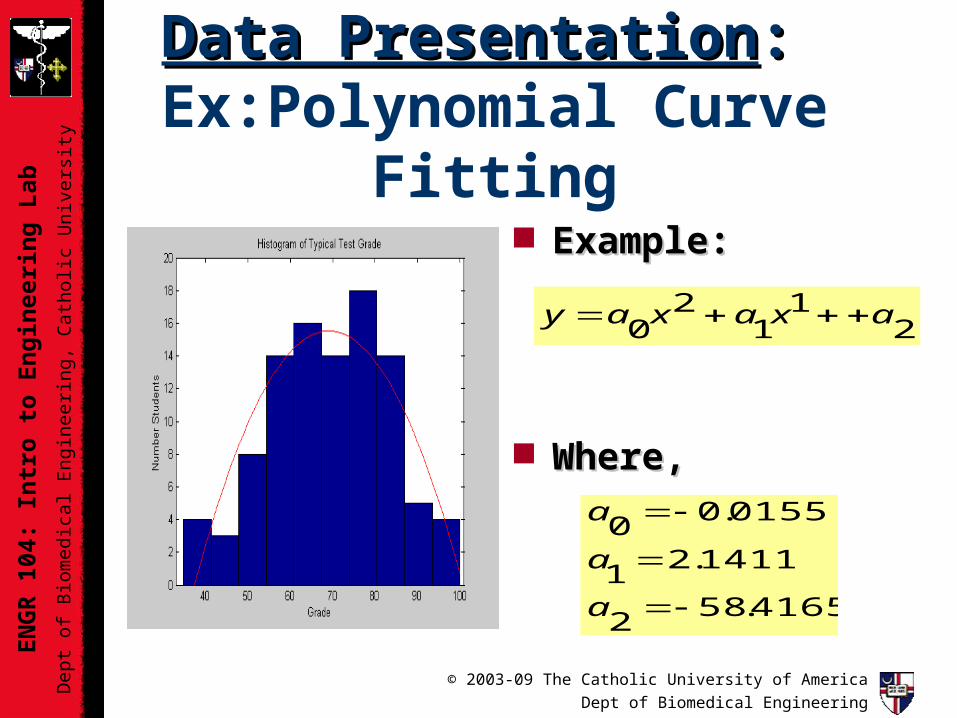
Data PresentationData Presentation:: Ex:Polynomial Curve Fitting
21
12
0axaxay
Example: Example:
Where, Where,
4165.582
1411.21
0155.00
a
a
a

EN
GR
104:
Int r
o t
o E
ng
i neer i
ng
Lab
Dept
of
Bio
medic
al En
gin
eeri
ng, C
at h
olic
Univ
ers
i ty
© 2003-09 The Catholic University of AmericaDept of Biomedical Engineering
Data PresentationData Presentation:: Time Series (Trend) AnalysisTime Series (Trend) Analysis
Definition:Definition: Graphic Graphic representation consisting of representation consisting of description & measurement of description & measurement of various changes or movements of various changes or movements of data during a period of time.data during a period of time.
Types of trend measurementTypes of trend measurement• Semi-averageSemi-average• Moving averageMoving average

EN
GR
104:
Int r
o t
o E
ng
i neer i
ng
Lab
Dept
of
Bio
medic
al En
gin
eeri
ng, C
at h
olic
Univ
ers
i ty
© 2003-09 The Catholic University of AmericaDept of Biomedical Engineering
Data PresentationData Presentation:: Semi-AverageSemi-Average
Definition:Definition: Split data set Split data set into two equal parts; take into two equal parts; take average; draw average; draw straight linestraight line through two average pointsthrough two average points
Advantage:Advantage: Very simple to Very simple to calculatecalculate
Disadvantage: Disadvantage: Only gross Only gross representation of data trendsrepresentation of data trends

EN
GR
104:
Int r
o t
o E
ng
i neer i
ng
Lab
Dept
of
Bio
medic
al En
gin
eeri
ng, C
at h
olic
Univ
ers
i ty
© 2003-09 The Catholic University of AmericaDept of Biomedical Engineering
Data PresentationData Presentation:: Moving AverageMoving Average
Definition:Definition: A series of A series of successive group averages successive group averages
Advantage:Advantage: Simple to calculate; Simple to calculate; more accurate representation of more accurate representation of local changeslocal changes
Disadvantage:Disadvantage: Cannot be Cannot be brought up to datebrought up to date

EN
GR
104:
Int r
o t
o E
ng
i neer i
ng
Lab
Dept
of
Bio
medic
al En
gin
eeri
ng, C
at h
olic
Univ
ers
i ty
© 2003-09 The Catholic University of AmericaDept of Biomedical Engineering
Data PresentationData Presentation::Ex: Three-Item Moving AverageEx: Three-Item Moving Average
Values Total Moving Average
3
5 15 5.00
7 22 7.33
10 29 9.67
12 36 12.00
14 41 13.67
15 46 15.33
17

EN
GR
104:
Int r
o t
o E
ng
i neer i
ng
Lab
Dept
of
Bio
medic
al En
gin
eeri
ng, C
at h
olic
Univ
ers
i ty
© 2003-09 The Catholic University of AmericaDept of Biomedical Engineering
Questions ?Questions ?

EN
GR
104:
Int r
o t
o E
ng
i neer i
ng
Lab
Dept
of
Bio
medic
al En
gin
eeri
ng, C
at h
olic
Univ
ers
i ty
© 2003-09 The Catholic University of AmericaDept of Biomedical Engineering
Lab #2: Telemedicine Analysis
Lab Report Due: 9/29 Download Telemedicine data for 6
study subjects (txt files)– http://faculty.cua.edu/tran/engr104/Datafiles.htm
Using Matlab, statistically analyze the data and report your observations
See handout
EN
GR
104:
Int r
o t
o E
ng
i neer i
ng
Lab
Dept
of
Bio
medic
al En
gin
eeri
ng, C
at h
olic
Univ
ers
i ty
© 2003-09 The Catholic University of AmericaDept of Biomedical Engineering
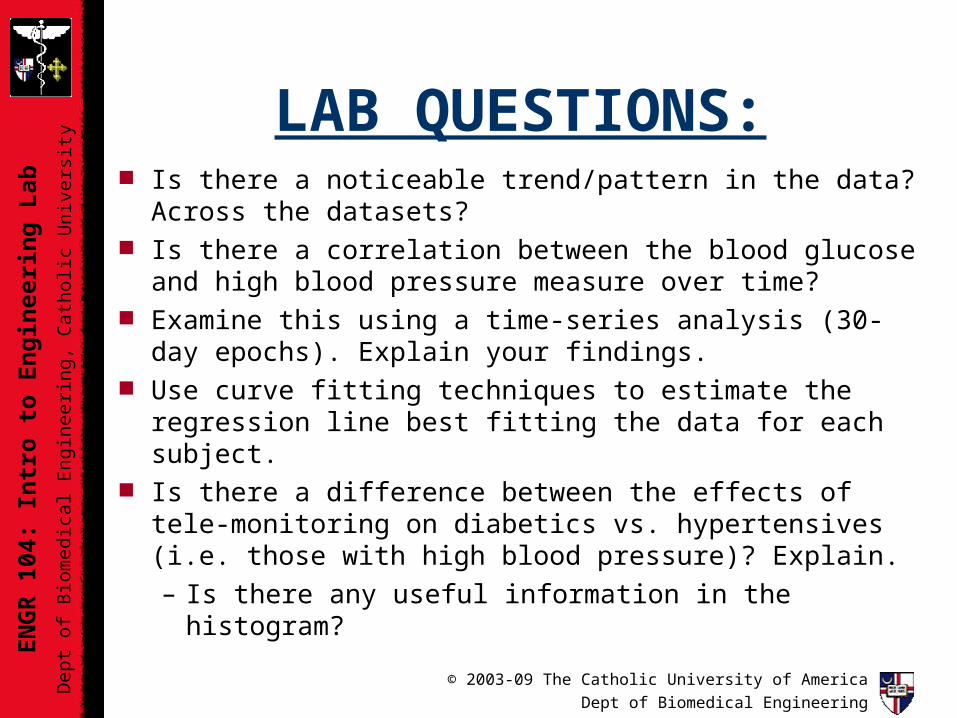
LAB QUESTIONS: Is there a noticeable trend/pattern in the data? Across the
datasets? Is there a correlation between the blood glucose and high blood
pressure measure over time? Examine this using a time-series analysis (30-day epochs). Explain
your findings. Use curve fitting techniques to estimate the regression line best
fitting the data for each subject. Is there a difference between the effects of tele-monitoring on
diabetics vs. hypertensives (i.e. those with high blood pressure)? Explain. – Is there any useful information in the histogram?