| 1| 1peer report: dialysis care & outcomes in the u.s., 2014 | mortality peer report: dialysis...
TRANSCRIPT

| 1Peer Report: Dialysis Care & Outcomes in the U.S., 2014 | Mortality
Peer Report: Dialysis Care & Outcomes in the U.S., 2014
Mortality

| 2Peer Report: Dialysis Care & Outcomes in the U.S., 2014 | Mortality
First-year mortality in incident dialysis patients, by incident year, quarter, & month After first dialysis session in freestanding facility

| 3Peer Report: Dialysis Care & Outcomes in the U.S., 2014 | Mortality
First-year mortality in incident dialysis patients, overall & by U.S. Census Division After first dialysis session in freestanding facility

| 4Peer Report: Dialysis Care & Outcomes in the U.S., 2014 | Mortality
First-year mortality in incident dialysis patients, by U.S. Census Division: Division 1, New England After first dialysis session in freestanding facility. Deaths per 100 patient years; APC, Annual Percent Change. Maps show 2011 rates.

| 5Peer Report: Dialysis Care & Outcomes in the U.S., 2014 | Mortality
First-year mortality in incident dialysis patients, by U.S. Census Division: Division 2, Middle AtlanticAfter first dialysis session in freestanding facility. Deaths per 100 patient years; APC, Annual Percent Change. Maps show 2011 rates.

| 6Peer Report: Dialysis Care & Outcomes in the U.S., 2014 | Mortality
First-year mortality in incident dialysis patients, by U.S. Census Division: Division 3, East North CentralAfter first dialysis session in freestanding facility. Deaths per 100 patient years; APC, Annual Percent Change. Maps show 2011 rates.

| 7Peer Report: Dialysis Care & Outcomes in the U.S., 2014 | Mortality
First-year mortality in incident dialysis patients, by U.S. Census Division: Division 4, West North Central After first dialysis session in freestanding facility. Deaths per 100 patient years; APC, Annual Percent Change. Maps show 2011 rates.

| 8Peer Report: Dialysis Care & Outcomes in the U.S., 2014 | Mortality
First-year mortality in incident dialysis patients, by U.S. Census Division: Division 5, South Atlantic After first dialysis session in freestanding facility. Deaths per 100 patient years; APC, Annual Percent Change. Maps show 2011 rates.

| 9Peer Report: Dialysis Care & Outcomes in the U.S., 2014 | Mortality
First-year mortality in incident dialysis patients, by U.S. Census Division: Division 6, East South Central After first dialysis session in freestanding facility. Deaths per 100 patient years; APC, Annual Percent Change. Maps show 2011 rates.

| 10Peer Report: Dialysis Care & Outcomes in the U.S., 2014 | Mortality
First-year mortality in incident dialysis patients, by U.S. Census Division: Division 7, West South Central After first dialysis session in freestanding facility. Deaths per 100 patient years; APC, Annual Percent Change. Maps show 2011 rates.

| 11Peer Report: Dialysis Care & Outcomes in the U.S., 2014 | Mortality
First-year mortality in incident dialysis patients, by U.S. Census Division: Division 8, Mountain After first dialysis session in freestanding facility. Deaths per 100 patient years; APC, Annual Percent Change. Maps show 2011 rates.

| 12Peer Report: Dialysis Care & Outcomes in the U.S., 2014 | Mortality
First-year mortality in incident dialysis patients, by U.S. Census Division: Division 9, Pacific After first dialysis session in freestanding facility. Deaths per 100 patient years; APC, Annual Percent Change. Maps show 2011 rates.

| 13Peer Report: Dialysis Care & Outcomes in the U.S., 2014 | Mortality
Weekly mortality rates in incident dialysis patients After first dialysis session in a freestanding facility

| 14Peer Report: Dialysis Care & Outcomes in the U.S., 2014 | Mortality
Weekly mortality rates in incident dialysis patients, by ageAfter first dialysis session in a freestanding facility
| 15Peer Report: Dialysis Care & Outcomes in the U.S., 2014 | Mortality
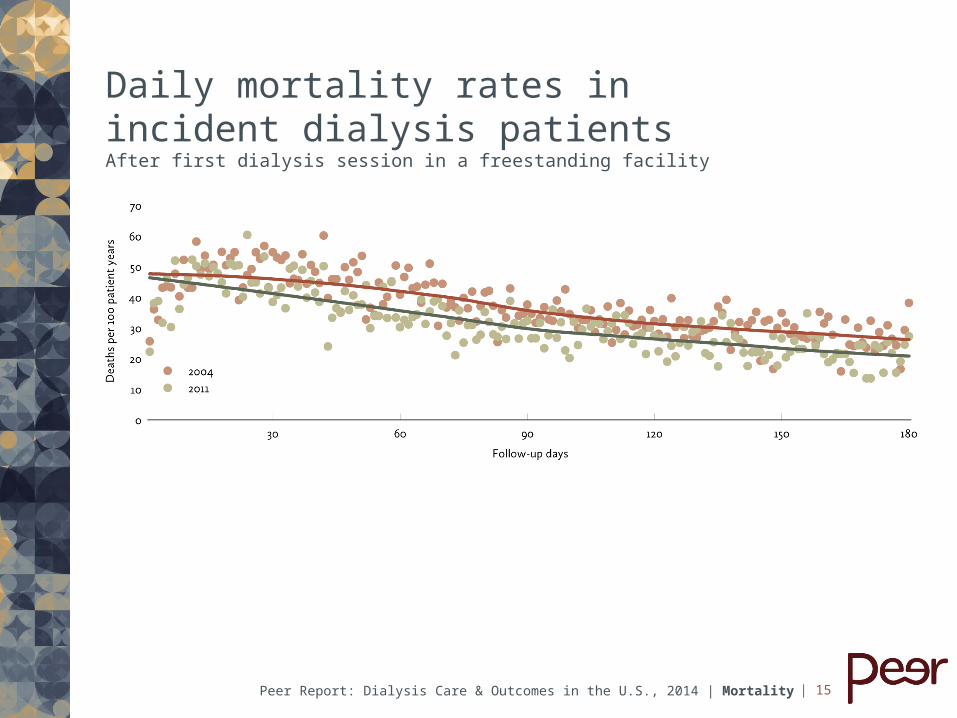
Daily mortality rates in incident dialysis patientsAfter first dialysis session in a freestanding facility

| 16Peer Report: Dialysis Care & Outcomes in the U.S., 2014 | Mortality
Daily mortality rates in incident dialysis patients, by ageAfter first dialysis session in a freestanding facility

| 17Peer Report: Dialysis Care & Outcomes in the U.S., 2014 | Mortality
Expected remaining lifetimes in incident dialysis patients

| 18Peer Report: Dialysis Care & Outcomes in the U.S., 2014 | Mortality
Distribution of causes of death during the first year of dialysisAccording to the Death Notification Form

| 19Peer Report: Dialysis Care & Outcomes in the U.S., 2014 | Mortality
Distribution of causes of death during the first year of dialysis (continued)According to the Death Notification Form

| 20Peer Report: Dialysis Care & Outcomes in the U.S., 2014 | Mortality
Cause-specific mortality in incident dialysis patientsAfter first dialysis session in a freestanding facility

| 21Peer Report: Dialysis Care & Outcomes in the U.S., 2014 | Mortality
Number of incident peritoneal dialysis patientsOn peritoneal dialysis within three months of dialysis initiation

| 22Peer Report: Dialysis Care & Outcomes in the U.S., 2014 | Mortality
Mortality rates in incident peritoneal dialysis patientsOn peritoneal dialysis within three months of dialysis initiation

| 23Peer Report: Dialysis Care & Outcomes in the U.S., 2014 | Mortality
Mortality rates in incident peritoneal dialysis patients, by U.S. Census Division On peritoneal dialysis within three months of dialysis initiation

| 24Peer Report: Dialysis Care & Outcomes in the U.S., 2014 | Mortality
Mortality in prevalent dialysis patients, by year, quarter, & monthDeaths per 100 patient years among patients alive on January 1 of each year

| 25Peer Report: Dialysis Care & Outcomes in the U.S., 2014 | Mortality
Mortality in prevalent dialysis patients, overall & by U.S. Census Division Deaths per 100 patient years among patients alive on January 1 of each year

| 26Peer Report: Dialysis Care & Outcomes in the U.S., 2014 | Mortality
Mortality in prevalent dialysis patients, by U.S. Census Division: Division 1, New England Deaths per 100 patient years among patients alive on January 1 of each year; APC, Annual Percent Change. Maps show 2011 rates.

| 27Peer Report: Dialysis Care & Outcomes in the U.S., 2014 | Mortality
Mortality in prevalent dialysis patients, by U.S. Census Division: Division 2, Middle Atlantic Deaths per 100 patient years among patients alive on January 1 of each year; APC, Annual Percent Change. Maps show 2011 rates.

| 28Peer Report: Dialysis Care & Outcomes in the U.S., 2014 | Mortality
Mortality in prevalent dialysis patients, by U.S. Census Division: Division 3, East North Central Deaths per 100 patient years among patients alive on January 1 of each year; APC, Annual Percent Change. Maps show 2011 rates.

| 29Peer Report: Dialysis Care & Outcomes in the U.S., 2014 | Mortality
Mortality in prevalent dialysis patients, by U.S. Census Division: Division 4, West North Central Deaths per 100 patient years among patients alive on January 1 of each year; APC, Annual Percent Change. Maps show 2011 rates.

| 30Peer Report: Dialysis Care & Outcomes in the U.S., 2014 | Mortality
Mortality in prevalent dialysis patients, by U.S. Census Division: Division 5, South Atlantic Deaths per 100 patient years among patients alive on January 1 of each year; APC, Annual Percent Change. Maps show 2011 rates.

| 31Peer Report: Dialysis Care & Outcomes in the U.S., 2014 | Mortality
Mortality in prevalent dialysis patients, by U.S. Census Division: Division 6, East South Central Deaths per 100 patient years among patients alive on January 1 of each year; APC, Annual Percent Change. Maps show 2011 rates.

| 32Peer Report: Dialysis Care & Outcomes in the U.S., 2014 | Mortality
Mortality in prevalent dialysis patients, by U.S. Census Division: Division 7, West South Central Deaths per 100 patient years among patients alive on January 1 of each year; APC, Annual Percent Change. Maps show 2011 rates.

| 33Peer Report: Dialysis Care & Outcomes in the U.S., 2014 | Mortality
Mortality in prevalent dialysis patients, by U.S. Census Division: Division 8, Mountain Deaths per 100 patient years among patients alive on January 1 of each year; APC, Annual Percent Change. Maps show 2011 rates.

| 34Peer Report: Dialysis Care & Outcomes in the U.S., 2014 | Mortality
Mortality in prevalent dialysis patients, by U.S. Census Division: Division 9, Pacific Deaths per 100 patient years among patients alive on January 1 of each year; APC, Annual Percent Change. Maps show 2011 rates.

| 35Peer Report: Dialysis Care & Outcomes in the U.S., 2014 | Mortality
Counts of prevalent patients, by year, quarter, & month

| 36Peer Report: Dialysis Care & Outcomes in the U.S., 2014 | Mortality
Counts of prevalent patient deaths, by year, quarter, & month

| 37Peer Report: Dialysis Care & Outcomes in the U.S., 2014 | Mortality
Mortality trends in prevalent dialysis patients, by stratumDeaths per 100 patient years among patients alive on January 1 of each year; APC, Annual Percent Change.

| 38Peer Report: Dialysis Care & Outcomes in the U.S., 2014 | Mortality
Expected remaining lifetimes in prevalent dialysis patients

| 39Peer Report: Dialysis Care & Outcomes in the U.S., 2014 | Mortality
Cause of death in prevalent dialysis patients

| 40Peer Report: Dialysis Care & Outcomes in the U.S., 2014 | Mortality
Number of deaths prevented, due to year-over-year changes in the death rate

| 41Peer Report: Dialysis Care & Outcomes in the U.S., 2014 | Mortality
Number of deaths prevented, due to cumulative changes in the death rate since 2003