- 0 - presentation on indian economy february 2010
TRANSCRIPT

- 1 -
PRESENTATION ON INDIAN ECONOMY
February 2010

- 2 -
STRONG MACRO FUNDAMENTALS
World’s fourth-largest economy in terms of PPP* and ranked 12th in US$ terms.
GDP has increased rapidly over the past 15 years from $250 billion to over US$ 1 trillion currently.
Per Capita Income in 2008-09:- US$ 2,563 in PPP terms- US$ 831 in nominal terms
0
100
200
300
400
500
600
700
800
900
19
92
-93
19
93
-94
19
94
-95
19
95
-96
19
96
-97
19
97
-98
19
98
-99
19
99
-00
20
00
-01
20
01
-02
20
02
-03
20
03
-04
20
04
-05
20
05
-06
20
06
-07
20
07
-08
20
08
-09
0
200
400
600
800
1000
1200
1400
Per capita income GDP
US$ US$ bn
* PPP : Purchasing Power Parity terms
–
–
–
- 3 -
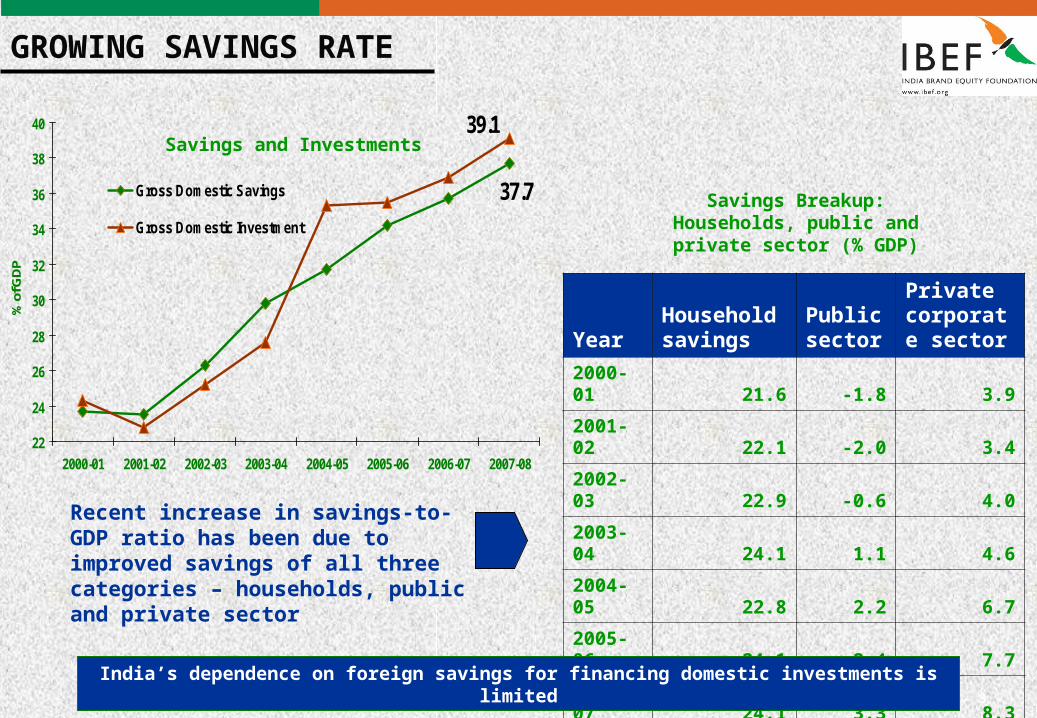
GROWING SAVINGS RATE
37.7
39.1
22
24
26
28
30
32
34
36
38
40
2000-01 2001-02 2002-03 2003-04 2004-05 2005-06 2006-07 2007-08
% o
f GD
P
Gross Domestic Savings
Gross Domestic Investment
YearHouseholdsavings
Public sector
Private corporate sector
2000-01 21.6 -1.8 3.9
2001-02 22.1 -2.0 3.4
2002-03 22.9 -0.6 4.0
2003-04 24.1 1.1 4.6
2004-05 22.8 2.2 6.7
2005-06 24.1 2.4 7.7
2006-07 24.1 3.3 8.3
2007-08 24.3 4.5 8.8
Savings and Investments
Savings Breakup: Households, public and private sector (%
GDP)
Recent increase in savings-to-GDP ratio has been due to improved savings of all three categories – households, public and private sector
India’s dependence on foreign savings for financing domestic investments is limited
- 4 -
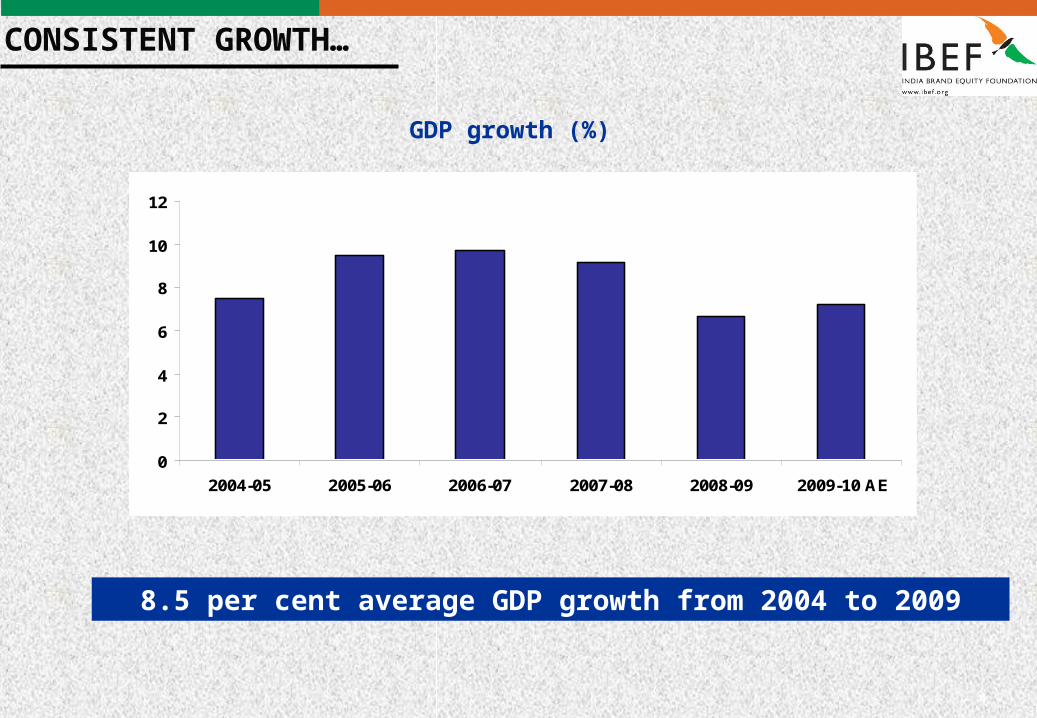
GDP growth (%)
CONSISTENT GROWTH…
0
2
4
6
8
10
12
2004-05 2005-06 2006-07 2007-08 2008-09 2009-10 AE
8.5 per cent average GDP growth from 2004 to 2009

- 5 -Source: IMF
India is set to grow faster than other regions (Annual Percentage change)
Economies 2008 2009 Projections
2010 2011
World 3.0 -0.8 3.9 4.3
Advanced Economies 0.5 -3.2 2.1 2.4
United States 0.4 -2.5 2.7 2.4
Euro Area 0.6 -3.9 1.0 1.6
Japan -1.2 -5.3 1.7 2.2
Developing Asia 7.9 6.5 8.4 8.4
China 9.6 8.7 10.0 9.7
India 7.3 5.6 7.7 7.8
Brazil 5.1 -0.4 4.7 3.7
…OUTPACING THE WORLD

- 6 -
GDP Composition: 1990-91 and 2009-10
1990-91
32%
27%
41%
Agriculture Industry Services
2009-1015%
28%
57%
RISE OF SERVICES AND INDUSTRY

- 7 -
FDI and Portfolio Inflows (US$ bn)
8.9
22.7
34.2 35.0
26.5
12.57.1
29.623.7
-14.0
2005-06 2006-07 2007-08 2008-09 2009-10*
Inward FDI Portfolio
*Apr-Dec 2009
CAPITAL INFLOWS ARE RISING
• Foreign Direct Investment (FDI) in Jan 2010 grew 13.2 per cent over the previous month, to touch US$ 1.54 billion
• Private equity investments in India doubled in Jan 2010, with deals of over US$ 386 mn being announced.
• The recent recovery in capital inflows has lead to a 5-6% recovery in the value of the Rupee, which is currently trading at levels of Rs 46-47 /US$.

- 8 -
RESILIENT ECONOMY
OPPORTUNITY INDIA
TRENDS
- 9 -
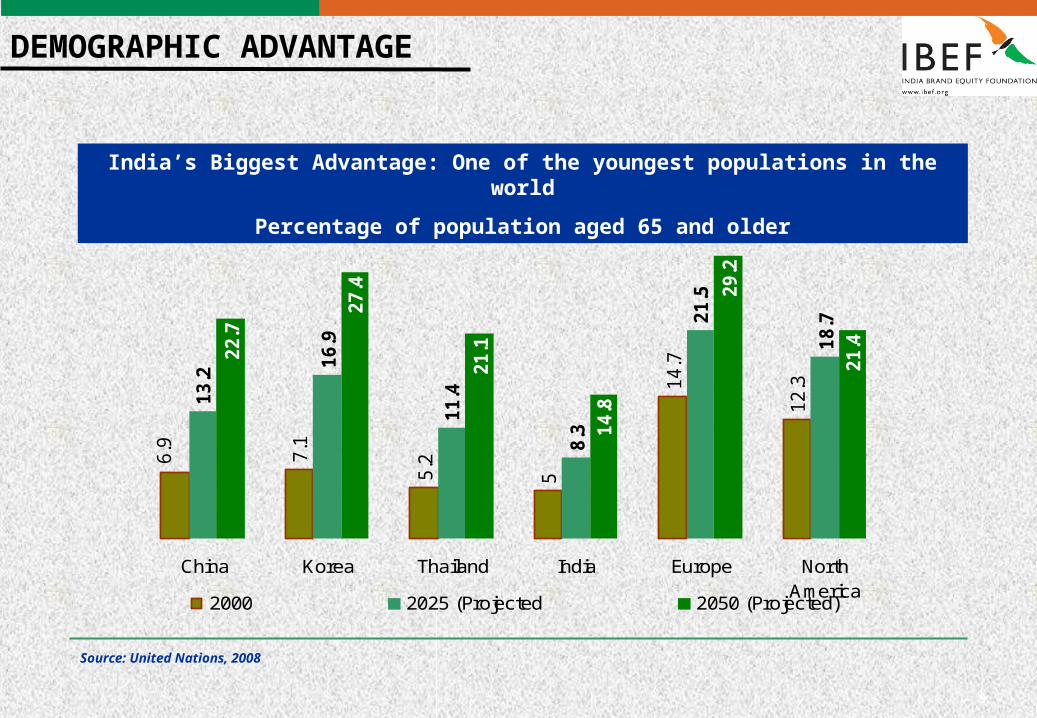
DEMOGRAPHIC ADVANTAGE
7.1
5
14.7
12.3
13.2
16.9
11.4
8.3
18.7
22.7
21.1
14.8
21.4
5.26
.9
21.5 2
9.2
27.4
China Korea Thailand India Europe NorthAmerica
2000 2025 (Projected 2050 (Projected)
India’s Biggest Advantage: One of the youngest populations in the world
Percentage of population aged 65 and older
Source: United Nations, 2008

- 10 -
• 50 per cent of the population under 25
• Among top three of 30 nations in availability of skilled labour
• 7.7 mn new entrants to the workforce every year
• Dependency ratio expected to fall from current 60 per cent to 48 per cent by 2025
STRONG DEMOGRAPHIC DIVIDEND
BOOSTING INCREDIBLE ASPIRATIONS

- 11 -
Market capitalisation
0
20
40
60
80
100
120
140
160
Oil
& g
as &
PO
L
pro
ducts
Banks a
nd
Fin
ancia
l
serv
ices
Energ
y
Constr
uction
Meta
ls a
nd
meta
l pro
ducts
IT /
ITE
S
Tele
com
Engin
eering
Consum
er
dis
cre
tionary
Dru
gs &
pharm
aceuticals
Min
ing
Tra
din
g
Auto
/ A
uto
ancill
iary
US$ billion
RELENTLESS ENTREPRENEURSHIP
Emergent Indian enterprises across sectors ranging from engineering to financial services.
Market capitalisation of top-500 companies in excess of $800 bn or about 70% of GDP

- 12 -12
INDIA INC. GOING GLOBAL
US$ 2.8 billion US$ 2.8 billion ONGC acquired Imperial Energy PLC in 2008ONGC acquired Imperial Energy PLC in 2008
US$ 44.44 million
US$ 44.44 million
Spice Group acquired 20 per cent stake in MediaRing Ltd. in 2009
Spice Group acquired 20 per cent stake in MediaRing Ltd. in 2009
US$ 82 millionUS$ 82 millionShree Renuka Sugars Ltd. acquired Vale Do Ivai
S.A. Acucar E Alcool sugar and ethanol company in Brazil in 2009
Shree Renuka Sugars Ltd. acquired Vale Do Ivai S.A. Acucar E Alcool sugar and ethanol
company in Brazil in 2009
Sources: 1. Tribune India
2. The First Reporter
Bharti Airtel has acquired a 70 per cent stake in Warid Telecom in 2010
Bharti Airtel has acquired a 70 per cent stake in Warid Telecom in 2010
Planned investment -
US$ 300 million
Planned investment -
US$ 300 million

- 13 -13
Abundant Natural Resources
Fifth-largest bauxite reserves in the world, fourth-largest coal reserves, sixth-largest iron ore deposits
Low-cost Skilled Talent
India offers skilled and trained human resource at low cost
Huge Demand
Large population base and surging middle class with high disposable income
Easy Access to Other Markets
India’s strategic geographical location offers an opportunity to access neighboring South Asian markets
Gains in Productivity
India's productivity growth was 5.5 per cent in 2008, as compared with 2.3 per cent globally
India: Manufacturing
Hub
Sources: The Conference Board; CIA
INDIA: GROWING MANUFACTURING HUB

- 14 -
INDIA: FAVOURED R&D HUB
Sources:: 1. Asia Times; 2. Business Standard
Vast pool of manpower
According to the IMD World Competitiveness Year Book, India ranks among the top three of 30 nations in terms of availability of skilled labour
Higher productivity
Indian graduates, on an average, work 2,350 hours a year as compared with 1,900–1,700 hours in the US
Tax benefits
Companies engaged in scientific R&D projects in India are entitled to a 100 per cent tax relief on profits for 10 years
Growing domestic market
The growing demand for technologically-advanced products in the Indian market is increasingly drawing MNCs to set up R&D centres here
India: R&D Hub
- 15 -
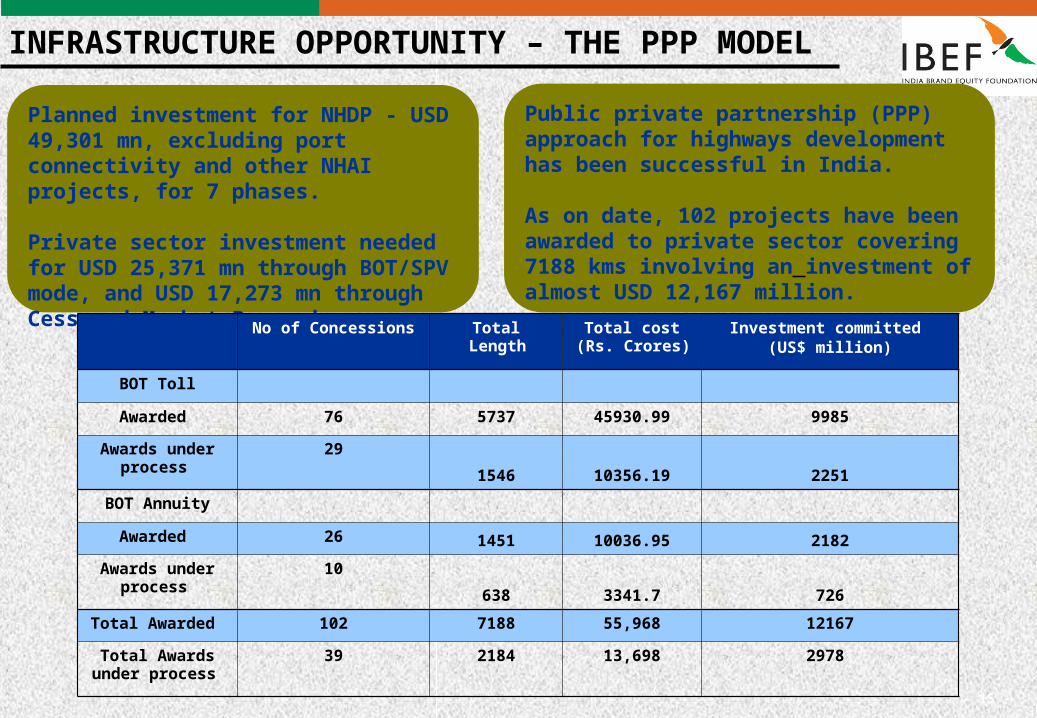
INFRASTRUCTURE OPPORTUNITY – THE PPP MODEL
Planned investment for NHDP - USD 49,301 mn, excluding port connectivity and other NHAI projects, for 7 phases.
Private sector investment needed for USD 25,371 mn through BOT/SPV mode, and USD 17,273 mn through Cess and Market Borrowings.
Public private partnership (PPP) approach for highways development has been successful in India.
As on date, 102 projects have been awarded to private sector covering 7188 kms involving an investment of almost USD 12,167 million.
No of Concessions Total Length Total cost (Rs. Crores)
Investment committed (US$ million)
BOT Toll
Awarded 76 5737 45930.99 9985
Awards under process
29
1546 10356.19 2251
BOT Annuity
Awarded 26 1451 10036.95 2182
Awards under process
10
638 3341.7 726
Total Awarded 102 7188 55,968 12167
Total Awards under process
39 2184 13,698 2978

- 16 -
BIOTECHNOLOGY
India is among the top-12 biotech markets globally.
India ranks third in the Asia-Pacific region, after Japan and Korea.
Expected to touch US$ 5 billion by 2010 and US$ 25 billion by 2015.
*Source: Top 20 biotech companies, Biospectrum industry survey, June 2009, p.14; Ernst & Young analysis
Segment 2008-09 Revenue (in US$ mn)
Contribution (in per cent)
Biopharma 1734.26 64.95
Bioservices 453.64 16.99
Bioagri 328.68 12.31
Bioindustrial 105.16 3.94
Bioinformatics 48.4 1.81

- 17 -
Low-cost operations
• Significantly lower R&D costs; outsourcing to India can save up to US$ 200 million.
• Cost of clinical trials 50 percent lower in phase I and 60 percent lower in phase II compared to global markets.
• Clinical trials take significantly lesser time.
BIOTECHNOLOGY - ADVANTAGE INDIA
Large pool of talented human resources
• Large talent pool of science students pursuing higher education.
• 5000 PhDs and 1000 post-doctorals in biosciences-related fields.
• Top-notch life science education and research institutes.
Favourable IP climate
Adherence to the TRIPS agreement with regard to the Patent Protection Act implemented in 2005 has increased the confidence of innovator companies in India.

- 18 -
PHARMACEUTICALS
Among the fastest growing pharmaceutical markets in the world; worth US$ 16.6 billion in 2007–08
Domestic retail market expected to cross US$ 10 billion mark in 2010 and reach an estimated US$ 12 billion to US$ 13 billion by 2012.
Outsourcing opportunity set to grow to US$ 53 billion in 2010 from US$ 26 billion in 2006.
Key Multinational Companies in India

- 19 -
PHARMACEUTICALS - ADVANTAGE INDIA
The basic production cost in India is almost 50 per cent lower than costs in the US.
85 per cent to 90 per cent
manpower cost savings
40 per cent to 50 per cent savings in raw materials
30 per cent to 50 per cent lower depreciation
Around 1,000 biotech and biochemistry postgraduates pass out every year
Around 10,000 chemistry postgraduate students graduate every year
India: Growing pharma market

- 20 -
IT & ITeS
India topped the A.T. Kearney Global Services Location Index 2009,
beating 49 other countries of the world, emerging to be the destination of
choice as an offshoring location of global IT/ITeS powerhouses
Revenues by segment – Indian IT industry

- 21 -
• India’s share in the global market has increased to four per cent in the IT segment and close to 12 per cent in ITeS in 2008-09.
• India has maintained its position as the preferred outsourcing destination; Indian IT/ITeS companies are now offering a global delivery model, at par with leading global standards.
• India offers low costs, technical and language skills, abundant skilled pool, mature industry players and supportive government policies.
Sources: ITeS: Industry profile, April 2009, CRIS INFAC
IT & ITeS - ADVANTAGE INDIA
Financial attractiveness of top 5 global services locations
Country Index on a scale of 4
India 3.13
China 2.59
Malaysia 2.76
Thailand 3.05
Indonesia 3.23
Source: A T Kearney Global Service Location index 2009

- 22 -
The processed food market in India
is at an early stage with low
penetration and offers huge
opportunities.
In the 2004-2007 period:
– Value of food processing
grew from US$57 bn to US$75 bn
– Number of registered operating
units increased from 24,000 to
25,725.
Source: Flavors of incredible India, Ernst & Young, 2009
FOOD PROCESSING
Growth in output of processed food (US$ billion)

- 23 -
FOR INFORMATION ON INDIAN BUSINESS AND ECONOMY, PLEASE VISIT
www.ibef.org