zoetis: the world leader in animal health · zoetis: the world leader in animal health corporate...
TRANSCRIPT
1
ZOETIS: THE WORLD LEADER IN
ANIMAL HEALTH CORPORATE PRESENTATION
UPDATED AS OF AUGUST 3, 2016
2
FORWARD-LOOKING STATEMENTS
NON-GAAP FINANCIAL INFORMATION
This presentation contains forward-looking statements, which reflect the current views of Zoetis with respect to business
plans or prospects, future operating or financial performance, future guidance, future operating models, expectations
regarding products, future use of cash and dividend payments, tax rate and tax regimes, changes in the tax regimes and
laws in other jurisdictions, and other future events. These statements are not guarantees of future performance or
actions. Forward-looking statements are subject to risks and uncertainties. If one or more of these risks or uncertainties
materialize, or if management's underlying assumptions prove to be incorrect, actual results may differ materially from
those contemplated by a forward-looking statement. Forward-looking statements speak only as of the date on which they
are made. Zoetis expressly disclaims any obligation to update or revise any forward-looking statement, whether as a
result of new information, future events or otherwise. A further list and description of risks, uncertainties and other matters
can be found in our Annual Report on Form 10-K for the fiscal year ended December 31, 2015, including in the sections
thereof captioned “Forward-Looking Information and Factors That May Affect Future Results” and “Item 1A. Risk
Factors,” in our Quarterly Reports on Form 10-Q and in our Current Reports on Form 8-K. These filings and subsequent
filings are available online at www.sec.gov, www.zoetis.com, or on request from Zoetis.
We use non-GAAP financial measures, such as adjusted net income and adjusted diluted earnings per share, to assess
and analyze our operational results and trends and to make financial and operational decisions. We believe these non-
GAAP financial measures are also useful to investors because they provide greater transparency regarding our operating
performance. The non-GAAP financial measures included in this presentation should not be considered alternatives to
measurements required by GAAP, such as net income, operating income, and earnings per share, and should not be
considered measures of liquidity. These non-GAAP financial measures are unlikely to be comparable with non-GAAP
information provided by other companies. Reconciliation of non-GAAP financial measures and GAAP financial measures
are included in the appendix of this presentation as well as in the tables accompanying our earnings release and are
posted on our website at www.zoetis.com.
3
STRONG LONG-TERM
INDUSTRY GROWTH
DRIVERS
4
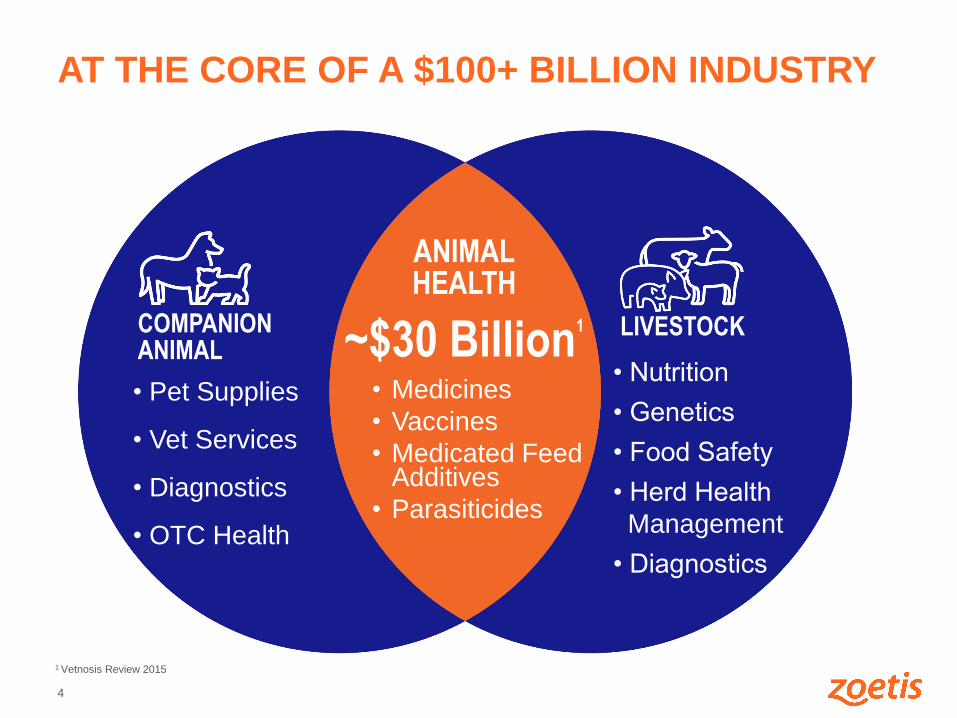
AT THE CORE OF A $100+ BILLION INDUSTRY
COMPANION ANIMAL
LIVESTOCK
1 Vetnosis Review 2015
• Pet Supplies
• Vet Services
• Diagnostics
• OTC Health
• Nutrition
• Genetics
• Food Safety
• Herd Health
Management
• Diagnostics
~$30 Billion1
• Medicines
• Vaccines
• Medicated Feed Additives
• Parasiticides
ANIMAL HEALTH
5
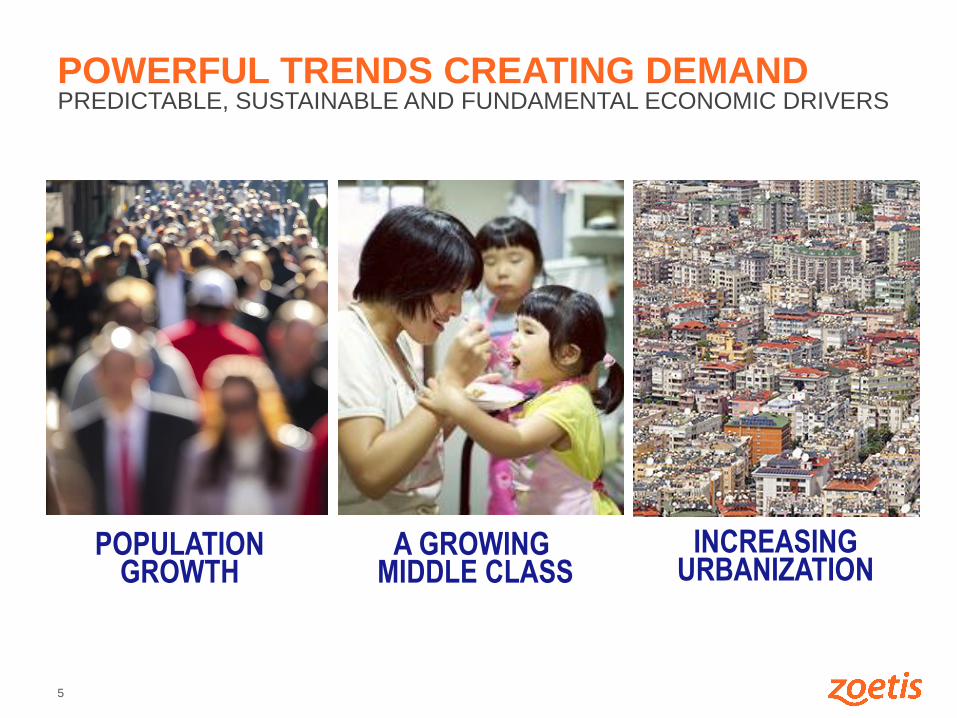
POWERFUL TRENDS CREATING DEMAND
POPULATION GROWTH
A GROWING MIDDLE CLASS
INCREASING URBANIZATION
PREDICTABLE, SUSTAINABLE AND FUNDAMENTAL ECONOMIC DRIVERS
6
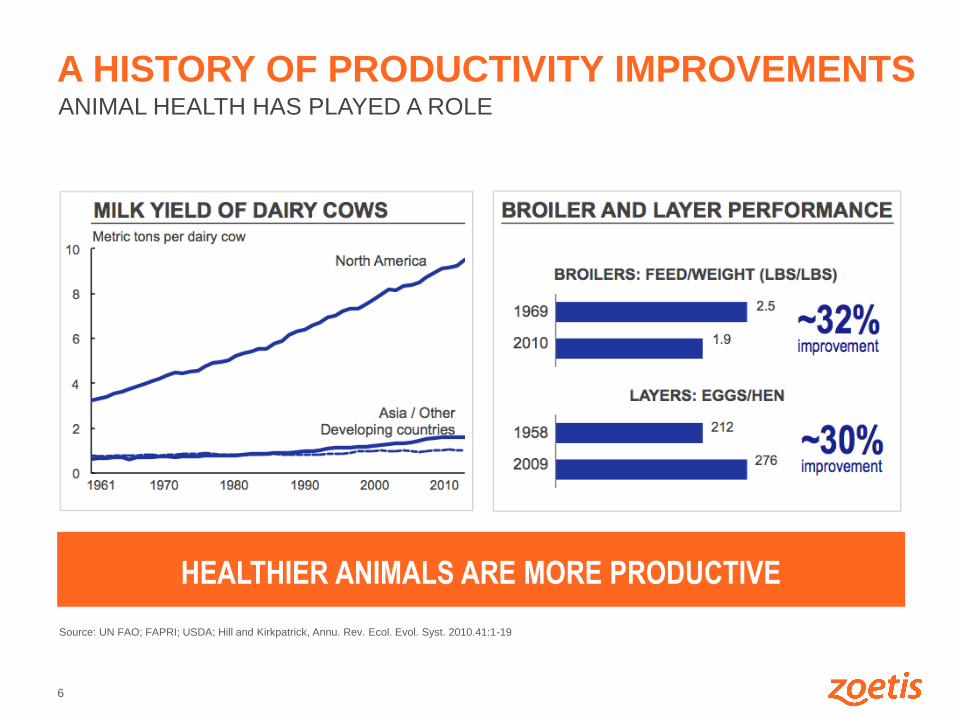
A HISTORY OF PRODUCTIVITY IMPROVEMENTS
HEALTHIER ANIMALS ARE MORE PRODUCTIVE
Source: UN FAO; FAPRI; USDA; Hill and Kirkpatrick, Annu. Rev. Ecol. Evol. Syst. 2010.41:1-19
ANIMAL HEALTH HAS PLAYED A ROLE
7
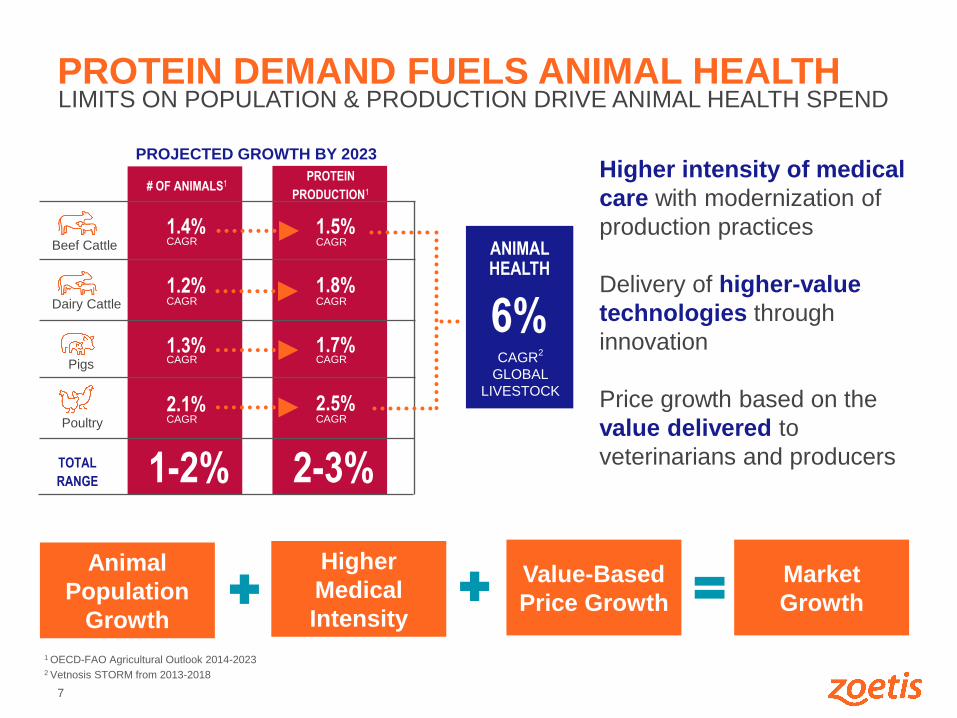
LIMITS ON POPULATION & PRODUCTION DRIVE ANIMAL HEALTH SPEND PROTEIN DEMAND FUELS ANIMAL HEALTH
# OF ANIMALS1 PROTEIN
PRODUCTION1
ANIMAL HEALTH
Beef Cattle
1.4% 1.5% CAGR CAGR
Dairy Cattle
1.2% 1.8% CAGR CAGR
Pigs
1.3% 1.7% CAGR CAGR
Poultry
2.1% 2.5% CAGR CAGR
1-2% 2-3%
6%
TOTAL
RANGE
PROJECTED GROWTH BY 2023
CAGR2
GLOBAL
LIVESTOCK
1 OECD-FAO Agricultural Outlook 2014-2023 2 Vetnosis STORM from 2013-2018
Higher intensity of medical
care with modernization of
production practices
Delivery of higher-value
technologies through
innovation
Price growth based on the
value delivered to
veterinarians and producers
Animal
Population
Growth
Higher
Medical
Intensity
Value-Based
Price Growth
Market
Growth
8
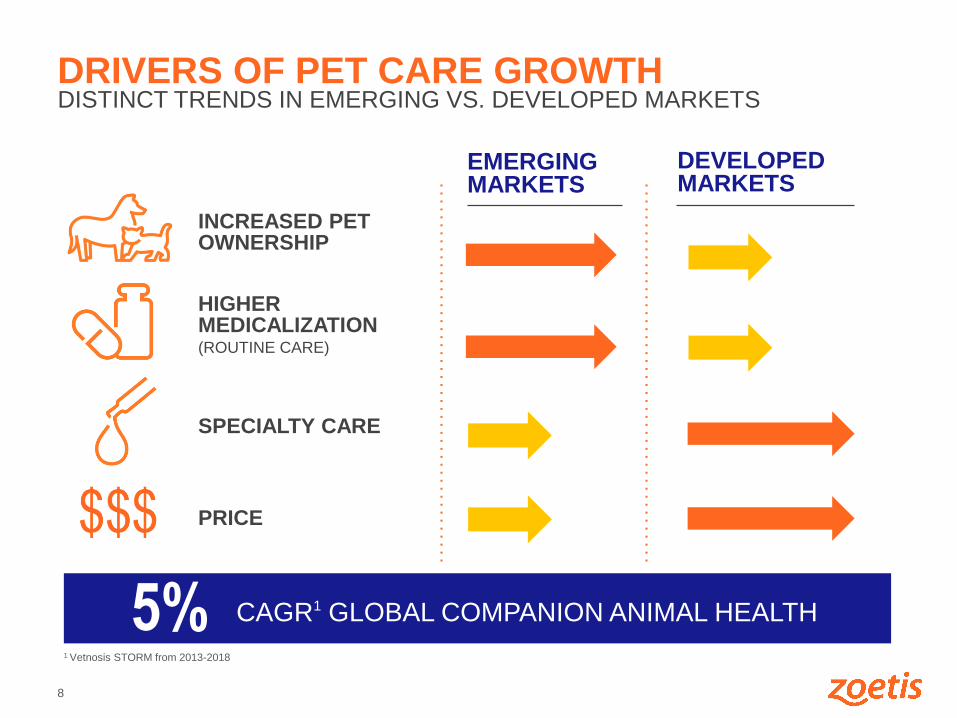
DRIVERS OF PET CARE GROWTH DISTINCT TRENDS IN EMERGING VS. DEVELOPED MARKETS
INCREASED PET OWNERSHIP
HIGHER MEDICALIZATION (ROUTINE CARE)
SPECIALTY CARE
PRICE
EMERGING MARKETS
DEVELOPED MARKETS
5%
CAGR1 GLOBAL COMPANION ANIMAL HEALTH
1 Vetnosis STORM from 2013-2018
9
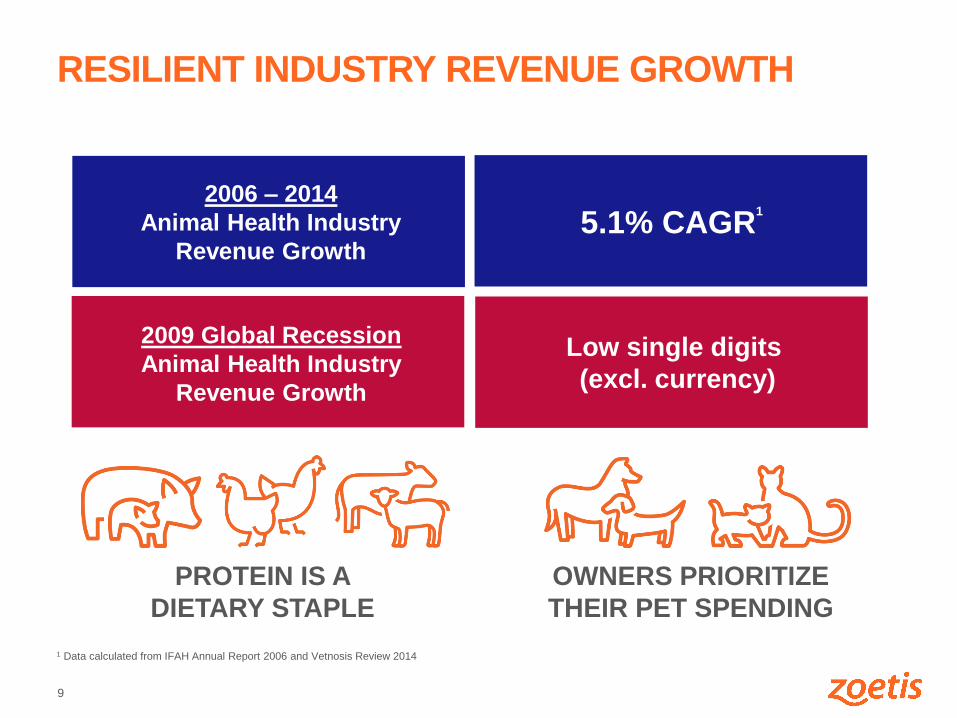
RESILIENT INDUSTRY REVENUE GROWTH
2006 – 2014
Animal Health Industry
Revenue Growth
2009 Global Recession
Animal Health Industry
Revenue Growth
Low single digits
(excl. currency)
1 Data calculated from IFAH Annual Report 2006 and Vetnosis Review 2014
5.1% CAGR1
PROTEIN IS A
DIETARY STAPLE
OWNERS PRIORITIZE
THEIR PET SPENDING
10
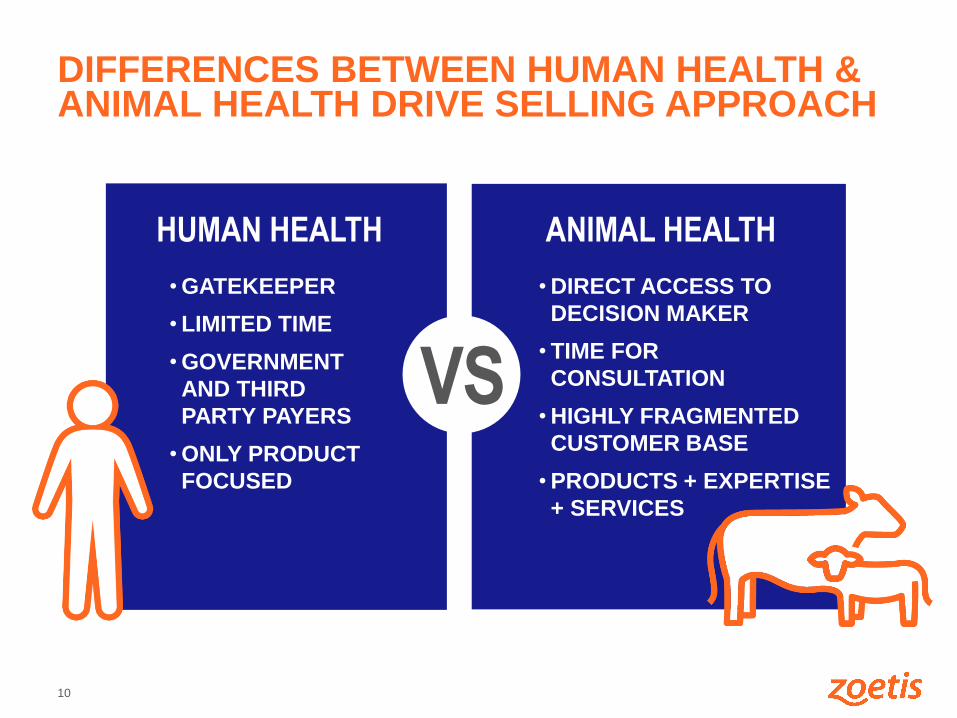
DIFFERENCES BETWEEN HUMAN HEALTH & ANIMAL HEALTH DRIVE SELLING APPROACH
VS
HUMAN HEALTH ANIMAL HEALTH
• DIRECT ACCESS TO
DECISION MAKER
• TIME FOR
CONSULTATION
• HIGHLY FRAGMENTED
CUSTOMER BASE
• PRODUCTS + EXPERTISE
+ SERVICES
• GATEKEEPER
• LIMITED TIME
• GOVERNMENT
AND THIRD
PARTY PAYERS
• ONLY PRODUCT
FOCUSED
11
MARKET LEADERSHIP
AND COMPETITIVE
ADVANTAGES
12
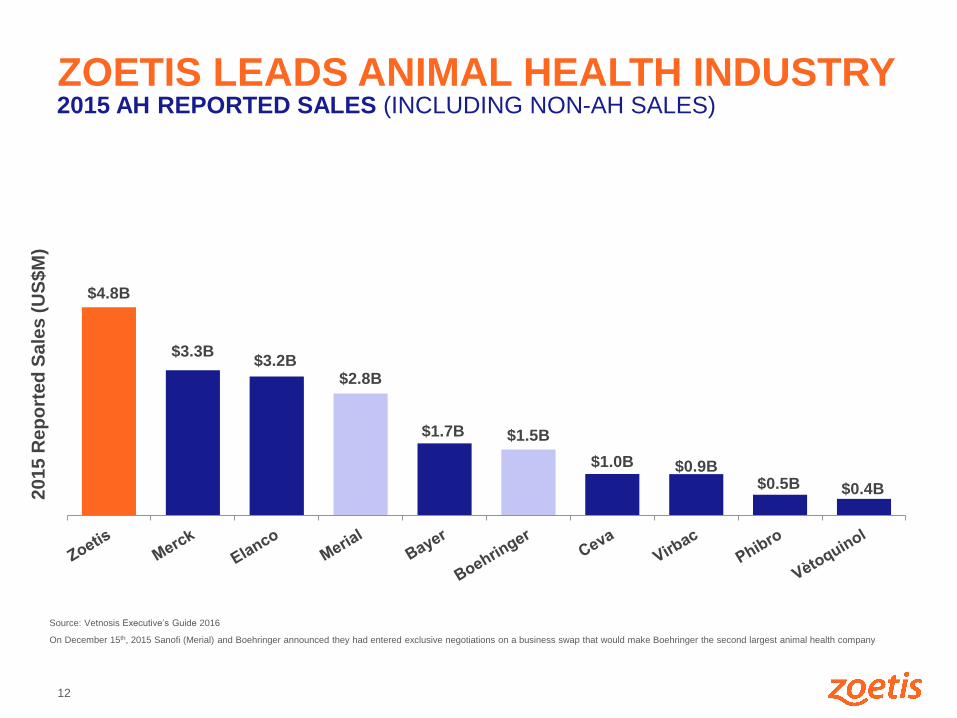
ZOETIS LEADS ANIMAL HEALTH INDUSTRY
2015 AH REPORTED SALES (INCLUDING NON-AH SALES)
Source: Vetnosis Executive’s Guide 2016
On December 15th, 2015 Sanofi (Merial) and Boehringer announced they had entered exclusive negotiations on a business swap that would make Boehringer the second largest animal health company
2015 R
ep
ort
ed
Sa
les
(U
S$
M)
$4.8B
$3.3B $3.2B
$2.8B
$1.7B $1.5B
$1.0B $0.9B $0.5B $0.4B
13
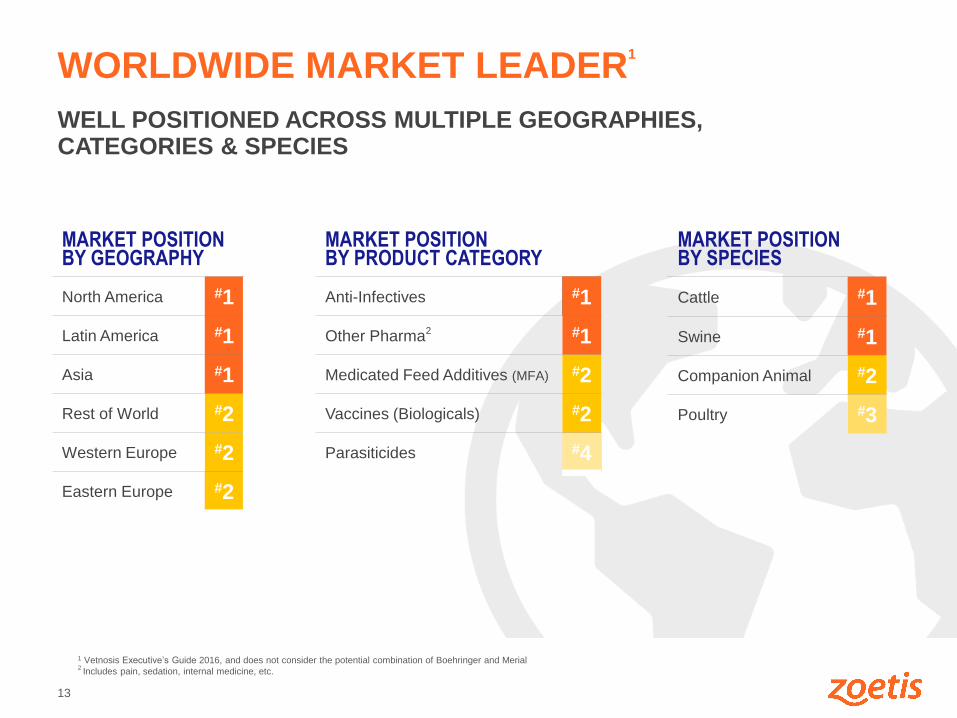
WORLDWIDE MARKET LEADER1
WELL POSITIONED ACROSS MULTIPLE GEOGRAPHIES, CATEGORIES & SPECIES
1 Vetnosis Executive’s Guide 2016, and does not consider the potential combination of Boehringer and Merial 2 Includes pain, sedation, internal medicine, etc.
MARKET POSITION BY PRODUCT CATEGORY
Anti-Infectives #1
Other Pharma2 #1
Medicated Feed Additives (MFA) #2
Vaccines (Biologicals) #2
Parasiticides #4
MARKET POSITION BY GEOGRAPHY
North America #1
Latin America #1
Asia #1
Rest of World #2
Western Europe #2
Eastern Europe #2
MARKET POSITION BY SPECIES
Cattle #1
Swine #1
Companion Animal #2
Poultry #3
14
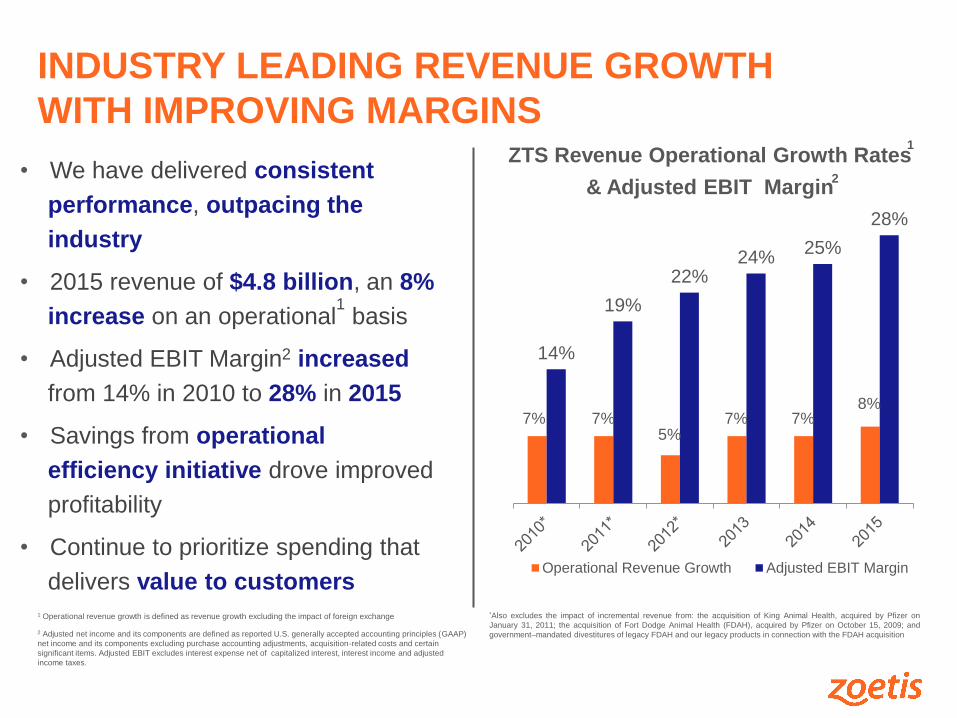
INDUSTRY LEADING REVENUE GROWTH
WITH IMPROVING MARGINS
• We have delivered consistent
performance, outpacing the
industry
• 2015 revenue of $4.8 billion, an 8%
increase on an operational1 basis
• Adjusted EBIT Margin2 increased
from 14% in 2010 to 28% in 2015
• Savings from operational
efficiency initiative drove improved
profitability
• Continue to prioritize spending that
delivers value to customers
ZTS Revenue Operational Growth Rates
& Adjusted EBIT Margin
7% 7% 5%
7% 7% 8%
14%
19%
22% 24%
25%
28%
Operational Revenue Growth Adjusted EBIT Margin
1
2
1 Operational revenue growth is defined as revenue growth excluding the impact of foreign exchange
2 Adjusted net income and its components are defined as reported U.S. generally accepted accounting principles (GAAP)
net income and its components excluding purchase accounting adjustments, acquisition-related costs and certain
significant items. Adjusted EBIT excludes interest expense net of capitalized interest, interest income and adjusted
income taxes.
*Also excludes the impact of incremental revenue from: the acquisition of King Animal Health, acquired by Pfizer on
January 31, 2011; the acquisition of Fort Dodge Animal Health (FDAH), acquired by Pfizer on October 15, 2009; and
government–mandated divestitures of legacy FDAH and our legacy products in connection with the FDAH acquisition
15
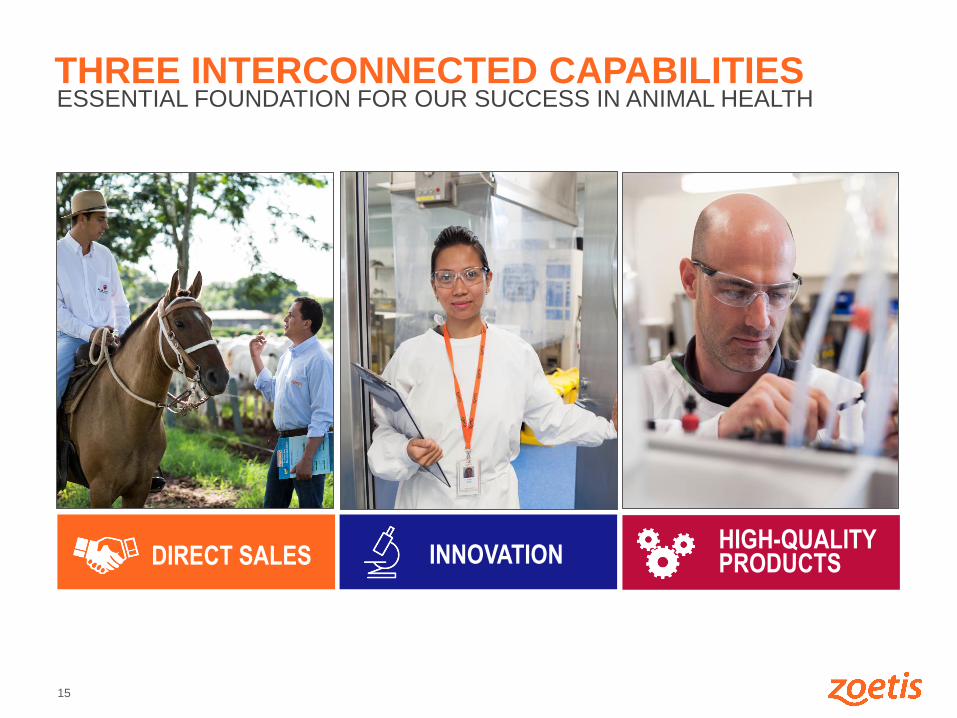
HIGH-QUALITY PRODUCTS DIRECT SALES INNOVATION
THREE INTERCONNECTED CAPABILITIES ESSENTIAL FOUNDATION FOR OUR SUCCESS IN ANIMAL HEALTH
16
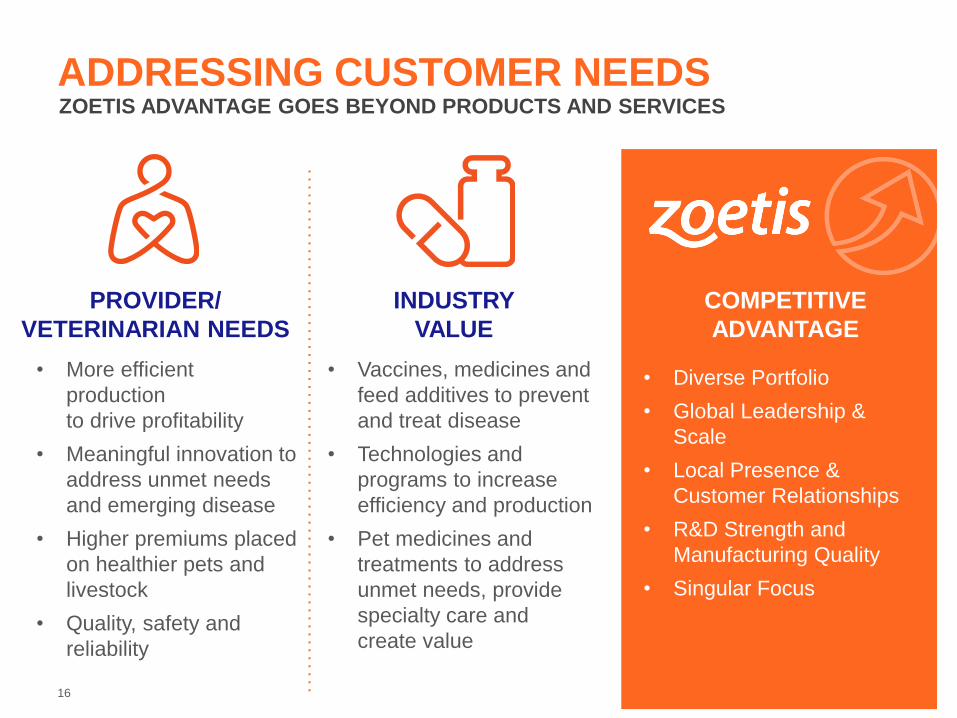
ADDRESSING CUSTOMER NEEDS ZOETIS ADVANTAGE GOES BEYOND PRODUCTS AND SERVICES
PROVIDER/
VETERINARIAN NEEDS
INDUSTRY
VALUE
• More efficient
production
to drive profitability
• Meaningful innovation to
address unmet needs
and emerging disease
• Higher premiums placed
on healthier pets and
livestock
• Quality, safety and
reliability
• Vaccines, medicines and
feed additives to prevent
and treat disease
• Technologies and
programs to increase
efficiency and production
• Pet medicines and
treatments to address
unmet needs, provide
specialty care and
create value
COMPETITIVE
ADVANTAGE
• Diverse Portfolio
• Global Leadership &
Scale
• Local Presence &
Customer Relationships
• R&D Strength and
Manufacturing Quality
• Singular Focus
17
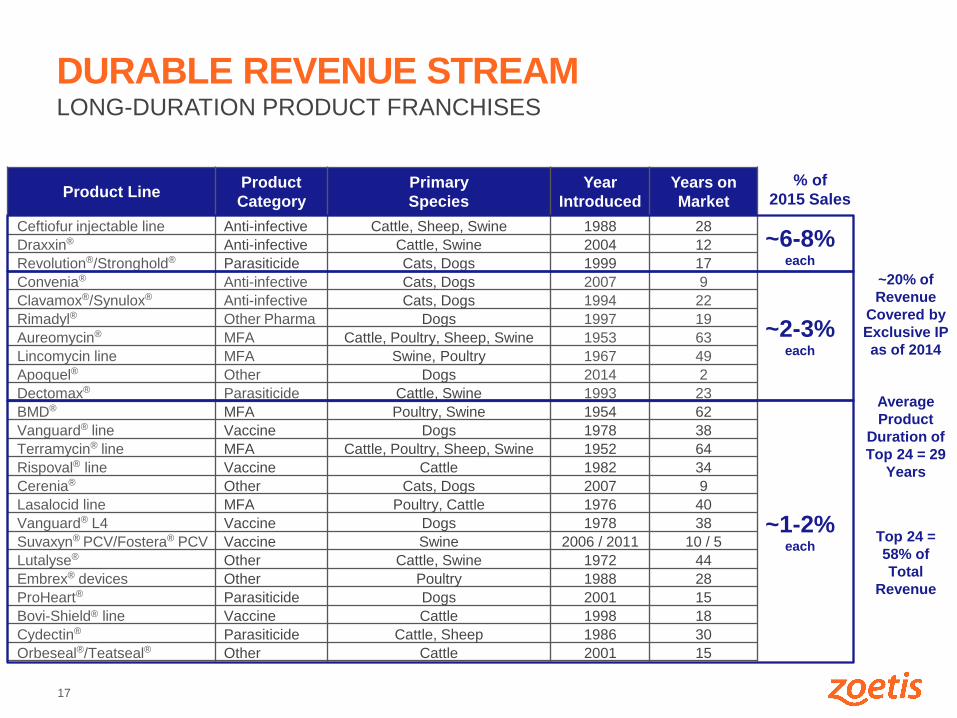
Product Line Product
Category
Primary
Species
Year
Introduced
Years on
Market
Ceftiofur injectable line Anti-infective Cattle, Sheep, Swine 1988 28
Draxxin® Anti-infective Cattle, Swine 2004 12
Revolution®/Stronghold® Parasiticide Cats, Dogs 1999 17
Convenia® Anti-infective Cats, Dogs 2007 9
Clavamox®/Synulox® Anti-infective Cats, Dogs 1994 22
Rimadyl® Other Pharma Dogs 1997 19
Aureomycin® MFA Cattle, Poultry, Sheep, Swine 1953 63
Lincomycin line MFA Swine, Poultry 1967 49
Apoquel® Other Dogs 2014 2
Dectomax® Parasiticide Cattle, Swine 1993 23
BMD® MFA Poultry, Swine 1954 62
Vanguard® line Vaccine Dogs 1978 38
Terramycin® line MFA Cattle, Poultry, Sheep, Swine 1952 64
Rispoval® line Vaccine Cattle 1982 34
Cerenia® Other Cats, Dogs 2007 9
Lasalocid line MFA Poultry, Cattle 1976 40
Vanguard® L4 Vaccine Dogs 1978 38
Suvaxyn® PCV/Fostera® PCV Vaccine Swine 2006 / 2011 10 / 5
Lutalyse® Other Cattle, Swine 1972 44
Embrex® devices Other Poultry 1988 28
ProHeart® Parasiticide Dogs 2001 15
Bovi-Shield® line Vaccine Cattle 1998 18
Cydectin® Parasiticide Cattle, Sheep 1986 30
Orbeseal®/Teatseal® Other Cattle 2001 15
~20% of
Revenue
Covered by
Exclusive IP
as of 2014
Average
Product
Duration of
Top 24 = 29
Years
DURABLE REVENUE STREAM LONG-DURATION PRODUCT FRANCHISES
% of
2015 Sales
~6-8% each
~2-3% each
~1-2% each
Top 24 =
58% of
Total
Revenue
18
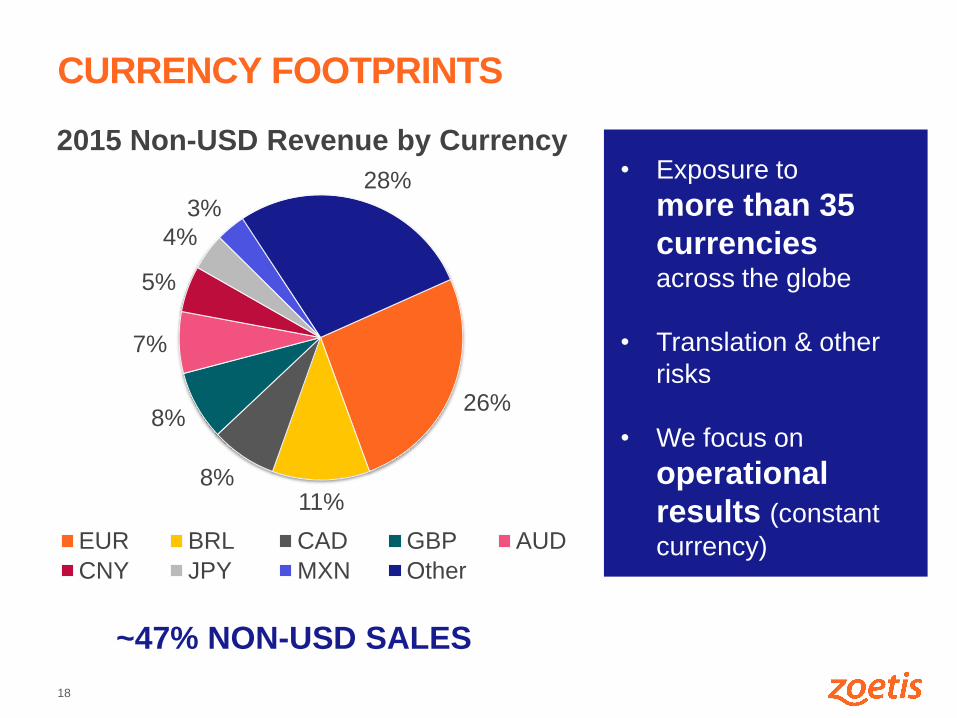
CURRENCY FOOTPRINTS
26%
11% 8%
8%
7%
5%
4%
3% 28%
EUR BRL CAD GBP AUD
CNY JPY MXN Other
~47% NON-USD SALES
• Exposure to
more than 35
currencies across the globe
• Translation & other
risks
• We focus on
operational
results (constant
currency)
2015 Non-USD Revenue by Currency
19
SECTION
DIVIDER
U.S. & INTERNATIONAL
SEGMENTS
20
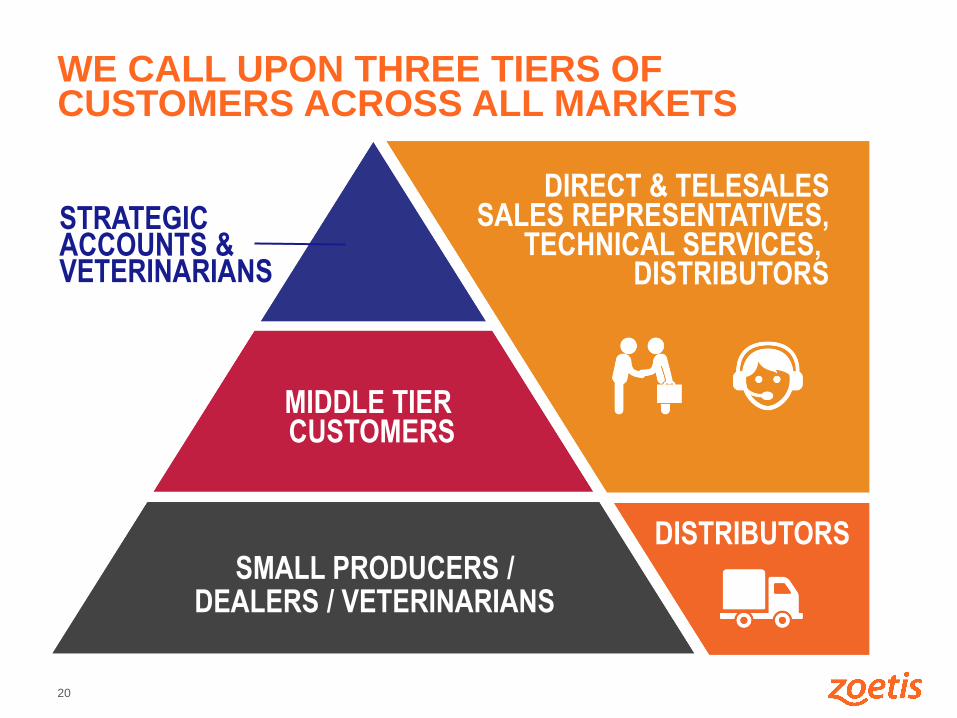
WE CALL UPON THREE TIERS OF CUSTOMERS ACROSS ALL MARKETS
DIRECT & TELESALES SALES REPRESENTATIVES,
TECHNICAL SERVICES, DISTRIBUTORS
DISTRIBUTORS
STRATEGIC ACCOUNTS & VETERINARIANS
MIDDLE TIER CUSTOMERS
SMALL PRODUCERS / DEALERS / VETERINARIANS
21
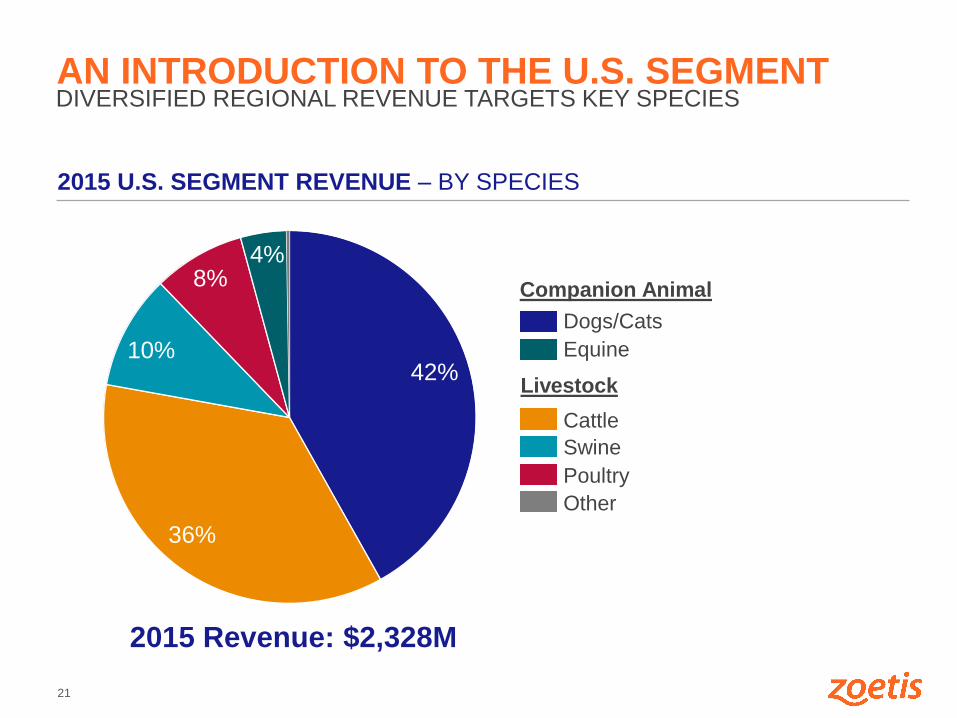
2015 U.S. SEGMENT REVENUE – BY SPECIES
42%
36%
10%
8% 4%
Other
Poultry
Swine
Cattle
Equine
Dogs/Cats
2015 Revenue: $2,328M
Livestock
Companion Animal
DIVERSIFIED REGIONAL REVENUE TARGETS KEY SPECIES AN INTRODUCTION TO THE U.S. SEGMENT
22
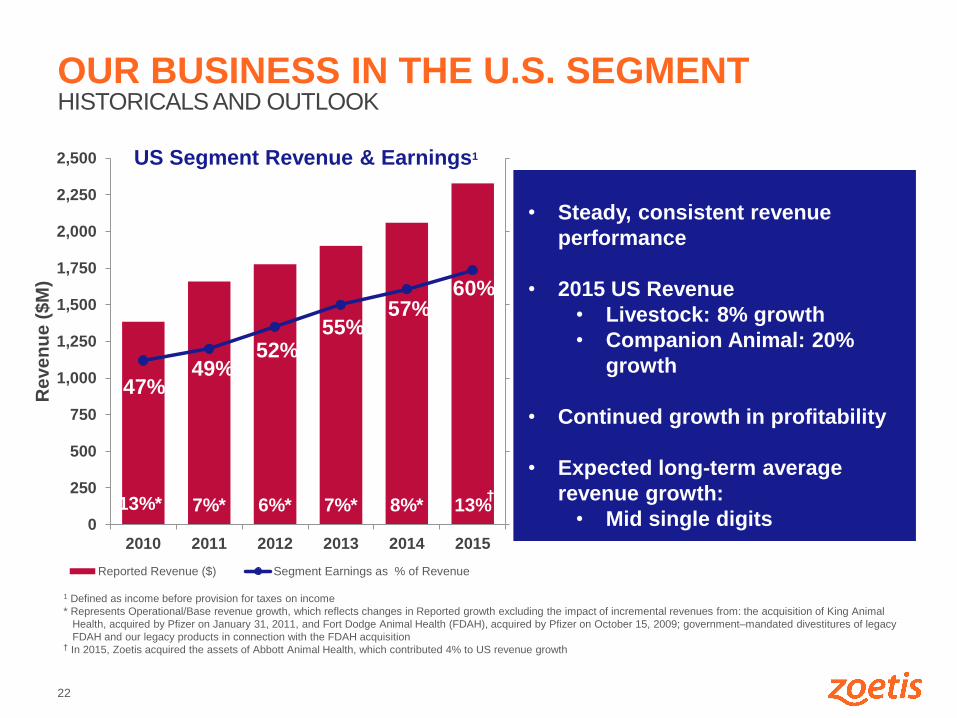
OUR BUSINESS IN THE U.S. SEGMENT HISTORICALS AND OUTLOOK
1 Defined as income before provision for taxes on income
* Represents Operational/Base revenue growth, which reflects changes in Reported growth excluding the impact of incremental revenues from: the acquisition of King Animal
Health, acquired by Pfizer on January 31, 2011, and Fort Dodge Animal Health (FDAH), acquired by Pfizer on October 15, 2009; government–mandated divestitures of legacy
FDAH and our legacy products in connection with the FDAH acquisition † In 2015, Zoetis acquired the assets of Abbott Animal Health, which contributed 4% to US revenue growth
• Steady, consistent revenue
performance
• 2015 US Revenue
• Livestock: 8% growth
• Companion Animal: 20%
growth
• Continued growth in profitability
• Expected long-term average
revenue growth:
• Mid single digits 13%* 7%* 6%* 7%* 8%* 13%
47% 49%
52% 55%
57% 60%
0
250
500
750
1,000
1,250
1,500
1,750
2,000
2,250
2,500
2010 2011 2012 2013 2014 2015
Re
ve
nu
e (
$M
)
US Segment Revenue & Earnings1
Reported Revenue ($) Segment Earnings as % of Revenue
†
23
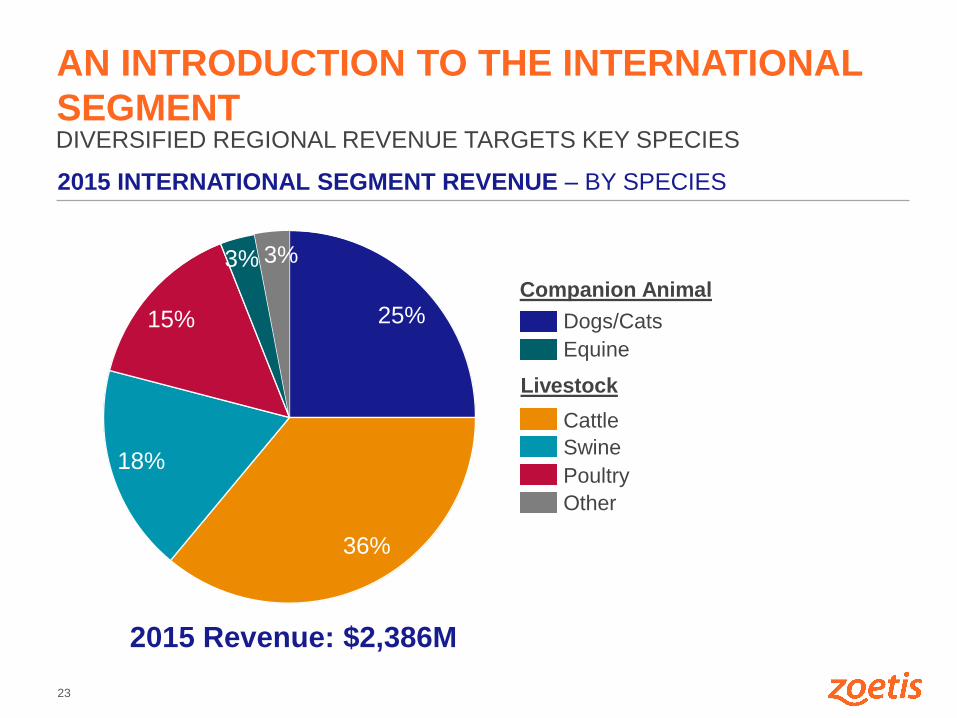
25%
36%
18%
15%
3% 3%
DIVERSIFIED REGIONAL REVENUE TARGETS KEY SPECIES
AN INTRODUCTION TO THE INTERNATIONAL
SEGMENT
2015 INTERNATIONAL SEGMENT REVENUE – BY SPECIES
Poultry
Swine
Cattle
Equine
Dogs/Cats
2015 Revenue: $2,386M
Livestock
Companion Animal
Other
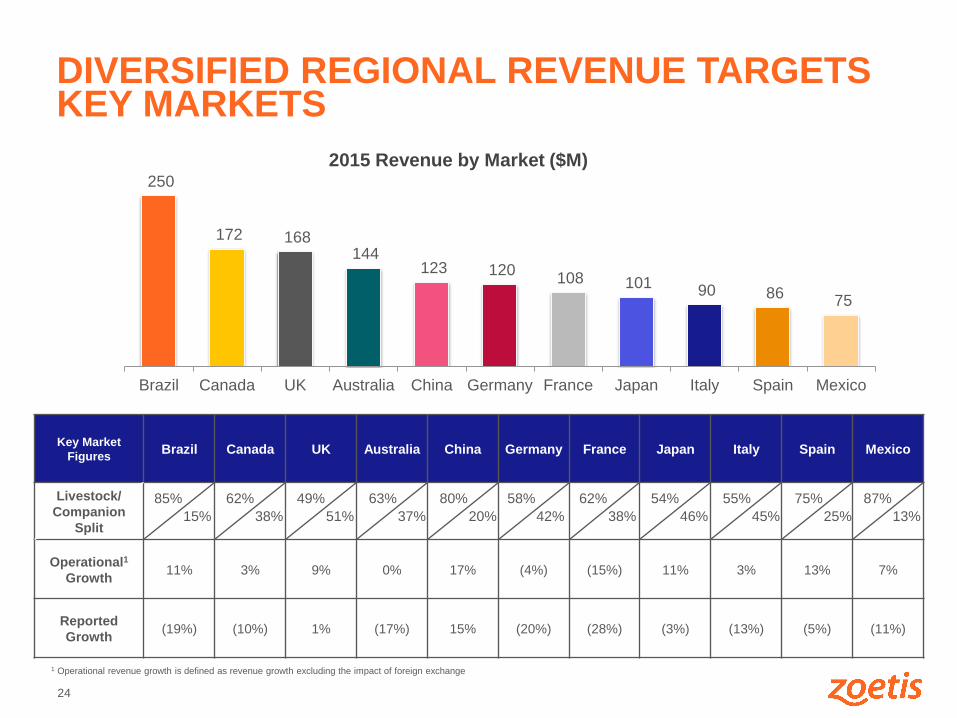
24
250
172 168 144
123 120 108 101 90 86
75
Brazil Canada UK Australia China Germany France Japan Italy Spain Mexico
Key Market
Figures Brazil Canada UK Australia China Germany France Japan Italy Spain Mexico
Livestock/
Companion
Split
Operational1
Growth 11% 3% 9% 0% 17% (4%) (15%) 11% 3% 13% 7%
Reported
Growth (19%) (10%) 1% (17%) 15% (20%) (28%) (3%) (13%) (5%) (11%)
2015 Revenue by Market ($M)
DIVERSIFIED REGIONAL REVENUE TARGETS KEY MARKETS
85%
15%
62%
38%
49%
51%
63%
37%
80%
20%
58%
42%
62%
38%
54%
46%
55%
45%
75%
25%
87%
13%
1 Operational revenue growth is defined as revenue growth excluding the impact of foreign exchange
25
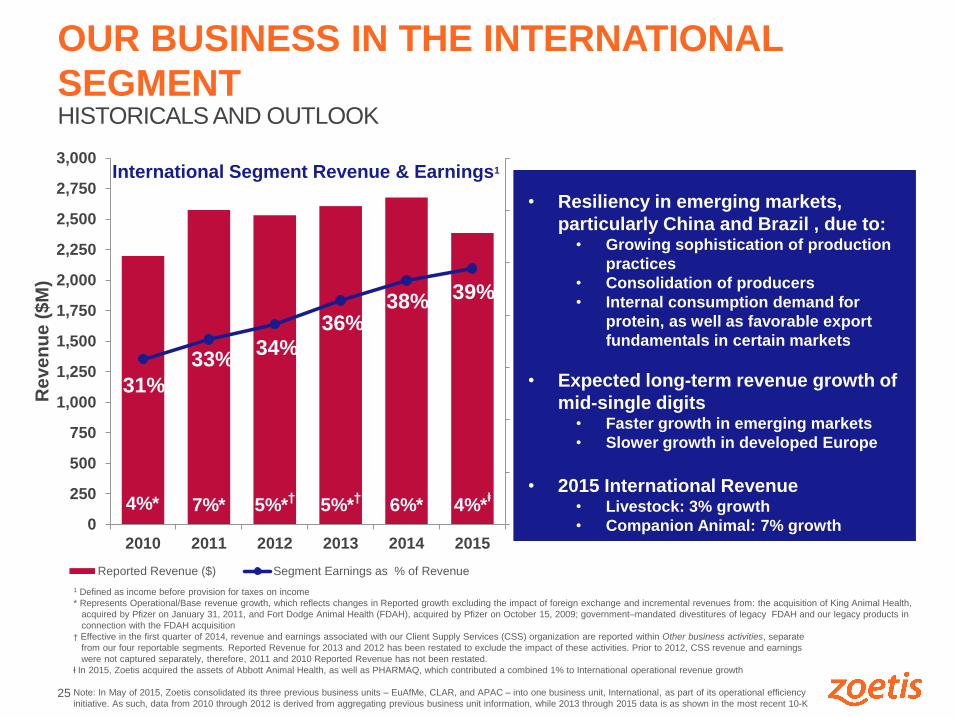
OUR BUSINESS IN THE INTERNATIONAL
SEGMENT HISTORICALS AND OUTLOOK
1 Defined as income before provision for taxes on income
* Represents Operational/Base revenue growth, which reflects changes in Reported growth excluding the impact of foreign exchange and incremental revenues from: the acquisition of King Animal Health,
acquired by Pfizer on January 31, 2011, and Fort Dodge Animal Health (FDAH), acquired by Pfizer on October 15, 2009; government–mandated divestitures of legacy FDAH and our legacy products in
connection with the FDAH acquisition
† Effective in the first quarter of 2014, revenue and earnings associated with our Client Supply Services (CSS) organization are reported within Other business activities, separate
from our four reportable segments. Reported Revenue for 2013 and 2012 has been restated to exclude the impact of these activities. Prior to 2012, CSS revenue and earnings
were not captured separately, therefore, 2011 and 2010 Reported Revenue has not been restated.
ⱡ In 2015, Zoetis acquired the assets of Abbott Animal Health, as well as PHARMAQ, which contributed a combined 1% to International operational revenue growth
Note: In May of 2015, Zoetis consolidated its three previous business units – EuAfMe, CLAR, and APAC – into one business unit, International, as part of its operational efficiency
initiative. As such, data from 2010 through 2012 is derived from aggregating previous business unit information, while 2013 through 2015 data is as shown in the most recent 10-K
• Resiliency in emerging markets,
particularly China and Brazil , due to: • Growing sophistication of production
practices
• Consolidation of producers
• Internal consumption demand for
protein, as well as favorable export
fundamentals in certain markets
• Expected long-term revenue growth of
mid-single digits • Faster growth in emerging markets
• Slower growth in developed Europe
• 2015 International Revenue • Livestock: 3% growth
• Companion Animal: 7% growth
† 4%* 7%* 5%*
† 5%*
† 6%* 4%*
ⱡ
31%
33% 34%
36% 38% 39%
0
250
500
750
1,000
1,250
1,500
1,750
2,000
2,250
2,500
2,750
3,000
2010 2011 2012 2013 2014 2015
Re
ve
nu
e (
$M
)
International Segment Revenue & Earnings1
Reported Revenue ($) Segment Earnings as % of Revenue

26
RESEARCH &
DEVELOPMENT
27
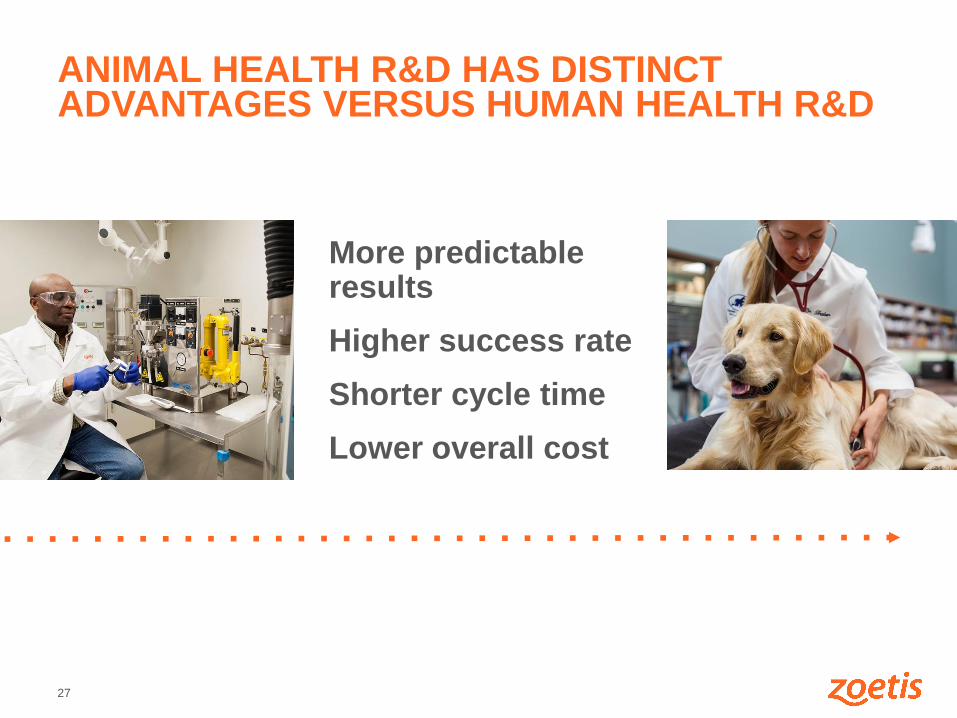
ANIMAL HEALTH R&D HAS DISTINCT ADVANTAGES VERSUS HUMAN HEALTH R&D
More predictable results Higher success rate Shorter cycle time Lower overall cost
28
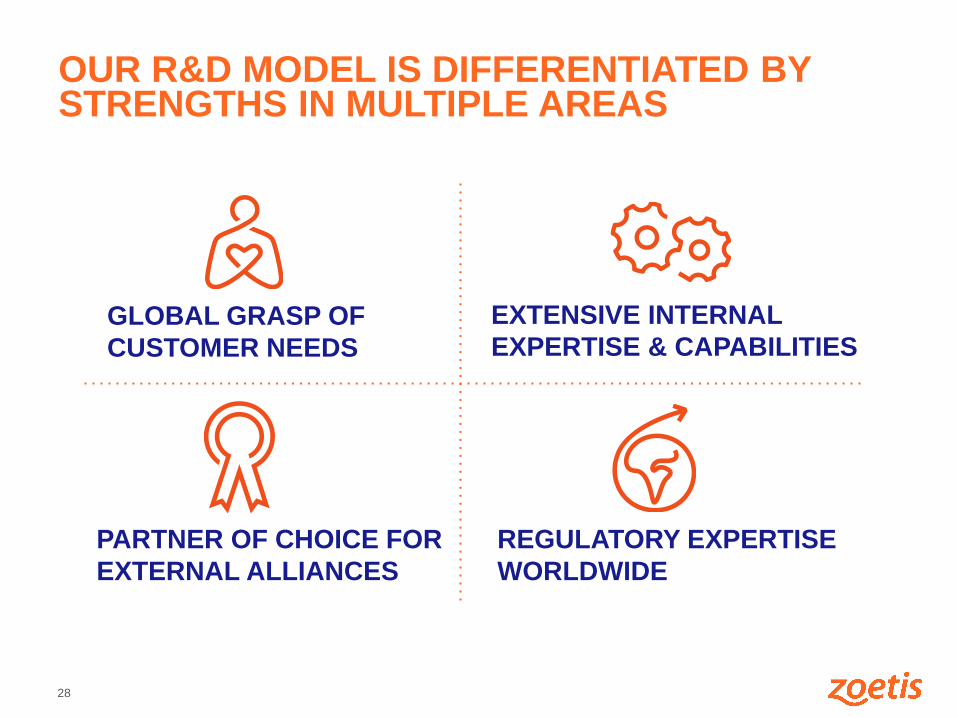
OUR R&D MODEL IS DIFFERENTIATED BY STRENGTHS IN MULTIPLE AREAS
EXTENSIVE INTERNAL
EXPERTISE & CAPABILITIES GLOBAL GRASP OF
CUSTOMER NEEDS
REGULATORY EXPERTISE
WORLDWIDE
PARTNER OF CHOICE FOR
EXTERNAL ALLIANCES
29
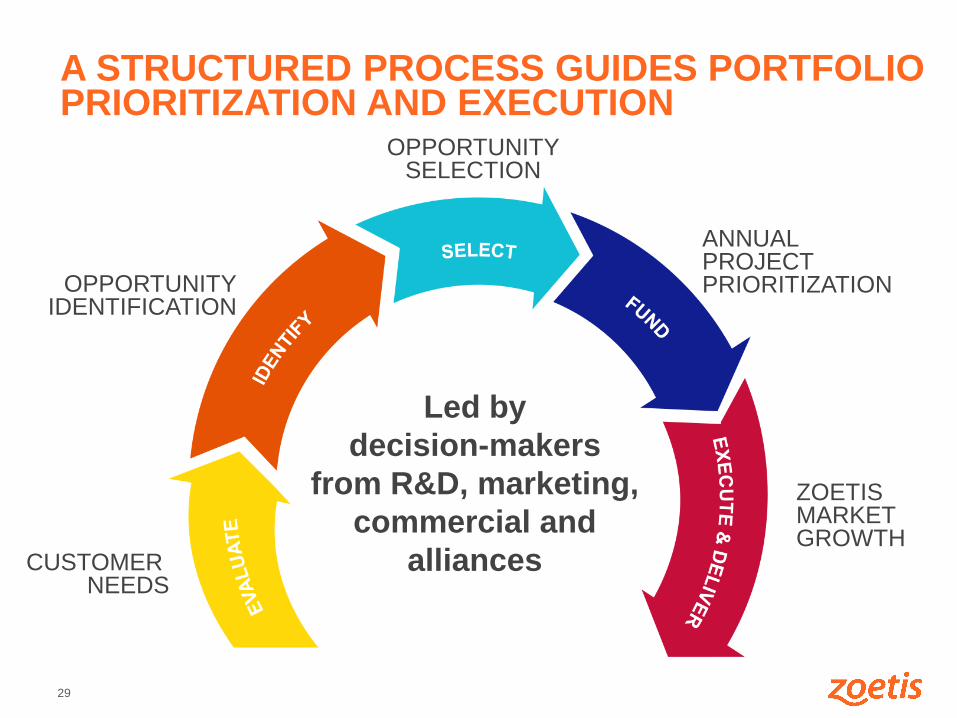
A STRUCTURED PROCESS GUIDES PORTFOLIO PRIORITIZATION AND EXECUTION
Led by
decision-makers
from R&D, marketing,
commercial and
alliances CUSTOMER NEEDS
OPPORTUNITY IDENTIFICATION
OPPORTUNITY SELECTION
ANNUAL PROJECT PRIORITIZATION
ZOETIS MARKET GROWTH
30
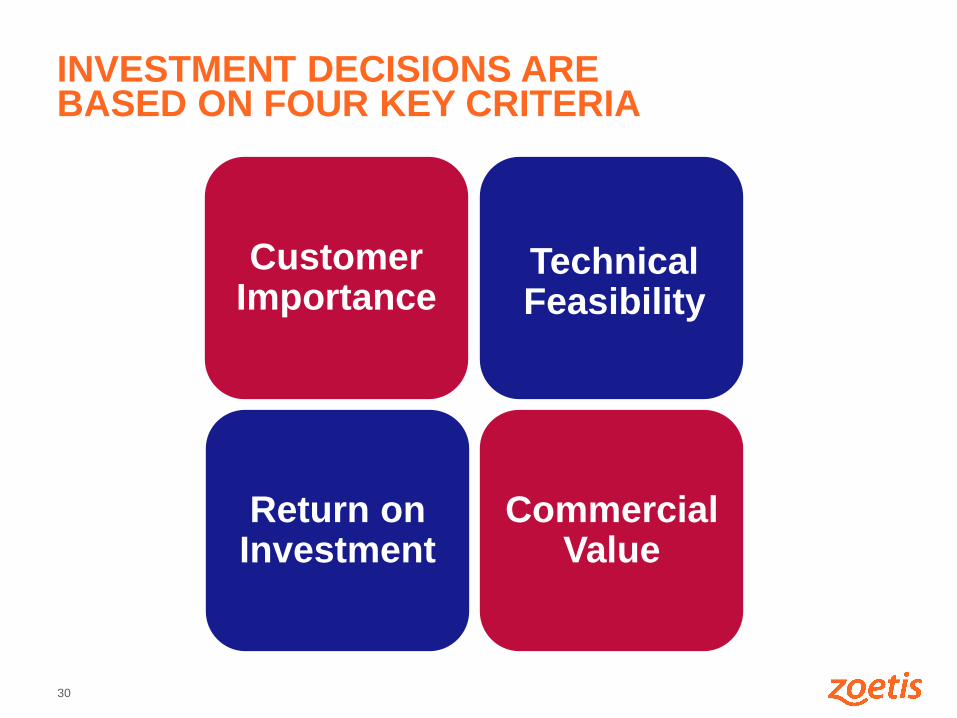
INVESTMENT DECISIONS ARE BASED ON FOUR KEY CRITERIA
Customer Importance
Technical Feasibility
Return on Investment
Commercial Value
31
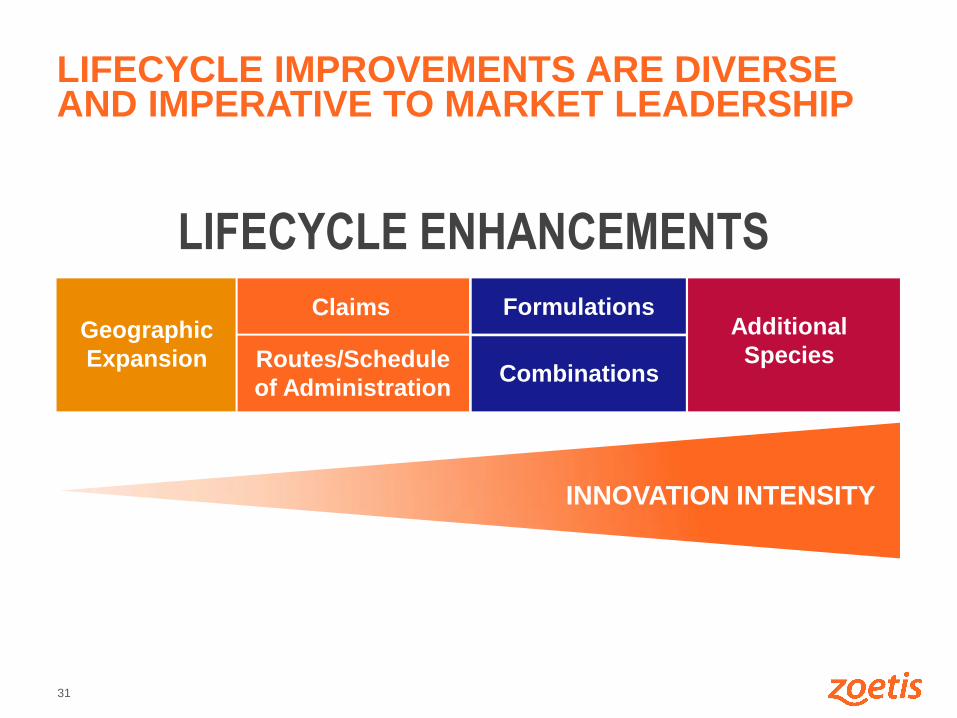
LIFECYCLE IMPROVEMENTS ARE DIVERSE AND IMPERATIVE TO MARKET LEADERSHIP
Geographic
Expansion
Claims
Routes/Schedule
of Administration
LIFECYCLE ENHANCEMENTS
Formulations
Combinations
Additional
Species
INNOVATION INTENSITY
32
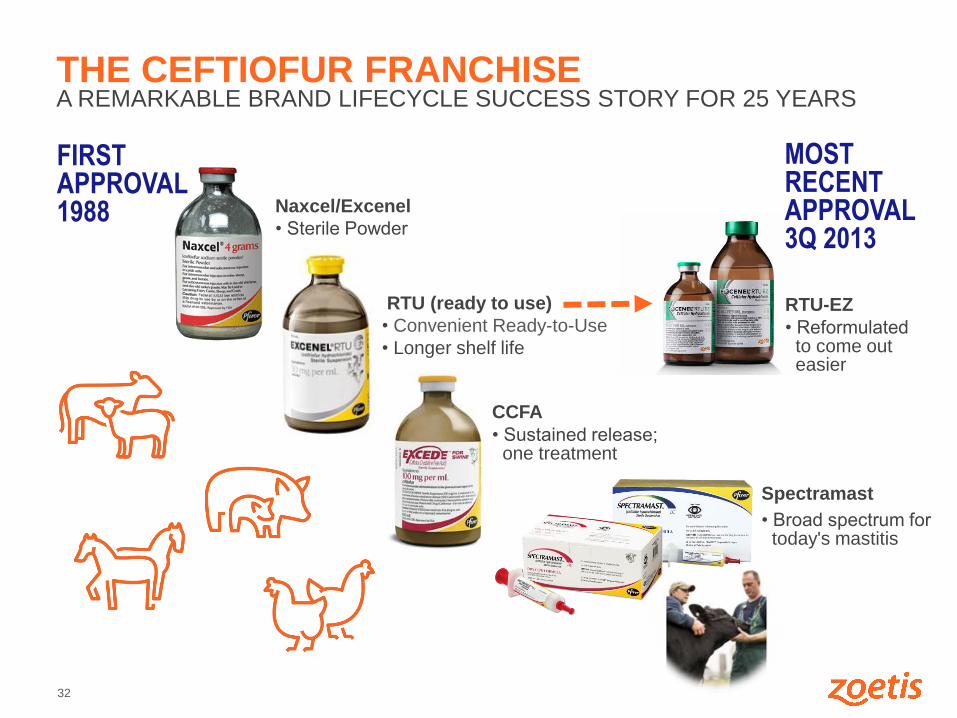
THE CEFTIOFUR FRANCHISE A REMARKABLE BRAND LIFECYCLE SUCCESS STORY FOR 25 YEARS
MOST RECENT APPROVAL 3Q 2013
FIRST APPROVAL 1988 Naxcel/Excenel
• Sterile Powder
RTU (ready to use)
• Convenient Ready-to-Use
• Longer shelf life
Spectramast
• Broad spectrum for today's mastitis
RTU-EZ
• Reformulated to come out easier
CCFA
• Sustained release; one treatment
33
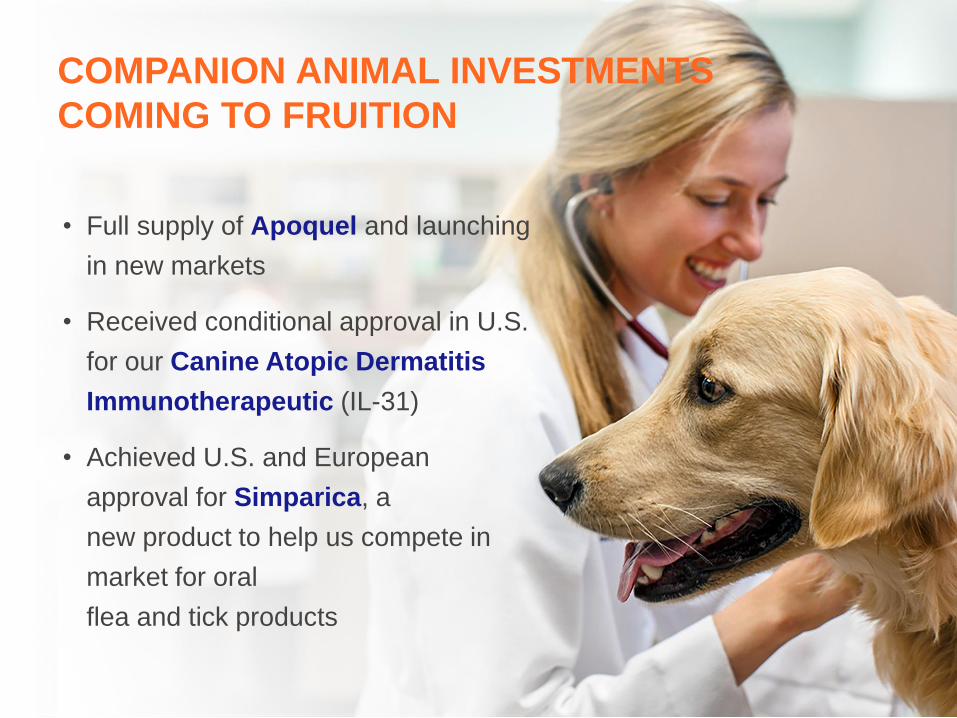
COMPANION ANIMAL INVESTMENTS
COMING TO FRUITION
• Full supply of Apoquel and launching
in new markets
• Received conditional approval in U.S.
for our Canine Atopic Dermatitis
Immunotherapeutic (IL-31)
• Achieved U.S. and European
approval for Simparica, a
new product to help us compete in
market for oral
flea and tick products
34
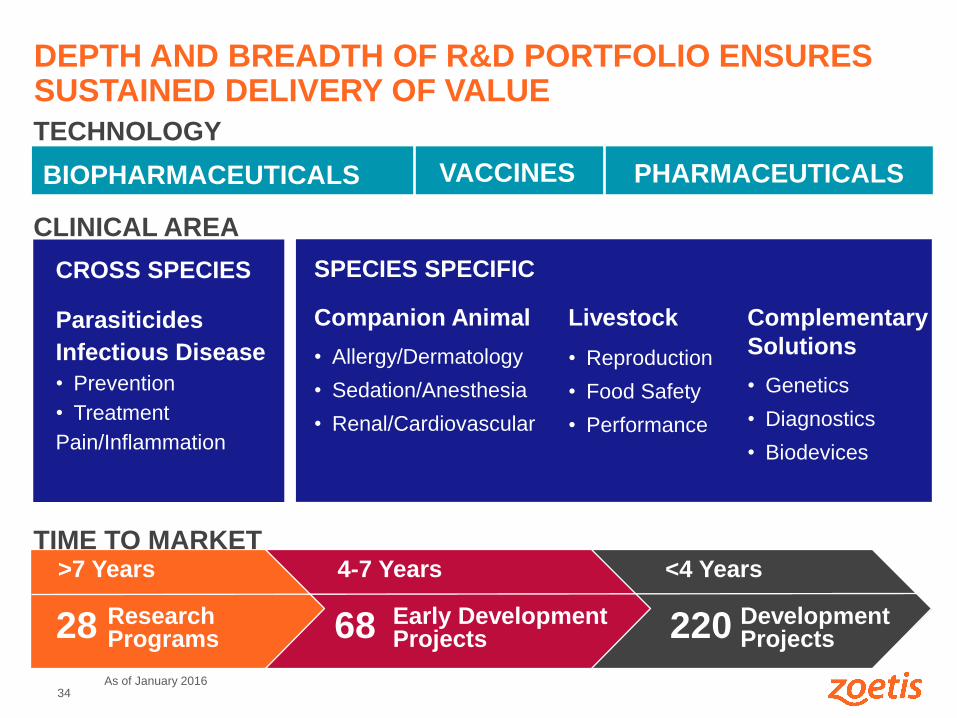
CROSS SPECIES
Parasiticides
Infectious Disease
• Prevention
• Treatment
Pain/Inflammation
DEPTH AND BREADTH OF R&D PORTFOLIO ENSURES SUSTAINED DELIVERY OF VALUE
Companion Animal
• Allergy/Dermatology
• Sedation/Anesthesia
• Renal/Cardiovascular
Livestock
• Reproduction
• Food Safety
• Performance
Complementary
Solutions
• Genetics
• Diagnostics
• Biodevices
SPECIES SPECIFIC
68
TIME TO MARKET >7 Years 4-7 Years <4 Years
28 220 Research Programs
Early Development Projects
Development Projects
As of January 2016
BIOPHARMACEUTICALS PHARMACEUTICALS VACCINES
TECHNOLOGY
CLINICAL AREA
35
FINANCIAL
OVERVIEW
36
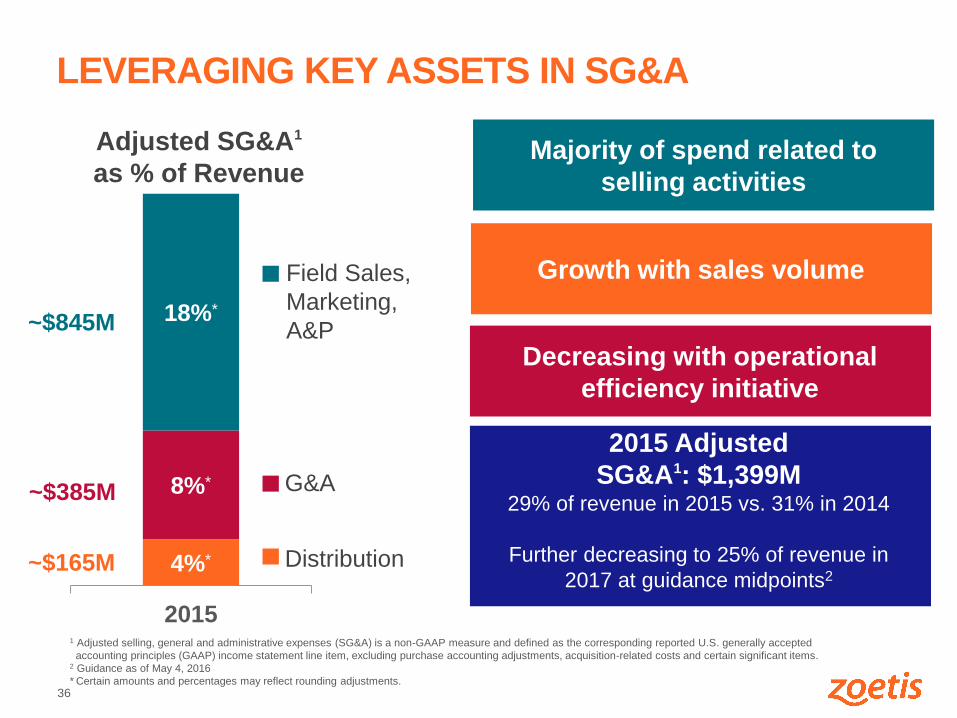
4%*
8%*
18%*
2015
Field Sales,
Marketing,
A&P
G&A
Distribution
Majority of spend related to
selling activities
LEVERAGING KEY ASSETS IN SG&A
Adjusted SG&A1
as % of Revenue
Growth with sales volume
2015 Adjusted
SG&A1: $1,399M 29% of revenue in 2015 vs. 31% in 2014
Further decreasing to 25% of revenue in
2017 at guidance midpoints2
~$845M
~$385M
~$165M
1 Adjusted selling, general and administrative expenses (SG&A) is a non-GAAP measure and defined as the corresponding reported U.S. generally accepted
accounting principles (GAAP) income statement line item, excluding purchase accounting adjustments, acquisition-related costs and certain significant items. 2 Guidance as of May 4, 2016
* Certain amounts and percentages may reflect rounding adjustments.
Decreasing with operational
efficiency initiative
37
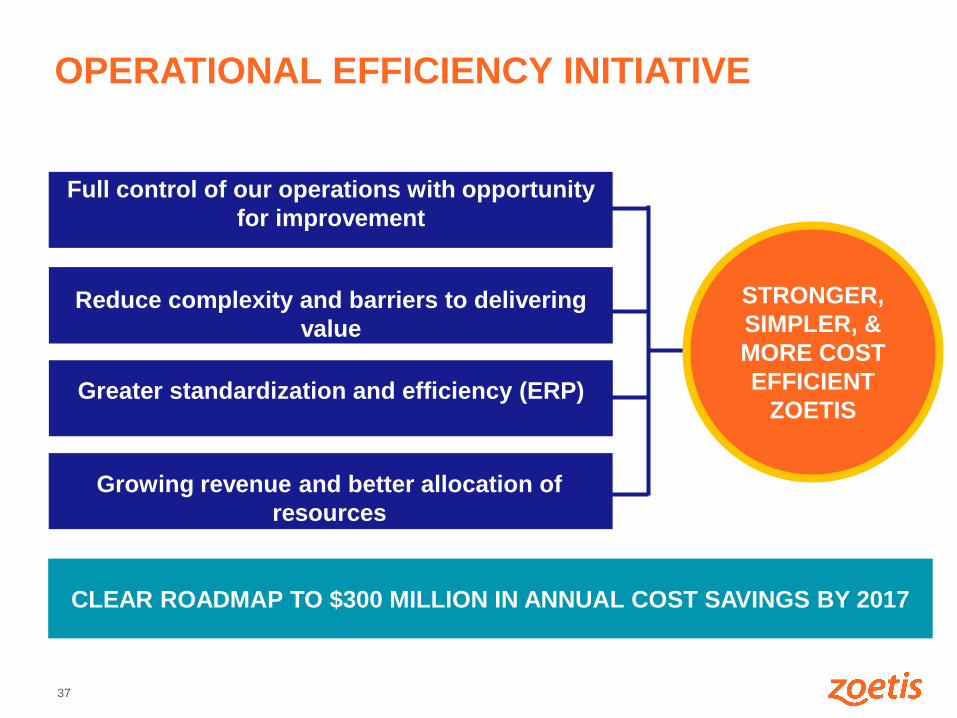
OPERATIONAL EFFICIENCY INITIATIVE
Full control of our operations with opportunity
for improvement
Reduce complexity and barriers to delivering
value
Greater standardization and efficiency (ERP)
Growing revenue and better allocation of
resources
CLEAR ROADMAP TO $300 MILLION IN ANNUAL COST SAVINGS BY 2017
STRONGER,
SIMPLER, &
MORE COST
EFFICIENT
ZOETIS
38
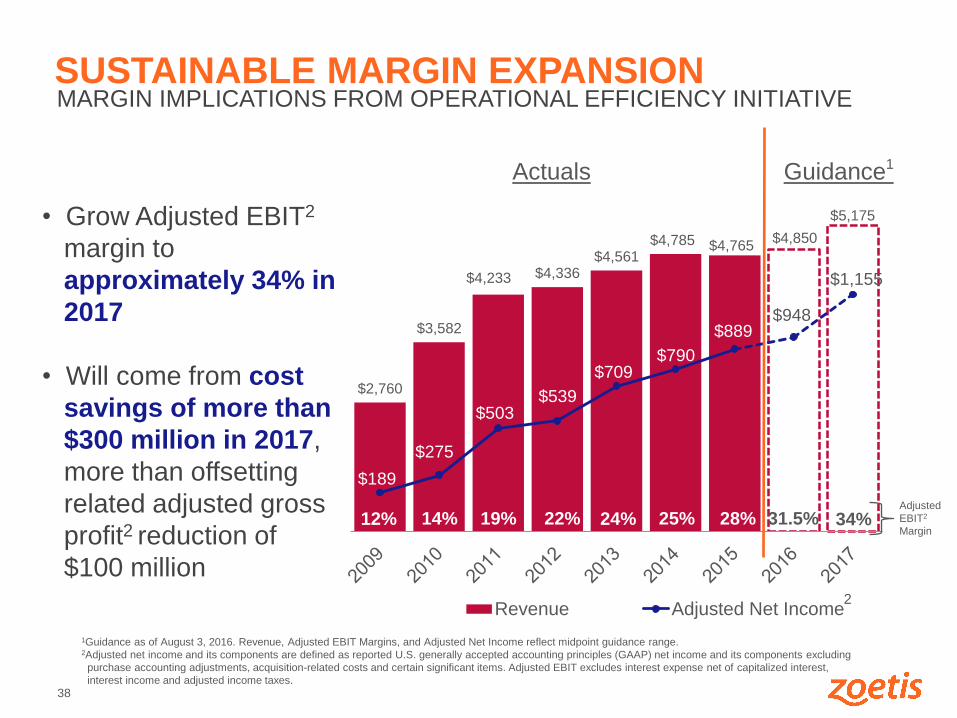
SUSTAINABLE MARGIN EXPANSION MARGIN IMPLICATIONS FROM OPERATIONAL EFFICIENCY INITIATIVE
$2,760
$3,582
$4,233 $4,336 $4,561
$4,785 $4,765 $4,850
$5,175
$189
$275
$503 $539
$709 $790
$889 $948
$1,155
Revenue Adjusted Net Income
Actuals Guidance1
• Grow Adjusted EBIT2
margin to
approximately 34% in
2017
• Will come from cost
savings of more than
$300 million in 2017,
more than offsetting
related adjusted gross
profit2 reduction of
$100 million
1Guidance as of August 3, 2016. Revenue, Adjusted EBIT Margins, and Adjusted Net Income reflect midpoint guidance range. 2Adjusted net income and its components are defined as reported U.S. generally accepted accounting principles (GAAP) net income and its components excluding
purchase accounting adjustments, acquisition-related costs and certain significant items. Adjusted EBIT excludes interest expense net of capitalized interest,
interest income and adjusted income taxes.
2
22% 24% 25% 28% 31.5% 34% Adjusted
EBIT2
Margin 19% 14% 12%
39
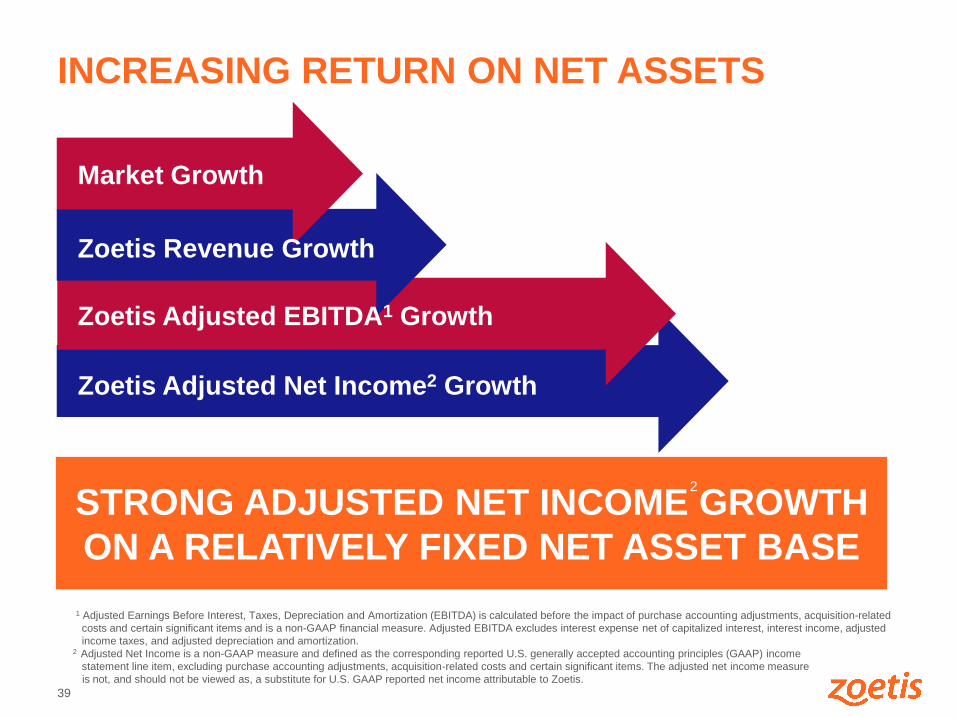
INCREASING RETURN ON NET ASSETS
STRONG ADJUSTED NET INCOME GROWTH
ON A RELATIVELY FIXED NET ASSET BASE
Zoetis Adjusted Net Income2 Growth
Zoetis Revenue Growth
Market Growth
Zoetis Adjusted EBITDA1 Growth
1 Adjusted Earnings Before Interest, Taxes, Depreciation and Amortization (EBITDA) is calculated before the impact of purchase accounting adjustments, acquisition-related
costs and certain significant items and is a non-GAAP financial measure. Adjusted EBITDA excludes interest expense net of capitalized interest, interest income, adjusted
income taxes, and adjusted depreciation and amortization. 2 Adjusted Net Income is a non-GAAP measure and defined as the corresponding reported U.S. generally accepted accounting principles (GAAP) income
statement line item, excluding purchase accounting adjustments, acquisition-related costs and certain significant items. The adjusted net income measure
is not, and should not be viewed as, a substitute for U.S. GAAP reported net income attributable to Zoetis.
2
40
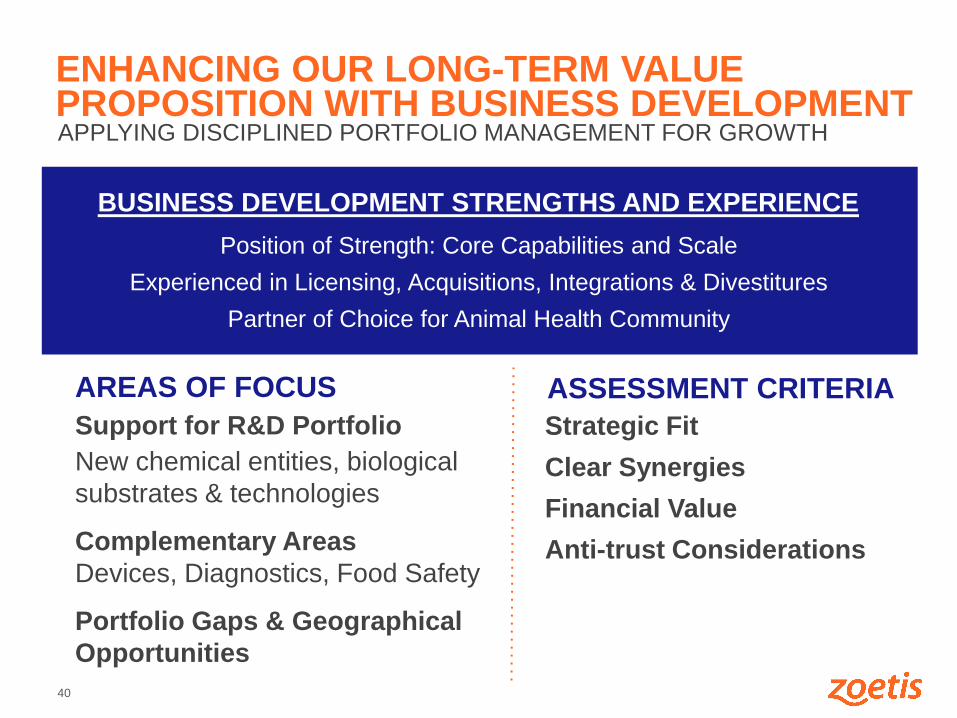
ENHANCING OUR LONG-TERM VALUE PROPOSITION WITH BUSINESS DEVELOPMENT APPLYING DISCIPLINED PORTFOLIO MANAGEMENT FOR GROWTH
AREAS OF FOCUS
Support for R&D Portfolio
New chemical entities, biological
substrates & technologies
Complementary Areas
Devices, Diagnostics, Food Safety
Portfolio Gaps & Geographical
Opportunities
ASSESSMENT CRITERIA
Strategic Fit
Clear Synergies
Financial Value
Anti-trust Considerations
Position of Strength: Core Capabilities and Scale
Experienced in Licensing, Acquisitions, Integrations & Divestitures
Partner of Choice for Animal Health Community
BUSINESS DEVELOPMENT STRENGTHS AND EXPERIENCE
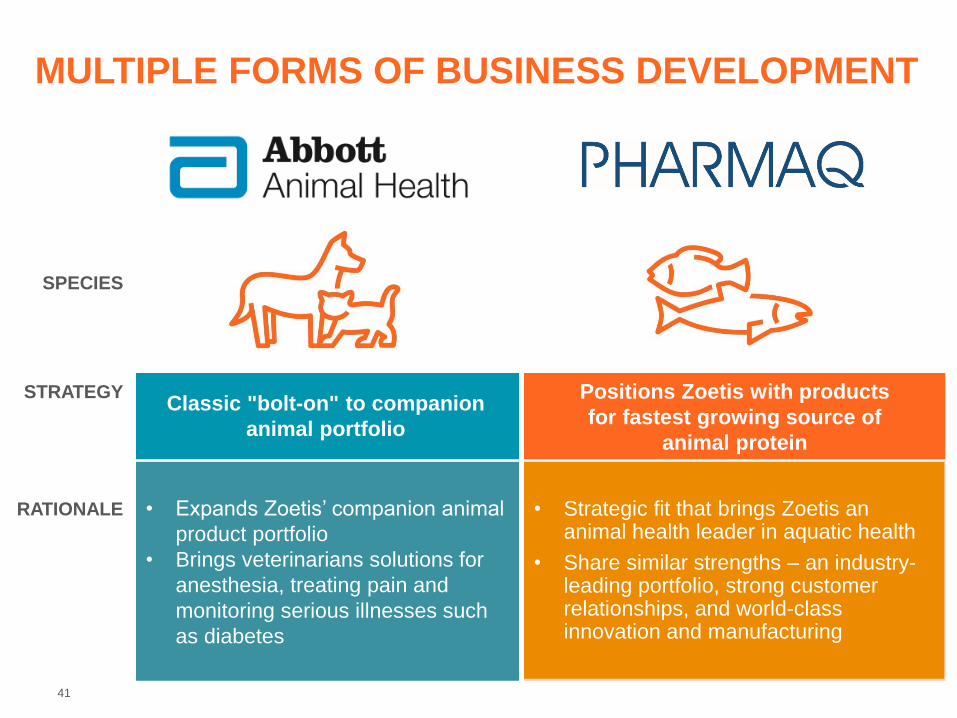
41
Positions Zoetis with products
for fastest growing source of
animal protein
• Expands Zoetis’ companion animal
product portfolio
• Brings veterinarians solutions for
anesthesia, treating pain and
monitoring serious illnesses such
as diabetes
MULTIPLE FORMS OF BUSINESS DEVELOPMENT
SPECIES
STRATEGY
RATIONALE
Classic "bolt-on" to companion
animal portfolio
• Strategic fit that brings Zoetis an animal health leader in aquatic health
• Share similar strengths – an industry-leading portfolio, strong customer relationships, and world-class innovation and manufacturing
42
PHARMAQ TRANSACTION OVERVIEW
2014 Sales $76M
• On November 2, 2015 Zoetis announced an agreement to acquire PHARMAQ from the
UK-based private equity investment firm Permira, for a purchase price of $765 million in
cash
• The transaction is expected to close in Q4 2015 with no antitrust hurdles expected or
shareholder vote required
• Privately held and headquartered in Norway, PHARMAQ is recognized as the
world's leading pharmaceutical company specializing in aquatic health
• Established in 2004 as an independent company based on more than 25 years of
R&D in aquatic health
• PHARMAQ develops, manufactures and markets vaccines and therapeutic products
for farmed fish within key markets of Norway, Chile and the UK
– Strong market share in high-growth markets
– Market leaders in all key Salmon markets
• Headquartered in Overhalla, Norway; employs 200 (including 60 in R&D)
43
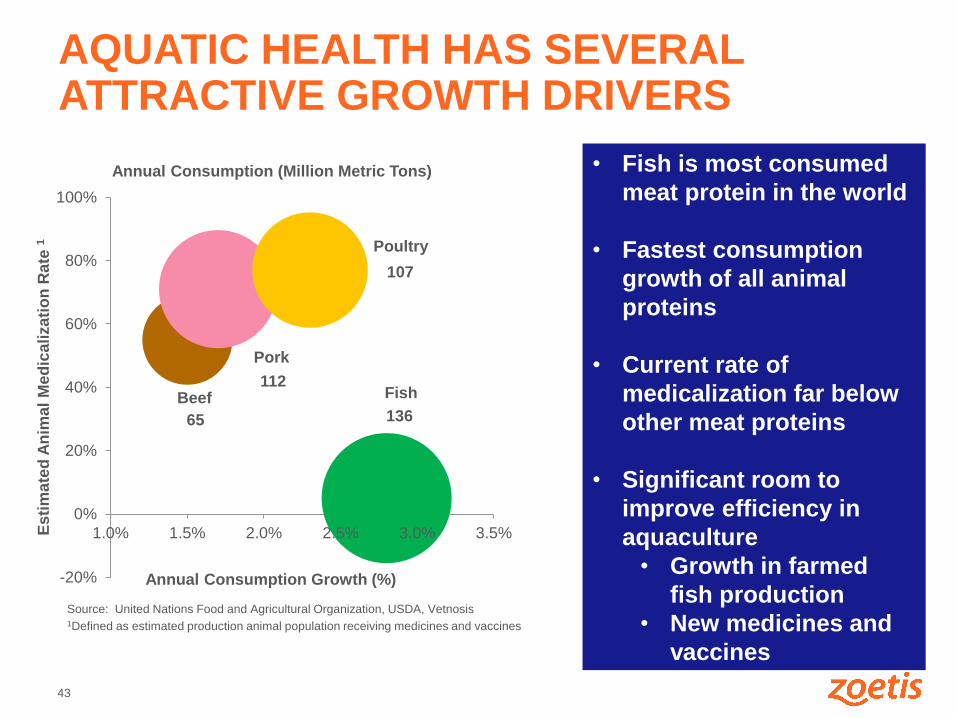
136 65
112
107
-20%
0%
20%
40%
60%
80%
100%
1.0% 1.5% 2.0% 2.5% 3.0% 3.5%Es
tim
ate
d A
nim
al
Me
dic
ali
za
tio
n R
ate
1
Annual Consumption Growth (%)
Annual Consumption (Million Metric Tons)
Beef
Poultry
Pork
Fish
• Fish is most consumed
meat protein in the world
• Fastest consumption
growth of all animal
proteins
• Current rate of
medicalization far below
other meat proteins
• Significant room to
improve efficiency in
aquaculture
• Growth in farmed
fish production
• New medicines and
vaccines
Source: United Nations Food and Agricultural Organization, USDA, Vetnosis 1Defined as estimated production animal population receiving medicines and vaccines
AQUATIC HEALTH HAS SEVERAL ATTRACTIVE GROWTH DRIVERS
44
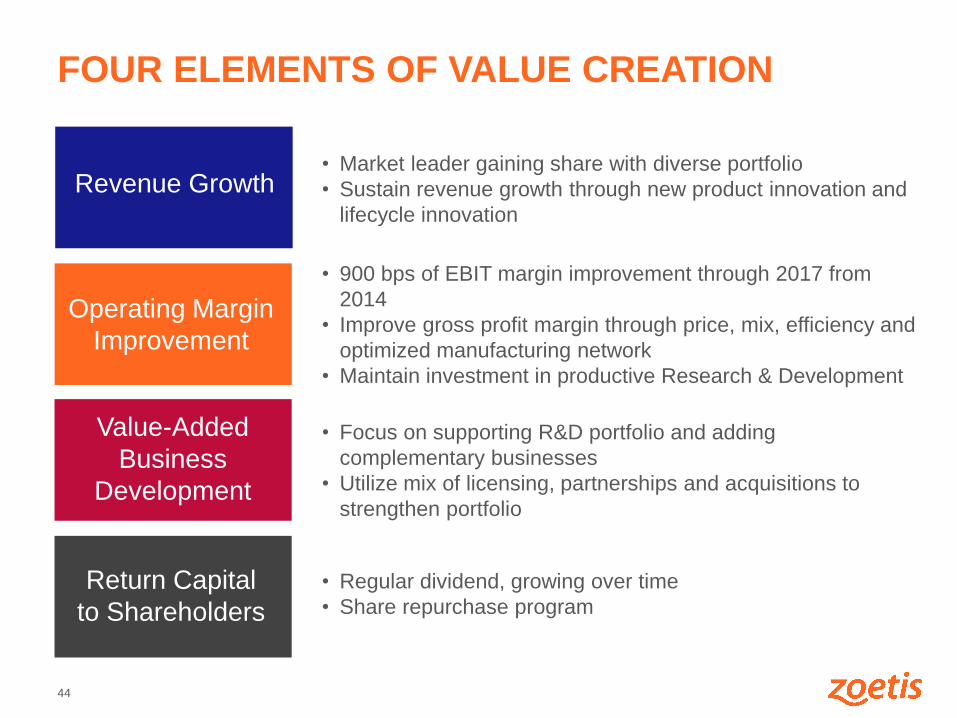
FOUR ELEMENTS OF VALUE CREATION
Revenue Growth
Operating Margin
Improvement
Value-Added
Business
Development
Return Capital
to Shareholders
• Market leader gaining share with diverse portfolio
• Sustain revenue growth through new product innovation and
lifecycle innovation
• 900 bps of EBIT margin improvement through 2017 from
2014
• Improve gross profit margin through price, mix, efficiency and
optimized manufacturing network
• Maintain investment in productive Research & Development
• Regular dividend, growing over time
• Share repurchase program
• Focus on supporting R&D portfolio and adding
complementary businesses
• Utilize mix of licensing, partnerships and acquisitions to
strengthen portfolio
45
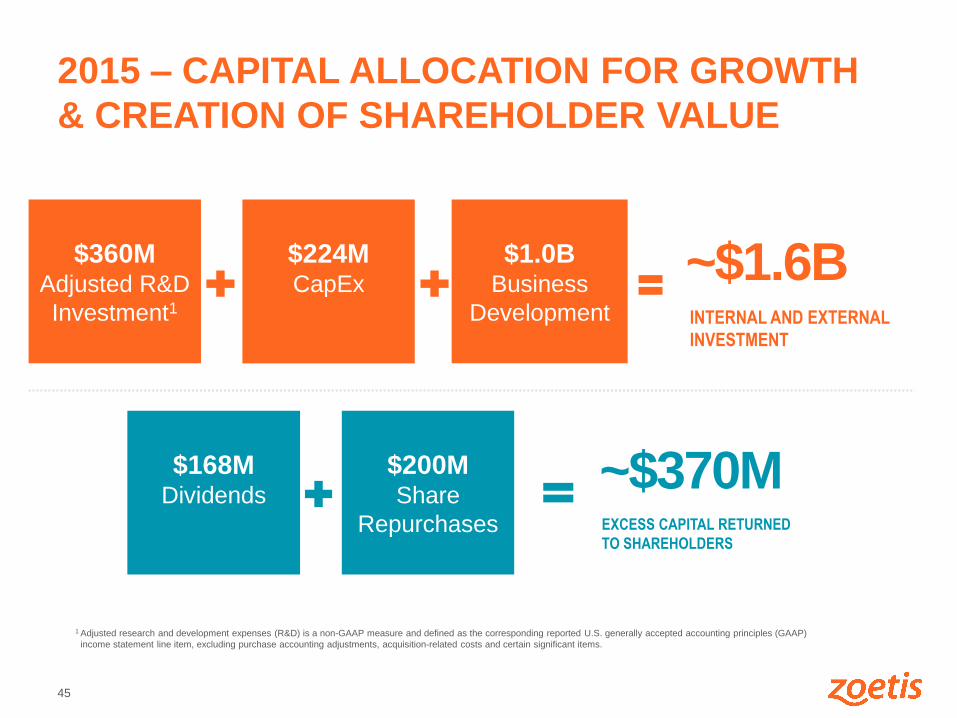
1 Adjusted research and development expenses (R&D) is a non-GAAP measure and defined as the corresponding reported U.S. generally accepted accounting principles (GAAP)
income statement line item, excluding purchase accounting adjustments, acquisition-related costs and certain significant items.
2015 – CAPITAL ALLOCATION FOR GROWTH
& CREATION OF SHAREHOLDER VALUE
$360M
Adjusted R&D
Investment1
$224M CapEx
$1.0B
Business
Development
~$1.6B INTERNAL AND EXTERNAL
INVESTMENT
$168M
Dividends
$200M
Share
Repurchases
~$370M EXCESS CAPITAL RETURNED
TO SHAREHOLDERS
APPENDIX
47 |
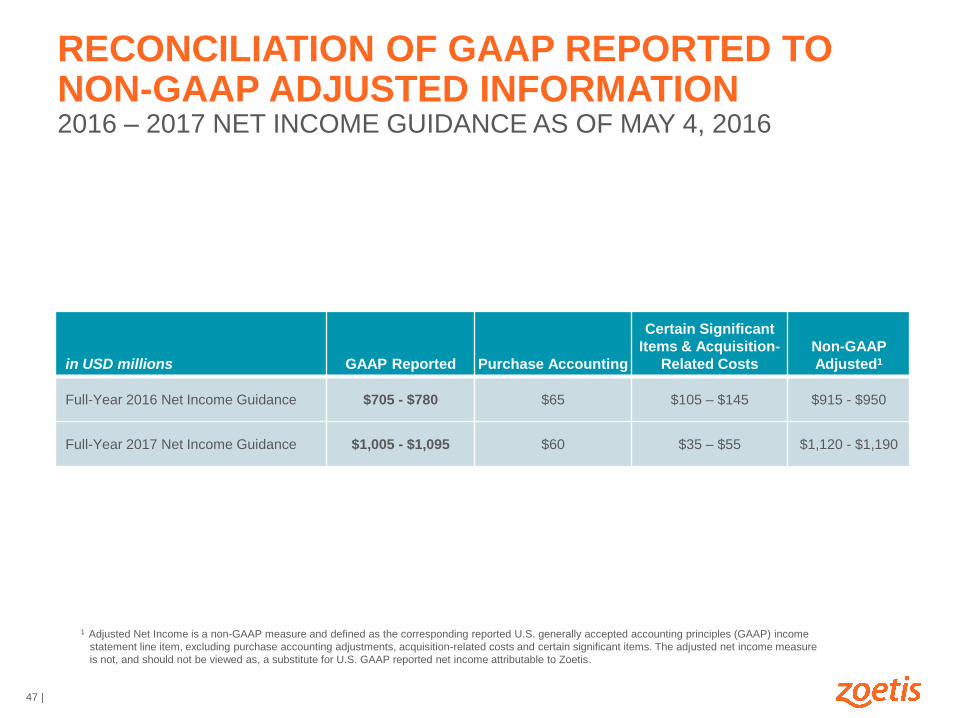
RECONCILIATION OF GAAP REPORTED TO NON-GAAP ADJUSTED INFORMATION 2016 – 2017 NET INCOME GUIDANCE AS OF MAY 4, 2016
in USD millions GAAP Reported Purchase Accounting
Certain Significant
Items & Acquisition-
Related Costs
Non-GAAP
Adjusted1
Full-Year 2016 Net Income Guidance $705 - $780 $65 $105 – $145 $915 - $950
Full-Year 2017 Net Income Guidance $1,005 - $1,095 $60 $35 – $55 $1,120 - $1,190
1 Adjusted Net Income is a non-GAAP measure and defined as the corresponding reported U.S. generally accepted accounting principles (GAAP) income
statement line item, excluding purchase accounting adjustments, acquisition-related costs and certain significant items. The adjusted net income measure
is not, and should not be viewed as, a substitute for U.S. GAAP reported net income attributable to Zoetis.

48 |
RECONCILIATION OF GAAP REPORTED TO NON-GAAP ADJUSTED INFORMATION 2015
in USD millions
GAAP
Reported
Purchase
Accounting
Acquisition
related costs
Certain
Significant
Items
Non-GAAP
Adjusted
Revenue $4,765 $0 $0 $0 $4,765
Cost of Sales 1,738 (9) 0 (62) 1,667
Gross Profit 3,027 9 0 62 3,098
Gross Profit as % of Revenue 63.5% 65.0%
Selling, general and administrative expenses 1,532 0 0 (133) 1,399
Research & Development Expenses 364 (2) 0 (2) 360
Amortization of intangible assets 61 (46) 0 0 15
Total Operating Expenses 1,957 (48) 0 (135) 1,774
Total Operating Expenses as % of Revenue 41.1% 37.2%
Restructuring charges and certain acquisition related costs 320 0 (19) (301) 0
Other (Income) / Expenses 81 0 (2) (94) (15)
Income/(loss) before Interest and Taxes 669 57 21 592 1,339
Interest Expense 124 0 0 0 124
Income before provision for taxes on income 545 57 21 592 1,215
Provision for taxes on income 206 18 (1) 103 326
Income from continuing operations 339 39 22 489 889
Net income attributable to non-controlling interests 0 0 0 0 0
Net income attributable to Zoetis 339 39 22 489 889
49 |
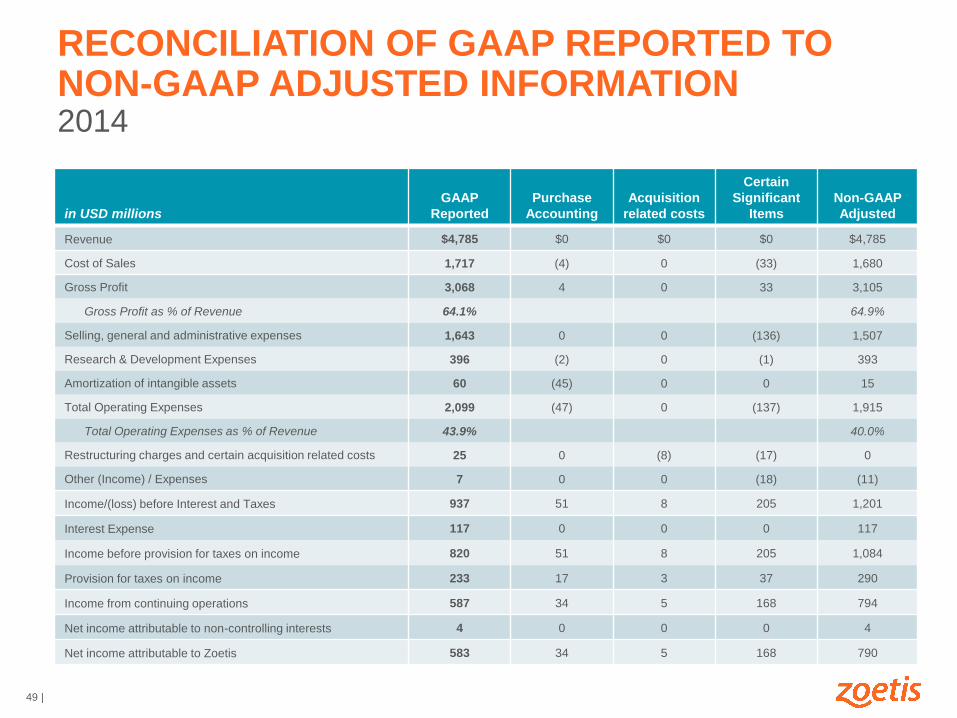
RECONCILIATION OF GAAP REPORTED TO NON-GAAP ADJUSTED INFORMATION 2014
in USD millions
GAAP
Reported
Purchase
Accounting
Acquisition
related costs
Certain
Significant
Items
Non-GAAP
Adjusted
Revenue $4,785 $0 $0 $0 $4,785
Cost of Sales 1,717 (4) 0 (33) 1,680
Gross Profit 3,068 4 0 33 3,105
Gross Profit as % of Revenue 64.1% 64.9%
Selling, general and administrative expenses 1,643 0 0 (136) 1,507
Research & Development Expenses 396 (2) 0 (1) 393
Amortization of intangible assets 60 (45) 0 0 15
Total Operating Expenses 2,099 (47) 0 (137) 1,915
Total Operating Expenses as % of Revenue 43.9% 40.0%
Restructuring charges and certain acquisition related costs 25 0 (8) (17) 0
Other (Income) / Expenses 7 0 0 (18) (11)
Income/(loss) before Interest and Taxes 937 51 8 205 1,201
Interest Expense 117 0 0 0 117
Income before provision for taxes on income 820 51 8 205 1,084
Provision for taxes on income 233 17 3 37 290
Income from continuing operations 587 34 5 168 794
Net income attributable to non-controlling interests 4 0 0 0 4
Net income attributable to Zoetis 583 34 5 168 790

50 |
RECONCILIATION OF GAAP REPORTED TO NON-GAAP ADJUSTED INFORMATION 2013
in USD millions
GAAP
Reported
Purchase
Accounting
Acquisition
related costs
Certain
Significant
Items
Non-GAAP
Adjusted
Revenue $4,561 $0 $0 $0 $4,561
Cost of Sales 1,669 (2) 0 (42) 1,625
Gross Profit 2,892 $2 0 $42 2,936
Gross Profit as % of Revenue 63.4% 64.4%
Selling, general and administrative expenses 1,613 1 0 (188) 1,426
Research & Development Expenses 399 (1) 0 (7) 391
Amortization of intangible assets 60 (46) 0 0 14
Total Operating Expenses 2,072 (46) 0 (195) 1,831
Total Operating Expenses as % of Revenue 45.4% 40.1%
Restructuring charges and certain acquisition related costs 26 0 (22) (4) 0
Other (Income) / Expenses (9) 0 0 1 (8)
Income/(loss) before Interest and Taxes 803 48 22 240 1,113
Interest Expense 113 0 0 0 113
Income before provision for taxes on income 690 48 22 240 1,000
Provision for taxes on income 187 16 8 81 292
Income from continuing operations 503 32 14 159 708
Net income attributable to non-controlling interests (1) 0 0 0 (1)
Net income attributable to Zoetis 504 32 14 159 709

51 |
RECONCILIATION OF GAAP REPORTED TO NON-GAAP ADJUSTED INFORMATION 2012
in USD millions
GAAP
Reported
Purchase
Accounting
Acquisition
related costs
Certain
Significant
Items
Non-GAAP
Adjusted
Revenue $4,336 $0 $0 $0 $4,336
Cost of Sales 1,563 (4) (9) (1) 1,549
Gross Profit 2,773 4 9 1 2,787
Gross Profit as % of Revenue 64.0% 64.3%
Selling, general and administrative expenses 1,470 1 (1) (18) 1,452
Research & Development Expenses 409 0 0 (10) 399
Amortization of intangible assets 64 (49) 0 0 15
Total Operating Expenses 1,943 (48) (1) (28) 1,866
Total Operating Expenses as % of Revenue 44.8% 43.0%
Restructuring charges and certain acquisition related costs 135 0 (43) (92) 0
Other (Income) / Expenses (46) 0 0 25 (21)
Income/(loss) before Interest and Taxes 741 52 53 96 942
Interest Expense 31 0 0 0 31
Income before provision for taxes on income 710 52 53 96 911
Provision for taxes on income 274 17 19 62 372
Income from continuing operations 436 35 34 34 539
Net income attributable to non-controlling interests 0 0 0 0 0
Net income attributable to Zoetis 436 35 34 34 539
52 |
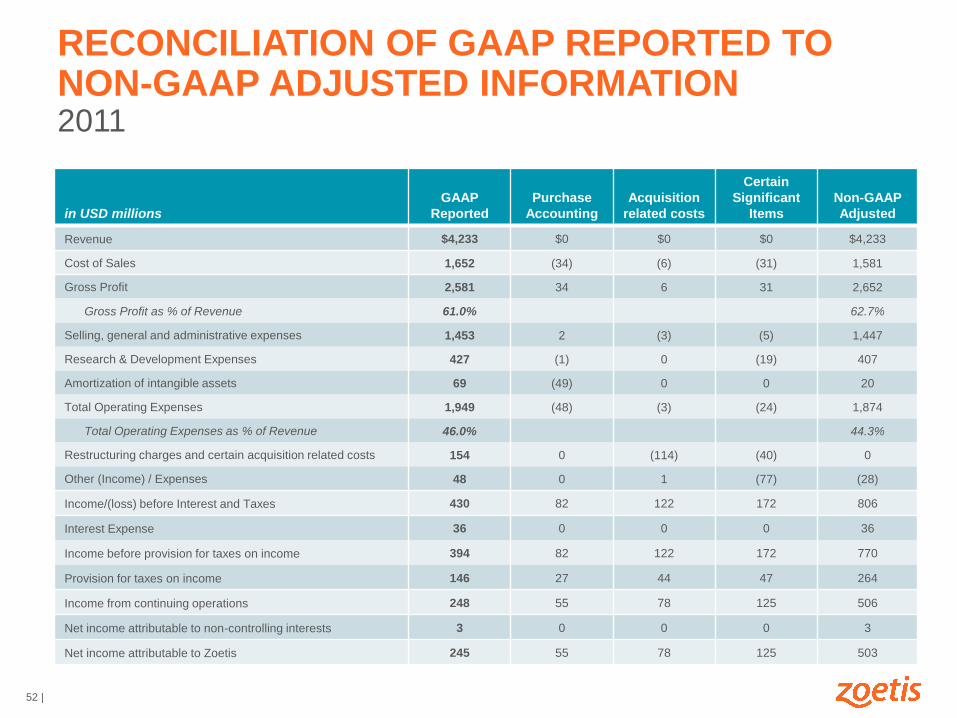
RECONCILIATION OF GAAP REPORTED TO NON-GAAP ADJUSTED INFORMATION 2011
in USD millions
GAAP
Reported
Purchase
Accounting
Acquisition
related costs
Certain
Significant
Items
Non-GAAP
Adjusted
Revenue $4,233 $0 $0 $0 $4,233
Cost of Sales 1,652 (34) (6) (31) 1,581
Gross Profit 2,581 34 6 31 2,652
Gross Profit as % of Revenue 61.0% 62.7%
Selling, general and administrative expenses 1,453 2 (3) (5) 1,447
Research & Development Expenses 427 (1) 0 (19) 407
Amortization of intangible assets 69 (49) 0 0 20
Total Operating Expenses 1,949 (48) (3) (24) 1,874
Total Operating Expenses as % of Revenue 46.0% 44.3%
Restructuring charges and certain acquisition related costs 154 0 (114) (40) 0
Other (Income) / Expenses 48 0 1 (77) (28)
Income/(loss) before Interest and Taxes 430 82 122 172 806
Interest Expense 36 0 0 0 36
Income before provision for taxes on income 394 82 122 172 770
Provision for taxes on income 146 27 44 47 264
Income from continuing operations 248 55 78 125 506
Net income attributable to non-controlling interests 3 0 0 0 3
Net income attributable to Zoetis 245 55 78 125 503

53 |
in USD millions
GAAP
Reported
Purchase
Accounting
Acquisition
related costs
Certain
Significant
Items
Non-GAAP
Adjusted
Revenue $3,582 $0 $0 $0 $3,582
Cost of Sales 1,444 (107) 0 (19) 1,318
Gross Profit 2,138 107 0 19 2,264
Gross Profit as % of Revenue 59.7% 63.2%
Selling, general and administrative expenses 1,382 0 (17) 0 1,365
Research & Development Expenses 411 0 0 0 411
Amortization of intangible assets 58 (41) 0 0 17
Total Operating Expenses 1,851 (41) (17) 0 1,793
Total Operating Expenses as % of Revenue 51.7% 50.0%
Restructuring charges and certain acquisition related costs 202 0 (200) (2) 0
Other (Income) / Expenses (130) 0 0 105 (25)
Income/(loss) before Interest and Taxes 215 148 217 (84) 496
Interest Expense 37 0 0 0 37
Income before provision for taxes on income 178 148 217 (84) 459
Provision for taxes on income 67 45 72 (1) 183
Income from continuing operations 111 103 145 (83) 276
Net income attributable to non-controlling interests 1 0 0 0 1
Net income attributable to Zoetis 110 103 145 (83) 275
RECONCILIATION OF GAAP REPORTED TO NON-GAAP ADJUSTED INFORMATION 2010

54 |
in USD millions
GAAP
Reported
Purchase
Accounting
Acquisition
related costs
Certain
Significant
Items
Non-GAAP
Adjusted
Revenue $2,760 $0 $0 $0 $2,760
Cost of Sales 1,078 (24) 0 (53) 1,001
Gross Profit 1,682 24 0 53 $1,759
Gross Profit as % of Revenue 60.9% 63.7%
Selling, general and administrative expenses 1,066 1 0 (10) 1,057
Research & Development Expenses 368 0 0 (3) 365
Amortization of intangible assets 33 (17) 0 0 16
Total Operating Expenses 1,467 (16) (0) (13) 1,438
Total Operating Expenses as % of Revenue 53.2% 52.1%
Restructuring charges and certain acquisition related costs 340 0 (247) (93) 0
Other (Income) / Expenses (3) 0 0 2 (1)
Income/(loss) before Interest and Taxes (122) 40 247 157 322
Interest Expense 26 0 0 0 26
Income before provision for taxes on income (148) 40 247 157 296
Provision for taxes on income (47) 13 79 63 108
Income from continuing operations (101) 27 168 94 188
Net income attributable to non-controlling interests (1) 0 0 0 (1)
Net income attributable to Zoetis (100) 27 168 94 189
RECONCILIATION OF GAAP REPORTED TO NON-GAAP ADJUSTED INFORMATION 2009
55 |
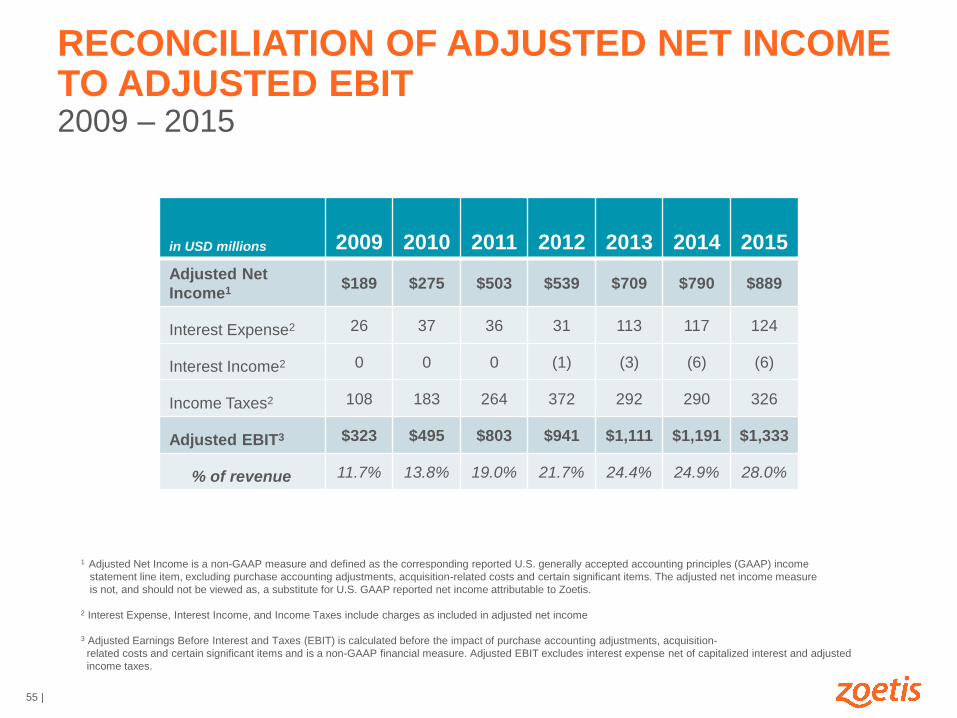
RECONCILIATION OF ADJUSTED NET INCOME TO ADJUSTED EBIT 2009 – 2015
in USD millions 2009 2010 2011 2012 2013 2014 2015
Adjusted Net
Income1 $189 $275 $503 $539 $709 $790 $889
Interest Expense2 26 37 36 31 113 117 124
Interest Income2 0 0 0 (1) (3) (6) (6)
Income Taxes2 108 183 264 372 292 290 326
Adjusted EBIT3 $323 $495 $803 $941 $1,111 $1,191 $1,333
% of revenue 11.7% 13.8% 19.0% 21.7% 24.4% 24.9% 28.0%
1 Adjusted Net Income is a non-GAAP measure and defined as the corresponding reported U.S. generally accepted accounting principles (GAAP) income
statement line item, excluding purchase accounting adjustments, acquisition-related costs and certain significant items. The adjusted net income measure
is not, and should not be viewed as, a substitute for U.S. GAAP reported net income attributable to Zoetis.
2 Interest Expense, Interest Income, and Income Taxes include charges as included in adjusted net income
3 Adjusted Earnings Before Interest and Taxes (EBIT) is calculated before the impact of purchase accounting adjustments, acquisition-
related costs and certain significant items and is a non-GAAP financial measure. Adjusted EBIT excludes interest expense net of capitalized interest and adjusted
income taxes.