zew-seeding strategies for viral...
TRANSCRIPT

Social Contagion – An Empirical Comparison of
Seeding Strategies for Viral Marketing
Oliver Hinz (* corresponding author) Professor of Electronic Markets
Technische Universität Darmstadt 64289 Darmstadt, Germany
+49 6151 16 75220 [email protected]
Bernd Skiera Chaired Professor of Electronic Commerce
Goethe-University of Frankfurt 60323 Frankfurt am Main, Germany
+49 69 798 34649 [email protected]
Christian Barrot Assistant Professor of Marketing and Innovation
Kühne Logistics University 20457 Hamburg, Germany
+49 40 328 7070 [email protected]
Jan U. Becker Assistant Professor of Marketing and Service Management
Kühne Logistics University 20457 Hamburg, Germany
+49 40 328 7070 [email protected]
Social Contagion – An Empirical Comparison of
Seeding Strategies for Viral Marketing
Seeding strategies have a major influence on the success of viral marketing campaigns, but
previous studies using computer simulations and analytical models produced conflicting
recommendations about the optimal seeding strategy. We therefore compare four different
seeding strategies in two complementary small-scale field experiments as well as in one
real-life viral marketing campaign that involved more than 200,000 customers of a mobile
phone service provider. Our empirical results show that the best seeding strategies can be up
to eight times more successful than other seeding strategies. Seeding to well-connected
individuals is most successful. They are attractive seeding points for viral marketing
campaigns because they are more likely participate, which contradicts a commonly made
assumption in other studies. Well-connected individuals also actively make use of their
higher reach but they do not do not have more influence on their peers than less-connected
individuals.
Keywords: viral marketing, seeding strategy, word-of-mouth, social contagion, targeting
1
Introduction
The future of traditional mass media advertising is uncertain in today’s environment of
increasingly prevalent digital video recorders and spam filters. Marketers must bear in mind
that 65% of consumers are overwhelmed with too many advertising messages, and nearly
60% feel that advertising is not relevant to them (Porter and Golan 2006). In fact, information
overload is likely and may even cause consumers to defer the purchase decision altogether
(Iyengar and Lepper 2000). In other words, there is strong evidence supporting the existence
of marketing avoidance with respect to traditional marketing instruments (Hann et al. 2008).
Empirical evidence reveals that consumers increasingly rely on advice from individuals in
their personal or professional networks for guidance in making purchase decisions (Hill,
Provost and Volinsky 2006, Iyengar, Van den Bulte, and Valente 2011). Interpersonal
communication gains importance in such situations and online communication is particularly
important, with websites containing user-generated content, such as blogs, video- and photo
sharing sites, and online social networking platforms, such as Facebook and LinkedIn,
growing tremendously. Companies have followed this trend by shifting budgets from “above-
the-line” (mass media) to “below-the-line” (e.g., promotions, direct mail, and viral)
marketing activities.
Not surprisingly, viral marketing is currently a hot topic. The term “viral marketing”
describes the phenomenon of individuals mutually sharing and spreading marketing-relevant
information that was initially deliberately sent out by marketers with the intent to stimulate
and capitalize on word-of-mouth (WOM) (Van der Lans et al. 2010). Such stimuli in form of
e-mails are usually unsolicited (De Bruyn and Lilien 2008) and easily forwarded to multiple
recipients at once. These characteristics are quite similar to those of infectious diseases, so
that many ideas of viral marketing build upon findings from epidemiology (see Watts and
2
Peretti 2007).
Because viral marketing campaigns leave the dispersion of marketing messages up to
individuals, they are also supposed to be more cost efficient than traditional mass-media
advertising. For example, one of the first successful viral campaigns conducted by Hotmail
generated twelve million subscribers in just 18 months with a marketing budget of only
$50,000. Google’s Gmail captured a significant share of the mail provider market even
though the only way to sign up for the service was via referral. A recent viral advertisement
by Tipp-Ex (“A hunter shoots a bear!”) triggered nearly 10 million clicks within four weeks.
The existing literature distinguishes among four critical factors for viral marketing
success: (i) content, i.e., the attractiveness of a message that makes it memorable (Gladwell
2002; Porter and Golan 2006), (ii) structure of the social network (Bampo et al. 2008), (iii)
behavioral characteristics of the recipients and their incentives for sharing the message
themselves (Arndt 1967), and (iv) seeding strategy, i.e., the initial set of individuals targeted
by the initiator of the viral marketing campaign (Kalish, Mahajan, and Muller 1995; Libai,
Muller, and Peres 2005; Bampo et al. 2008). The seeding strategy is of particular importance
because it is entirely under the control of the initiator and potentially manageable by
observable network metrics. Unfortunately, a "need for more sophisticated and targeted
seeding experimentation" exists in order to gain "a better understanding of the role of hubs in
seeding strategies" (Bampo et al. 2008).
Many people believe in the “influentials hypothesis”, which states that targeting opinion
leaders and strong connected individuals in social networks, also called hubs, is important for
fast diffusion (for a summary of arguments, see Iyengar, van den Bulte and Valente 2011).
However, recent findings raise doubts. Van den Bulte and Lilien (2001) show that social
contagion does not necessarily influence diffusion. Social contagion means that an
individual’s adoption behavior is a function of exposure to other individuals’ knowledge,
3
attitude, or behavior regarding the focal innovation (Van den Bulte and Wuyts 2007) and
social contagion is thus a basic premise of a successful viral marketing campaign. It
frequently arises when people who are close in the social structure use one another to manage
the uncertainty of prospective decisions (Granovetter 1985). Watts and Dodds (2007)
conducted a computer simulation study to show that well-connected individuals are less
important as initiators of large cascades of referrals or as early adopters as usually
conjectured. Their finding, summarized by the provocative statement “the tipping point is
toast”, has stimulated a heated debate about optimal seeding strategies (Thompson 2008).
However, an extensive empirical comparison of seeding strategies is still missing.
Consequently, Van den Bulte (2010) urges empirical comparisons of seeding strategies that
use socio-metric metrics, i.e., metrics that capture the social position of individuals.
This article empirically compares the success of different seeding strategies for viral
marketing campaigns and identifies the reasons for these differences. Thus, we answer the
important questions of whether companies should care about the seeding of their viral
marketing campaigns and why. More specifically, we study whether well-connected
individuals are really harder to activate, really participate more actively in these campaigns,
and whether they really have more influence on each of their peers than less-connected
individuals. In contrast to previous studies, which rely on analytical models or computer
simulations, we derive our results from field experiments as well as from a real viral
marketing campaign.
The remainder of this article is structured as follows: We start by presenting the related
literature on viral marketing and outlining social contagion theory. We introduce our
theoretical framework that disentangles the determinants of social contagion and present four
different seeding strategies. Next, we empirically compare the success of these seeding
strategies in two complementary field experiments (Study 1 and Study 2) that aim at
4
spreading information und at attitudinal changes. Then, we analyze a real-life viral marketing
campaign (Study 3) that aims at increasing sales as an economic measure of success. Then,
we identify the determinants for the differences in their success. The article concludes with a
discussion of our research contribution, its managerial implications, and its limitations.
Theoretical Framework
Whenever information on the underlying social network is available, seeding based on such
information, typically captured by socio-metric data, seems promising (Van den Bulte 2010).
It allows for distinguishing between three types of individuals: Hubs who represent well-
connected individuals with a high number of connections to other individuals, and fringes
who are individuals who are poorly connected. The socio-metric measure degree centrality
captures an individual’s connectedness within his/her local environment (see Appendix for
details). Thus, high values for degree centrality characterize hubs and low values characterize
fringes. The third type is bridges: individuals who connect two otherwise unconnected parts
of the network. The socio-metric measure betweenness centrality describes the extent to
which an individual acts as a network intermediary by calculating the share of shortest
communication paths that pass through that individual (see Appendix for details). Thus, high
values for betweenness centrality characterize bridges.
Determinants of Social Contagion
Based on Van der Lans et al. (2010), we propose a four-determinant model of social
contagion that allows for determining the success of viral marketing campaigns: First,
individual i receives a viral message from a sender s, who can either be a friend or the
initiator of the campaign, and thereby i becomes aware and informed of the message with the
information probability Ii. Individual i then becomes active and decides to participate in the
5
campaign with participation probability Pi. Given the participation, individual i passes the
message on to a set of recipients Ji, with ni being the number of recipients (|Ji| = ni) and
mirroring its used reach. The number of expected referrals Ri of individual i is then given by
the product of the information probability (Ii, i.e., being aware of the message), the
probability to participate (Pi) and the used reach (ni): Ri = Ii · Pi · ni.
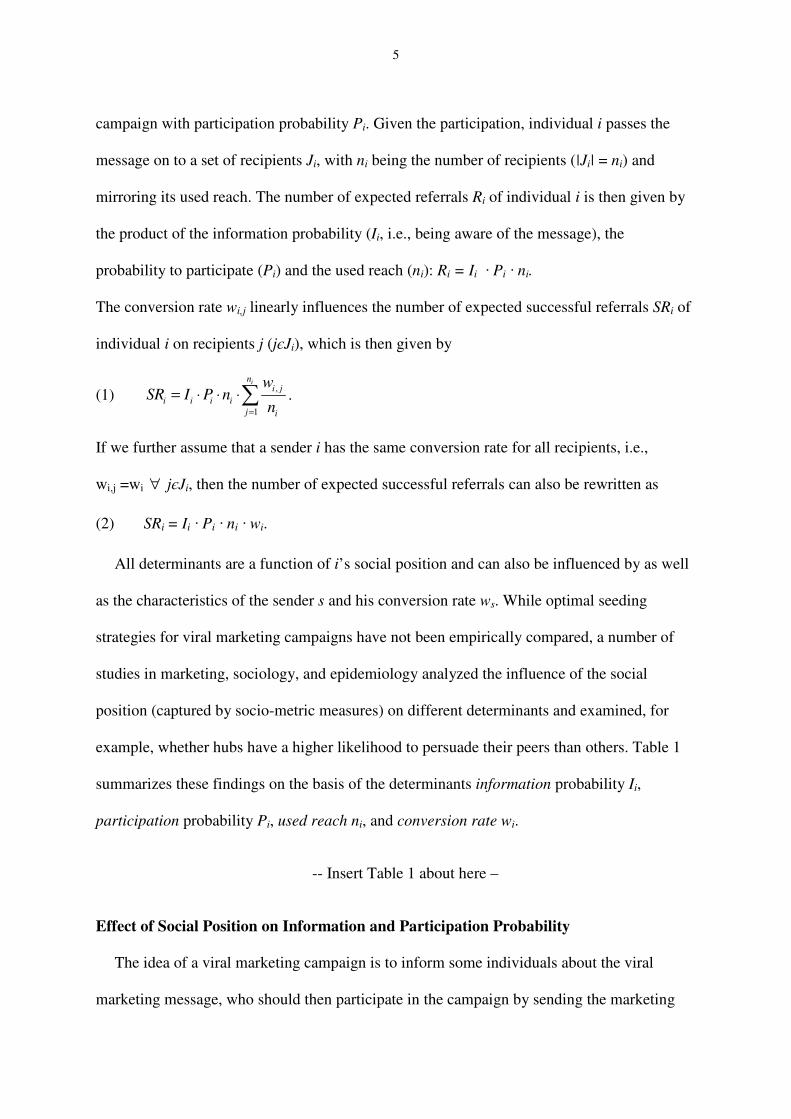
The conversion rate wi,j linearly influences the number of expected successful referrals SRi of
individual i on recipients j (jєJi), which is then given by
(1) ,
1
ini j
i i i i
j i
wSR I P n
n=
= ⋅ ⋅ ⋅∑ .
If we further assume that a sender i has the same conversion rate for all recipients, i.e.,
wi,j =wi ∀ jєJi, then the number of expected successful referrals can also be rewritten as
(2) SRi = Ii · Pi · ni · wi.
All determinants are a function of i’s social position and can also be influenced by as well
as the characteristics of the sender s and his conversion rate ws. While optimal seeding
strategies for viral marketing campaigns have not been empirically compared, a number of
studies in marketing, sociology, and epidemiology analyzed the influence of the social
position (captured by socio-metric measures) on different determinants and examined, for
example, whether hubs have a higher likelihood to persuade their peers than others. Table 1
summarizes these findings on the basis of the determinants information probability Ii,
participation probability Pi, used reach ni, and conversion rate wi.
-- Insert Table 1 about here –
Effect of Social Position on Information and Participation Probability
The idea of a viral marketing campaign is to inform some individuals about the viral
marketing message, who should then participate in the campaign by sending the marketing
6
message to other individuals. Regarding the impact of social position on information
probability, Goldenberg et al. (2009) show that hubs are on average better informed than
others because they are exposed to innovations earlier, as a result of their multiple social
links. In his reanalysis of Coleman, Katz, and Menzel’s (1966) “Medical Innovation” study,
Burt (1987) describes that some actors experience discomfort when peers whose approval
they value adopt an innovation they themselves have not yet adopted; in this case, social
contagion, reflected in a higher probability to participate, is caused by normative pressure and
status considerations. This mechanism could explain findings of Coleman, Katz, and Menzel
(1966) that highly integrated actors (such as hubs) are more likely to adopt an innovation at
an early stage than more isolated actors.
However, in some special cases, hubs are not more likely to adopt innovations first
(Becker 1970). When an innovation does not suit with a hub’s opinion, he or she is likely to
reject the product, which is then adopted first by individuals at the fringes of the network
(Iyengar, Van den Bulte, and Valente 2011). Another potential reason for the hubs’ lower
probability to participate is information overload. Because hubs are exposed to a high number
of contacts and thus a large amount of information due to their central position, they might be
harder to activate (Simmel 1950, Porter and Donthu 2008) and might therefore be less likely
to participate in viral marketing campaigns. Overall, information and participation
probabilities are hard to disentangle and we therefore assume throughout this article that all
receivers of viral marketing messages are aware of them. This assumption is likely to hold in
each of our three empirical studies. The motivation for this assumption is that disentangling
the two determinants is otherwise extremely difficult. Note that our main findings still hold if
that assumption is not satisfied. The only difference would be that the participation
probability would also capture the probability that an individual is informed (and thus aware)
of the viral marketing campaign.
7
Effect of Social Position on Used Reach
Studies in epidemiology find that hub constellations foster the spread of diseases
(Anderson and May 1991; Kemper 1980), which suggests that hubs are also more attractive
for the seeding of viral marketing campaigns, although it is unclear whether hubs actively and
purposefully make use of their potential reach. While this deliberate use of reach is a
common assumption, only Leskovec, Adamic, and Huberman (2007) show that hubs indeed
send out more messages. However, their definition of hub is based on the messaging behavior
itself, and therefore it cannot serve as generalizable evidence for the assumption that hubs
actively make use of their higher reach potential.
Individual i's used reach (first generation) plus the used reach of successive generations
originating from i’s initial direct reach (second and further generations), which we call i's
influence domain (Lin 1976), also depends on the number of individuals who have already
received the message. Bridges are then advantageous because they can forward the message
to different parts of the network (Granovetter 1973) that have not yet been infected.
Effect of Social Position on Conversion Rate
The social position might impact the degree of influence that is measured by the
conversion rate, i.e., the share of referrals that lead to successful referrals. Iyengar, Van den
Bulte, and Valente (2011) find that hubs are more likely to be heavy users and therefore
influence more effectively because they act in accordance to their own recommendation, e.g.,
by making heavy use of the innovation. Leskovec, Adamic, and Huberman (2007) find that
the success rate per recommendation declines with the number of recommendations that are
made. This result indicates that individuals have influence over a limited number of their
friends, but not over everybody they know. This result indicates that the conversion rate is
lower for hubs if they make use of their full reach potential. Yet, it does not preclude that
hubs might also select a more relevant subset of recipients from their peers and could thus

8
have a higher conversion rate. The effect of social position on the conversion rate thus
remains unclear. Still, Goldenberg et al. (2009) make the—in their eyes—conservative
assumption that hubs are not more persuasive than other people, but do not provide empirical
support for this assumption.
Seeding Strategies
Table 1 summarizes the conclusions that can be drawn for recommendation about the optimal
seeding strategy (see the column “recommendation for optimal seeding strategy”). It
illustrates that there is little consent. Four studies recommend seeding hubs, three recommend
fringes, and one recommends bridges.
If at least one of the determinants Ii, Pi, ni, or wi is increasing with a higher connectivity of
the sender i, and the remaining determinants are not correlated with higher connectivity, then
hubs should be the subject of initial seeding efforts because they best spread the viral
information. This conclusion is also offered as a conjecture by Hanaki et al. (2007) and Van
den Bulte and Joshi (2007) and a simulation study by Kiss and Bichler (2008). We
subsequently refer to addressing hubs as initial seeding points as a “high-degree seeding”
strategy.
In contrast, Watts and Dodds (2007) conduct a series of computer simulations to analyze
interpersonal influence and find that the targeting of well-connected individuals to maximize
the spread of information only works under certain conditions that appear to be the exception
rather than the rule. Generally, a critical mass of influenceable individuals, rather than
particularly influential individuals, drives large cascades of influence. In particular, the
impact of influentials on triggering critical mass is not even proportional to the number of
people that they directly influence. Dodds and Watts (2004) claim that the individuals most
easily influenced have the highest impact on social contagion. If hubs truly suffer from
9
information overload because of their central position in a social network (Simmel 1950;
Porter and Donthu 2008), these particularly well-connected individuals must filter or validate
a potentially overwhelming amount of information via trustworthy sources and therefore may
indeed be less susceptible to information received from outside of their trusted network.
In their analytical model, Galeotti and Goyal (2009) proposes to target the low-degree
individuals, i.e., the fringe of the network, when the probability of adopting a product
increases with the absolute number of adopting neighbors. Based on similar ideas,
Sundararajan (2006) suggests seeding the fringes rather than the hubs, which we
subsequently refer to as a “low-degree seeding” strategy.
If the analyses focus on the influence domain, hence referrals beyond the first generation,
it becomes necessary to consider concepts of centrality that are not restricted to the local
environment. “Bridges”, which are individuals who connect otherwise unconnected sub-
networks, have large influence domains. Thus, seeding bridges bears the advantage that the
information diffuses into different parts of the network and prevents the viral message from
simply circulating in already infected, highly clustered sub-networks. Accordingly, Rayport
(1996) recommends exploiting "the strength of weak ties" (i.e., the bridges, see Granovetter
1973) to ignite a marketing virus. Analogously, Watts (2004) recommends focusing on
eliminating bridges and intermediaries to prevent epidemics. We subsequently refer to the
idea of seeding to those who bridge otherwise unconnected sub-networks as a “high-
betweenness seeding” strategy.
If no correlation exists between social position and the different determinants Ii, Pi, ni, and
wi, or if opposing influences of the determinants nullify each other, then there should be no
differences between the proposed strategies and a random targeting of individuals. We also
test this “random seeding” strategy, which additionally serves as benchmark because it
describes a situation in which no information on the social network is available.
10
Methodology
In the following section, we present three studies that empirically compare the success of
seeding strategies and identify which of the determinants are influenced by the individuals’
social position. Our three studies cover the two kinds of settings that are particularly relevant
for viral marketing. The first type of viral marketing campaigns primarily aims at spreading
information, typically to create awareness and to improve the perception of the brand, which
represent non-economic measure of success. The second type of viral marketing campaigns
aims at increasing sales as an economic measure of success. It encourages the mutual
information exchange of adopters and prospective adopters, and thereby triggers belief
updating (e.g., Hotmail).
These reasons for social contagion map nicely into the classification by Van den Bulte and
Wuyts (2007), who identify five reasons for the occurrence of social contagion. The first two
of them are especially relevant for viral marketing and the two types of campaigns that we
consider. First, people may become aware of the existence of an innovation through word-of-
mouth from previous adopters by simple information transfer. Second, people may update
their beliefs about the benefits and costs of a product or service. Third, social contagion may
occur through normative pressure, and individuals might experience discomfort when they do
not comply with the expectations of their peer group. Fourth, social contagion is based on
status considerations and competitive concerns, which are responsible for the level of
competitiveness between two individuals. Fifth, complementary network effects can cause
social contagion. In this case, the benefit of using a product or service increases with the
number of users.
To examine both types of viral marketing campaigns, we conduct two experimental
studies, Study 1 and Study 2, that simulate viral marketing campaigns where the social
11
contagion process mainly consists of simple information transfers and results in an increase
of awareness as a non-economic measure of success. The aim is to compare the success of
different seeding strategies. In Study 3, we examine a viral marketing campaign where social
contagion is caused by belief updating, which results in sales as an economic success
measure. In this study, a mobile phone service provider stimulates referrals (by sending out
text messages) to attract new customers. As the providers tracks all referrals, we can compare
the economic success of different seeding strategies and analyze the influence of the
corresponding socio-metric measures on all determinants of social contagion (see Table 1).
Table 2 summarizes the complementary setup of the three studies that helps to overcome
individual limitations of each of the three studies.
-- Insert Table 2 about here --
Experimental Comparison of Seeding Strategies
In both experimental studies, we compare the success of our four seeding strategies under
different conditions, which allows us to analyze the robustness of results in rather different
settings. The neccessity to conduct such experiments has just recently been pointed out by
Trusov, Bodapati, and Bucklin (2010): By analyzing data from one of the major social
networking sites, they found that only about one-fifth of a user’s friends actually influence
the user’s activity on the site. However, it remains unclear how responsive the identified "top
influencers" are and, thus, whether and how marketers should use information on underlying
social networks to better seed their viral marketing campaigns. In light of this limitation with
respect to managerial implications, they propose further research to conduct “straightforward
(and small-scale) field experiments.” We agree that such experiments can help to identify
best-practice strategies and, therefore, compare the four seeding strategies two in small-scale
12
field experiments.
Study 1: Comparison of Seeding Strategies in a Controlled Setting
The first experiment was conducted in a controlled setup to ensure internal validity and to
better control for the willingness to actively participate Pi (see Table 1). We recruited 120
students at a German university. The recruitment and commitment processes ensured
relatively similar individuals in terms of communication activity across treatments, because
all individuals were personally addressed and expressed their willingness to actively
contribute. In this setting, we expect a lower variation in activity levels as compared to a
study without awareness of participation and without direct contact with the experimenter.
The prerequisite for participation was having an account on the specified major online social
networking platform (similar to Facebook). Using proprietary software, we automatically
gathered each individual’s friends list from the social networking platform. We applied an
event-based approach as boundary specification strategy and discarded all links to friends
who did not participate in the experiment. We then used the software Pajek to calculate the
socio-metric measures (degree centrality and betweenness centrality, see Appendix for more
details) for each individual.
In detail, the social network generated consisted of 120 nodes (i.e., individuals) with 270
edges (i.e., friendship relations). The calculated degree centrality ranged from 1 to 17, with a
mean of 4.463 and a standard deviation of 3.362. In other words, there was an average of
slightly more than four friends per individual in the considered social network. Interestingly,
the correlation of .592 (p < .01) between the degree centrality of this small network created
by our rather artificial boundary specification strategy (using the criteria “participation in
experiment”) and the entire network captured by this social networking platform (6.2 million
unique users in November 2009) is striking. This high correlation supports the work by
Costenbader and Valente (2003), who find that centrality metrics are relatively robust across
13
different network boundaries. Thus, our results reveal that the applied boundary in this
experiment does not systematically bias centrality metrics such as degree centrality, even
when the subsample is as small as .002% of the entire online social network platform.
Betweenness centrality ranged from 0 to .320, with a standard deviation of .053.
We used these two socio-metric measures to implement our four seeding strategies. The
seeding was done by using the message function of the social networking platform to send
out unique tokens of information to a varying subset of participants (while the total
population remained unchanged throughout this experiment) and to trace the contagion
process. These tokens were to be shared by the initial recipients with their friends, who, in
turn, were asked to spread them further. All receivers were asked to enter the tokens on a
website that we created for this purpose, along with information from whom it was received
(called the "referrer"). Because each individual was provided with login information for this
website, we were able to observe the number of successful referrals SRi (in terms of tokens
entered on the website) of each individual i for each of the seeding strategies. Furthermore,
we were able to distinguish whether the recipient received the tokens directly from the
experimenter ("Seeded by Experimenter") or via viral spreading from friends. We prohibited
the use of forums or mailing lists for spreading tokens and did not observed such an activity.
The experiment was conducted as a 4 x 2 x 2 full factorial design: According to the
strategies presented before, we varied the seeding strategies and seeded the tokens every few
days to hubs (high-degree seeding), to fringes (low-degree seeding), to bridges (high-
betweenness seeding), or to a random set of participants. We varied the number of initial
seeds such that the tokens were sent to either 12 (10%) or 24 (20%) of the 120 individuals.
Furthermore, we varied the payments for successful referrals to account for the effects of
extrinsic motivation (incentive for sharing yes/no). Under the condition "no incentive for
sharing," individuals were remunerated only for correctly entering a secret token. Under the
14
condition "incentives for sharing," individuals received a monetary reward when they were
named as a referrer.
In sum, we created 4 x 2 x 2 = 16 different treatments, which were systematically varied
with 2 replications per treatment. Due to limitations of the social networking platform
messaging system, we were unable to replicate four treatments and thus obtained n = 28
experimental settings (with two replications per treatment, the potential maximum would
have been 4 x 2 x 2 x 2 = 32 experimental settings). Although treatments were systematically
varied, we timed the "low incentive for sharing" settings before the "high incentive for
sharing" settings to avoid confusing individuals with different incentive instructions. We
always seeded one token and captured all responses within two weeks after seeding.
Overall, 55% of the individuals actively spread or entered unique tokens, resulting in a
total of 1,155 responses. We observed an average of 41.25 spread tokens per experimental
setting and a standard deviation of 19.21. To compare the success of the strategies, we used a
random effects logistic regression analysis that accounts for individual behavioral differences
of participants with each participant's responsiveness (token entered yes=1, no=0) in each of
the experimental settings as a dependent variable. Thus, we had 120 (participants) x 28
(experimental settings) = 3,360 observations. As independent variables, we included dummy-
coded treatment variables that reflect our full factorial design. We present the results in Table
3.
-- Insert Table 3 about here --
The model reaches a Pseudo-R2 of 15.5%. The proportion of unexplained variance that is
accounted for by subject-specific differences due to unobserved influences, labeled as ρ, is
more than 90%. Compared to random seeding, we found the high-degree seeding strategy to
yield a much higher likelihood of response (odds ratio=1.53)―somewhat similar to the high-

15
betweenness seeding strategy (odds ratio=1.39). On the other hand, the low-degree seeding
strategy dramatically decreases the likelihood to respond (odds ratio=.19).
Our treatment variable high seeding (dummy coded with 0="12 seeds"; 1="24 seeds")
positively influences the likelihood to respond. Furthermore, we found that the type of
incentive offered seems to be a major driver behind reaching the highest odds-ratio estimate.
This high value could possibly explain why extrinsic motivation via monetary incentives is
frequently used for viral marketing (e.g., recruit-a-friend campaigns offering rewards for the
referrer, such as price discounts or redeemable coupons for successful spreading;
Biyalogorsky, Gerstner, and Libai 2001). Finally, we found that individuals who received the
token from the experimenter ("seeded by experimenter") had a higher likelihood to respond
which is not surprising because the information probability is 1.
To directly compare the various seeding strategies, we varied the contrast specifications
while leaving the remaining model unchanged and obtained the conditional odds ratio matrix
presented in Table 4.
-- Insert Table 4 about here --
Table 4 indicates that both high-degree and high-betweenness seeding increase the
likelihood to respond in contrast to the random seeding strategy by +39-53%. When
considering the low-degree seeding strategy (see second column of Table 4), all other seeding
strategies are 5-8 times more successful than the low-degree seeding strategy. A comparison
of the two most successful seeding strategies, i.e., high-betweenness and high-degree seeding,
does not yield significant differences. This result is very interesting and might be very useful
for marketing practice because degree centrality as a local measure for centrality is much
easier computable than betweenness centrality which requires information on the structure of
the entire network.

16
In summary, our results show that i) the low-degree seeding strategy is inferior to the other
three seeding strategies, and ii) both high-betweenness and high-degree seeding strategies
clearly outperform the random seeding strategy and yield comparable results.
Yet, the setup of this experiment cannot avoid sequential effects, which might limit the
validity of separately analyzing each experiment setting. The reason is that the behavior of an
individual in one experimental setting might also be influenced by the experience that this
individual made earlier in other experimental settings. This problem is driven by the limited
number of individuals in our experiment. To address this problem, we conducted a second
experiment with more individuals that avoids sequential effects by simultaneously
implementing four different seeding strategies.
Study 2: Comparison of Seeding Strategies in a Field Setting
In the second field experiment, we focused on the entire online social network of all students
that are enrolled in the MBA program at the same university as in Study 1. Thus, the network
boundary is defined by the individuals’ participation in this program. We collected the
contact information of 1,380 students (1,380 nodes with 4,052 edges) by crawling the same
social networking platform, collecting information on the individuals’ friendships and
calculated the socio-metric measures likewise in Study 1.
We found a mean degree (standard deviation) of 5.872 (7.318). Study 2 also displays a
very high and significant correlation between individuals’ degree centrality in the bounded
network (1.380 MBA students at the particular university) and their degree centrality in the
entire network of the social networking platform (6.2 million unique users in November
2009). With a Pearson correlation of .824 (p < .001), the number of friends reported (open to
everybody) is a very good indicator for degree centrality in the bounded network. It suggests
that the overall network socio-metric measures approximate those of more bounded networks
very well.
17
In addition, we used the time since the last profile update as a proxy for the level of
activity. We acquired information for 849 update timestamps―531 were missing because of
privacy restrictions set by the users. On average, the users had updated their profile 25.7
(Median = 15.0) weeks ago, and we observed a weak but significant correlation between the
degree centrality and the time (coded as weeks) since the last profile update (r = −.192,
p < .01). We also observed a correlation between betweenness centrality and time since the
last profile update (r = −.154, p < .01). The negative correlation implies that individuals who
updated their profiles more recently (and most likely update them more frequently) are also
more central in the social network. In other words, activity correlates with centrality and may
therefore be an additional determinant of the viral spread of information in this setting.
Furthermore, we observed that male individuals (805 male, 569 female, and 6 missing
observations) were more central because average female individuals had .92 fewer
connections than average male individuals (p < .05). However, this gender difference
becomes insignificant if we also control for activity.
We changed the experimental setup as follows: First, the four treatment groups (each
consisting of hubs, bridges, fringes, or a random sample) were all seeded on the same day.
Second, any variation of the incentive was eliminated. To complement Study 1, we did not
use extrinsic monetary incentives to stimulate participation. Third, we did not vary the
seeding size, and a reminder was sent out to the initial seeds seven days after the initial
seeding. Seeding was conducted using 95 individuals in each of the four treatments (70
individuals on Day 1, 25 individuals on Day 2), which represented seven percent of the total
network (which is in line with Jain, Mahajan, and Muller 1995). We seeded a message that
contained a unique URL to a website with a funny video about the participants’ university
(the landing page and the video were identical for all treatments). By producing a new video
specifically for this second field experiment, we ensured that the viral marketing stimulus
18
(i.e., content) was unknown to all participants. Furthermore, we conjectured that the seeded
link to the video website would be preferentially distributed to fellow students of the
university (from which we obtained the mutual online social network relationships), rather
than outside the university’s social network. In other words, we considered the social network
for Study 2 to represent a coherent, self-contained social community.
One MBA student served as the initiator to seed the message to the individuals according
to the respective seeding strategy. The message included the link to the particular entry page
and the information that the addressees would find a funny video about the university that
had just been created by the initiator.
We subsequently tracked the website visits for the entry pages and video download pages
of these four sites for 19 days. Figure 1 compares the success of the four seeding strategies.
-- Insert Figure 1 about here --
The rank order of the seeding strategies with respect to their success for both dependent
variables is consistent with the results from our first experiment. We find that high-degree
seeding and high-betweenness seeding clearly outperform both low-degree seeding and
random seeding. For instance, in terms of videos watched, the high-degree seeding strategy
yielded more than twice the number of responses of random seeding. In other words,
information about social position made it possible to more than double the number of
responses.
To more precisely assess these findings, we estimated two random effects models (one for
the entry page and one for the video page) where each of the 19 days is treated as a unit of
observation for which we have four observations. We included the seeding and re-seeding
(reminder) days as dummy variables and added another dummy variable to account for
weekend days. The seeding strategies are coded as dummy variables. Table 5 illustrates the

19
results.
-- Insert Table 5 about here --
Both models for the entry and video pages are highly significant, with explained overall
variances (adjusted R2) of about 47.5% and 43.6%. The results shown in Figure 1 confirm our
previous observations, the high-degree and high-betweenness seeding yield again comparable
results and are three times more successful than low-degree seeding and 60% more successful
than random seeding. Days with seeding or re-seeding activities yield a higher number of
unique visits. The responsiveness was reduced on weekends (albeit insignificantly),
presumably due to an overall higher level of online activity on weekdays.
In summary, the results of Study 2 support our findings that seeding to hubs and bridges
outperforms seeding to fringes. Yet there could be interactions between the activities of the
four seeding strategies in Study 2. For example, a participant might have watched the video
after receiving the message from seeding strategy A and then, after receiving a nearly
identical message from seeding strategy B, might not click on the link because he correctly
assumes that he has already watched the video. In this case, seeding strategies that foster a
faster diffusion may have an advantage that could bias the result. The success of high-degree
and high-betweenness seeding in contrast to random and low-degree seeding might be
slightly overestimated. However, the results from Study 1 (were such crossings were not
possible due to the sequential timing) were confirmed in this complementary experimental
setting.
Other limitations of Study 1 and Study 2 are that we are not able to identify reasons for the
superiority of some seeding strategies and cannot distinguish between first- and second-
generation referrals. We will address these shortcomings in Study 3.
20
Comparison of the Effect of Seeding Strategies on the Determinants of
Social Contagion in a Real-life Viral Marketing Campaign (Study 3)
In contrast to Study 1 and 2, Study 3 compares the economic success of different seeding
strategies in a real-life viral marketing campaign and identifies reasons for these differences.
More precisely, Study 3 allows for decomposing the effect of the different determinants that
drive the social contagion process as introduced in Table 1, namely the effects of
participation probability Pi, the used reach ni, the mean conversion rate wi of all referrals
made by i on the expected number of referrals Ri, and the expected number of successful
referrals SRi. To investigate the influence of an individual’s social position and viral
marketing success, we used empirical data from a viral marketing campaign of a mobile
phone service provider. In the campaign, a text message was sent to the entire customer base
(n = 208,829 customers) promising a higher reward (by 50%) than the regular €10 worth of
airtime for each new customer referred within the next month. In total, 4,549 customers
participated in the campaign, initiating 6,392 first-generation referrals, reflecting a 50%
increase compared to the average number of referrals. In this empirical setting, we expect that
social contagion works through belief updating as prospective customers talk to adopters
about this product. According to the classification in Becker (1970), the product can be
classified as a low-risk product (e.g., compared to the trial of untested drugs, see Becker
1970).
To analyze the social contagion process, we used a rich data set: Every referral activity
was logged through the online referral system of the company, as customers had to initiate
referral messages to their friends online. Successful referrals were then confirmed during the
registration process of the new customers, who had to validate their respective referrer to
trigger the payout of the referral premium. More specifically, we used the information on
whether customers acted on the stimulus of the referral campaign captured by the variable
21
program participation Pi as well as the number of referrals Ri and the number of successful
referrals SRi. The mean conversion rate per referrer wi can be inferred from a comparison of
Ri and SRi. We used individual-level communication data, as well as the number of text
messages to other individuals to calculate (external) degree centrality (in total, we evaluated
more than 100 million connections).1 We assumed that any telephone call or SMS, between
individuals (independent of the direction) reflected social ties to other individuals. Thus, the
degree centrality of an individual equals her total number of such unique communication
relationships. Because the service can only be referred to non-customers, our degree
centrality metric accounts only for ties that customers had to individuals outside the service
network at the beginning of the viral marketing campaign and, thus, represents the external
degree centrality. As we had no information about all the relationships of individuals who
were currently not customers of the provider, we could not measure betweenness centrality
and, thus, could not test a high-betweenness seeding strategy in Study 3.
Furthermore, we used the following customer characteristics as covariates: demographic
information such as age (in years) and gender (1 = female; 0 = male), service-specific
characteristics such as the customer tenure (i.e., length of the relationship with the company,
measured in months) and the tariff plan. The tariff plan was operationalized with a
dichotomous variable indicating whether the customer chose a community tariff (=1, which
included a reduced minute-price for calls within the network) or a one-price tariff (=0).
Furthermore, we included two measures that provide information on the customers’ trust in
the service: here, the payment type (dichotomous variable: automatic (=1) or manual (=0)
payment) and the refill policy (dichotomous variable: automatic (=1) or manual (=0) refill). In
the case of the automatic payment and refill options, customers needed to provide their credit
1 Note that all individual-level data were anonymized through a multi-stage encryption process by the firm prior to our analysis. Thus, at no stage of our analysis was sensitive customer information such as names or telephone numbers, etc., disclosed.
22
card details to the service provider. Also, we included information on the acquisition channel
of the customer (1 = offline / retail; 0 = online).
Our model reflects the two-stage process of each individual who first decides whether to
participate (Pi) and then chooses to which extent to participate (ni). A specific characteristic
of the first stage is the relatively large share of zeros (non-participants). At the same time,
observed values for the second stage are of count nature and highly left-skewed. This data
structure required the application of specific two-stage regression models: either inflation
models, such as the zero-inflated Poisson regression (ZIP) (Lambert 1992), or hurdle models,
such as the Poisson-Logit Hurdle Regression model (PLHR) (Mullahy 1986). We chose a
PLHR, i.e., a combination of a logit model to account for the participation decision and a
zero-truncated Poisson regression to analyze the actual outcomes of participation (such as
number of (successful) referrals).2 In our PLHR specification, the binary variable i
P
indicates whether individual i participates in the referral program or not (hurdle or logit
model). Additionally, Used Reach ni indicates how many referrals the individual i initiates,
conditional on the decision to participate (Pi = 1). As an extension, Converted Reach CR =
(ni ⋅ wi) indicates how many successful referrals the individual i initiates, again, conditional
on the decision to participate. Note that Used Reach ni and Converted Reach CRi are
equivalent to Referrals Ri and Successful Referrals SRi, respectively, but conditional on a
program participation probability Pi = 1. Both variables are used as dependent variables in the
Poisson regression of our PLHR specification.
Hence, let ∗
iP be the latent variable related to
iP , ni
* be the censored variable related to ni,
and CR* = (ni
* ⋅ wi)
* be the censored variable related to CR = (ni* ⋅ wi). Together with the
explanatory variable (external) degree centrality as well as the covariates (i.e., age, gender,
2 We chose PLHR over ZIP because the logit stage of the former is directed to determine the effects that lead to
participation (i.e., identifying the referrers, in which we are interested), while the inflation stage of ZIP tries to detect “sure zeros” (i.e., non-participants).

23
payment type, refill policy, acquisition channel, and customer tenure), our PLHR is specified
as follows:
(4) 0
1 if 0, where ,
0 otherwise
i
i i P i Pij Pij Pi
PP P X
∗∗
>= = β +β ⋅ + ε
(5) 0
if 0, where ,
0 otherwise
i i
i i UR i URij URij URi
n Pn n X
∗ ∗∗
>= = β +β ⋅ + ε
(6) ( ) ( ) ( )*
0
if n 0, where .
0 otherwise
i i i
i i i i CR i CRij CRij CRi
n wCR n w n w X
∗∗
⋅ >= ⋅ = ⋅ = β +β ⋅ + ε
ijX contains the explanatory variables j (i.e., degree centrality and the covariates) and error
terms εPi
, URi
ε , and CRi
ε that represent unobserved influences on individuals’ participation
probability, their used reach, and the number of successful referrals
Seeding Strategies in First-Generation Models
In the first step, we restricted our analysis to a first-generation model; i.e., we only
considered referrals that were directly initiated by customers who have received the seeding
stimulus during the viral marketing campaign.
-- Insert Table 6 about here --
Table 6 presents the parameter estimates of the PHLR model. The results can be
interpreted in two stages: first, what drives the participation of seeded customers in the viral
marketing campaign (logit component = LC), and second, for participants, what influences
the number of referrals and successful referrals, respectively (poisson component = PC). With
regard to the covariates’ impact on program participation, we found significant effects of the
demographic variables gender ( 2
LC
n∗β = −.2171; p < .01) and age ( 3
LC
n∗β = −.0209; p < .01),
indicating that male and older customers are more likely to participate as well as customers
24
with short customer tenure, i.e., customers who have just recently adopted the service ( 8
LC
n∗β =
−.0016; p < .01). The latter finding is in line with the cognitive dissonance theory that
assumes that customers communicate shortly after their purchase decision to reduce positive
or negative dissonance (Festinger 1957). Furthermore, we found that customers who were
acquired online are more strongly engaged in the (online-based) referral program than
customer who were acquired in the retail channel ( 6
LC
n∗β = −.9843; p < .01). Concerning the
tariff plan choice, the one-price tariff seems to be easier to communicate, as seeded customers
with that tariff option are also more likely to participate in the referral program ( 7
LC
n∗β =
−.1433; p < .01).The influence of most covariates is comparable between the logit and the
Poisson regression stage, except for acquisition channel: Retail customers are less likely to
participate in the program—but if they do, they show a significantly higher activity than
online customers ( 6
PC
n∗β = .7388; p < .01).
The influence of (external) degree centrality varies between the two stages of the model:
In the logit regression stage, degree centrality has a positive and significant influence on the
likelihood to participate Pi in the referral program ( 1
LC
n∗β = .0032; p < .01). Confirming the
results of Study 1 and Study 2, this result shows that customers with high degree centrality
are more likely to participate than those with low degree centrality (average degree of
participants = 45.3 versus non-participants = 36.5). However, in the Poisson regression stage
that analyzes only the group of active referrers the effect of degree centrality is mixed: We
find a positive, significant effect on used reach ( 1
PC
n∗β = .0012; p < .01), i.e., customers with
high-degree centrality are not only more likely to participate, but also more active when
participating in the viral marketing campaign. However, we find no significant effect of
degree centrality on the referral success of active referrers ( 1
PC
CRβ = −.00019; n.s.).

25
-- Insert Table 7 about here --
This result is further confirmed by analyzing the mean conversion rate of referrals per
referrer *
ii
i
CRw
n= (see Table 7)3: Again, we do not find a significant effect of degree
centrality for active referrers (β1w = .0001; n.s.). Thus, our results show no support for the
assumption that participating central customers are more persuasive referrers or better in
selecting potential referrals targets.
Considering that viral marketing campaigns can be costly, it is beneficial to identify those
customers who are most likely to participate and generate (successful) referrals. We use the
estimated participation probability calculated from the results of the selection model (see
Table 6, Logit Component) to group the full customer base into cohorts. We then compare
these cohorts according to their observed participation / referral / conversion rates and degree
centrality (see Table 8). The Top 5,000 cohort corresponds to a high-degree and the Bottom
5,000 cohort to a low-degree seeding strategy, and the results reported in the Average column
correspond to a random seeding strategy.
-- Insert Table 8 about here --
The results in Table 8 clearly confirm the positive correlation between degree centrality
and the success of viral marketing: As the estimated participation probability increases,
observed participation, referral, and conversion rates (i.e., total number of participants /
referrals / successful referrals divided by number of seeded customers in the cohort) and
degree centrality go up. More specifically, the participation rate of the Top 5,000 cohort is a
multiple of that of the Bottom 5,000 cohort (4.4% vs. .5%) with a much higher average
degree centrality (70.8 vs. 18.0). Thus, a high-degree seeding would be nearly nine times
3 We thank an anonymous reviewer for suggesting this additional analysis.
26
more successful than a low-degree seeding. Compared to the average value (i.e., the success
of a random strategy), the Top 5,000 cohort participation rate and degree centrality is twice as
high; therefore, targeting the hubs would double the performance compared to random
seeding of a sample of the same size.
Study 3 clearly shows the positive and significant effect of degree centrality on viral
marketing participation and activity and thus provides strong support for a “high-degree”
seeding strategy. However, as the results of the Poisson regression model show, we do not
observe a higher referral success of hubs within the group of active referrers.
Seeding Strategies in Multiple-Generation Models
In the second step of our empirical analysis, we extended the measurement of success of
our viral marketing campaign. To account for the complete effects of the seeding efforts, we
include more than one generation of referrals, as first-generation referrals are expected to
start a viral process that optimally continues through further generations of referral dyads.
The extent of this viral branching may differ between seeding strategies because of their
ability to reach different parts of the social network. Thus, the inclusion of multiple
generations could change the optimal seeding strategy.
To capture success beyond the first generation of referrals, we measured all subsequent
referral generations that originated from a first-generation referral during the campaign. We
limited the observation period to 12 months after the end of the campaign, as the company
repeated the referral campaign 13 months later. During our observation period, the company
did not engage in further promotions that directly focused on the referral program.
Furthermore, we could not observe any anomalies (such as drastic increases or reductions)
with regard to company-owned or competitive marketing spending during this period.
Within the first year after the campaign, 20.8% of all first-generation referrals became
active referrers themselves, 5.8% even multiple times. We observed viral referral chains with
27
a maximum length of 29 generations; on average, every first-generation referral during the
campaign led to .48 additional referrals.
-- Insert Figure 2 about here --
We define the dependent variable as the influence domain of all successful referrals of a
specific first-generation customer, i.e., the number of successful first-generation referrals,
plus the number of successful referrals of successive generations originating from these
successful first-generation referrals within the subsequent 12 months.4 For example, Figure 2
illustrates the influence domain of a referral customer X that spans over 22 additional
successful referrals in 7 generations.
Table 6 presents the parameter estimates of the PLHR model for this multiple-generation
model in the right-hand column. Note that the dependent variable influence domain IDiT is,
again, conditional on program participation (Pi = 1). Comparing the resulting regression
model parameters across the different dependent variables, we find similar results for
Influence Domain IDiT and Used Reach ni. However, we observe one important difference:
Our focal variable, degree centrality, is negative ( 1
PC
IDβ
= −.00205; p < .01) in the Poisson
regression model, i.e., among the participants of the campaign, the more central customers
have a smaller influence domain. We find indications in the observed network structure of the
referral processes that help to explain this surprising result. For hubs, we mostly observe
short referral chains (if at all). However, fringe customers participating in the campaign
demonstrate significantly longer referral chains, as illustrated in Figure 2: Non-central
customer X reacts to the campaign and refers the service. Within two generations, this
referral reaches the actor Y, who initiates a total of 15 additional referrals, thus increasing the
4 Note that, by definition, there is no overlap of influence domains between two different origins, as every referred customer has an in-degree of 1; i.e., only one specific referrer is rewarded for every new customer.
28
influence domain of the original referrer X to 22.
-- Insert Table 9 about here --
Because we find a positive effect of high degree in the selection model and a negative
effect in the regression model, the overall effect of degree centrality remains unclear. As a
simple test, we performed both, an OLS and a simple Poisson regression (PR), with
unconditional Influence Domain IDiR as dependent variable for the complete sample of
customers, i.e., we included all 208,829 customers who received the viral marketing
campaign stimulus. Table 9 presents the results: For both approaches, the standardized beta
for degree centrality is positive and significant ( 1
OLS
IDβ = .010; 1
PR
IDβ = .002, p < .001), thus
indicating that the overall effect of high degree centrality as a selection criterion for seeding a
viral marketing campaign is positive. This result, in turn, means that high-degree seeding
remains the more successful strategy, even when accounting for the full extent of a multiple-
generation viral process.
Robustness Checks
To check for the robustness of our findings, we also analyzed our data with a whole set of
alternative approaches, such as a Poisson-based (such as Zero-Inflated Poisson Regression
(ZIP)) and probit-OLS combinations (such as Tobit Type II models).5 Our core results
regarding the influence of degree centrality, positive influence on the selection stage
determining the likelihood of participation as well as negative effect on the influence domain
on the regression stage, hold for all tested models. Furthermore, these results remain
unchanged when incorporating additional individual-level covariates, such as airtime volume,
number of text messages or monthly mobile telephone charges that represent the
5 A confidentiality agreement prevents us from reporting the details of the results in the paper, but these results
were available to the reviewers.
29
attractiveness of a customer for the provider.
Unlike Studies 1 and 2, Study 3 does not allow for assessing the causal effect of seeding
strategy on referral success unambiguously. It reflects however a real-world marketing
application and is based on detailed firm data and illustrates strikingly the power of network
information.
General Discussion
Research Contribution
Inspired by the conflicting recommendations of previous studies regarding optimal seeding
strategies for viral marketing campaigns, the objectives of this study were to empirically
compare the performance of various proposed strategies, examine the magnitude of
differences, and identify the determinants that are responsible for the superiority of the best
seeding strategy. To our knowledge, the experimental comparison of seeding strategies is
unprecedented, as previous literature is solely based on mathematical models and computer
simulations. Hence, our real-life application helps to answer the controversially discussed
questions whether hubs are harder to convince to participate, whether they make use of their
reach, and whether they are indeed more persuasive.
We found that marketers can reach the highest number of referrals across various settings
if they seed the message to hubs (“high-degree seeding”) or bridges (“high-betweenness
seeding”). These two strategies yield comparable results but clearly outperform both the
random strategy (+52%) and are up to 8 times more successful than seeding to fringes (“low-
degree seeding”). The superiority of high-degree seeding does not rest on a higher conversion
rate due to a higher persuasiveness of hubs, but mainly on the higher activity of hubs, which
supports previous findings (e.g., Scott 2000; Iyengar, Van den Bulte, and Valente 2011).
The stream of research favoring the low-degree seeding strategy is based on the central
30
assumption that highly connected individuals are not easily influenced towards spreading
viral messages because they themselves are subject to the influence of too many other
individuals (e.g., Watts and Dodds 2007). Our results from Studies 1 and 3 show that this
assumption does not hold. In fact, we find that hubs have a higher probability of participating
in viral marketing campaigns. The distinction made by Becker (1970) seems to be important:
Hubs are more likely to engage because viral marketing works mostly through awareness
caused by information transfer from previous adopters and through belief updating, in
particular for low-risk products. Due to the low perceived risk, hubs do not hesitate to
participate. The fact that social contagion occurs mostly at the awareness stage also implies
that there is no disproportionate persuasiveness of hubs on their peers’ probability of
forwarding messages or adopting the product.
The analysis of a viral marketing campaign of a mobile phone service provider reveals that
hubs make slightly more use of their reach potential. Furthermore, for the group of
participating customers, we even found a negative influence of higher connectivity on the
resulting influence domains. Although epidemiology documents that infectious diseases
spread through hubs, we found that well-connected individuals are not using their higher
reach potential efficiently. A likely reason is that spreading information is costly both in
terms of time invested and capturing peers’ attention. Furthermore, hubs may be less likely to
reach other previously unaffected central actors, and are therefore limited in their overall
influence domain. These results show that a substantial number of findings from sociology
and epidemiology may have been incorrectly transferred to targeting strategies such as
optimal seeding in viral marketing.
Nevertheless, we maintain that the social network is a crucial determinant of the optimal
seeding strategies for viral marketing in practice because i) the social structure is much easier
to observe and to measure than the communication intensity, quality, or frequency, and ii) the
31
result was robust even when we controlled for the level of communication activity.
Therefore, we conclude that companies should utilize social network information about
mutual friendship relationships for spreading their viral marketing.
Managerial Implications
Our results show that viral marketing is not necessarily more of an art than a science, as
marketers can increase the performance of their campaigns by pursuing a seeding strategy
based on information pertaining to the structure of a social network. All studies in this article
document that information about the social structure is valuable for seeding. Seeding to the
“right” individuals yields up to 8 times more referrals than seeding to the “wrong”
individuals. This difference highlights the importance of the chosen seeding strategy for
marketing practice. In contrast to random seeding, seeding to hubs and bridges can still easily
increase the number of successful referrals by more than +50%. These results emphasize that
it is essential for marketers to follow the right seeding strategy and that the use of socio-
metric data allows for significantly increasing profit. We conclude that adding metrics about
social positions to CRM databases can substantially improve targeting models.
Many companies already have implicit information on social ties that can be used to
calculate explicit socio-metric measures. Telecommunication providers can exploit
connection data (see Study 3), banks have data on money transfers, mail providers can
analyze mail exchange or companies can evaluate behavior in company-owned forums. Many
companies also have indirect access to information on social networks, such as eBay through
Skype or Google through its Google mail service and start to use information obtained this
way (Hill, Provost and Volinsky 2006). Such network information is further available in the
form of friendship-choice data in online social communities such as Facebook, LinkedIn, or
the like (see, e.g., Hinz and Spann 2008).
32
Somewhat surprisingly, we found that in order to target a particular sub-network (e.g., all
students of a particular university as in Study 2) with a viral marketing message, use of the
respective sub-network's socio-metric measures is not necessarily required to implement the
desired seeding strategies. Instead, because the socio-metric measures of sub-network and
total network are highly correlated, marketers can utilize the socio-metric measures of the
total network and do not need to bother with the complex task of determining exact network
boundary specifications. This result is appealing because it also allows marketers to infer the
connectivity of an individual in an overall network rather reliably from information on the
connectivity in a natural sub-network. Because betweenness centrality requires knowledge
about the structure of the entire network, and the computation is complex and time-
consuming, degree centrality seems to be the best socio-metric measure for marketing
practice. This supports the simulative results from Kiss and Bichler (2008).
Based on these insights, marketers should pick highly-connected individuals as initial
seeding points. This strategy yields the best results for viral marketing campaigns that aim to
generate awareness and for viral marketing campaigns that encourage transactions. Although
our results imply that hubs are not more persuasive, they are more likely to participate and
therefore promise a higher spreading of the viral message. Additionally, our results show that
monetary incentives strongly increase the spread of viral marketing messages, but such
incentives could also make viral marketing more costly than is commonly assumed.
Our results further show that expertise in the domain of social networks is valuable for
seeding purposes. Based on this finding, online communities such as Facebook might begin
offering information on individuals’ social positions to third parties for marketing activities,
or offer services like seeding to a specific target group based on socio-metric measures.
Accordingly, specialized service providers might adopt this idea to tailor their offerings with
respect to optimal seeding activities. Business models might consist of collecting or
33
constructing social network information out of communication relationships or domain
expertise in certain subject domains, then targeting the most highly connected or intermediary
individuals with specific marketing information to maximize the success of viral marketing
campaigns. Today, Procter and Gamble's subsidiaries, Vocalpoint and Tremor, already
successfully utilize social network information for the introduction of new products and have
shown a doubling of sales in test locations.
Limitations and Directions for Future Research
Although we designed our experiments carefully, some shortcomings might limit the validity
of the results: In Study 1, order effects may exist because the sets of participants in the
different experimental settings are not disjunct. Therefore, Study 2 was designed to avoid
such an overlap but due to the parallel timing, there could be interrelations between the
different seeding lines, e.g., a participant might have watched the video after receiving the
message from seeding strategy A and then, after receiving a nearly identical message from
seeding strategy B, might not click on the link because this participant correctly assumes that
he has already watched the video. In this case, seeding strategies that foster a faster diffusion
may have an advantage that could bias results.
The student sample and the artificial information content of the experiments are further
limitations of the experimental studies, although these shortcomings do not systematically
favor one strategy over another. It would, however, be interesting to conduct similar
experiments with a different sample and real marketing content such as advertising spots.
In our real-life application, we were limited to comparing high-degree and low-degree
seeding strategies with a random seeding strategy. Although we did not differentiate referrals
with regard to profit of the referred customers (see Schmitt, Skiera and van den Bulte (2011)
for an analysis on the value of customers acquired through referral programs), our robustness
34
checks incorporating monthly telephone charges do not show any significant regression stage
effects of these additional covariates on converted reach or influence domain. Our results
regarding the effects of degree centrality remain unchanged throughout the robustness
checks.
Finally, most current research, including this article, focuses on individual choices and
treats the choices of partners (within the social network) as exogenous; these studies assume
that the network in question remains fixed for the duration of the study and remains
unaffected by it. We postulate that this is a strong assumption and conjecture that
incorporating the dynamics that are immanent to real-life social networks into marketing
response models would be an interesting avenue for future research. Also, a further extension
could be the incorporation of information on the dyadic level, such as tie strength. This
incorporation would be very helpful when trying to differentiate the success of referrals from
a specific customer.
The combination of the two experimental studies and the ex-post analysis of a real viral
marketing campaign provide strong arguments that hubs and bridges are important for the
diffusion of viral marketing campaigns. We cannot confirm recent findings in different
disciplines questioning the exposed role of hubs for the success of viral marketing campaigns.
In contrast, our analysis of the different determinants in Study 3 yields additional
explanations regarding why hubs are more attractive seeding points. These findings could be
used as input to create more realistic computer simulations and analytical models.
References
Amemiya, Takeshi (1984), “Tobit Models: A Survey,” Journal of Econometrics, 24 (1), 3-61.
Anderson, Roy M. and Robert M. May (1991), Infectious Diseases of Humans: Dynamics and Control.
Oxford, New York: Oxford University Press.

35
Arndt, Johan (1967), “Role of Product-Related Conversations in the Diffusion of a New Product,”
Journal of Marketing Research, 4(3), 291–295.
Bampo, Mauro, Michael T. Ewing, Dineli R. Mather, David Stewart, and Mark Wallace (2008), “The
Effects of the Social Structure of Digital Networks on Viral Marketing Performance,” Information
Systems Research, 19(3), 273–290.
Becker, Marshall H. (1970), “Sociometric Location and Innovativeness: Reformulation and Extension
of the Diffusion Model,” American Sociological Review, 35(2), 267–282.
Biyalogorsky, Eyal, Eitan Gerstner, and Barak Libai (2001), “Customer Referral Management: Optimal
Reward Programs,” Marketing Science, 20 (1), 82-95.
Coleman, James S., Elihu Katz, and Herbert Menzel (1966), Medical Innovation: A Diffusion Study.
Indianapolis: Bobbs-Merrill Co.
Costenbader, Elizabeth and Thomas W. Valente (2003), “The Stability of Centrality Measures when
Networks are Sampled,” Social Networks, 25(4), 283–307.
De Bruyn, Arnaud and Gary L. Lilien (2008), “A Multi-Stage Model of Word-of-Mouth Influence
Through Viral Marketing,” International Journal of Research in Marketing, 25(3), 151–163.
Dodds, Peter S. and Duncan J. Watts (2004), “Universal Behavior in a Generalized Model of
Contagion,” Physical Review Letters, 92(21), 218701.
Festinger, Leon (1957), A Theory of Cognitive Dissonance. Stanford: Stanford University Press.
Galeotti, Andrea and Sanjeev Goyal (2009), “Influencing the Influencers: A Theory of Strategic
Diffusion,” RAND Journal of Economics, 40(3), 509–532.
Gladwell, Malcolm (2002), The Tipping Point: How Little Things Can Make a Big Difference. Boston:
Back Bay Books.
Granovetter, Mark S. (1973), “The Strength of Weak Ties,” American Journal of Sociology, 78(6),
1360–1380.
——— (1985), “Economic Action and Social Structure: The Problem of Embeddedness,” American
36
Journal of Sociology, 91(3), 481–510.
Goldenberg, Jacob, Sangman Han, Donald R. Lehmann, and Jae Weon Hong (2009), “The Role of
Hubs in the Adoption Process,” Journal of Marketing, 73(2), 1–13.
Hanaki, Nobuyuki, Alexander Peterhansl, Peter S. Dodds, and Duncan J. Watts (2007), "Cooperation in
Evolving Social Networks," Management Science, 53(7), 1036–1050.
Hann, Il-Horn, Kai-Lung Hui, Sang-Yong T. Lee, and Ivan P. L. Png (2008), “Consumer Privacy and
Marketing Avoidance: A Static Model,” Management Science, 54(6), 1094–1103.
Hill, Shawndra, Foster Provost, and Chris Volinsky (2006), “Network-Based Marketing: Identifying
Likely Adopters via Consumer Networks,” Statistical Science, 21(2), 256–276.
Hinz, Oliver and Martin Spann (2008), “The Impact of Information Diffusion on Bidding Behavior in
Secret Reserve Price Auctions,” Information Systems Research, 19(3), 351–368.
Iyengar, Raghuram, Christophe Van den Bulte, and Thomas W. Valente (2011), “Opinion Leadership
and Social Contagion in New Product Diffusion,” Marketing Science, forthcoming.
lyengar, Sheena S. and Mark Lepper (2000), “When Choice is Demotivating: Can One Desire Too
Much of a Good Thing?” Journal of Personality and Social Psychology, 76(6), 995–1006.
Jain, Dipak, Vijay Mahajan, and Eitan Muller (1995), “An Approach for Determining Optimal Product
Sampling for the Diffusion of a New Product,” Journal of Product Innovation Management, 12(2),
124–135.
Kalish, Shlomo, Vijay Mahajan, and Eitan Muller (1995), "Waterfall and Sprinkler New-Product
Strategies in Competitive Global Markets," International Journal of Research in Marketing, 12(2),
105-119.
Katz, Elihu and Paul F. Lazarsfeld (1955), Personal Influence: The Part Played by People in the Flow
of Mass Communications. New York: Free Press.
Kemper, John T. (1980), “On the Identification of Superspreaders for Infectious Disease,”
Mathematical Biosciences, 48 (1-2), 111–127.
37
Kiss, Christine and Martin Bichler (2008), “Identification of influencers – Measuring influence in
customer networks”, Decision Support Systems, 46 (1), 233–253.
Lambert, Diane (1992), "Zero-Inflated Poisson Regression, With an Application to Defects in
Manufacturing," Technometrics, 34(1), 1-14.
Leskovec, Jure, Lada A. Adamic and Bernardo A. Huberman (2007), “The Dynamics of Viral
Marketing,” ACM Transactions on the Web, 1, 228 - 237.
Libai, Barak, Eitan Muller, and Renana Peres (2005), "The Role of Seeding in Multi-Market Entry,"
International Journal of Research in Marketing, 22(4), 375-393.
Lin, Nan (1976), Foundations of Social Research. New York: McGraw-Hill.
Mullahy, John (1986), "Specification and Testing of Some Modified Count Data Models," Journal of
Econometrics, 33(3), 341-365.
Porter, Constance E. and Naveen Donthu (2008), “Cultivating Trust and Harvesting Value in Virtual
Communities,” Management Science, 54(1), 113–128.
Porter, Lance and Guy J. Golan (2006), “From Subservient Chickens to Brawny Men: A Comparison of
Viral Advertising to Television Advertising,” Journal of Interactive Advertising, 6(2), 30–38.
Rayport, Jeffrey (1996), “The Virus of Marketing,” (accessed August 12, 2010), [available at
http://www.fastcompany.com/magazine/06/virus.html].
Schmitt, Philipp, Bernd Skiera and Christophe van den Bulte (2011), “Referral Programs and Customer
Value”, Journal of Marketing, 75(1), 46-59.
Scott, John (2000), Social Network Analysis: A Handbook (2nd ed.), London: Sage.
Simmel, Georg (1950), The Sociology of Georg Simmel. Compiled and Translated by Kurt Wolff,
Glencoe, IL: Free Press.
Sundararajan, Arun (2006), “Network Seeding,” Extended Abstract for WISE 2006, NYU Stern School
of Business.
Thompson, Clive (2008), “Is the Tipping Point Toast?” Fast Company, 122, 74-105 and (accessed
38
March 2, 2011), [available at http://www.fastcompany.com/magazine/122/is-the-tipping-point-
toast.html].
Trusov, Michael, Anand Bodapati and Randolph E. Bucklin (2010), “Determining Influential Users in
Internet Social Networks,” Journal of Marketing Research, 47(4), 643–658.
Van den Bulte, Christophe (2010), “Opportunities and Challenges in Studying Consumer Networks,” in
The Connected Customer, S. Wuyts, M. G. Dekimpe, E. Gijsbrechts, and R. Pieters eds. London:
Routledge, 7-35.
———, Christophe and Yogesh V. Joshi (2007), “New Product Diffusion with Influentials and
Imitators,” Marketing Science, 26(3), 400–421.
——— and Gary L. Lilien (2001), “Medical Innovation Revisited: Social Contagion versus Marketing
Effort,” American Journal of Sociology, 106(5), 1409–1435.
——— and Stefan Wuyts (2007), Social Networks and Marketing. Cambridge, MA: MSI Relevant
Knowledge Series.
Van der Lans, Ralf, Gerrit van Bruggen, Jehoshua Eliashberg and Berend Wierenga (2010), “A Viral
Branching Model for Predicting the Spread of Electronic Word-of-Mouth,” Marketing Science,
29(2), 348–365.
Watts, Duncan J. (2004), “The 'New' Science of Networks,” Annual Review of Sociology, 30(1), 243–
270.
——— and Peter S. Dodds (2007), “Influentials, Networks, and Public Opinion Formation,” Journal of
Consumer Research, 34(4), 441–458.
——— and Jonah Peretti (2007), “Viral Marketing for the Real World,” Harvard Business Review,
85(5), 22–23.
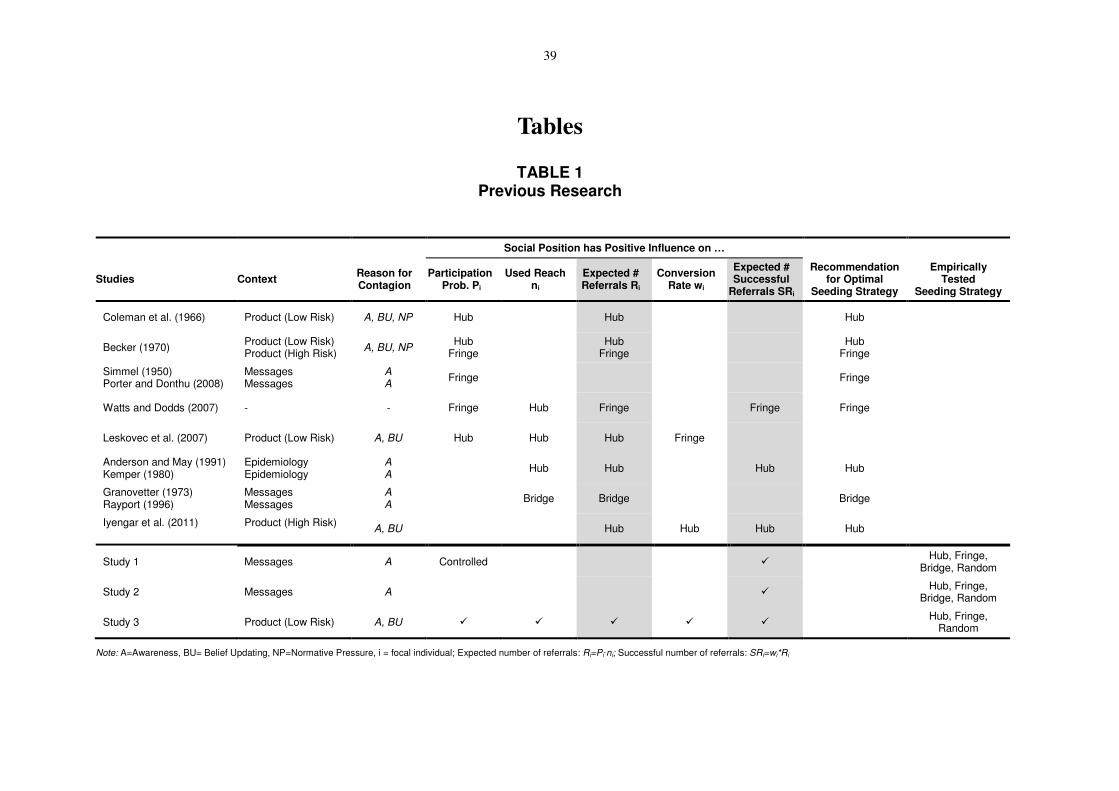
39
Tables
TABLE 1 Previous Research
Social Position has Positive Influence on …
Studies Context Reason for Contagion
Participation Prob. Pi
Used Reach ni
Expected # Referrals Ri
Conversion Rate wi
Expected # Successful
Referrals SRi
Recommendation for Optimal
Seeding Strategy
Empirically Tested
Seeding Strategy
Coleman et al. (1966) Product (Low Risk) A, BU, NP Hub Hub Hub
Becker (1970) Product (Low Risk) Product (High Risk)
A, BU, NP Hub
Fringe
Hub Fringe
Hub
Fringe
Simmel (1950) Porter and Donthu (2008)
Messages Messages
A A
Fringe Fringe
Watts and Dodds (2007) - - Fringe Hub Fringe Fringe Fringe
Leskovec et al. (2007) Product (Low Risk) A, BU Hub Hub Hub Fringe
Anderson and May (1991) Kemper (1980)
Epidemiology Epidemiology
A A
Hub Hub Hub Hub
Granovetter (1973) Rayport (1996)
Messages Messages
A A
Bridge Bridge Bridge
Iyengar et al. (2011)
Product (High Risk)
A, BU Hub Hub Hub Hub
Study 1 Messages A Controlled � Hub, Fringe,
Bridge, Random
Study 2 Messages A � Hub, Fringe,
Bridge, Random
Study 3 Product (Low Risk) A, BU � � � � � Hub, Fringe,
Random
Note: A=Awareness, BU= Belief Updating, NP=Normative Pressure, i = focal individual; Expected number of referrals: Ri=Pi·ni; Successful number of referrals: SRi=wi*Ri

40
TABLE 2 Summary of Studies
Study 1 Study 2 Study 3
Seeding Strategies Four Seeding Strategies:
• High-Degree (HD)
• Low-Degree (LD)
• High-Betweenness (HB)
• Random (Control)
Four Seeding Strategies
• High-Degree (HD)
• Low-Degree (LD)
• High-Betweenness (HB)
• Random (Control)
Three Seeding Strategies
• High-Degree (HD)
• Low-Degree (LD)
• Random (Control)
Social Contagion through Awareness (Advertisement) Awareness (Advertisement) Belief Updating (Service Referral)
Motivation Extrinsic motivation for sharing (Experimental Remuneration)
Intrinsic motivation (Funny Video about University)
Extrinsic motivation for sharing (Additional Airtime for Referral)
Seeding Size • 10% of network size
• 20% of network size
7% of network size Entire network
Seeding Timing Sequential Parallel -
Social Network 120 nodes (Small network), 270 edges
1,380 nodes (medium-sized network), 4,052 edges
208,829 nodes (very large network), 7,786,019 edges
Number of Treatments 16=4·2·2 4 -
Number of Replications 2 (4 Treatments missing) 1 -
Number of Experimental Settings 28 4 -
Boundary of Network Artificial Natural Natural
Design Strengths Test of causality, strong control due to experimental setup, identification of individual behavior due to specific IDs
Test of causality, realistic scenario Large real-world network based on firm data, identification of determinants
Design Weaknesses Repeated measures due to sequential timing, artificial scenario
Potential interaction between treatments, activity level of individuals not controlled for, individuals cannot be identified
Missing edges between non-customers (HB could not be tested), causality cannot be tested
Specific Finding HD and HB are comparable and outperform Random by +39-52% and LD by factor 7-8
HD and HB are comparable and outperform Random by +60% and LD by factor 3
HD outperforms Random by factor 2 and LD by factor 8-9
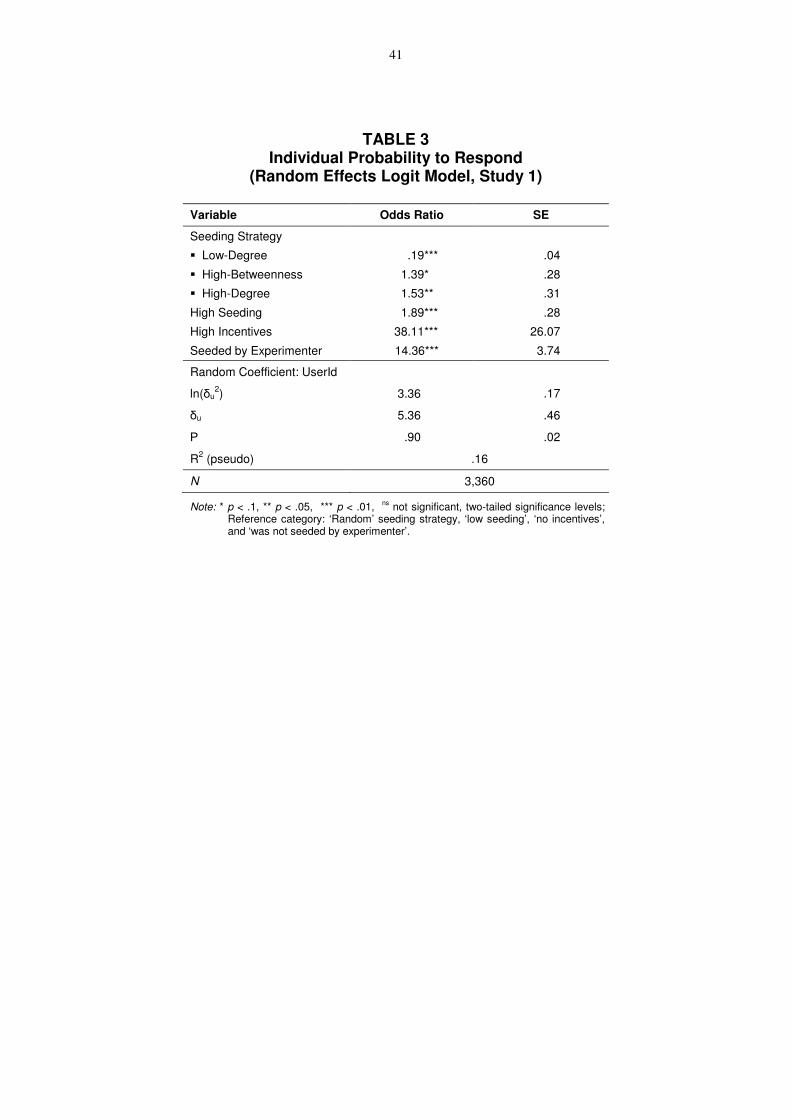
41
TABLE 3 Individual Probability to Respond
(Random Effects Logit Model, Study 1)
Variable Odds Ratio SE
Seeding Strategy
� Low-Degree .19*** .04
� High-Betweenness 1.39* .28
� High-Degree 1.53** .31
High Seeding 1.89*** .28
High Incentives 38.11*** 26.07
Seeded by Experimenter 14.36*** 3.74
Random Coefficient: UserId
ln(δu2) 3.36 .17
δu 5.36 .46
Ρ .90 .02
R2 (pseudo) .16
N 3,360
Note: * p < .1, ** p < .05, *** p < .01, ns
not significant, two-tailed significance levels; Reference category: ‘Random’ seeding strategy, ‘low seeding’, ‘no incentives’, and ‘was not seeded by experimenter’.
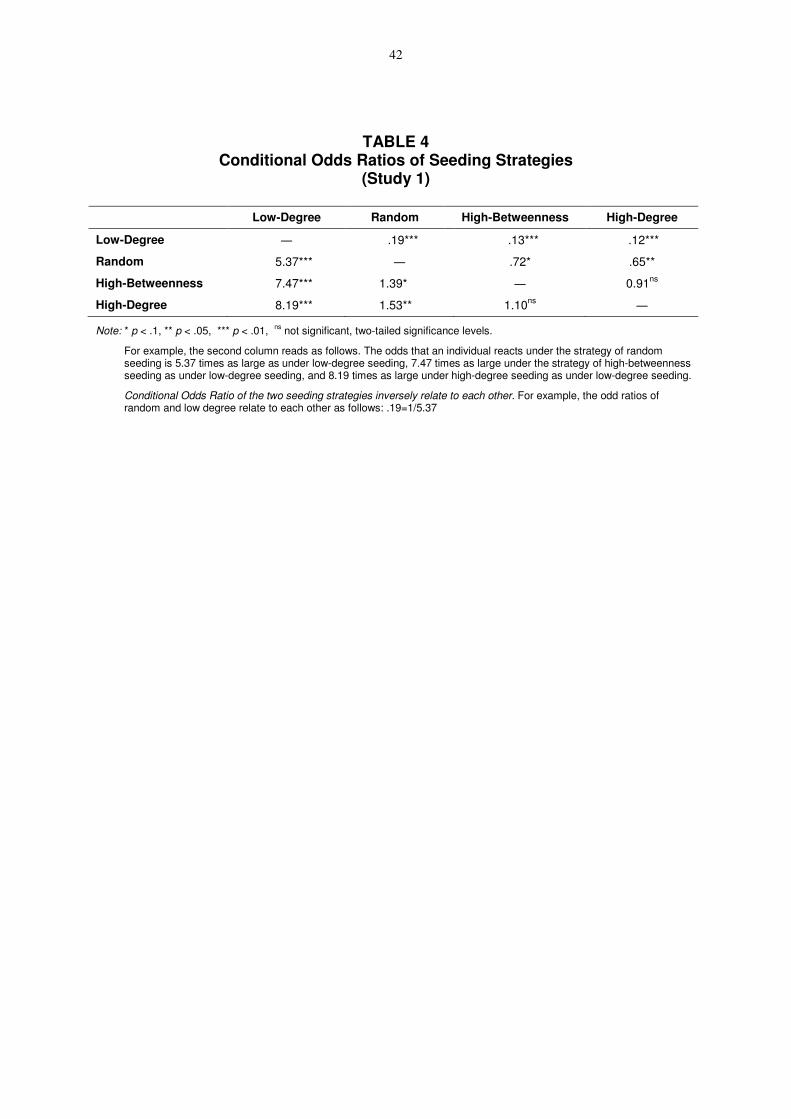
42
TABLE 4 Conditional Odds Ratios of Seeding Strategies
(Study 1)
Low-Degree Random High-Betweenness High-Degree
Low-Degree ― .19*** .13*** .12***
Random 5.37*** ― .72* .65**
High-Betweenness 7.47*** 1.39* ― 0.91ns
High-Degree 8.19*** 1.53** 1.10ns
―
Note: * p < .1, ** p < .05, *** p < .01, ns
not significant, two-tailed significance levels.
For example, the second column reads as follows. The odds that an individual reacts under the strategy of random seeding is 5.37 times as large as under low-degree seeding, 7.47 times as large under the strategy of high-betweenness seeding as under low-degree seeding, and 8.19 times as large under high-degree seeding as under low-degree seeding.
Conditional Odds Ratio of the two seeding strategies inversely relate to each other. For example, the odd ratios of random and low degree relate to each other as follows: .19=1/5.37

43
TABLE 5 Number of Visits per Day
(Random Effects Model, Study 2)
Entry Page
Unique Visits
Video Page
Unique Visits
Variable Coefficient SE Coefficient SE
High-Degree Seeding 2.263*** .766 1.623*** .547
High-Betweenness Seeding 2.158*** .766 1.211** .547
Random Seeding .947ns
.766 .263ns
.547
Seeding Day or Re-Seeding 7.128*** 1.276 4.005*** .727
Weekend −1.026ns
1.569 −.636ns
.794
Intercept −.127ns
.911 −.078ns
.524
Random Coefficient: Experimental Day
δe 2.375 1.642
Ρ .519 .290
R2 (overall) .475 .436
Note: * p < .1, ** p < .05, *** p < .01, ns
not significant, two-tailed significance levels. Reference categories: ‘Low-degree seeding’ and ‘weekdays’ and ‘No Seeding Day’
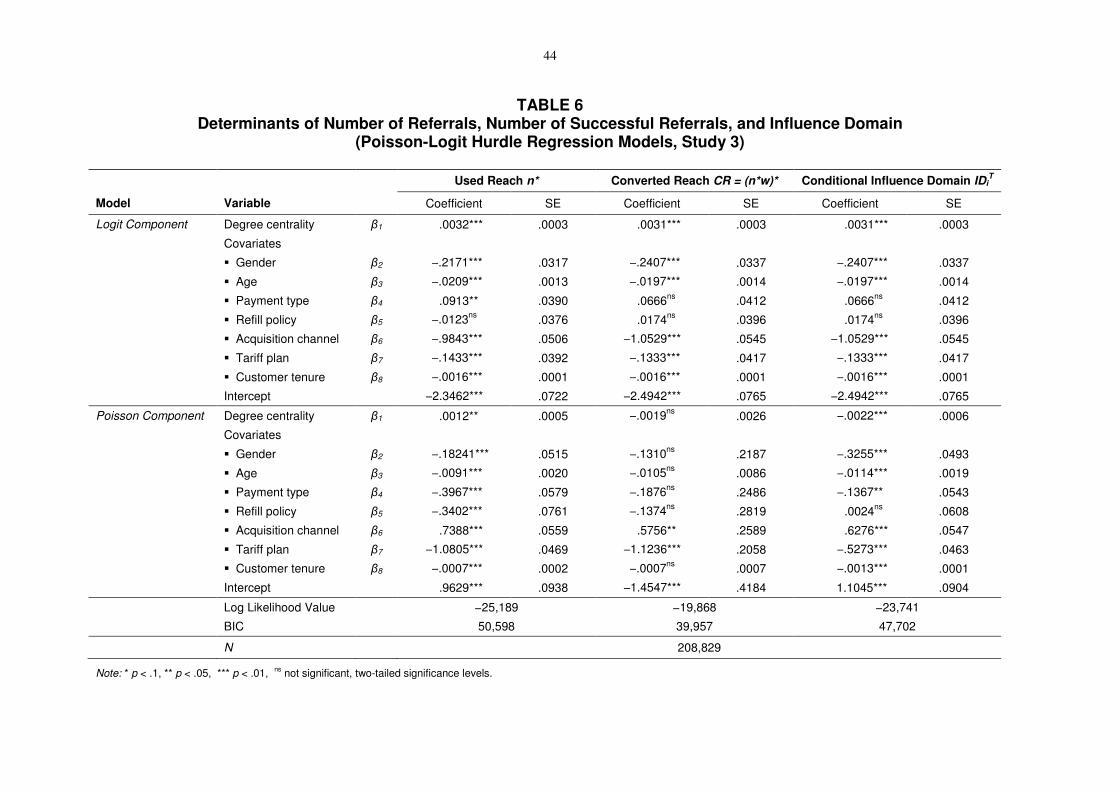
44
TABLE 6 Determinants of Number of Referrals, Number of Successful Referrals, and Influence Domain
(Poisson-Logit Hurdle Regression Models, Study 3)
Used Reach n* Converted Reach CR = (n*w)* Conditional Influence Domain IDiT
Model Variable Coefficient SE Coefficient SE Coefficient SE
Logit Component Degree centrality β1 .0032*** .0003 .0031*** .0003 .0031*** .0003
Covariates
� Gender β2 −.2171*** .0317 −.2407*** .0337 −.2407*** .0337
� Age β3 −.0209*** .0013 −.0197*** .0014 −.0197*** .0014
� Payment type β4 .0913** .0390 .0666ns
.0412 .0666ns
.0412
� Refill policy β5 −.0123ns
.0376 .0174ns
.0396 .0174ns
.0396
� Acquisition channel β6 −.9843*** .0506 −1.0529*** .0545 −1.0529*** .0545
� Tariff plan β7 −.1433*** .0392 −.1333*** .0417 −.1333*** .0417
� Customer tenure β8 −.0016*** .0001 −.0016*** .0001 −.0016*** .0001
Intercept −2.3462*** .0722 −2.4942*** .0765 −2.4942*** .0765
Poisson Component Degree centrality β1 .0012** .0005 −.0019ns
.0026 −.0022*** .0006
Covariates
� Gender β2 −.18241*** .0515 −.1310ns
.2187 −.3255*** .0493
� Age β3 −.0091*** .0020 −.0105ns
.0086 −.0114*** .0019
� Payment type β4 −.3967*** .0579 −.1876ns
.2486 −.1367** .0543
� Refill policy β5 −.3402*** .0761 −.1374ns
.2819 .0024ns
.0608
� Acquisition channel β6 .7388*** .0559 .5756** .2589 .6276*** .0547
� Tariff plan β7 −1.0805*** .0469 −1.1236*** .2058 −.5273*** .0463
� Customer tenure β8 −.0007*** .0002 −.0007ns
.0007 −.0013*** .0001
Intercept .9629*** .0938 −1.4547*** .4184 1.1045*** .0904
Log Likelihood Value −25,189 −19,868 −23,741
BIC 50,598 39,957 47,702
N 208,829
Note: * p < .1, ** p < .05, *** p < .01, ns
not significant, two-tailed significance levels.
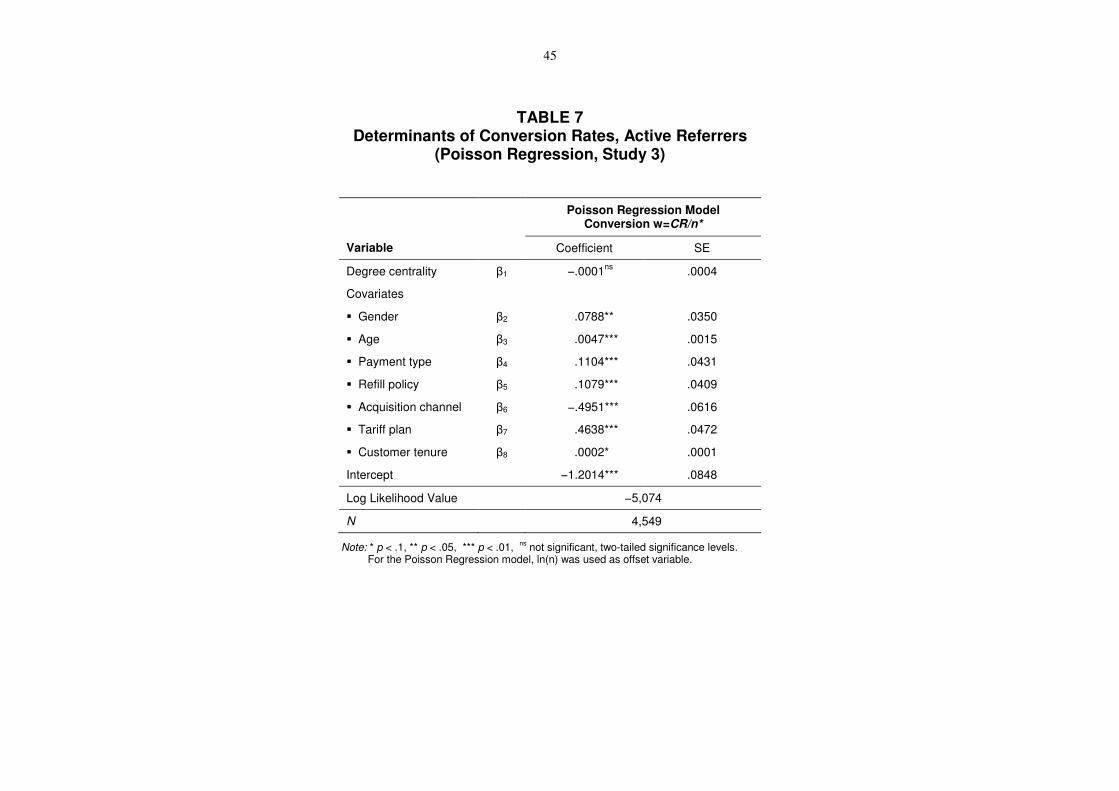
45
TABLE 7 Determinants of Conversion Rates, Active Referrers
(Poisson Regression, Study 3)
Poisson Regression Model
Conversion w=CR/n*
Variable Coefficient SE
Degree centrality β1 −.0001ns
.0004
Covariates
� Gender β2 .0788** .0350
� Age β3 .0047*** .0015
� Payment type β4 .1104*** .0431
� Refill policy β5 .1079*** .0409
� Acquisition channel β6 −.4951*** .0616
� Tariff plan β7 .4638*** .0472
� Customer tenure β8 .0002* .0001
Intercept −1.2014*** .0848
Log Likelihood Value −5,074
N 4,549
Note: * p < .1, ** p < .05, *** p < .01, ns
not significant, two-tailed significance levels. For the Poisson Regression model, ln(n) was used as offset variable.
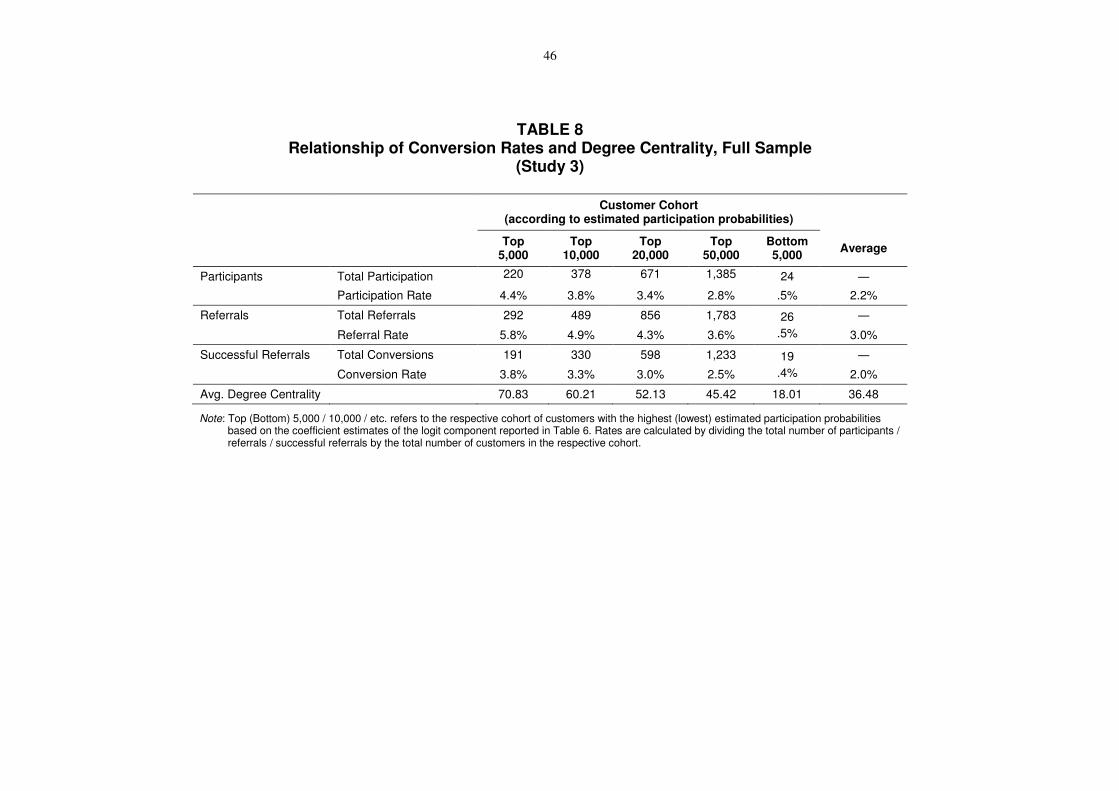
46
TABLE 8 Relationship of Conversion Rates and Degree Centrality, Full Sample
(Study 3)
Customer Cohort
(according to estimated participation probabilities)
Top
5,000 Top
10,000 Top
20,000 Top
50,000 Bottom 5,000
Average
Participants Total Participation 220 378 671 1,385 24 ―
Participation Rate 4.4% 3.8% 3.4% 2.8% .5% 2.2%
Referrals Total Referrals 292 489 856 1,783 26
.5%
―
Referral Rate 5.8% 4.9% 4.3% 3.6% 3.0%
Successful Referrals Total Conversions 191 330 598 1,233 19
.4%
―
Conversion Rate 3.8% 3.3% 3.0% 2.5% 2.0%
Avg. Degree Centrality 70.83 60.21 52.13 45.42 18.01 36.48
Note: Top (Bottom) 5,000 / 10,000 / etc. refers to the respective cohort of customers with the highest (lowest) estimated participation probabilities based on the coefficient estimates of the logit component reported in Table 6. Rates are calculated by dividing the total number of participants / referrals / successful referrals by the total number of customers in the respective cohort.

47
TABLE 9 Determinants of Unconditional Influence Domain
(OLS Model, Study 3)
OLS Model
Unconditional Influence Domain (IDiR)
Poisson Regression Model Unconditional Influence Domain (IDi
R)
Variable Std. Coefficient SE Coefficient SE
Degree centrality β1 .010*** .000 .002*** .000
Covariates
� Gender β2 −.015*** .002 −.358*** .028
� Age β3 −.024*** .000 −.024*** .001
� Payment type β4 .001ns
.002 .013ns
.033
� Refill policy β5 .000ns
.002 .003ns
.033
� Acquisition channel β6 −.025*** .002 −.680*** .039
� Tariff plan β7 −.016*** .002 −.433*** .030
� Customer tenure β8 −.031*** .004 −.002*** .000
Intercept .091*** .004 -1.509*** .058
R² (pseudo) .05 .03
N 208,829 208,829
Note: * p < .1, ** p < .05, *** p < .01, ns
not significant, two-tailed significance levels.
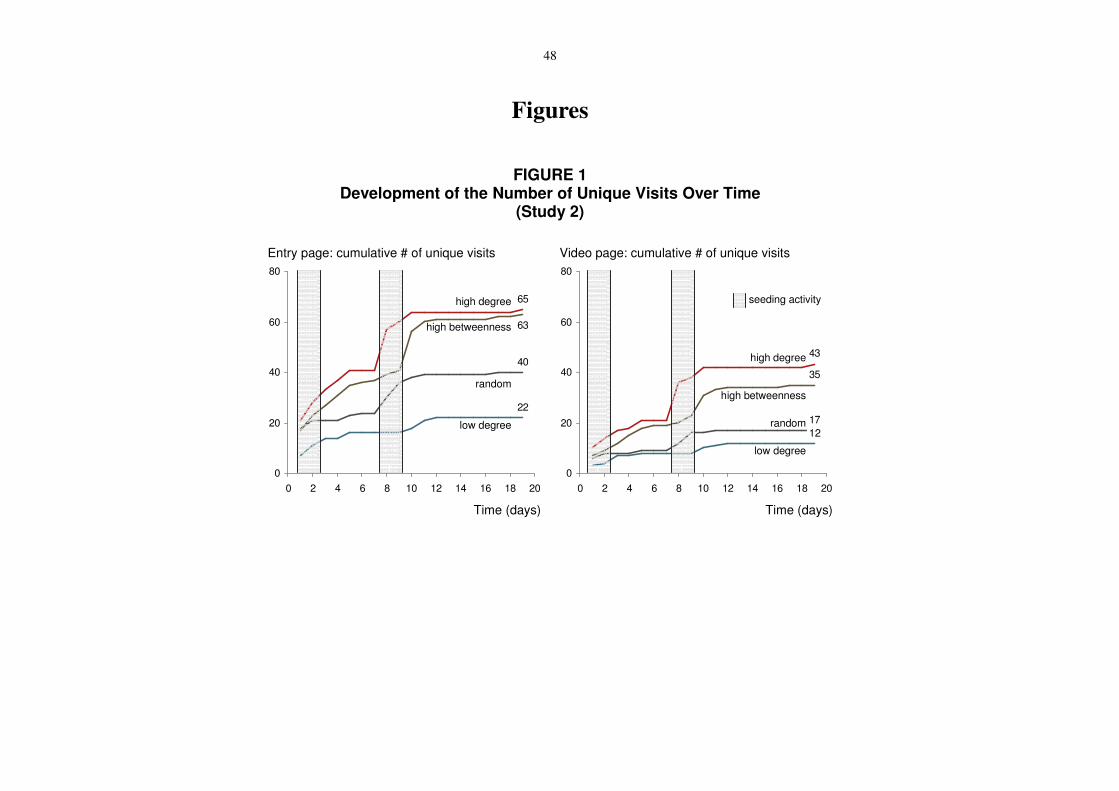
48
Figures
FIGURE 1
Development of the Number of Unique Visits Over Time (Study 2)
65
22
63
40
0
20
40
60
80
0 2 4 6 8 10 12 14 16 18 20
Entry page: cumulative # of unique visits
Time (days)
43
35
17
0
20
40
60
80
0 2 4 6 8 10 12 14 16 18 20
12
Time (days)
Video page: cumulative # of unique visits
seeding activityhigh degree
high betweenness
random
low degree
high degree
high betweenness
random
low degree
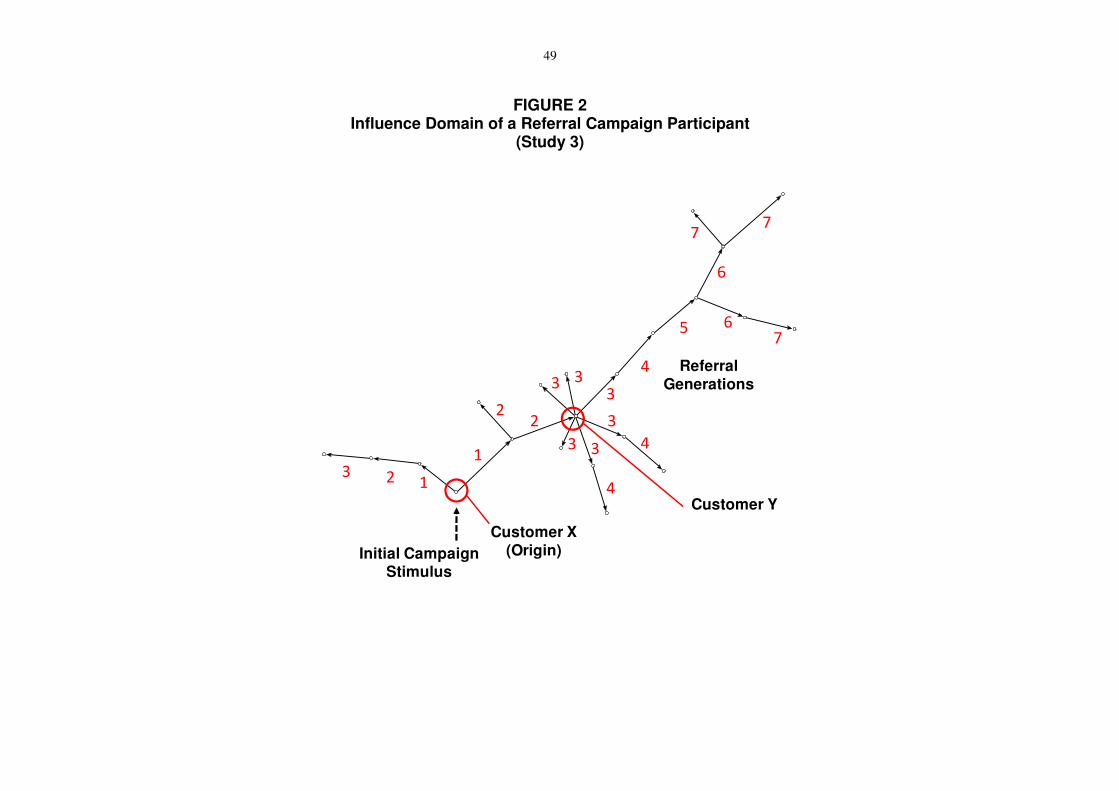
49
FIGURE 2 Influence Domain of a Referral Campaign Participant
(Study 3)
Initial CampaignStimulus
Customer X(Origin)
Customer Y
1
2
3
4
5
6
7
123
ReferralGenerations
2
33
3
3 3 4
4
6
7
7