zee entertainment enterprises - edelweiss research zee entertainment enterprises compelling...
TRANSCRIPT
ZEE Entertainment EnterprisesCompelling defensive stock available at a steal
Abneesh Roy Alankar Garude+91 22 6620 3141 +91 22 6623 3301b h @ d l l k d @ d l
J 2012
[email protected] [email protected]
June 2012
1
Key investment thesis
One of the best defensives: Sturdy free cash flow, net cash of ~INR10bn, minimal debt, secular growth story, two buy‐back offers
Digitisation to spur subscription revenues: Huge under‐declared subscriber base of ~75mnDigitisation to spur subscription revenues: Huge under declared subscriber base of 75mn is a big opportunity. NPV/share of ~INR73 from digitisation in spite of considering delays
MediaPro traction visible: MediaPro will increase bargaining power of ZEE aiding subscription revenue as has been visible in Q3FY12 and Q4FY12subscription revenue, as has been visible in Q3FY12 and Q4FY12.
Reduced dependency on ad revenues: Subscription revenues will increase to 56% in FY16 from current ~44% of ZEE’s total revenues
Most negatives discounted: Slowdown in ad revenue growth, delay in digitisation and sports losses are discounted in the current price
Likely to re‐rate: Limited scope for new entrants (two of the three new Hindi GEC entrants have shut shop) and 600bps surge likely in ROE post digitisation
Two‐year target price of INR244; One‐year target price of INR166
2
Positives being overlooked
Best amongst the defensive stocks
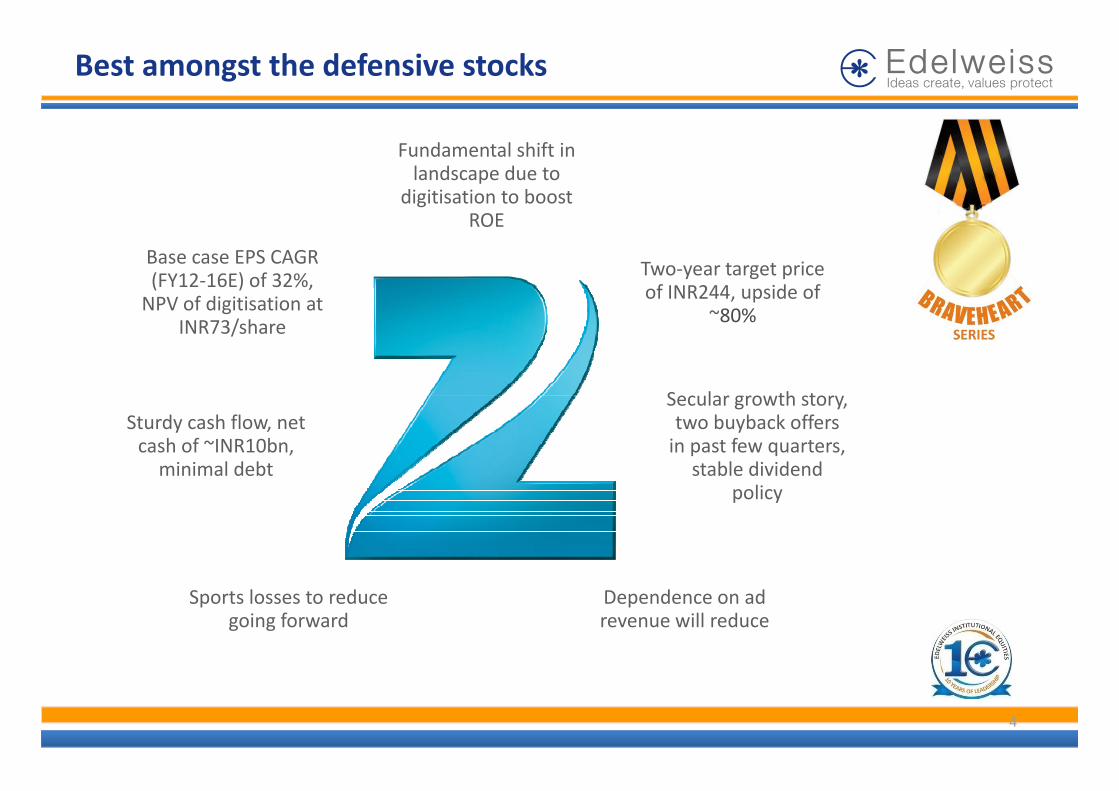
Fundamental shift in landscape due to
digitisation to boost ROEROE
Two‐year target price of INR244, upside of
Base case EPS CAGR (FY12‐16E) of 32%, NPV of digitisation at ~80%
Sec lar gro th stor
NPV of digitisation at INR73/share
Secular growth story, two buyback offers in past few quarters,
stable dividend li
Sturdy cash flow, net cash of ~INR10bn, minimal debt
policy
Dependence on ad revenue will reduce
Sports losses to reduce going forward
4
The digitisation story
Digitisation with addressability implies that there should be a set top box in every household.
We are of the opinion that it will provide a level playing field to all the stakeholders in the i d b d SO CO d b ibindustry—broadcasters, MSOs, LCOs and subscribers.
Apart from better quality signals, service, HD for the consumers, government is keen on putting check on rampant under‐declaration which is causing the government to lose ~INR50bn per year
Also, there will be enhanced transparency in business, which will reduce litigations and cut the necessity of regulatory interventions.
All key stakeholders (broadcasters, DTH providers, MSOs, government) are serious about the implementation of digitisation this time around, which was not the case earlier
~40% boxes seeded in Mumbai; ~60% of Hathway’s universe in Mumbai has been seeded40% boxes seeded in Mumbai; 60% of Hathway s universe in Mumbai has been seeded
I&B Minister Ms. Ambika Soni has said that the ministry will closely monitor the progress and issue warning letters if necessary.
Tickers are being shown on all channels at regular intervals to educate consumers about digitisation
Dependence on ad revenues of ZEE to reduce from ~52% in FY12 to ~41% in FY16Dependence on ad revenues of ZEE to reduce from 52% in FY12 to 41% in FY16
5
Digitisation to spur subscription revenue
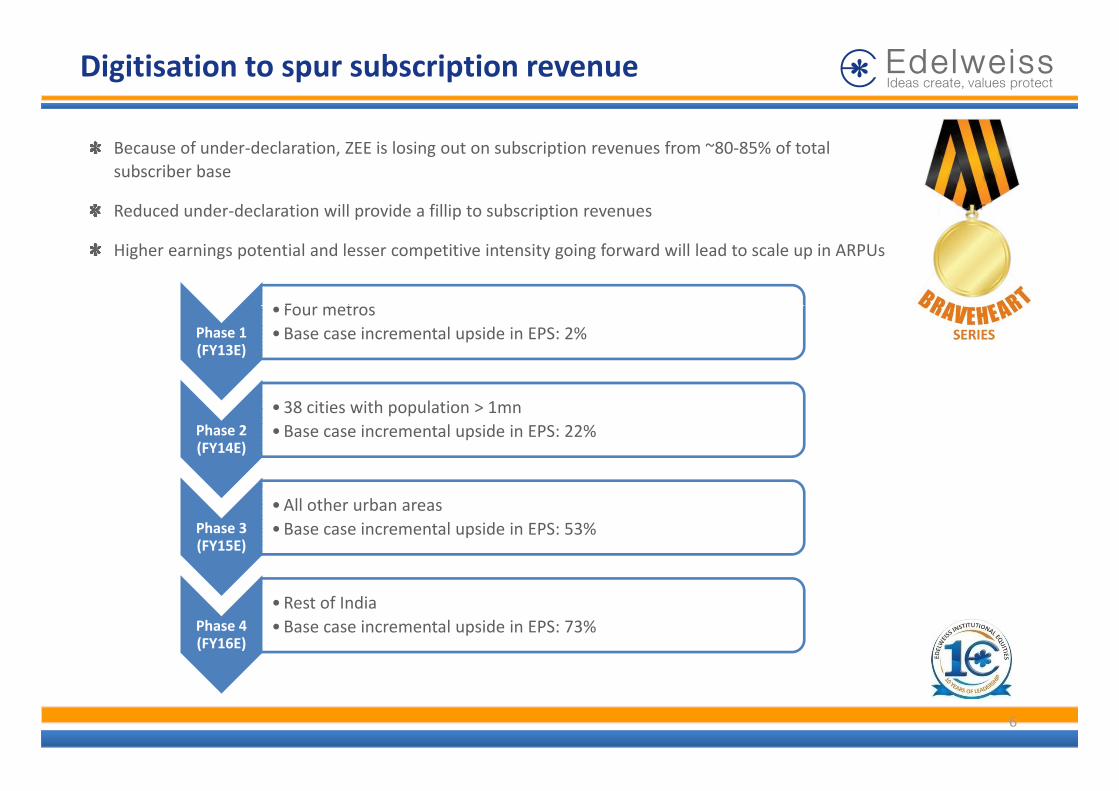
Because of under‐declaration, ZEE is losing out on subscription revenues from ~80‐85% of total subscriber base
Reduced under‐declaration will provide a fillip to subscription revenues
F t
Reduced under declaration will provide a fillip to subscription revenues
Higher earnings potential and lesser competitive intensity going forward will lead to scale up in ARPUs
Phase 1 (FY13E)
• Four metros•Base case incremental upside in EPS: 2%
Phase 2 (FY14E)
•38 cities with population > 1mn•Base case incremental upside in EPS: 22%
Phase 3 (FY15E)
•All other urban areas•Base case incremental upside in EPS: 53%
Phase 4 (FY16E)
•Rest of India•Base case incremental upside in EPS: 73%
6
Post‐digitisation scenario analysis
Methodology of our post‐digitisation analysis
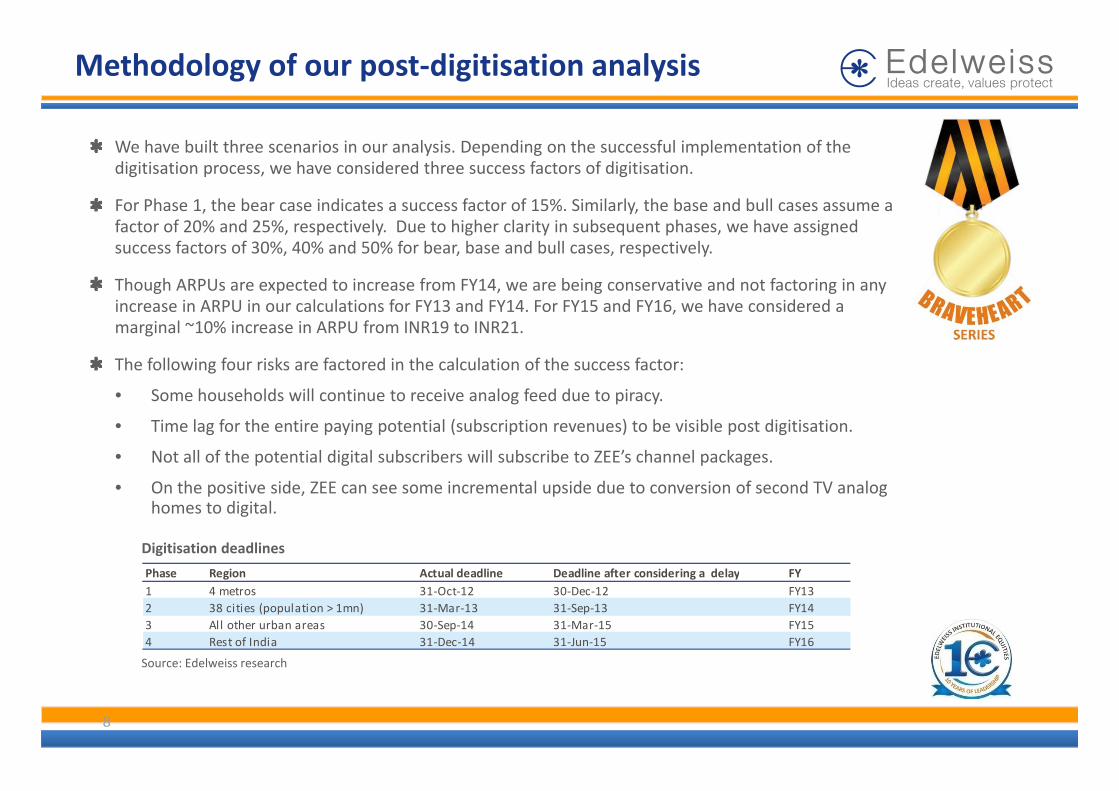
We have built three scenarios in our analysis. Depending on the successful implementation of the digitisation process, we have considered three success factors of digitisation.
For Phase 1, the bear case indicates a success factor of 15%. Similarly, the base and bull cases assume a factor of 20% and 25%, respectively. Due to higher clarity in subsequent phases, we have assigned success factors of 30%, 40% and 50% for bear, base and bull cases, respectively.
Though ARPUs are expected to increase from FY14, we are being conservative and not factoring in any increase in ARPU in our calculations for FY13 and FY14 For FY15 and FY16 we have considered aincrease in ARPU in our calculations for FY13 and FY14. For FY15 and FY16, we have considered a marginal ~10% increase in ARPU from INR19 to INR21.
The following four risks are factored in the calculation of the success factor:
• Some households will continue to receive analog feed due to piracy• Some households will continue to receive analog feed due to piracy.
• Time lag for the entire paying potential (subscription revenues) to be visible post digitisation.
• Not all of the potential digital subscribers will subscribe to ZEE’s channel packages.
• On the positive side ZEE can see some incremental upside due to conversion of second TV analog• On the positive side, ZEE can see some incremental upside due to conversion of second TV analog homes to digital.
Digitisation deadlines
Phase Region Actual deadline Deadline after considering a delay FY
Source: Edelweiss research
Phase Region Actual deadline Deadline after considering a delay FY1 4 metros 31‐Oct‐12 30‐Dec‐12 FY132 38 cities (population > 1mn) 31‐Mar‐13 31‐Sep‐13 FY143 All other urban areas 30‐Sep‐14 31‐Mar‐15 FY154 Rest of India 31‐Dec‐14 31‐Jun‐15 FY16
8
Source: Edelweiss research
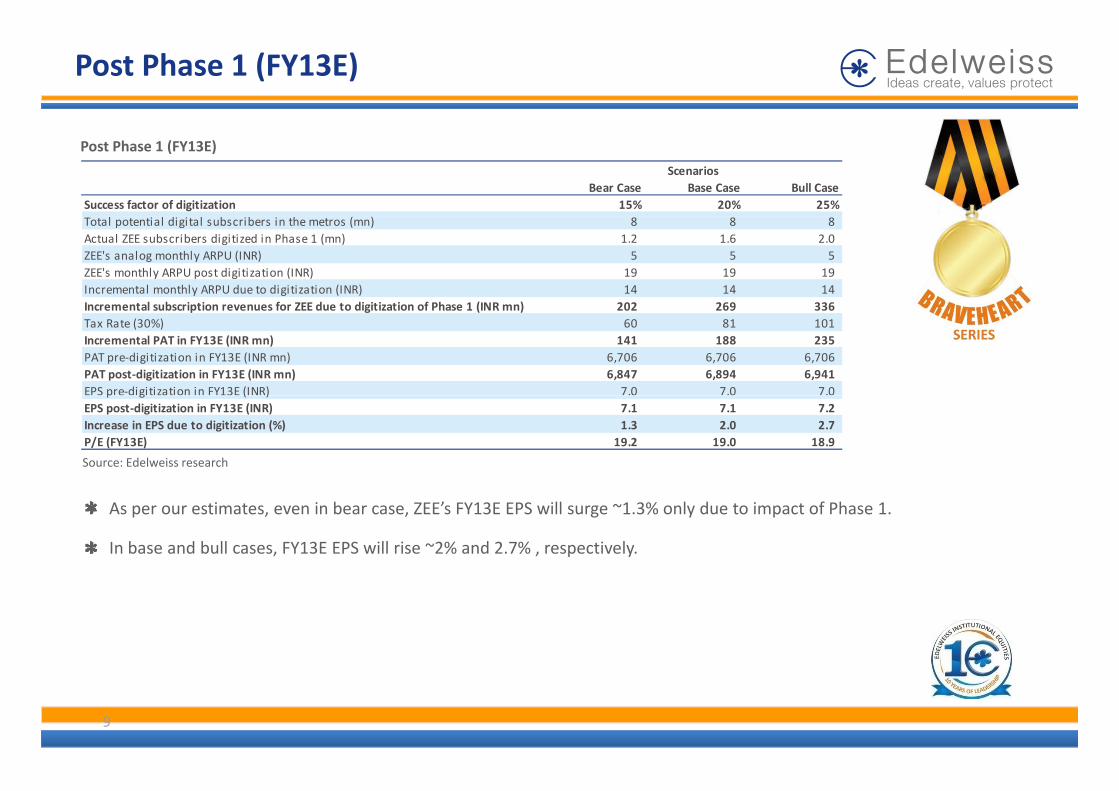
Post Phase 1 (FY13E)
Post Phase 1 (FY13E)
Bear Case Base Case Bull CaseSuccess factor of digitization 15% 20% 25%
Scenarios
Total potential digital subscribers in the metros (mn) 8 8 8Actual ZEE subscribers digitized in Phase 1 (mn) 1.2 1.6 2.0ZEE's analog monthly ARPU (INR) 5 5 5ZEE's monthly ARPU post digitization (INR) 19 19 19Incremental monthly ARPU due to digitization (INR) 14 14 14Incremental subscription revenues for ZEE due to digitization of Phase 1 (INR mn) 202 269 336Incremental subscription revenues for ZEE due to digitization of Phase 1 (INR mn) 202 269 336Tax Rate (30%) 60 81 101Incremental PAT in FY13E (INR mn) 141 188 235PAT pre‐digitization in FY13E (INR mn) 6,706 6,706 6,706PAT post‐digitization in FY13E (INR mn) 6,847 6,894 6,941EPS pre‐digitization in FY13E (INR) 7.0 7.0 7.0
Source: Edelweiss research
p g ( )EPS post‐digitization in FY13E (INR) 7.1 7.1 7.2Increase in EPS due to digitization (%) 1.3 2.0 2.7P/E (FY13E) 19.2 19.0 18.9
As per our estimates, even in bear case, ZEE’s FY13E EPS will surge ~1.3% only due to impact of Phase 1.
In base and bull cases, FY13E EPS will rise ~2% and 2.7% , respectively.
9
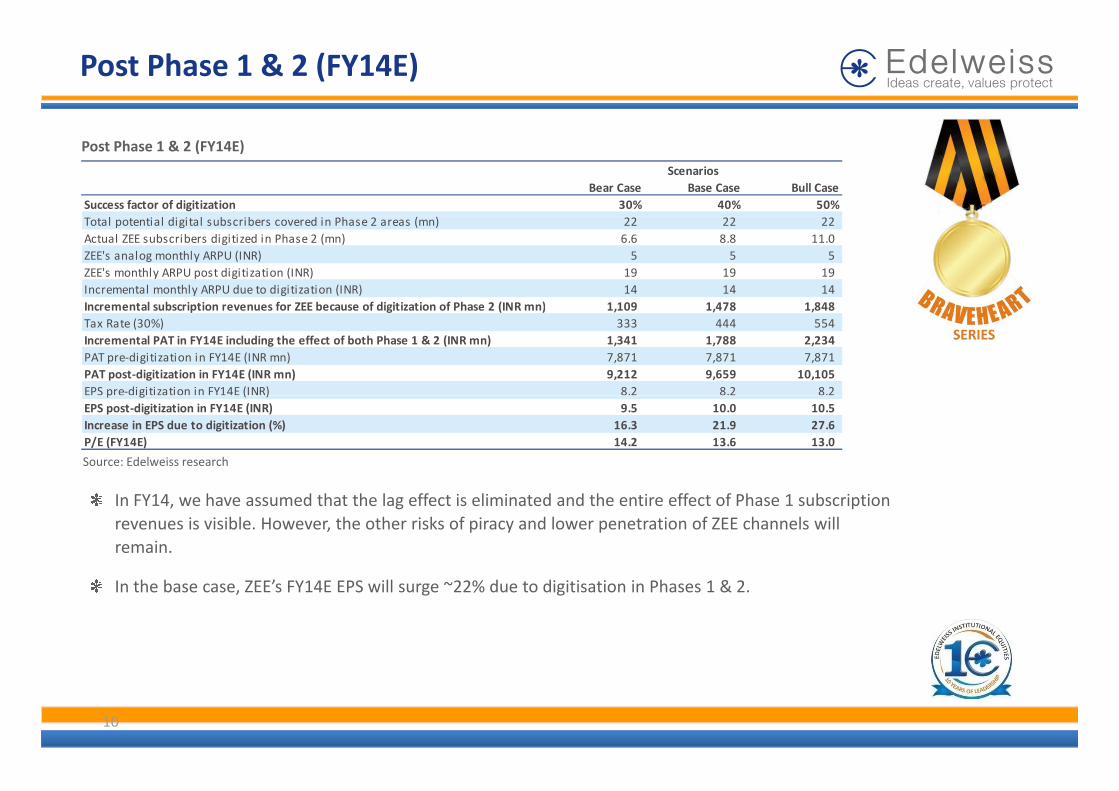
Post Phase 1 & 2 (FY14E)
Post Phase 1 & 2 (FY14E)
Bear Case Base Case Bull CaseSuccess factor of digitization 30% 40% 50%
Scenarios
Total potential digital subscribers covered in Phase 2 areas (mn) 22 22 22Actual ZEE subscribers digitized in Phase 2 (mn) 6.6 8.8 11.0ZEE's analog monthly ARPU (INR) 5 5 5ZEE's monthly ARPU post digitization (INR) 19 19 19Incremental monthly ARPU due to digitization (INR) 14 14 14Incremental subscription revenues for ZEE because of digitization of Phase 2 (INR mn) 1 109 1 478 1 848Incremental subscription revenues for ZEE because of digitization of Phase 2 (INR mn) 1,109 1,478 1,848Tax Rate (30%) 333 444 554Incremental PAT in FY14E including the effect of both Phase 1 & 2 (INR mn) 1,341 1,788 2,234PAT pre‐digitization in FY14E (INR mn) 7,871 7,871 7,871PAT post‐digitization in FY14E (INR mn) 9,212 9,659 10,105EPS pre‐digitization in FY14E (INR) 8.2 8.2 8.2
Source: Edelweiss research
p g ( )EPS post‐digitization in FY14E (INR) 9.5 10.0 10.5Increase in EPS due to digitization (%) 16.3 21.9 27.6P/E (FY14E) 14.2 13.6 13.0
In FY14, we have assumed that the lag effect is eliminated and the entire effect of Phase 1 subscription revenues is visible. However, the other risks of piracy and lower penetration of ZEE channels will remain.
In the base case, ZEE’s FY14E EPS will surge ~22% due to digitisation in Phases 1 & 2.
10

Post Phase 1, 2 & 3 (FY15E)
Post Phase 1, 2 & 3 (FY15E)
Bear Case Base Case Bull CaseSuccess factor of digitization 30% 40% 50%
l l d l b b d h ( )
Scenarios
Total potential digital subscribers covered in Phase 3 areas (mn) 30 30 30Actual ZEE subscribers digitized in Phase 3 (mn) 9.0 12.0 15.0ZEE's analog monthly ARPU (INR) 5 5 5ZEE's monthly ARPU post digitization (INR) 21 21 21Incremental monthly ARPU due to digitization (INR) 16 16 16Incremental subscription revenues for ZEE because of digitization of Phase 3 (INR mn) 1 728 2 304 2 880Incremental subscription revenues for ZEE because of digitization of Phase 3 (INR mn) 1,728 2,304 2,880Tax Rate (30%) 518 691 864Incremental PAT in FY15E including the effect of both Phase 1, 2 & 3 (INR mn) 3,629 4,838 6,048PAT pre‐digitization in FY15E (INR mn) 9,033 9,033 9,033PAT post‐digitization in FY15E (INR mn) 12,662 13,871 15,081EPS pre‐digitization in FY15E (INR) 9.4 9.4 9.4
Source: Edelweiss research
p g ( )EPS post‐digitization in FY15E (INR) 13.1 14.4 15.6Increase in EPS due to digitization (%) 39.6 52.9 66.3P/E (FY15E) 10.4 9.5 8.7
Phase 3 mandates digitisation of all urban areas other than those covered under Phase 1 & 2. In FY15, we have assumed that the entire subscription revenues from Phase 1 and 2 areas are visible.
In the base case, ZEE’s FY15E EPS will soar ~53% due to digitisation in Phases 1, 2 & 3.
11
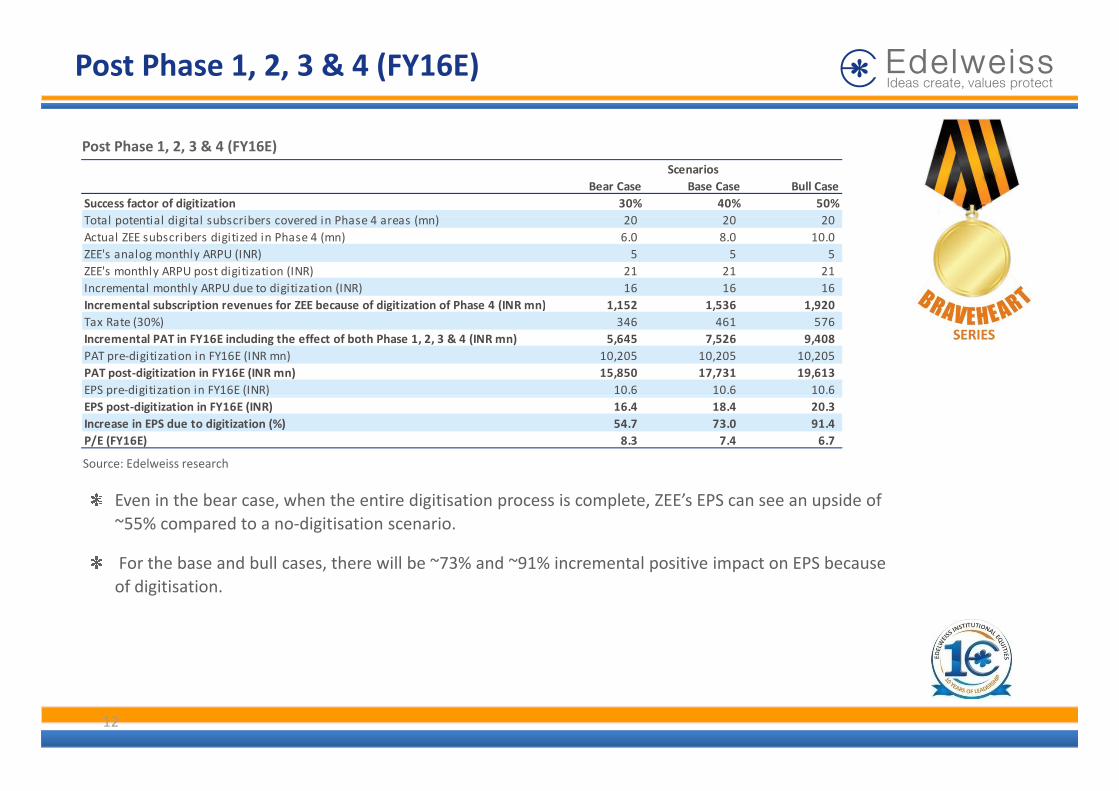
Post Phase 1, 2, 3 & 4 (FY16E)
Post Phase 1, 2, 3 & 4 (FY16E)
Bear Case Base Case Bull CaseSuccess factor of digitization 30% 40% 50%
l i l di i l b ib d i h 4 ( ) 20 20 20
Scenarios
Total potential digital subscribers covered in Phase 4 areas (mn) 20 20 20Actual ZEE subscribers digitized in Phase 4 (mn) 6.0 8.0 10.0ZEE's analog monthly ARPU (INR) 5 5 5ZEE's monthly ARPU post digitization (INR) 21 21 21Incremental monthly ARPU due to digitization (INR) 16 16 16Incremental subscription revenues for ZEE because of digitization of Phase 4 (INR mn) 1 152 1 536 1 920Incremental subscription revenues for ZEE because of digitization of Phase 4 (INR mn) 1,152 1,536 1,920Tax Rate (30%) 346 461 576Incremental PAT in FY16E including the effect of both Phase 1, 2, 3 & 4 (INR mn) 5,645 7,526 9,408PAT pre‐digitization in FY16E (INR mn) 10,205 10,205 10,205PAT post‐digitization in FY16E (INR mn) 15,850 17,731 19,613EPS pre‐digitization in FY16E (INR) 10.6 10.6 10.6
Source: Edelweiss research
p g ( )EPS post‐digitization in FY16E (INR) 16.4 18.4 20.3Increase in EPS due to digitization (%) 54.7 73.0 91.4P/E (FY16E) 8.3 7.4 6.7
Even in the bear case, when the entire digitisation process is complete, ZEE’s EPS can see an upside of ~55% compared to a no‐digitisation scenario.
For the base and bull cases, there will be ~73% and ~91% incremental positive impact on EPS because of digitisation.
12
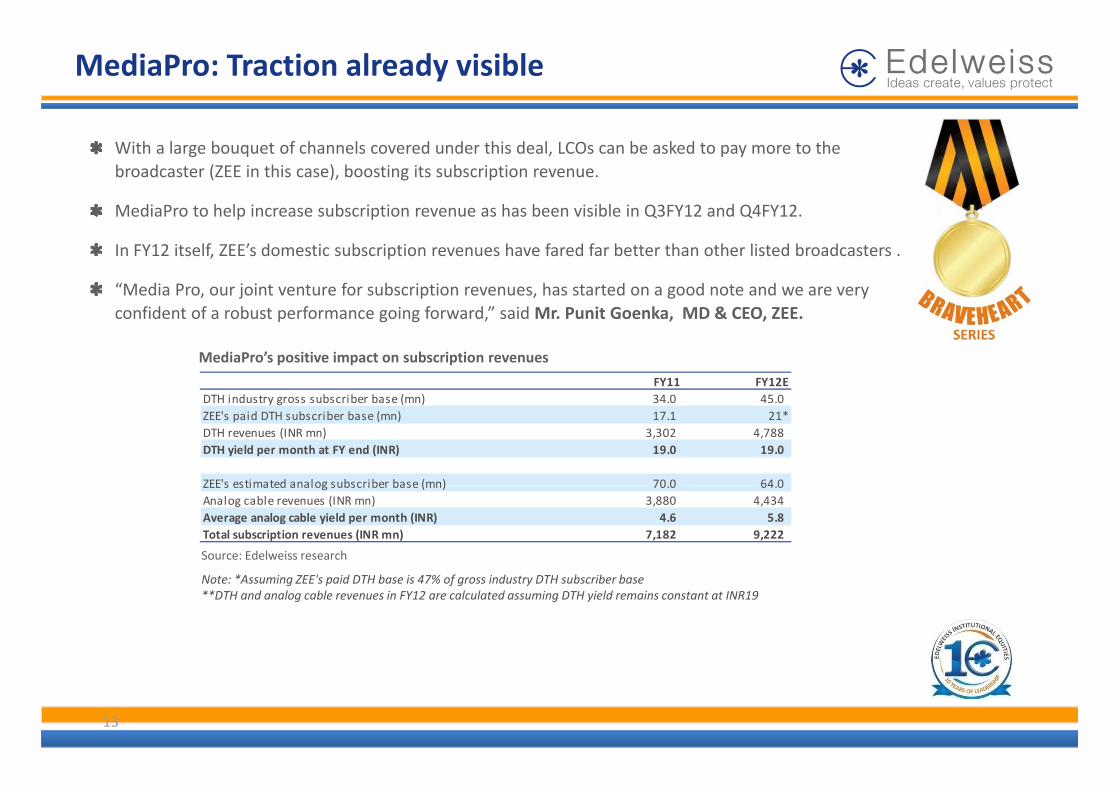
MediaPro: Traction already visible
With a large bouquet of channels covered under this deal, LCOs can be asked to pay more to the broadcaster (ZEE in this case), boosting its subscription revenue.
MediaPro to help increase subscription revenue as has been visible in Q3FY12 and Q4FY12.MediaPro to help increase subscription revenue as has been visible in Q3FY12 and Q4FY12.
In FY12 itself, ZEE’s domestic subscription revenues have fared far better than other listed broadcasters .
“Media Pro, our joint venture for subscription revenues, has started on a good note and we are very confident of a robust performance going forward,” said Mr. Punit Goenka, MD & CEO, ZEE.
MediaPro’s positive impact on subscription revenues
FY11 FY12EDTH i d t b ib b ( ) 34 0 45 0DTH industry gross subscriber base (mn) 34.0 45.0ZEE's paid DTH subscriber base (mn) 17.1 21*DTH revenues (INR mn) 3,302 4,788DTH yield per month at FY end (INR) 19.0 19.0
ZEE's estimated analog subscriber base (mn) 70 0 64 0
N *A i ZEE' id DTH b i 47% f i d DTH b ib b
Source: Edelweiss research
ZEE s estimated analog subscriber base (mn) 70.0 64.0Analog cable revenues (INR mn) 3,880 4,434Average analog cable yield per month (INR) 4.6 5.8Total subscription revenues (INR mn) 7,182 9,222
Note: *Assuming ZEE's paid DTH base is 47% of gross industry DTH subscriber base**DTH and analog cable revenues in FY12 are calculated assuming DTH yield remains constant at INR19
13
Reduced dependence on ad revenue going forward
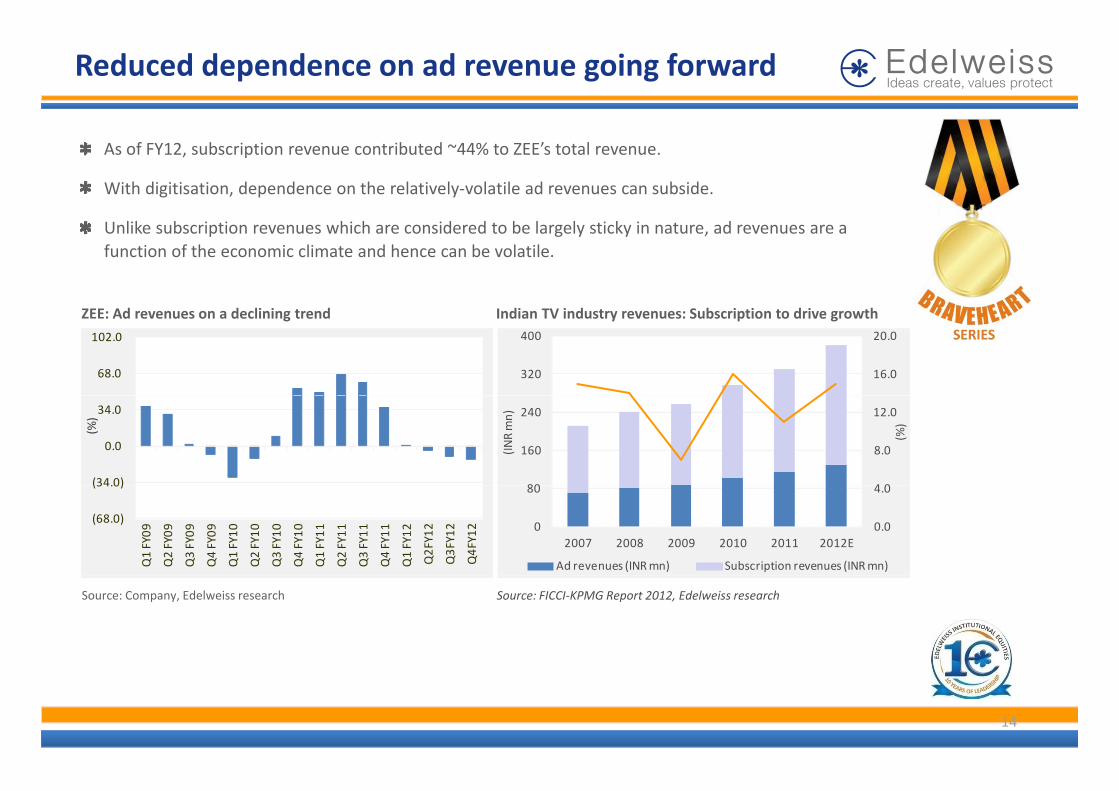
As of FY12, subscription revenue contributed ~44% to ZEE’s total revenue.
With digitisation, dependence on the relatively‐volatile ad revenues can subside.
Unlike subscription revenues which are considered to be largely sticky in nature, ad revenues are a function of the economic climate and hence can be volatile.
Indian TV industry revenues: Subscription to drive growthZEE: Ad revenues on a declining trend
68.0
102.0
16.0
20.0
320
400
(34.0)
0.0
34.0
(%)
4 0
8.0
12.0
80
160
240
(%)
(INR mn)
(68.0)
(34.0)
Q1 FY09
Q2 FY09
Q3 FY09
Q4 FY09
Q1 FY10
Q2 FY10
Q3 FY10
Q4 FY10
Q1 FY11
Q2 FY11
Q3 FY11
Q4 FY11
Q1 FY12
Q2FY12
Q3FY12
Q4FY12 0.0
4.0
0
80
2007 2008 2009 2010 2011 2012E
Ad revenues (INR mn) Subscription revenues (INR mn)
Source: FICCI‐KPMG Report 2012, Edelweiss researchSource: Company, Edelweiss research
14
Post‐digitisation, focus will be on ARPU
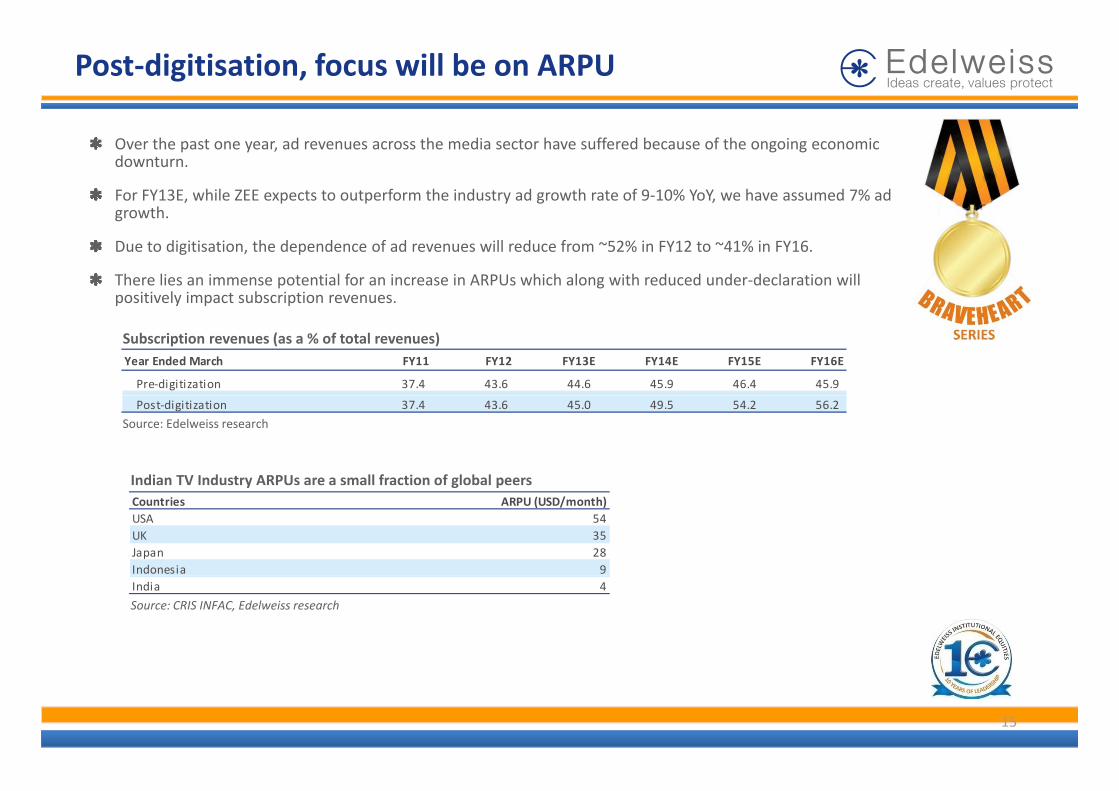
Over the past one year, ad revenues across the media sector have suffered because of the ongoing economic downturn.
For FY13E, while ZEE expects to outperform the industry ad growth rate of 9‐10% YoY, we have assumed 7% ad growthgrowth.
Due to digitisation, the dependence of ad revenues will reduce from ~52% in FY12 to ~41% in FY16.
There lies an immense potential for an increase in ARPUs which along with reduced under‐declaration will positively impact subscription revenues.
Subscription revenues (as a % of total revenues)
p y p p
Year Ended March FY11 FY12 FY13E FY14E FY15E FY16E
Pre‐digitization 37.4 43.6 44.6 45.9 46.4 45.9
Source: Edelweiss researchPost‐digitization 37.4 43.6 45.0 49.5 54.2 56.2
Indian TV Industry ARPUs are a small fraction of global peersy g pCountries ARPU (USD/month)USA 54UK 35Japan 28Indonesia 9
Source: CRIS INFAC, Edelweiss researchIndia 4
15
Investments in content will bear fruits in the long run
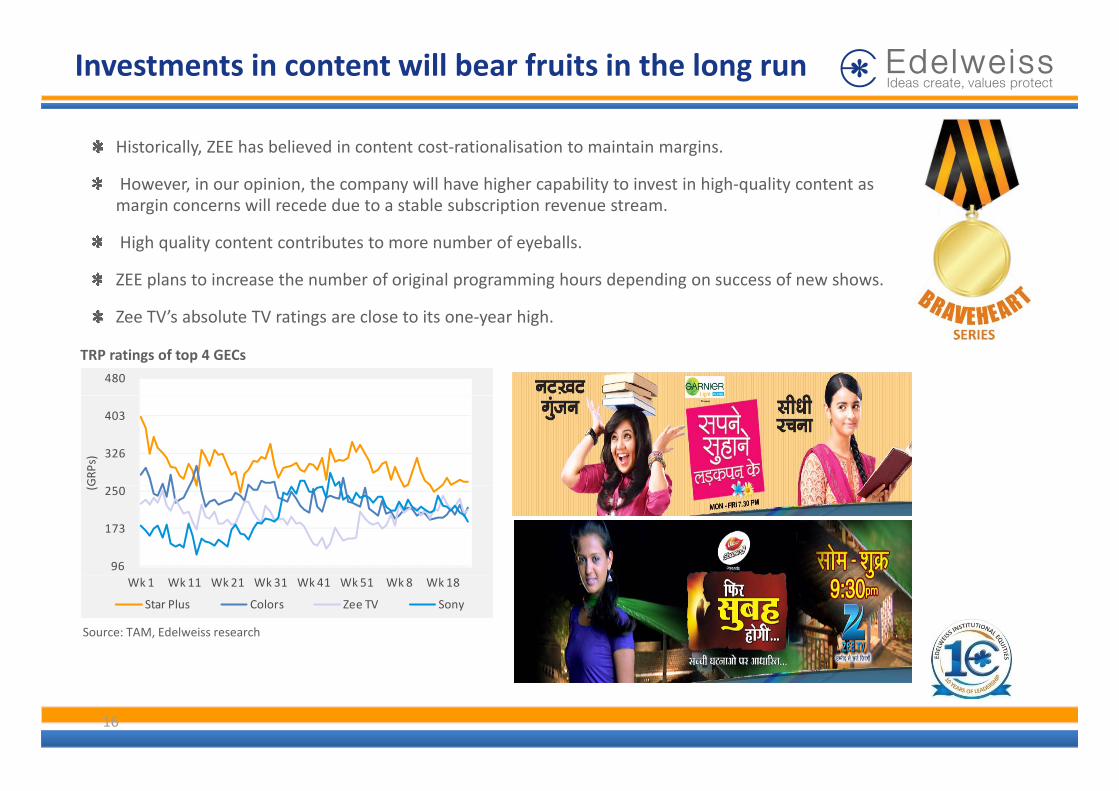
Historically, ZEE has believed in content cost‐rationalisation to maintain margins.
However, in our opinion, the company will have higher capability to invest in high‐quality content as margin concerns will recede due to a stable subscription revenue stream.
High quality content contributes to more number of eyeballs.
ZEE plans to increase the number of original programming hours depending on success of new shows.
Zee TV’s absolute TV ratings are close to its one‐year high.
TRP ratings of top 4 GECs480
326
403
GRP
s)
96
173
250 (G
Source: TAM, Edelweiss research
Wk 1 Wk 11 Wk 21 Wk 31 Wk 41 Wk 51 Wk 8 Wk 18
Star Plus Colors Zee TV Sony
16
ZEE vs. Sun TV: Subscription the key differentiator
ZEE’s domestic subscription revenue grew ~23% YoY in Q3FY12 and ~22% YoY in Q4FY12 (FY12 financials are not comparable to FY11 due to change in accounting treatment; growth rates only indicate jump in subscription revenues due to MediaPro).
ZEE has outperformed Sun TV considerably as far as domestic subscription revenues are considered in FY12, which partly indicates the positive impact of MediaPro.
Apart from the Arasu issue, Sun TV has also been suffering because of a fall in market share and other p gregulatory and political issues In comparison, though Sun TV’s DTH subscription revenues grew ~15% YoY in FY12, the sequential growth in Q4FY12 has been disappointing at ~2.4%.
Sun TV’s domestic subscription revenue has declined ~8% and ~15% YoY in the past two quarters, respectively. However, it has to be noted that a major reason for the degrowth for Sun TV was lack of subscription deal with Arasu Cable.
17
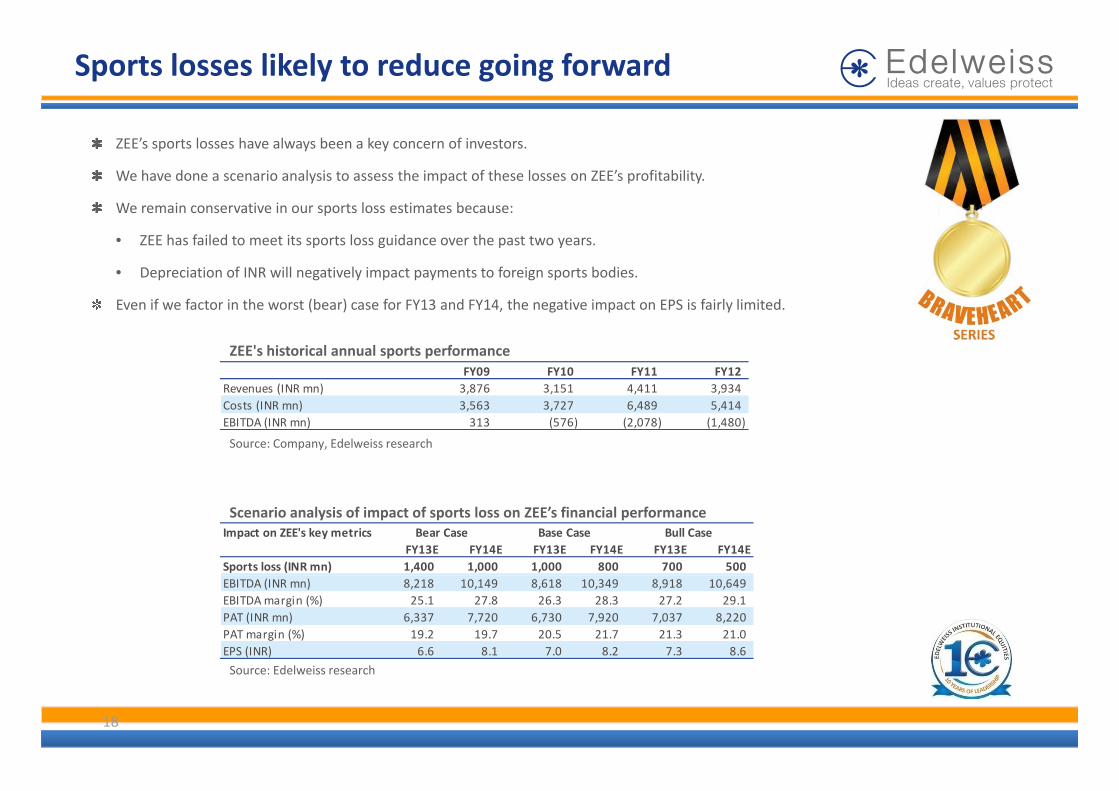
Sports losses likely to reduce going forward
ZEE’s sports losses have always been a key concern of investors.
We have done a scenario analysis to assess the impact of these losses on ZEE’s profitability.
We remain conservative in our sports loss estimates because:
• ZEE has failed to meet its sports loss guidance over the past two years.
• Depreciation of INR will negatively impact payments to foreign sports bodies.
Even if we factor in the worst (bear) case for FY13 and FY14 the negative impact on EPS is fairly limitedEven if we factor in the worst (bear) case for FY13 and FY14, the negative impact on EPS is fairly limited.
ZEE's historical annual sports performanceFY09 FY10 FY11 FY12
Revenues (INR mn) 3,876 3,151 4,411 3,934
Source: Company, Edelweiss research
Costs (INR mn) 3,563 3,727 6,489 5,414EBITDA (INR mn) 313 (576) (2,078) (1,480)
Scenario analysis of impact of sports loss on ZEE’s financial performance Impact on ZEE's key metrics
FY13E FY14E FY13E FY14E FY13E FY14ESports loss (INR mn) 1,400 1,000 1,000 800 700 500
Bull CaseBase CaseBear Case
EBITDA (INR mn) 8,218 10,149 8,618 10,349 8,918 10,649EBITDA margin (%) 25.1 27.8 26.3 28.3 27.2 29.1PAT (INR mn) 6,337 7,720 6,730 7,920 7,037 8,220PAT margin (%) 19.2 19.7 20.5 21.7 21.3 21.0EPS (INR) 6.6 8.1 7.0 8.2 7.3 8.6
18
Source: Edelweiss research
International sub‐revenues to be a key revenue stream
ZEE has presence across 5 continents through over 22 beams.
ZEE is now increasingly focusing on increasing its overseas revenues.
Currently, it reaches 550mn subscribers globally and aims to reach 1bn subscribers in the next 3‐5 years. ZEE has recently launched local language content in Russia, South East Asia and Saudi Arabia.
The company also became the first Indian broadcaster to receive landing rights in China.
After the success of Zee Aflam, which offers dubbed content in Arabic, ZEE is launching a second Arabic h l Z Alchannel Zee Alwan.
ZEE now plans to launch localised content in foreign markets and along with the subscription revenue stream wants to cash in on ad revenues in foreign markets as well.
“Now, we are increasingly focused on the global market. Currently, we reach 550mn people. In the next three to five years, we should reach a billion people. Eventually, we must reach one‐third of humanity,” saysMr Punit Goenka MD & CEO ZEEsays Mr. Punit Goenka, MD & CEO, ZEE.
19
Ditto TV: Aiming for the future
In March 2012, ZEE launched Ditto TV, an over‐the‐top (OTT) television distribution platform, to provide paid entertainment content on portable mobile devices.
Initially Ditto TV will offer 21 channels across various genres which will increase to 100 channels tillInitially, Ditto TV will offer 21 channels across various genres which will increase to 100 channels till FY13 end.
ZEE targets acquiring a subscriber base of 1mn active users for mobile TV and plans to target the ~6mn ti 3G b i I diactive 3G user base in India.
As per Mr. Punit Goenka, in the long run, Ditto TV will contribute ~10% to ZEE’s total revenue.
ZEE is planning to launch Ditto TV in other countries as wellZEE is planning to launch Ditto TV in other countries as well.
According to PWC, India will have 176mn OTT viewers by 2015, generating revenue of USD552mn. PWC estimates that 33% of Indian smartphone users will watch TV on their smart phones.
20

Most negatives already priced in
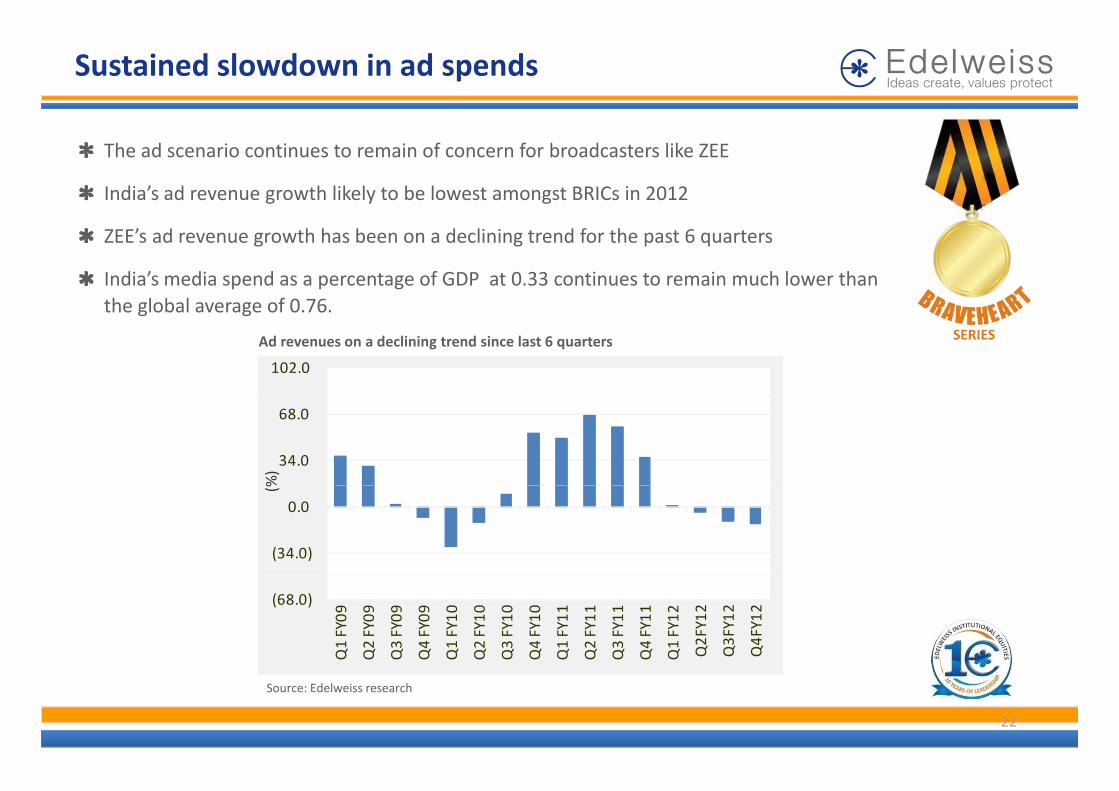
Sustained slowdown in ad spends
The ad scenario continues to remain of concern for broadcasters like ZEE
India’s ad revenue growth likely to be lowest amongst BRICs in 2012
ZEE’s ad revenue growth has been on a declining trend for the past 6 quarters
India’s media spend as a percentage of GDP at 0.33 continues to remain much lower than the global average of 0 76the global average of 0.76.
102.0
Ad revenues on a declining trend since last 6 quarters
34.0
68.0
%)
(34.0)
0.0
(%
(68.0)
Q1 FY09
Q2 FY09
Q3 FY09
Q4 FY09
Q1 FY10
Q2 FY10
Q3 FY10
Q4 FY10
Q1 FY11
Q2 FY11
Q3 FY11
Q4 FY11
Q1 FY12
Q2FY12
Q3FY12
Q4FY12
22
Source: Edelweiss research
Sports losses refuse to abate
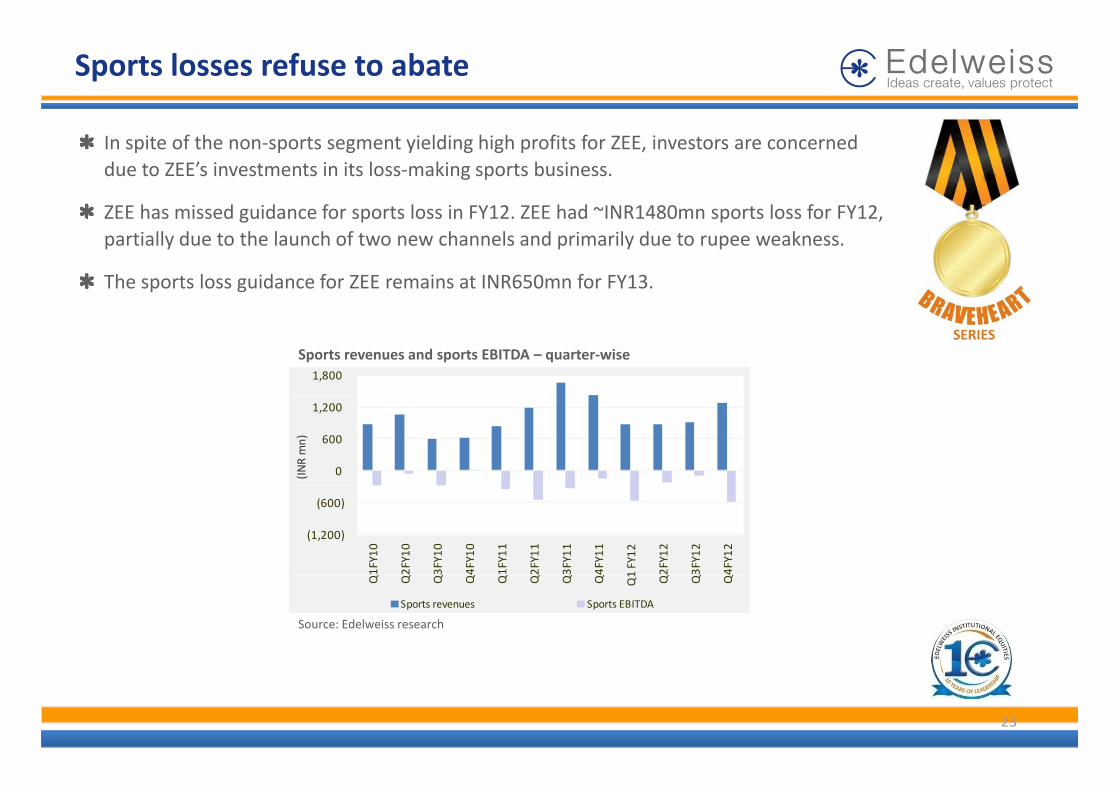
In spite of the non‐sports segment yielding high profits for ZEE, investors are concerned due to ZEE’s investments in its loss‐making sports business.
ZEE has missed guidance for sports loss in FY12 ZEE had ~INR1480mn sports loss for FY12ZEE has missed guidance for sports loss in FY12. ZEE had INR1480mn sports loss for FY12, partially due to the launch of two new channels and primarily due to rupee weakness.
The sports loss guidance for ZEE remains at INR650mn for FY13.
Sports revenues and sports EBITDA – quarter‐wise1,800
0
600
1,200
(INR mn)
(1,200)
(600)
Q1FY10
Q2FY10
Q3FY10
Q4FY10
Q1FY11
Q2FY11
Q3FY11
Q4FY11
1 FY12
Q2FY12
Q3FY12
Q4FY12
Source: Edelweiss research
Q Q Q Q Q Q Q Q Q1 Q Q Q
Sports revenues Sports EBITDA
23
Further delay in digitisation likely
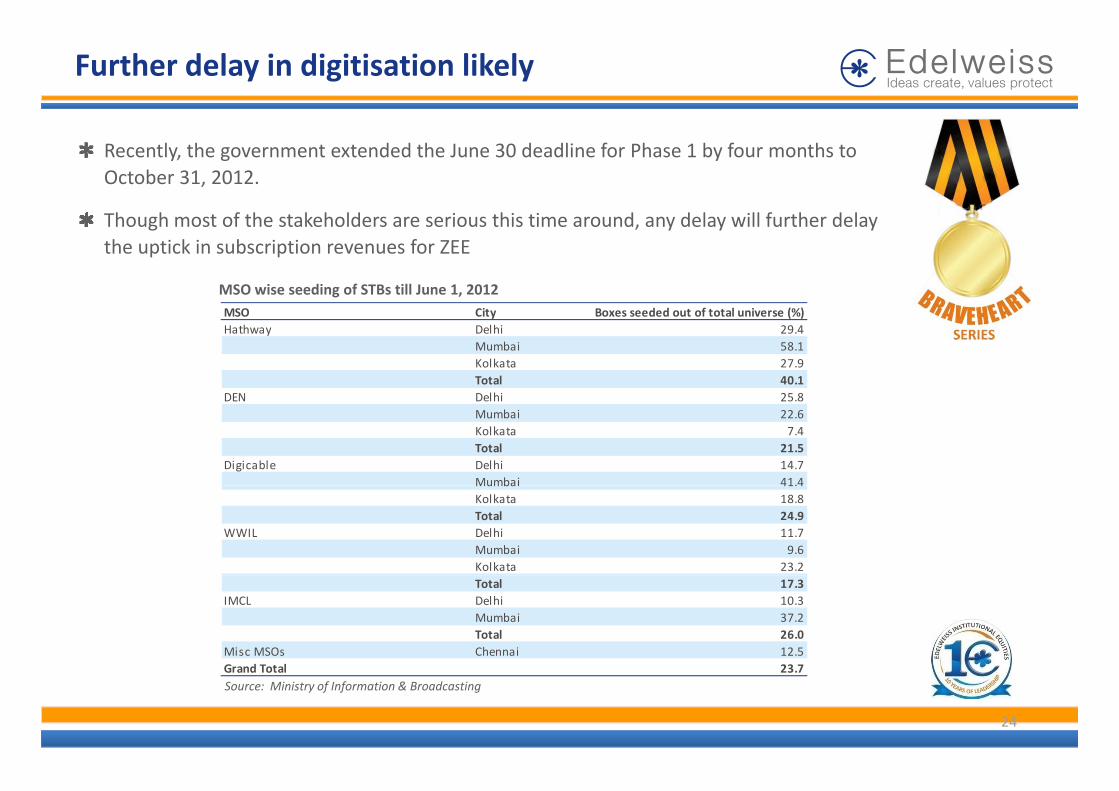
Recently, the government extended the June 30 deadline for Phase 1 by four months to October 31, 2012.
Th h t f th t k h ld i thi ti d d l ill f th d lThough most of the stakeholders are serious this time around, any delay will further delay the uptick in subscription revenues for ZEE
MSO wise seeding of STBs till June 1, 2012 MSO City Boxes seeded out of total universe (%)Hathway Delhi 29.4
Mumbai 58.1Kolkata 27.9Total 40.1
DEN Delhi 25 8DEN Delhi 25.8Mumbai 22.6Kolkata 7.4Total 21.5
Digicable Delhi 14.7Mumbai 41.4Mumbai 41.4Kolkata 18.8Total 24.9
WWIL Delhi 11.7Mumbai 9.6Kolkata 23.2Total 17.3
IMCL Delhi 10.3Mumbai 37.2Total 26.0
Misc MSOs Chennai 12.5G d T l 23 7
24
Source: Ministry of Information & BroadcastingGrand Total 23.7
Outlook and Valuations: Future Beaming
Valuation: Upside potential is enticing
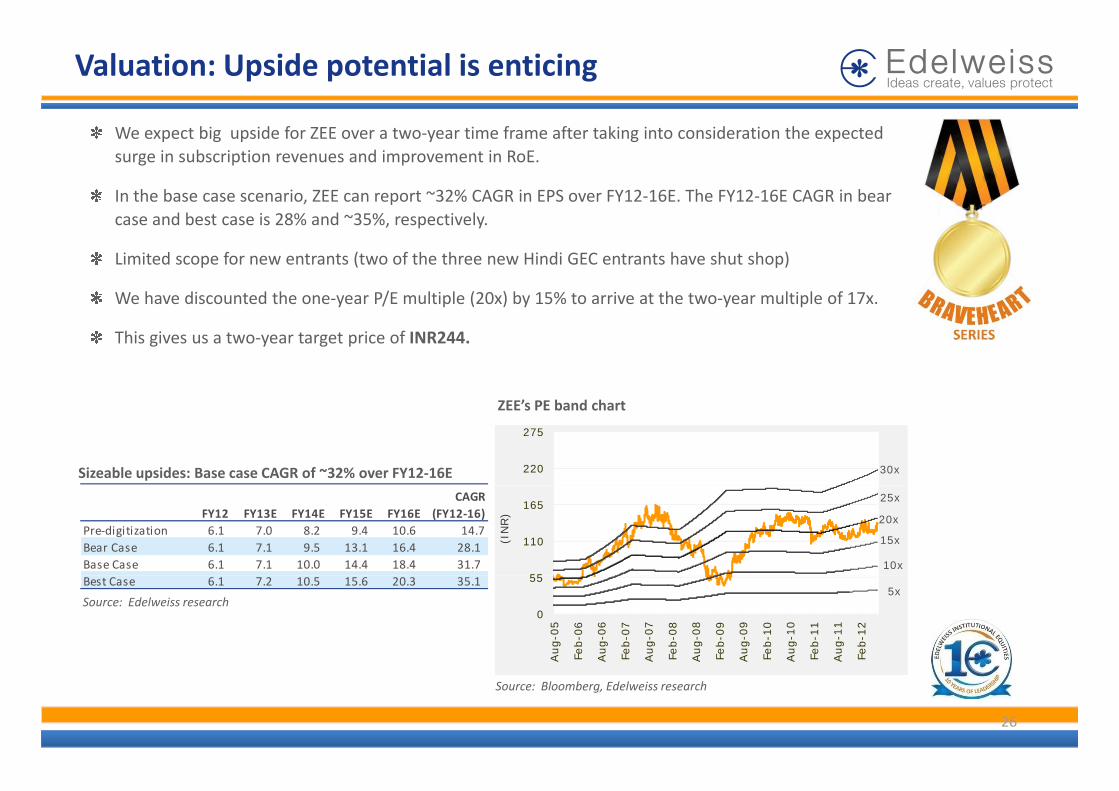
b d f f f k d h dWe expect big upside for ZEE over a two‐year time frame after taking into consideration the expected surge in subscription revenues and improvement in RoE.
In the base case scenario, ZEE can report ~32% CAGR in EPS over FY12‐16E. The FY12‐16E CAGR in bear d b t i 28% d ~35% ti lcase and best case is 28% and ~35%, respectively.
Limited scope for new entrants (two of the three new Hindi GEC entrants have shut shop)
We have discounted the one‐year P/E multiple (20x) by 15% to arrive at the two‐year multiple of 17x. y / p ( ) y y p
This gives us a two‐year target price of INR244.
ZEE’s PE band chart
Sizeable upsides: Base case CAGR of ~32% over FY12‐16E 220
275
30x
55
110
165(I
NR
)
10x
15x
25x
20xFY12 FY13E FY14E FY15E FY16ECAGR
(FY12‐16)Pre‐digitization 6.1 7.0 8.2 9.4 10.6 14.7 Bear Case 6.1 7.1 9.5 13.1 16.4 28.1 Base Case 6.1 7.1 10.0 14.4 18.4 31.7
Source: Edelweiss research0
55
Aug-0
5
Feb-0
6
Aug-0
6
Feb-0
7
Aug-0
7
Feb-0
8
Aug-0
8
Feb-0
9
Aug-0
9
Feb-1
0
Aug-1
0
Feb-1
1
Aug-1
1
Feb-1
2
5xBest Case 6.1 7.2 10.5 15.6 20.3 35.1
26
Source: Bloomberg, Edelweiss research
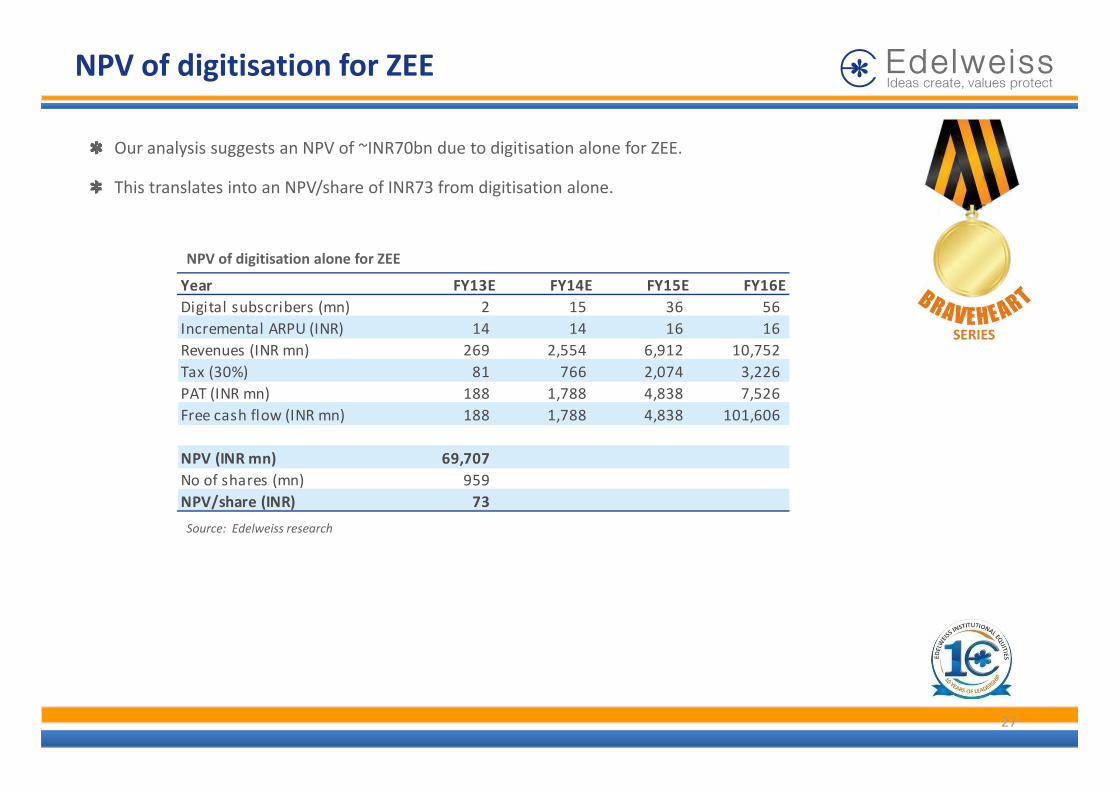
NPV of digitisation for ZEE
Our analysis suggests an NPV of ~INR70bn due to digitisation alone for ZEE.
This translates into an NPV/share of INR73 from digitisation alone.
NPV of digitisation alone for ZEE
Year FY13E FY14E FY15E FY16EDigital subscribers (mn) 2 15 36 56Digital subscribers (mn) 2 15 36 56Incremental ARPU (INR) 14 14 16 16Revenues (INR mn) 269 2,554 6,912 10,752Tax (30%) 81 766 2,074 3,226PAT (INR mn) 188 1 788 4 838 7 526PAT (INR mn) 188 1,788 4,838 7,526Free cash flow (INR mn) 188 1,788 4,838 101,606
NPV (INR mn) 69,707No of shares (mn) 959
Source: Edelweiss research
o o s a es ( ) 959NPV/share (INR) 73
27
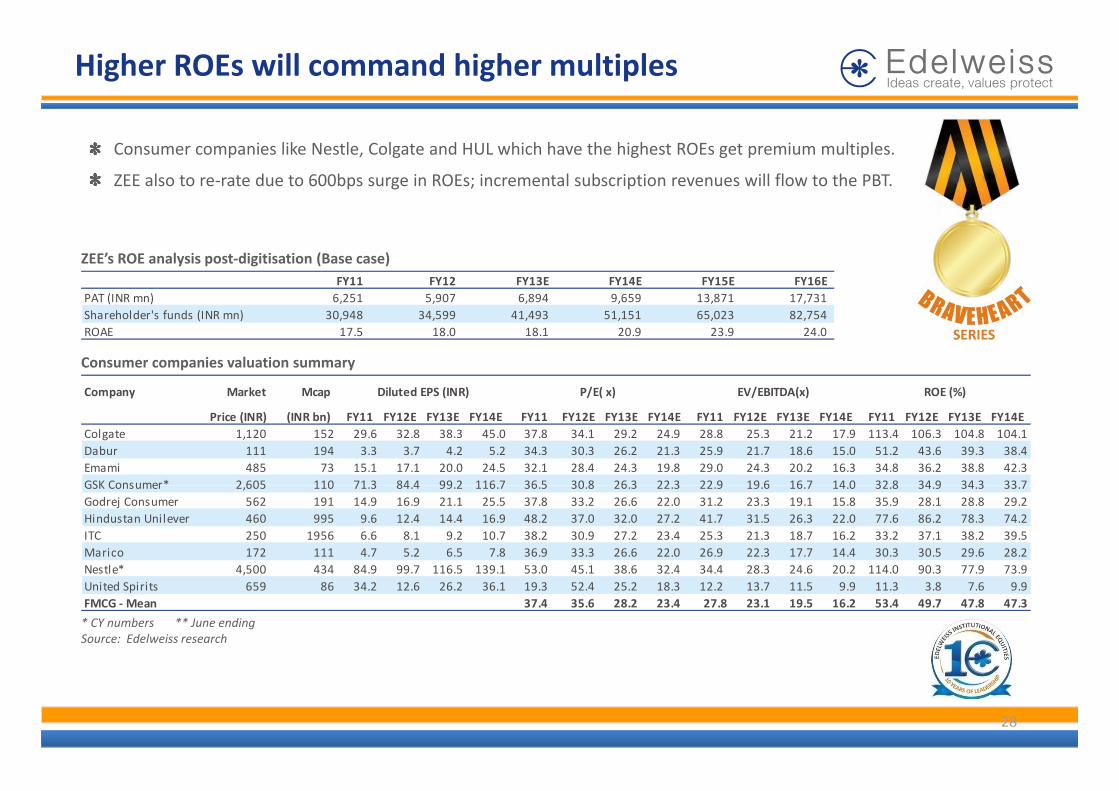
Higher ROEs will command higher multiples
Consumer companies like Nestle, Colgate and HUL which have the highest ROEs get premium multiples.
ZEE also to re‐rate due to 600bps surge in ROEs; incremental subscription revenues will flow to the PBT.
ZEE’s ROE analysis post‐digitisation (Base case)FY11 FY12 FY13E FY14E FY15E FY16E
PAT (INR mn) 6,251 5,907 6,894 9,659 13,871 17,731
Consumer companies valuation summary
Company Market Mcap Diluted EPS (INR) P/E( x) EV/EBITDA(x) ROE (%)
Shareholder's funds (INR mn) 30,948 34,599 41,493 51,151 65,023 82,754ROAE 17.5 18.0 18.1 20.9 23.9 24.0
Company Market Mcap
Price (INR) (INR bn) FY11 FY12E FY13E FY14E FY11 FY12E FY13E FY14E FY11 FY12E FY13E FY14E FY11 FY12E FY13E FY14EColgate 1,120 152 29.6 32.8 38.3 45.0 37.8 34.1 29.2 24.9 28.8 25.3 21.2 17.9 113.4 106.3 104.8 104.1Dabur 111 194 3.3 3.7 4.2 5.2 34.3 30.3 26.2 21.3 25.9 21.7 18.6 15.0 51.2 43.6 39.3 38.4Emami 485 73 15.1 17.1 20.0 24.5 32.1 28.4 24.3 19.8 29.0 24.3 20.2 16.3 34.8 36.2 38.8 42.3GSK Consumer* 2 605 110 71 3 84 4 99 2 116 7 36 5 30 8 26 3 22 3 22 9 19 6 16 7 14 0 32 8 34 9 34 3 33 7
Diluted EPS (INR) P/E( x) EV/EBITDA(x) ROE (%)
GSK Consumer 2,605 110 71.3 84.4 99.2 116.7 36.5 30.8 26.3 22.3 22.9 19.6 16.7 14.0 32.8 34.9 34.3 33.7Godrej Consumer 562 191 14.9 16.9 21.1 25.5 37.8 33.2 26.6 22.0 31.2 23.3 19.1 15.8 35.9 28.1 28.8 29.2Hindustan Unilever 460 995 9.6 12.4 14.4 16.9 48.2 37.0 32.0 27.2 41.7 31.5 26.3 22.0 77.6 86.2 78.3 74.2ITC 250 1956 6.6 8.1 9.2 10.7 38.2 30.9 27.2 23.4 25.3 21.3 18.7 16.2 33.2 37.1 38.2 39.5Marico 172 111 4.7 5.2 6.5 7.8 36.9 33.3 26.6 22.0 26.9 22.3 17.7 14.4 30.3 30.5 29.6 28.2Nestle* 4,500 434 84.9 99.7 116.5 139.1 53.0 45.1 38.6 32.4 34.4 28.3 24.6 20.2 114.0 90.3 77.9 73.9
* CY numbers ** June endingSource: Edelweiss research
,United Spirits 659 86 34.2 12.6 26.2 36.1 19.3 52.4 25.2 18.3 12.2 13.7 11.5 9.9 11.3 3.8 7.6 9.9FMCG ‐ Mean 37.4 35.6 28.2 23.4 27.8 23.1 19.5 16.2 53.4 49.7 47.8 47.3
28
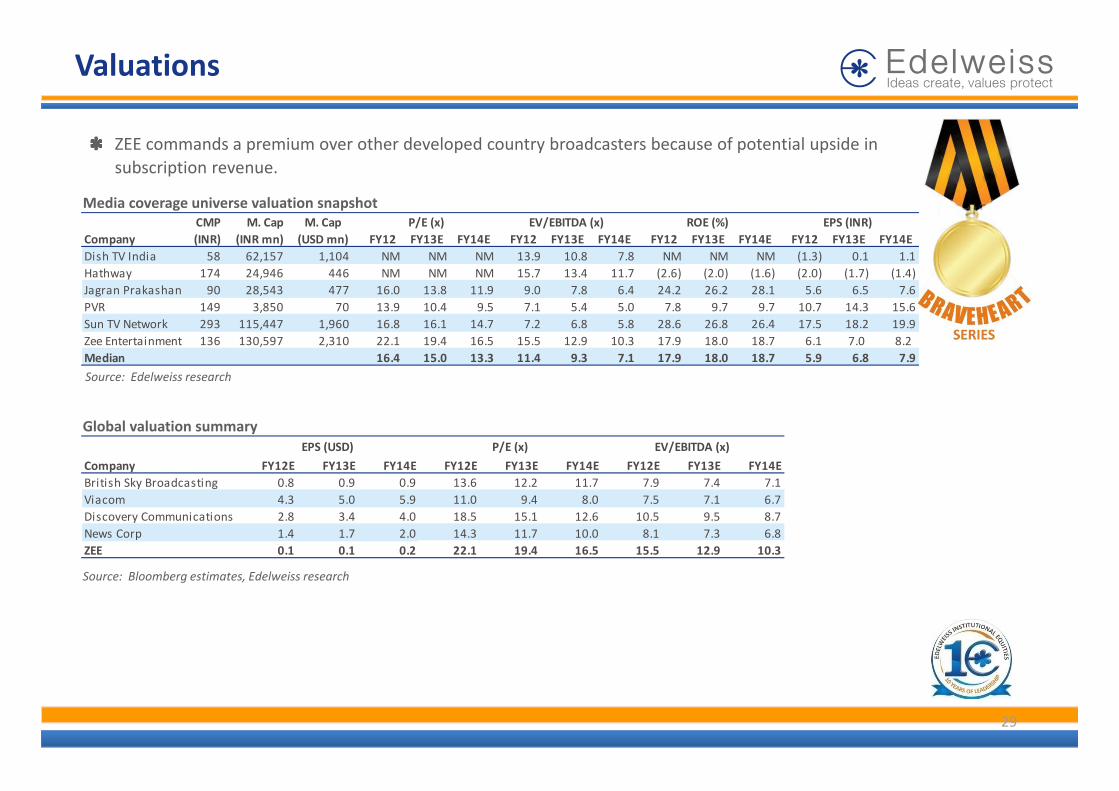
Valuations
Media coverage universe valuation snapshot
ZEE commands a premium over other developed country broadcasters because of potential upside in subscription revenue.
CMP M. Cap M. CapCompany (INR) (INR mn) (USD mn) FY12 FY13E FY14E FY12 FY13E FY14E FY12 FY13E FY14E FY12 FY13E FY14EDish TV India 58 62,157 1,104 NM NM NM 13.9 10.8 7.8 NM NM NM (1.3) 0.1 1.1Hathway 174 24,946 446 NM NM NM 15.7 13.4 11.7 (2.6) (2.0) (1.6) (2.0) (1.7) (1.4) Jagran Prakashan 90 28,543 477 16.0 13.8 11.9 9.0 7.8 6.4 24.2 26.2 28.1 5.6 6.5 7.6PVR 149 3 850 70 13 9 10 4 9 5 7 1 5 4 5 0 7 8 9 7 9 7 10 7 14 3 15 6
P/E (x) EV/EBITDA (x) ROE (%) EPS (INR)
Source: Edelweiss research
PVR 149 3,850 70 13.9 10.4 9.5 7.1 5.4 5.0 7.8 9.7 9.7 10.7 14.3 15.6Sun TV Network 293 115,447 1,960 16.8 16.1 14.7 7.2 6.8 5.8 28.6 26.8 26.4 17.5 18.2 19.9Zee Entertainment 136 130,597 2,310 22.1 19.4 16.5 15.5 12.9 10.3 17.9 18.0 18.7 6.1 7.0 8.2 Median 16.4 15.0 13.3 11.4 9.3 7.1 17.9 18.0 18.7 5.9 6.8 7.9
Global valuation summary
Company FY12E FY13E FY14E FY12E FY13E FY14E FY12E FY13E FY14EBritish Sky Broadcasting 0.8 0.9 0.9 13.6 12.2 11.7 7.9 7.4 7.1
P/E (x) EV/EBITDA (x)EPS (USD)
Source: Bloomberg estimates Edelweiss research
British Sky Broadcasting 0.8 0.9 0.9 13.6 12.2 11.7 7.9 7.4 7.1Viacom 4.3 5.0 5.9 11.0 9.4 8.0 7.5 7.1 6.7Discovery Communications 2.8 3.4 4.0 18.5 15.1 12.6 10.5 9.5 8.7News Corp 1.4 1.7 2.0 14.3 11.7 10.0 8.1 7.3 6.8ZEE 0.1 0.1 0.2 22.1 19.4 16.5 15.5 12.9 10.3
Source: Bloomberg estimates, Edelweiss research
29
Appendix
Indian TV IndustryIndian TV industry
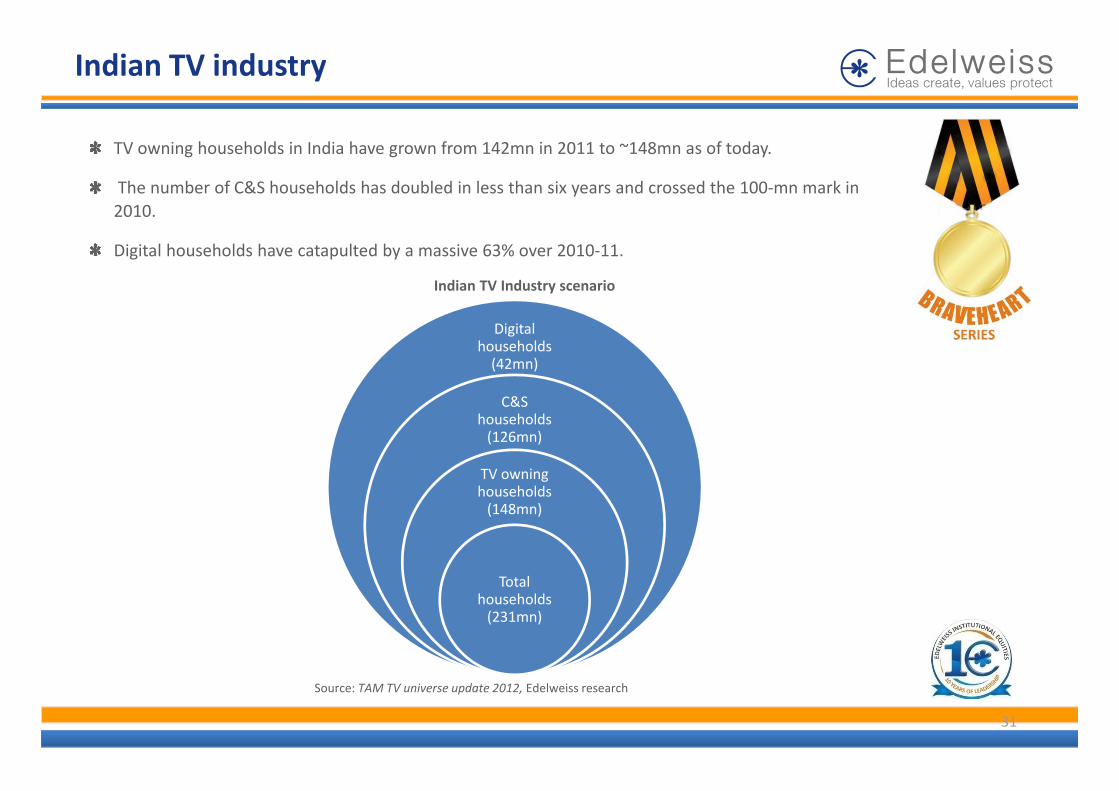
TV owning households in India have grown from 142mn in 2011 to ~148mn as of today.
The number of C&S households has doubled in less than six years and crossed the 100‐mn mark in 2010.2010.
Digital households have catapulted by a massive 63% over 2010‐11.
Indian TV Industry scenario
Digital households (42mn)
C&S households (126mn)
TV owning households (148mn)
Total households (231mn)
Source: TAM TV universe update 2012, Edelweiss research
31
Sports broadcasting in India
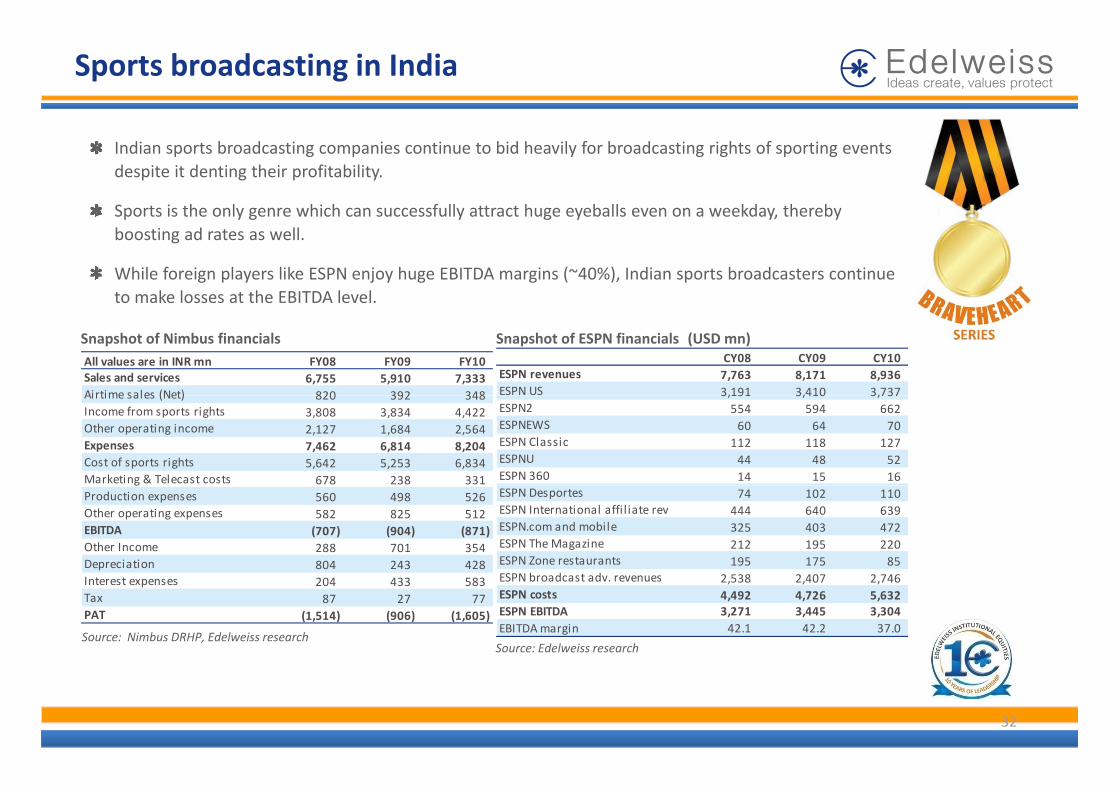
Indian sports broadcasting companies continue to bid heavily for broadcasting rights of sporting events despite it denting their profitability.
Sports is the only genre which can successfully attract huge eyeballs even on a weekday, therebySports is the only genre which can successfully attract huge eyeballs even on a weekday, thereby boosting ad rates as well.
While foreign players like ESPN enjoy huge EBITDA margins (~40%), Indian sports broadcasters continue to make losses at the EBITDA level.
Snapshot of Nimbus financials Snapshot of ESPN financials (USD mn)All values are in INR mn FY08 FY09 FY10Sales and services 6,755 5,910 7,333 Airtime sales (Net) 820 392 348
CY08 CY09 CY10ESPN revenues 7,763 8,171 8,936 ESPN US 3,191 3,410 3,737Airtime sales (Net) 820 392 348
Income from sports rights 3,808 3,834 4,422 Other operating income 2,127 1,684 2,564 Expenses 7,462 6,814 8,204 Cost of sports rights 5,642 5,253 6,834 Marketing & Telecast costs 678 238 331
3,191 3,410 3,737 ESPN2 554 594 662 ESPNEWS 60 64 70 ESPN Classic 112 118 127 ESPNU 44 48 52 ESPN 360 14 15 16 g
Production expenses 560 498 526 Other operating expenses 582 825 512 EBITDA (707) (904) (871) Other Income 288 701 354 Depreciation 804 243 428
ESPN Desportes 74 102 110 ESPN International affi l iate rev 444 640 639 ESPN.com and mobile 325 403 472 ESPN The Magazine 212 195 220 ESPN Zone restaurants 195 175 85 ESPN b d t d 2 538 2 407 2 746
Source: Nimbus DRHP, Edelweiss researchSource: Edelweiss research
Interest expenses 204 433 583 Tax 87 27 77 PAT (1,514) (906) (1,605)
ESPN broadcast adv. revenues 2,538 2,407 2,746 ESPN costs 4,492 4,726 5,632 ESPN EBITDA 3,271 3,445 3,304 EBITDA margin 42.1 42.2 37.0
32
Global television distribution scenario
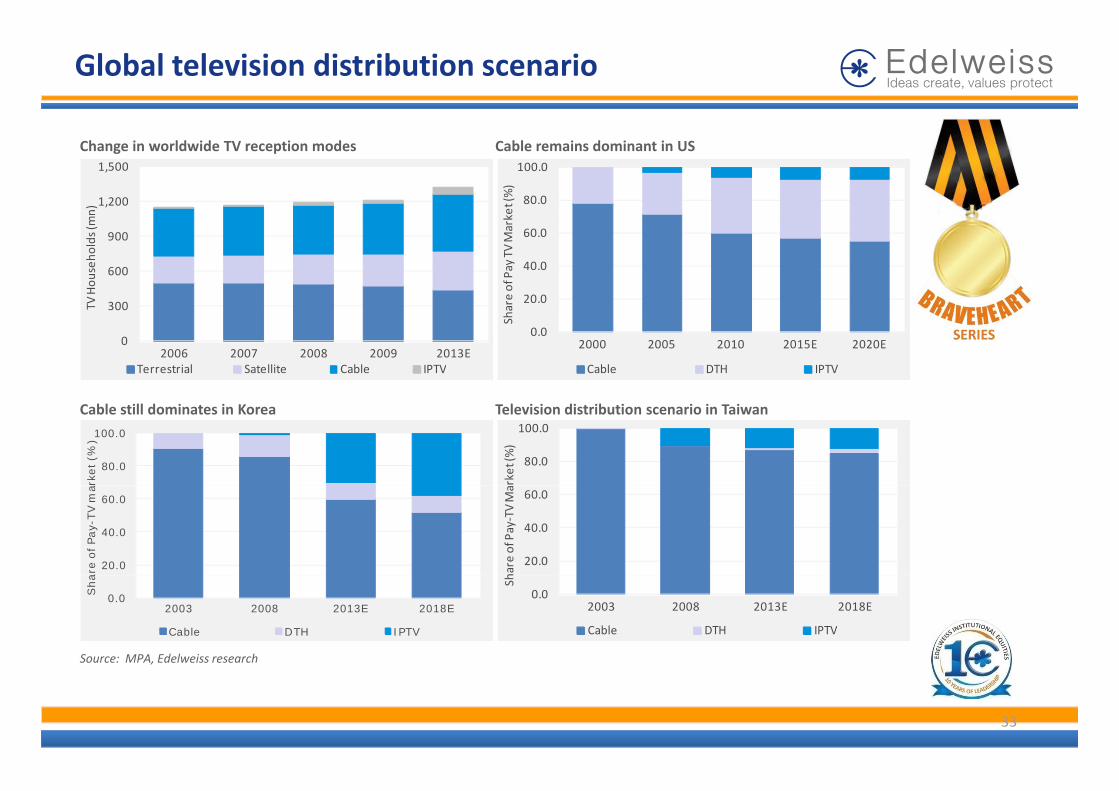
Change in worldwide TV reception modes Cable remains dominant in US
1,200
1,500
n)
80.0
100.0
ket (%)
300
600
900
TV Hou
seho
lds (m
20.0
40.0
60.0
re of Pay TV Mark
0
300
2006 2007 2008 2009 2013E
T
Terrestrial Satellite Cable IPTV
0.02000 2005 2010 2015E 2020E
Sha
Cable DTH IPTV
Cable still dominates in Korea Television distribution scenario in Taiwan
80.0
100.0
rket (%
)
80.0
100.0
rket (%
)
20.0
40.0
60.0
are
of Pay-
TV m
a
20.0
40.0
60.0hare of Pay‐TV Ma
Source: MPA, Edelweiss research
0.02003 2008 2013E 2018E
Sha
Cable DTH IPTV
0.02003 2008 2013E 2018E
Sh
Cable DTH IPTV
33
Other leading broadcasting networks in India
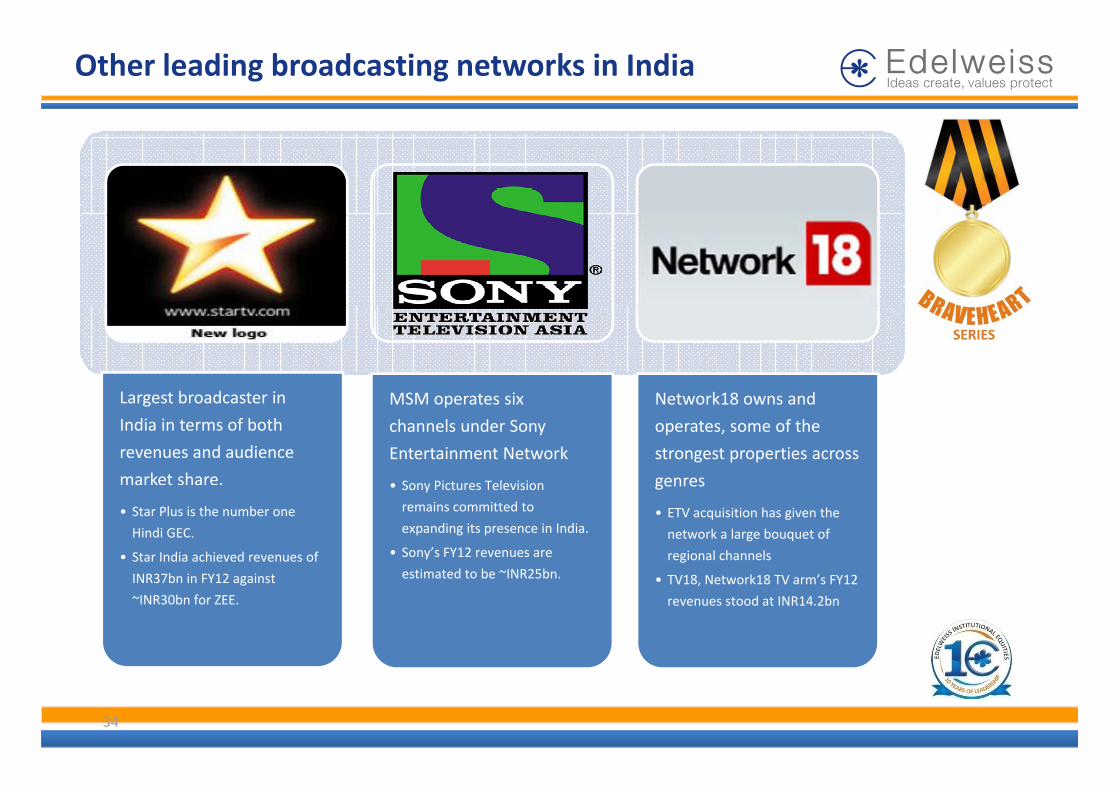
Largest broadcaster in MSM t i N t k18 dLargest broadcaster in
India in terms of both
revenues and audience
market share.
MSM operates six
channels under Sony
Entertainment Network
• Sony Pictures Television
Network18 owns and
operates, some of the
strongest properties across
genres
• Star Plus is the number one
Hindi GEC.
• Star India achieved revenues of
INR37b i FY12 i t
• Sony Pictures Television
remains committed to
expanding its presence in India.
• Sony’s FY12 revenues are
estimated to be ~INR25bn
genres
• ETV acquisition has given the
network a large bouquet of
regional channels
TV18 N k18 TV ’ FY12INR37bn in FY12 against
~INR30bn for ZEE.
estimated to be INR25bn. • TV18, Network18 TV arm’s FY12
revenues stood at INR14.2bn
34
Disclaimer
General Disclaimer:
This document has been prepared by Edelweiss Securities Limited (Edelweiss). Edelweiss, its holding company and associate companies are a full service, integrated investment banking, portfolio management andbrokerage group. Our research analysts and sales persons provide important input into our investment banking activities. This document does not constitute an offer or solicitation for the purchase or sale of anyfinancial instrument or as an official confirmation of any transaction. The information contained herein is from publicly available data or other sources believed to be reliable, but we do not represent that it isaccurate or complete and it should not be relied on as such. Edelweiss or any of its affiliates/ group companies shall not be in any way responsible for any loss or damage that may arise to any person from anyinadvertent error in the information contained in this report. This document is provided for assistance only and is not intended to be and must not alone be taken as the basis for an investment decision. The userassumes the entire risk of any use made of this information. Each recipient of this document should make such investigation as it deems necessary to arrive at an independent evaluation of an investment in they p g y psecurities of companies referred to in this document (including the merits and risks involved), and should consult his own advisors to determine the merits and risks of such investment. The investment discussed orviews expressed may not be suitable for all investors. We and our affiliates, group companies, officers, directors, and employees may: (a) from time to time, have long or short positions in, and buy or sell thesecurities thereof, of company (ies) mentioned herein or (b) be engaged in any other transaction involving such securities and earn brokerage or other compensation or act as advisor or lender/borrower to suchcompany (ies) or have other potential conflict of interest with respect to any recommendation and related information and opinions. This information is strictly confidential and is being furnished to you solely foryour information. This information should not be reproduced or redistributed or passed on directly or indirectly in any form to any other person or published, copied, in whole or in part, for any purpose. This reportis not directed or intended for distribution to, or use by, any person or entity who is a citizen or resident of or located in any locality, state, country or other jurisdiction, where such distribution, publication,availability or use would be contrary to law, regulation or which would subject Edelweiss and affiliates/ group companies to any registration or licensing requirements within such jurisdiction. The distribution of thisdocument in certain jurisdictions may be restricted by law, and persons in whose possession this document comes, should inform themselves about and observe, any such restrictions. The information given in thisj y y , p p , , y gdocument is as of the date of this report and there can be no assurance that future results or events will be consistent with this information. This information is subject to change without any prior notice. Edelweissreserves the right to make modifications and alterations to this statement as may be required from time to time. However, Edelweiss is under no obligation to update or keep the information current. Nevertheless,Edelweiss is committed to providing independent and transparent recommendation to its client and would be happy to provide any information in response to specific client queries. Neither Edelweiss nor any of itsaffiliates, group companies, directors, employees, agents or representatives shall be liable for any damages whether direct, indirect, special or consequential including lost revenue or lost profits that may arise fromor in connection with the use of the information. Past performance is not necessarily a guide to future performance. The disclosures of interest statements incorporated in this document are provided solely toenhance the transparency and should not be treated as endorsement of the views expressed in the report. Edelweiss Securities Limited generally prohibits its analysts, persons reporting to analysts and theirdependents from maintaining a financial interest in the securities or derivatives of any companies that the analysts cover. The information provided in this document remains, unless otherwise stated, the copyrightof Edelweiss. All layout, design, original artwork, concepts and other Intellectual Properties, remains the property and copyright Edelweiss and may not be used in any form or for any purpose whatsoever by anyy g g p p p p y py g y y y p p y yparty without the express written permission of the copyright holders.
Analyst Certification:
The analyst for this report certifies that all of the views expressed in this report accurately reflect his or her personal views about the subject company or companies and its or their securities, and no part of his orher compensation was, is or will be, directly or indirectly related to specific recommendations or views expressed in this report.
Analyst holding in the stock: No.
Additional Disclaimer for U.S. Persons
This research report is a product of Edelweiss Securities Limited, which is the employer of the research analyst(s) who has prepared the research report. The research analyst(s) preparing the research report is/areresident outside the United States (U.S.) and are not associated persons of any U.S. regulated broker‐dealer and therefore the analyst(s) is/are not subject to supervision by a U.S. broker‐dealer, and is/are notrequired to satisfy the regulatory licensing requirements of FINRA or required to otherwise comply with U.S. rules or regulations regarding, among other things, communications with a subject company, publicappearances and trading securities held by a research analyst account.
Thi i i d d f di ib i b Ed l i S i i Li i d l "M j I i i l I " d fi d b R l 15 6(b)(4) f h U S S i i d E h A 1934 ( h E h A ) dThis report is intended for distribution by Edelweiss Securities Limited only to "Major Institutional Investors" as defined by Rule 15a‐6(b)(4) of the U.S. Securities and Exchange Act, 1934 (the Exchange Act) andinterpretations thereof by U.S. Securities and Exchange Commission (SEC) in reliance on Rule 15a 6(a)(2). If the recipient of this report is not a Major Institutional Investor as specified above, then it should not actupon this report and return the same to the sender. Further, this report may not be copied, duplicated and/or transmitted onward to any U.S. person, which is not the Major Institutional Investor.
In reliance on the exemption from registration provided by Rule 15a‐6 of the Exchange Act and interpretations thereof by the SEC in order to conduct certain business with Major Institutional Investors, EdelweissSecurities Limited has entered into an agreement with a U.S. registered broker‐dealer, Marco Polo Securities Inc. ("Marco Polo").
Transactions in securities discussed in this research report should be effected through Marco Polo or another U.S. registered broker dealer.
Copyright 2009 Edelweiss Research (Edelweiss Securities Ltd). All rights reserved
35