youth in the labor force: statistics and trends · statistics and trends youth employment work...
TRANSCRIPT
Youth in the Labor Force:Statistics and Trends
Youth Employment Work Group
May 26, 2016
1
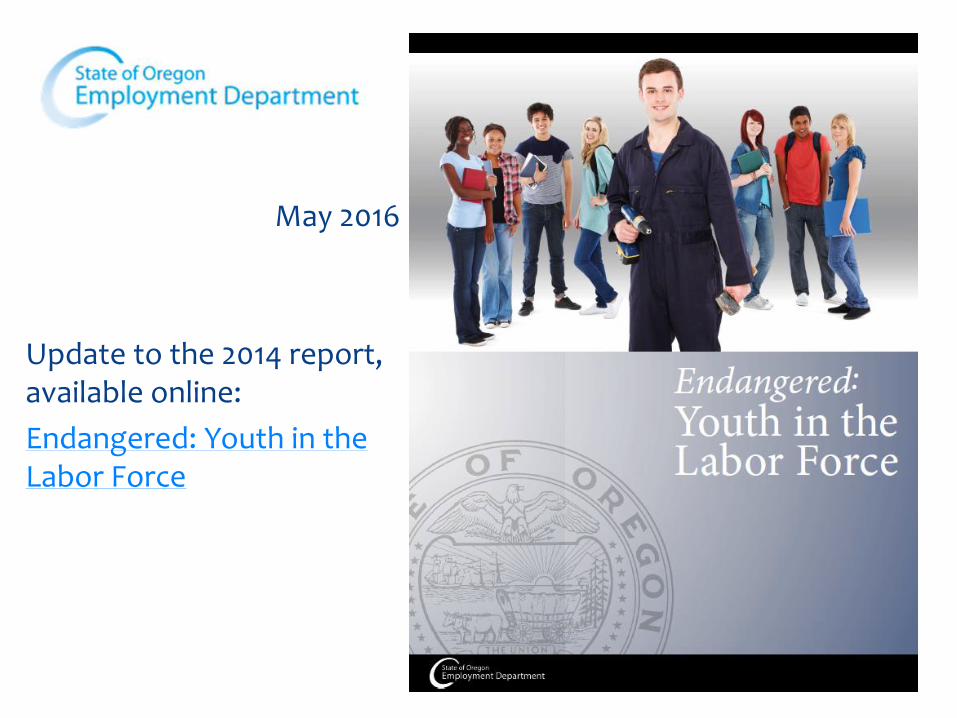
May 2016
Update to the 2014 report, available online:
Endangered: Youth in the Labor Force
Oregon has been adding jobs faster than the U.S. since 2013.
More jobs were added in the last 12 months than over any 12 month period since 1990 (at least).
Oregon’s unemployment rate is the lowest in 40 years, and is lower than the U.S.
Strong job growth is boosting the labor force participation rate, offsetting the long-term decline in participation.
The youth labor market has improved a lot, but it’s still not great, especially for teens.
Oregon’s labor market has improved substantially since the report was published.
Unemployment rates for teens and young adults increased drastically during the recession.
Unemployment among young adults (20-24 years) has improved significantly since then.
Unemployment among teenagers (16-19 years) reached a record high during the recession. It has improved a lot since then, but the unemployment rate for teens is still very high.
Youth Unemployment
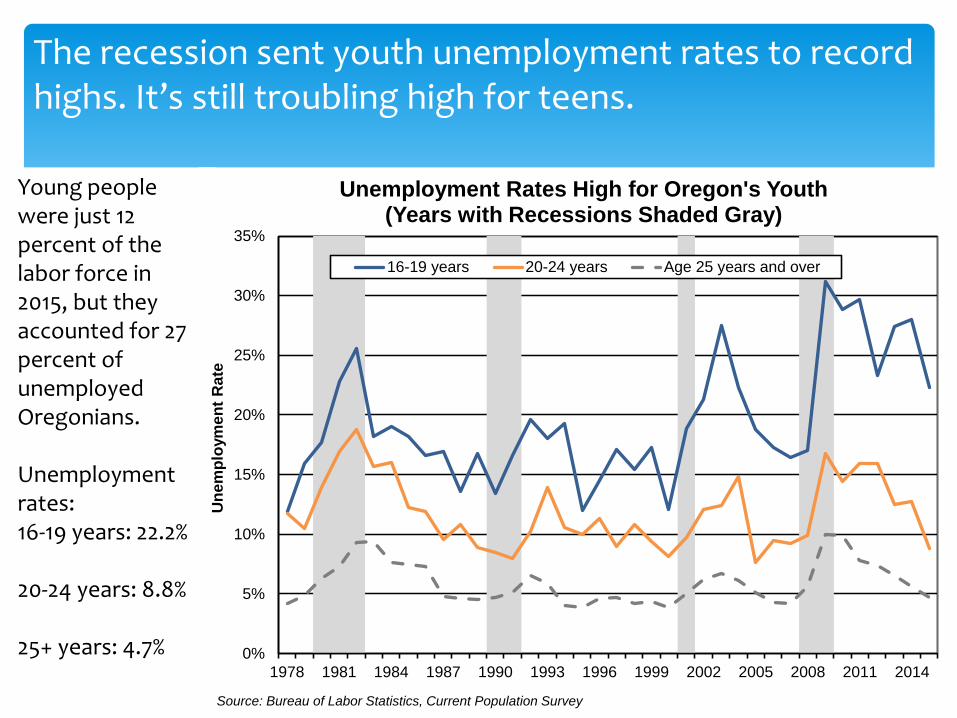
The recession sent youth unemployment rates to record highs. It’s still troubling high for teens.
Young people were just 12 percent of the labor force in 2015, but they accounted for 27 percent of unemployed Oregonians.
Unemployment rates:16-19 years: 22.2%
20-24 years: 8.8%
25+ years: 4.7% 0%
5%
10%
15%
20%
25%
30%
35%
1978 1981 1984 1987 1990 1993 1996 1999 2002 2005 2008 2011 2014
Un
em
plo
ym
en
t R
ate
Unemployment Rates High for Oregon's Youth(Years with Recessions Shaded Gray)
16-19 years 20-24 years Age 25 years and over
Source: Bureau of Labor Statistics, Current Population Survey
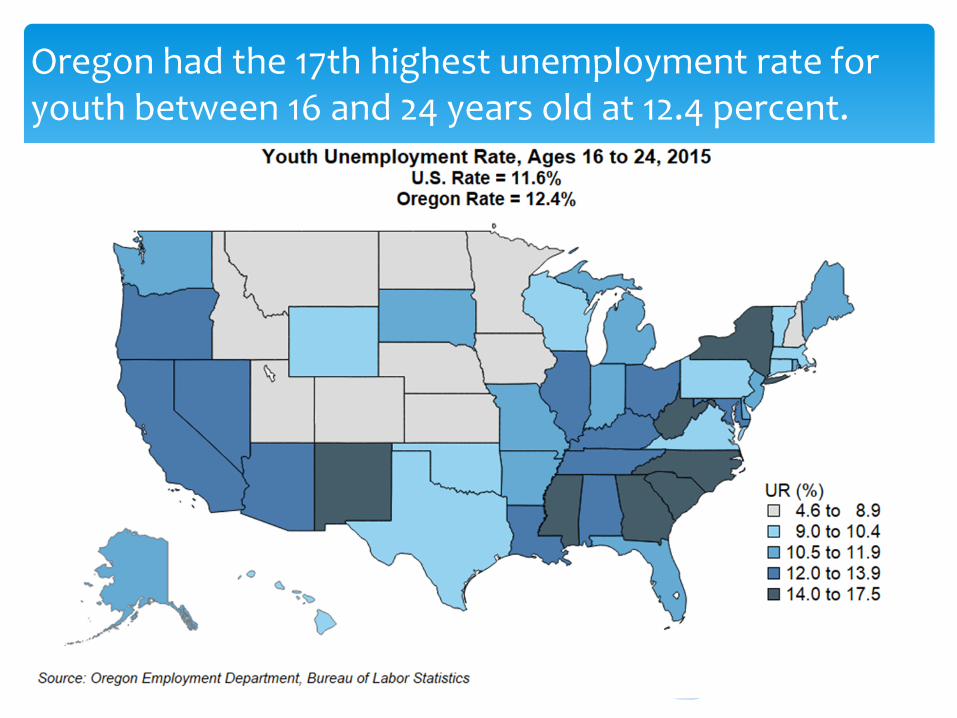
Oregon had the 17th highest unemployment rate for youth between 16 and 24 years old at 12.4 percent.
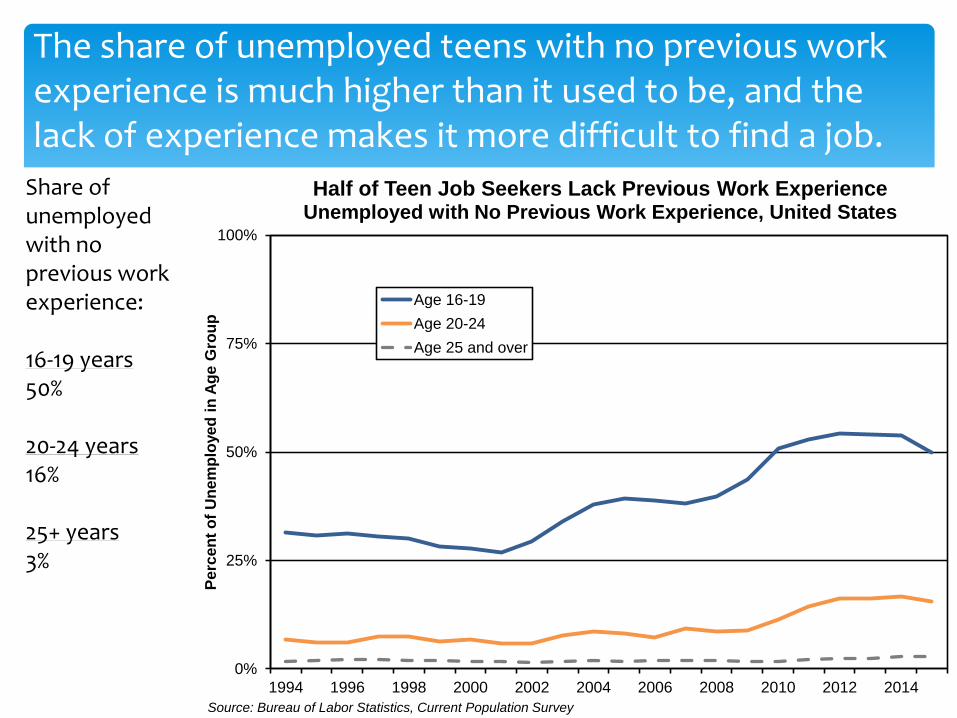
The share of unemployed teens with no previous work experience is much higher than it used to be, and the lack of experience makes it more difficult to find a job.
Share of unemployed with no previous work experience:
16-19 years50%
20-24 years16%
25+ years3%
0%
25%
50%
75%
100%
1994 1996 1998 2000 2002 2004 2006 2008 2010 2012 2014
Perc
en
t o
f U
nem
plo
yed
in
Ag
e G
rou
p
Half of Teen Job Seekers Lack Previous Work ExperienceUnemployed with No Previous Work Experience, United States
Age 16-19
Age 20-24
Age 25 and over
Source: Bureau of Labor Statistics, Current Population Survey
The labor force participation rate is the share of the civilian noninstitutional population that is employed or unemployed (no job, but actively looking for work).
Young adult participation increased slightly as economic conditions improved.
Teen participation has continued its long-term fall, which began in the year 2000.
Youth Labor Force Participation
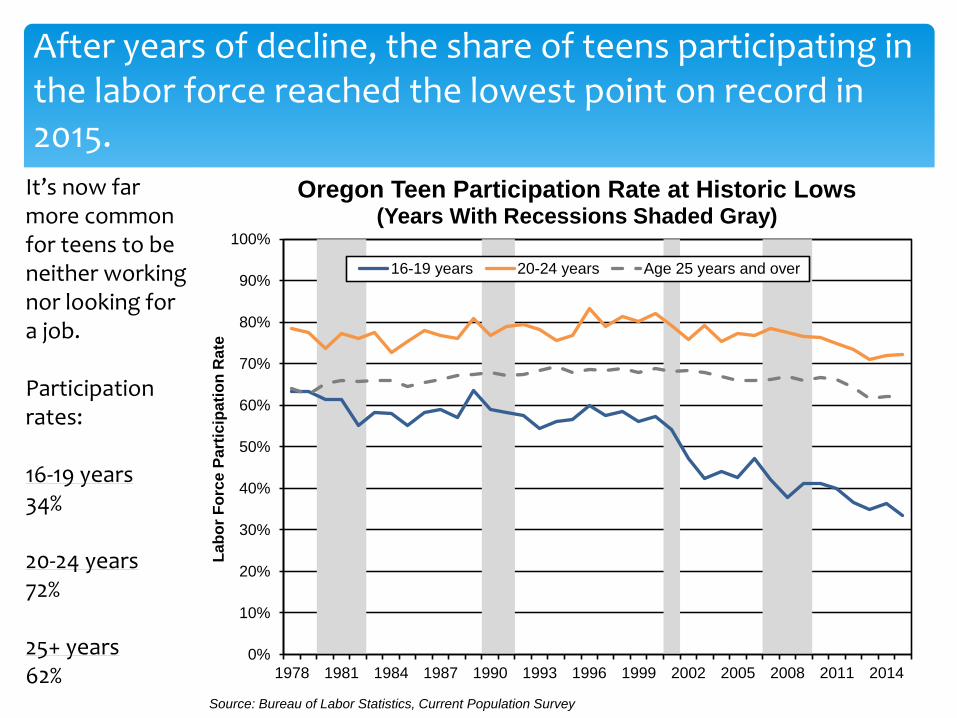
After years of decline, the share of teens participating in the labor force reached the lowest point on record in 2015.
It’s now far more common for teens to be neither working nor looking for a job.
Participation rates:
16-19 years34%
20-24 years72%
25+ years62%
0%
10%
20%
30%
40%
50%
60%
70%
80%
90%
100%
1978 1981 1984 1987 1990 1993 1996 1999 2002 2005 2008 2011 2014
La
bo
r F
orc
e P
art
icip
ati
on
Ra
te
Oregon Teen Participation Rate at Historic Lows(Years With Recessions Shaded Gray)
16-19 years 20-24 years Age 25 years and over
Source: Bureau of Labor Statistics, Current Population Survey
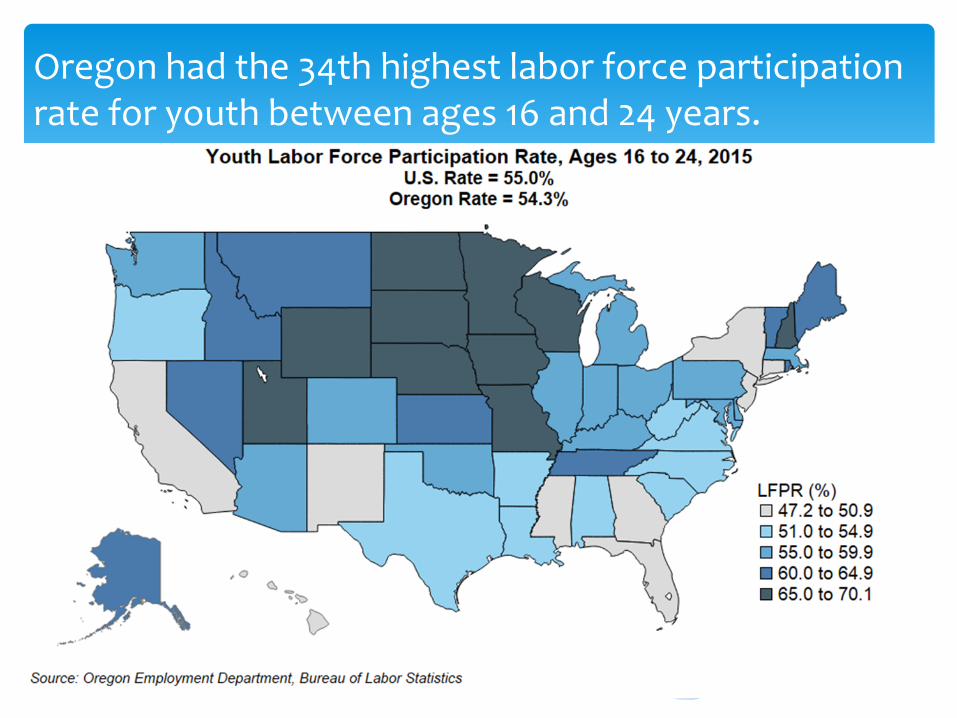
Oregon had the 34th highest labor force participation rate for youth between ages 16 and 24 years.
Oregon has added back the number of jobs lost during the recession. However, relatively few of the new jobs went to younger workers.
By 2015, there were 43,000 more jobs in Oregon than before the recession.
But there were 29,300 fewer jobs held by workers ages 14 to 24 years, than in 2007.
Fewer Jobs Held by Young People
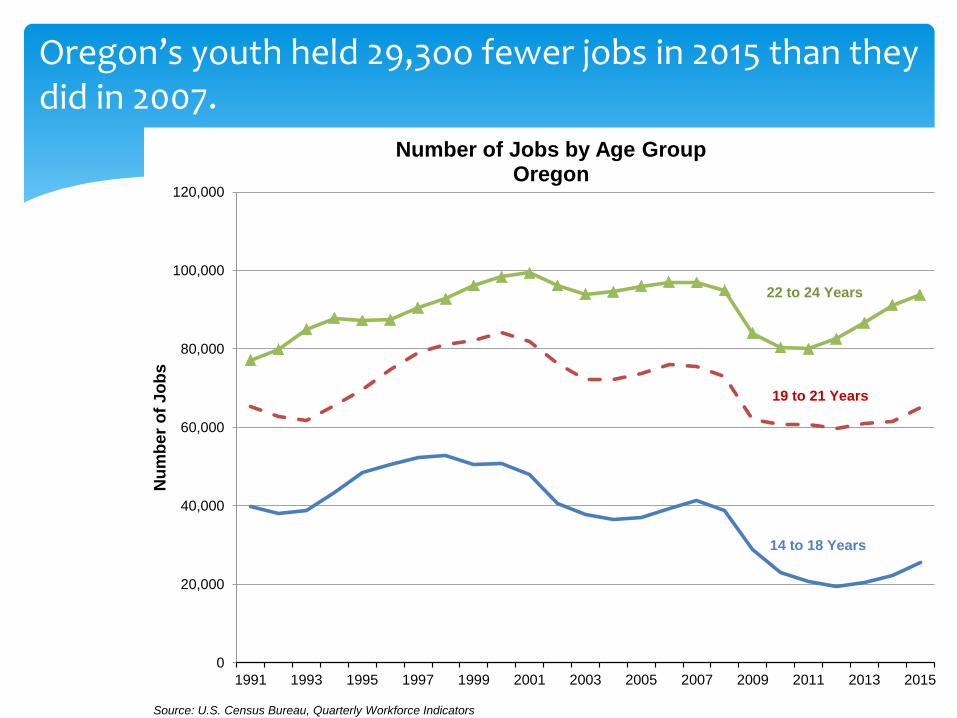
Oregon’s youth held 29,3oo fewer jobs in 2015 than they did in 2007.
0
20,000
40,000
60,000
80,000
100,000
120,000
1991 1993 1995 1997 1999 2001 2003 2005 2007 2009 2011 2013 2015
Nu
mb
er
of
Jo
bs
Number of Jobs by Age GroupOregon
22 to 24 Years
19 to 21 Years
14 to 18 Years
Source: U.S. Census Bureau, Quarterly Workforce Indicators
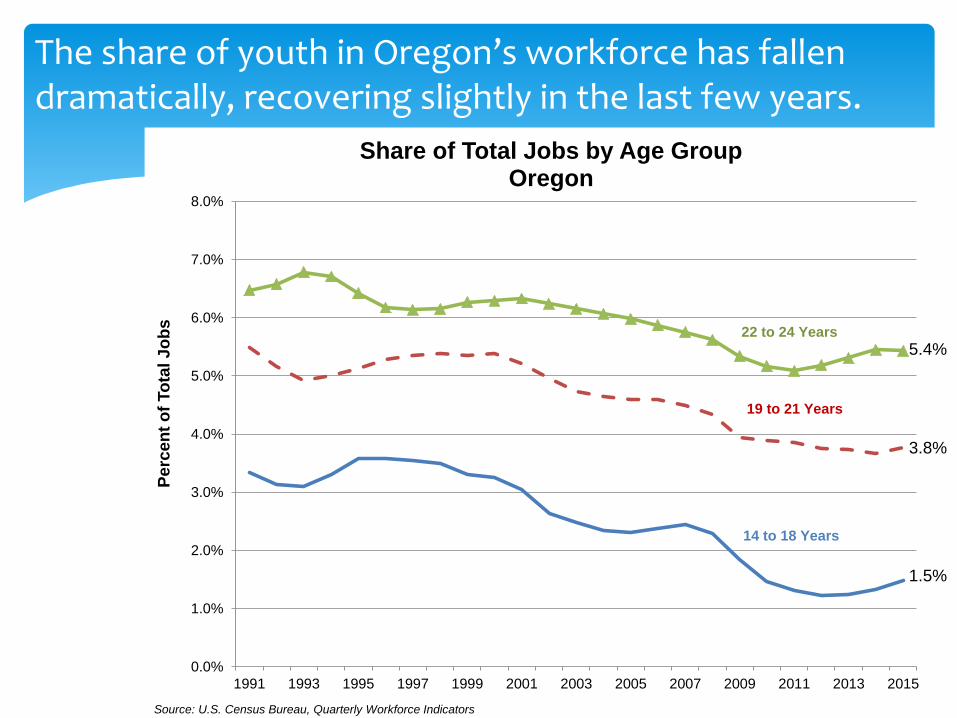
The share of youth in Oregon’s workforce has fallen dramatically, recovering slightly in the last few years.
0.0%
1.0%
2.0%
3.0%
4.0%
5.0%
6.0%
7.0%
8.0%
1991 1993 1995 1997 1999 2001 2003 2005 2007 2009 2011 2013 2015
Pe
rce
nt
of
To
tal J
ob
sShare of Total Jobs by Age Group
Oregon
5.4%
3.8%
1.5%
Source: U.S. Census Bureau, Quarterly Workforce Indicators
22 to 24 Years
19 to 21 Years
14 to 18 Years

Today’s teenagers are less likely to find a summer job than previous generations.
The number of teen summer “new hires” fell during the recession and hasn’t recovered.
Summer 200645,300
Summer 201428,100
0
10,000
20,000
30,000
40,000
50,000
60,000
70,000
1992 1994 1996 1998 2000 2002 2004 2006 2008 2010 2012 2014
Nu
mb
er
of
New
Hir
es
Oregon Teen Hiring Halved in RecessionThird Quarter New Hires Ages 14-18
Source: U.S. Census Bureau, Quarterly Workforce Indicators
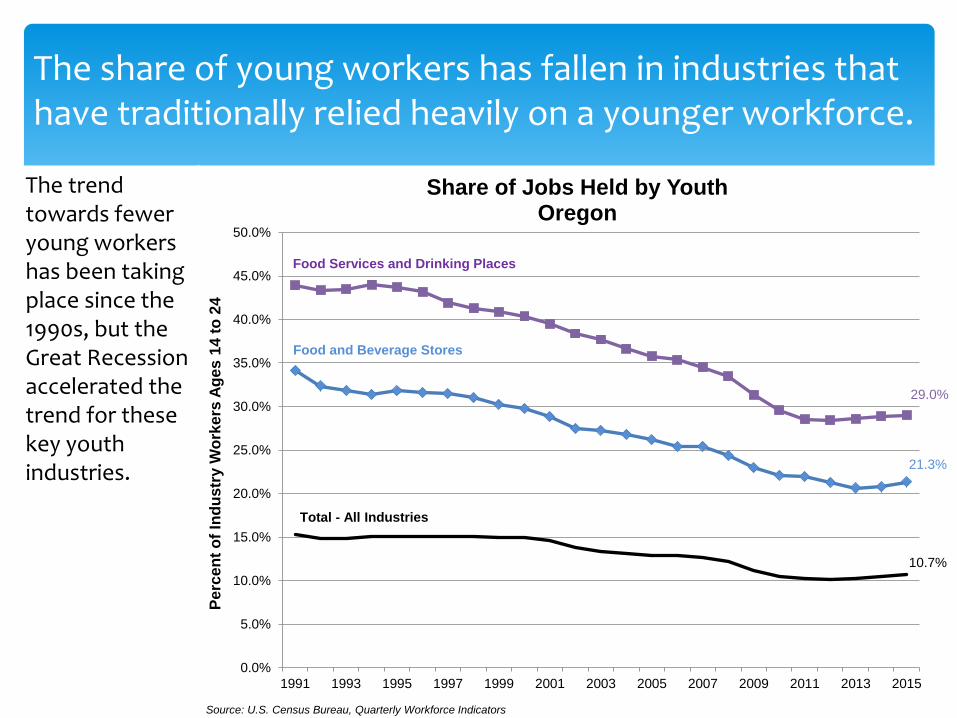
The share of young workers has fallen in industries that have traditionally relied heavily on a younger workforce.
The trend towards fewer young workers has been taking place since the 1990s, but the Great Recession accelerated the trend for these key youth industries.
0.0%
5.0%
10.0%
15.0%
20.0%
25.0%
30.0%
35.0%
40.0%
45.0%
50.0%
1991 1993 1995 1997 1999 2001 2003 2005 2007 2009 2011 2013 2015
Perc
en
t o
f In
du
str
y W
ork
ers
Ag
es 1
4 t
o 2
4
Share of Jobs Held by YouthOregon
21.3%
29.0%
10.7%
Source: U.S. Census Bureau, Quarterly Workforce Indicators
Food Services and Drinking Places
Food and Beverage Stores
Total - All Industries
What Are Young People Doing If They Are Not Working?
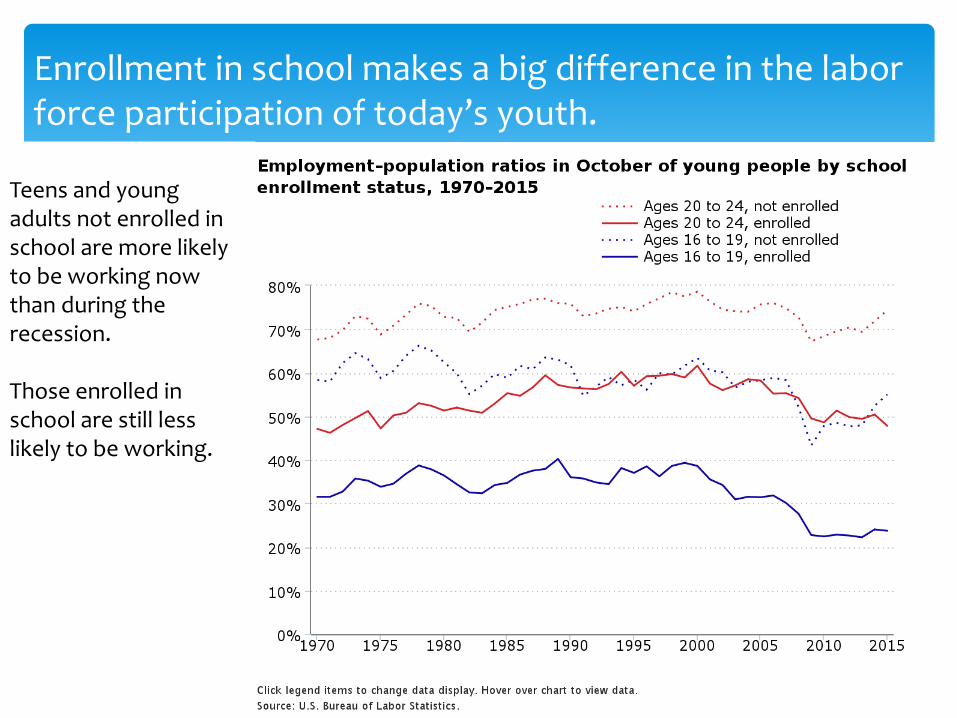
Enrollment in school makes a big difference in the labor force participation of today’s youth.
Teens and young adults not enrolled in school are more likely to be working now than during the recession.
Those enrolled in school are still less likely to be working.
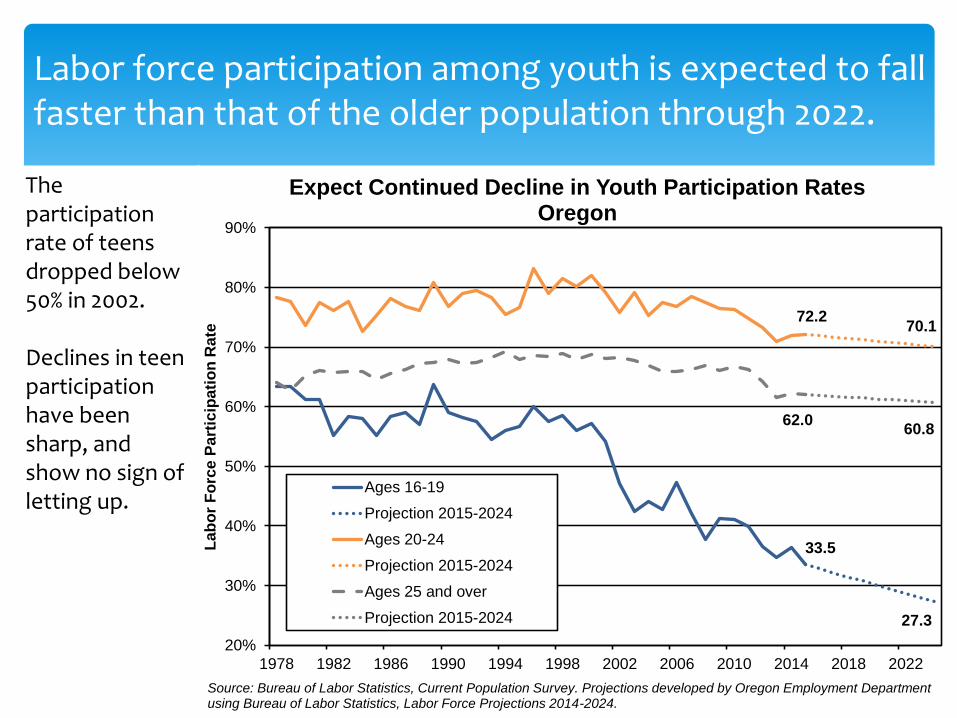
Labor force participation among youth is expected to fall faster than that of the older population through 2022.
The participation rate of teens dropped below 50% in 2002.
Declines in teen participation have been sharp, and show no sign of letting up.
20%
30%
40%
50%
60%
70%
80%
90%
1978 1982 1986 1990 1994 1998 2002 2006 2010 2014 2018 2022
Lab
or
Fo
rce P
art
icip
ati
on
Rate
Expect Continued Decline in Youth Participation Rates Oregon
Ages 16-19
Projection 2015-2024
Ages 20-24
Projection 2015-2024
Ages 25 and over
Projection 2015-2024
33.5
27.3
72.270.1
62.060.8
Source: Bureau of Labor Statistics, Current Population Survey. Projections developed by Oregon Employment Department using Bureau of Labor Statistics, Labor Force Projections 2014-2024.

What About the Minimum Wage?
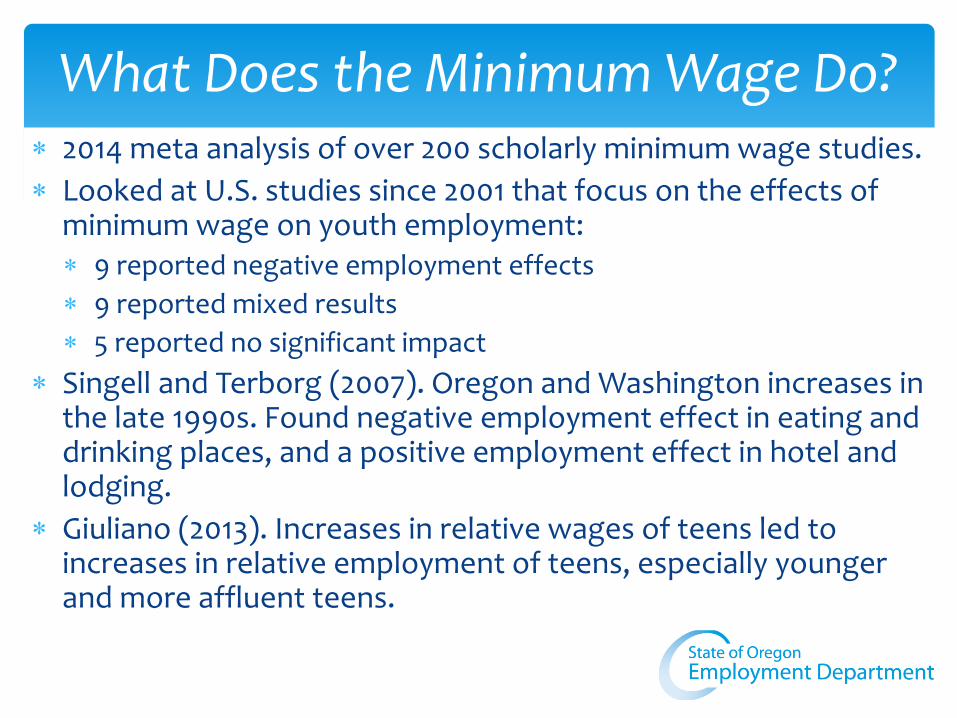
2014 meta analysis of over 200 scholarly minimum wage studies.
Looked at U.S. studies since 2001 that focus on the effects of minimum wage on youth employment: 9 reported negative employment effects
9 reported mixed results
5 reported no significant impact
Singell and Terborg (2007). Oregon and Washington increases in the late 1990s. Found negative employment effect in eating and drinking places, and a positive employment effect in hotel and lodging.
Giuliano (2013). Increases in relative wages of teens led to increases in relative employment of teens, especially younger and more affluent teens.
What Does the Minimum Wage Do?
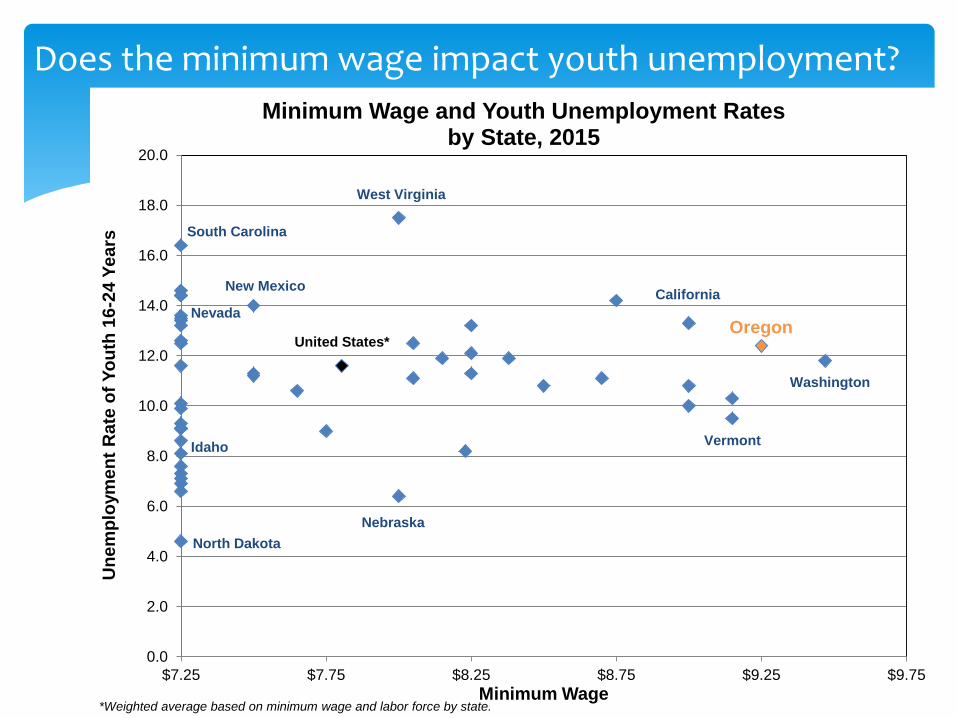
Does the minimum wage impact youth unemployment?
0.0
2.0
4.0
6.0
8.0
10.0
12.0
14.0
16.0
18.0
20.0
$7.25 $7.75 $8.25 $8.75 $9.25 $9.75
Un
em
plo
ym
en
t R
ate
of
Yo
uth
16
-24
Ye
ars
Minimum Wage
Minimum Wage and Youth Unemployment Ratesby State, 2015
United States*Oregon
Vermont
Washington
Nebraska
West Virginia
North Dakota
South Carolina
New Mexico
Idaho
California
Nevada
*Weighted average based on minimum wage and labor force by state.
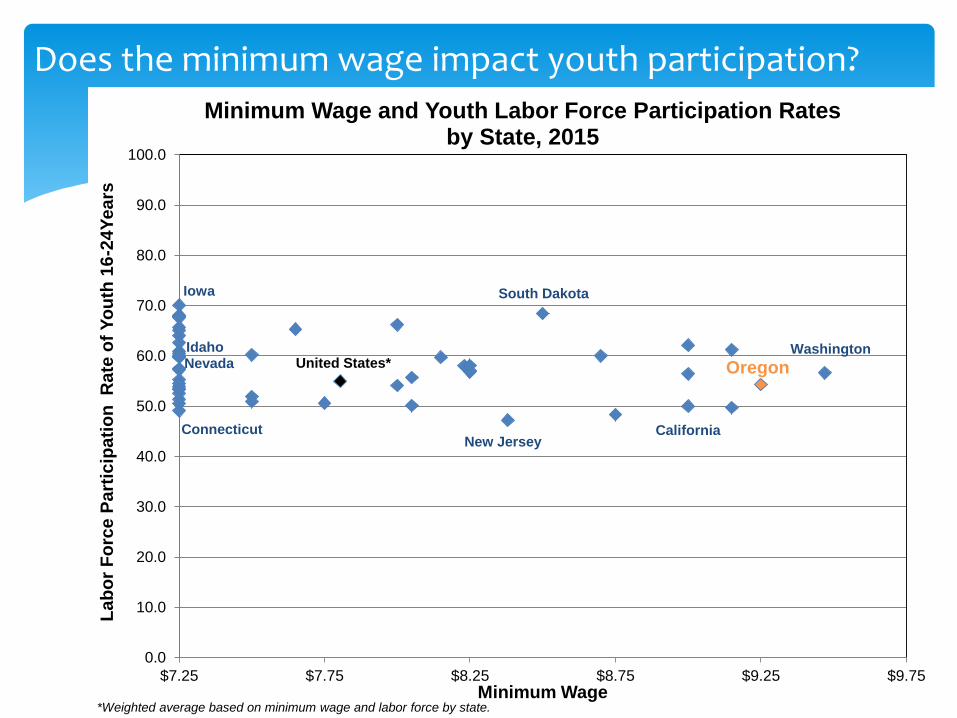
Does the minimum wage impact youth participation?
0.0
10.0
20.0
30.0
40.0
50.0
60.0
70.0
80.0
90.0
100.0
$7.25 $7.75 $8.25 $8.75 $9.25 $9.75
La
bo
r F
orc
e P
art
icip
ati
on
R
ate
of
Yo
uth
16
-24
Ye
ars
Minimum Wage
Minimum Wage and Youth Labor Force Participation Ratesby State, 2015
United States* Oregon
South Dakota
WashingtonNevada
Connecticut
Idaho
California
Iowa
New Jersey
*Weighted average based on minimum wage and labor force by state.
More About Teen Workers16-19 Years
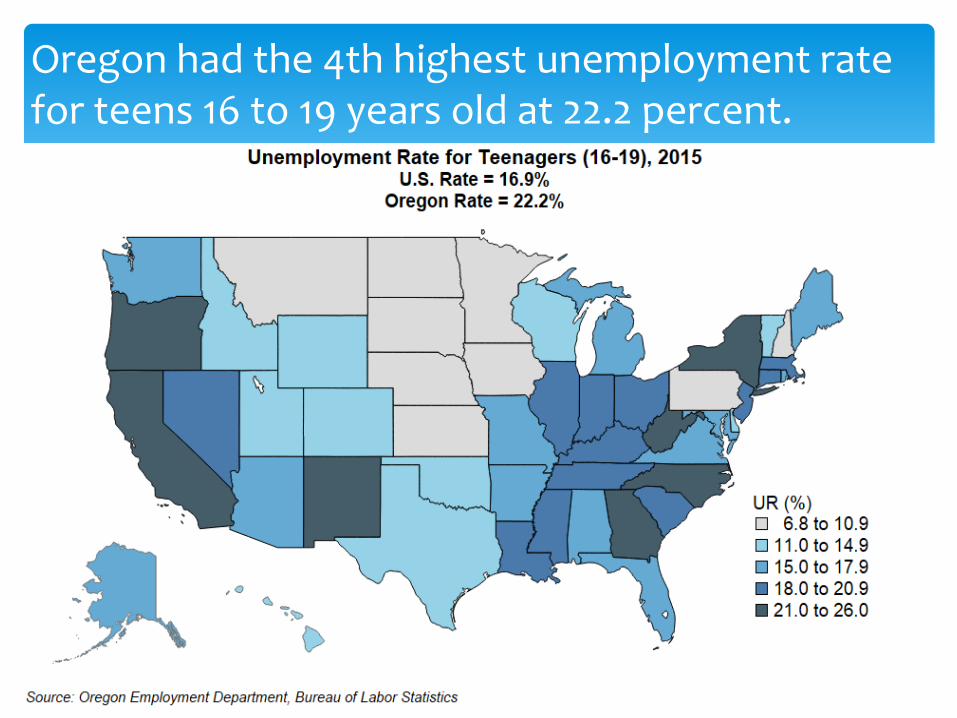
Oregon had the 4th highest unemployment rate for teens 16 to 19 years old at 22.2 percent.
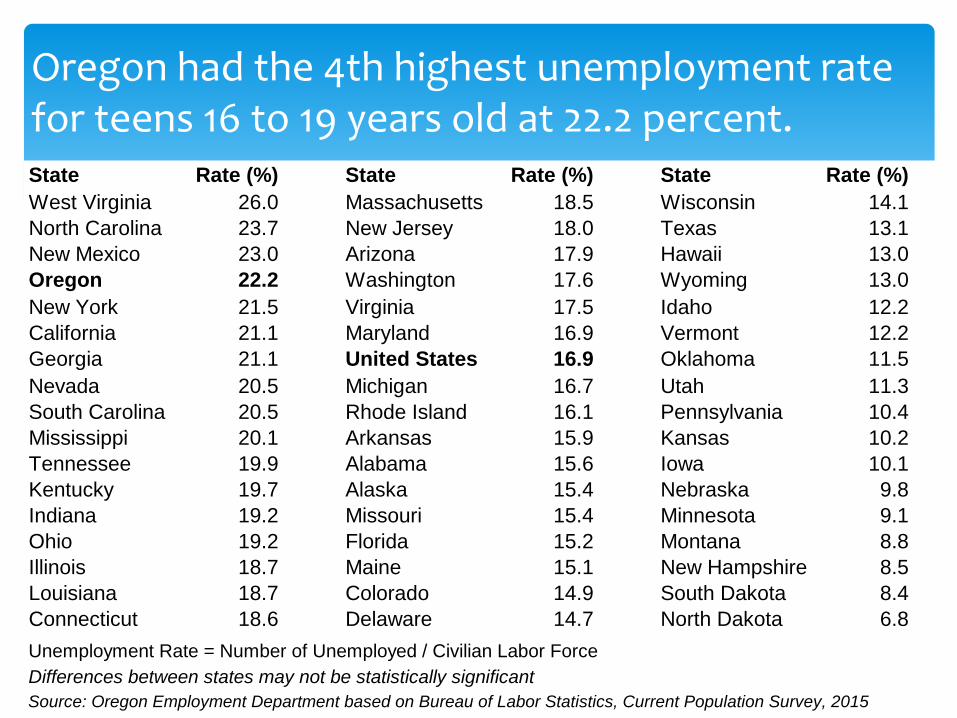
Oregon had the 4th highest unemployment rate for teens 16 to 19 years old at 22.2 percent.State Rate (%) State Rate (%) State Rate (%)
West Virginia 26.0 Massachusetts 18.5 Wisconsin 14.1
North Carolina 23.7 New Jersey 18.0 Texas 13.1
New Mexico 23.0 Arizona 17.9 Hawaii 13.0
Oregon 22.2 Washington 17.6 Wyoming 13.0
New York 21.5 Virginia 17.5 Idaho 12.2
California 21.1 Maryland 16.9 Vermont 12.2
Georgia 21.1 United States 16.9 Oklahoma 11.5
Nevada 20.5 Michigan 16.7 Utah 11.3
South Carolina 20.5 Rhode Island 16.1 Pennsylvania 10.4
Mississippi 20.1 Arkansas 15.9 Kansas 10.2
Tennessee 19.9 Alabama 15.6 Iowa 10.1
Kentucky 19.7 Alaska 15.4 Nebraska 9.8
Indiana 19.2 Missouri 15.4 Minnesota 9.1
Ohio 19.2 Florida 15.2 Montana 8.8
Illinois 18.7 Maine 15.1 New Hampshire 8.5
Louisiana 18.7 Colorado 14.9 South Dakota 8.4
Connecticut 18.6 Delaware 14.7 North Dakota 6.813.4 Texas 10.8
Unemployment Rate = Number of Unemployed / Civilian Labor Force
Differences between states may not be statistically significant
Source: Oregon Employment Department based on Bureau of Labor Statistics, Current Population Survey, 2015
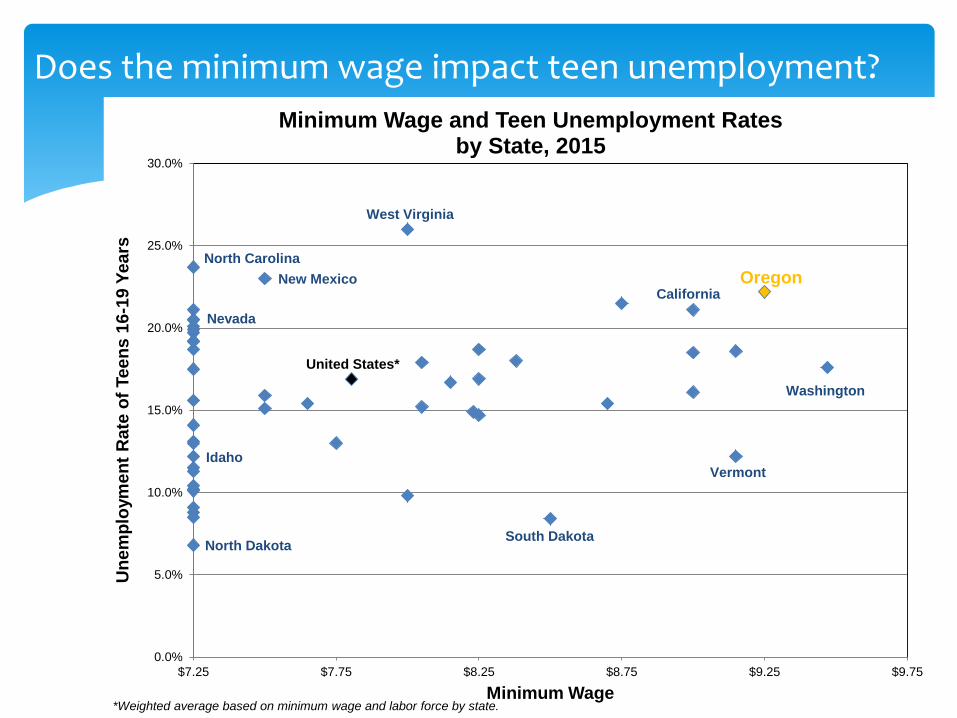
Does the minimum wage impact teen unemployment?
0.0%
5.0%
10.0%
15.0%
20.0%
25.0%
30.0%
$7.25 $7.75 $8.25 $8.75 $9.25 $9.75
Un
em
plo
ym
en
t R
ate
of
Te
en
s 1
6-1
9 Y
ea
rs
Minimum Wage
Minimum Wage and Teen Unemployment Ratesby State, 2015
United States*
Oregon
Vermont
Washington
South Dakota
West Virginia
North Dakota
North Carolina
New Mexico
Idaho
California
Nevada
*Weighted average based on minimum wage and labor force by state.
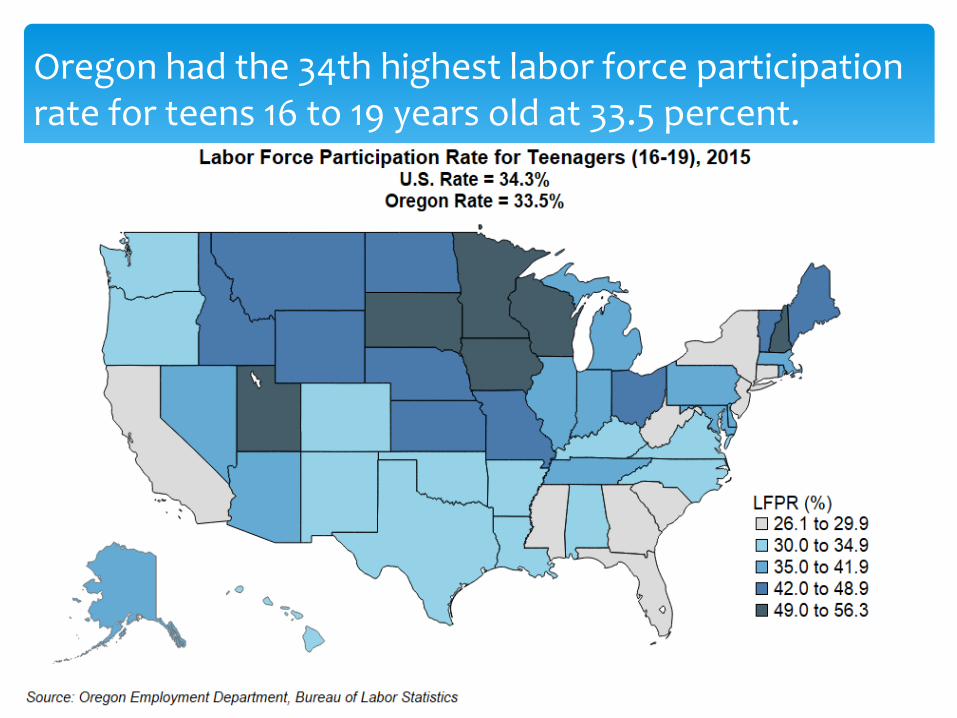
Oregon had the 34th highest labor force participation rate for teens 16 to 19 years old at 33.5 percent.
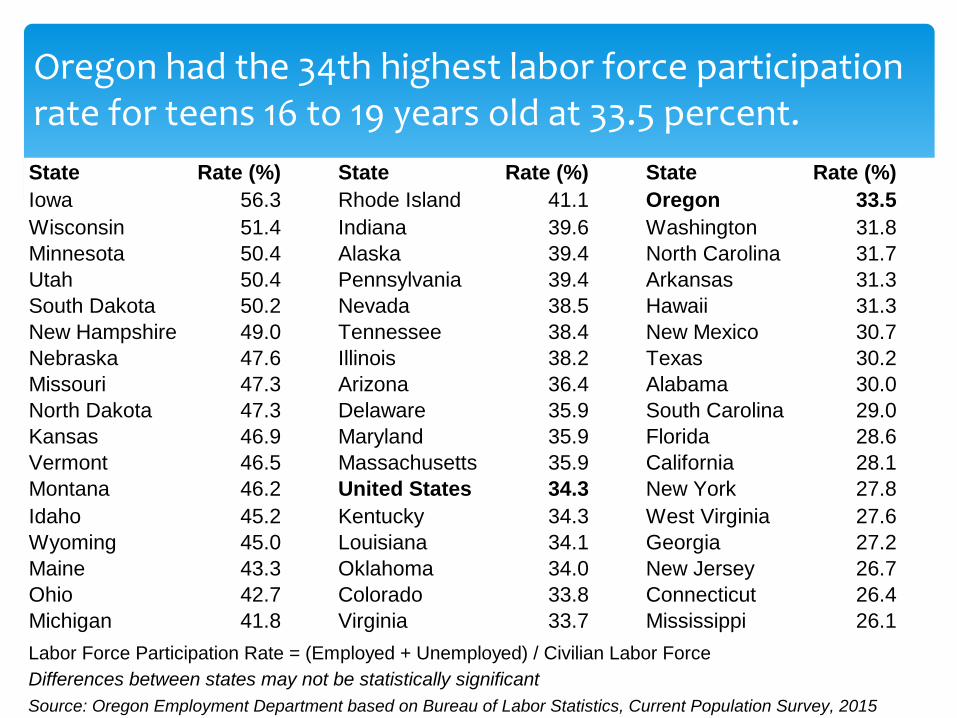
Oregon had the 34th highest labor force participation rate for teens 16 to 19 years old at 33.5 percent.
State Rate (%) State Rate (%) State Rate (%)
Iowa 56.3 Rhode Island 41.1 Oregon 33.5
Wisconsin 51.4 Indiana 39.6 Washington 31.8
Minnesota 50.4 Alaska 39.4 North Carolina 31.7
Utah 50.4 Pennsylvania 39.4 Arkansas 31.3
South Dakota 50.2 Nevada 38.5 Hawaii 31.3
New Hampshire 49.0 Tennessee 38.4 New Mexico 30.7
Nebraska 47.6 Illinois 38.2 Texas 30.2
Missouri 47.3 Arizona 36.4 Alabama 30.0
North Dakota 47.3 Delaware 35.9 South Carolina 29.0
Kansas 46.9 Maryland 35.9 Florida 28.6
Vermont 46.5 Massachusetts 35.9 California 28.1
Montana 46.2 United States 34.3 New York 27.8
Idaho 45.2 Kentucky 34.3 West Virginia 27.6
Wyoming 45.0 Louisiana 34.1 Georgia 27.2
Maine 43.3 Oklahoma 34.0 New Jersey 26.7
Ohio 42.7 Colorado 33.8 Connecticut 26.4
Michigan 41.8 Virginia 33.7 Mississippi 26.1
Labor Force Participation Rate = (Employed + Unemployed) / Civilian Labor Force
Differences between states may not be statistically significant
Source: Oregon Employment Department based on Bureau of Labor Statistics, Current Population Survey, 2015
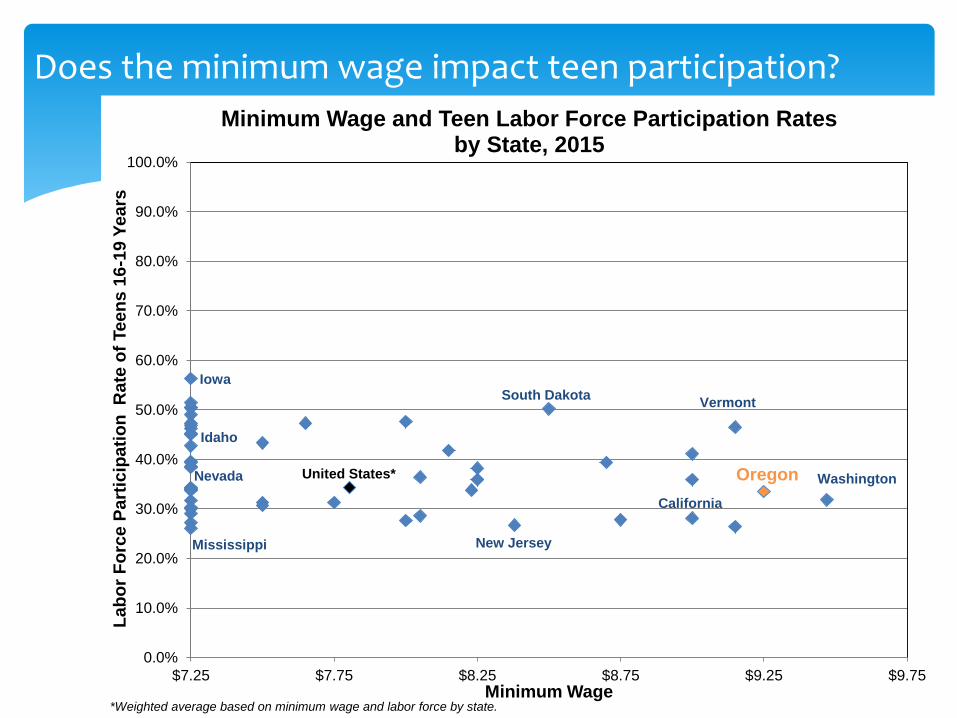
Does the minimum wage impact teen participation?
0.0%
10.0%
20.0%
30.0%
40.0%
50.0%
60.0%
70.0%
80.0%
90.0%
100.0%
$7.25 $7.75 $8.25 $8.75 $9.25 $9.75
La
bo
r F
orc
e P
art
icip
ati
on
R
ate
of
Te
en
s 1
6-1
9 Y
ea
rs
Minimum Wage
Minimum Wage and Teen Labor Force Participation Ratesby State, 2015
United States* Oregon
South Dakota
WashingtonNevada
Mississippi
Idaho
California
Iowa
New Jersey
*Weighted average based on minimum wage and labor force by state.
Vermont
More About Young Adults20-24 Years
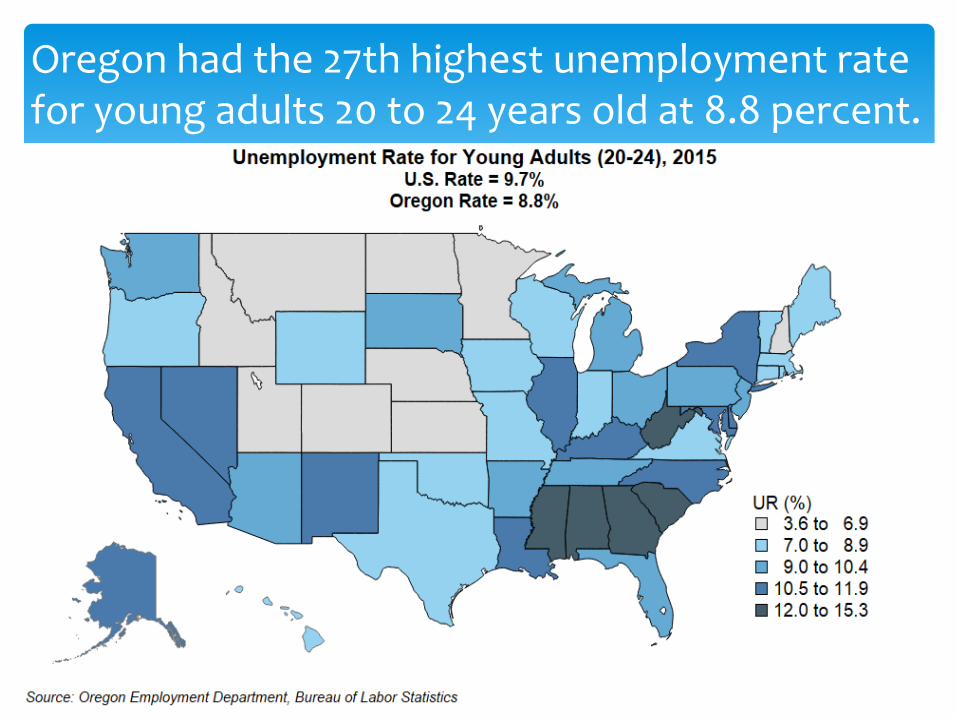
Oregon had the 27th highest unemployment rate for young adults 20 to 24 years old at 8.8 percent.
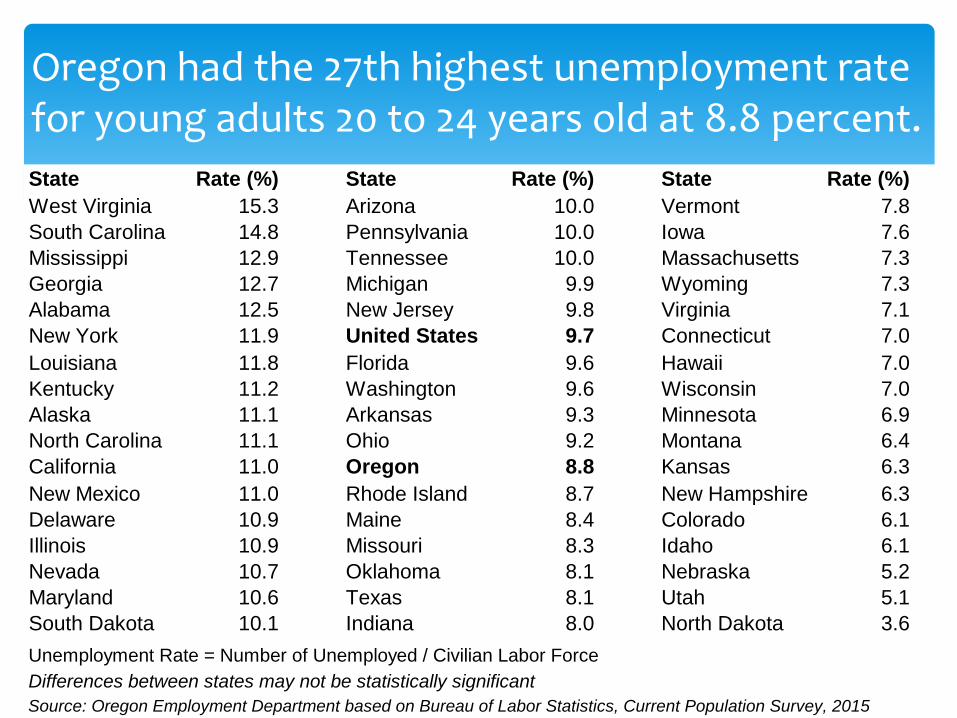
Oregon had the 27th highest unemployment rate for young adults 20 to 24 years old at 8.8 percent.
State Rate (%) State Rate (%) State Rate (%)
West Virginia 15.3 Arizona 10.0 Vermont 7.8
South Carolina 14.8 Pennsylvania 10.0 Iowa 7.6
Mississippi 12.9 Tennessee 10.0 Massachusetts 7.3
Georgia 12.7 Michigan 9.9 Wyoming 7.3
Alabama 12.5 New Jersey 9.8 Virginia 7.1
New York 11.9 United States 9.7 Connecticut 7.0
Louisiana 11.8 Florida 9.6 Hawaii 7.0
Kentucky 11.2 Washington 9.6 Wisconsin 7.0
Alaska 11.1 Arkansas 9.3 Minnesota 6.9
North Carolina 11.1 Ohio 9.2 Montana 6.4
California 11.0 Oregon 8.8 Kansas 6.3
New Mexico 11.0 Rhode Island 8.7 New Hampshire 6.3
Delaware 10.9 Maine 8.4 Colorado 6.1
Illinois 10.9 Missouri 8.3 Idaho 6.1
Nevada 10.7 Oklahoma 8.1 Nebraska 5.2
Maryland 10.6 Texas 8.1 Utah 5.1
South Dakota 10.1 Indiana 8.0 North Dakota 3.613.4 Texas 10.8
Unemployment Rate = Number of Unemployed / Civilian Labor Force
Differences between states may not be statistically significant
Source: Oregon Employment Department based on Bureau of Labor Statistics, Current Population Survey, 2015

Does the minimum wage impact young adult unemployment?
0.0%
2.0%
4.0%
6.0%
8.0%
10.0%
12.0%
14.0%
16.0%
18.0%
$7.25 $7.75 $8.25 $8.75 $9.25 $9.75
Un
em
plo
ym
en
t R
ate
of
Yo
un
g A
du
lts
20
-24
Ye
ars
Minimum Wage
Minimum Wage and Young Adult Unemployment Ratesby State, 2015
United States*
Oregon
Connecticut
Washington
Nebraska
West Virginia
North Dakota
South Carolina
Georgia
Idaho
California
Nevada
*Weighted average based on minimum wage and labor force by state.
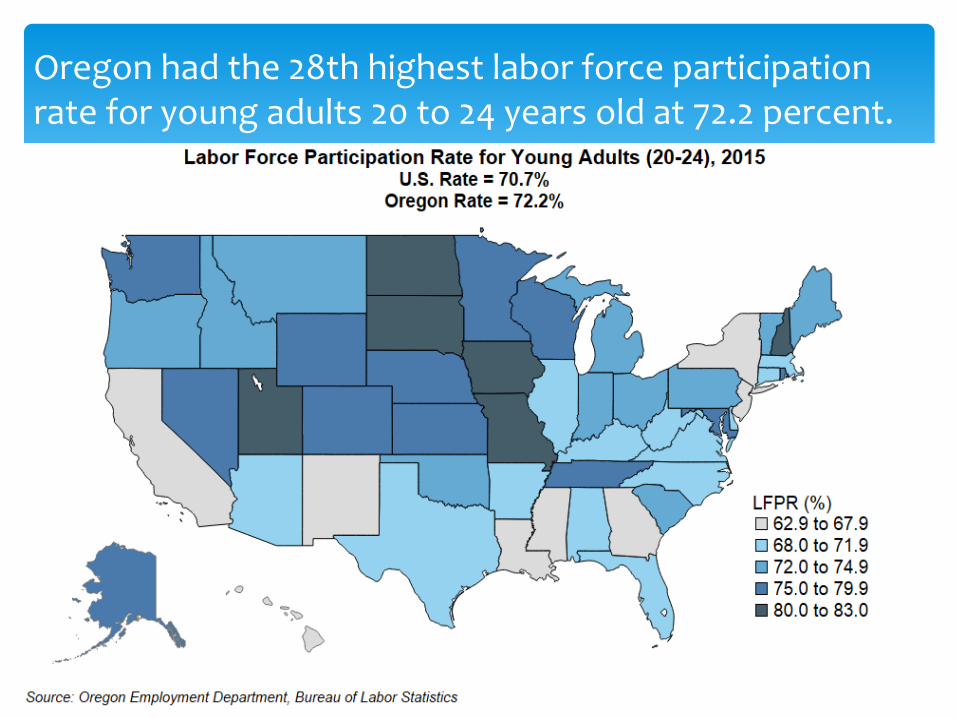
Oregon had the 28th highest labor force participation rate for young adults 20 to 24 years old at 72.2 percent.
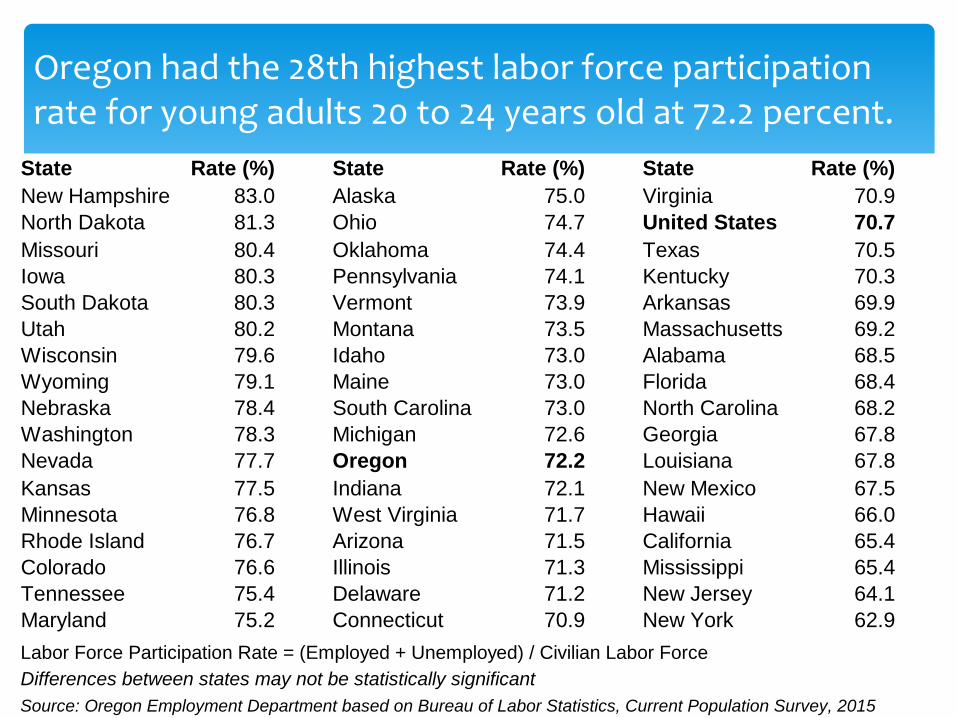
Oregon had the 28th highest labor force participation rate for young adults 20 to 24 years old at 72.2 percent.
State Rate (%) State Rate (%) State Rate (%)
New Hampshire 83.0 Alaska 75.0 Virginia 70.9
North Dakota 81.3 Ohio 74.7 United States 70.7
Missouri 80.4 Oklahoma 74.4 Texas 70.5
Iowa 80.3 Pennsylvania 74.1 Kentucky 70.3
South Dakota 80.3 Vermont 73.9 Arkansas 69.9
Utah 80.2 Montana 73.5 Massachusetts 69.2
Wisconsin 79.6 Idaho 73.0 Alabama 68.5
Wyoming 79.1 Maine 73.0 Florida 68.4
Nebraska 78.4 South Carolina 73.0 North Carolina 68.2
Washington 78.3 Michigan 72.6 Georgia 67.8
Nevada 77.7 Oregon 72.2 Louisiana 67.8
Kansas 77.5 Indiana 72.1 New Mexico 67.5
Minnesota 76.8 West Virginia 71.7 Hawaii 66.0
Rhode Island 76.7 Arizona 71.5 California 65.4
Colorado 76.6 Illinois 71.3 Mississippi 65.4
Tennessee 75.4 Delaware 71.2 New Jersey 64.1
Maryland 75.2 Connecticut 70.9 New York 62.9
Labor Force Participation Rate = (Employed + Unemployed) / Civilian Labor Force
Differences between states may not be statistically significant
Source: Oregon Employment Department based on Bureau of Labor Statistics, Current Population Survey, 2015
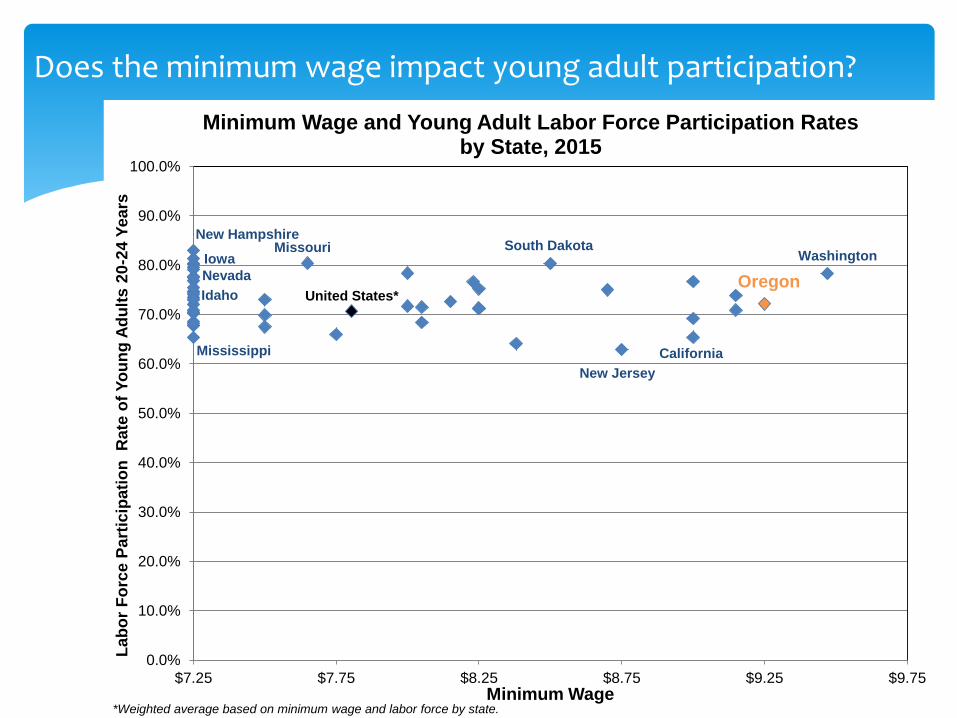
Does the minimum wage impact young adult participation?
0.0%
10.0%
20.0%
30.0%
40.0%
50.0%
60.0%
70.0%
80.0%
90.0%
100.0%
$7.25 $7.75 $8.25 $8.75 $9.25 $9.75
Lab
or
Fo
rce P
art
icip
ati
on
R
ate
of
Yo
un
g A
du
lts 2
0-2
4 Y
ears
Minimum Wage
Minimum Wage and Young Adult Labor Force Participation Ratesby State, 2015
United States*Oregon
MissouriWashington
Nevada
Mississippi
Idaho
California
Iowa
New Jersey
*Weighted average based on minimum wage and labor force by state.
New HampshireSouth Dakota
To find this presentation online, go towww.QualityInfo.org
and use the search box to look up my name
Join the conversation:OregonEmployment.blogspot.com
Twitter @OrEmployment
Nick BeleiciksState Employment [email protected]
503-947-1267