young australians, illness and education - victoria … · young australians, illness and education...
TRANSCRIPT
Young Australians, illness and education Report on the national database project
THE VICTORIA INSTITUTE
Julie White PhD
Karen Rosauer MA
vu.edu.auCRICOS Provider No. 00124KCRICOS Provider No. 02475D
DEC 2013

Final Report
Julie White PhD
Karen Rosauer MA
APRIL 2015
REPORT ON THE NATIONAL DATABASE PROJECT
YOUNG AUSTRALIANS, ILLNESS AND EDUCATION
Acknowledgements Ronald McDonald House Charities (RMHC) has demonstrated unparalleled commitment to improving the educational outcomes of students with chronic illness throughout Australia. The charity has supported 6,000 students recovering from serious health conditions to remain engaged with their education. RMHC provided substantial financial and in-kind support through its Ronald McDonald Learning Program (RMLP). The study was jointly funded through the Victoria University ‘Out of Cycle’ grant scheme that aims to foster and develop long-term research partnerships. Victoria University and The Victoria Institute co-funded this project with RMHC. The preparation of this report was also supported by the Australian Government’s Collaborative Research Network (CRN) program.
The project was conceptualised in 2011 when Tracey Webster, RMLP National Learning Program Manager and Anita Neville, RMLP National Operations and Victorian State Manager discussed the database they had recently established with Julie White. Dr Iris Dumenden, Research Officer, VU helped develop the idea into a proposal. The project was also supported in its development phase by staff at the VU Research Office and The Victoria Institute. Debbie Krapywnyj and Stanley Koh provided valuable practical assistance at the proposal phase. Associate Professor Deborah Zion, Chair of the VU Human Research Ethics Committee assisted with navigation through ethical concerns.
A number of people contributed to and supported the conduct of the study in important ways. In particular, Anita Neville and Fiona Giles, Education Coordinator, from the Ronald McDonald Learning Program in Melbourne were actively involved in the project throughout its operation. They provided thoughtful and generous advice in project steering committee meetings as well as direct support about the database. During the extended data-cleaning phase, they continued to provide important information and insight to the researchers and responded to many questions during all phases.
The two-day analysis data workshop held at The Victoria Institute in July 2014 was an important part of this study. We appreciate the participation of Tracey Webster, Anita Neville, Fiona Giles, Barb Donnan RMLP Psychologist and Alistair Lum, RMLP supported PhD student. We thank these people for travelling to Melbourne and for their questions and valuable input into this project.
James Antrim, National Information Systems Manager for Ronald McDonald House Charities assisted with practical issues about the database via teleconference. Associate Professor Charles Lawoko, Coordinator, Research Design and Statistical Consulting, VU, was consulted several times during the analysis phase. Continued assistance was also received from Esther Doecke, Research Officer, Centre for International Research on Education Systems, VU. Dr Daniel Rosauer, Research School of Biology at the Australian National University generously assisted with preparation of the maps.
This final report was prepared with the assistance of Hendrik Jacobs, Communications Officer at The Victoria Institute.
AddressVictoria UniversityCity Queen Campus300 Queen StreetVIC, 3000Australia
Phone: +61 3 9919 5934Email: [email protected]
The Victoria InstituteAbout
Well placed within Victoria University, The Victoria Institute has social justice as a key focus. Our researchers work collaboratively with a range of government departments, policy makers, philanthropic organisations and community groups.
The Victoria Institute operates with the explicit intention of improving educational experiences and outcomes for all.
Our targeted research program aims to build better learning and greater participation and success for students from diverse and disadvantaged backgrounds as well as those who are disengaged or excluded. This includes the group of young people targeted by this particular project, who have significant health conditions that can affect their participation and success in education.
The Victoria Institute is connected with the College of Education and works in association with The Mitchell Institute and the Centre for International Research on Education Systems.
The Victoria Institute was established in 2011 under the leadership of Professor Roger Slee. It is a research-intensive unit focused on impact and influence, particularly in the areas of educational reform and inclusive practices.
Figures ..............................................................................................8Abbreviations ...................................................................................9Executive summary ......................................................................111. Orientation to this study and the report ....................................13
1.1 Research focus ............................................................................ 131.2 The Ronald McDonald Learning Program (RMLP) ........................ 141.3 The RMLP database..................................................................... 151.4 Research purpose ........................................................................ 161.5 Ethics approval ............................................................................. 171.6 Overview of the project and report ................................................ 18
2. Research about children with serious health conditions and education .........................................................19
2.1 Prior research ............................................................................... 193. Scoping and preparation: Working with the database ..............27
3.1 Knowledge discovery in databases............................................... 273.2 Scoping the project ...................................................................... 283.3 Data preparation .......................................................................... 29
4. Analysing RMLP student records ..............................................334.1 Student numbers ......................................................................... 344.2 Affiliation codes ............................................................................ 344.3 Referral to the RMLP program ..................................................... 364.4 Health condition .......................................................................... 374.5 Gender and health condition ....................................................... 404.6 School absence .......................................................................... 434.7 School absence and health condition .......................................... 444.8 Age and school year level ............................................................ 464.9 Aboriginal and Torres Strait Islander ............................................. 474.10 Language other than English at home ..................................... 534.11 School sector ......................................................................... 554.12 Location of students ................................................................ 56
5. RMLP students and socio-economic status (SES) .....................595.1 Using the ABS socio-economic indexes ....................................... 595.2 SES and RMLP students .............................................................. 615.3 SES and health condition ............................................................. 635.4 Exploring SES and other variables ................................................ 71
Contents
1.1 Language other than English at home .......................................... 491.2 School sector ............................................................................... 501.3 Location of students ..................................................................... 51
4.104.114.12
6. Discussion and recommendations .............................................776.1 Overview ...................................................................................... 776.2 Key themes from the literature ...................................................... 776.3 Counting these students .............................................................. 786.4 School absence ........................................................................... 806.5 Individual illness ............................................................................ 806.6 Support provision ......................................................................... 816.7 Parent associates ......................................................................... 816.8 Conclusion ................................................................................... 826.9 Recommendations ....................................................................... 83
References ...................................................................................85

Young Australians, illness and education April 20158
FiguresFIGURE 4.2.1 PEOPLE IN THE RMLP DATABASE.......................................................................................................................... 35FIGURE 4.3.1 SOURCES OF PROGRAM REFERRAL ....................................................................................................................36FIGURE 4.4.1 STUDENT REPORTED PRIMARY HEALTH CONDITION.......................................................................................... 38FIGURE 4.4.2 STUDENT REPORTED PRIMARY HEALTH CONDITION – GROUPED.................................................................... 38FIGURE 4.4.3 ESTIMATED NUMBER OF CHILDREN 5-17 DIAGNOSED WITH CANCER, 2011-2013.......................................... 40FIGURE 4.5.1 STUDENT GENDER.................................................................................................................................................. 41FIGURE 4.5.2 STUDENT HEALTH CONDITIONS AND GENDER.................................................................................................... 42FIGURE 4.5.3 STUDENTS WITH CANCER AND GENDER............................................................................................................. 42FIGURE 4.5.4 AVERAGE NUMBER OF NEW CASES DIAGNOSED PER YEAR, CHILDREN (0-14), GREAT BRITAIN................... 43FIGURE 4.6.1 AMOUNT OF SCHOOL RMLP STUDENTS HAVE MISSED (AT TIME OF ENTRY TO RMLP).................................. 44FIGURE 4.6.2 OVER WHAT PERIOD OF TIME WAS SCHOOL MISSED......................................................................................... 44FIGURE 4.7.1 AMOUNT OF MISSED SCHOOL AND HEALTH CONDITION................................................................................... 45FIGURE 4.7.2 OVER WHAT PERIOD OF TIME WAS THE SCHOOL MISSED AND HEALTH CONDITION .................................... 46FIGURE 4.8.1 AGE AT ENTRY TO RMLP......................................................................................................................................... 47FIGURE 4.8.2 SCHOOL YEAR LEVEL AT ENTRY TO RMLP........................................................................................................... 47FIGURE 4.9.1 STUDENTS WHO IDENTIFY AS ABORIGINAL OR TORRES STRAIT ISLANDER.................................................... 48FIGURE 4.9.2 RMLP STUDENTS AND AUSTRALIAN POPULATION IDENTIFYING AS ATSI IN EACH AUSTRALIAN STATE....... 48FIGURE 4.10.1 LANGUAGE SPOKEN AT HOME............................................................................................................................ 49FIGURE 4.10.2 LANGUAGES SPOKEN AT HOME OTHER THAN ENGLISH.................................................................................. 50 FIGURE 4.11.1 SCHOOL SECTOR FOR RMLP STUDENTS........................................................................................................... 51FIGURE 4.11.2 SCHOOL SECTOR FOR ALL AUSTRALIAN CHILDREN IN SCHOOL.................................................................. 51FIGURE 4.12.1 MAP OF ALL RMLP STUDENTS IN AUSTRALIA .................................................................................................. 52FIGURE 4.12.2 NUMBER OF RMLP STUDENTS IN EACH STATE ................................................................................................ 53FIGURE 4.12.3 PERCENTAGE OF RMLP STUDENTS IN EACH STATE, COMPARED WITH PERCENTAGE OF AUSTRALIAN POPULATION IN EACH STATE.......................................................................... 53FIGURE 4.12.4 LOCATION OF RMLP EDUCATION COORDINATORS........................................................................................... 54FIGURE 4.12.5 POSTCODE AREAS WITH 10 OR MORE STUDENTS........................................................................................... 56FIGURE 4.12.6 LOCATION OF STUDENTS IN THE MELBOURNE REGION – BY POSTCODE AREA .......................................... 56FIGURE 4.12.7 LOCATION OF STUDENTS IN THE WIDER SYDNEY REGION – BY POSTCODE AREA. .................................... 57FIGURE 4.12.8 LOCATION OF STUDENTS IN THE SYDNEY REGION – BY POSTCODE AREA .................................................. 57FIGURE 5.1.1 INDEX OF RELATIVE ADVANTAGE AND DISADVANTAGE FOR AUSTRALIAN POSTCODE AREAS...................... 61FIGURE 5.2.1 RMLP STUDENTS AND SES.................................................................................................................................... 62FIGURE 5.1.2 AUSTRALIAN POPULATION AND SES.................................................................................................................... 62FIGURE 5.1.3 RMLP STUDENTS, AUSTRALIAN POPULATION AND SES .................................................................................... 63FIGURE 5.3.1 STUDENT SPREAD BETWEEN POSTCODE AREAS THAT HAVE MORE OR LESS ADVANTAGE.......................... 64FIGURE 5.3.1.1 STUDENTS WITH CANCER AND SES ................................................................................................................. 65FIGURE 5.3.1.2 RMLP STUDENTS WITH CANCER, ALL RMLP STUDENTS AND ALL AUSTRALIANS AND SES....................... 65FIGURE 5.3.2.1 STUDENTS WITH ASTHMA AND SES.................................................................................................................. 66FIGURE 5.3.3.1 STUDENTS WITH CYSTIC FIBROSIS AND SES................................................................................................... 67FIGURE 5.3.4.1 STUDENTS WITH TRAUMA AND SES.................................................................................................................. 67FIGURE 5.3.5.1 STUDENTS WITH DIABETES AND SES................................................................................................................ 68FIGURE 5.3.6.1 STUDENTS WITH CARDIAC CONDITIONS AND SES.......................................................................................... 69FIGURE 5.3.7.1 STUDENTS WITH RENAL CONDITIONS AND SES.............................................................................................. 69FIGURE 5.3.8.1 STUDENTS WITH EPILEPSY AND SES................................................................................................................ 70FIGURE 5.4.1.1 STUDENTS WHO ONLY HAVE A MOTHER LISTED AND SES............................................................................. 72FIGURE 5.4.1.2 STUDENTS WHO ONLY HAVE A FATHER LISTED AND SES............................................................................... 73FIGURE 5.4.2.1 STUDENTS IDENTIFIED AS ABORIGINAL OR TORRES STRAIT ISLANDER AND SES....................................... 73FIGURE 5.4.3.1 STUDENTS WITH ENGLISH AND ANOTHER LANGUAGE SPOKEN AT HOME AND SES.................................. 74FIGURE 5.4.3.2 RMLP STUDENTS WITH A LANGUAGE AT HOME IN ADDITION TO ENGLISH, ALL RMLP STUDENTS AND ALL AUSTRALIANS AND SES................................................................................. 75FIGURE 5.4.3.3 STUDENTS WITH ONLY A LANGUAGE OTHER THAN ENGLISH AT HOME AND SES....................................... 76
Young Australians, illness and education April 2015 9
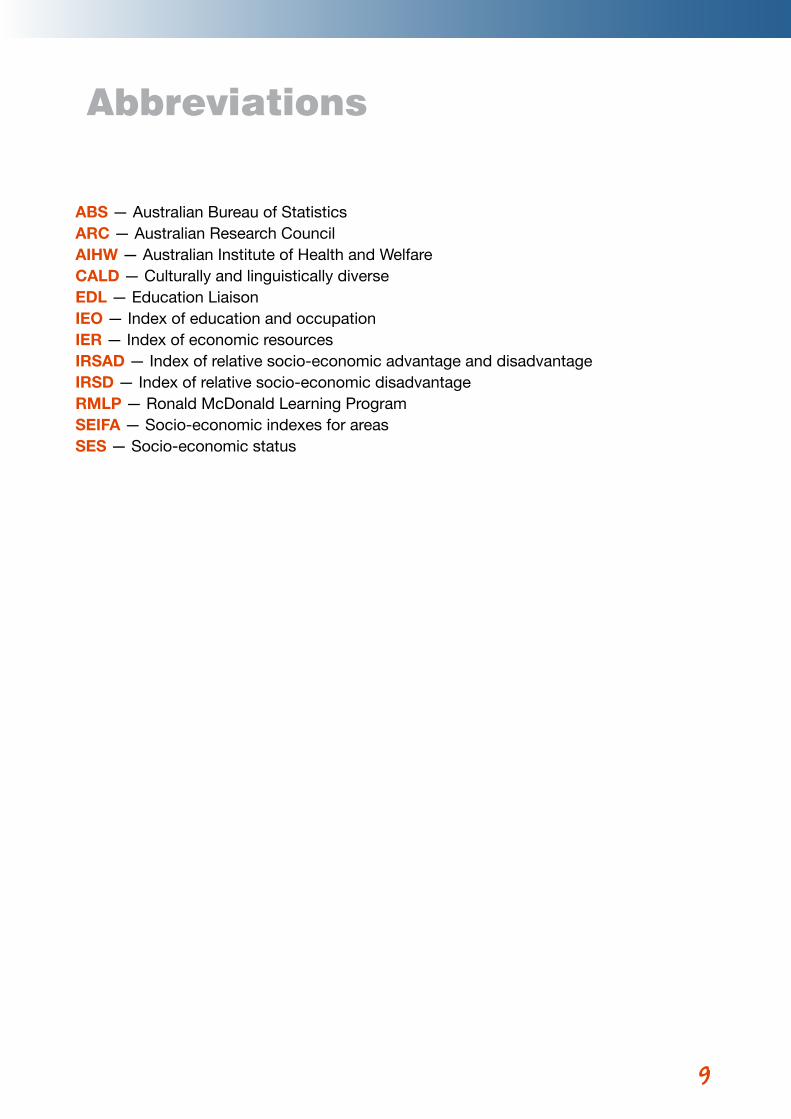
Abbreviations
ABS — Australian Bureau of StatisticsARC — Australian Research CouncilAIHW — Australian Institute of Health and WelfareCALD — Culturally and linguistically diverseEDL — Education LiaisonIEO — Index of education and occupationIER — Index of economic resourcesIRSAD — Index of relative socio-economic advantage and disadvantageIRSD — Index of relative socio-economic disadvantageRMLP — Ronald McDonald Learning Program SEIFA — Socio-economic indexes for areasSES — Socio-economic status
Young Australians, illness and education April 2015 11 EXECUTIVE SUMMARY 10
Young Australians, illness and education April 2015 1111 EXECUTIVE SUMMARY
Executive Summary
Australia’s health system faces many challenges related to chronic and complex health conditions. Major
advances in biomedicine mean that children and young people are now surviving conditions that would
have meant early death just a short time ago. This has major implications for Australia’s education systems.
A troubling side effect of this success in medicine is the number of children and young people who manage
their chronic health conditions, but who can easily remain overlooked in education. In many ways this is
a new frontier for teachers, schools and education systems. Never before have so many students been
present in our classrooms, who have survived major health challenges, but who are not yet systematically
supported to thrive in education.
This report provides a detailed summary of education, health and demographic information about Australian
children and young people who live with significant health conditions. This study closely examined an
important national database of 2360 such individuals.
This study is contextualised within recent international literature from the fields of education, medicine,
oncology, public health, paediatric nursing, psychology, counselling, psychiatry and social policy. Socio-
economic indexes developed by the Australian Bureau of Statistics were employed in the analysis of data.
As Australian government figures are not available about these young people as an educational cohort,
the major purpose of this study was to provide an empirical base for policy recommendation and further
investigation. An important secondary aim of the study was to contribute to the growing body of evidence
about pressing educational issues related to these children and young people. Concern about the education
of this group is expected to escalate as this cohort of Australian students continues to expand, due to
advances in biomedicine.
Recommendations
1. To systematically identify students enrolled in Australian schools who have health conditions.
2. To identify students with health conditions as a collective educational cohort, rather than individual young people who are isolated medical aberrations.
3. To retrieve and analyse data related to school absence from education system databases for (a) student stays in hospital, (b) students who spend periods of time at home recuperating, and (c) students with patterns of frequent or sporadic absences due to health conditions.
4. To develop and publish government policy and guidelines to explain the legal entitlement to reasonable adjustment for students with health conditions.
5. To provide practical assistance to schools that explain the legal obligations to support students with health conditions.
12 13 1 Orientation to this study and the report Young Australians, illness and education April 2015
6. To establish guidelines and procedures for schools regarding assistance for students with health conditions.
7. To establish a comprehensive checklist for use by families, teachers and health professionals that supports clear communication and monitoring of (a) the effects of the student’s health condition on their learning, and (b) reasonable adjustment measures.
8. To develop a system to monitor Australian students with health conditions.
9. To use the RMLP database as a quality resource for further research, particularly about students with cancer and their education.
10. To undertake research into the connections between: (a) social determinants of health, (b) Australian SES data, and (c) the education of students with health conditions.
13
1
13 1 Orientation to this study and the report
ORIENTATION TO THIS STUDY AND THE REPORT
This chapter outlines the context, focus and purpose of this study as well as an overview of each chapter.
Background information about the partner organisation, Ronald McDonald Learning Program (RMLP) whose
database was investigated in this project is also found here.
1.1 The Research FocusThe primary aim of this study was to develop empirical evidence about young people in Australia with
serious and continuing health conditions and their education. Government figures about these young
people, as a growing and substantial cohort of students, has not previously been available, making
this study significant. A key purpose for undertaking this research was to build evidence to influence
Departments of Education and school-level practice in Australia.
This study builds upon the ARC Linkage project (LP0669735), Keeping Connected: Identity, Social
Connection and Education for Young People Living with Chronic Illness (Yates et al., 2010) on which Julie
White was a Chief Investigator. The major component of that study was a longitudinal ethnographic study
of the lives of 31 students who lived with serious ongoing health conditions. That study revealed a series
of issues these young people face in relation to identity, education and school life, as well as related
challenges faced by their families. However as an ethnographic study, the project did not produce larger
scale empirical data – of the type that might compel governments to act.
Key contextual understandings underpinning this study:
• The number of young people in Australian schools with serious ongoing health conditions
has increased dramatically over the past decade, with significant improvements in medicine
leading to substantially increased rates of survival for a range of conditions. This means
that many more children attend school and will live well into adulthood.
• Education leads to essential social and economic outcomes for young people and society
and is as important for students with health conditions, as it is for others.
• Young people with serious ongoing health conditions (and their parents) frequently face
significant communication difficulties with schools.
• Students with serious health conditions can also face difficulties connecting socially at
school and bullying has been reported as widespread.
• Government Departments of Education do not monitor these students either individually or
as a cohort.
• It is anticipated that these students will not be identified or included in the 2015 Federal
Government count of Australian students with disability in education.
Young Australians, illness and education April 2015
14 15 1 Orientation to this study and the report
• Government Departments of Education have developed policy but only for extreme cases
where students cannot attend regular schools.
• Children and young people with health conditions are entitled to ‘reasonable adjustment’
and support within their schools under national disability legislation in Australia, but
knowledge about this in families and within education is low.
• There has been little research about the education of children and young people with
serious ongoing health conditions.
The Ronald McDonald Learning Program (RMLP) is a national philanthropic program that provides short-
term support for children with serious ongoing health conditions who have been associated with paediatric
hospitals and missed significant periods of school. Like many philanthropic programs, the Learning
Program developed because no adequate education service existed for this growing number of students.
The program provides practical support for young people to return to school and participate in education.
It should be noted here that the majority of Australian students who live with serious health conditions do
not participate in this program and are not represented in the RMLP database. However, as figures about
students with health conditions are not available in Australia, this project provides an important starting
point for longer-term research that identifies numbers of students in each state and territory with health
conditions, existing educational needs and provision as well as gaps and requirements in system and
school level educational support.
This report outlines the systematic analysis undertaken of the RMLP database and contextualises the study
within the international literature. Demographic information contained in the database has been closely
examined. Conclusions, and recommendations have been developed directly from this analysis and from
the wider research context.
1.2 The Ronald McDonald Learning Program (RMLP)From the beginning of the program in NSW in 1998 with 10 students, RMLP currently has 1086 students,
and has provided educational support to 6,000 students since 1998. The program currently employs 794
qualified teachers as tutors, with education coordinators in 16 locations around Australia (see Figure 4.12.4).
All the Australian states, the Australian Capital Territory and Northern Territory have programs.
The Ronald McDonald Learning Program comprises of several interrelated strands.
1.2.1 TuitionThe core program involves 40 weekly individual tuition sessions with a qualified and experienced teacher,
funded and organised by RMLP in negotiation with the child’s family and school. The aim of this tuition is
to assist students to re-enter school after a period of absence, due to illness or injury. Individual learning
plans are developed after psychometric assessment and other services, such as speech and occupational
therapy, which are provided free of charge.
RMLP’s Tuition Program caters for young people who have missed at least 40 days of school as a result
of an acute or chronic illness or trauma. It is provided for young people who are eligible to be enrolled in a
mainstream classroom and have experienced illness or trauma. Young people with an intellectual disability
Young Australians, illness and education April 2015
1515 1 Orientation to this study and the report
or condition such as Down syndrome or autism, are not eligible for this program as they have other avenues
of educational support (Ronald McDonald Learning Program).
1.2.2 Education Coordinators - CommunicationA team of education coordinators is employed to assist communication between the young people, parents,
program tutors and schools. The education coordinators take initial referrals and enquiries, organise
assessments to be undertaken, find a suitable teacher in a child’s locality to be the tutor and monitor
progress by maintaining communication with tutors, parents and schools.
1.2.3 Education Liaison Between Hospital, Family and SchoolIn response to a clearly identified and urgent need, the RMLP has implemented a new initiative to provide
an education liaison service, to assist students with their education after they leave the hospital and before
they are able to return to school. This has involved the employment of experienced teachers with significant
expertise and basing them in Australian paediatric hospitals. These coordinators undertake the important
liaison work between family, school and hospital, that is not undertaken by government funded hospital
special schools or education services associated with paediatric hospitals.
1.2.4 Information for ParentsRMLP also provides information for parents including advice about advocacy in schools, important
resources and points of contact. This information is provided on the program website and in the form of
booklets.
1.2.5 Information for TeachersAnother aspect of the RMLP is the accredited teacher professional development course (EDMed) that
introduces teachers to issues related to students with serious health conditions and how curriculum can
be modified and adapted to include greater participation of the individual young people in the regular class
programs. This professional learning program is regularly conducted free of charge for whole school groups
and teams in schools in all Australian states and territories; in government, Catholic and independent
sectors. To support this professional learning program, teachers who attend are given a detailed manual.
Both components of the EDMed program serve to introduce teachers to issues involved in accommodating
these students into classrooms.
The EDMed program is also offered to pre-service teacher education courses in universities via lectures and
workshops. This is also provided freely and frequently.
1.3 The RMLP Database The RMLP database is the source of the data for this research project. It contains individual records for
each student accepted either for the Tuition Program or the Education Liaison Program as well as referrals
made by parents, health professionals, hospital school teachers, or classroom teachers.
The database is a specifically modified version of Telosa’s Exceed software suite, designed for fundraising
by non-profit organisations (Telosa Software, 2014). This version of the software was developed for use by
Ronald McDonald Houses around the world, and has been further modified for use by Australia’s Ronald
McDonald Learning Program. RMLP developed the National Information System, with the Exceed database
forming a central part of the system, in 2010 (Ronald McDonald Learning Program, 2014). Records were
first entered into the database on 26th May 2011.
Young Australians, illness and education April 2015
16 17 1 Orientation to this study and the report Young Australians, illness and education April 2015
The database includes information related to students, their families, tutors, other professionals and
schools. Standard forms have been used to gather the national information, which is entered into the
database. A key form is the student intake form, completed by parents or guardians in conjunction with the
Education Coordinator.
When RMLP education coordinators make contact with the parents, tutors, or schools, information about
these communications are entered into the database. The database therefore contains both a record of
information related to each student and their family and a record of actions relating to the student.
This project looked only at de-identified demographic data relating to students and their families and did
not access or analyse data related to the comments or actions of education coordinators, parents, tutors,
or students. This was due to the limited permission gained from the University Ethics Committee that raised
concerns (see section 1.5).
In addition to student information entered into the database from the student intake forms, some student
information had also been entered into the database when a parent or hospital staff member contacted
RMLP to establish individual eligibility or make referrals.
For this project, data from the initial phases of the intake process was analysed along with the other student
records. Exceptions included student records that had been closed with no evidence of the student ever
starting in the program, or where no address details had been entered or there was no evidence of contact
with the student, parents or guardians. More details on student records that were excluded from this
analysis are provided in section 3.2 Data preparation.
1.4 Research PurposeThe major purpose of this small study was to establish an empirical base to support the continuing
development of the larger research agenda regarding school aged children and young people who live with
significant health challenges.
During the planning and proposal phases of this study, three overarching research questions were used as a
guide for the study.
1. What do children and young people, their parents, teachers and clinicians report about their
learning as they transition repeatedly between hospital, home and school?
2. What enables children and young people with chronic illness to succeed in schooling?
3. What factors and processes shape these students’ trajectories and what recommendations can be
proposed for improved practices?
These questions were deliberately broad to retain the focus on what is known from the literature and from
the earlier study (Yates et al., 2010) about the education of this cohort. It was not intended that these
questions would be directly answered, but that they would assist the research team to retain focus on the
larger research program about education regarding these students. Of specific interest is the extent to
which:
• teachers, schools and education systems acknowledge the challenges these students face;
• these students’ entitlement to inclusion and participation in school is recognised and supported;
1717 1 Orientation to this study and the report Young Australians, illness and education April 2015
• education systems take responsibility to support and advise schools about implementing Australian legislative requirements regarding ‘reasonable adjustment’ for these students.
The database at the centre of this project does not contain information about the majority of those
Australian children and young people who live with serious health conditions. However, the wider research
context that informed the design of this study, particularly the review of recent international literature
consistently points to widespread concern about the education of these students.
The RMLP database is significant as it is the first Australian source of national data about this cohort that
was developed for educational purposes. Further it provides empirical evidence about the education of
children and young people with health conditions.
1.5 Ethics Approval Because of the potentially sensitive focus of a study related to Australian children and young people with
health challenges, the initial application for approval was submitted to the full Human Research Ethics
Committee (HREC) at Victoria University.
The concerns raised by that committee did not relate to the records of the children or their families, but
focused on three other concerns:
1. a general negative concern about database research, which it viewed as problematic and likened to
‘fishing’ exercises;
2. the lack of specificity contained in the initial HREC application and subsequent amendments that
related to:
a. the nature of the contents of the database;
b. the proposed analytical process;
3. that reports written by teachers contained in the database did not have the informed consent of
those teachers for these reports to be used for research purposes; and that retrospective consent
could not be obtained.
The lead researcher had not yet established familiarity with the database, beyond a general understanding,
in the belief that HREC approval was required prior to access. The second researcher had not yet been
appointed to work on the study. Therefore, clear knowledge about the exact contents of the database at
the centre of the study was not yet known. This was something of a ‘chicken and egg’ conundrum, with
the lead researcher being unwilling to commit to any particular analytical approach, as it was not yet known
what would be the most appropriate.
The teachers who wrote the reports were employees of the Ronald McDonald Learning Program whose
reports were prepared while they operated as program tutors. The argument was forwarded that these were
not classroom teachers and this data should be included in the study, without success. It was subsequently
discovered that the majority of these reports had not been entered into the database, so it turned out to be
a moot point.
After several discussions between the lead researcher and the chair of the HREC, the decision was taken to
focus the study on demographic information and to clearly locate the study within the research literature.
Young Australians, illness and education April 201518
At first this limitation seemed detrimental to the study, but over time it became a strength. The employment
of creativity was required to determine how best the extensive demographic data, contained within the
database, could be analysed to produce useful knowledge about children and young people with chronic
illness. The early challenge to the study by the HREC had an unintentional effect of ensuring clarity and
focus.
1.6 Overview of the Project and ReportThere were five key phases of the project:
1. Contextualisation: Research literature from a range of fields was scanned to assist with the
contextualisation of this study. (Chapter 2)
2. Defining the scope and data preparation:
Identifying the scope of the study required familiarity with database contents, investigation of analytical
options, extraction and preparation of data for analysis (Chapter 3).
3. Investigation of demographic information: Student records in the database were analysed, aggregated
and presented in summary form (Chapter 4).
4. Investigation of socio-economic status factors: SES data was examined, using Australian Bureau of
Statistics data to investigate how information in the database compares with what is known about factors
associated with socio-economic status in Australia (Chapter 5).
5. Analysis workshop: Questions and comments were raised during the intensive two-day analysis
workshop that brought together the researchers and key individuals from the RMLP program (See Chapter
3). These discussions prompted further investigation of the data, which has been incorporated into three
sections of this report (Chapters 4, 5 and 6).
19 2 Research about children with serious health conditions and education
19Young Australians, illness and education April 2015 19 2 Research about children with serious health conditions and education
2RESEARCH ABOUT CHILDREN WITH SERIOUS HEALTH CONDITIONS AND EDUCATION
This chapter provides an overview of prior research about children with serious health conditions and
education.
2.1 Prior Research
2.1.1 IntroductionThirty years ago, Gortmaker and Sappenfield (1984) anticipated the social changes that would evolve as
medical advances dramatically increased the numbers of children surviving and surviving longer with a
range of serious and chronic illnesses, including cancer and cystic fibrosis. In this widely cited article, the
difficulty and importance of obtaining data about the prevalence of chronic childhood conditions, is raised.
Data is important, they argue, to enable thoughtful planning to support these children across diverse
communities, especially as any given community will usually have only a small number of children with a
particular condition.
Since that publication, a steady stream of academic articles has been published reporting on research
projects about children and adolescents with health conditions. Some have focused on: quality of life
(Berntsson, Berg, Brydolf, & Hellström, 2007; Koot & Wallander, 2014); psychosocial impacts (Blum 1992;
Eiser, 1993; Morad, Kandel, Hyam, & Merrick, 2004; Sawyer, Drew, Yeo, & Britto, 2007) and transition
to adulthood (Gortmaker, Perrin, Weitzman, Homer, & Sobol, 1993; Stam, Hartman, Deurloo, Groothoff,
& Grootenhuis, 2006). There have also been a small number of research projects directly relating to the
education of these children and young people. Most of these relate to children with a particular condition,
most commonly cancer, (Donnan, 2011; Katz, Rubinstein, Hubert, & Blew, 1989; Rynard, Chambers, Klinck,
& Gray, 1998). And some projects relate to the education of children with health conditions as a group
(Bradley-Klug et al., 2013; Clay, Cortina, Harper, Cocco, & Drotar, 2004; Daly, 2013; Fowler, Johnson,
& Atkinson, 1985; Kaffenberger, 2006; Mukherjee, Lightfoot, & Sloper, 2000; M. Weitzman, 1986; West,
Denzer, Wildman, & Anhalt, 2013; Yates et al., 2010). Research focused on inclusion of children with
disabilities in schools also occasionally talks explicitly about children with chronic health conditions (Slee,
2011).
Australian reviews of the literature on children with chronic illness and their education, have noted the lack
of research about education for children with a chronic illness or serious ongoing health condition (Jackson,
2012; Shiu, 2001).
20 Young Australians, illness and education April 2015 21 2 Research about children with serious health conditions and education
Along with investigating the impact of serious health conditions on young people’s lives, there are
investigations into the effect of socio-economic status (SES) on young people’s health (Barr, Britton, Smyth,
& Fogarty, 2011; Cassedy et al., 2013; Gortmaker et al., 1993; Heaney et al., 2002; Minnick, Boynton,
Ndirangu, & Furth, 2010; Orton, Kendrick, West, & Tata, 2014; Schechter, Shelton, Margolis, & Fitzsimmons,
2001; Stokes, Ashby, & Clapperton, 2001; Wong et al., 2014; Yu et al., 2014), and conversely the impacts
of having a child with a serious health condition or disability on the SES of the family (Maguire, 2011;
Saunders, 2006). Others have looked at the situation for single parents of children with a serious health
condition (Brown et al., 2008; McLachlan, Gilfillan, & Gordon, 2013; White, 2014; Yates et al., 2010), and for
the families of children with a serious health condition (Maguire, 2011; Thompson & Raezer, 1998).
2.1.2 Conceptualising the FieldThree key issues that have arisen in conceptualising the field are:
• Defining ‘chronic illness’ – Who is in? And who is out?
• Counting – how many students are affected; and
• Determining whether students with chronic illness can be considered as a group, rather than separated into medical conditions.
Defining Chronic IllnessA range of terms are used when talking about health conditions, which reflects in part, different
conceptualisations and definitions. Terms include: chronic health condition (Ireys, 2001); ongoing health
condition (Stein, Bauman, Westbrook, Coupey, & Ireys, 1993); long-term illness (Berntsson et al., 2007); and
‘child and adolescent disability’ (Morad et al., 2004).
This study has mostly used the term ‘health conditions’ but ‘chronic illness’, ‘ongoing health conditions’,
‘serious health conditions’, and the like are also used throughout. ‘Health conditions’ is used to include
all groups and all conditions. Because the focus here is on the education of young people, whether their
conditions occur within a defined period, e.g. cancer, or over a lifetime, e.g. cystic fibrosis, or is the result of
accident or trauma, is not the central issue.
Ireys (2001) provides a useful categorisation and explanation of two key approaches to conceptualising
the boundaries of chronic health conditions; a list-based approach and a non-categorical or functional
approach.
A list-based approach would involve determining a list of conditions to be included. Controversy inevitably
arises over what conditions should be on the list. Should mild asthma be included, for example? As Ireys
(2001) notes, this approach becomes problematic because of the large number (200+) of chronic conditions
in childhood and adolescence. Ireys (2001) also raises the important point that some children and young
people live for long periods of time with serious ongoing health problems before an accurate diagnosis
is made (p. 124). For example, this is common with autoimmune conditions. However, with a list-based
approach, they would be excluded.
The non-categorical, generic or functional approach, looks at the ‘meaningful consequences of a health
condition’ (Ireys, 2001, p. 124), rather than the diagnosis or name of the condition. Does the child
experience limitations in some way as a result of their condition? Or do they require medical or other health-
related services to sustain their functioning capacity?
21Young Australians, illness and education April 2015 21 2 Research about children with serious health conditions and education
The non-categorical approach emerges from the:
...common clinical observation that a particular diagnosis conveys little about the psychological and social functioning of a child or family … (and) virtually every diagnostic group has a wide variability in health status at any one point in time (Ireys, 2001, pp. 125-126).
There can be as much variation within a diagnostic group as between different diagnostic groups (Ireys,
2001) which makes it appropriate to consider young people with chronic health conditions as a cohort
rather than in terms of separate diagnoses, especially when thinking about their schooling and education.
Each child will be affected differently and their situation will vary at different times. The understandings of
the non-categorical approach highlight the need to communicate directly with each young person, rather
than make assumptions about their lives based on diagnostic categories.
Studies using the non-categorical, generic or functional approach, often determine the amount of time a
condition lasts to qualify as chronic. These can range from at least 3 months in duration (Gortmaker et al.,
1993; Newacheck & Taylor, 1992) to least 12 months in duration (Morad et al., 2004; Sawyer et al., 2007).
The range of terms listed at the start of this section to define chronic illness, indicate another significant
area of ambiguity in positioning chronic illness. Should health conditions be differentiated from
physical impairments or intellectual disabilities? Some authors make no differentiation using the terms
interchangeably (Morad et al., 2004), while the Australian Institute of Health and Welfare (2012), clearly
distinguishes between chronic conditions, (e.g. diabetes, cancer and asthma) and disability (e.g. stroke,
head injury, physical, intellectual and psychological disabilities).
While the Ronald McDonald Learning Program (RMLP) database does list student health conditions, that
organisation’s approach to assessing students for program eligibility is based on a categorical or functional
approach, rather than a list based approach, as explained in section 1.2 of this report. Records in this
database indicate that a wide range of conditions are included.
There is ambiguity about where young people with chronic health conditions fit in education. Teachers
of these students are no clearer. A significant factor is the lack of visibility of their condition. As the large
Australian study ‘Keeping Connected’ noted, a key social goal for young people is to fit in to regular school
(Yates et al 2010) which can play out in terms of not asking for assistance, nor being offered services and
assistance that they might need and for which they are eligible (White et al., 2014). Jackson (2012, p. 544)
describes the ambiguity this way:
One of the challenges for students with chronic illness is whether or not their condition fits into the definitions of disability… the usual distinctions between diagnoses of illness and disability becomes blurred in this situation, ‘because illness implies a particular temporal relation – you get sick, you get well’.
Chronic illness for adults is a growing and complex specialist field within health and living with chronic
illness impacts significantly on individuals in many different ways. The Australian Chronic Illness Alliance
(2014), through its definition, assists in conceptualising some of the issues faced by children and young
people who have challenging health conditions and are attempting to learn and progress at school. Chronic
illness for that organisation is:
…an illness that is permanent or lasts a long time. It may get slowly worse over time. It may lead to death, or it may finally go away. It may cause permanent changes to the body. It will certainly affect the person’s quality of life.
Young Australians, illness and education April 201522 23 2 Research about children with serious health conditions and education
Deciding how to define a chronic health condition also becomes important, when trying to estimate the
numbers of Australian students with such health conditions.
Counting - How Many are Affected?A range of different studies have offered dramatically different estimates of the number of children affected
by chronic health conditions, depending on definitions used, and methods of study used. Gortmaker
and Sappenfield (1984), cite five different studies, finding rates from 10% - 20%. And a few years later,
Newacheck and Taylor (1992), cite seven different studies finding rates of 5% to over 30%. A more recent
Australian study (Sawyer et al., 2007), used the following definition that identified 12% of people younger
than 18 years with a chronic condition.
Children with special health care needs are those who ‘have or are at increased risk for a chron-ic physical, developmental, behavioural or emotional condition and who also require health and related services of a type or amount beyond that required by children generally’
(McPherson et al., 1998, cited in Sawyer, 2007, p.1482).
As an exercise, White (2015) employed Sawyer et al.’s (2007) estimate of 12% of the school-aged
population (based on American data) who live with chronic health conditions, together with Australian
Bureau of Statistics national figures of school enrolment, resulting in the startling figure of 437,462
Australian students that could be in the chronic illness category. While this requires substantial further
work, it does point to the paucity of accurate Australian information, particularly within education, and the
importance of definition and data in discussions about children and young people with health conditions.
Individual Illnesses? Many studies examine the impact of particular illnesses for children, families or schools, and these usually
emerge from specialist medical units or research fields. There is nevertheless a growing recognition of the
usefulness of considering the needs and experiences of children with chronic health conditions and their
families, as a group (Gortmaker et al., 1993), and this particularly applies within education.
Ireys (2001) cites Pless and Pinkerton’s (1975, p.2) summary of the argument, which is worth reiterating
here:
The chronicity of the illness and the impact that it has on the child, his [sic] parents, and his siblings, is more significant than the specific character of the disorder, be it diabetes, cerebral palsy, haemophilia, etc. in other words there are certain problems common to all chronic illness over and above particular challenges posed by individual needs.
As White (forthcoming) points out, the important ‘quality of life research’ from the field of public health
provides valuable assistance for conceptualisation here.
2.1.3 Socio-economic Status
People with long-term health conditions are one of the groups most likely to experience deep and persistent disadvantage (McLachlan et al., 2013, p. 136).
This statement from the Australian government’s productivity commission is just one amongst a plethora
of studies and reports, showing that disadvantage is connected with poorer health and with disability. In a
review of studies about children with disabilities and their families, Morad et al. (2004), noted that in addition
to experiencing work uncertainty, sleep disturbance and financial burdens, “Families with a disabled child
were also more likely to be living below the poverty line” (Morad et al., 2004).
Young Australians, illness and education April 2015 2323 2 Research about children with serious health conditions and education
In recent years a burgeoning body of research has examined connections between low socio-economic
status and poor health or disability. Evidencing this trend, the Australian Institute for Health and Welfare
(AIHW), examines the impact of socioeconomic factors, as a matter of course, when investigating trends for
different illnesses and health conditions (Australian Institute of Health and Welfare, 2012; Australian Institute
of Health and Welfare & Australasian Association of Cancer Registries, 2012).
The association of low socio-economic status and poorer health is many faceted. For example:
• Children from families with a lower socio-economic status are more likely to be injured (Orton et al., 2014; Stokes et al., 2001), and more likely to have some health conditions, including congenital heart conditions (Yu et al., 2014) and epilepsy (Heaney et al., 2002).
• Children from families with a lower socio-economic status die earlier and have more complications from various conditions, including cancer (Australian Institute of Health and Welfare, 2012), cystic fibrosis (Barr et al., 2011) and kidney disease (Minnick et al., 2010; Wong et al., 2014).
• There are barriers to access to health services for people from lower socioeconomic status in Australia (Katterl, 2011).
• Families with a child who has a chronic health condition can face additional financial challenges because of this (Morad et al., 2004). Reporting on Australia’s Keeping Connected project, Yates et al. (2010, p. 52) comment:
Parents also report other challenges which emerged in tandem with the young person’s ill health. For example, financial pressures as a result of parents (usually mothers) having to limit their hours of paid work in order to cater for the specific and unpredictable needs of their un-well son or daughter.
There has also been some research into how socio-economic status impacts on education for children
and young people with chronic health conditions. Gortmaker et al. (1993) found that the success of young
people with chronic health conditions, as they transitioned to adulthood, was more strongly linked to their
socio-economic status in childhood, than to their health condition. A recent Australian study (Goldfeld,
O’Connor, Quach, Tarasuik, & Kvalsvig, 2014) also notes the importance of SES in relation to serious
childhood illness and education.
The social determinants of health are of particular interest:
The social determinants of health are the conditions in which people are born, grow, live, work and age. These circumstances are shaped by the distribution of money, power and resources at global, national and local levels. The social determinants of health are mostly responsible for health inequities - the unfair and avoidable differences in health status seen within and between countries. (World Health Organisation, 2013)
This also applies to education. What are the social determinants of health and education for this cohort of
Australian students?
2.1.4 Single Parents The pressures on families resulting from a child with a chronic health condition are multiplied in a single
parent household. Drawing from Yates et al. (2010), a recent poster presentation outlining key concerns,
noted:
For example, if a parent, generally a mother, needs to be available to take her child to regular and emergency medical appointments, then this might restrict the work she is able to do, and the hours she can work. If she is single parenting, then this might cause significant financial hardship, and the family might need to move to more outer suburban areas, in order to find af-
Young Australians, illness and education April 201524 25 2 Research about children with serious health conditions and education
fordable accommodation. Moving may require changing schools, or travelling further to school, and also living further from medical care, which in turn increases the time needed to attend medical appointments, (and the time taken off work and school) and the travel expense (White et al., 2014).
While Brown et al. (2008), in a review article, did not find evidence that having a child with a chronic illness,
leads to higher rates of divorce, Morad et al. (2004) reports on a large study in the USA, including data
from over 5000 children with disabilities and nearly 25,000 without disabilities, which found that “mothers
of children with disabilities are more likely to be divorced, separated or never married and unemployed” (p.
24). Clearly more research is needed in this area.
In a unique review of research about single parents of children with a chronic illness, Brown et al. (2008)
makes reference to the substantial literature on the association between chronic illness, financial difficulty
and low socioeconomic status, and to the literature on the emotional and practical stresses and impacts on
these families, which often fall particularly heavily on mothers. Reference is also made in this review to the
plentiful research on lone parenting and in particular lone mothering. However these researchers reported
being shocked that they did not locate any research studies on single parents with a child with a chronic
illness or disability, and strongly advocated for the importance of such research. `
2.1.5 Education Much research about children with chronic health conditions, makes mention of the difficulties associated
with education. Some studies investigate school absences that result from chronic illness; school re-entry
(especially for young people with cancer), or teacher perceptions. However, there is little research that
explicitly investigates education for these children. In particular, very little Australian research exists about
this issue.
Fields of research - The research into education and children with chronic health conditions that does
exist, originates from a number of fields, including:
• Medical and public health
◊ School absence rates and achievement for children with a chronic illness (Fowler et al., 1985; Newacheck & Taylor, 1992; M. Weitzman, 1986; Michael Weitzman, Walker, & Gortmaker, 1986);
◊ Educational needs of children surviving cancer (Marks, Sheinfeld Gorin, & McAuliffe, 2008).
• Paediatric nursing
◊ School re-entry (Kliebenstein & Broome, 1999)
• Psychology and psychiatry
◊ School psychologists looking at communication between health practitioners and schools (Bradley-Klug et al., 2013);
◊ Education outcomes for particular illnesses (Smith, Patterson, Szabo, Tarazi, & Barakat, 2013);
◊ Teacher’s experience and perceptions of children with chronic illness (Clay et al., 2004; West et al., 2013);
◊ School change (Walsh & Chenneville, 2013);
◊ School re-entry (Sexson & Madan-Swain, 1993).
Young Australians, illness and education April 2015 2525 2 Research about children with serious health conditions and education
• School counsellors
◊ Supporting children with chronic illness in schools (Kaffenberger, 2006).
• Oncology departments – sometimes multidisciplinary teams
◊ School reintegration programs following cancer treatment (Katz et al., 1989; Katz, Varm, Rubenstein, Blew, & Hubert, 1992; Rynard et al., 1998);
◊ Issues around education for children with cancer (Donnan, 2011).
• Social policy
◊ Inclusion of students with chronic health conditions (Mukherjee et al., 2000);
◊ Listening to young people’s views about support in school (Lightfoot, Wright, & Sloper, 1999)
• Children’s hospitals
◊ For example looking at educational needs and issues (Shiu, 2001).
• Education
◊ The Keeping Connected project - listening to young people with a chronic illness about identity and education, and to their parents (White, 2014; Yates et al., 2010);
◊ Policy gaps (Ashton & Bailey, 2004; White, 2015);
◊ School change (Thies & McAllister, 2001);
◊ The importance of relationships at school (Dockett, 2004);
◊ Parent and teacher recommendations (Shiu, 2004b);
◊ Inclusion (Jackson, 2012; Shiu, 2004a; Tait, 2012);
◊ Equity in educational outcomes (Shiu, 2008);
◊ Support in schools (St Leger, 2012);
◊ Identifying children’s educational needs (Thies, 1999).
Repeated themes that emerge from the literature:
• Communication is mentioned repeatedly (Daly, 2013; Jackson, 2012; White, 2014; Yates et al., 2010). “The issue of communication is prevalent in the literature discussing the special educational needs of students with chronic illness. Over 50% of the documents studied discussed ways that communication contributes, whether positively or negatively, to student engagement and student success in the classroom” (Jackson, 2012, p. 547). Some explore the potential technologies offer for communication (e.g. Wilkie, 2012) while others are enthusiastic about technologies being used in paediatric hospitals (Nisselle, Hanns, Green, & Jones, 2012). However, few contextualise discussion of technology within actual education programs or pay attention to associated curriculum and pedagogical issues.
• The importance of communicating directly with students, and not making assumptions about their needs. For example: assuming that their needs are the same as those of others with the same condition, and recognizing that their needs may change from day to day or month to month (Jackson, 2012; Yates et al., 2010).
• Along with communication, is the idea of collaboration between teachers, parents, students, health professionals, school nurses and school counsellors (Ainscow, 2012; Bradley-Klug et al., 2013; Daly, 2013; West et al., 2013).
• The lack of policy for students with a chronic illness in Australia, leads to inequities (Ashton &
26 Young Australians, illness and education April 2015
Bailey, 2004; Donnan, 2011; White, 2014, 2015). These students are frequently not recognised within school and system level disability policy and programs, despite legal frameworks indicating otherwise. As the mother of one child with cancer comments: “Unfortunately I feel that my son has slipped through the cracks as he is not labelled with any disability, but really he now has a hidden disability” (Donnan, 2011, p. 15). The lack of policy and guidance also leads to these young people being poorly accommodated in education. The Keeping Connected project concluded, “the kinds of support they get from school can seem haphazard or inappropriate” (Yates et al., 2010, p. 142).
• Lack of Australian research (Jackson, 2012; Shiu, 2001). “As an Australian teacher and researcher, a point of interest is that there appears to be little Australian research on the education of students with chronic illness” (Jackson, 2012, p. 549).
• The importance of remaining connected to friends and to school life (Dockett, 2004; Jackson, 2012; Lightfoot et al., 1999; Yates et al., 2010).
• School absence - the levels and impact of the absence (Donnan, 2011; Fowler et al., 1985; Jackson, 2012; Lightfoot et al., 1999; Weitzman, 1986; Weitzman et al., 1986).
• Striving to conform, to fit in with one’s peer group, appear ‘normal’, do normal teenage things (Jackson, 2012; Sawyer et al., 2007; Shiu, 2001; White, 2014; Yates et al., 2010).
• Attending school when not fully well, in pain, suffering treatment side effects (for example cognitive effects can occur several years after treatment for cancer), with low energy, or tiredness (for example asthma can lead to lack of sleep at night), or part-time. It may be important for a variety of reasons for the young person to be in school, including social connection, even when it is difficult for them. However to what extent are they able to learn, be consistent, do homework, focus? And they may have different priorities with different levels of energy. See for example Berland (2009); French (2001); Jackson (2012); Lightfoot et al. (1999); Marks et al. (2008); Shiu (2001) and Yates et al. (2010).
• The lack of visible indicators to alert teachers to student difficulties, e.g., “The effects of pain and fatigue on academic capacity are not always obvious to teachers and other school staff” (Jackson, 2012, p.545) and may even be kept hidden, as students strive to fit in with their peers, and avoid ostracism (Yates et al., 2010).
• Low teacher expectations. On the one hand, teachers may fail to accommodate students when they do not realise the impact of the illness, or are not aware that there is one. Conversely, when teachers are aware of a student’s health condition, they may have overly low expectations (Bessell, 2001; White, 2014).
• Bullying is regularly reported as a difficulty.(Lightfoot et al., 1999; Mukherjee et al., 2000; Yates et al., 2010). “Often, the response of peers is to ostracise or ignore the student living with chronic illness” (Jackson, 2012, p. 546).
2.1.6 Previous Research Directly Related to this Project
The Keeping Connected Project and Related ResearchThis project builds on the Keeping Connected: Identity, social connection and education for young people
living with chronic illness ARC project. That project produced a research report (Yates et al., 2010) as well
as a report for the young people who participated in the project (Walker, Ferguson, & Drew, 2009). A series
of articles by the researcher team were included in a special issue of the International Journal of Inclusive
Education, Volume 18, Issue 3, 2014. Julie White, one of the authors of this report, was also a chief
investigator on the Keeping Connected project.
27 3 Scoping and preparation: Working with the database
27Young Australians, illness and education April 2015 27 3 Scoping and preparation: Working with the database
3
This chapter provides an overview of the methodological literature related to database research and an
overview of the data preparation and scoping work undertaken for the Young Australians, illness and
education: National database project.
3.1 Knowledge Discovery in DatabasesOver recent decades databases have been created and used in many areas of service provision
including health, social welfare and education. There has also been an increased interest in accessing
these databases for research purposes (D’Arcy, Holman, Bass, Rouse, & Hobbs, 1999; Jick et al., 2003;
Lane, Stain, Kelly, Lewin, & Higginbotham, 2008; Manns et al., 2001; Merceron & Yacef, 2003; Stanley,
Croft, Gibbins, & Read, 1994; Tamblyn, Lavoie, Petrella, & Monette, 1995). While ensuring the validity of
data in databases is important for research, this is not straightforward, as outlined below. Researchers
have developed a range of approaches to assist with data validity.
The General Practice Research Database in the UK, for example, requires all medical practices to work
to guidelines and to undertake ongoing training for data entry. Importantly, medical practices that have
not entered data consistently, are excluded from using this research database (Jick et al., 2003).
The process of exploring the contents of databases is sometimes referred to as ‘data mining’. However
as Fayyad, Piatetsky-Shapiro, and Smyth (1996) explain, it is more useful to consider data mining to be
just one step in a larger overall process:
In our view, knowledge discovery in databases (KDD) refers to the overall process of discovering
useful knowledge from data, and data mining refers to a particular step in this process … The
additional steps in the KDD process, such as data preparation, data selection, data cleaning,
incorporation of appropriate prior knowledge, and proper interpretation of the results of mining,
are essential to ensure that useful knowledge is derived from the data (p. 39).
Data ‘cleaning’ refers to the identification of mistakes and anomalies in the data. Keeping data
clean is a serious and perennial problem, highlighted in chapter titles of the book, Exploratory Data
Mining and Data Cleaning, which includes sections titled: “Cautionary tales” and “Taming the data”
(Dasu & Johnson, 2003). In their article, “A Taxonomy of Dirty Data”, Kim, Choi, Hong, Kim, and Lee
(2003), explain in detail the range of ways that dirty data can arise, and what can be done about it.
They summarise saying, “broadly, dirty data include missing data, wrong data, and non-standard
representations of the same data” (p. 81). These problems can arise in a range of ways including:
SCOPING AND PREPARATION: WORKING WITH THE DATABASE
Young Australians, illness and education April 201528 29 3 Scoping and preparation: Working with the database
• Errors made in entering the data into the database;
• Different people using the same fields differently, or using different ways of representing the same data;
• Through issues resulting from the transfer of data from one computer system to another; and
• As a result of problems that occur during the extraction of data from a database.
As Charles Lawoko, an experienced data analyst consultant explained, “More than 50% of consulting time
is usually spent on cleaning data” (personal communication, March 24th, 2014).
The following sections report on the process of discovering knowledge in the RMLP database. Outlined
here are methodological decisions made during the project and some of the limitations that were
encountered in the research processes.
3.2 Scoping the ProjectFollowing University Ethics Committee approval, a number of decisions were made about what would be
analysed and how this analysis would be undertaken. That is the focus of this section. The overall purpose
of contributing to knowledge about young people with chronic illness and education in Australia, remained
uppermost in the analytic processes of the study that involved:
• Familiarisation with the contents of the database. Involvement of the partners from RMLP was important to understand how the data fields were used, including differences in usage in different state offices, and also to understand anomalies in the data.
• Discussions between the researchers and the partners from RMLP about analysis to be undertaken, including consideration of:
◊ Demographic records;
◊ Connections between database contents and SES;
◊ Investigation of patterns in service delivery;
◊ Information in the records related to parents and other relatives;
• Attention was paid to the ways in which data could be extracted. Due to the structure of the database and the form of the existing extraction programs, it was not possible, within the project time and resource limits, to analyse data related to the patterns of tutoring sessions.
• Investigating different ways of representing and understanding the data, including:
◊ Use of mapping applications to identify student locations based on postcodes from the database;
◊ Use of Australian Bureau of Statistics (ABS) data to produce maps based showing SES in different postcode areas;
◊ Use of ABS data to investigate the relationship between SES and other demographic factors related to young people in the database;
◊ Use of ABS and Australian Institute of Health and Welfare (AIHW) data to compare our results with general Australian population findings where possible.
Young Australians, illness and education April 2015 2929 3 Scoping and preparation: Working with the database
3.2 Data Preparation Data preparation refers to the work involved to prepare the data for analysis. While the researchers carried
out the main preparatory work, involvement of the partners from RMLP was important to understand how
the data had been entered and filed.
Data Extraction ProcessThe first step was to extract the data for all the students and their family members, which was not a
straightforward process.
After a series of test extractions, the data for analysis was extracted from the database on 14th April 2014.
The extraction had 8531 records, including students, parents, siblings and other family members.
During data cleaning (see below) some records were removed, leaving 8508 records. Of these, 2360 were
student records. Most of the analyses subsequently undertaken were in relation to these student records.
Data Selection, Labelling and Re-codingAs discussed in section, 3.1 Knowledge Discovery in Databases, data preparation and cleaning, can be
expected to take more time than the actual data analysis, and that was the case for this project.
Because of the detailed nature of this work, this report provides an indication of the decisions made in
preparing the data for analysis.
• Deciding which items may be useful to include for analysis.
◊ There are 240 potential items of data for each student. Some of these data fields are not used for RMLP students, some are occasionally used and some are regularly or always used.
◊ It was important to identify each item correctly and then decide which items may be useful for analysis and therefore clearly labelled, prepared and ‘cleaned’.
◊ Items to be deleted were identified during this process.
• Correct labelling of the data.
◊ When data is extracted from the database into a spreadsheet, the labels for the data are not always clear to those less familiar with the database.
• Converting data into different formats.
◊ The database contains dates of birth, but not ages at program entry. A decision was made to calculate the age of each student at the time of entry of their data into the database, using their date of birth.
◊ Alphanumeric codes are used in the database to identify student participation in different programs and other statuses. For example a student could be identified as an Education Liaison Program student, a Tuition Program student, a student who has moved through both programs, or a deceased student. These codes were allocated labels for ready identification in graphs. The codes were also grouped, so that student records could be identified in different groupings, such as all active students in any program.
Young Australians, illness and education April 201530 31 3 Scoping and preparation: Working with the database
◊ Alphanumeric codes are used to identify illnesses, periods of time away from school, referral sources, whether students speak English at home and many other issues. Each code was allocated a label for display in graphs. In some instances the decision was made to re-code some variables (like specific conditions) into groups, to allow for a range of different analyses and the development of accessible graphs.
• Parent/Guardian Addresses
◊ Identification was made of student records where only a mother or only a father was listed, or where the parents lived at different addresses.
◊ Other codes were assigned to students in each of these situations, and in a few less common situations, such as a student not living with either parent, to allow for analysis based on these factors.
Data CleaningThis process required a range of actions, including:
• Identification and correction of as many data entry errors as possible. Prior to 14th April, RMLP staff in each state office were asked to amend these data entry problems in their student records.
◊ Liaison between the researchers and RMLP partners to assist with identification and correction of data entry errors found during test data extractions.
◊ Prior to the final data extraction on 14th April, RMLP staff in each state office were asked to amend data entry problems in their student records.
• Excluding records from the analysis occurred for example:
◊ When student records did not have an address, and/or did not have a parent or guardian entered these records were individually checked. These were mostly initial referrals from hospital-based staff.
◊ Occasional errors were made in data entry, leading to duplicated records or other anomalies. Each of these, when identified through data scanning, was individually checked, and deleted from the master spreadsheet when appropriate.
◊ When student records where closed (‘exited’), with no evidence of having entered the Tuition or Education Liaison Program, these student records were deleted from the master spreadsheet.
• Amending suburb, postcode and state:
◊ Where a student address did not have a postcode or state listed, and it had been determined that this was a genuine student record, if the suburb was listed, the postcode and state was entered. If the suburb was not listed, the school address was used to identify the postcode and state.
◊ The database allows for several different addresses (e.g. home, office, postal), for any person in the database including a student, parent or sibling. Different education coordinators developed different ways of using the address fields which, together with data entry errors, led to confusing address records as the student’s regular home address was the primary one for analysis. This was resolved through a combination of techniques.
• Correcting spelling errors and consolidating terms used for languages other than English. For example:
Young Australians, illness and education April 2015 3131 3 Scoping and preparation: Working with the database
◊ Spelling errors or spelling a language with or without an initial capital letter identifies them as separate languages.
◊ Calling the same language different things identifies them as separate languages, e.g. Filipino and Tagalog.
◊ Listing two additional languages. When a student had two additional languages listed, this initially appeared in graphs, as if it was one new language. A new field was created to allow for listing the first and second additional language separately.
• Amending date errors:
◊ When a non-existent date was identified in the database, usually a date of birth, that date had to be removed before the data could be analysed in SPSS, the statistical analysis package.
• Identifying and removing or amending invalid codes entered in various fields.
While these errors seem insignificant in the day-to-day use of the database, they became important
when analysis of the data was attempted. Small anomalies such as an upper rather than a lower case
letter or an extra space inadvertently added, can lead to items being treated separately during analysis,
so accurate data entry is important.
32 Young Australians, illness and education April 2015 33 4 The RMLP student records
33Young Australians, illness and education April 2015 33 4 The RMLP student records
4ANALYSING THE RMLPSTUDENT RECORDS
This chapter presents the first stage of what was learned by analysing the RMLP database records. Where
it is important, information is provided about data and data cleaning, prior to presenting each section of
analysis.
The Analysis Workshop Integral to the overall process of data analysis was the two-day workshop conducted at The Victoria
Institute at the midpoint of the project. This workshop, attended by the researchers and key national and
research personnel from RMLP, provided the opportunity to view, discuss and question the graphs and
charts produced at this point from the database. Through this process, RMLP staff were able to offer
explanations, anecdotes and possibilities for various patterns in the data, based on extensive knowledge of
the sector, their own programs and the database they had created. Many thoughtful and helpful questions
were raised that informed the subsequent focus of the study during this workshop.
Chapter 4, together with Chapter 5 that examines SES factors, incorporates a number of those
explanations, and addresses a number of the questions posed at that workshop. However, a number of
questions are yet to be addressed in future research.
Chapter 4 is organised into the following sections:
1. Student numbers
2. Types of students and relatives in the database
3. How students find out about RMLP - Referral source
4. Health condition
5. Gender and Health condition
6. School absence
7. School absence and Health condition
8. Age and School year level
9. Aboriginal and Torres Strait Islander
10. Language spoken at home
11. School sector
12. Location of students
34 Young Australians, illness and education April 2015 35 4 The RMLP student records
4.1 Student Numbers The records in the database were entered over a period of 2.5 years. Records began to be entered into
the database from 26th May 2011 with records from Victoria, followed by other RMLP state offices during
October 2011. The data analysed for this project was extracted from the database on 14th April 2014.
After deletion of anomalies and cleaning processes, 2360 student records remained. All of these records
have a postcode, but some of the records are not complete, so not all analyses include all the students.
Where relevant, the number of students used to create each graph, has been included.
The number of students participating in the programs, and who therefore have records in the database,
is affected by a number of factors. The key factor relates to levels of funding RMLP receives in each year
which impacts on how many Teachers and education coordinators can be employed. This in turn affects
how many students can be accepted into the program at any time.
So how does the number of students in the RMLP database, compare with the number of students who
live with a chronic health condition in Australia? Using existing data, we can only make estimates and this
depends very much on the standpoint taken while making this estimate. As explained in section 2.1.2,
‘Conceptualising the Field’, the figures used, depend very much on both the definition of chronic health
condition employed and whether a categorical or non-categorical approach is employed.
Australian researchers, Sawyer et al. (2007), provide some useful figures, particularly for application within
education, which is our main interest here. White’s (2015) exercise, using Sawyer et al.’s estimate that at
least 12% of students live with chronic illness combined with figures about Australian student enrolments is
confronting. Noting the estimate that:
...at least 12% of young people live with a chronic health condition (Sawyer et al., 2007, p. 1481), I undertook a simple exercise that resulted in a quite startling figure. Official student enrolment numbers showed that just over three and a half million students (3,545,519) are enrolled in Australian schools (Australian Bureau of Statistics, 2014). Applying Sawyer et al.’s (2007) minimum estimate of 12% to that, a figure of nearly half a million (437,462) school-aged students could be living with serious health challenges in Australia. While this has not been veri-fied, and it should also be noted here that Sawyer et al. used American data for their estimates, interesting questions are nevertheless raised about how many Australian students have chronic illness, how this should be counted and what this means for education (White, 2015, p. 2).
4.2 Affiliation CodesEach student record entered into the RMLP database is given an ‘affiliation code’, to indicate if that person
is a student, a parent, sibling, or a cohabiting relative of the student. There are separate affiliation codes
for each parent. Mothers are assigned the ‘Parent/Guardian’ code and the father is assigned the ‘Parent/
Guardian2’ code. When filling out the program entry form, parents have the opportunity to enter details
for all people living in the household. All members of the household are frequently included, but this is not
always the case. Therefore these records provide an approximation, rather than an accurate record of the
families.
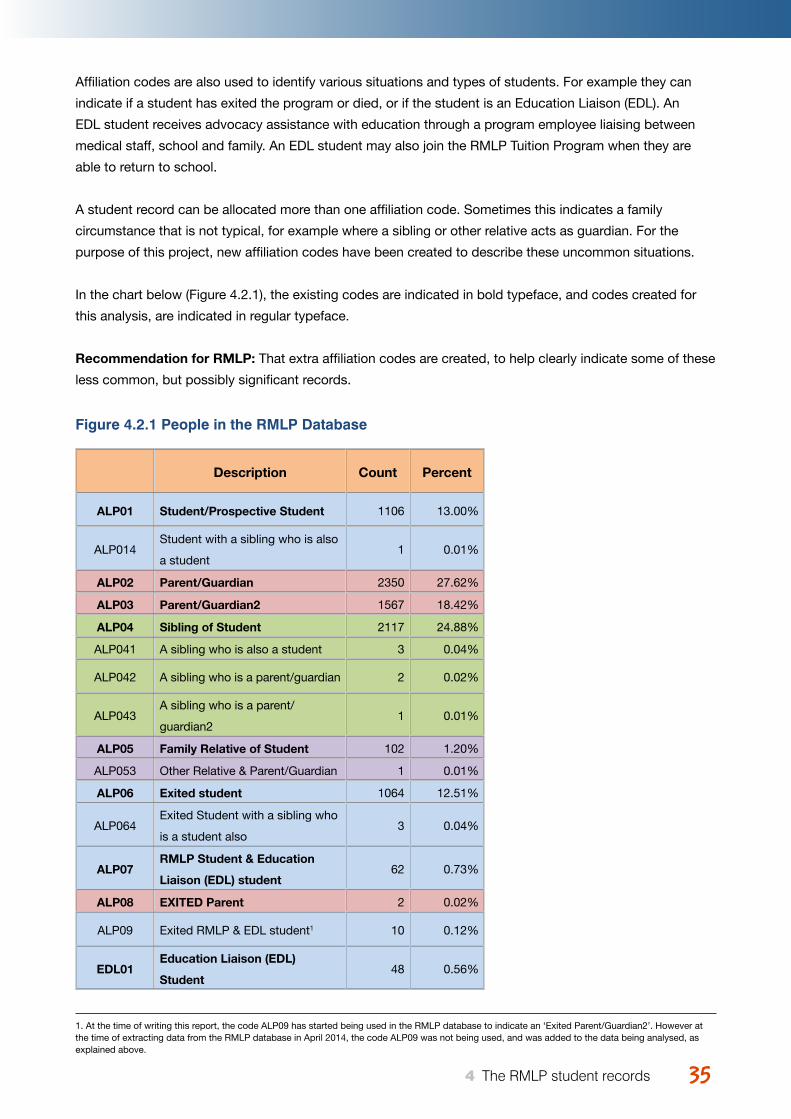
35Young Australians, illness and education April 2015 35 4 The RMLP student records
Affiliation codes are also used to identify various situations and types of students. For example they can
indicate if a student has exited the program or died, or if the student is an Education Liaison (EDL). An
EDL student receives advocacy assistance with education through a program employee liaising between
medical staff, school and family. An EDL student may also join the RMLP Tuition Program when they are
able to return to school.
A student record can be allocated more than one affiliation code. Sometimes this indicates a family
circumstance that is not typical, for example where a sibling or other relative acts as guardian. For the
purpose of this project, new affiliation codes have been created to describe these uncommon situations.
In the chart below (Figure 4.2.1), the existing codes are indicated in bold typeface, and codes created for
this analysis, are indicated in regular typeface.
Recommendation for RMLP: That extra affiliation codes are created, to help clearly indicate some of these
less common, but possibly significant records.
Figure 4.2.1 People in the RMLP Database
Description Count Percent
ALP01 Student/Prospective Student 1106 13.00%
ALP014Student with a sibling who is also
a student1 0.01%
ALP02 Parent/Guardian 2350 27.62%
ALP03 Parent/Guardian2 1567 18.42%
ALP04 Sibling of Student 2117 24.88%
ALP041 A sibling who is also a student 3 0.04%
ALP042 A sibling who is a parent/guardian 2 0.02%
ALP043A sibling who is a parent/
guardian21 0.01%
ALP05 Family Relative of Student 102 1.20%
ALP053 Other Relative & Parent/Guardian 1 0.01%
ALP06 Exited student 1064 12.51%
ALP064Exited Student with a sibling who
is a student also3 0.04%
ALP07RMLP Student & Education
Liaison (EDL) student62 0.73%
ALP08 EXITED Parent 2 0.02%
ALP09 Exited RMLP & EDL student1 10 0.12%
EDL01Education Liaison (EDL)
Student48 0.56%
1. At the time of writing this report, the code ALP09 has started being used in the RMLP database to indicate an ‘Exited Parent/Guardian2’. However at the time of extracting data from the RMLP database in April 2014, the code ALP09 was not being used, and was added to the data being analysed, as explained above.
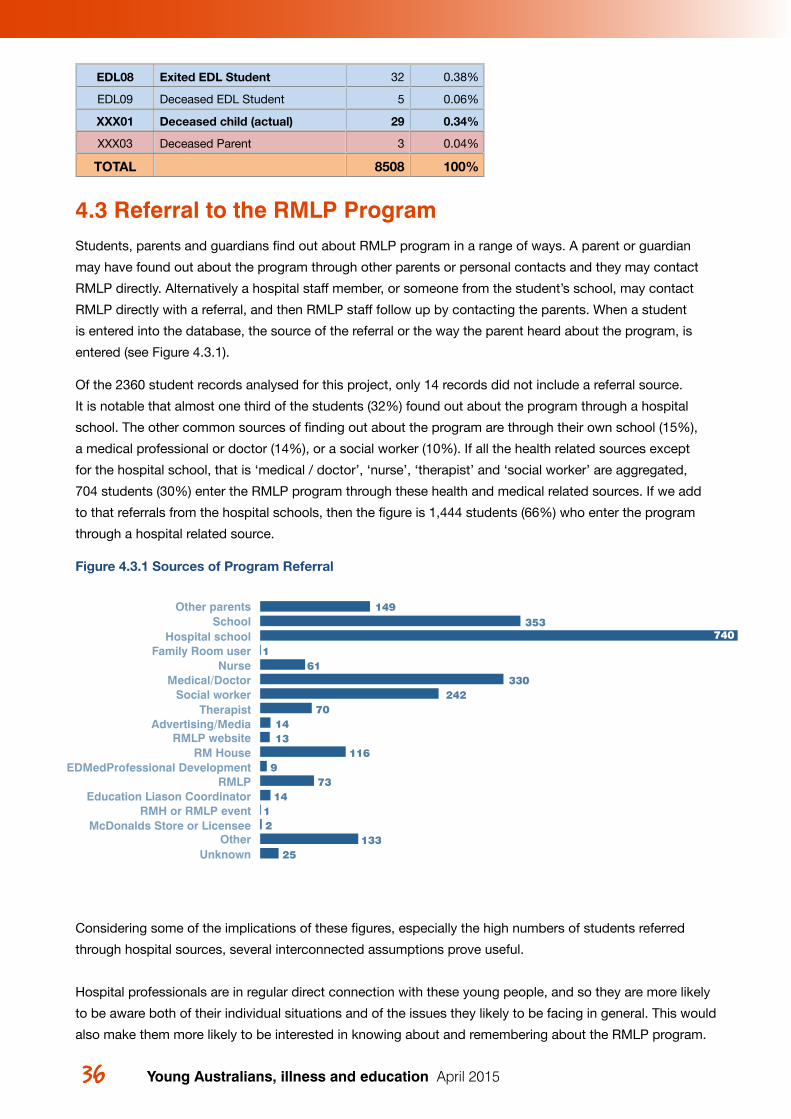
36 37 4 The RMLP student records
EDL08 Exited EDL Student 32 0.38%
EDL09 Deceased EDL Student 5 0.06%
XXX01 Deceased child (actual) 29 0.34%
XXX03 Deceased Parent 3 0.04%
TOTAL 8508 100%
4.3 Referral to the RMLP ProgramStudents, parents and guardians find out about RMLP program in a range of ways. A parent or guardian
may have found out about the program through other parents or personal contacts and they may contact
RMLP directly. Alternatively a hospital staff member, or someone from the student’s school, may contact
RMLP directly with a referral, and then RMLP staff follow up by contacting the parents. When a student
is entered into the database, the source of the referral or the way the parent heard about the program, is
entered (see Figure 4.3.1).
Of the 2360 student records analysed for this project, only 14 records did not include a referral source.
It is notable that almost one third of the students (32%) found out about the program through a hospital
school. The other common sources of finding out about the program are through their own school (15%),
a medical professional or doctor (14%), or a social worker (10%). If all the health related sources except
for the hospital school, that is ‘medical / doctor’, ‘nurse’, ‘therapist’ and ‘social worker’ are aggregated,
704 students (30%) enter the RMLP program through these health and medical related sources. If we add
to that referrals from the hospital schools, then the figure is 1,444 students (66%) who enter the program
through a hospital related source.
Figure 4.3.1 Sources of Program Referral
Considering some of the implications of these figures, especially the high numbers of students referred
through hospital sources, several interconnected assumptions prove useful.
Hospital professionals are in regular direct connection with these young people, and so they are more likely
to be aware both of their individual situations and of the issues they likely to be facing in general. This would
also make them more likely to be interested in knowing about and remembering about the RMLP program.
UnknownOther
McDonalds Store or LicenseeRMH or RMLP event
Education Liason CoordinatorRMLP
EDMedProfessional DevelopmentRM House
RMLP websiteAdvertising/Media
TherapistSocial worker
Medical/DoctorNurse
Family Room userHospital school
SchoolOther parents 149
353
1
24270
1413
1169
7314
12
13325
33061
740
Young Australians, illness and education April 2015
3737 4 The RMLP student records
They are in a position to notice the need, provide information and referral, and understand the importance
of helping young people link back to their schools and ongoing education.
There are 9 paediatric hospitals around Australia, as well as hospitals with paediatric wards. This
concentration of large numbers of sick children in a small number of hospitals and paediatric wards, means
that awareness of the RMLP program that RMLP staff build among health professionals (including allied
health) in these hospitals and with teachers in the hospital special schools, can lead to many program
referrals.
Referrals from hospitals and hospital schools in particular, are likely to focus on students who spend large
amounts of time in hospital. As will be discussed in other sections of this report, not all children who have
chronic health conditions spend large amounts of time in hospital.
On the other hand, there are approximately 10,000 schools in Australia (Australian Bureau of Statistics,
2014b). Presumably each school will have only a small number of such children enrolled, who are either (a)
attending school while managing their health conditions, (b) recuperating at home or (c) in hospital. Figures
about these students are not available. So while RMLP informs school staff through the EDMed program,
individual teachers or schools are unlikely to refer many students. RMLP as a philanthropic organisation
cannot be expected to reach all the 10,000 Australian schools, but they can (and do) create good
connections in the 9 Australian paediatric hospitals and wards around the country.
4.4 Health ConditionThis section discusses the relative numbers of student with different health conditions in the database and
implications for students and for research.
In the RMLP database health conditions are broken into 42 pre-defined health conditions (Figure 4.4.1). It
is worth noting that many children also have secondary serious health issues, resulting from, or concurrent
with the primary condition. These secondary conditions may be noted in the database notes, but are not
coded within the current system, and have not been analysed for this report.
The most common type of health condition for students in the RMLP database is Leukaemia (418 students,
19.5%). When all types of cancer are taken as a group, this accounts for 44% (949) of the students (Figure
4.4.2).
Of the 2147 student who have a health condition (illness) listed, 396 (18.4%) fall into the ‘other’ category.
Managers in the RMLP program explained that one reason for the large number of conditions being listed
as ‘other’ is because doctors these days are giving more detailed diagnoses (for instance for type of
cancer). Parents list this detailed diagnosis on the registration form, which does not match with any of the
pre-defined health conditions in the database, so it gets slotted into ‘other’. Also included within the ‘other’
category, are immune system conditions, which are complex and varied.
After cancer, the next most common health condition in the database is trauma (grouping together general
accidents, road accidents and burns) with 100 students. Following this are: epilepsy (89 students); cystic
fibrosis (82 students); stroke (59 students); diabetes (48 students); ortho-congenital abnormalities (47
students); and asthma (44 students) (see Figures 4.4.1 & 4.4.2).
Young Australians, illness and education April 2015
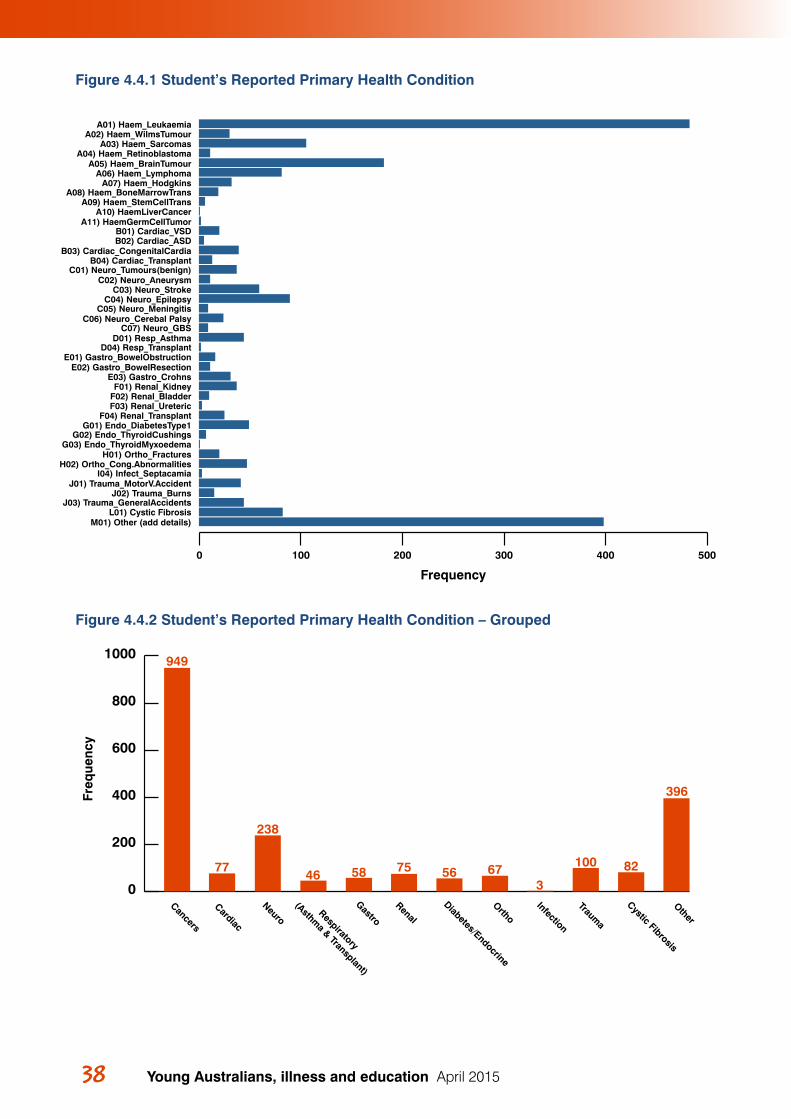
38 39 4 The RMLP student records
Figure 4.4.1 Student’s Reported Primary Health Condition
Figure 4.4.2 Student’s Reported Primary Health Condition – Grouped
Frequency
M01) Other (add details)L01) Cystic Fibrosis
J03) Trauma_GeneralAccidentsJ02) Trauma_Burns
J01) Trauma_MotorV.AccidentI04) Infect_Septacamia
H02) Ortho_Cong.AbnormalitiesH01) Ortho_Fractures
G03) Endo_ThyroidMyxoedemaG02) Endo_ThyroidCushings
G01) Endo_DiabetesType1F04) Renal_Transplant
F03) Renal_UretericF02) Renal_BladderF01) Renal_Kidney
E03) Gastro_CrohnsE02) Gastro_BowelResection
E01) Gastro_BowelObstructionD04) Resp_Transplant
D01) Resp_AsthmaC07) Neuro_GBS
C06) Neuro_Cerebal PalsyC05) Neuro_Meningitis
C04) Neuro_EpilepsyC03) Neuro_Stroke
C02) Neuro_AneurysmC01) Neuro_Tumours(benign)
B04) Cardiac_TransplantB03) Cardiac_CongenitalCardia
B02) Cardiac_ASDB01) Cardiac_VSD
A11) HaemGermCellTumorA10) HaemLiverCancer
A09) Haem_StemCellTransA08) Haem_BoneMarrowTrans
A07) Haem_HodgkinsA06) Haem_Lymphoma
A05) Haem_BrainTumourA04) Haem_Retinoblastoma
A03) Haem_SarcomasA02) Haem_WilmsTumour
A01) Haem_Leukaemia
0 100 200 300 400 500
Figure 5
Freq
uenc
y
396
82100
36756755846
238
77
949
0
200
400
600
800
1000
Other
Cystic Fibrosis
Trauma
Infection
Ortho
Diabetes/Endocrine
Renal
GastroRespiratory
(Asthma & Transplant)
NeuroCardiac
Cancers
Young Australians, illness and education April 2015
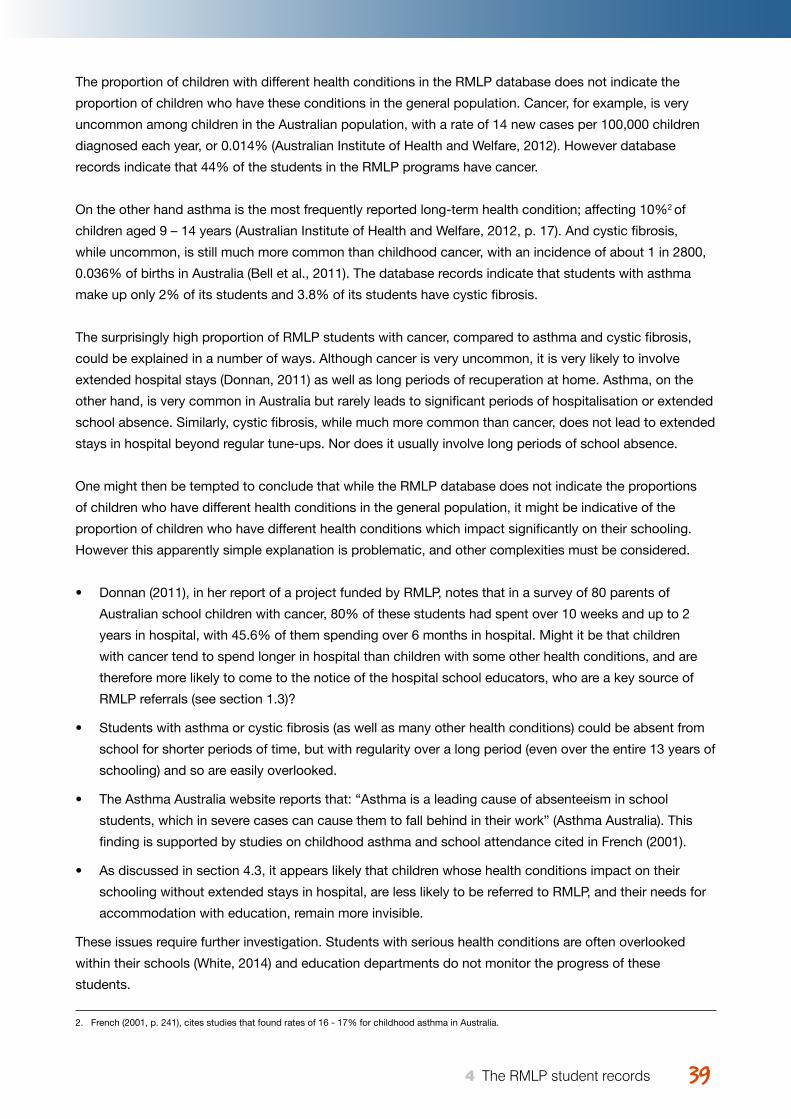
3939 4 The RMLP student records
The proportion of children with different health conditions in the RMLP database does not indicate the
proportion of children who have these conditions in the general population. Cancer, for example, is very
uncommon among children in the Australian population, with a rate of 14 new cases per 100,000 children
diagnosed each year, or 0.014% (Australian Institute of Health and Welfare, 2012). However database
records indicate that 44% of the students in the RMLP programs have cancer.
On the other hand asthma is the most frequently reported long-term health condition; affecting 10%2 of
children aged 9 – 14 years (Australian Institute of Health and Welfare, 2012, p. 17). And cystic fibrosis,
while uncommon, is still much more common than childhood cancer, with an incidence of about 1 in 2800,
0.036% of births in Australia (Bell et al., 2011). The database records indicate that students with asthma
make up only 2% of its students and 3.8% of its students have cystic fibrosis.
The surprisingly high proportion of RMLP students with cancer, compared to asthma and cystic fibrosis,
could be explained in a number of ways. Although cancer is very uncommon, it is very likely to involve
extended hospital stays (Donnan, 2011) as well as long periods of recuperation at home. Asthma, on the
other hand, is very common in Australia but rarely leads to significant periods of hospitalisation or extended
school absence. Similarly, cystic fibrosis, while much more common than cancer, does not lead to extended
stays in hospital beyond regular tune-ups. Nor does it usually involve long periods of school absence.
One might then be tempted to conclude that while the RMLP database does not indicate the proportions
of children who have different health conditions in the general population, it might be indicative of the
proportion of children who have different health conditions which impact significantly on their schooling.
However this apparently simple explanation is problematic, and other complexities must be considered.
• Donnan (2011), in her report of a project funded by RMLP, notes that in a survey of 80 parents of
Australian school children with cancer, 80% of these students had spent over 10 weeks and up to 2
years in hospital, with 45.6% of them spending over 6 months in hospital. Might it be that children
with cancer tend to spend longer in hospital than children with some other health conditions, and are
therefore more likely to come to the notice of the hospital school educators, who are a key source of
RMLP referrals (see section 1.3)?
• Students with asthma or cystic fibrosis (as well as many other health conditions) could be absent from
school for shorter periods of time, but with regularity over a long period (even over the entire 13 years of
schooling) and so are easily overlooked.
• The Asthma Australia website reports that: “Asthma is a leading cause of absenteeism in school
students, which in severe cases can cause them to fall behind in their work” (Asthma Australia). This
finding is supported by studies on childhood asthma and school attendance cited in French (2001).
• As discussed in section 4.3, it appears likely that children whose health conditions impact on their
schooling without extended stays in hospital, are less likely to be referred to RMLP, and their needs for
accommodation with education, remain more invisible.
These issues require further investigation. Students with serious health conditions are often overlooked
within their schools (White, 2014) and education departments do not monitor the progress of these
students.
Young Australians, illness and education April 2015
2. French (2001, p. 241), cites studies that found rates of 16 - 17% for childhood asthma in Australia.
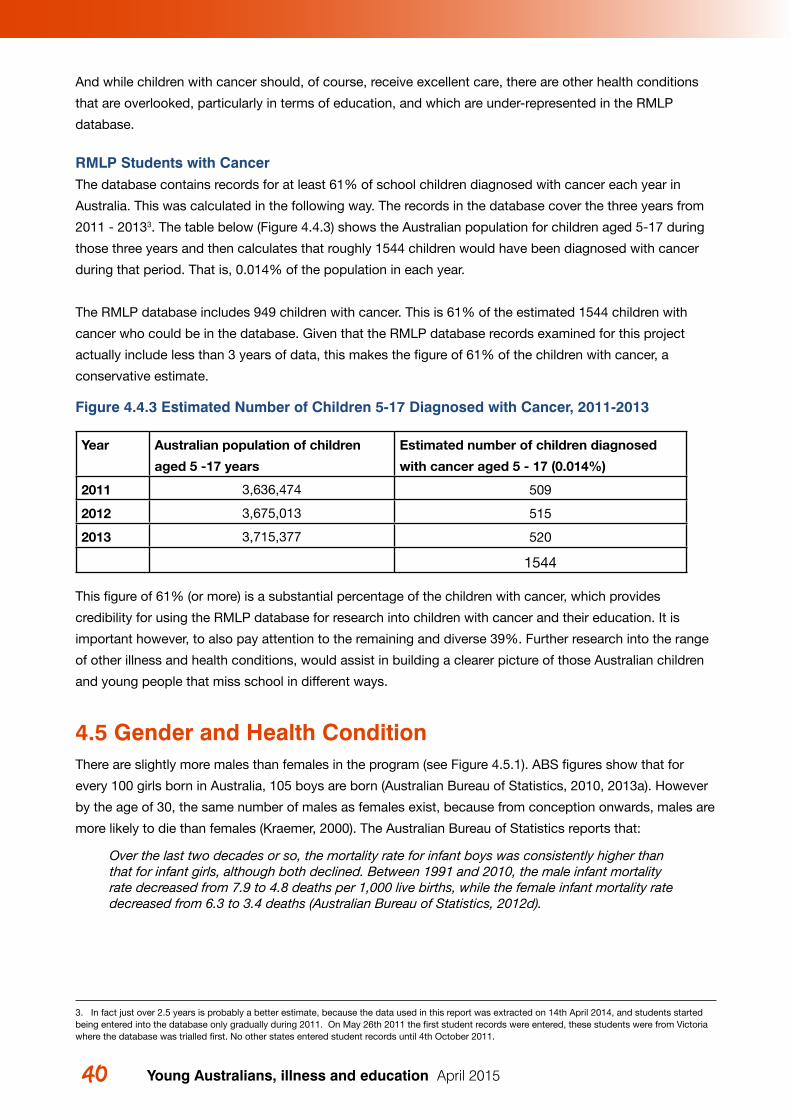
Young Australians, illness and education April 201540 41 4 The RMLP student records
And while children with cancer should, of course, receive excellent care, there are other health conditions
that are overlooked, particularly in terms of education, and which are under-represented in the RMLP
database.
RMLP Students with CancerThe database contains records for at least 61% of school children diagnosed with cancer each year in
Australia. This was calculated in the following way. The records in the database cover the three years from
2011 - 20133. The table below (Figure 4.4.3) shows the Australian population for children aged 5-17 during
those three years and then calculates that roughly 1544 children would have been diagnosed with cancer
during that period. That is, 0.014% of the population in each year.
The RMLP database includes 949 children with cancer. This is 61% of the estimated 1544 children with
cancer who could be in the database. Given that the RMLP database records examined for this project
actually include less than 3 years of data, this makes the figure of 61% of the children with cancer, a
conservative estimate.
Figure 4.4.3 Estimated Number of Children 5-17 Diagnosed with Cancer, 2011-2013
Year Australian population of children
aged 5 -17 years
Estimated number of children diagnosed
with cancer aged 5 - 17 (0.014%)
2011 3,636,474 509
2012 3,675,013 515
2013 3,715,377 520
1544
This figure of 61% (or more) is a substantial percentage of the children with cancer, which provides
credibility for using the RMLP database for research into children with cancer and their education. It is
important however, to also pay attention to the remaining and diverse 39%. Further research into the range
of other illness and health conditions, would assist in building a clearer picture of those Australian children
and young people that miss school in different ways.
4.5 Gender and Health ConditionThere are slightly more males than females in the program (see Figure 4.5.1). ABS figures show that for
every 100 girls born in Australia, 105 boys are born (Australian Bureau of Statistics, 2010, 2013a). However
by the age of 30, the same number of males as females exist, because from conception onwards, males are
more likely to die than females (Kraemer, 2000). The Australian Bureau of Statistics reports that:
Over the last two decades or so, the mortality rate for infant boys was consistently higher than that for infant girls, although both declined. Between 1991 and 2010, the male infant mortality rate decreased from 7.9 to 4.8 deaths per 1,000 live births, while the female infant mortality rate decreased from 6.3 to 3.4 deaths (Australian Bureau of Statistics, 2012d).
3. In fact just over 2.5 years is probably a better estimate, because the data used in this report was extracted on 14th April 2014, and students started being entered into the database only gradually during 2011. On May 26th 2011 the first student records were entered, these students were from Victoria where the database was trialled first. No other states entered student records until 4th October 2011.
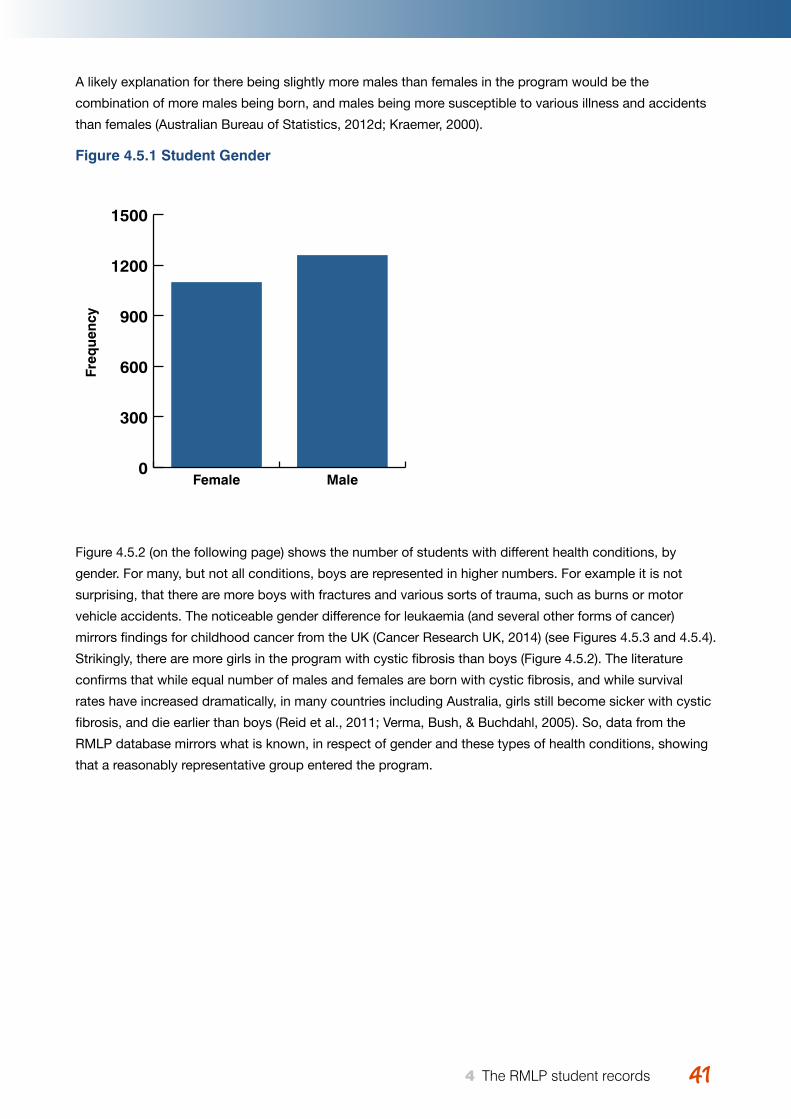
Young Australians, illness and education April 2015 4141 4 The RMLP student records
A likely explanation for there being slightly more males than females in the program would be the
combination of more males being born, and males being more susceptible to various illness and accidents
than females (Australian Bureau of Statistics, 2012d; Kraemer, 2000).
Figure 4.5.1 Student Gender
Figure 4.5.2 (on the following page) shows the number of students with different health conditions, by
gender. For many, but not all conditions, boys are represented in higher numbers. For example it is not
surprising, that there are more boys with fractures and various sorts of trauma, such as burns or motor
vehicle accidents. The noticeable gender difference for leukaemia (and several other forms of cancer)
mirrors findings for childhood cancer from the UK (Cancer Research UK, 2014) (see Figures 4.5.3 and 4.5.4).
Strikingly, there are more girls in the program with cystic fibrosis than boys (Figure 4.5.2). The literature
confirms that while equal number of males and females are born with cystic fibrosis, and while survival
rates have increased dramatically, in many countries including Australia, girls still become sicker with cystic
fibrosis, and die earlier than boys (Reid et al., 2011; Verma, Bush, & Buchdahl, 2005). So, data from the
RMLP database mirrors what is known, in respect of gender and these types of health conditions, showing
that a reasonably representative group entered the program.
Freq
uenc
y
0
300
600
900
1200
1500
MaleFemale
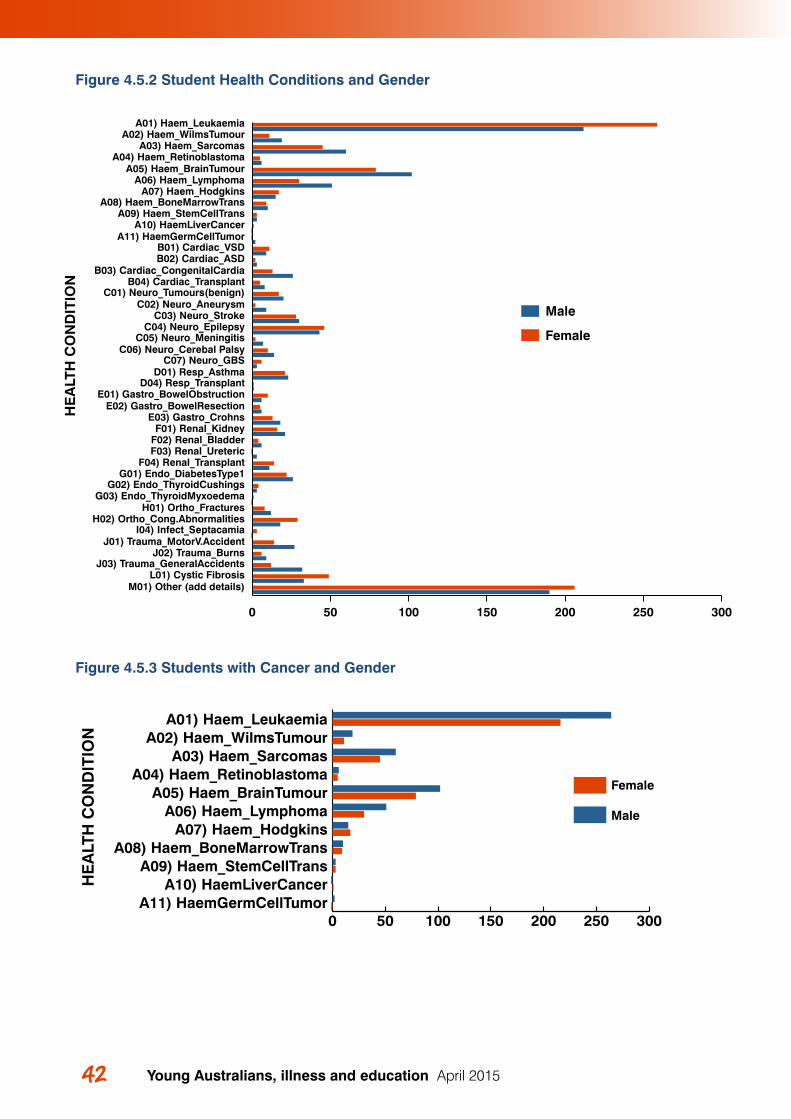
Young Australians, illness and education April 201542 43 4 The RMLP student records
Figure 4.5.2 Student Health Conditions and Gender
Figure 4.5.3 Students with Cancer and Gender
Male
Female
M01) Other (add details)L01) Cystic Fibrosis
J03) Trauma_GeneralAccidentsJ02) Trauma_Burns
J01) Trauma_MotorV.AccidentI04) Infect_Septacamia
H02) Ortho_Cong.AbnormalitiesH01) Ortho_Fractures
G03) Endo_ThyroidMyxoedemaG02) Endo_ThyroidCushings
G01) Endo_DiabetesType1F04) Renal_Transplant
F03) Renal_UretericF02) Renal_BladderF01) Renal_Kidney
E03) Gastro_CrohnsE02) Gastro_BowelResection
E01) Gastro_BowelObstructionD04) Resp_Transplant
D01) Resp_AsthmaC07) Neuro_GBS
C06) Neuro_Cerebal PalsyC05) Neuro_Meningitis
C04) Neuro_EpilepsyC03) Neuro_Stroke
C02) Neuro_AneurysmC01) Neuro_Tumours(benign)
B04) Cardiac_TransplantB03) Cardiac_CongenitalCardia
B02) Cardiac_ASDB01) Cardiac_VSD
A11) HaemGermCellTumorA10) HaemLiverCancer
A09) Haem_StemCellTransA08) Haem_BoneMarrowTrans
A07) Haem_HodgkinsA06) Haem_Lymphoma
A05) Haem_BrainTumourA04) Haem_Retinoblastoma
A03) Haem_SarcomasA02) Haem_WilmsTumour
0 50 100 150 200 250 300
HE
ALT
H C
ON
DIT
ION
A01) Haem_Leukaemia
0 50 100 150 200 250 300
Female
Male
A11) HaemGermCellTumorA10) HaemLiverCancer
A09) Haem_StemCellTransA08) Haem_BoneMarrowTrans
A07) Haem_HodgkinsA06) Haem_Lymphoma
A05) Haem_BrainTumourA04) Haem_Retinoblastoma
A03) Haem_SarcomasA02) Haem_WilmsTumour
A01) Haem_Leukaemia
HE
ALT
H C
ON
DIT
ION
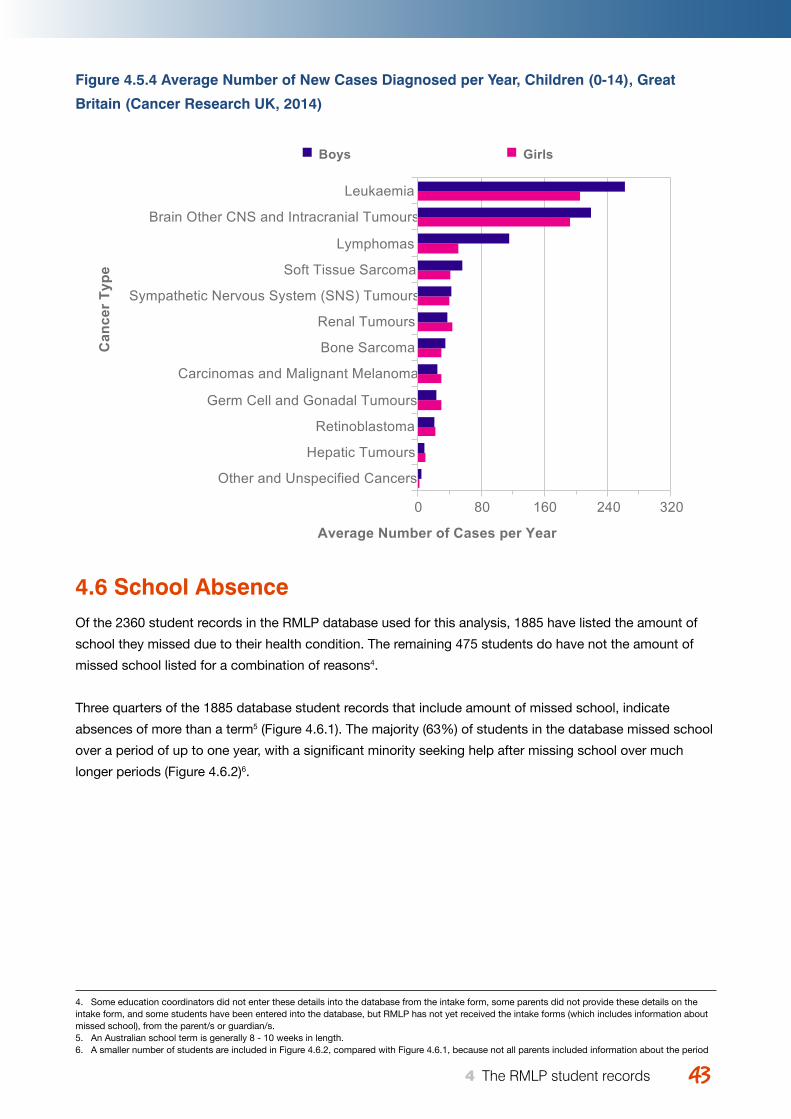
Young Australians, illness and education April 2015 4343 4 The RMLP student records
Figure 4.5.4 Average Number of New Cases Diagnosed per Year, Children (0-14), Great
Britain (Cancer Research UK, 2014)
4.6 School AbsenceOf the 2360 student records in the RMLP database used for this analysis, 1885 have listed the amount of
school they missed due to their health condition. The remaining 475 students do have not the amount of
missed school listed for a combination of reasons4.
Three quarters of the 1885 database student records that include amount of missed school, indicate
absences of more than a term5 (Figure 4.6.1). The majority (63%) of students in the database missed school
over a period of up to one year, with a significant minority seeking help after missing school over much
longer periods (Figure 4.6.2)6.
Childhood Cancers (the 12 ICCC Diagnostic Groups): 2006-2008Average Number of New Cases Diagnosed per Year, Children (0-14), Great Britain
Cancer Type Boys Girls ChildrenLeukaemia 262 205 468Brain Other CNS and Intracranial Tumours 219 193 412Lymphomas 115 51 167Soft Tissue Sarcoma 57 41 98Sympathetic Nervous System (SNS) Tumours 43 40 83Renal Tumours 38 44 82Bone Sarcoma 35 30 65Carcinomas and Malignant Melanoma 25 30 55Germ Cell and Gonadal Tumours 24 30 55Retinoblastoma 22 22 44Hepatic Tumours 9 10 18Other and Unspecified Cancers 5 3 8
Prepared by Cancer Research UKOriginal data sources:Childhood Cancer Research Group (CCRG), National Registry of Childhood Tumours (NRCT), March 2014.
4. Some education coordinators did not enter these details into the database from the intake form, some parents did not provide these details on the intake form, and some students have been entered into the database, but RMLP has not yet received the intake forms (which includes information about missed school), from the parent/s or guardian/s.5. An Australian school term is generally 8 - 10 weeks in length. 6. A smaller number of students are included in Figure 4.6.2, compared with Figure 4.6.1, because not all parents included information about the period
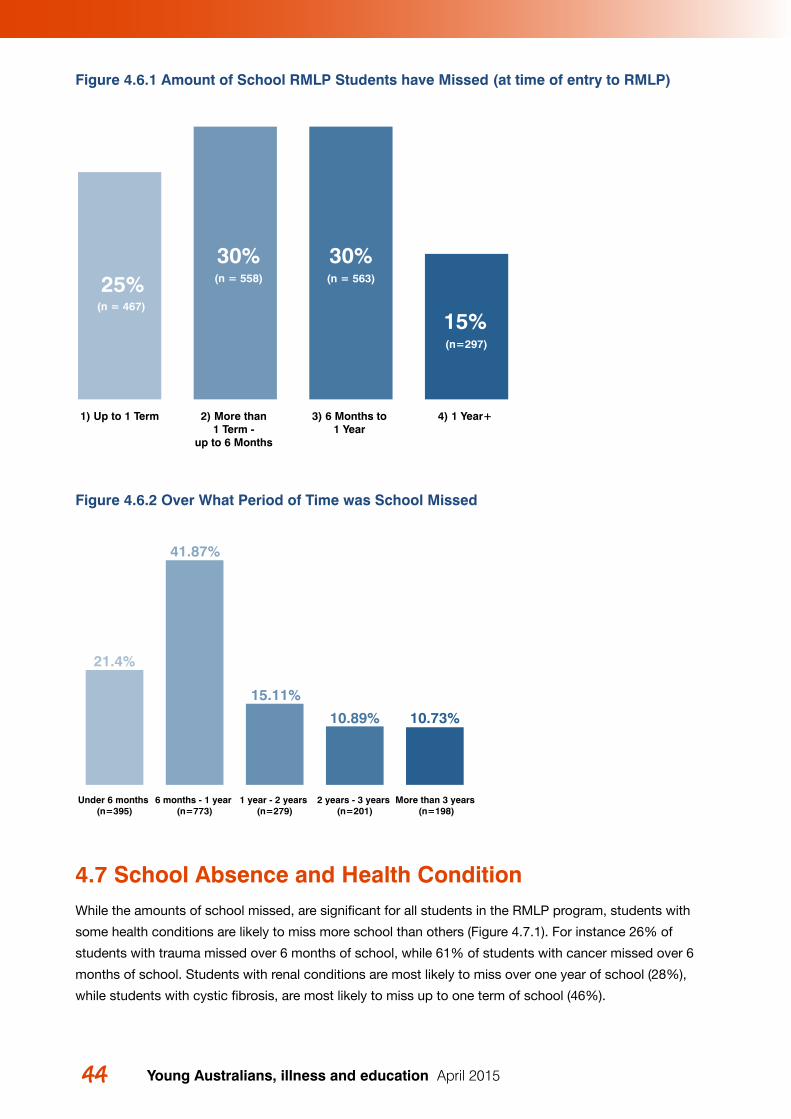
Young Australians, illness and education April 201544 45 4 The RMLP student records
Figure 4.6.1 Amount of School RMLP Students have Missed (at time of entry to RMLP)
Figure 4.6.2 Over What Period of Time was School Missed
4.7 School Absence and Health ConditionWhile the amounts of school missed, are significant for all students in the RMLP program, students with
some health conditions are likely to miss more school than others (Figure 4.7.1). For instance 26% of
students with trauma missed over 6 months of school, while 61% of students with cancer missed over 6
months of school. Students with renal conditions are most likely to miss over one year of school (28%),
while students with cystic fibrosis, are most likely to miss up to one term of school (46%).
Figure 11
21.4%
41.87%
15.11%
10.89% 10.73%
More than 3 years (n=198)
2 years - 3 years (n=201)
1 year - 2 years (n=279)
6 months - 1 year (n=773)
Under 6 months (n=395)
Figure 114) 1 Year+ 3) 6 Months to
1 Year 2) More than
1 Term - up to 6 Months
1) Up to 1 Term
25%30% 30%
15%(n=297)
(n = 563)(n = 558)
(n = 467)
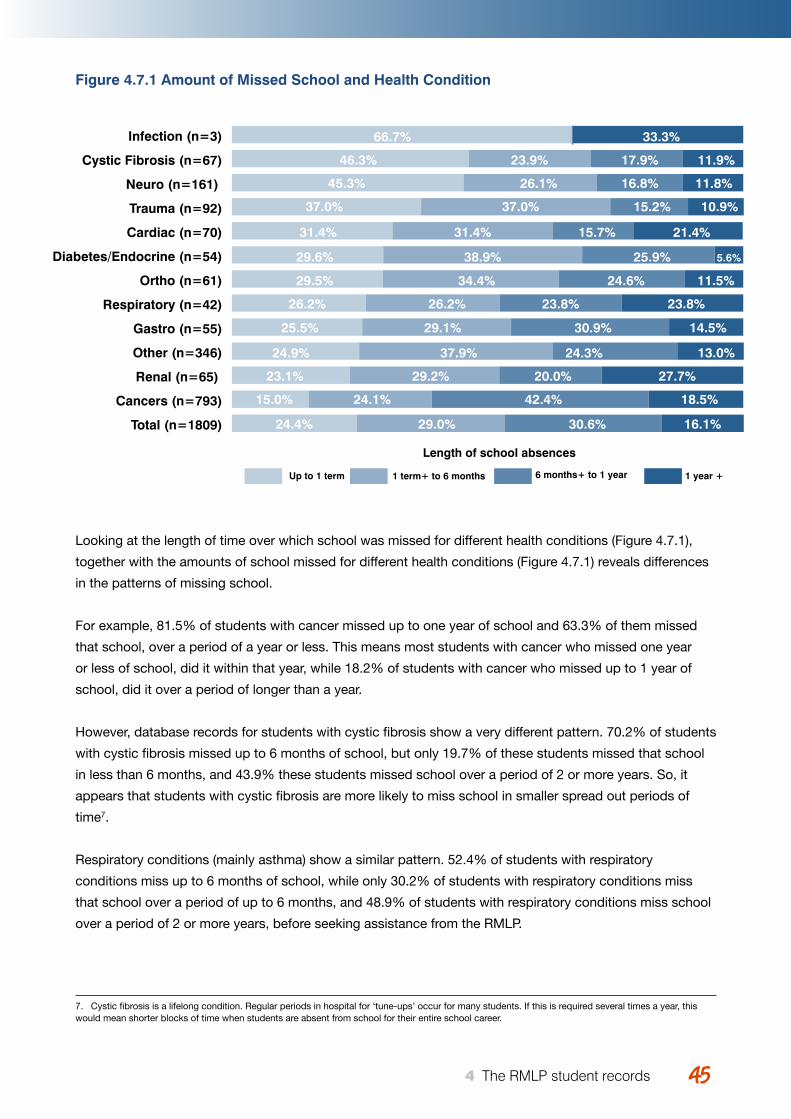
Young Australians, illness and education April 2015 4545 4 The RMLP student records
Figure 4.7.1 Amount of Missed School and Health Condition
Looking at the length of time over which school was missed for different health conditions (Figure 4.7.1),
together with the amounts of school missed for different health conditions (Figure 4.7.1) reveals differences
in the patterns of missing school.
For example, 81.5% of students with cancer missed up to one year of school and 63.3% of them missed
that school, over a period of a year or less. This means most students with cancer who missed one year
or less of school, did it within that year, while 18.2% of students with cancer who missed up to 1 year of
school, did it over a period of longer than a year.
However, database records for students with cystic fibrosis show a very different pattern. 70.2% of students
with cystic fibrosis missed up to 6 months of school, but only 19.7% of these students missed that school
in less than 6 months, and 43.9% these students missed school over a period of 2 or more years. So, it
appears that students with cystic fibrosis are more likely to miss school in smaller spread out periods of
time7.
Respiratory conditions (mainly asthma) show a similar pattern. 52.4% of students with respiratory
conditions miss up to 6 months of school, while only 30.2% of students with respiratory conditions miss
that school over a period of up to 6 months, and 48.9% of students with respiratory conditions miss school
over a period of 2 or more years, before seeking assistance from the RMLP.
Figure 12
Figure 131 year +6 months+ to 1 year1 term+ to 6 monthsUp to 1 term
Total (n=1809)
Cancers (n=793)
Renal (n=65)
Other (n=346)
Gastro (n=55)
Respiratory (n=42)
Ortho (n=61)
Diabetes/Endocrine (n=54)
Cardiac (n=70)
Trauma (n=92)
Neuro (n=161)
Cystic Fibrosis (n=67)
Infection (n=3) 66.7%
46.3%
45.3%
37.0%
31.4%
29.6%
29.5%
26.2%
25.5%
24.9%
23.1%
15.0%
24.4%
23.9%
26.1%
37.0%
31.4%
38.9%
34.4%
26.2%
29.1%
37.9%
29.2%
24.1%
29.0%
17.9%
16.8%
15.2%
15.7%
25.9%
24.6%
23.8%
30.9%
24.3%
20.0%
42.4%
30.6%
11.9%
11.8%
10.9%
21.4%
5.6%
11.5%
23.8%
14.5%
13.0%
27.7%
18.5%
16.1%
33.3%
Length of school absences
7. Cystic fibrosis is a lifelong condition. Regular periods in hospital for ‘tune-ups’ occur for many students. If this is required several times a year, this would mean shorter blocks of time when students are absent from school for their entire school career.
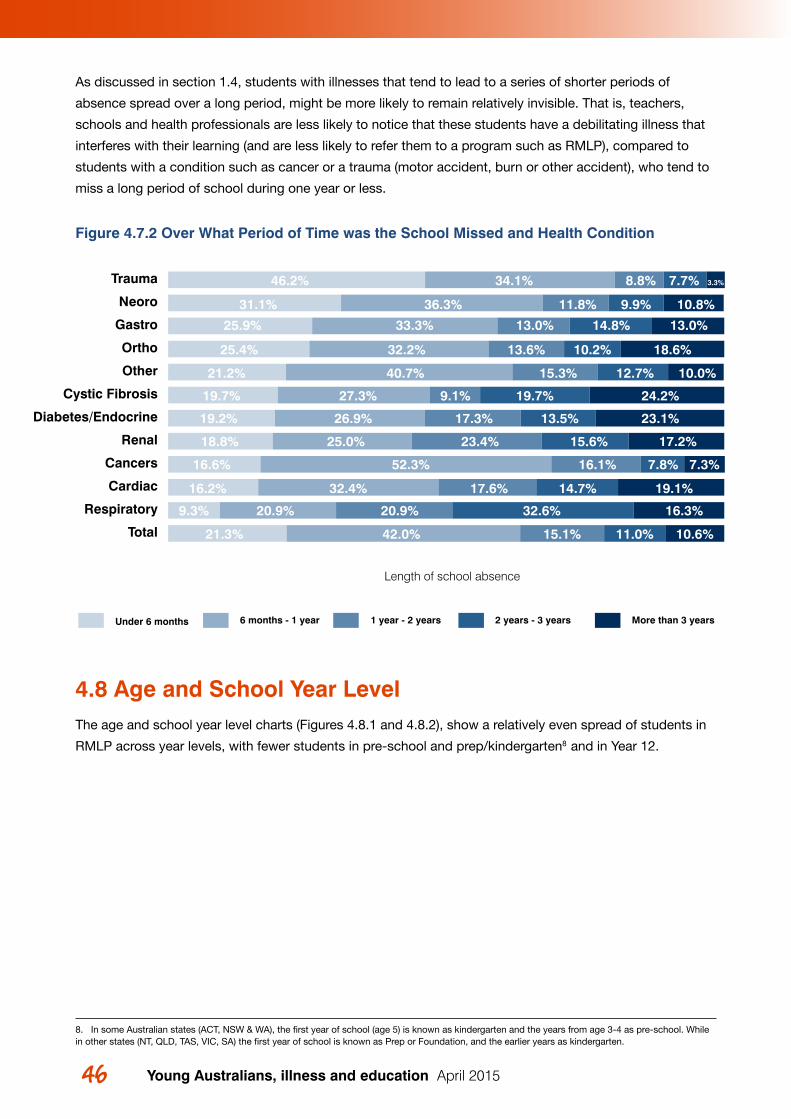
Young Australians, illness and education April 201546 47 4 The RMLP student records
As discussed in section 1.4, students with illnesses that tend to lead to a series of shorter periods of
absence spread over a long period, might be more likely to remain relatively invisible. That is, teachers,
schools and health professionals are less likely to notice that these students have a debilitating illness that
interferes with their learning (and are less likely to refer them to a program such as RMLP), compared to
students with a condition such as cancer or a trauma (motor accident, burn or other accident), who tend to
miss a long period of school during one year or less.
Figure 4.7.2 Over What Period of Time was the School Missed and Health Condition
4.8 Age and School Year LevelThe age and school year level charts (Figures 4.8.1 and 4.8.2), show a relatively even spread of students in
RMLP across year levels, with fewer students in pre-school and prep/kindergarten8 and in Year 12.
Figure 13
Length of school absence
More than 3 years2 years - 3 years1 year - 2 years6 months - 1 yearUnder 6 months
Total
Respiratory
Cardiac
Cancers
Renal
Diabetes/Endocrine
Cystic Fibrosis
Other
Ortho
Gastro
Neoro
Trauma 46.2% 34.1% 8.8% 7.7%
36.3% 9.9%11.8% 10.8%
33.3% 13.0% 14.8% 13.0%
18.6%
10.0%
24.2%
23.1%
17.2%
7.3%
19.1%
16.3%
10.6%
32.2% 13.6% 10.2%
40.7% 15.3% 12.7%
27.3% 9.1% 19.7%
26.9% 17.3% 13.5%
25.0% 23.4% 15.6%
52.3% 16.1% 7.8%
32.4% 17.6% 14.7%
20.9% 20.9% 32.6%
42.0% 15.1% 11.0%
3.3%
31.1%
25.9%
25.4%
21.2%
19.7%
19.2%
18.8%
16.6%
16.2%
9.3%
21.3%
8. In some Australian states (ACT, NSW & WA), the first year of school (age 5) is known as kindergarten and the years from age 3-4 as pre-school. While in other states (NT, QLD, TAS, VIC, SA) the first year of school is known as Prep or Foundation, and the earlier years as kindergarten.
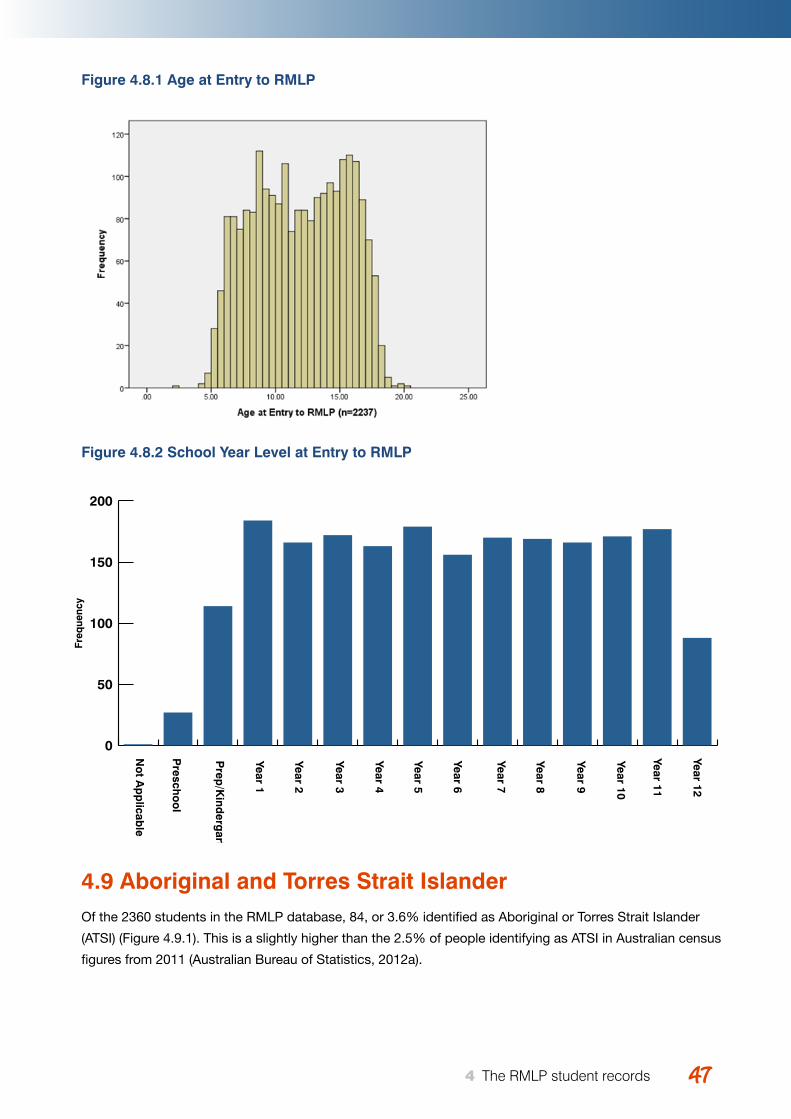
Young Australians, illness and education April 2015 4747 4 The RMLP student records
Figure 4.8.1 Age at Entry to RMLP
Figure 4.8.2 School Year Level at Entry to RMLP
4.9 Aboriginal and Torres Strait IslanderOf the 2360 students in the RMLP database, 84, or 3.6% identified as Aboriginal or Torres Strait Islander
(ATSI) (Figure 4.9.1). This is a slightly higher than the 2.5% of people identifying as ATSI in Australian census
figures from 2011 (Australian Bureau of Statistics, 2012a).
Figure 14
Figure 15
Freq
uenc
y
0
50
100
150
200
Year 12
Year 11
Year 10
Year 9
Year 8
Year 7
Year 6
Year 5
Year 4
Year 3
Year 2
Year 1
Prep
/Kind
ergarten
Presch
oo
l
No
t Ap
plicab
le
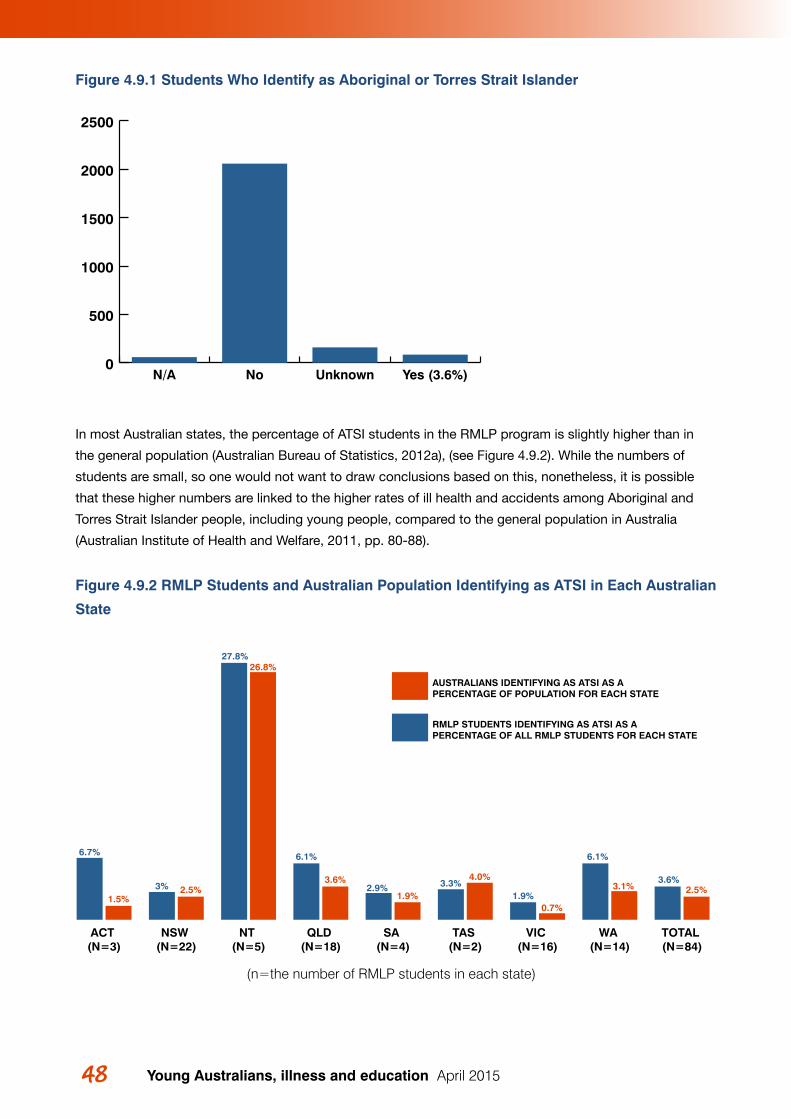
Young Australians, illness and education April 201548 49 4 The RMLP student records
Figure 4.9.1 Students Who Identify as Aboriginal or Torres Strait Islander
In most Australian states, the percentage of ATSI students in the RMLP program is slightly higher than in
the general population (Australian Bureau of Statistics, 2012a), (see Figure 4.9.2). While the numbers of
students are small, so one would not want to draw conclusions based on this, nonetheless, it is possible
that these higher numbers are linked to the higher rates of ill health and accidents among Aboriginal and
Torres Strait Islander people, including young people, compared to the general population in Australia
(Australian Institute of Health and Welfare, 2011, pp. 80-88).
Figure 4.9.2 RMLP Students and Australian Population Identifying as ATSI in Each Australian
State
0
500
1000
1500
2000
2500
Yes (3.6%)UnknownNoN/A
6.7%
1.5%3% 2.5%
27.8%26.8%
6.1%
3.6%2.9%
1.9%3.3%
4.0%
1.9%0.7%
6.1%
3.1%3.6%
2.5%
AUSTRALIANS IDENTIFYING AS ATSI AS A PERCENTAGE OF POPULATION FOR EACH STATE
RMLP STUDENTS IDENTIFYING AS ATSI AS A PERCENTAGE OF ALL RMLP STUDENTS FOR EACH STATE
TOTAL (N=84)
WA (N=14)
VIC (N=16)
TAS (N=2)
SA (N=4)
QLD (N=18)
NT (N=5)
NSW (N=22)
ACT (N=3)
(n=the number of RMLP students in each state)
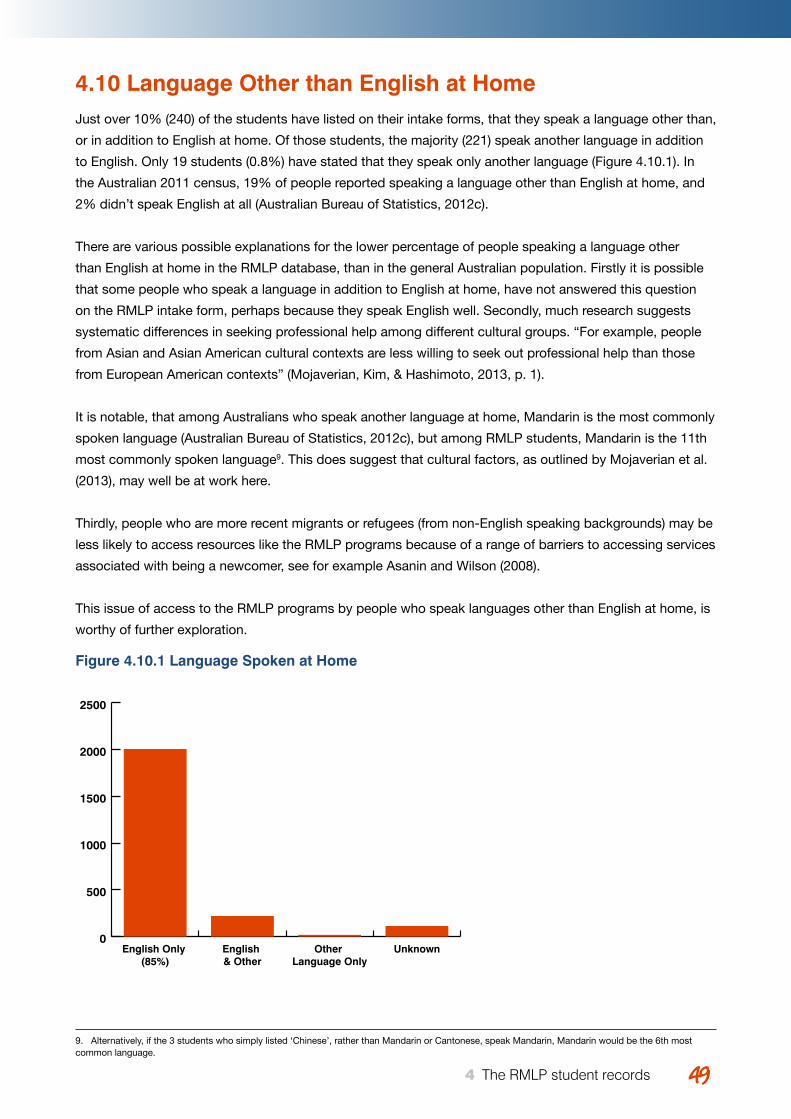
Young Australians, illness and education April 2015 4949 4 The RMLP student records
4.10 Language Other than English at HomeJust over 10% (240) of the students have listed on their intake forms, that they speak a language other than,
or in addition to English at home. Of those students, the majority (221) speak another language in addition
to English. Only 19 students (0.8%) have stated that they speak only another language (Figure 4.10.1). In
the Australian 2011 census, 19% of people reported speaking a language other than English at home, and
2% didn’t speak English at all (Australian Bureau of Statistics, 2012c).
There are various possible explanations for the lower percentage of people speaking a language other
than English at home in the RMLP database, than in the general Australian population. Firstly it is possible
that some people who speak a language in addition to English at home, have not answered this question
on the RMLP intake form, perhaps because they speak English well. Secondly, much research suggests
systematic differences in seeking professional help among different cultural groups. “For example, people
from Asian and Asian American cultural contexts are less willing to seek out professional help than those
from European American contexts” (Mojaverian, Kim, & Hashimoto, 2013, p. 1).
It is notable, that among Australians who speak another language at home, Mandarin is the most commonly
spoken language (Australian Bureau of Statistics, 2012c), but among RMLP students, Mandarin is the 11th
most commonly spoken language9. This does suggest that cultural factors, as outlined by Mojaverian et al.
(2013), may well be at work here.
Thirdly, people who are more recent migrants or refugees (from non-English speaking backgrounds) may be
less likely to access resources like the RMLP programs because of a range of barriers to accessing services
associated with being a newcomer, see for example Asanin and Wilson (2008).
This issue of access to the RMLP programs by people who speak languages other than English at home, is
worthy of further exploration.
Figure 4.10.1 Language Spoken at Home
0
500
1000
1500
2000
2500
UnknownOther Language Only
English & Other
English Only (85%)
9. Alternatively, if the 3 students who simply listed ‘Chinese’, rather than Mandarin or Cantonese, speak Mandarin, Mandarin would be the 6th most common language.
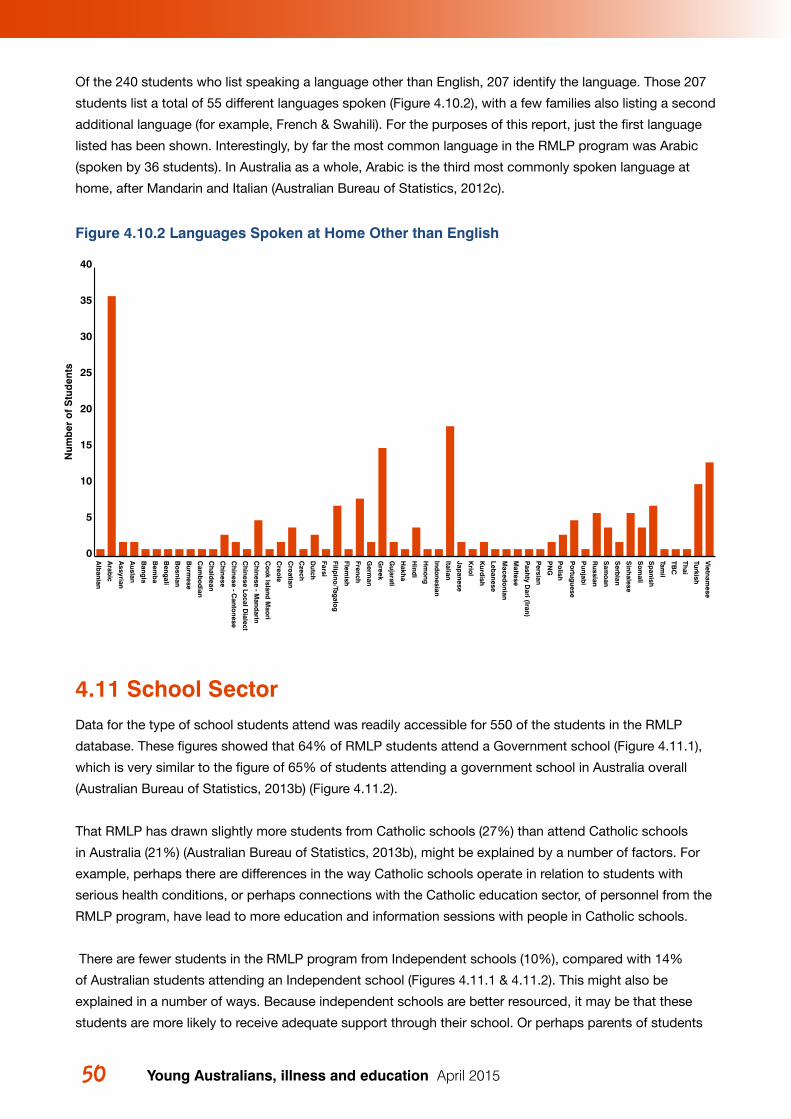
Young Australians, illness and education April 201550
Of the 240 students who list speaking a language other than English, 207 identify the language. Those 207
students list a total of 55 different languages spoken (Figure 4.10.2), with a few families also listing a second
additional language (for example, French & Swahili). For the purposes of this report, just the first language
listed has been shown. Interestingly, by far the most common language in the RMLP program was Arabic
(spoken by 36 students). In Australia as a whole, Arabic is the third most commonly spoken language at
home, after Mandarin and Italian (Australian Bureau of Statistics, 2012c).
Figure 4.10.2 Languages Spoken at Home Other than English
4.11 School SectorData for the type of school students attend was readily accessible for 550 of the students in the RMLP
database. These figures showed that 64% of RMLP students attend a Government school (Figure 4.11.1),
which is very similar to the figure of 65% of students attending a government school in Australia overall
(Australian Bureau of Statistics, 2013b) (Figure 4.11.2).
That RMLP has drawn slightly more students from Catholic schools (27%) than attend Catholic schools
in Australia (21%) (Australian Bureau of Statistics, 2013b), might be explained by a number of factors. For
example, perhaps there are differences in the way Catholic schools operate in relation to students with
serious health conditions, or perhaps connections with the Catholic education sector, of personnel from the
RMLP program, have lead to more education and information sessions with people in Catholic schools.
There are fewer students in the RMLP program from Independent schools (10%), compared with 14%
of Australian students attending an Independent school (Figures 4.11.1 & 4.11.2). This might also be
explained in a number of ways. Because independent schools are better resourced, it may be that these
students are more likely to receive adequate support through their school. Or perhaps parents of students
Figure 19N
umb
er o
f S
tud
ents
0
5
10
15
20
25
30
35
40
Vietnam
ese
Turkish
Thai
TBC
Tamil
Sp
anish
So
mali
Sinh
alese
Serb
ian
Sam
oan
Russian
Punjab
i
Po
rtuguese
Po
lish
PN
G
Persian
Pash
ty Dari (Iran)
Maltese
Maced
onian
Lebanese
Kurd
ish
Krio
l
Japanese
Italian
Indo
nesian
Hm
ong
Hind
i
Hakh
a
Gujarati
Greek
Germ
an
French
Flemish
Filipino
/Tagalo
g
Farsi
Dutch
Czech
Cro
atian
Creo
le
Co
ok Island
Mao
ri
Ch
inese - Mand
arin
Ch
inese Local D
ialect
Ch
inese - Canto
nese
Ch
inese
Ch
aldean
Cam
bo
dian
Burm
ese
Bo
snian
Beng
ali
Bem
ba
Bang
la
Auslan
Assyrian
Arab
ic
Alb
anian
51 4 The RMLP student records
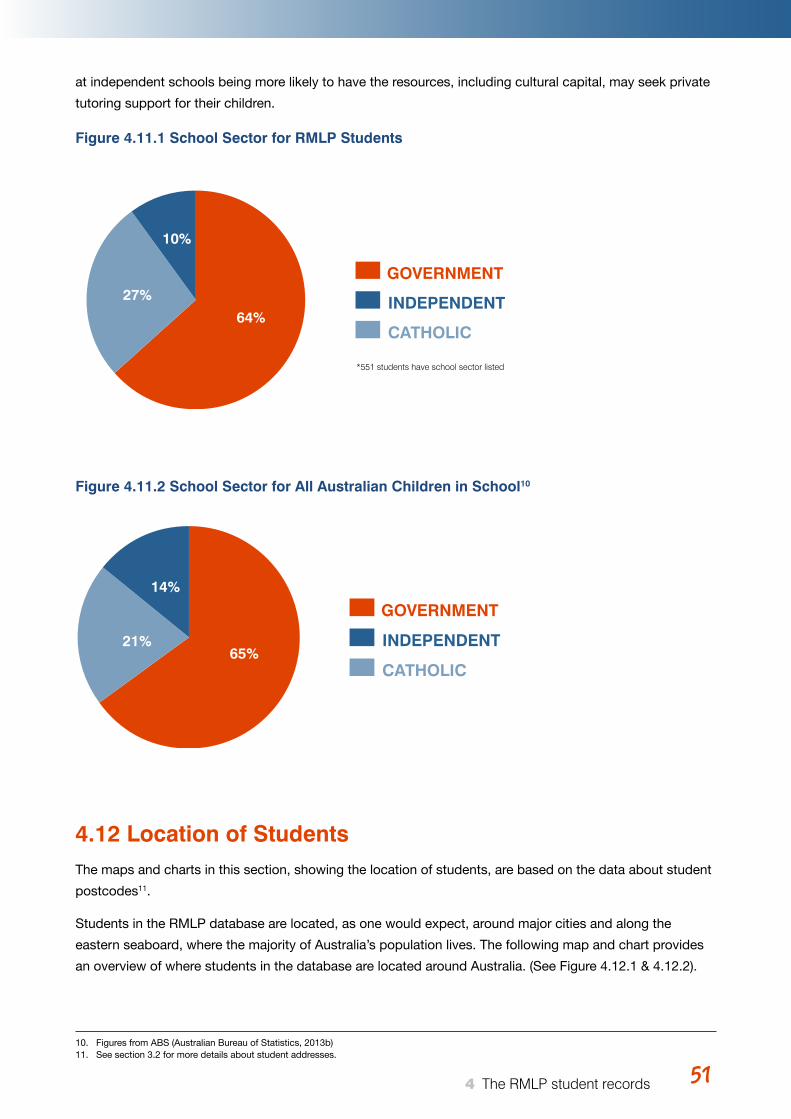
Young Australians, illness and education April 2015 51
at independent schools being more likely to have the resources, including cultural capital, may seek private
tutoring support for their children.
Figure 4.11.1 School Sector for RMLP Students
Figure 4.11.2 School Sector for All Australian Children in School10
4.12 Location of StudentsThe maps and charts in this section, showing the location of students, are based on the data about student
postcodes11.
Students in the RMLP database are located, as one would expect, around major cities and along the
eastern seaboard, where the majority of Australia’s population lives. The following map and chart provides
an overview of where students in the database are located around Australia. (See Figure 4.12.1 & 4.12.2).
Figure 20 64%
27%
10%
GOVERNMENT
INDEPENDENT
CATHOLIC
*551 students have school sector listed
GOVERNMENT
INDEPENDENT
CATHOLIC65%
14%
21%
51 4 The RMLP student records
10. Figures from ABS (Australian Bureau of Statistics, 2013b)11. See section 3.2 for more details about student addresses.
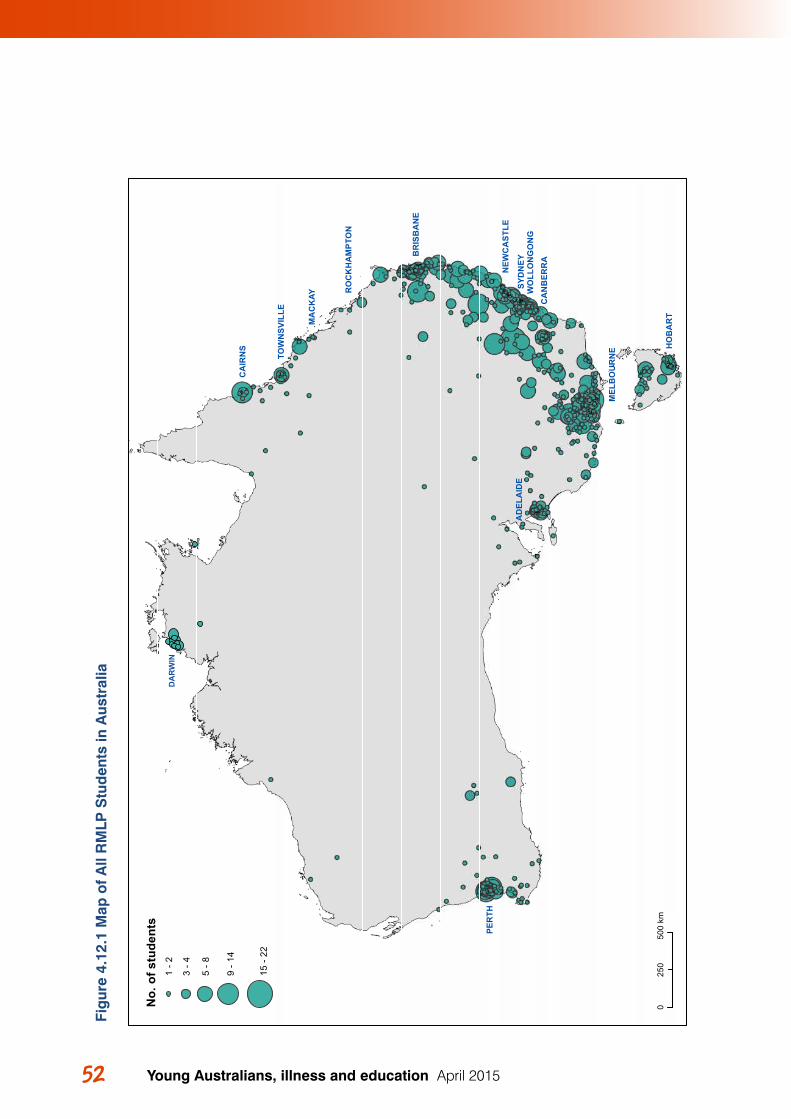
Young Australians, illness and education April 201552 53 4 The RMLP student records
Figu
re 2
2"
"
"
"
"
"
"
"
"
"
"
"
"
PER
TH
SYD
NEY
CA
IRN
S HO
BA
RT
MA
CK
AY
AD
ELA
IDE
CA
NB
ERR
A
BR
ISB
AN
E
MEL
BO
UR
NE
NEW
CA
STLE
WO
LLO
NG
ON
G
TOW
NSV
ILLE
RO
CK
HA
MPT
ON
050
025
0km
No.
of s
tude
nts
1 - 2
3 - 4
5 - 8
9 - 1
4
15 -
22
DA
RW
IN
Fig
ure
4.12
.1 M
ap o
f A
ll R
MLP
Stu
den
ts in
Aus
tral
ia
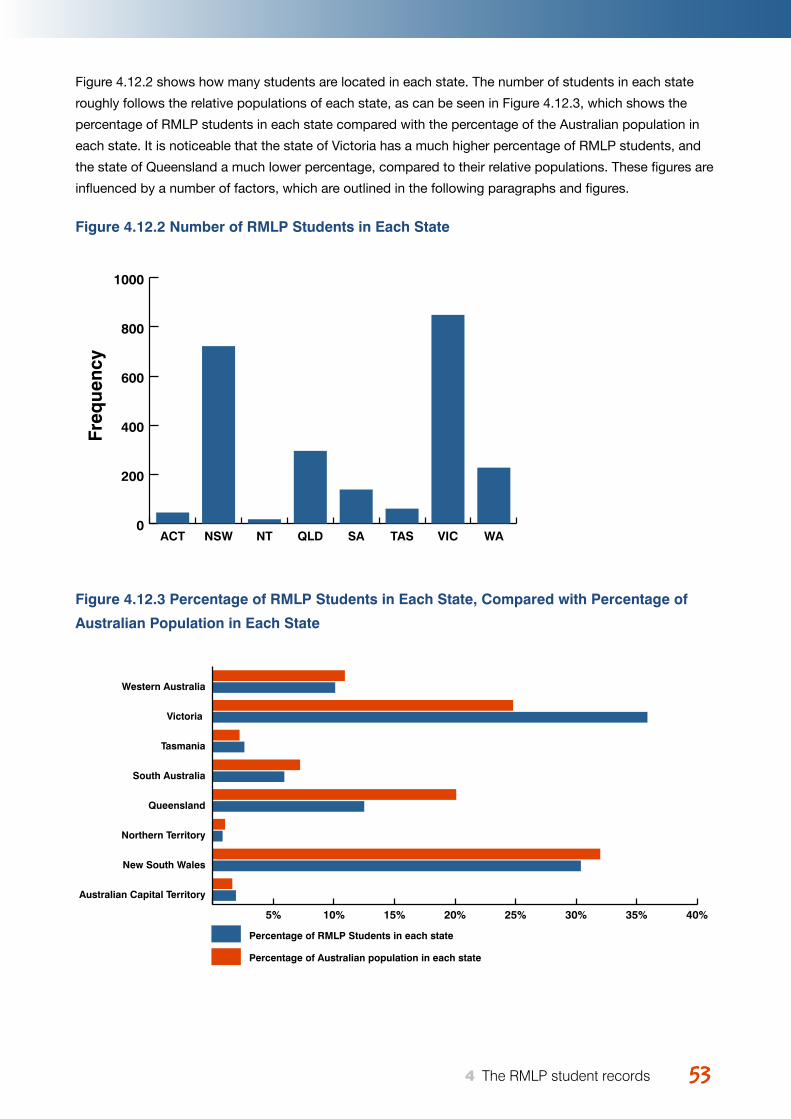
Young Australians, illness and education April 2015 5353 4 The RMLP student records
Figure 4.12.2 shows how many students are located in each state. The number of students in each state
roughly follows the relative populations of each state, as can be seen in Figure 4.12.3, which shows the
percentage of RMLP students in each state compared with the percentage of the Australian population in
each state. It is noticeable that the state of Victoria has a much higher percentage of RMLP students, and
the state of Queensland a much lower percentage, compared to their relative populations. These figures are
influenced by a number of factors, which are outlined in the following paragraphs and figures.
Figure 4.12.2 Number of RMLP Students in Each State
Figure 4.12.3 Percentage of RMLP Students in Each State, Compared with Percentage of
Australian Population in Each State
Figure 23
Figure 24
Freq
uenc
y
0
200
400
600
800
1000
WAVICTASSAQLDNTNSWACT
5% 10% 15% 20% 25% 30% 35% 40%
Percentage of RMLP Students in each state
Percentage of Australian population in each state
Australian Capital Territory
New South Wales
Northern Territory
Queensland
South Australia
Tasmania
Victoria
Western Australia
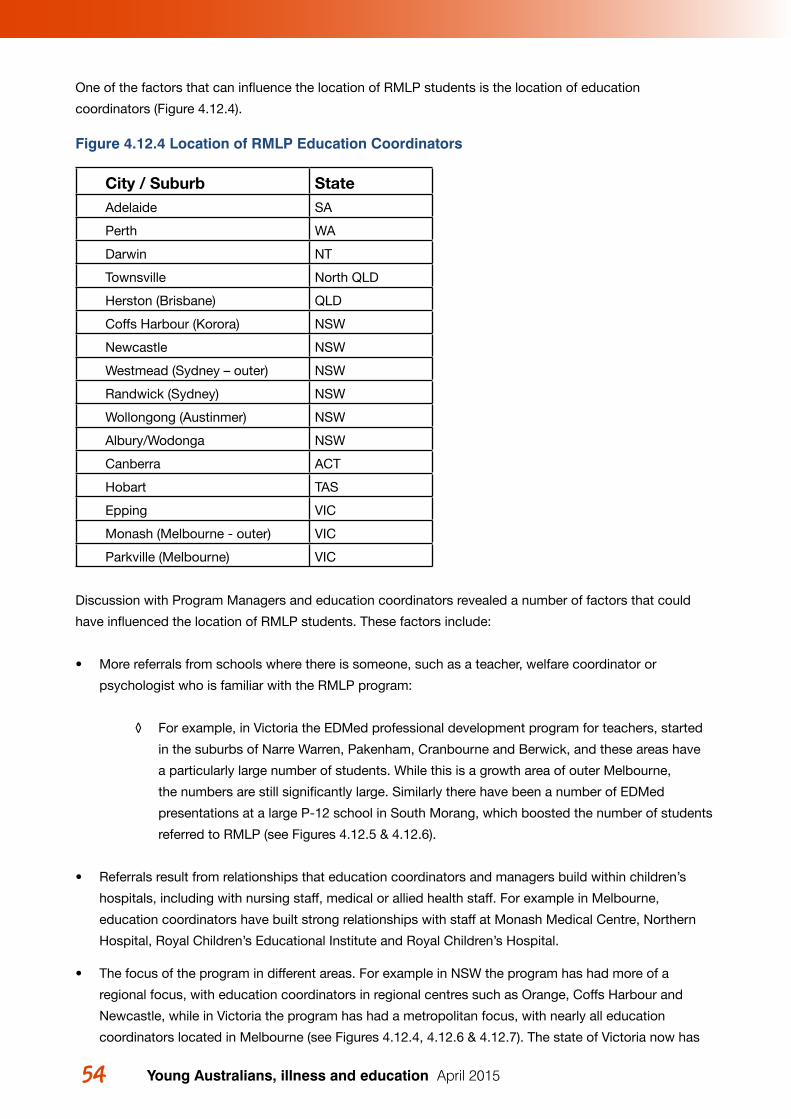
Young Australians, illness and education April 201554 55 4 The RMLP student records
One of the factors that can influence the location of RMLP students is the location of education
coordinators (Figure 4.12.4).
Figure 4.12.4 Location of RMLP Education Coordinators
City / Suburb StateAdelaide SA
Perth WA
Darwin NT
Townsville North QLD
Herston (Brisbane) QLD
Coffs Harbour (Korora) NSW
Newcastle NSW
Westmead (Sydney – outer) NSW
Randwick (Sydney) NSW
Wollongong (Austinmer) NSW
Albury/Wodonga NSW
Canberra ACT
Hobart TAS
Epping VIC
Monash (Melbourne - outer) VIC
Parkville (Melbourne) VIC
Discussion with Program Managers and education coordinators revealed a number of factors that could
have influenced the location of RMLP students. These factors include:
• More referrals from schools where there is someone, such as a teacher, welfare coordinator or
psychologist who is familiar with the RMLP program:
◊ For example, in Victoria the EDMed professional development program for teachers, started
in the suburbs of Narre Warren, Pakenham, Cranbourne and Berwick, and these areas have
a particularly large number of students. While this is a growth area of outer Melbourne,
the numbers are still significantly large. Similarly there have been a number of EDMed
presentations at a large P-12 school in South Morang, which boosted the number of students
referred to RMLP (see Figures 4.12.5 & 4.12.6).
• Referrals result from relationships that education coordinators and managers build within children’s
hospitals, including with nursing staff, medical or allied health staff. For example in Melbourne,
education coordinators have built strong relationships with staff at Monash Medical Centre, Northern
Hospital, Royal Children’s Educational Institute and Royal Children’s Hospital.
• The focus of the program in different areas. For example in NSW the program has had more of a
regional focus, with education coordinators in regional centres such as Orange, Coffs Harbour and
Newcastle, while in Victoria the program has had a metropolitan focus, with nearly all education
coordinators located in Melbourne (see Figures 4.12.4, 4.12.6 & 4.12.7). The state of Victoria now has
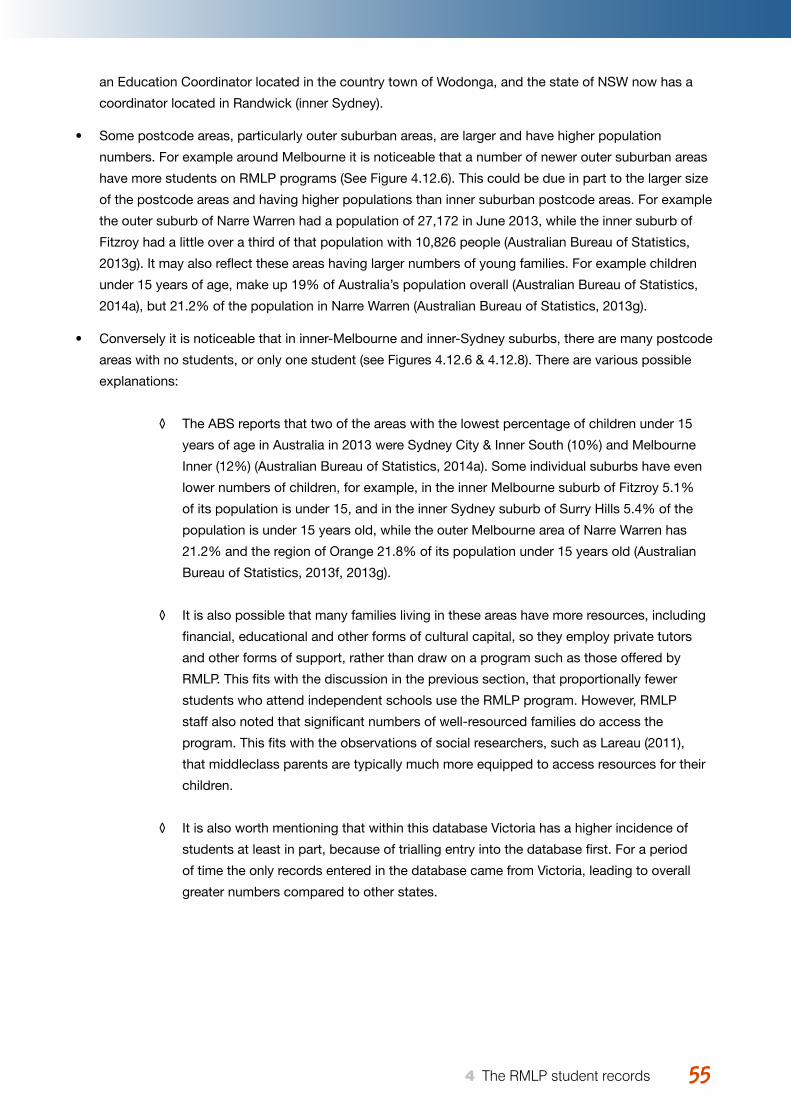
Young Australians, illness and education April 2015 5555 4 The RMLP student records
an Education Coordinator located in the country town of Wodonga, and the state of NSW now has a
coordinator located in Randwick (inner Sydney).
• Some postcode areas, particularly outer suburban areas, are larger and have higher population
numbers. For example around Melbourne it is noticeable that a number of newer outer suburban areas
have more students on RMLP programs (See Figure 4.12.6). This could be due in part to the larger size
of the postcode areas and having higher populations than inner suburban postcode areas. For example
the outer suburb of Narre Warren had a population of 27,172 in June 2013, while the inner suburb of
Fitzroy had a little over a third of that population with 10,826 people (Australian Bureau of Statistics,
2013g). It may also reflect these areas having larger numbers of young families. For example children
under 15 years of age, make up 19% of Australia’s population overall (Australian Bureau of Statistics,
2014a), but 21.2% of the population in Narre Warren (Australian Bureau of Statistics, 2013g).
• Conversely it is noticeable that in inner-Melbourne and inner-Sydney suburbs, there are many postcode
areas with no students, or only one student (see Figures 4.12.6 & 4.12.8). There are various possible
explanations:
◊ The ABS reports that two of the areas with the lowest percentage of children under 15
years of age in Australia in 2013 were Sydney City & Inner South (10%) and Melbourne
Inner (12%) (Australian Bureau of Statistics, 2014a). Some individual suburbs have even
lower numbers of children, for example, in the inner Melbourne suburb of Fitzroy 5.1%
of its population is under 15, and in the inner Sydney suburb of Surry Hills 5.4% of the
population is under 15 years old, while the outer Melbourne area of Narre Warren has
21.2% and the region of Orange 21.8% of its population under 15 years old (Australian
Bureau of Statistics, 2013f, 2013g).
◊ It is also possible that many families living in these areas have more resources, including
financial, educational and other forms of cultural capital, so they employ private tutors
and other forms of support, rather than draw on a program such as those offered by
RMLP. This fits with the discussion in the previous section, that proportionally fewer
students who attend independent schools use the RMLP program. However, RMLP
staff also noted that significant numbers of well-resourced families do access the
program. This fits with the observations of social researchers, such as Lareau (2011),
that middleclass parents are typically much more equipped to access resources for their
children.
◊ It is also worth mentioning that within this database Victoria has a higher incidence of
students at least in part, because of trialling entry into the database first. For a period
of time the only records entered in the database came from Victoria, leading to overall
greater numbers compared to other states.
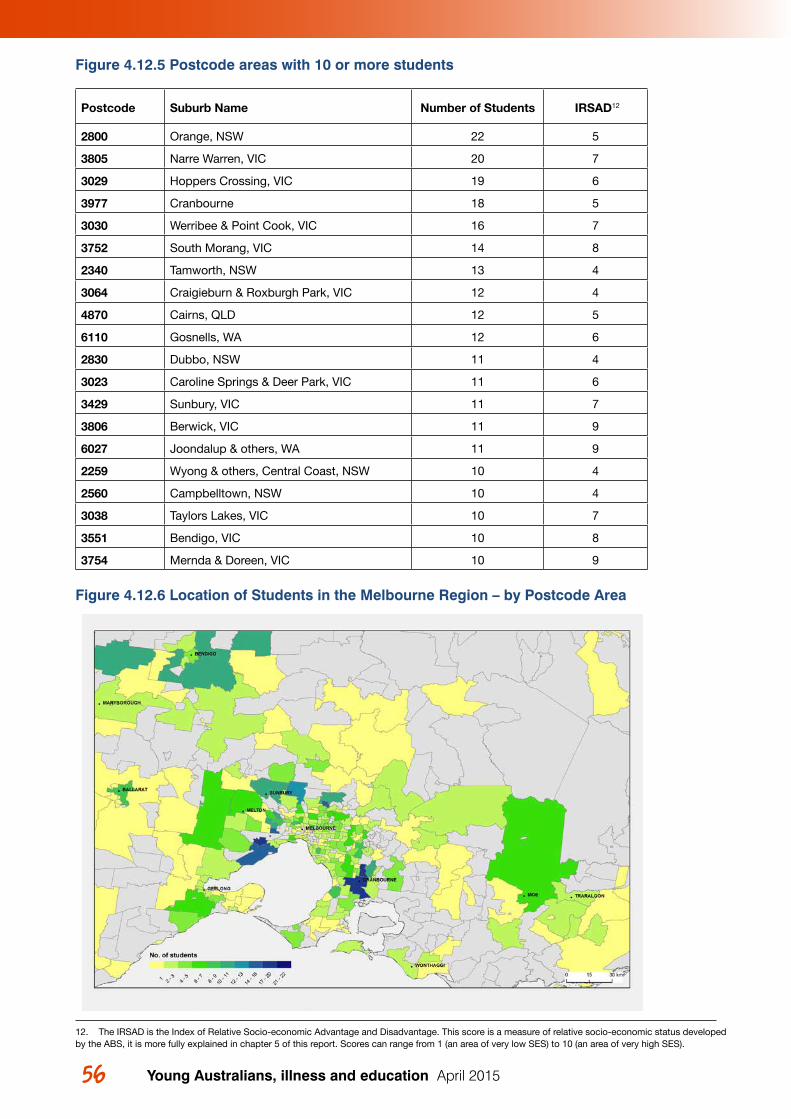
Young Australians, illness and education April 201556 57 4 The RMLP student records
Figure 4.12.5 Postcode areas with 10 or more students
Postcode Suburb Name Number of Students IRSAD12
2800 Orange, NSW 22 5
3805 Narre Warren, VIC 20 7
3029 Hoppers Crossing, VIC 19 6
3977 Cranbourne 18 5
3030 Werribee & Point Cook, VIC 16 7
3752 South Morang, VIC 14 8
2340 Tamworth, NSW 13 4
3064 Craigieburn & Roxburgh Park, VIC 12 4
4870 Cairns, QLD 12 5
6110 Gosnells, WA 12 6
2830 Dubbo, NSW 11 4
3023 Caroline Springs & Deer Park, VIC 11 6
3429 Sunbury, VIC 11 7
3806 Berwick, VIC 11 9
6027 Joondalup & others, WA 11 9
2259 Wyong & others, Central Coast, NSW 10 4
2560 Campbelltown, NSW 10 4
3038 Taylors Lakes, VIC 10 7
3551 Bendigo, VIC 10 8
3754 Mernda & Doreen, VIC 10 9
Figure 4.12.6 Location of Students in the Melbourne Region – by Postcode Area
Figure 27
12. The IRSAD is the Index of Relative Socio-economic Advantage and Disadvantage. This score is a measure of relative socio-economic status developed by the ABS, it is more fully explained in chapter 5 of this report. Scores can range from 1 (an area of very low SES) to 10 (an area of very high SES).
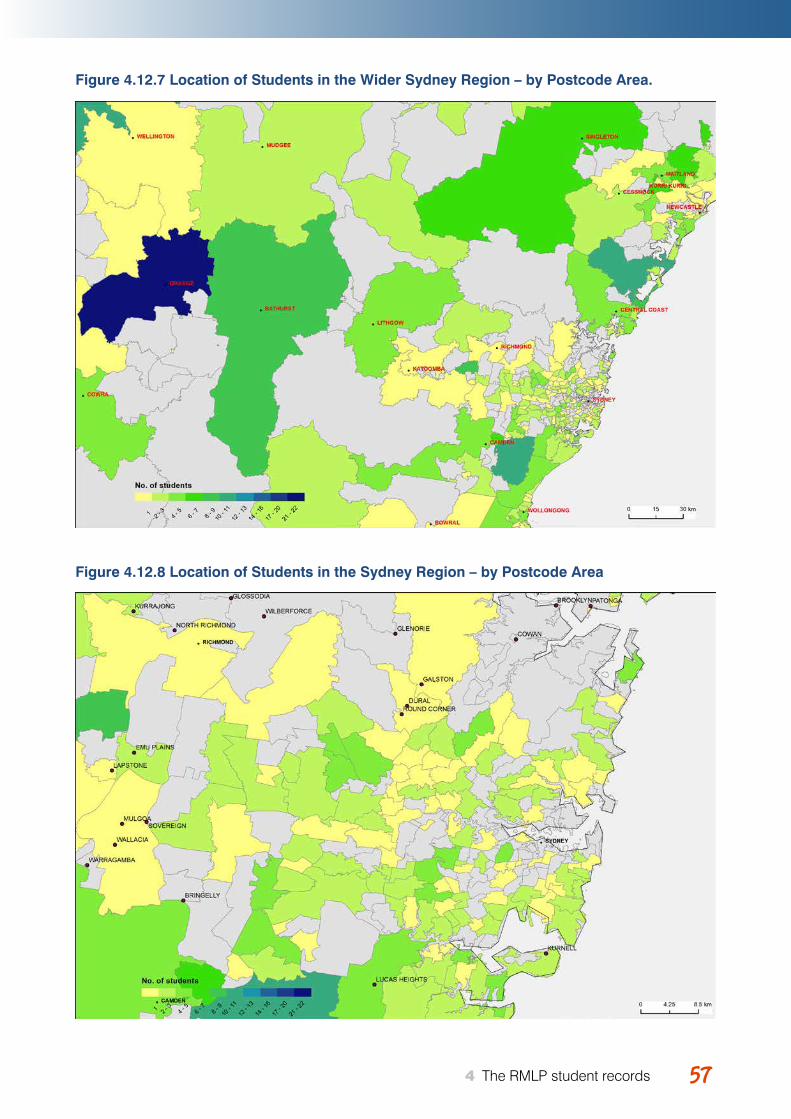
Young Australians, illness and education April 2015 5757 4 The RMLP student records
Figure 4.12.7 Location of Students in the Wider Sydney Region – by Postcode Area.
Figure 4.12.8 Location of Students in the Sydney Region – by Postcode Area
Young Australians, illness and education April 201558
4.12.1 Questions Raised by Mapping
The creation of maps showing student numbers was useful in helping the Program Managers identify their
working knowledge of the program, to tell stories and provide explanations of high numbers in different
places, and to ask questions and consider the meaning of these areas of concentration. Many of these
questions were generative, in that they suggest different approaches to thinking about and addressing the
research questions.
Concerns about who accesses the programs and why, provide useful lines of enquiry about the different
factors that impact on students accessing the program and thinking about the project’s third research
question:
What factors and processes shape these students’ trajectories and what recommendations can be proposed for improved practices?
Questions that were asked in relation to maps of student locations include:
• Why do so few students who access the program live in inner suburban areas? (Possible answers to
this questions have been offered in the preceding pages (section 1.12)
• Why are significant numbers of students located in some areas where there is no Education
Coordinator, and EDMed has not been particularly emphasised, such as the country town of Bendigo in
Victoria?
59 5 RMLP students and socio-economic status (SES)
59Young Australians, illness and education April 2015 59 5 RMLP students and socio-economic status (SES)
5RMLP STUDENTS AND SOCIOECONOMIC STATUS (SES)
As discussed in the overview of research about young people with serious health conditions and their
education, lower SES13 is associated with poorer educational outcomes in a range of ways. It is also
associated with disability and illness, with single parenting and access to services. In considering what
could be learned from the database about young people with serious illness and their education, priority
was given to examination of SES factors. It was not known whether students from lower or higher SES
areas accessed the RMLP services. The investigation also sought to reveal new or confirm existing
knowledge in relation to SES and other factors such as type of illness, amount of missed school14, or single
parenting.
This chapter begins with:
1. An explanation of the Australian Bureau of Statistics (ABS) socio-economic indexes that were used to examine SES in this study.
The chapter then proceeds to outline investigations about these issues:
2. The spread of RMLP students across higher and lower SES areas;
3. Connections between different health conditions and SES;
4. Connections between other factors and SES.
5.1 Using the ABS Socio-Economic IndexesSocio-economic indexes for areas (SEIFA) developed by the ABS (Australian Bureau of Statistics, 2013i),
were used to examine the socio-economic status (SES) of students in the RMLP database.
The ABS socio-economic indexes rank areas around Australia, based on the level of advantage and
disadvantage of people in each area. The indexes are based on various data from the 2011 Census,
including income, employment, occupation, housing, education and disability (Australian Bureau of
Statistics, 2013h). Based on these variables, scores were allocated to geographic areas. A low score means
people living in that area have relatively few resources or advantage, and a higher score, means they have
more resources and advantage. These areas are ranked in order from lowest to highest score around
Australia. It is these rankings, rather than the raw scores that are used to compare the SES of different
areas.
The SEIFA rankings that were used in this project are based on postcode areas. While the ABS can also
provide data based on much smaller geographic areas, which allows a more accurate approximation of SES
13. SES = Socio-economic status14. In the case of amount of missed school, the graphs did not appear to reveal any new information, so these graphs are not presented here. Amount of missed school appeared to be connected with type of illness (as one would expect), but not in any noticeable way with SES.
Young Australians, illness and education April 201560 61 5 RMLP students and socio-economic status (SES)
for a given household, this requires coding of all addresses, which was beyond the scope of this project.
Using postcode based SES rankings necessarily masks a lot, as within one postcode, might be a wide
range of different socio-economic areas. However when looking for trends with larger numbers of people, it
can nevertheless prove a useful measure.
The ABS ranks all the postcode areas according to their SEIFA scores, and then divides the scores into
deciles. ‘10’ means the postcode area is in the top 10%, and is among the most advantaged of all areas in
Australia. ‘1’ means that the suburb is in the bottom 10%, and is most disadvantaged. This report also uses
quintiles, to make the charts more accessible. In this case, a ‘5’ means the suburb is in the top 20%, and a
‘1’, the bottom 20%.
It is important to note that it is postcode areas that are being ranked. The score is based on the SES (level
of advantage or disadvantage) of the people living in that area, but it is the area as a whole that gets a
score. Different postcode areas can have different sizes (the map in Figure 5.1.1 illustrates) and different
populations. The importance of this factor will be further discussed in the following section of the report,
looking at SES and RMLP students.
There are four different indexes that the ABS has designed:
1. Index of Relative Socio-economic Advantage and Disadvantage (IRSAD);
2. Index of Relative Socio-economic Disadvantage (IRSD);
3. Index of Economic Resources (IER); and
4. Index of Education and Occupation (IEO) (Australian Bureau of Statistics, 2013c).
The most comprehensive index is the Index of Relative Socio-economic Advantage and Disadvantage
(IRSAD), which is the index used for this project. It takes into account variables that indicate advantage
and variables that indicate disadvantage. The ABS advises that this index is the most appropriate index
for users who want to compare the entire range of areas, as in this project, rather than focussing only on
disadvantaged areas (Australian Bureau of Statistics, 2013d).
Below is a map of Australia that identifies the IRSAD for each postcode area (Figure 5.1.1). This map was
produced using Google Earth, which allows for integration with files from the ABS (Australian Bureau
of Statistics, 2013e). This map shows a number of very large postcode areas, most of which are very
disadvantaged (coloured red or orange). These postcode areas are very large, because very few people live
in them. This map does not show RMLP data, but is included here to provide understanding of postcode
areas and the indexes, and the process of analysis.
Similar maps were produced during the process of analysing the data, which zoomed into specific areas.
These maps were compared with maps showing the location of students (see section 4.12)15.
15. These maps were displayed during the data-analysis workshop, and can be readily reproduced, using the directions on the ABS website (Australian Bureau of Statistics, 2013e).
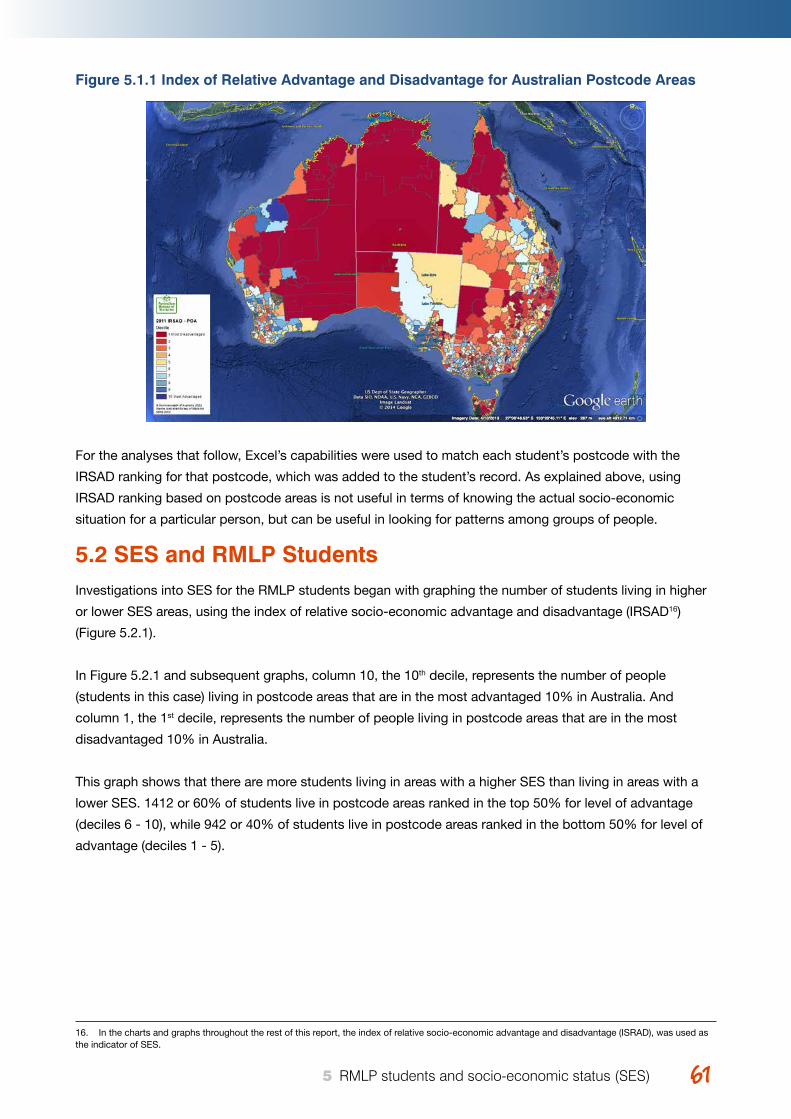
Young Australians, illness and education April 2015 6161 5 RMLP students and socio-economic status (SES)
Figure 5.1.1 Index of Relative Advantage and Disadvantage for Australian Postcode Areas
For the analyses that follow, Excel’s capabilities were used to match each student’s postcode with the
IRSAD ranking for that postcode, which was added to the student’s record. As explained above, using
IRSAD ranking based on postcode areas is not useful in terms of knowing the actual socio-economic
situation for a particular person, but can be useful in looking for patterns among groups of people.
5.2 SES and RMLP StudentsInvestigations into SES for the RMLP students began with graphing the number of students living in higher
or lower SES areas, using the index of relative socio-economic advantage and disadvantage (IRSAD16)
(Figure 5.2.1).
In Figure 5.2.1 and subsequent graphs, column 10, the 10th decile, represents the number of people
(students in this case) living in postcode areas that are in the most advantaged 10% in Australia. And
column 1, the 1st decile, represents the number of people living in postcode areas that are in the most
disadvantaged 10% in Australia.
This graph shows that there are more students living in areas with a higher SES than living in areas with a
lower SES. 1412 or 60% of students live in postcode areas ranked in the top 50% for level of advantage
(deciles 6 - 10), while 942 or 40% of students live in postcode areas ranked in the bottom 50% for level of
advantage (deciles 1 - 5).
16. In the charts and graphs throughout the rest of this report, the index of relative socio-economic advantage and disadvantage (ISRAD), was used as the indicator of SES.
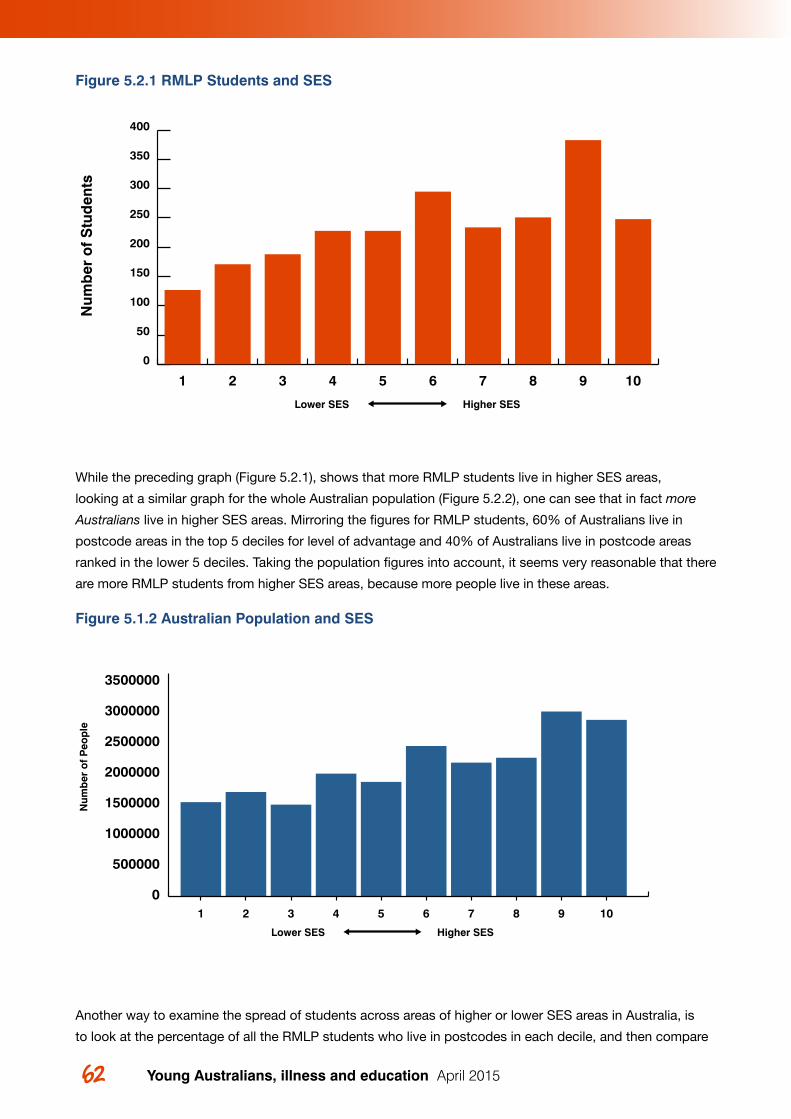
Young Australians, illness and education April 201562 63 5 RMLP students and socio-economic status (SES)
Figure 5.2.1 RMLP Students and SES
While the preceding graph (Figure 5.2.1), shows that more RMLP students live in higher SES areas,
looking at a similar graph for the whole Australian population (Figure 5.2.2), one can see that in fact more
Australians live in higher SES areas. Mirroring the figures for RMLP students, 60% of Australians live in
postcode areas in the top 5 deciles for level of advantage and 40% of Australians live in postcode areas
ranked in the lower 5 deciles. Taking the population figures into account, it seems very reasonable that there
are more RMLP students from higher SES areas, because more people live in these areas.
Figure 5.1.2 Australian Population and SES
Another way to examine the spread of students across areas of higher or lower SES areas in Australia, is
to look at the percentage of all the RMLP students who live in postcodes in each decile, and then compare
Figure 31
Num
ber
of
Stu
den
ts
Lower SES Higher SES
1 2 3 4 5 6 7 8 9 10
0
50
100
150
200
250
300
350
400
Num
ber
of
Peo
ple
Lower SES Higher SES
01 2 3 4 5 6 7 8 9 10
500000
1000000
1500000
2000000
2500000
3000000
3500000
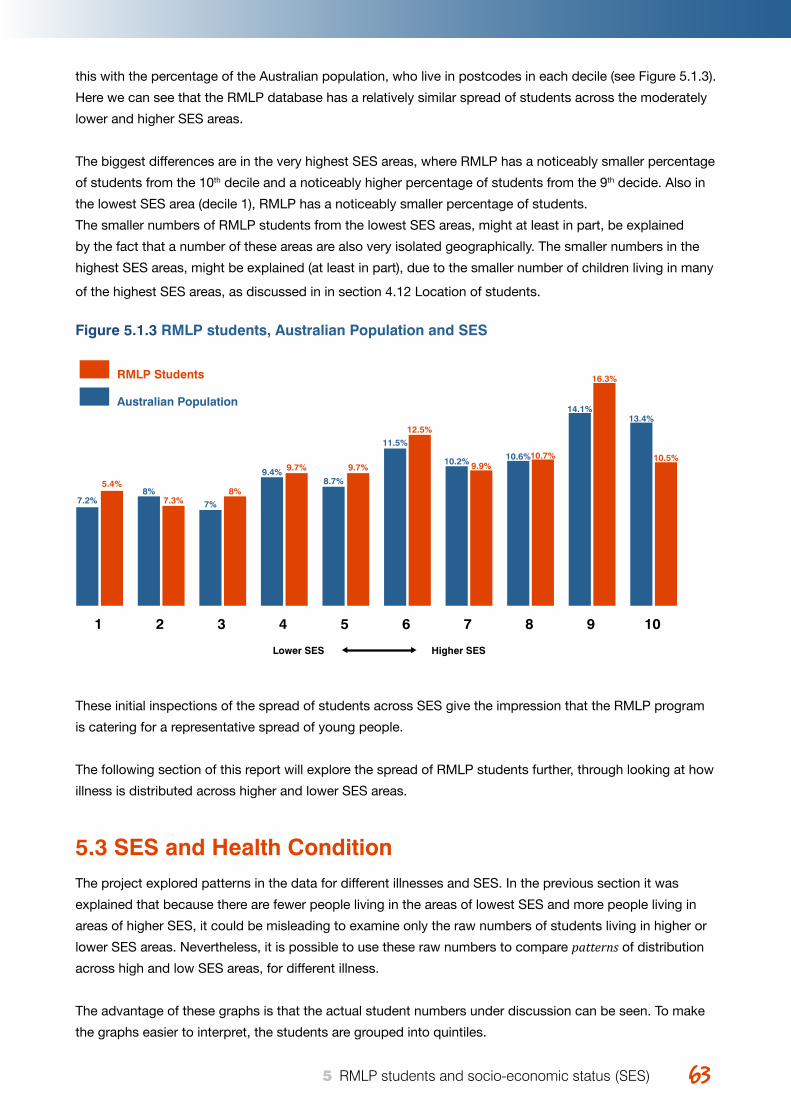
Young Australians, illness and education April 2015 6363 5 RMLP students and socio-economic status (SES)
this with the percentage of the Australian population, who live in postcodes in each decile (see Figure 5.1.3).
Here we can see that the RMLP database has a relatively similar spread of students across the moderately
lower and higher SES areas.
The biggest differences are in the very highest SES areas, where RMLP has a noticeably smaller percentage
of students from the 10th decile and a noticeably higher percentage of students from the 9th decide. Also in
the lowest SES area (decile 1), RMLP has a noticeably smaller percentage of students.
The smaller numbers of RMLP students from the lowest SES areas, might at least in part, be explained
by the fact that a number of these areas are also very isolated geographically. The smaller numbers in the
highest SES areas, might be explained (at least in part), due to the smaller number of children living in many
of the highest SES areas, as discussed in in section 4.12 Location of students.
Figure 5.1.3 RMLP students, Australian Population and SES
These initial inspections of the spread of students across SES give the impression that the RMLP program
is catering for a representative spread of young people.
The following section of this report will explore the spread of RMLP students further, through looking at how
illness is distributed across higher and lower SES areas.
5.3 SES and Health ConditionThe project explored patterns in the data for different illnesses and SES. In the previous section it was
explained that because there are fewer people living in the areas of lowest SES and more people living in
areas of higher SES, it could be misleading to examine only the raw numbers of students living in higher or
lower SES areas. Nevertheless, it is possible to use these raw numbers to compare patterns of distribution
across high and low SES areas, for different illness.
The advantage of these graphs is that the actual student numbers under discussion can be seen. To make
the graphs easier to interpret, the students are grouped into quintiles.
1
7.2%
5.4%8%
7.3% 7%8%
9.4% 9.7%
8.7%
9.7%
11.5%
12.5%
10.2% 9.9%10.6%10.7%
14.1%
16.3%
13.4%
10.5%
2 3 4 5 6 7 8 9 10
Lower SES Higher SES
RMLP Students
Australian Population
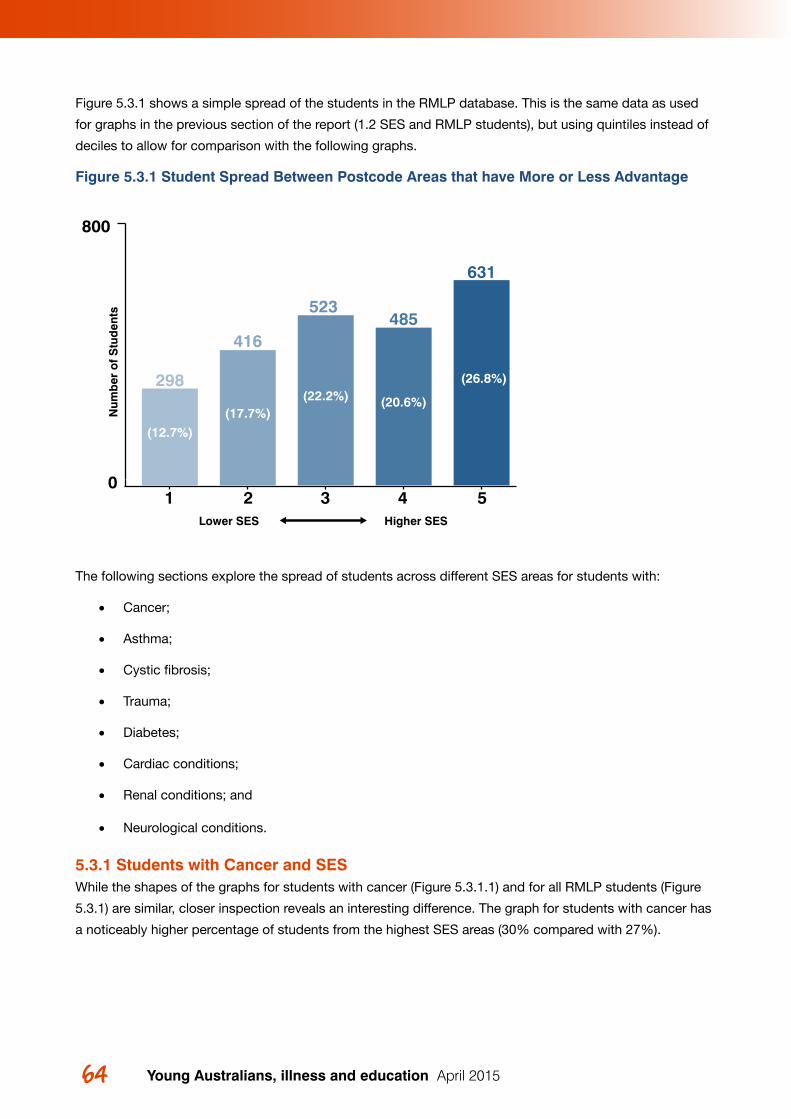
Young Australians, illness and education April 201564 65 5 RMLP students and socio-economic status (SES)
Figure 5.3.1 shows a simple spread of the students in the RMLP database. This is the same data as used
for graphs in the previous section of the report (1.2 SES and RMLP students), but using quintiles instead of
deciles to allow for comparison with the following graphs.
Figure 5.3.1 Student Spread Between Postcode Areas that have More or Less Advantage
The following sections explore the spread of students across different SES areas for students with:
• Cancer;
• Asthma;
• Cystic fibrosis;
• Trauma;
• Diabetes;
• Cardiac conditions;
• Renal conditions; and
• Neurological conditions.
5.3.1 Students with Cancer and SESWhile the shapes of the graphs for students with cancer (Figure 5.3.1.1) and for all RMLP students (Figure
5.3.1) are similar, closer inspection reveals an interesting difference. The graph for students with cancer has
a noticeably higher percentage of students from the highest SES areas (30% compared with 27%).
Num
ber
of
Stu
den
ts
Lower SES Higher SES
0
800
298
523485
631
416
1 2 3 4 5
(12.7%)(17.7%)
(22.2%) (20.6%)
(26.8%)
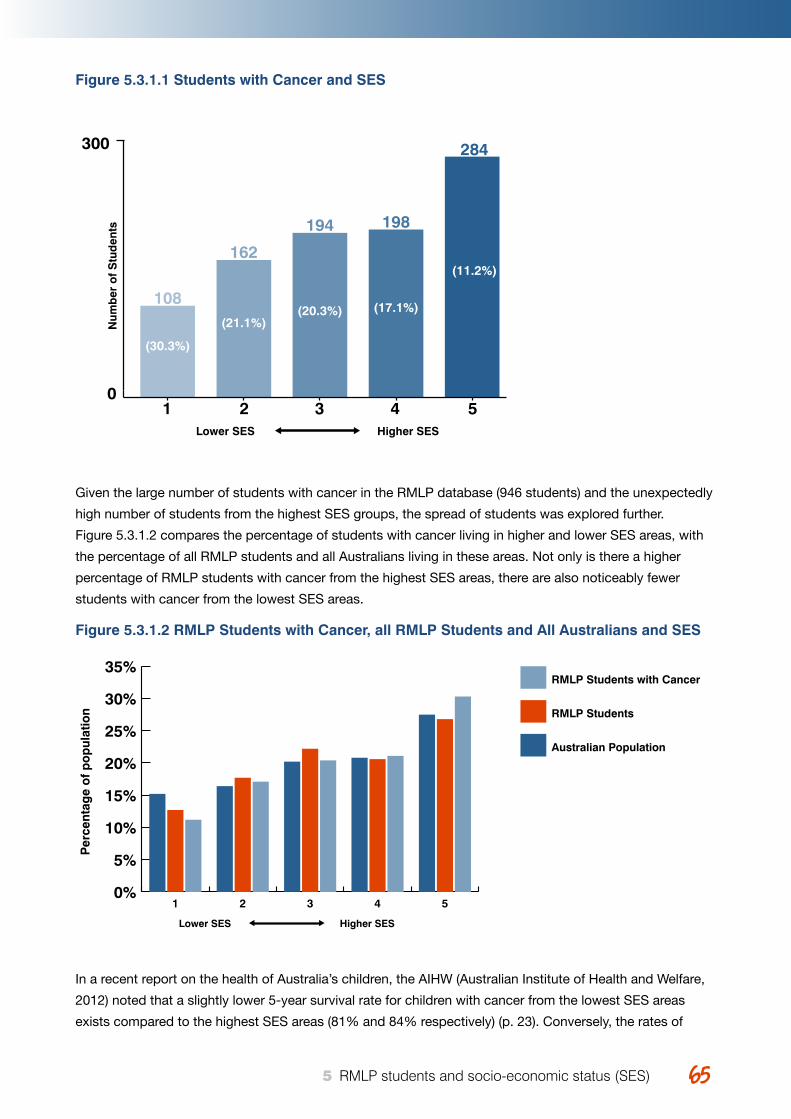
Young Australians, illness and education April 2015 6565 5 RMLP students and socio-economic status (SES)
Figure 5.3.1.1 Students with Cancer and SES
Given the large number of students with cancer in the RMLP database (946 students) and the unexpectedly
high number of students from the highest SES groups, the spread of students was explored further.
Figure 5.3.1.2 compares the percentage of students with cancer living in higher and lower SES areas, with
the percentage of all RMLP students and all Australians living in these areas. Not only is there a higher
percentage of RMLP students with cancer from the highest SES areas, there are also noticeably fewer
students with cancer from the lowest SES areas.
Figure 5.3.1.2 RMLP Students with Cancer, all RMLP Students and All Australians and SES
In a recent report on the health of Australia’s children, the AIHW (Australian Institute of Health and Welfare,
2012) noted that a slightly lower 5-year survival rate for children with cancer from the lowest SES areas
exists compared to the highest SES areas (81% and 84% respectively) (p. 23). Conversely, the rates of
Num
ber
of
Stu
den
ts
Lower SES Higher SES
0
300
108
194 198
284
162
1 2 3 4 5
(30.3%)
(21.1%)(20.3%) (17.1%)
(11.2%)
Per
cent
age
of
po
pul
atio
n
Lower SES Higher SES
0%
5%
10%
15%
20%
25%
30%
35%RMLP Students with Cancer
RMLP Students
Australian Population
54321
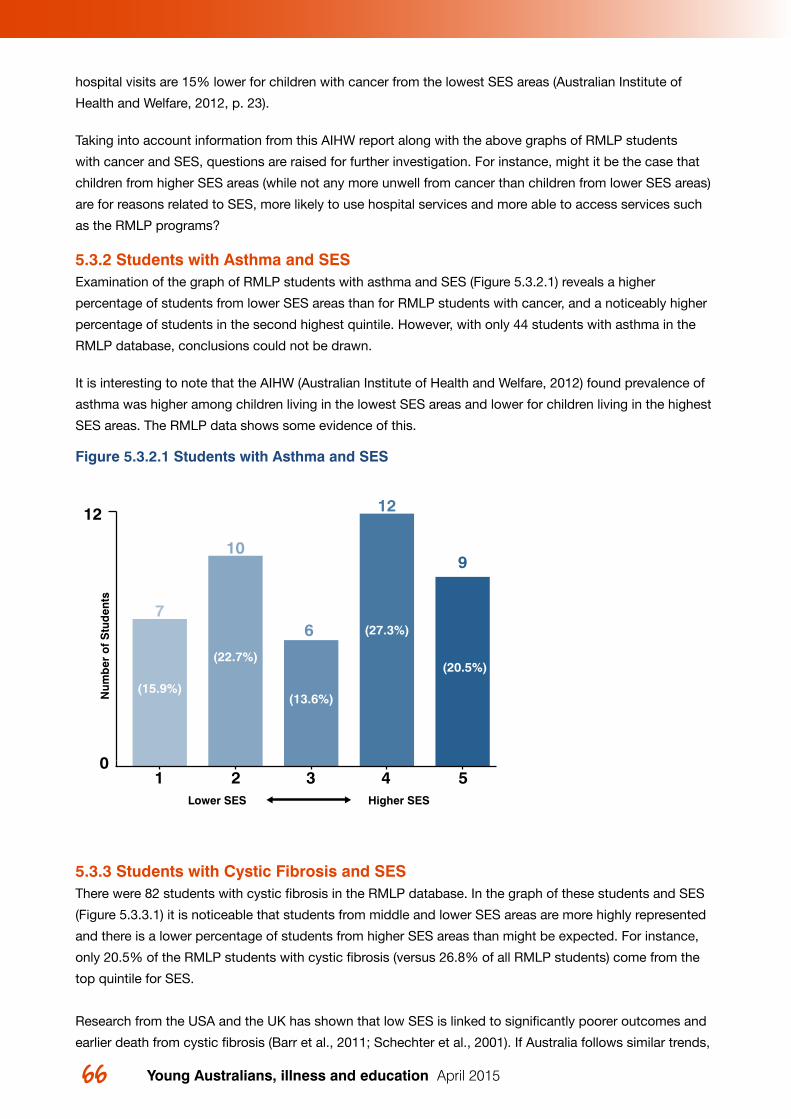
Young Australians, illness and education April 201566 67 5 RMLP students and socio-economic status (SES)
hospital visits are 15% lower for children with cancer from the lowest SES areas (Australian Institute of
Health and Welfare, 2012, p. 23).
Taking into account information from this AIHW report along with the above graphs of RMLP students
with cancer and SES, questions are raised for further investigation. For instance, might it be the case that
children from higher SES areas (while not any more unwell from cancer than children from lower SES areas)
are for reasons related to SES, more likely to use hospital services and more able to access services such
as the RMLP programs?
5.3.2 Students with Asthma and SES Examination of the graph of RMLP students with asthma and SES (Figure 5.3.2.1) reveals a higher
percentage of students from lower SES areas than for RMLP students with cancer, and a noticeably higher
percentage of students in the second highest quintile. However, with only 44 students with asthma in the
RMLP database, conclusions could not be drawn.
It is interesting to note that the AIHW (Australian Institute of Health and Welfare, 2012) found prevalence of
asthma was higher among children living in the lowest SES areas and lower for children living in the highest
SES areas. The RMLP data shows some evidence of this.
Figure 5.3.2.1 Students with Asthma and SES
5.3.3 Students with Cystic Fibrosis and SES There were 82 students with cystic fibrosis in the RMLP database. In the graph of these students and SES
(Figure 5.3.3.1) it is noticeable that students from middle and lower SES areas are more highly represented
and there is a lower percentage of students from higher SES areas than might be expected. For instance,
only 20.5% of the RMLP students with cystic fibrosis (versus 26.8% of all RMLP students) come from the
top quintile for SES.
Research from the USA and the UK has shown that low SES is linked to significantly poorer outcomes and
earlier death from cystic fibrosis (Barr et al., 2011; Schechter et al., 2001). If Australia follows similar trends,
Figure 38
Num
ber
of
Stu
den
ts
Lower SES Higher SES
0
12
76
12
910
1 2 3 4 5
(13.6%)
(22.7%)
(15.9%)
(27.3%)
(20.5%)
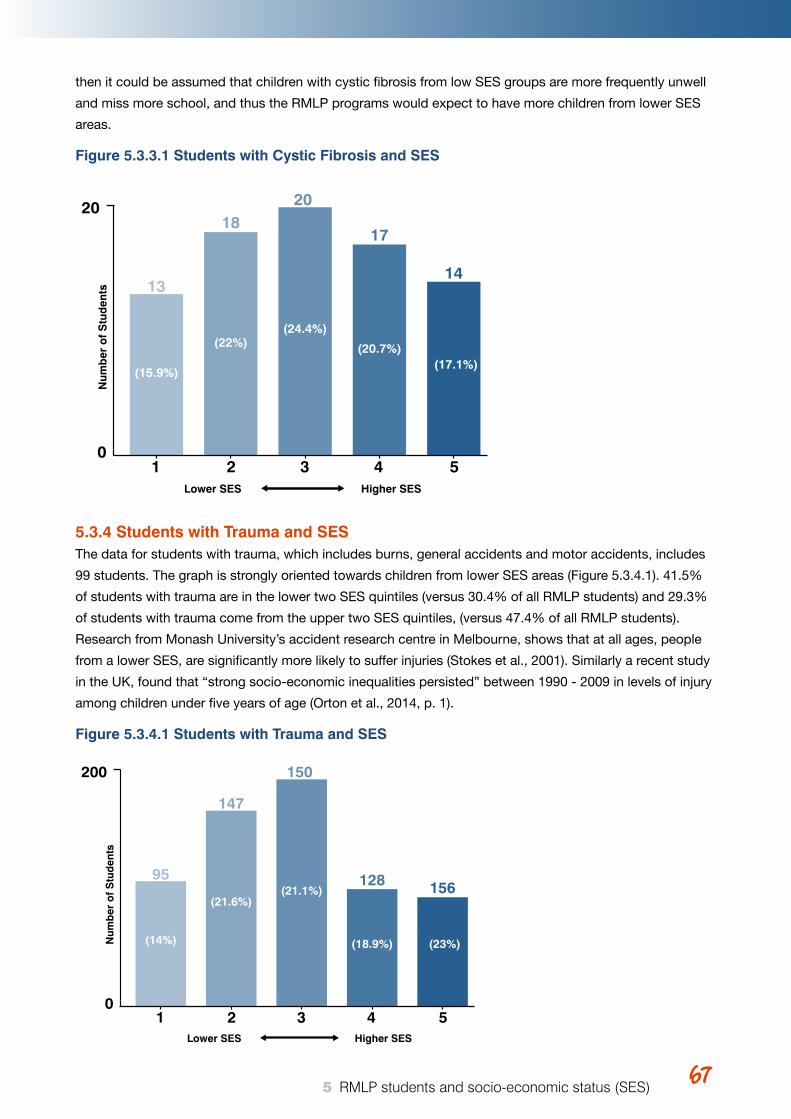
Young Australians, illness and education April 2015 6767 5 RMLP students and socio-economic status (SES)
then it could be assumed that children with cystic fibrosis from low SES groups are more frequently unwell
and miss more school, and thus the RMLP programs would expect to have more children from lower SES
areas.
Figure 5.3.3.1 Students with Cystic Fibrosis and SES
5.3.4 Students with Trauma and SES The data for students with trauma, which includes burns, general accidents and motor accidents, includes
99 students. The graph is strongly oriented towards children from lower SES areas (Figure 5.3.4.1). 41.5%
of students with trauma are in the lower two SES quintiles (versus 30.4% of all RMLP students) and 29.3%
of students with trauma come from the upper two SES quintiles, (versus 47.4% of all RMLP students).
Research from Monash University’s accident research centre in Melbourne, shows that at all ages, people
from a lower SES, are significantly more likely to suffer injuries (Stokes et al., 2001). Similarly a recent study
in the UK, found that “strong socio-economic inequalities persisted” between 1990 - 2009 in levels of injury
among children under five years of age (Orton et al., 2014, p. 1).
Figure 5.3.4.1 Students with Trauma and SES
Num
ber
of
Stu
den
ts
Lower SES Higher SES
0
20
13
20
17
14
18
1 2 3 4 5
(15.9%)
(22%)(24.4%)
(20.7%)(17.1%)
Num
ber
of
Stu
den
ts
Lower SES Higher SES
0
200
95
150
128 156
147
1 2 3 4 5
(14%)
(21.6%)(21.1%)
(18.9%) (23%)
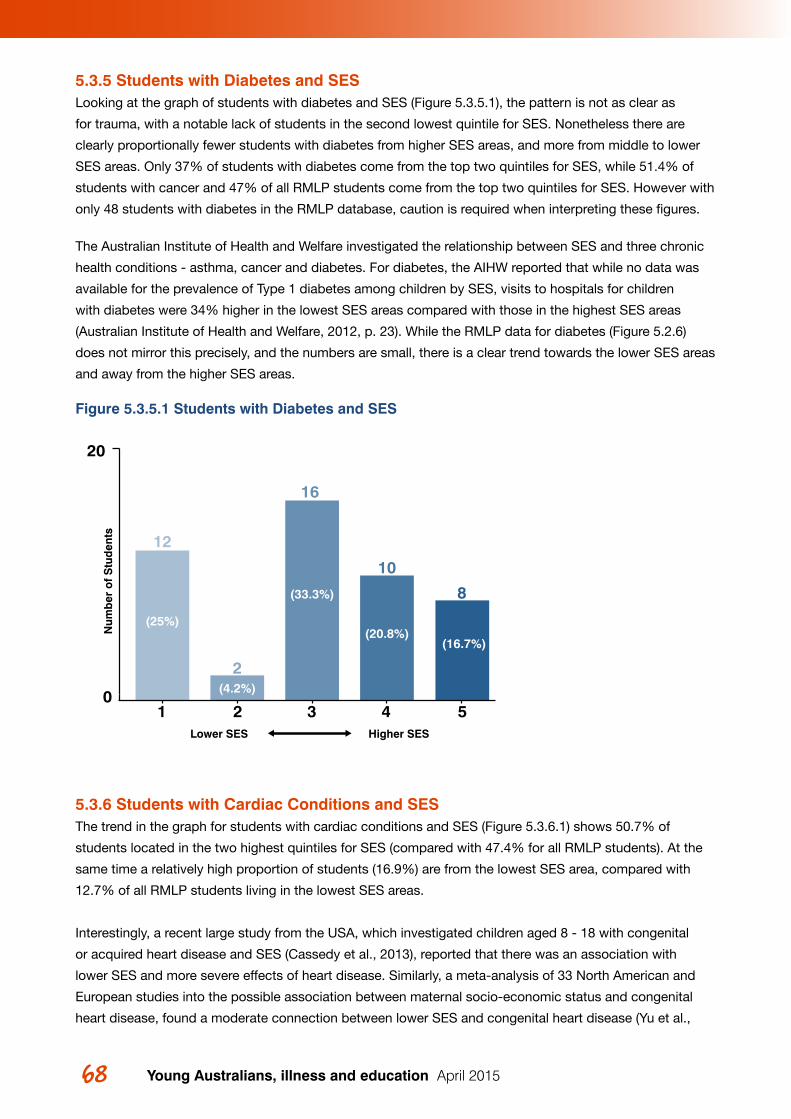
Young Australians, illness and education April 201568 69 5 RMLP students and socio-economic status (SES)
5.3.5 Students with Diabetes and SES Looking at the graph of students with diabetes and SES (Figure 5.3.5.1), the pattern is not as clear as
for trauma, with a notable lack of students in the second lowest quintile for SES. Nonetheless there are
clearly proportionally fewer students with diabetes from higher SES areas, and more from middle to lower
SES areas. Only 37% of students with diabetes come from the top two quintiles for SES, while 51.4% of
students with cancer and 47% of all RMLP students come from the top two quintiles for SES. However with
only 48 students with diabetes in the RMLP database, caution is required when interpreting these figures.
The Australian Institute of Health and Welfare investigated the relationship between SES and three chronic
health conditions - asthma, cancer and diabetes. For diabetes, the AIHW reported that while no data was
available for the prevalence of Type 1 diabetes among children by SES, visits to hospitals for children
with diabetes were 34% higher in the lowest SES areas compared with those in the highest SES areas
(Australian Institute of Health and Welfare, 2012, p. 23). While the RMLP data for diabetes (Figure 5.2.6)
does not mirror this precisely, and the numbers are small, there is a clear trend towards the lower SES areas
and away from the higher SES areas.
Figure 5.3.5.1 Students with Diabetes and SES
5.3.6 Students with Cardiac Conditions and SES The trend in the graph for students with cardiac conditions and SES (Figure 5.3.6.1) shows 50.7% of
students located in the two highest quintiles for SES (compared with 47.4% for all RMLP students). At the
same time a relatively high proportion of students (16.9%) are from the lowest SES area, compared with
12.7% of all RMLP students living in the lowest SES areas.
Interestingly, a recent large study from the USA, which investigated children aged 8 - 18 with congenital
or acquired heart disease and SES (Cassedy et al., 2013), reported that there was an association with
lower SES and more severe effects of heart disease. Similarly, a meta-analysis of 33 North American and
European studies into the possible association between maternal socio-economic status and congenital
heart disease, found a moderate connection between lower SES and congenital heart disease (Yu et al.,
Figure 40
Num
ber
of
Stu
den
ts
Lower SES Higher SES
0
20
12
16
10
8
2
1 2 3 4 5
(25%)
(4.2%)
(33.3%)
(20.8%)(16.7%)
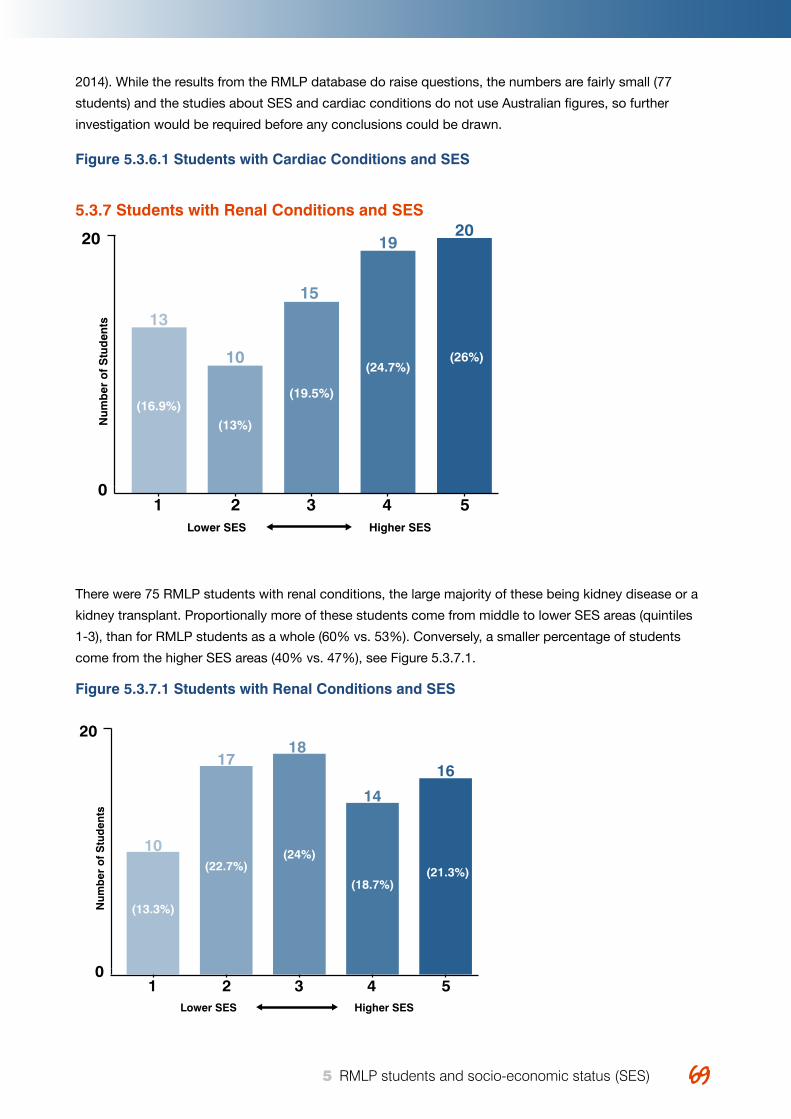
Young Australians, illness and education April 2015 6969 5 RMLP students and socio-economic status (SES)
2014). While the results from the RMLP database do raise questions, the numbers are fairly small (77
students) and the studies about SES and cardiac conditions do not use Australian figures, so further
investigation would be required before any conclusions could be drawn.
Figure 5.3.6.1 Students with Cardiac Conditions and SES
5.3.7 Students with Renal Conditions and SES
There were 75 RMLP students with renal conditions, the large majority of these being kidney disease or a
kidney transplant. Proportionally more of these students come from middle to lower SES areas (quintiles
1-3), than for RMLP students as a whole (60% vs. 53%). Conversely, a smaller percentage of students
come from the higher SES areas (40% vs. 47%), see Figure 5.3.7.1.
Figure 5.3.7.1 Students with Renal Conditions and SES
Figure 43
Num
ber
of
Stu
den
ts
Lower SES Higher SES
0
20
10
18
14
1617
1 2 3 4 5
(13.3%)
(22.7%)(24%)
(18.7%)(21.3%)
Num
ber
of
Stu
den
ts
Lower SES Higher SES
0
20
13
15
1920
10
1 2 3 4 5
(16.9%)
(13%)
(19.5%)
(24.7%)(26%)
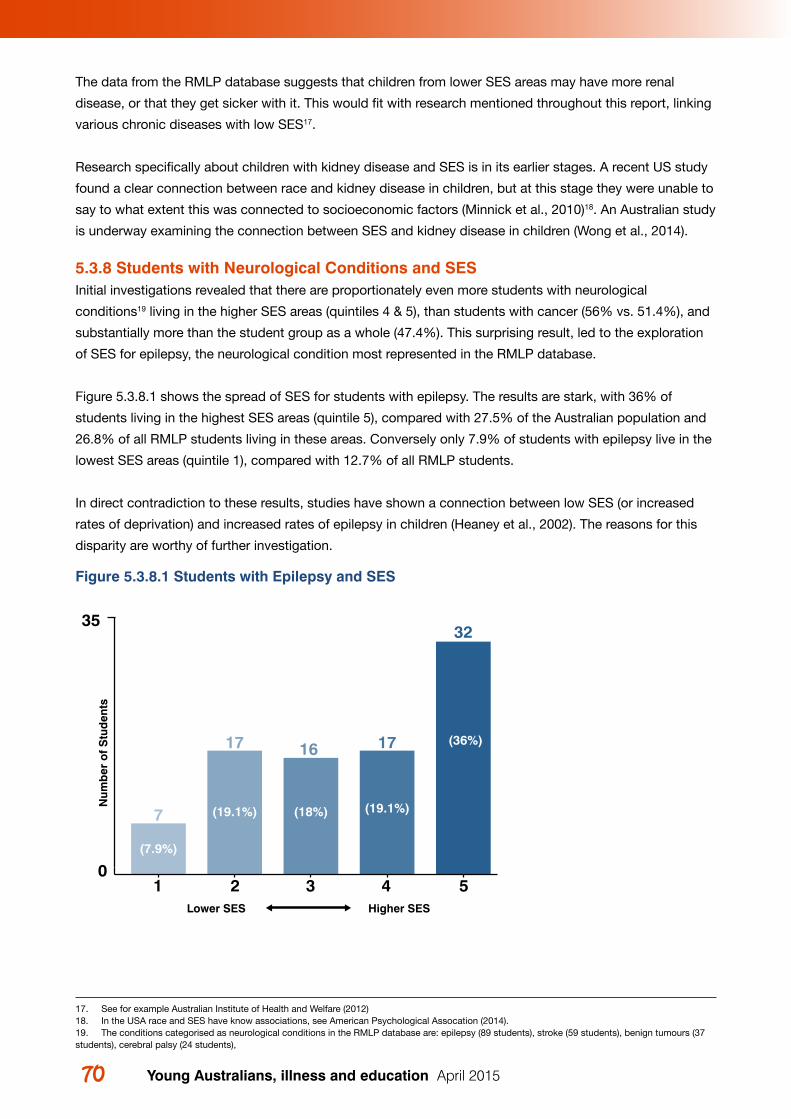
Young Australians, illness and education April 201570 71 5 RMLP students and socio-economic status (SES)
The data from the RMLP database suggests that children from lower SES areas may have more renal
disease, or that they get sicker with it. This would fit with research mentioned throughout this report, linking
various chronic diseases with low SES17.
Research specifically about children with kidney disease and SES is in its earlier stages. A recent US study
found a clear connection between race and kidney disease in children, but at this stage they were unable to
say to what extent this was connected to socioeconomic factors (Minnick et al., 2010)18. An Australian study
is underway examining the connection between SES and kidney disease in children (Wong et al., 2014).
5.3.8 Students with Neurological Conditions and SES Initial investigations revealed that there are proportionately even more students with neurological
conditions19 living in the higher SES areas (quintiles 4 & 5), than students with cancer (56% vs. 51.4%), and
substantially more than the student group as a whole (47.4%). This surprising result, led to the exploration
of SES for epilepsy, the neurological condition most represented in the RMLP database.
Figure 5.3.8.1 shows the spread of SES for students with epilepsy. The results are stark, with 36% of
students living in the highest SES areas (quintile 5), compared with 27.5% of the Australian population and
26.8% of all RMLP students living in these areas. Conversely only 7.9% of students with epilepsy live in the
lowest SES areas (quintile 1), compared with 12.7% of all RMLP students.
In direct contradiction to these results, studies have shown a connection between low SES (or increased
rates of deprivation) and increased rates of epilepsy in children (Heaney et al., 2002). The reasons for this
disparity are worthy of further investigation.
Figure 5.3.8.1 Students with Epilepsy and SES
Num
ber
of
Stu
den
ts
Lower SES Higher SES
0
35
7
16 17
32
17
1 2 3 4 5
(7.9%)
(19.1%) (18%) (19.1%)
(36%)
17. See for example Australian Institute of Health and Welfare (2012)18. In the USA race and SES have know associations, see American Psychological Assocation (2014).19. The conditions categorised as neurological conditions in the RMLP database are: epilepsy (89 students), stroke (59 students), benign tumours (37 students), cerebral palsy (24 students),
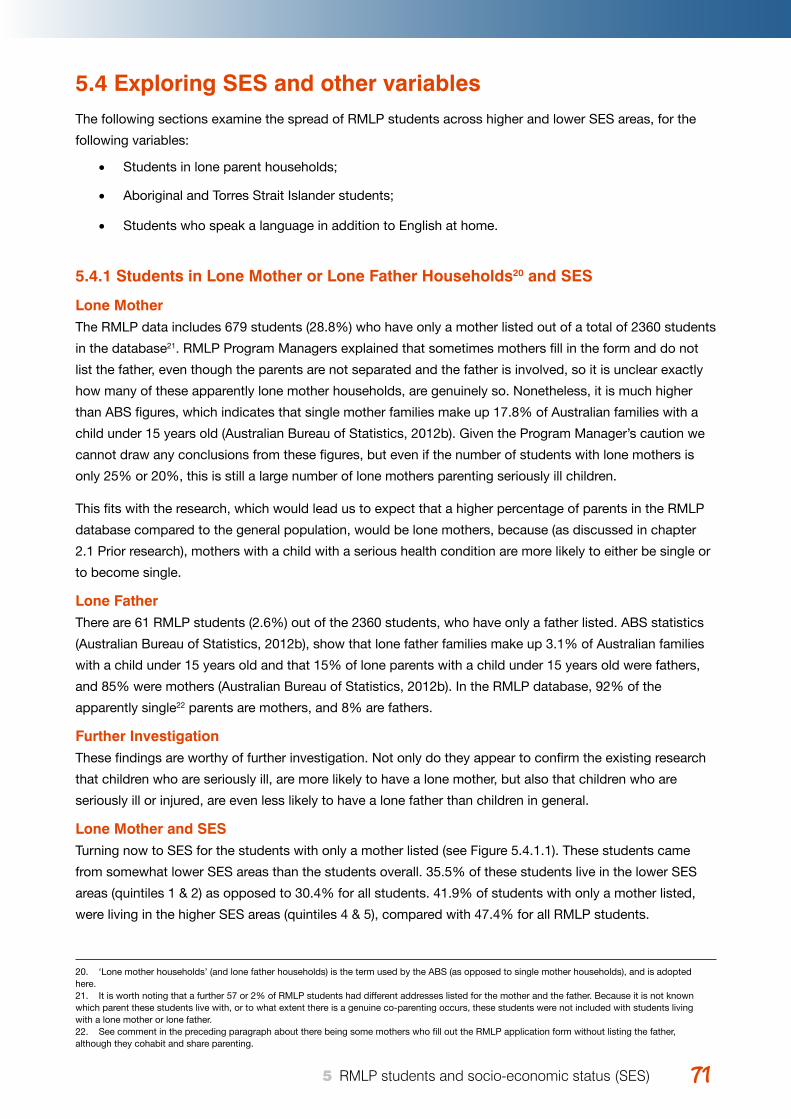
Young Australians, illness and education April 2015 7171 5 RMLP students and socio-economic status (SES)
5.4 Exploring SES and other variablesThe following sections examine the spread of RMLP students across higher and lower SES areas, for the
following variables:
• Students in lone parent households;
• Aboriginal and Torres Strait Islander students;
• Students who speak a language in addition to English at home.
5.4.1 Students in Lone Mother or Lone Father Households20 and SES
Lone MotherThe RMLP data includes 679 students (28.8%) who have only a mother listed out of a total of 2360 students
in the database21. RMLP Program Managers explained that sometimes mothers fill in the form and do not
list the father, even though the parents are not separated and the father is involved, so it is unclear exactly
how many of these apparently lone mother households, are genuinely so. Nonetheless, it is much higher
than ABS figures, which indicates that single mother families make up 17.8% of Australian families with a
child under 15 years old (Australian Bureau of Statistics, 2012b). Given the Program Manager’s caution we
cannot draw any conclusions from these figures, but even if the number of students with lone mothers is
only 25% or 20%, this is still a large number of lone mothers parenting seriously ill children.
This fits with the research, which would lead us to expect that a higher percentage of parents in the RMLP
database compared to the general population, would be lone mothers, because (as discussed in chapter
2.1 Prior research), mothers with a child with a serious health condition are more likely to either be single or
to become single.
Lone FatherThere are 61 RMLP students (2.6%) out of the 2360 students, who have only a father listed. ABS statistics
(Australian Bureau of Statistics, 2012b), show that lone father families make up 3.1% of Australian families
with a child under 15 years old and that 15% of lone parents with a child under 15 years old were fathers,
and 85% were mothers (Australian Bureau of Statistics, 2012b). In the RMLP database, 92% of the
apparently single22 parents are mothers, and 8% are fathers.
Further InvestigationThese findings are worthy of further investigation. Not only do they appear to confirm the existing research
that children who are seriously ill, are more likely to have a lone mother, but also that children who are
seriously ill or injured, are even less likely to have a lone father than children in general.
Lone Mother and SES Turning now to SES for the students with only a mother listed (see Figure 5.4.1.1). These students came
from somewhat lower SES areas than the students overall. 35.5% of these students live in the lower SES
areas (quintiles 1 & 2) as opposed to 30.4% for all students. 41.9% of students with only a mother listed,
were living in the higher SES areas (quintiles 4 & 5), compared with 47.4% for all RMLP students.
20. ‘Lone mother households’ (and lone father households) is the term used by the ABS (as opposed to single mother households), and is adopted here. 21. It is worth noting that a further 57 or 2% of RMLP students had different addresses listed for the mother and the father. Because it is not known which parent these students live with, or to what extent there is a genuine co-parenting occurs, these students were not included with students living with a lone mother or lone father.22. See comment in the preceding paragraph about there being some mothers who fill out the RMLP application form without listing the father, although they cohabit and share parenting.
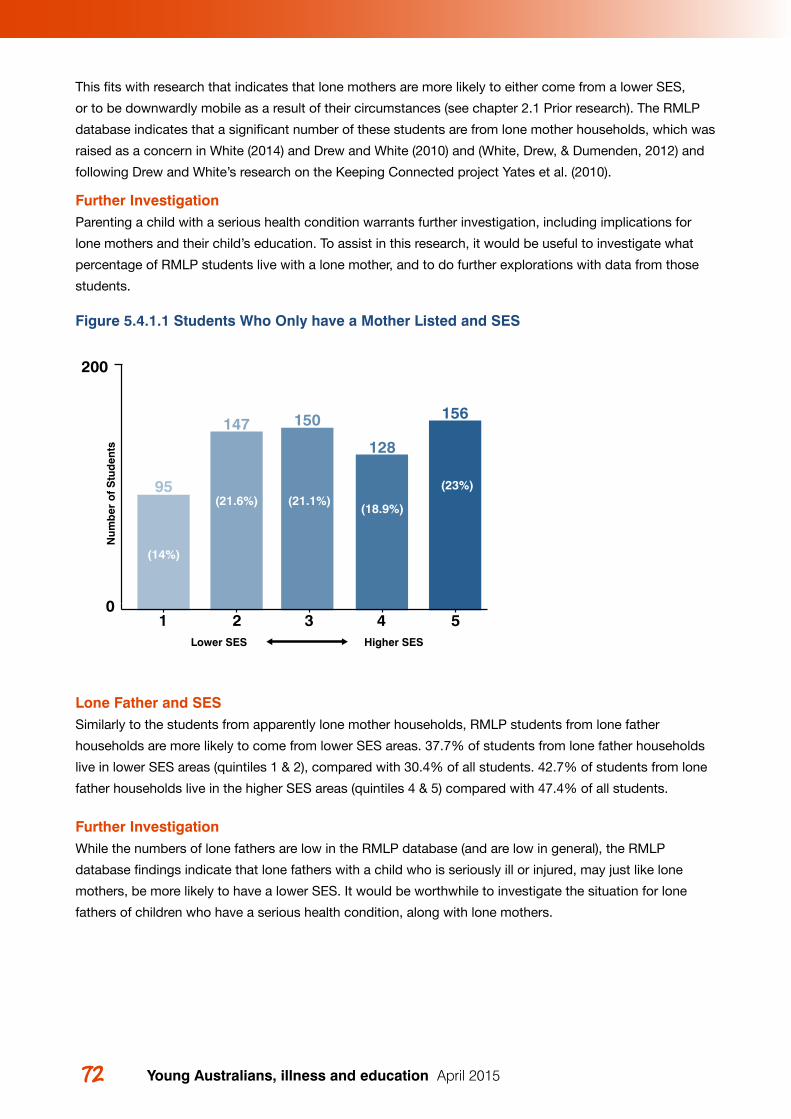
Young Australians, illness and education April 201572 73 5 RMLP students and socio-economic status (SES)
This fits with research that indicates that lone mothers are more likely to either come from a lower SES,
or to be downwardly mobile as a result of their circumstances (see chapter 2.1 Prior research). The RMLP
database indicates that a significant number of these students are from lone mother households, which was
raised as a concern in White (2014) and Drew and White (2010) and (White, Drew, & Dumenden, 2012) and
following Drew and White’s research on the Keeping Connected project Yates et al. (2010).
Further InvestigationParenting a child with a serious health condition warrants further investigation, including implications for
lone mothers and their child’s education. To assist in this research, it would be useful to investigate what
percentage of RMLP students live with a lone mother, and to do further explorations with data from those
students.
Figure 5.4.1.1 Students Who Only have a Mother Listed and SES
Lone Father and SES Similarly to the students from apparently lone mother households, RMLP students from lone father
households are more likely to come from lower SES areas. 37.7% of students from lone father households
live in lower SES areas (quintiles 1 & 2), compared with 30.4% of all students. 42.7% of students from lone
father households live in the higher SES areas (quintiles 4 & 5) compared with 47.4% of all students.
Further InvestigationWhile the numbers of lone fathers are low in the RMLP database (and are low in general), the RMLP
database findings indicate that lone fathers with a child who is seriously ill or injured, may just like lone
mothers, be more likely to have a lower SES. It would be worthwhile to investigate the situation for lone
fathers of children who have a serious health condition, along with lone mothers.
Num
ber
of
Stu
den
ts
Lower SES Higher SES
0
200
95
150
128
156147
1 2 3 4 5
(14%)
(21.6%) (21.1%)(18.9%)
(23%)
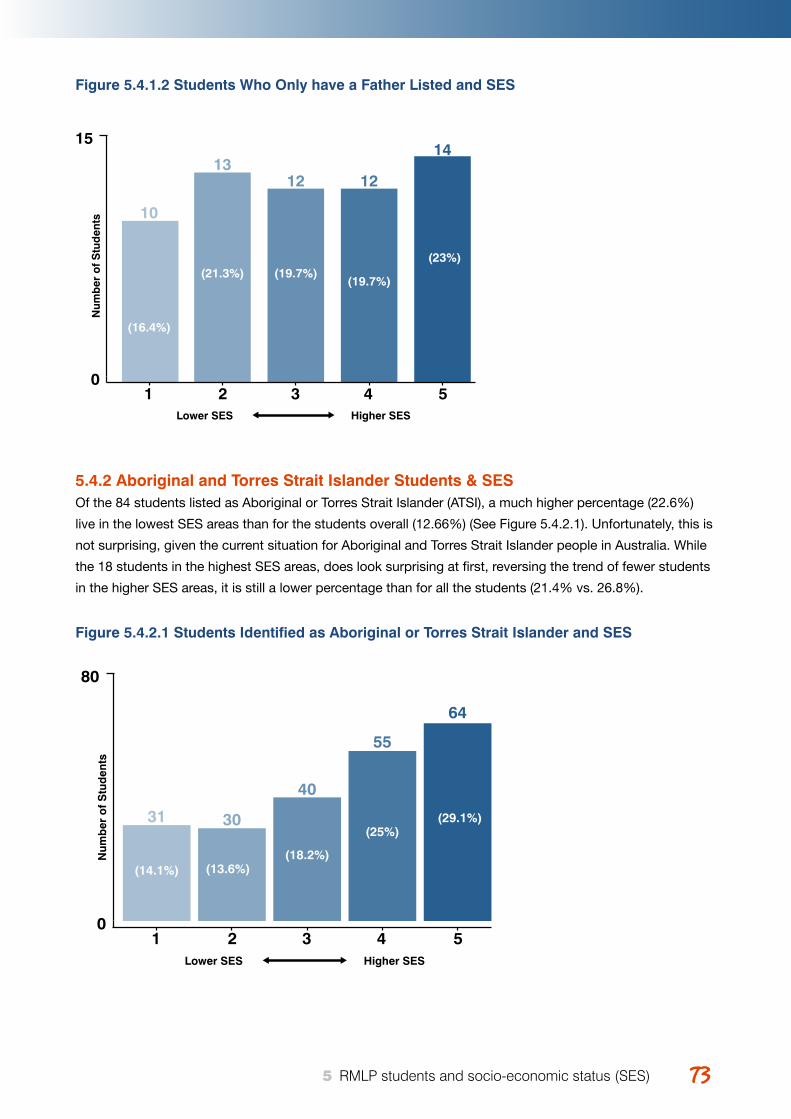
Young Australians, illness and education April 2015 7373 5 RMLP students and socio-economic status (SES)
Figure 5.4.1.2 Students Who Only have a Father Listed and SES
5.4.2 Aboriginal and Torres Strait Islander Students & SESOf the 84 students listed as Aboriginal or Torres Strait Islander (ATSI), a much higher percentage (22.6%)
live in the lowest SES areas than for the students overall (12.66%) (See Figure 5.4.2.1). Unfortunately, this is
not surprising, given the current situation for Aboriginal and Torres Strait Islander people in Australia. While
the 18 students in the highest SES areas, does look surprising at first, reversing the trend of fewer students
in the higher SES areas, it is still a lower percentage than for all the students (21.4% vs. 26.8%).
Figure 5.4.2.1 Students Identified as Aboriginal or Torres Strait Islander and SES
Figure 45N
umb
er o
f S
tud
ents
Lower SES Higher SES
0
15
10
12 12
1413
1 2 3 4 5
(16.4%)
(21.3%) (19.7%)(19.7%)
(23%)
Figure 47
Num
ber
of
Stu
den
ts
Lower SES Higher SES
0
80
31
40
55
64
30
1 2 3 4 5
(14.1%) (13.6%)(18.2%)
(25%)(29.1%)
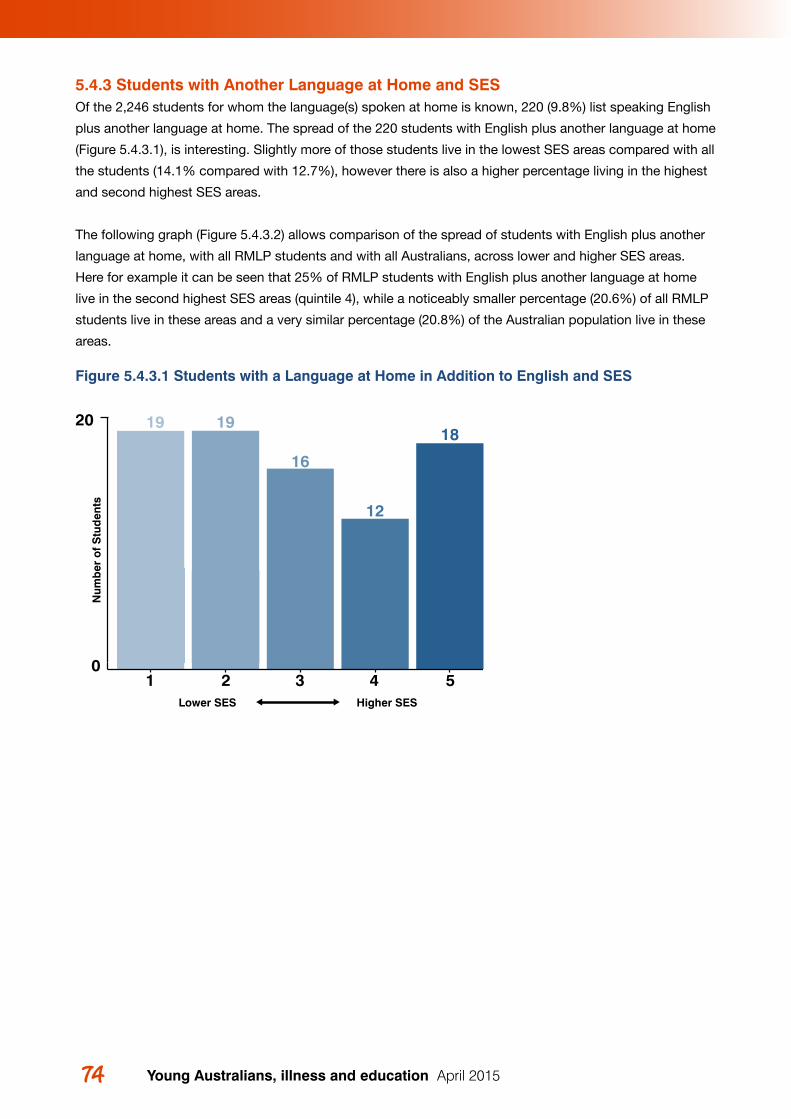
Young Australians, illness and education April 201574 75 5 RMLP students and socio-economic status (SES)
5.4.3 Students with Another Language at Home and SESOf the 2,246 students for whom the language(s) spoken at home is known, 220 (9.8%) list speaking English
plus another language at home. The spread of the 220 students with English plus another language at home
(Figure 5.4.3.1), is interesting. Slightly more of those students live in the lowest SES areas compared with all
the students (14.1% compared with 12.7%), however there is also a higher percentage living in the highest
and second highest SES areas.
The following graph (Figure 5.4.3.2) allows comparison of the spread of students with English plus another
language at home, with all RMLP students and with all Australians, across lower and higher SES areas.
Here for example it can be seen that 25% of RMLP students with English plus another language at home
live in the second highest SES areas (quintile 4), while a noticeably smaller percentage (20.6%) of all RMLP
students live in these areas and a very similar percentage (20.8%) of the Australian population live in these
areas.
Figure 5.4.3.1 Students with a Language at Home in Addition to English and SES
Figure 46
Figure 47
Num
ber
of
Stu
den
ts
Lower SES Higher SES
0
20 19
16
12
1819
1 2 3 4 5
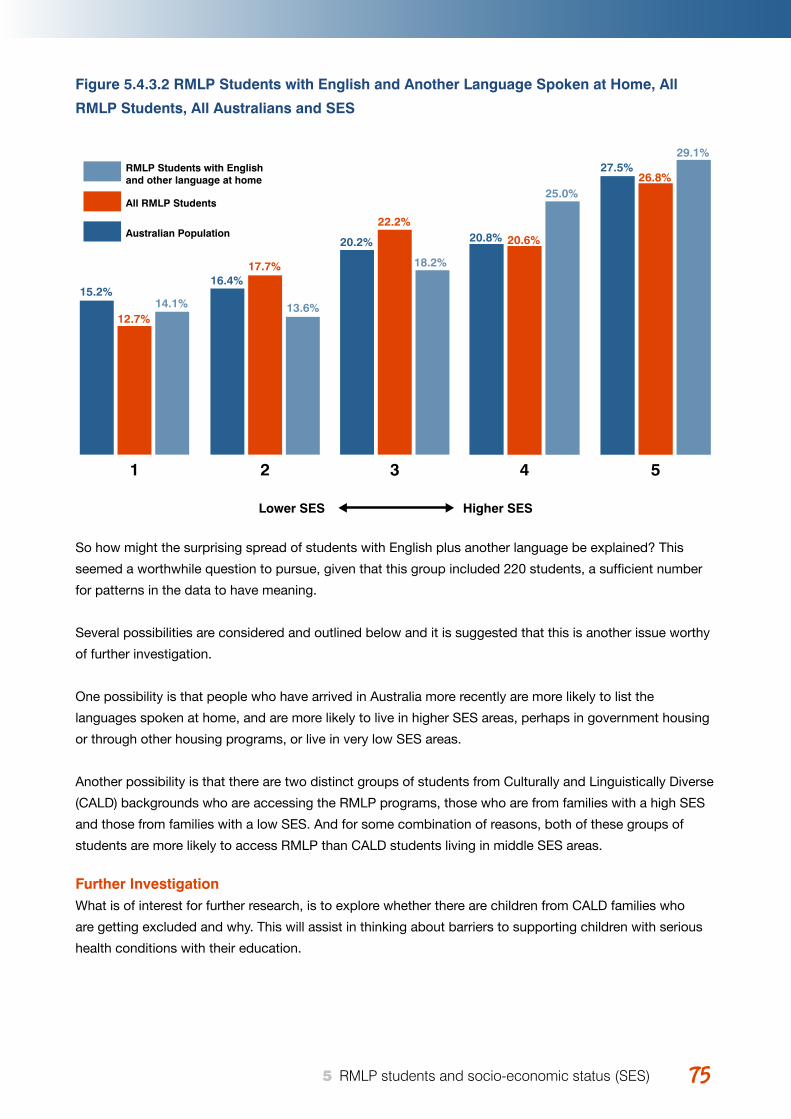
Young Australians, illness and education April 2015 7575 5 RMLP students and socio-economic status (SES)
Figure 5.4.3.2 RMLP Students with English and Another Language Spoken at Home, All
RMLP Students, All Australians and SES
So how might the surprising spread of students with English plus another language be explained? This
seemed a worthwhile question to pursue, given that this group included 220 students, a sufficient number
for patterns in the data to have meaning.
Several possibilities are considered and outlined below and it is suggested that this is another issue worthy
of further investigation.
One possibility is that people who have arrived in Australia more recently are more likely to list the
languages spoken at home, and are more likely to live in higher SES areas, perhaps in government housing
or through other housing programs, or live in very low SES areas.
Another possibility is that there are two distinct groups of students from Culturally and Linguistically Diverse
(CALD) backgrounds who are accessing the RMLP programs, those who are from families with a high SES
and those from families with a low SES. And for some combination of reasons, both of these groups of
students are more likely to access RMLP than CALD students living in middle SES areas.
Further InvestigationWhat is of interest for further research, is to explore whether there are children from CALD families who
are getting excluded and why. This will assist in thinking about barriers to supporting children with serious
health conditions with their education.
Lower SES Higher SES
15.2%
12.7%14.1%
16.4%17.7%
13.6%
20.2%
22.2%
18.2%
20.8% 20.6%
25.0%
27.5%26.8%
29.1%RMLP Students with English and other language at home
All RMLP Students
Australian Population
54321
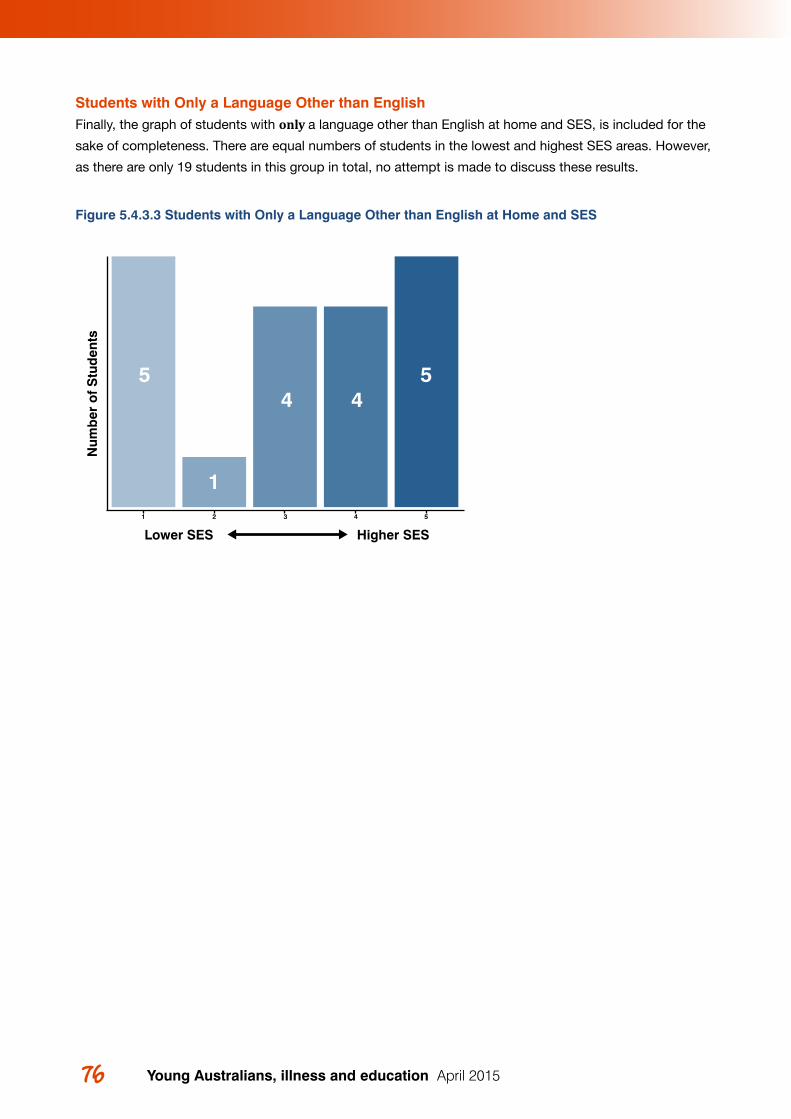
Young Australians, illness and education April 201576
Students with Only a Language Other than English Finally, the graph of students with only a language other than English at home and SES, is included for the
sake of completeness. There are equal numbers of students in the lowest and highest SES areas. However,
as there are only 19 students in this group in total, no attempt is made to discuss these results.
Figure 5.4.3.3 Students with Only a Language Other than English at Home and SES
5544
1
Num
ber
of
Stu
den
ts
1 2 3 4 5
Lower SES Higher SES
77 6 Discussion and recommendations
77Young Australians, illness and education April 2015 77 6 Discussion and recommendations
DISCUSSION AND RECOMMENDATIONS
6.1 OverviewIn this chapter the findings from this study are summarised and discussed and then recommendations are
provided for government and further research. The broad nature of the research questions ensured that the
researchers undertook this investigation in light of the Australian education context and the international
literature.
The analysis of the RMLP database was undertaken using the records of 2360 students. Analyses were
undertaken about health conditions, referral source, school absence, school sector, gender, age, languages
spoken at home and Indigenous identification. Demographic analyses were also undertaken using
Australian Bureau of Statistics (ABS) demographic indexes.
This chapter begins by noting the 12 major themes for education that emerged from the literature regarding
these students from the fields of medicine, public health, nursing, psychology, psychiatry, social policy as
well as education. This is followed by discussion and recommendations, organised around 5 key topics:
1. Counting these students
2. School absence
3. Individual illness studies
4. Support provision
5. Parents
6.2 Key Themes from the Literature All fields report concerns about the education of this cohort of young people. As biomedicine improves,
many children and young people who would have formerly died are now surviving at extraordinary rates
with most living into adulthood. The numbers of students with health conditions is growing exponentially.
This means that education for this group has a new importance, as they will need to be as independent and
socially connected as everyone else, as adults.
It also means that Australian school systems and schools need to adapt so they are more in step with
dramatic recent progress in medicine. These students need to be better accommodated in education.
This has frequently been raised in the literature from many fields, but rarely in education. As most young
people with health conditions do not spend long periods of time in hospital23, schools and school systems
need to become much more aware of their obligations to actively monitor and support students who are
(a) recuperating at home, for lengthy, frequent or intermittent periods of time, or (b) attending school while
managing challenging health conditions.
6
23. The exception to this is children and young people with cancer who are a very small proportion of the cohort under discussion here.
Young Australians, illness and education April 201578 79 6 Discussion and recommendations
Disruption of education progress as the result of ill health is complex and highly individualised, but these 12
themes emerged from the literature:
1. Effective communication between the health and education sectors is currently lacking.
2. The ways in which health conditions affect students is highly individualised. Within education, this means that consultation with individual students has particular importance.
3. Communication between staff within a school (teachers, welfare teachers, year level coordinators, psychologists, nurses) and communication with the student and parents is a significant area of concern.
4. The lack of educational policy for this cohort of students results in inequities and exclusion.
5. There is a dearth of Australian educational research about these students.
6. Connection and communication with school has particular importance for children and young people during periods of absence from school. While ICT may be used within programs for these students, it cannot replace a teacher’s attention. School level education is not about content alone; it is highly reliant on relationships, communication and connection.
7. School absences are detrimental to learning, but can easily go unnoticed. While some students have major periods of absence (e.g. a year for some with cancer), others have frequent or intermittent absences that are less visible, but are just as damaging to their learning.
8. Social goals have particular importance for adolescent students with health conditions. Not wanting to be seen as different from other students can work against educational achievement.
9. Many students attend school when not fully well which affects attention and learning (e.g. pain, depression, tiredness, lethargy).
10. Pain, fatigue and other health condition effects are invisible and teachers are often not aware of challenges faced by these students.
11. Teachers can have low expectations of students with health conditions.
12. Bullying of these students frequently occurs.
6.3 Counting These StudentsThe literature reports a range of different figures for estimating the number of children with chronic health
conditions, which are mostly derived from US studies. These figures depend on definitions used and the
type of study conducted, and range from 5% to over 30%. Recent Australian researchers from the field of
adolescent health estimate a figure of 12%.
Within the field of epidemiology, determining numbers of those with chronic illness has been identified as
a challenge. Ireys (2001) noted in his important work that conceptual boundaries are required before the
prevalence of children with chronic health conditions can be estimated, for any given population. He argues
that the ‘list-based’ or ‘conditions-specific’ approach in which categories and diagnoses are determined will
inevitably exclude many. The main difficulty with this condition-specific list approach, as he pointed out, is
that “well over 200” (p. 124) conditions need to be considered for such a list. Who makes decisions about
such a list becomes important and any set of criteria will be contested. He also observes,
Young Australians, illness and education April 2015 7979 6 Discussion and recommendations
Furthermore, some children have serious ongoing health problems long before an accurate
diagnosis is made. Should these children be excluded from services simply because they have an
obscure or unknown condition? (p. 124).
He argues that an alternative ‘non-categorical’ or ‘functional’ approach where the consequences of the
health condition, including limitations and challenges, is of greater use than the diagnosis, or label, that
provides little information about how the individual is affected. And this has particular importance for
Australian education.
Within the Australian education context, the list approach is of little use. Most Departments of Education
do not have policy for this specific cohort of students, beyond the addition of the words ‘health conditions’
within general disability policy.
The Victorian Department of Education and Training (DET) does recognise and offer support for those
students with “comorbid fragile health”24 and for those who “are unable to attend their enrolled school”
due to the nature and impact of their health conditions (Department of Education and Early Childhood
Development, 2014)25. This condition-focused list is so limited, however, that few would meet the eligibility
criteria. As (White, 2015) points out, most Australian children and young people who live with chronic health
conditions do not reside at this extreme end of the continuum.
From this study we know that the RMLP database contains records of at least 61% of Australian school
children with cancer, which is very comprehensive. Those with cancer comprise 44% of the RMLP
database (949 of 2147 student records). However, childhood cancer is very rare, with rates of 0.014% of the
population (Australian Institute of Health and Welfare, 2012).
Given that learning for children and young people with health conditions is likely to be affected by frequent,
sporadic or extended periods of school absence, by not being fully well at school (fatigue, pain, impaired
concentration) or by bullying, the children and young people represented in the RMLP database indicates
only the tip of the iceberg, in terms of the number of children who are entitled to attention and support.
More sensibly, clear policy is required that takes account of the legislative framework surrounding this
issue (See White, 2015 forthcoming) should be developed, focused on supporting this growing cohort of
Australian students. The United Kingdom, for example, provides a process including advocacy and liaison
between health, education and family (Department for Education, 2013) and the American system appears
to implement legal requirements more effectively.
In Australian legislation the requirement for schools and education systems to provide ‘reasonable
adjustment’, for students with disability clearly includes those students with health conditions. However, the
enactment of this legislation into policy and practice is highly problematic for this cohort of students (See
White, 2015).
24. It should be noted that this term ‘comorbid’ refers to multiple medical conditions that occur simultaneously but may or not be related to each other. 25. The nature of this support is unspecified but the policy states that ‘schools will be supported’ to provide for assistance for these students.
Young Australians, illness and education April 201580 81 6 Discussion and recommendations
The discourse in Australian education seems dominated by fear about additional resources, leaving
government departments without policy—almost as if this would commit them to significantly larger
budgets for this sort of inclusion.
However, students with health conditions and their parents have usually reported that they do not require
money or support staff allocated to them. Rather, they want their teachers to know that they have been in
hospital or at home because of their condition, or that they are having a bad day and have been struggling
with their schoolwork. Communication, flexibility and negotiation about due dates for assignments, work
requirements, homework and general consideration is what is usually wished for.
This points to the need for schools and teachers to be supported in their work and to be made aware of
their responsibility for these students. Formal processes need to be established to improve communication
within schools, so that individual students do not need to explain themselves repeatedly to each of their
teachers26, and so parents are not required to continually seek assistance for their child within their school
(See White, 2014; Yates et al., 2010).
This raises legal obligations and logistical challenges, particularly for government education systems. As
White (2015) points out, governments are presently left vulnerable to litigation without this clarity.
6.4 School AbsenceRecords about school absence due to health conditions in Australia are not available. However, the
investigation of the RMLP database has provided valuable and important information about school
absence. 1,418 of the RMLP students are recorded to have missed more than one school term, which is
significant27.
It is also estimated that approximately 709 students who enter the RMLP programs each year are absent
from school for more than one term.
However, not all children and young people who meet eligibility criteria for the RMLP programs gain access
to these programs. And many other students have survived illness and now live with health conditions,
but numbers are not available from government. Many more children are known to be absent from school
for shorter periods each year (e.g. several weeks, several times a year for those with cystic fibrosis) due to
their health conditions. While the figures from the RMLP database indicate a significant amount of students
are absent from school for substantial periods of time, it only represents a very small number of the entire
Australian cohort of students with health conditions. These numbers suggest that most Australian students
with one of the 200 health conditions remain invisible and unaccounted for.
6.5 Individual IllnessStudents in the Ronald McDonald Learning program have a wide range of chronic health conditions, with
many of them having more than one health condition. Despite there being 42 different health conditions
specified, there are still 396 students (18.4%) who fall into the ‘other’ category. This is a practical example
of the difficulty with trying to list chronic health conditions. As noted earlier, Ireys (2001) observes that there
are at least 200 conditions that count. However, this categorization by diagnosis or condition is of little use
in education. 26. This applies mostly to secondary schools.27. Students with cancer and trauma tend to be absent from school for substantial blocks of time.
Young Australians, illness and education April 2015 8181 6 Discussion and recommendations
This project looked specifically at various health conditions, or categories of health condition, for the
purpose of trying to understand if there are any different patterns, or things that could be learned, by
looking at separate illnesses.
For example, when investigating how many students are in the program from higher or lower socio-
economic areas, looking at separate health conditions allowed results to be compared with Australian or
international data about connections between socio-economic status and various different childhood health
conditions.
With at least 61% of the children with cancer in Australia, in the RMLP database, this has the potential to be
developed into a very valuable resource for research about children with cancer.
6.6 Support Provision
Gortmaker et al. (1993) found that the success of young people with childhood chronic health conditions
as they transitioned to adulthood, was strongly linked to their socio-economic status in childhood. Goldfeld
et al’s (2014) recent study also notes the importance of SES in relation to serious childhood illness and
advocates education and health professionals working together to improve educational attainment of this
cohort.
As a program funded by philanthropy, the RMLP was developed because of the substantial gap in
service provision for children and young people with serious health conditions. However, responsibility
for educational support rightly belongs to government, particularly Departments of Education. That is not
currently acknowledged in policy, programs or monitoring of students.
The Ronald McDonald Learning Program includes many students from the lowest socio-economic areas,
and a proportion of students in its programs identify as Aboriginal and Torres Strait Islander. Nevertheless, a
bias towards students from higher SES areas exists in the program. Including more students in more remote
and disadvantaged areas would no doubt demand additional resource allocation.
Through exploration of the connection between SES and various childhood chronic health conditions in
the literature and in the RMLP database, it became apparent that for many conditions, the RMLP database
has fewer students from lower SES areas, than one would expect. For many reasons that have been
investigated by various researchers in the past, it is often harder for people from lower socio-economic
areas to access services.
6.7 Parent AssociatesData from the RMLP database tentatively indicates that more mothers of children with a serious chronic
health condition are lone parents, than in the general population. While this fits with research about
parenting children with disabilities, it warrants further investigation. Both lone mother and lone father
families in the RMLP database, come from lower socio-economic areas, indicating the additional hardships
they face.
Recent Australian research (Donnan, 2011; White et al., 2014; Yates et al., 2010) has repeatedly indicated
that parents experience significant difficulties when they attempt to communicate with their children’s
Young Australians, illness and education April 201582 83 6 Discussion and recommendations
schools. Legally, parents are acknowledged as ‘associates’ and have the right to formally advocate on
behalf of their children. In the absence of other systems of support, the literature reports that parents are
required to continually negotiate educational programs for their children in schools, often meeting with
indifferent responses. The need to improve communication with (and within) schools has been identified as
the major concern for parents.
6.8 ConclusionTogether with the 12 key themes from the international literature from many scholarly fields, this project
focused on the education of young people with health conditions. In the absence of any official government
data for education, the Ronald McDonald Learning Program was closely analysed to discern patterns,
particularly in relation to Australian Bureau of Statistics (ABS) SES Indexes. The project found that the
RMLP, a generous philanthropic organisation, is providing a substantial level of services for a significant
number of students with health conditions, and does so particularly comprehensively for those Australian
students with cancer.
However, in light of Australian disability legislation, that clearly points to the entitlements of these students,
together with what is known from the international literature, Australian educational policy and service
provision is lagging seriously behind the substantial improvements made in recent years in medicine.
In summary, Australian state, territory and national Departments of Education, can do much more to meet
their obligations towards these students, the majority of whom do not spend extended periods of time in
hospital. On the contrary, most of the children and young people who are living long lives due to medical
improvements, are not acknowledged, counted or supported through any systematic education-focused
process.
Parents are living in strained circumstances and are required to continually advocate for their children in
schools, where the invisible nature of the health challenges limit perceptions about entitlement to support.
Responsibility for the education of these children and young people, when they are neither in hospital nor
in school—but recuperating at home—is not accepted in any systematic way by Departments of Education
through either their small-scale hospital special schools or the schools in which the students are enrolled.
Young Australians, illness and education April 2015 8383 6 Discussion and recommendations
6.9 Recommendations1. To systematically identify students enrolled in Australian schools who have health conditions.
2. To identify students with health conditions as a collective educational cohort, rather than individual young people who are medical aberrations.
3. To retrieve and analyse data related to school absence from education system databases for (a) student stays in hospital, (b) students who spend periods of time at home recuperating, and (c) students with patterns of frequent or sporadic absences due to health conditions.
4. To develop and publish government policy and guidelines to explain the legal entitlement to reasonable adjustment for students with health conditions.
5. To provide practical assistance to schools that explain the legal obligations to support students with health conditions.
6. To establish guidelines and procedures for schools regarding assistance for students with health conditions.
7. To establish a comprehensive checklist for use by families, teachers and health professionals that supports clear communication and monitoring of (a) the effects of the student’s health condition on their learning, and (b) reasonable adjustment measures.
8. To develop a system to monitor Australian students with health conditions.
9. To use the RMLP database as a quality resource for further research, particularly about students with cancer and their education.
10. To undertake research into the connections between: (a) social determinants of health, (b) Australian SES data, and (c) the education of students with health conditions.

Young Australians, illness and education April 201584 85 REfERENCES
Young Australians, illness and education April 2015 8585 REfERENCES
REfERENCES Ainscow, M. (2012). Moving knowledge around: Strategies for fostering equity within educational systems.
Journal of Educational Change, 13(3), 289-310. doi: 10.1007/s10833-012-9182-5
American Psychological Assocation. (2014). Ethnic and Racial Minorities & Socioeconomic Status. Fact Sheets. Retrieved 3rd December 2014, from http://www.apa.org/pi/ses/resources/publications/fact-sheet-erm.aspx
Asanin, J., & Wilson, K. (2008). “I spent nine years looking for a doctor”: Exploring access to health care among immigrants in Mississauga, Ontario, Canada. Social Science & Medicine, 66(6), 1271-1283. doi: http://dx.doi.org/10.1016/j.socscimed.2007.11.043
Ashton, J., & Bailey, J. (2004). Slipping through the Policy Cracks: Children with Chronic Illness in Early Childhood Settings. Australian Journal of Early Childhood, 29(1), 50-58.
Asthma Australia. Asthma in School-aged Children. Retrieved 3rd October 2014, from http://www.asth-maaustralia.org.au/asthma_in_school_aged_children.aspx
Australian Bureau of Statistics. (2010, 21st December 2010). 3201.0 - Population by Age and Sex, Austra-lian States and Territories, Jun 2010. Retrieved 19th September 2014, from http://www.abs.gov.au/Ausstats/[email protected]/mf/3201.0
Australian Bureau of Statistics. (2012a, 21st June 2012). 2011 Census Counts — Aboriginal and Torres Strait Islander Peoples. 2075.0 - Census of Population and Housing - Counts of Aboriginal and Torres Strait Islander Australians, 2011 Retrieved 30th September 2014, from http://www.abs.gov.au/ausstats/[email protected]/Latestproducts/2075.0Main Features32011?opendocument&tabname=Sum-mary&prodno=2075.0&issue=2011&num=&view=
Australian Bureau of Statistics. (2012b). cat. no. 4102.0 - Australian Social Trends, Data Cube - Family and community. Retrieved from: http://www.abs.gov.au/AUSSTATS/[email protected]/allprimarymainfeatures/BE6B2842A6549A7FCA257ACC000E2A23?opendocument
Australian Bureau of Statistics. (2012c, 21st June 2012). Cultural Diversity in Australia. 2071.0 - Reflecting a Nation: Stories from the 2011 Census, 2012–2013 Retrieved 1st October 2014, from http://www.abs.gov.au/ausstats/[email protected]/Lookup/2071.0main+features902012-2013
Australian Bureau of Statistics. (2012d, 24th May 2012). Mortality, Life Expectancy and Causes of Death. 1301.0 - Year Book Australia 2012. Retrieved 22nd September 2014, from http://www.abs.gov.au/ausstats/[email protected]/Lookup/by Subject/1301.0~2012~Main Features~Mortality, life expectancy and causes of death~231
Australian Bureau of Statistics. (2013a, 24th October 2013). 3301.0 - Births, Australia, 2012. Retrieved 19th September 2014, from http://www.abs.gov.au/ausstats/[email protected]/mf/3301.0
Australian Bureau of Statistics. (2013b, 6th February 2013). Commentary On Student Numbers. 4221.0 - Schools, Australia, 2012. Retrieved 1st October 2014, from http://www.abs.gov.au/AUSSTATS/[email protected]/Previousproducts/4221.0Main Features302012?opendocument&tabname=Summa-ry&prodno=4221.0&issue=2012&num=&view=
Australian Bureau of Statistics. (2013c, 17th July 2013). The Indexes. 2033.0.55.001 - Census of Pop-ulation and Housing: Socio-Economic Indexes for Areas (SEIFA), Australia, 2011. Retrieved 6th October 2014, from http://www.abs.gov.au/ausstats/[email protected]/Lookup/2033.0.55.001main+fea-tures100032011
Australian Bureau of Statistics. (2013d, 17th July 2013). IRSAD. 2033.0.55.001 - Census of Population and Housing: Socio-Economic Indexes for Areas (SEIFA), Australia, 2011. Retrieved 6th October 2014, from http://www.abs.gov.au/ausstats/[email protected]/Lookup/2033.0.55.001main+features100042011
86 Young Australians, illness and education April 2015
Australian Bureau of Statistics. (2013e, 17/7/2013). Mapping with Google Earth 2033.0.55.001 - Census of Population and Housing: Socio-Economic Indexes for Areas (SEIFA), Australia, 2011. Retrieved 30th October 2014, from http://www.abs.gov.au/ausstats/[email protected]/Lookup/2033.0.55.001main+fea-tures100262011
Australian Bureau of Statistics. (2013f). Population Estimates by Age and Sex, Regions of New South Wales (ASGS 2011), 2008 and 2013 ‘Table 6: Estimated Resident Population by Age, New South Wales, Persons - 30 June 2013’, datacube: Excel spreadsheet, cat. no. 3235.0. Retrieved 18th September 2014, from http://www.abs.gov.au/AUSSTATS/[email protected]/DetailsPage/3235.02013?OpenDocument
Australian Bureau of Statistics. (2013g). Population Estimates by Age and Sex, Regions of Victoria (ASGS 2011), 2008 and 2013 Table 6. Estimated Resident Population by Age, Victoria, Persons – 30 June 2013, Excel spreadsheet, cat. no. 3235.0. Retrieved 18th September 2014, from http://www.abs.gov.au/AUSSTATS/[email protected]/DetailsPage/3235.02013?OpenDocument
Australian Bureau of Statistics. (2013h, 17th July 2013). SEIFA Basics: Information on Socio-Economic Indexes for Areas. 2033.0.55.001 - Census of Population and Housing: Socio-Economic Indexes for Areas (SEIFA), Australia, 2011. Retrieved 6th October 2014, from http://www.abs.gov.au/ausstats/[email protected]/Lookup/by Subject/2033.0.55.001~2011~Main Features~SEIFA Basics~3
Australian Bureau of Statistics. (2013i, 23rd September 2013). Socio-Economic Indexes for Areas. Retrieved 6th October 2014, from http://www.abs.gov.au/websitedbs/censushome.nsf/home/seifa
Australian Bureau of Statistics. (2014a, 28th August 2014). 3235.0 - Population by Age and Sex, Regions of Australia, 2013. Retrieved 18th September 2014, from http://www.abs.gov.au/AUSSTATS/[email protected]/Lookup/3235.0Main+Features12013?OpenDocument
Australian Bureau of Statistics. (2014b). Schools. 4221.0 - Schools, Australia, 2013. 2014, from http://www.abs.gov.au/ausstats/[email protected]/Lookup/4221.0main+features100042013
Australian Institute of Health and Welfare. (2011). The health and welfare of Australia’s Aboriginal and Torres Strait Islander people, an overview 2011 (pp. 127). Canberra: AIHW.
Australian Institute of Health and Welfare. (2012). A picture of Australia’s children 2012. Cat. no. PHE 167. Canberra: AIHW.
Australian Institute of Health and Welfare, & Australasian Association of Cancer Registries. (2012). Cancer in Australia: an overview, 2012. (Cat. no. CAN 70). Canberra: AIHW.
Barr, H. L., Britton, J., Smyth, A. R., & Fogarty, A. W. (2011). Association between socioeconomic status, sex, and age at death from cystic fibrosis in England and Wales (1959 to 2008): cross sectional study (Vol. 343).
Bell, S. C., Bye, P. T. P., Cooper, P. J., Martin, A. J., McKay, K. O., Robinson, P. J., . . . Sims, G. C. (2011). Cystic fibrosis in Australia, 2009: results from a data registry. Med J Aust, 195(7), 396-400. doi: 10.5694/mja11.10719
Berland, J. (2009). The elephant in the classroom. International Journal of Inclusive Education, 13(7), 699-711. doi: 10.1080/13603110903045996
Berntsson, L., Berg, M., Brydolf, M., & Hellström, A.-L. (2007). Adolescents’ experiences of well-being when living with a long-term illness or disability. Scandinavian Journal of Caring Sciences, 21(4), 419-425. doi: 10.1111/j.1471-6712.2006.00490.x
Bessell, A. G. (2001). School days: educating children with chronic illness. Exceptional Parent, 31(9), 44.
Blum R, W. (1992). Chronic illness and disability in adolescence. Journal of adolescent health, 13(5), 364-368.
Bradley-Klug, K. L., Jeffries-DeLoatche, K. L., Walsh, A. S. J., Bateman, L. P., Nadeau, J., Powers, D. J., & Cunningham, J. (2013). School psychologists’ perceptions of primary care partnerships: Implica-tions for building the collaborative bridge. Advances in School Mental Health Promotion, 6(1), 51-67. doi: 10.1080/1754730X.2012.760921
87 REfERENCES
87Young Australians, illness and education April 2015 87 REfERENCES
Brown, R. T., Wiener, L., Kupst, M. J., Brennan, T., Behrman, R., Compas, B. E., . . . Zeltzer, L. (2008). Single Parents of Children with Chronic Illness: An Understudied Phenomenon. Journal of Pediatric Psy-chology, 33(4), 408-421. doi: 10.1093/jpepsy/jsm079
Cancer Research UK. (2014, 5th June 2014). Childhood Cancer Incidence Statistics. Retrieved 22nd Sep-tember 2014, from http://www.cancerresearchuk.org/cancer-info/cancerstats/childhoodcancer/inci-dence/childhood-cancer-incidence-statistics
Cassedy, A., Drotar, D., Ittenbach, R., Hottinger, S., Wray, J., Wernovsky, G., . . . Marino, B. S. (2013). The impact of socio-economic status on health related quality of life for children and adolescents with heart disease. Health Qual Life Outcomes, 11, 99. doi: 10.1186/1477-7525-11-99
Clay, D. L., Cortina, S., Harper, D. C., Cocco, K. M., & Drotar, D. (2004). Schoolteachers’ Experienc-es With Childhood Chronic Illness. Children’s Health Care, 33(3), 227-239. doi: 10.1207/s15326888chc3303_5
D’Arcy, C., Holman, J., Bass, A. J., Rouse, I. L., & Hobbs, M. S. T. (1999). Population‐based linkage of health records in Western Australia: development of a health services research linked database. Australian and New Zealand journal of public health, 23(5), 453-459.
Daly, B. P. (2013). Effectively supporting youth with chronic illness in schools. Advances in School Mental Health Promotion, 6(1), 1-4. doi: 10.1080/1754730X.2013.764678
Dasu, T., & Johnson, T. (2003). Exploratory data mining and data cleaning (Vol. 479): John Wiley & Sons.
Department for Education, U. K. (2013). Ensuring a good education for children who cannot attend school because of health needs: Statutory guidance for local authorities. (Ref: DFE-00307-2013 ). United Kingdom: Department for Education Retrieved from https://http://www.gov.uk/government/publica-tions/education-for-children-with-health-needs-who-cannot-attend-school.
Department of Education and Early Childhood Development. (2014, 6th January 2014). Home Based Pro-grams. Support for Children with Special Needs. Retrieved 7th December 2014, from http://www.education.vic.gov.au/school/parents/needs/pages/homebased.aspx
Dockett, S. (2004). “Everyone Was Really Happy to See Me!” The Importance of Friendships in the Return to School of Children with Chronic Illness. Australian Journal of Early Childhood, 29(1), 27-32.
Donnan, B. (2011). White Paper: Educational pathways for children, adolescents and young adults with cancer. Sydney: Ronald McDonald House Charities.
Drew, S., & White, J. (2010). ‘Advocate mothering’ when a teenager is living and learning with an ongoing health condition: Cultural capital in negotiations with health and education. Paper presented as part of the ‘Keeping Connected 2007-2009’ Symposium. Paper presented at the Making a difference, Annual conference of the Australian Association for Research in Education, Nov 28th - Dec 2nd, The University of Melbourne.
Eiser, C. (1993). Growing up with a chronic disease: The impact on children and their families: Jessica King-sley Publishers.
Fayyad, U., Piatetsky-Shapiro, G., & Smyth, P. (1996). From data mining to knowledge discovery in databas-es. AI magazine, 17(3), 37.
Fowler, M. G., Johnson, M. P., & Atkinson, S. S. (1985). School achievement and absence in children with chronic health conditions. The Journal of Pediatrics, 106(4), 683-687. doi: 10.1016/S0022-3476(85)80103-7
French, D. J. (2001). Asthma. In H. Koot & J. Wallander (Eds.), Quality of Life in Child and Adolescent Illness: Concepts, methods and findings (pp. 241- 266). East Sussex, UK: Bruner-Routledge.
Goldfeld, S., O’Connor, M., Quach, J., Tarasuik, J., & Kvalsvig, A. (2014). Learning Trajectories of Children With Special Health Care Needs Across the Severity Spectrum. Academic Pediatrics(0). doi: http://dx.doi.org/10.1016/j.acap.2014.09.001
88 Young Australians, illness and education April 2015 89 REfERENCES
Gortmaker, S., Perrin, J., Weitzman, M., Homer, C., & Sobol, A. (1993). An Unexpected Success Story: Transition to Adulthood in Youth With Chronic Physical Health Conditions. Journal of Research on Adolescence, 3(3), 317-336. doi: 10.1207/s15327795jra0303_6
Gortmaker, S. L., & Sappenfield, W. (1984). Chronic childhood disorders: prevalence and impact. Pediatr Clin North Am, 31(1), 3-18.
Heaney, D. C., MacDonald, B. K., Everitt, A., Stevenson, S., Leonardi, G. S., Wilkinson, P., & Sander, J. W. (2002). Socioeconomic variation in incidence of epilepsy: prospective community based study in south east England (Vol. 325).
Ireys, H. T. (2001). Epidemiology of Childhood Chronic illness: Issues in Definitions, Service Use, and Costs. In H. M. Koot & J. L. Wallander (Eds.), Quality of Live in Child and Adolescent Illness: Concepts methods and findings (pp. 123-150). East Sussex: Brunner-Routledge.
Jackson, M. (2012). The special educational needs of adolescents living with chronic illness: a literature review. International Journal of Inclusive Education, 17(6), 543-554. doi: 10.1080/13603116.2012.676085
Jick, S. S., Kaye, J. A., Vasilakis-Scaramozza, C., Rodríguez, L. A. G., Ruigómez, A., Meier, C. R., . . . Jick, H. (2003). Validity of the General Practice Research Database. Pharmacotherapy: The Journal of Human Pharmacology and Drug Therapy, 23(5), 686-689. doi: 10.1592/phco.23.5.686.32205
Kaffenberger, C. J. (2006). School reentry for students with a chronic illness: A role for professional school counselors. Professional School Counseling, 9(3), 223-230.
Katterl, R. (2011). Socioeconomic status and accessibility to health care services in Australia. RESEARCH ROUNDup(22).
Katz, E. R., Rubinstein, C. L., Hubert, N. C., & Blew, A. (1989). School and Social Reintegration of Children with Cancer. Journal of Psychosocial Oncology, 6(3-4), 123-140. doi: 10.1300/J077v06n03_09
Katz, E. R., Varm, J. W., Rubenstein, C. L., Blew, A., & Hubert, N. (1992). Teacher, Parent, and Child Eval-uative Ratings of a School Reintegration Intervention for Children With Newly Diagnosed Cancer. Children’s Health Care, 21(2), 69-75. doi: 10.1207/s15326888chc2102_1
Kim, W., Choi, B.-J., Hong, E.-K., Kim, S.-K., & Lee, D. (2003). A taxonomy of dirty data. Data mining and knowledge discovery, 7(1), 81-99.
Kliebenstein, M. A., & Broome, M. E. (1999). School re-entry for the child with chronic illness: parent and school personnel perceptions. Pediatric nursing, 26(6), 579-582.
Koot, H., & Wallander, J. (2014). Quality of Life in Child and Adolescent Illness : Concepts, Methods and Findings Retrieved from http://VU.eblib.com.au/patron/FullRecord.aspx?p=1596502
Kraemer, S. (2000). The fragile male. BMJ, 321(7276), 1609-1612. doi: 10.1136/bmj.321.7276.1609
Lane, P., Stain, H. J., Kelly, B., Lewin, T. J., & Higginbotham, N. (2008). Creating a database to facilitate mul-tilevel analyses of mental health determinants and outcomes in rural and remote areas. Australian Journal of Rural Health, 16(4), 207-212.
Lareau, A. (2011). Unequal childhoods: Class, race, and family life: Univ of California Press.
Lightfoot, J., Wright, S., & Sloper, P. (1999). Supporting pupils in mainstream school with an illness or disability: young people’s views. Child: Care, Health and Development, 25(4), 267-284. doi: 10.1046/j.1365-2214.1999.00112.x
Maguire, B. (2011). Families with a child with disability: Joblessness, financial hardship and social support LSAC Annual Statistical Report 2011 (pp. 33-42): Australian Institute of Family Studies.
Manns, B. J., Mortis, G. P., Taub, K. J., McLaughlin, K., Donaldson, C., & Ghali, W. A. (2001). The Southern Alberta Renal Program database: a prototype for patient management and research initiatives. Clini-cal and investigative medicine, 24(4), 164-170.
89Young Australians, illness and education April 2015 89 REfERENCES
Marks, R., Sheinfeld Gorin, S., & McAuliffe, P. (2008). Implications of childhood cancer survivors in the classroom and the school. Health Education, 109(1), 25-48. doi: doi:10.1108/09654280910923363
McLachlan, R., Gilfillan, G., & Gordon, J. (2013). Deep and Persistent Disadvantage in Australia, rev. Staff Working Paper, Productivity Commission (pp. 236). Canberra, Commonwealth of Australia.
McPherson, M., Arango, P., Fox, H., Lauver, C., McManus, M., Perrin, J. M., . . . Strickland, B. (1998). A new definition of children with special health care needs. Pediatrics, 102(1), 137.
Merceron, A., & Yacef, K. (2003). A Web-based tutoring tool with mining facilities to improve learning and teaching. In U. Hoppe, F. Verdejo & J. Kay (Eds.), Artificial Intelligence in education : shaping the future of learning through intelligent technologies (pp. 201-208). Amsterdam: IOS press.
Minnick, M. L., Boynton, S., Ndirangu, J., & Furth, S. (2010). Sex, race, and socioeconomic disparities in kidney disease in children. Semin Nephrol, 30(1), 26-32. doi: 10.1016/j.semnephrol.2009.10.003
Mojaverian, T., Kim, H. S., & Hashimoto, T. (2013). Cultural differences in professional help seeking: A com-parison of Japan and the U.S. Frontiers in Psychology, 3(JAN). doi: 10.3389/fpsyg.2012.00615
Morad, M., Kandel, I., Hyam, E., & Merrick, J. (2004). Adolescence, chronic illness and disability. Int J Ado-lesc Med Health, 16(1), 21-27.
Mukherjee, S., Lightfoot, J., & Sloper, P. (2000). The inclusion of pupils with a chronic health condition in mainstream school: what does it mean for teachers? Educational Research, 42(1), 59-72. doi: 10.1080/001318800363917
Newacheck, P. W., & Taylor, W. R. (1992). Childhood chronic illness: prevalence, severity, and impact. Ameri-can Journal of Public Health, 82(3), 364-371. doi: 10.2105/AJPH.82.3.364
Nisselle, A., Hanns, S., Green, J., & Jones, T. (2012). Accessing flexible learning opportunities: children’s and young people’s use of laptops in a paediatric hospital. Technology, Pedagogy and Education, 21(1), 3-20. doi: 10.1080/1475939X.2012.659883
Orton, E., Kendrick, D., West, J., & Tata, L. J. (2014). Persistence of Health Inequalities in Childhood Injury in the UK; A Population-Based Cohort Study of Children under 5. PLoS ONE, 9(10), e111631. doi: 10.1371/journal.pone.0111631
Reid, D. W., Leigh Blizzard, C., Shugg, D. M., Flowers, C., Cash, C., & Greville, H. M. (2011). Changes in cystic fibrosis mortality in australia, 1979-2005. Medical Journal of Australia, 195(7), 392-395. doi: 10.5694/mja10.11229
Ronald McDonald Learning Program. Request RMLP tuition. Retrieved 27 October 2014, from http://learn-ingprogram.rmhc.org.au/parents/apply-for-rmlp-tuition/
Ronald McDonald Learning Program. (2014). RMLP Exceed User Reference Guide. Melbourne, Australia: Ronald McDonald House Charities.
Rynard, D. W., Chambers, A., Klinck, A. M., & Gray, J. D. (1998). School Support Programs for Chronically Ill Children: Evaluating the Adjustment of Children With Cancer at School. Children’s Health Care, 27(1), 31-46. doi: 10.1207/s15326888chc2701_3
Saunders, P. (2006). The Costs of Disability and the Incidence of Poverty. In S.-S. P. R. Centre (Ed.), SPRC Discussion Paper No.147 (Vol. 147, pp. 1-28). Sydney, NSW: The Soical Policy Research Centre, University of New South Wales.
Sawyer, S. M., Drew, S., Yeo, M. S., & Britto, M. T. (2007). Adolescents with a chronic condition: challenges living, challenges treating. The Lancet, 369(9571), 1481-1489. doi: http://dx.doi.org/10.1016/S0140-6736(07)60370-5
Schechter, M. S., Shelton, B. J., Margolis, P. A., & Fitzsimmons, S. C. (2001). The Association of Socioeco-nomic Status with Outcomes in Cystic Fibrosis Patients in the United States. American Journal of Respiratory and Critical Care Medicine, 163(6), 1331-1337. doi: 10.1164/ajrccm.163.6.9912100
Young Australians, illness and education April 201590 91 REfERENCES
Sexson, S. B., & Madan-Swain, A. (1993). School reentry for the child with chronic illness. J Learn Disabil, 26(2), 115-125, 137.
Shiu, S. (2001). Issues in the Education of Students with Chronic Illness. International Journal of Disability, Development and Education, 48(3), 269-281. doi: 10.1080/10349120120073412
Shiu, S. (2004a). Maintaining the Thread: Including Young Children with Chronic Illness in the Primary Class-room. Australian Journal of Early Childhood, 29(1), 33-38.
Shiu, S. (2004b). Positive interventions for children with chronic illness: Parents’ and teachers’ concerns and recommendations. Australian Journal of Education, 48(3), 239-252.
Shiu, S. (2008). Achieving equity in educational outcomes for students with chronic illness. University of Western Sydney.
Slee, R. (2011). Irregular Schooling: Special education, regular education and inclusive education. London: Routledge.
Smith, K. E., Patterson, C. A., Szabo, M. M., Tarazi, R. A., & Barakat, L. P. (2013). Predictors of academic achievement for school-age children with sickle cell disease. Advances in School Mental Health Promotion, 6(1), 5-20.
St Leger, P. (2012). Practice of supporting young people with chronic health conditions in hos-pital and schools. International Journal of Inclusive Education, 18(3), 253-269. doi: 10.1080/13603116.2012.679320
Stam, H., Hartman, E. E., Deurloo, J. A., Groothoff, J., & Grootenhuis, M. A. (2006). Young Adult Patients with a History of Pediatric Disease: Impact on Course of Life and Transition into Adulthood. Journal of adolescent health, 39(1), 4-13. doi: http://dx.doi.org/10.1016/j.jadohealth.2005.03.011
Stanley, F. J., Croft, M. L., Gibbins, J., & Read, A. W. (1994). A population database for maternal and child health research in Western Australia using record linkage. Paediatric and perinatal epidemiology, 8(4), 433-447.
Stein, R. E. K., Bauman, L. J., Westbrook, L. E., Coupey, S. M., & Ireys, H. T. (1993). Framework for identify-ing children who have chronic conditions: The case for a new definition. The Journal of Pediatrics, 122(3), 342-347.
Stokes, M., Ashby, K., & Clapperton, A. (2001). The effect of socio-economic status on injury among Victo-rians. Hazard, 49(Summer 2001/2002), 2-12. http://www.monash.edu.au/miri/research/research-ar-eas/home-sport-and-leisure-safety/visu/hazard/haz49.pdf
Tait, B. L. (2012). ‘Talking up and talking down’: the presentation of educational need in an age of inclu-sive education policy reforms. International Journal of Inclusive Education, 17(6), 555-570. doi: 10.1080/13603116.2012.693545
Tamblyn, R., Lavoie, G., Petrella, L., & Monette, J. (1995). The use of prescription claims databases in phar-macoepidemiological research: the accuracy and comprehensiveness of the prescription claims database in Quebec. Journal of clinical epidemiology, 48(8), 999-1009.
Telosa Software. (2014). Telosa Software Product Overview. from http://www.telosa.com/software-non-prof-its/
Thies, K. M. (1999). Identifying the Educational Implications of Chronic Illness in School Children. Journal of School Health, 69(10), 392-397. doi: 10.1111/j.1746-1561.1999.tb06354.x
Thies, K. M., & McAllister, J. W. (2001). The Health and Education Leadership Project: A School Initiative for Children and Adolescents with Chronic Health Conditions. Journal of School Health, 71(5), 167-172. doi: 10.1111/j.1746-1561.2001.tb07309.x
Thompson, R. J., Jr., & Raezer, L. B. (1998). Families of children with chronic medical conditions. In M. Hersen & A. S. Bellack (Eds.), Comprehensive clinical psychology: Vol. 9 Applications in diverse populations (pp. 219-233). Oxford: Elsevier Science Limited.
Young Australians, illness and education April 2015 9191 REfERENCES
Verma, N., Bush, A., & Buchdahl, R. (2005). IS there still a gender gap in cystic fibrosis?*. Chest, 128(4), 2824-2834. doi: 10.1378/chest.128.4.2824
Walker, H., Ferguson, P., & Drew, S. (2009). Keeping Connected: Young people’s stories of living and learn-ing with an ongoing health condition (pp. 25). Melbourne, Australia: The University of Melbourne.
Walsh, A. S. J., & Chenneville, T. (2013). Addressing HIV in the school setting: Application of a school change model. Advances in School Mental Health Promotion, 6(1), 21-34.
Weitzman, M. (1986). School absence rates as outcome measures in studies of children with chronic illness. J Chronic Dis, 39(10), 799-808.
Weitzman, M., Walker, D. K., & Gortmaker, S. (1986). Chronic Illness, Psychosocial Problems, and School Absences. Clinical Pediatrics, 25(3), 137.
West, A. M., Denzer, A. Q., Wildman, B. G., & Anhalt, K. (2013). Teacher perception of burden and willing-ness to accommodate children with chronic health conditions. Advances in School Mental Health Promotion, 6(1), 35-50. doi: 10.1080/1754730X.2012.760920
White, J. (2014). Overlooking entitlement. International Journal of Inclusive Education, 18(3), 241-252. doi: 10.1080/13603116.2012.679319
White, J. (2015). Learning in ‘no man’s land’: Policy enactment for students with health conditions. In K. te Reile & R. Gorur (Eds.), Interrogating conceptions of ‘vulnerable youth’ in theory, policy and practice. Rotterdam: Sense.
White, J. (2015 forthcoming). Students with chronic health conditions, the law and education: A salutary lesson from Australia. International Journal of Inclusive Education.
White, J., Drew, S., & Dumenden, I. (2012). Embodying health-related educational disadvantage: How does it work? What work do mothers do? And how can we think our way through what it means? Paper presented at the Embodying good research: What counts and who decides? Association of Qualita-tive Research/Discourse Power Resistance (downunder) conference, August 23-25, Charles Darwin University, Darwin.
White, J., Neville, A., Culnane, E., Drew, S., Giles, F., Rosauer, K., & Sowman, P. (2014). Inculsion and En-titlement? Education and Serious Health Challenges for Young People. Poster Presentation. Paper presented at the American Educational Research Association (AERA) Disability Studies in Education ‘Learning from the past. Ensuring the future.’ Annual Conference, 25th - 27th July. , Victoria Univer-sity, Melbourne, Australia.
Wilkie, K. J. (2012). ‘Absence Makes the Heart Grow Fonder’: Students With Chronic Illness Seeking Aca-demic Continuity Through Interaction With Their Teachers at School. Australasian Journal of Special Education, 36(01), 1-20. doi: 10.1017/jse.2012.4
Wong, G., Medway, M., Didsbury, M., Tong, A., Turner, R., Mackie, F., . . . Craig, J. (2014). Health and wealth in children and adolescents with chronic kidney disease (K-CAD study). BMC Public Health, 14(1), 307.
World Health Organisation. (2013, 7 May 2013). What are social determinants of health? Social determinants of health. 2014, from http://www.who.int/social_determinants/sdh_definition/en/
Yates, L., Bond, L., Dixon, M., Drew, S., Ferguson, P., Hay, T., . . . White, J. (2010). Keeping Connected: Identity, Social Connection and Education for Young People living with Chronic Illness. Final Report from ‘Keeping Connected; young people, identity and schooling’ (pp. 109). Victoria, Australia: Mel-bourne Graduate School of Education, The University of Melbourne (ARC: LP0669735).
Yu, D., Feng, Y., Yang, L., Da, M., Fan, C., Wang, S., & Mo, X. (2014). Maternal Socioeconomic Status and the Risk of Congenital Heart Defects in Offspring: A Meta-Analysis of 33 Studies. PLoS ONE, 9(10), e111056. doi: 10.1371/journal.pone.0111056


94
vu.edu.au/the-victoria-institute