you analyzed graphs of functions. (lesson 1-5) · 2015-03-18 · you analyzed graphs of functions....
TRANSCRIPT

You analyzed graphs of functions. (Lesson 1-5)
• LEQ: How do we graph transformations of the sine and cosine functions & use sinusoidal functions to solve problems?
• sinusoid
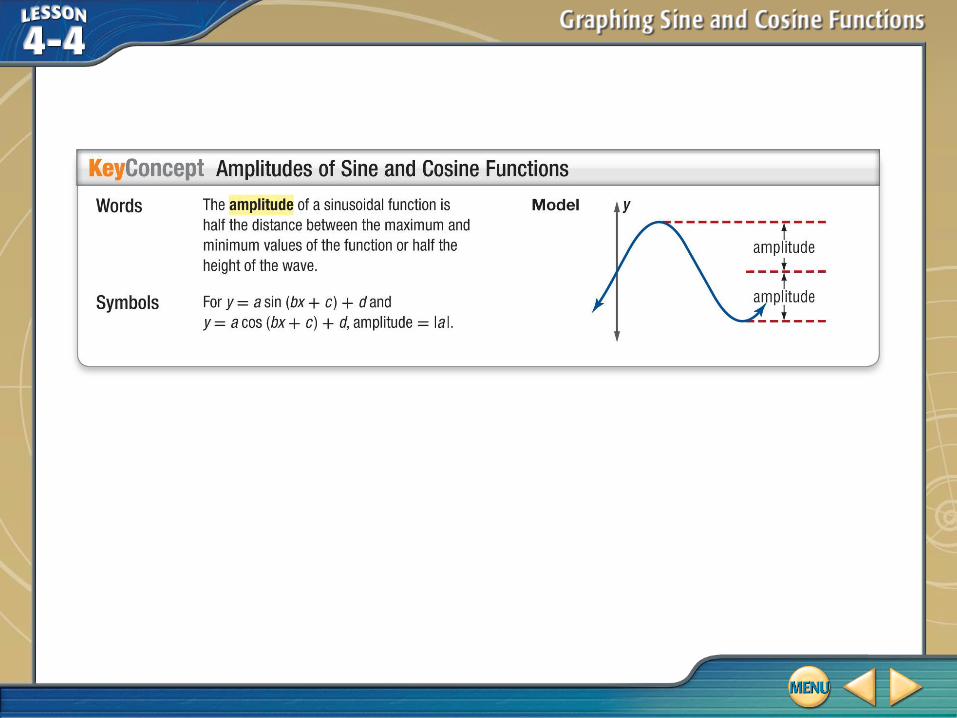
• amplitude
• frequency
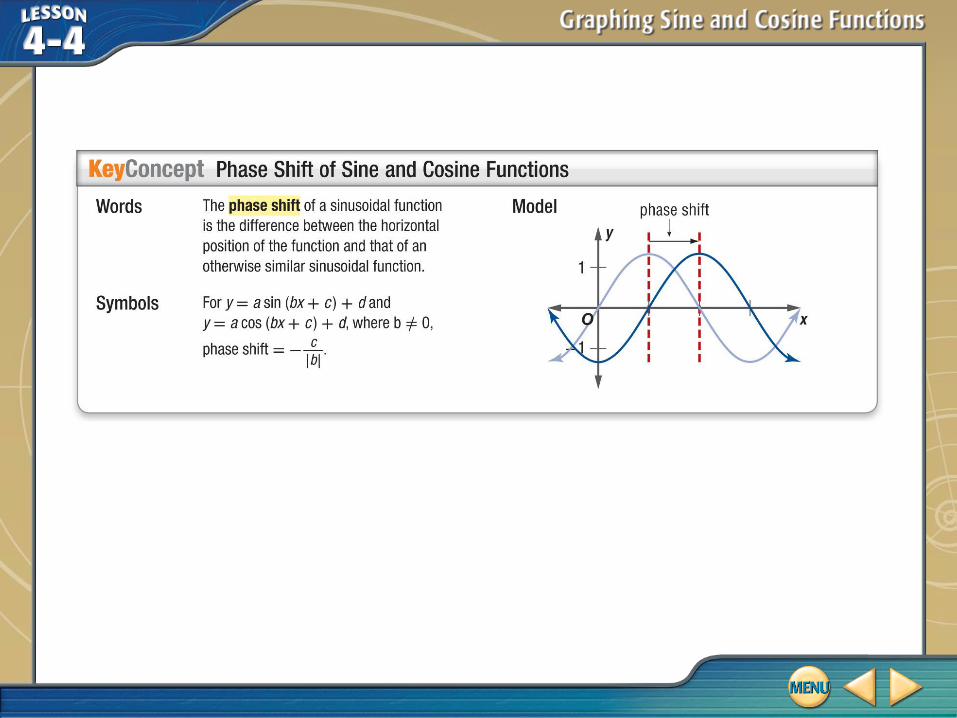
• phase shift
• vertical shift
• midline
Graph Vertical Dilations of Sinusoidal
Functions
Describe how the graphs of f(x) = sin x and g(x) = 2.5 sin x are related. Then find the amplitude of g(x), and sketch two periods of both functions on the same coordinate axes.
The graph of g(x) is the graph of f(x) expanded vertically. The amplitude of g(x) is |2.5| or 2.5.
Graph Vertical Dilations of Sinusoidal
Functions
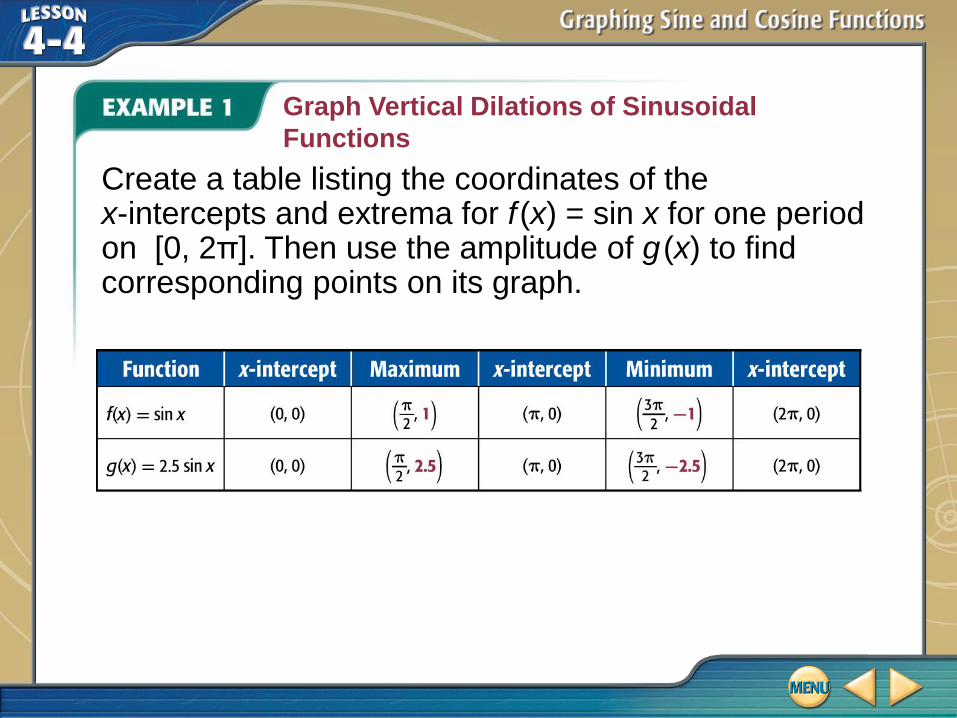
Create a table listing the coordinates of the x-intercepts and extrema for f(x) = sin x for one period on [0, 2π]. Then use the amplitude of g(x) to find corresponding points on its graph.
Graph Vertical Dilations of Sinusoidal
Functions
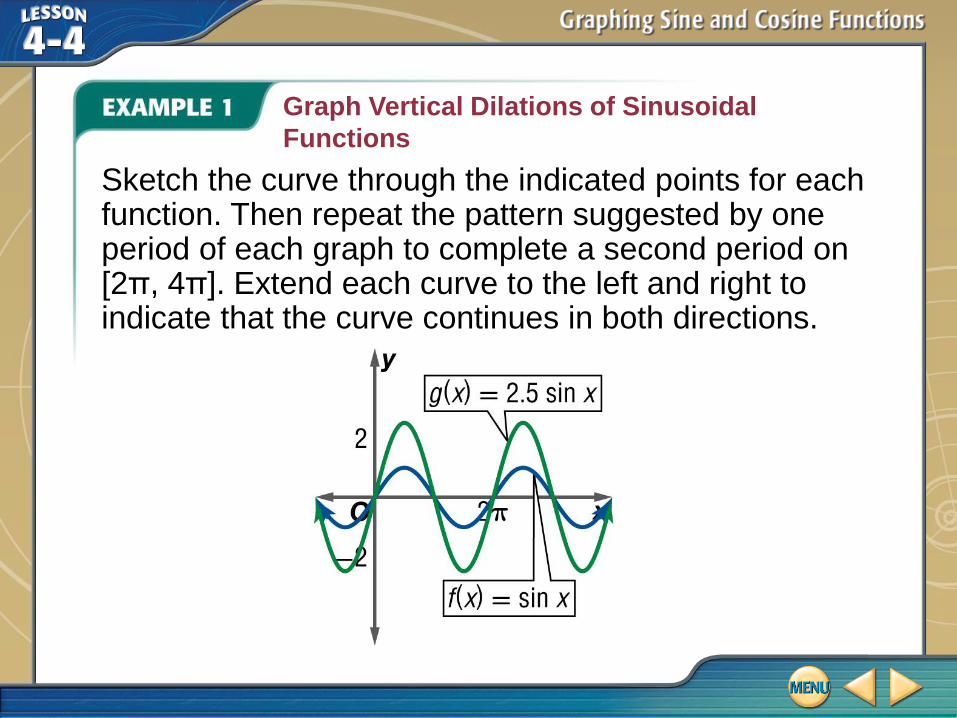
Sketch the curve through the indicated points for each function. Then repeat the pattern suggested by one period of each graph to complete a second period on [2π, 4π]. Extend each curve to the left and right to indicate that the curve continues in both directions.
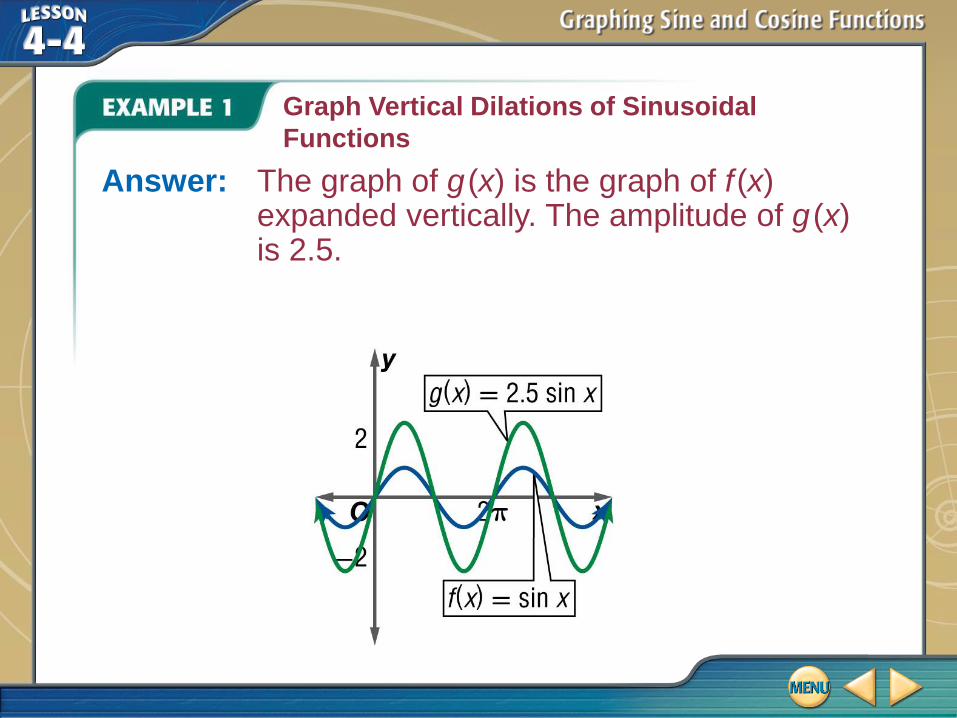
Answer: The graph of g(x) is the graph of f(x) expanded vertically. The amplitude of g(x) is 2.5.
Graph Vertical Dilations of Sinusoidal
Functions
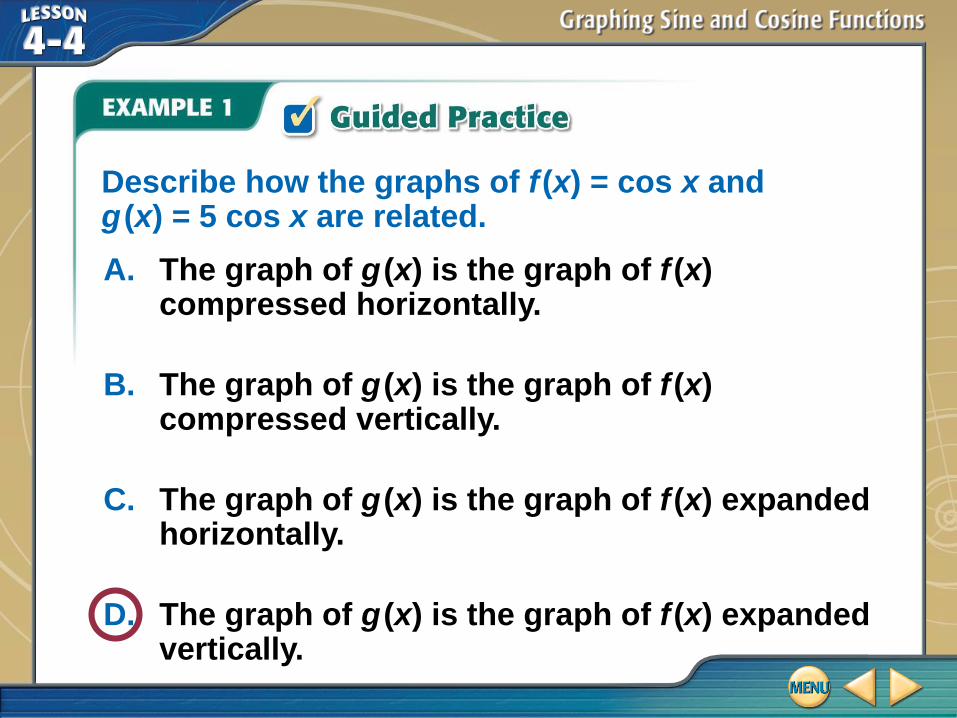
Describe how the graphs of f(x) = cos x and g(x) = 5 cos x are related.
A. The graph of g(x) is the graph of f(x) compressed horizontally.
B. The graph of g(x) is the graph of f(x) compressed vertically.
C. The graph of g(x) is the graph of f(x) expanded horizontally.
D. The graph of g(x) is the graph of f(x) expanded vertically.
Graph Reflections of Sinusoidal Functions
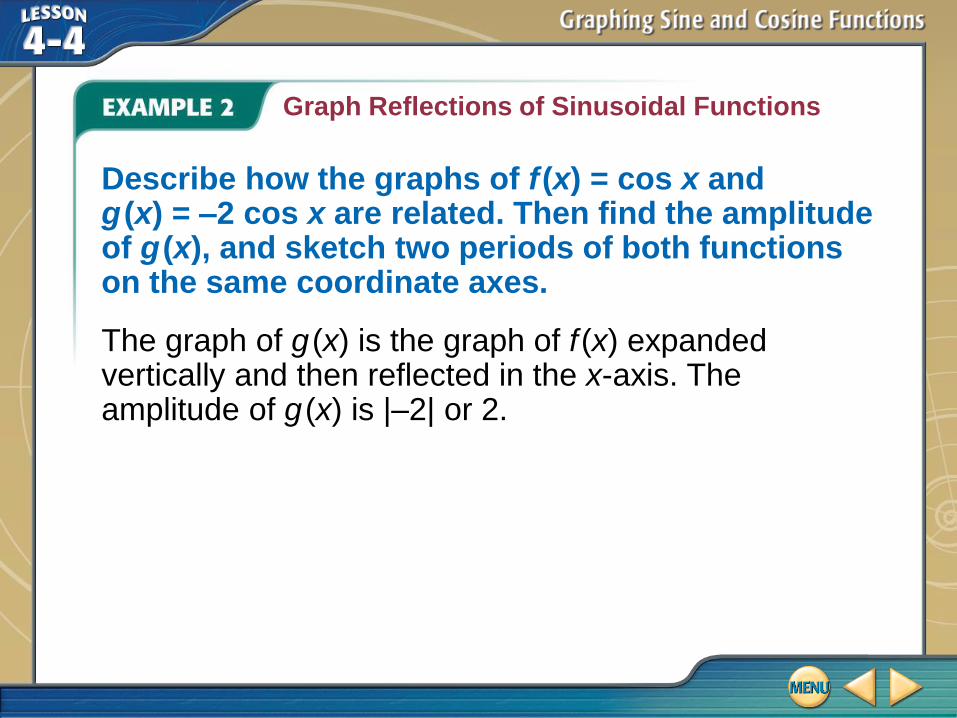
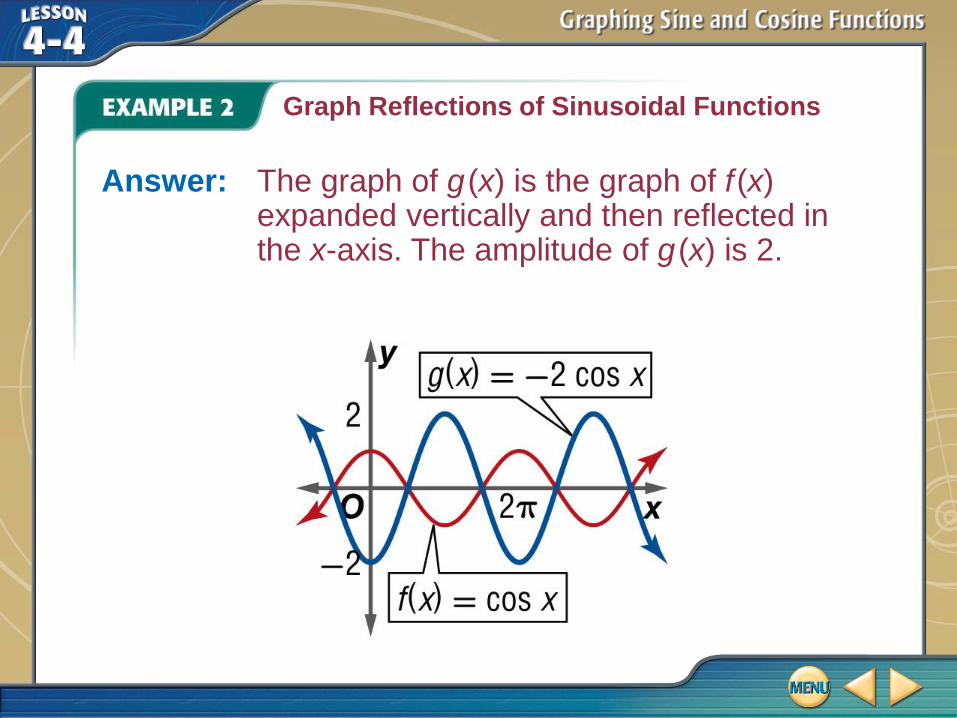
Describe how the graphs of f(x) = cos x and g(x) = –2 cos x are related. Then find the amplitude of g(x), and sketch two periods of both functions on the same coordinate axes.
The graph of g(x) is the graph of f(x) expanded vertically and then reflected in the x-axis. The amplitude of g(x) is |–2| or 2.
Graph Reflections of Sinusoidal Functions
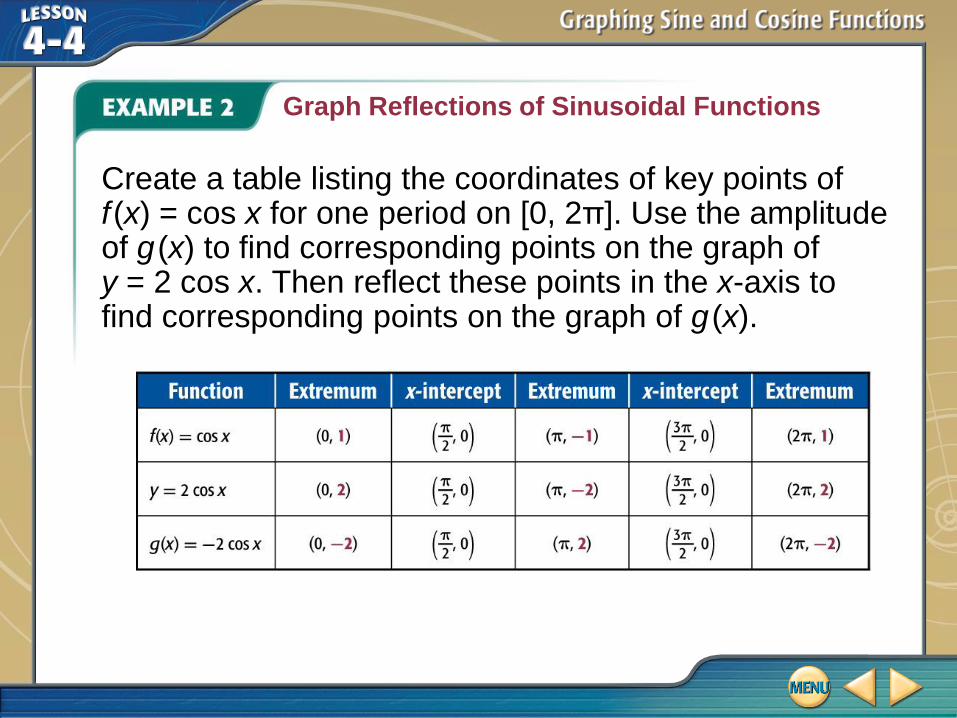
Create a table listing the coordinates of key points of f(x) = cos x for one period on [0, 2π]. Use the amplitude of g(x) to find corresponding points on the graph of y = 2 cos x. Then reflect these points in the x-axis to find corresponding points on the graph of g(x).
Graph Reflections of Sinusoidal Functions
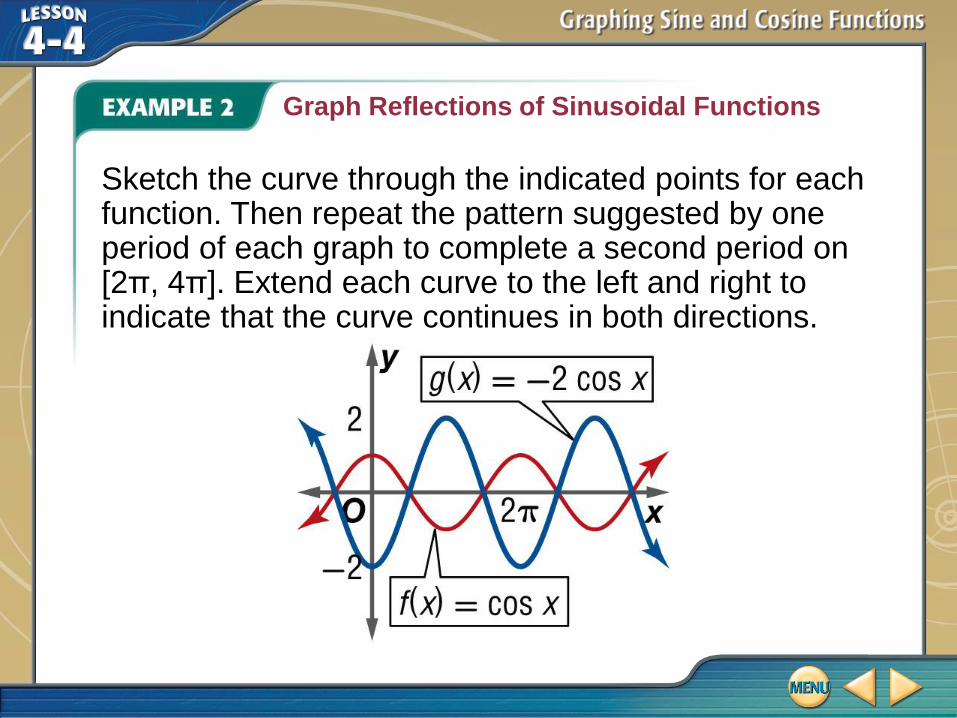
Sketch the curve through the indicated points for each function. Then repeat the pattern suggested by one period of each graph to complete a second period on [2π, 4π]. Extend each curve to the left and right to indicate that the curve continues in both directions.
Graph Reflections of Sinusoidal Functions
Answer: The graph of g(x) is the graph of f(x) expanded vertically and then reflected in the x-axis. The amplitude of g(x) is 2.
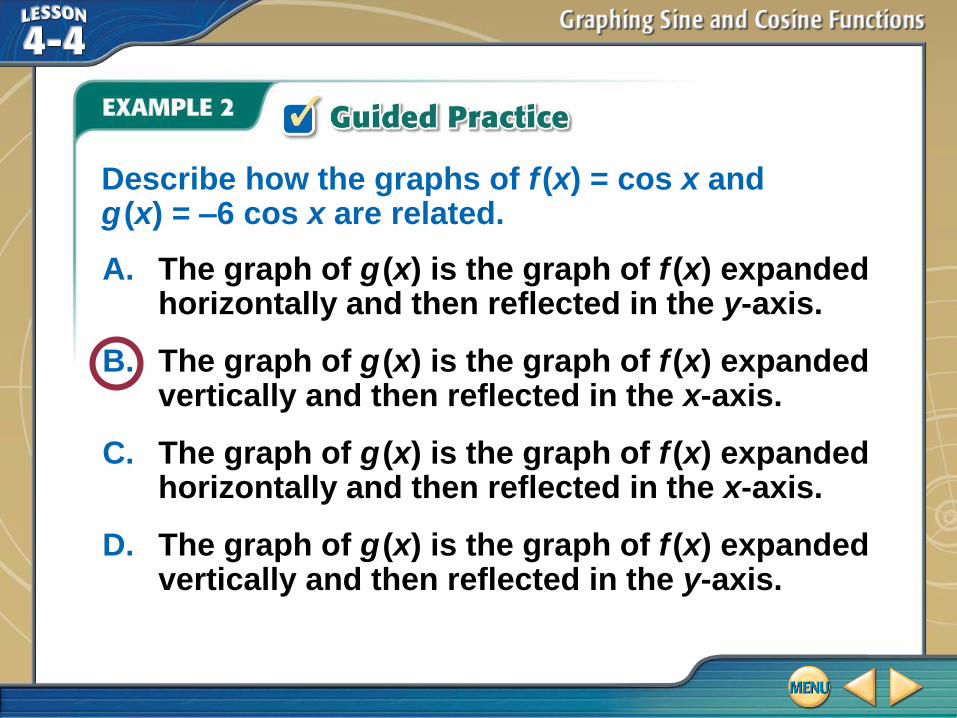
Describe how the graphs of f(x) = cos x and g(x) = –6 cos x are related.
A. The graph of g(x) is the graph of f(x) expanded horizontally and then reflected in the y-axis.
B. The graph of g(x) is the graph of f(x) expanded vertically and then reflected in the x-axis.
C. The graph of g(x) is the graph of f(x) expanded horizontally and then reflected in the x-axis.
D. The graph of g(x) is the graph of f(x) expanded vertically and then reflected in the y-axis.
Graph Horizontal Dilations of Sinusoidal
Functions
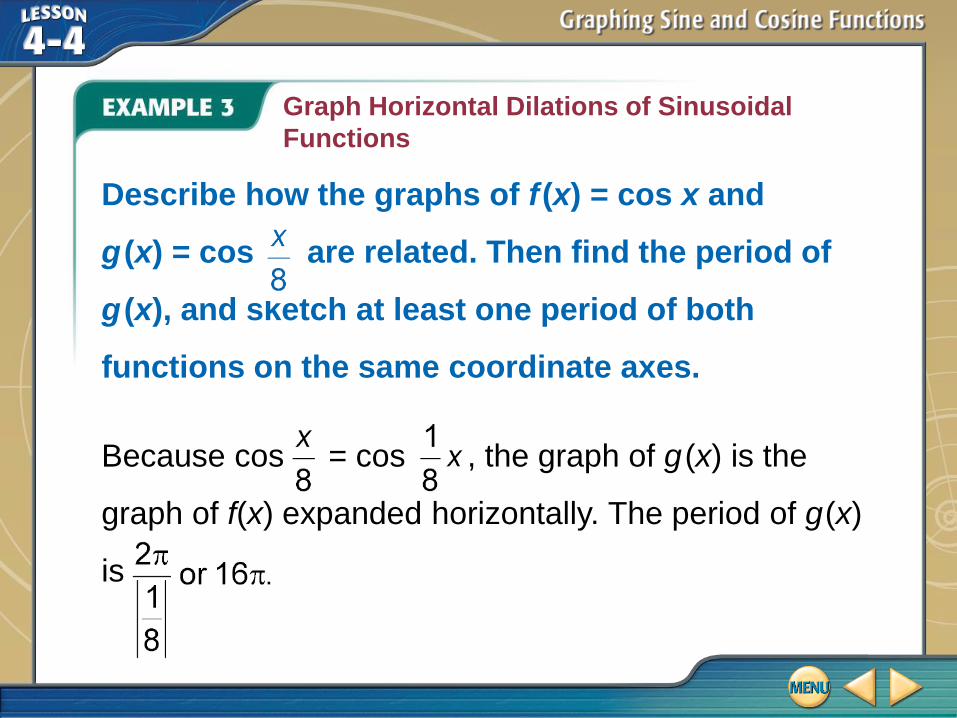
Describe how the graphs of f(x) = cos x and
g(x) = cos are related. Then find the period of
g(x), and sketch at least one period of both
functions on the same coordinate axes.
Because cos = cos , the graph of g(x) is the
graph of f(x) expanded horizontally. The period of g(x)
is
Graph Horizontal Dilations of Sinusoidal
Functions
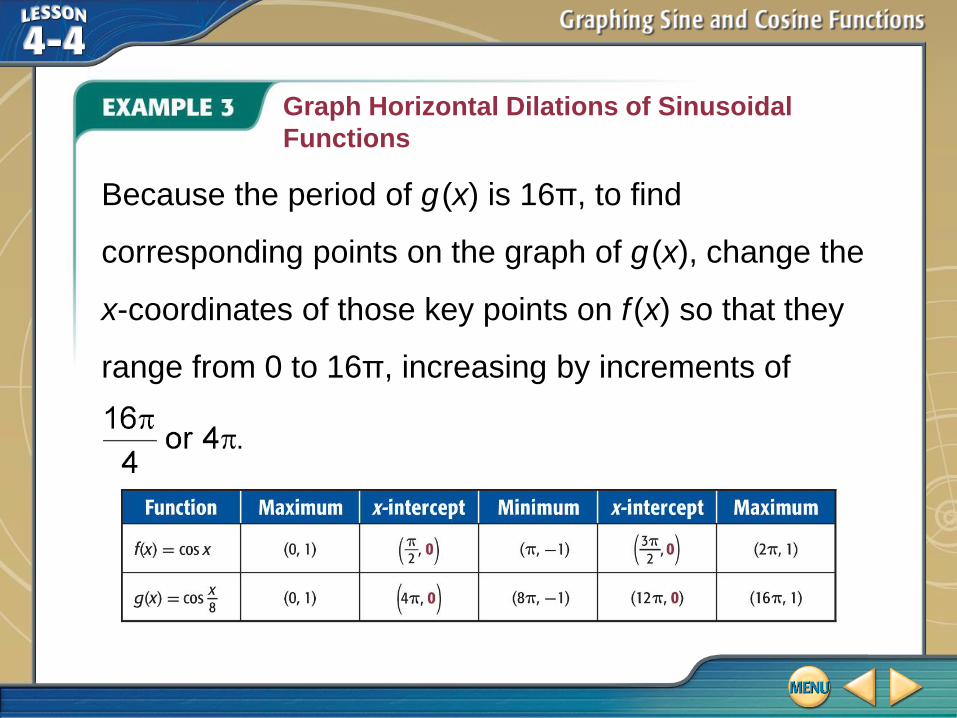
Because the period of g(x) is 16π, to find
corresponding points on the graph of g(x), change the
x-coordinates of those key points on f(x) so that they
range from 0 to 16π, increasing by increments of
Graph Horizontal Dilations of Sinusoidal
Functions
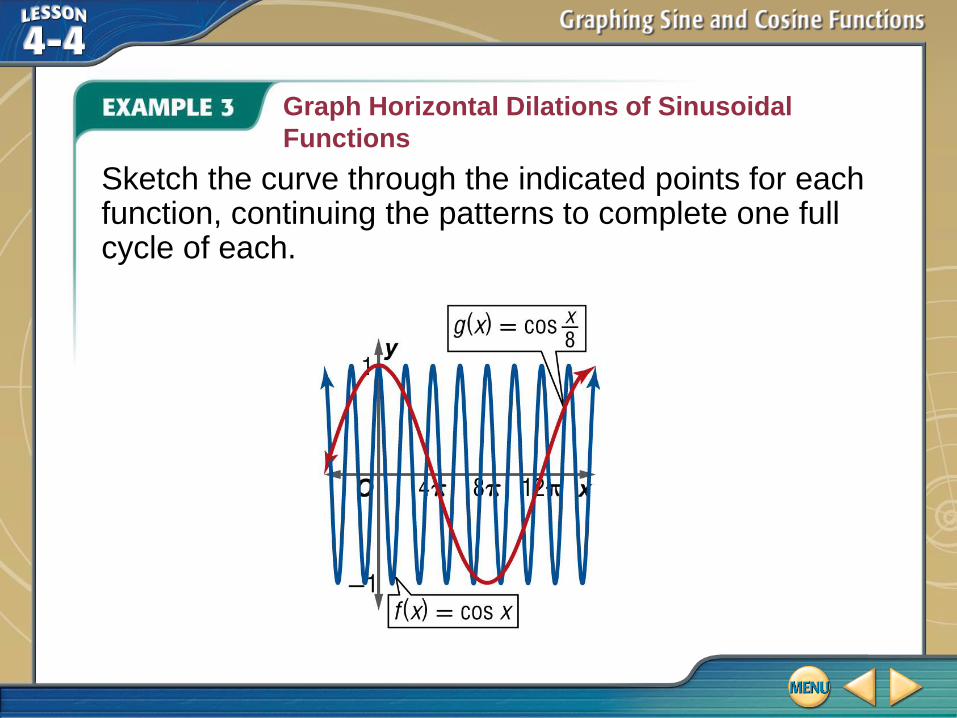
Sketch the curve through the indicated points for each function, continuing the patterns to complete one full cycle of each.

Graph Horizontal Dilations of Sinusoidal
Functions
Answer: The graph of g(x) is the graph of f(x) expanded horizontally by a factor of 8. The period of g(x) is 16π.
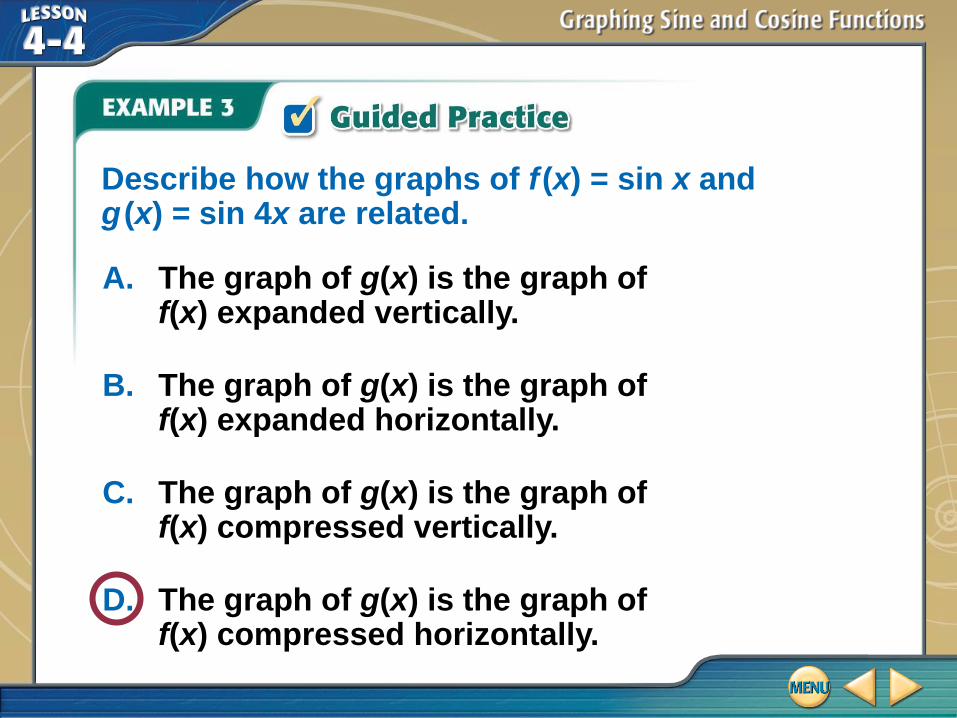
Describe how the graphs of f(x) = sin x and g(x) = sin 4x are related.
A. The graph of g(x) is the graph of f(x) expanded vertically.
B. The graph of g(x) is the graph of f(x) expanded horizontally.
C. The graph of g(x) is the graph of f(x) compressed vertically.
D. The graph of g(x) is the graph of f(x) compressed horizontally.
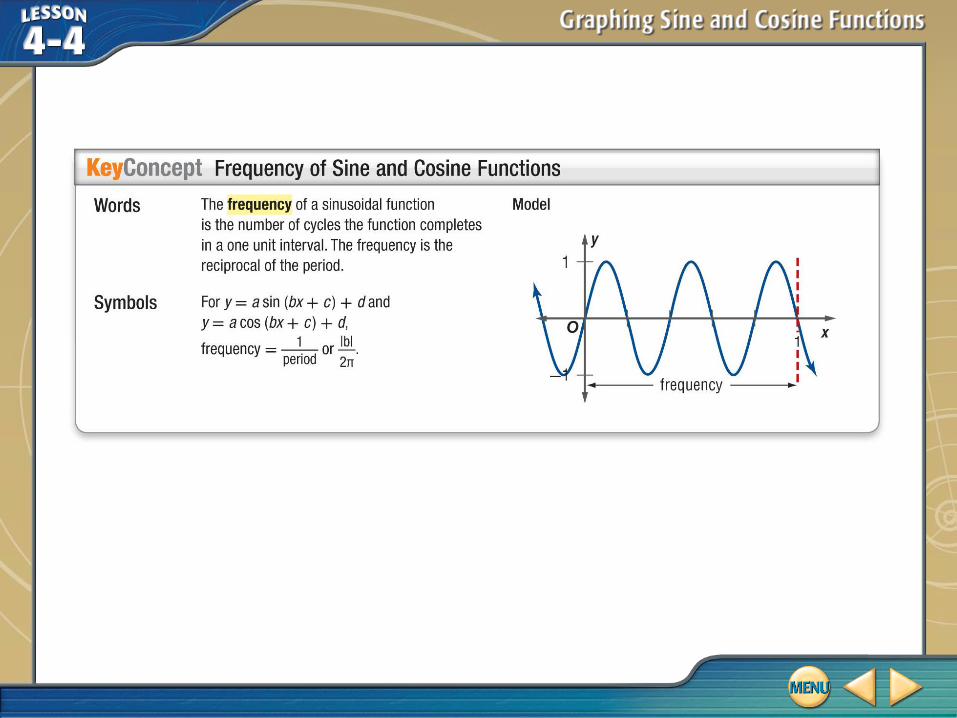
Use Frequency to Write a
Sinusoidal Function
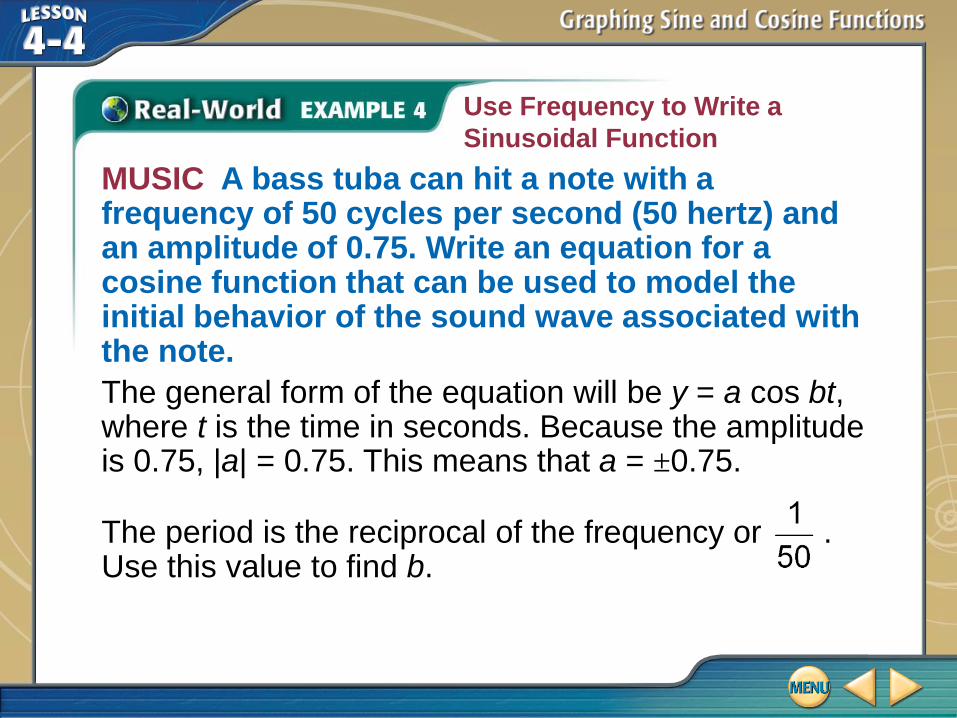
MUSIC A bass tuba can hit a note with a frequency of 50 cycles per second (50 hertz) and an amplitude of 0.75. Write an equation for a cosine function that can be used to model the initial behavior of the sound wave associated with the note.
The general form of the equation will be y = a cos bt, where t is the time in seconds. Because the amplitude is 0.75, |a| = 0.75. This means that a = ±0.75.
The period is the reciprocal of the frequency or . Use this value to find b.
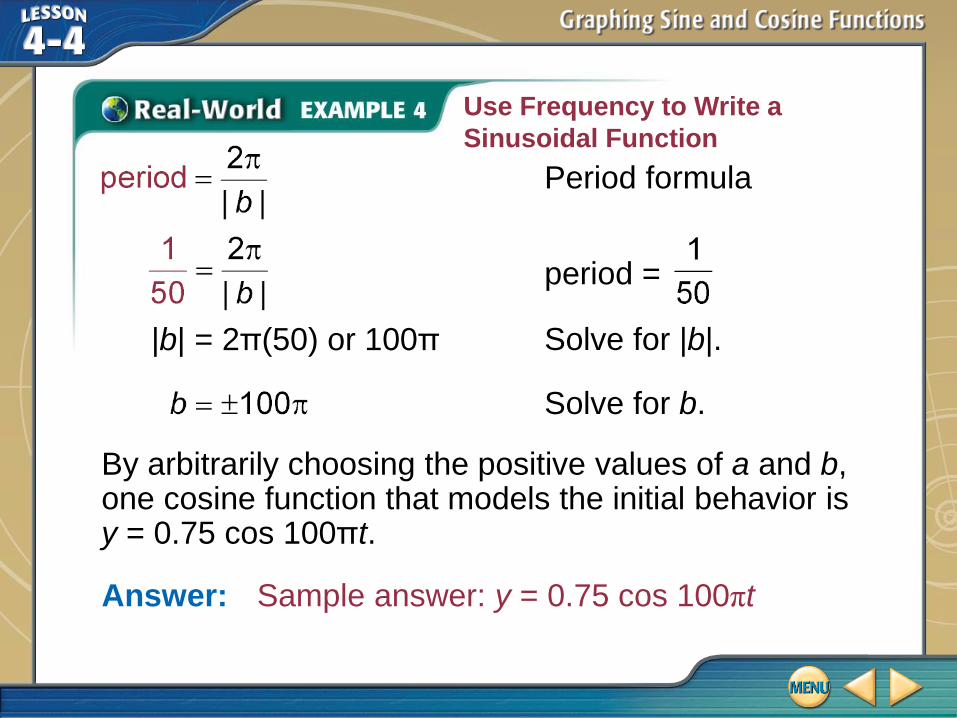
Answer: Sample answer: y = 0.75 cos 100πt
Use Frequency to Write a
Sinusoidal Function
By arbitrarily choosing the positive values of a and b, one cosine function that models the initial behavior is y = 0.75 cos 100πt.
Solve for |b|.|b| = 2π(50) or 100π
Solve for b.
period =
Period formula
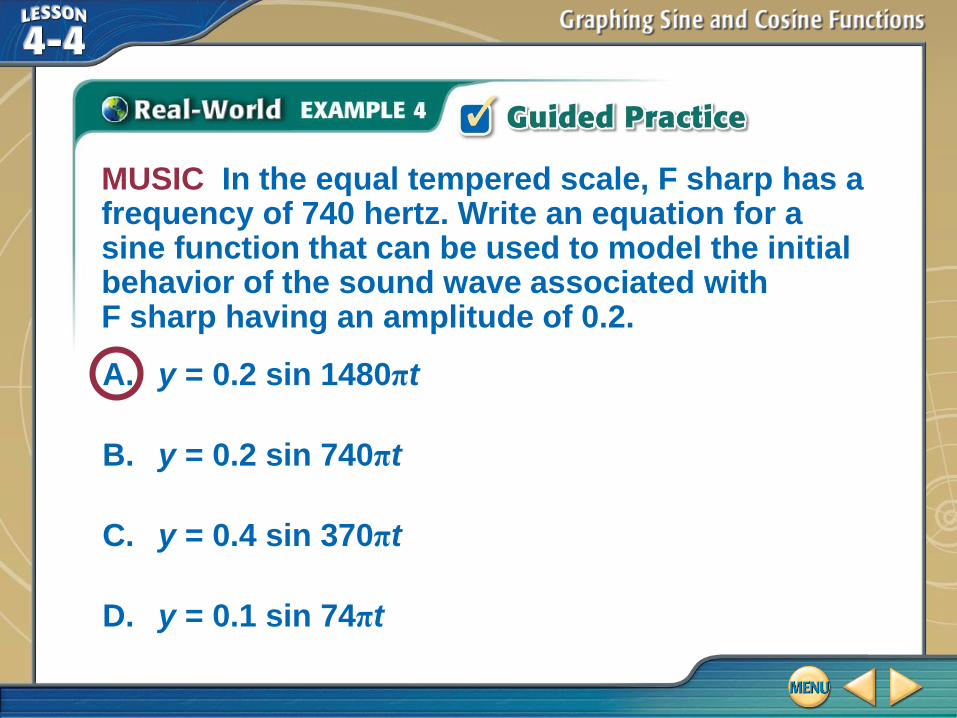
MUSIC In the equal tempered scale, F sharp has a frequency of 740 hertz. Write an equation for a sine function that can be used to model the initial behavior of the sound wave associated with F sharp having an amplitude of 0.2.
A. y = 0.2 sin 1480πt
B. y = 0.2 sin 740πt
C. y = 0.4 sin 370πt
D. y = 0.1 sin 74πt
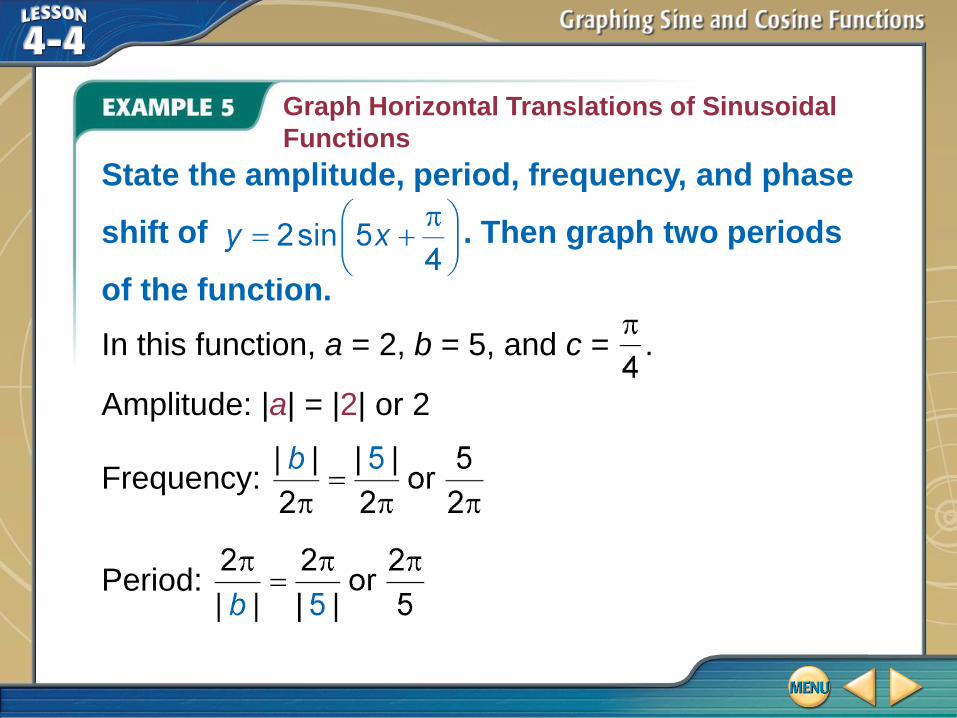
Graph Horizontal Translations of Sinusoidal
Functions
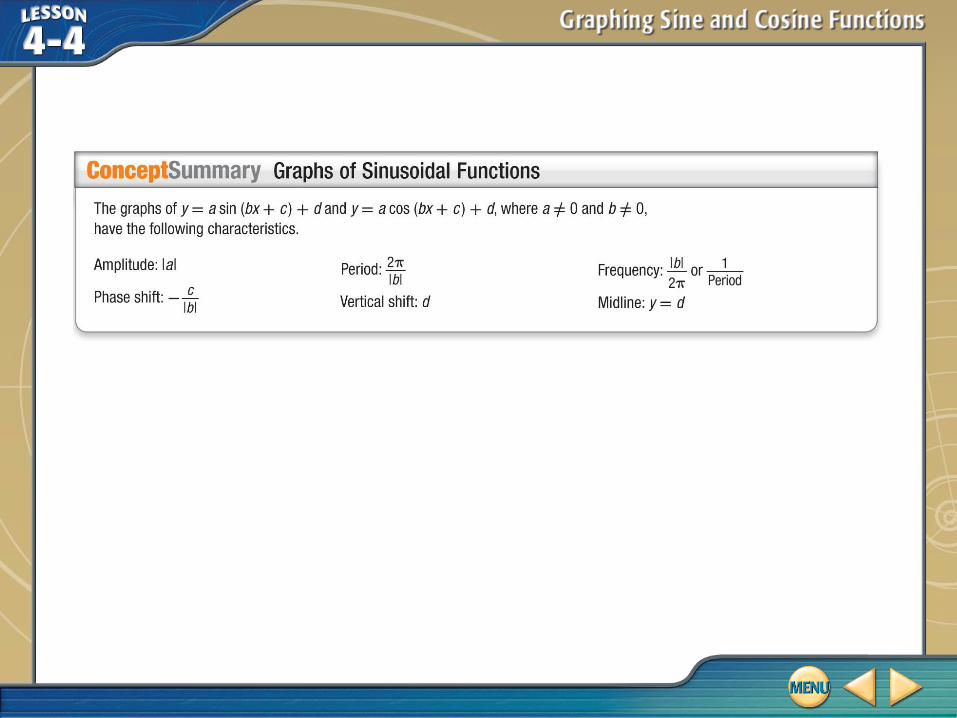
Amplitude: |a| = |2| or 2
State the amplitude, period, frequency, and phase
shift of . Then graph two periods
of the function.
In this function, a = 2, b = 5, and c = .
Period:
Frequency:
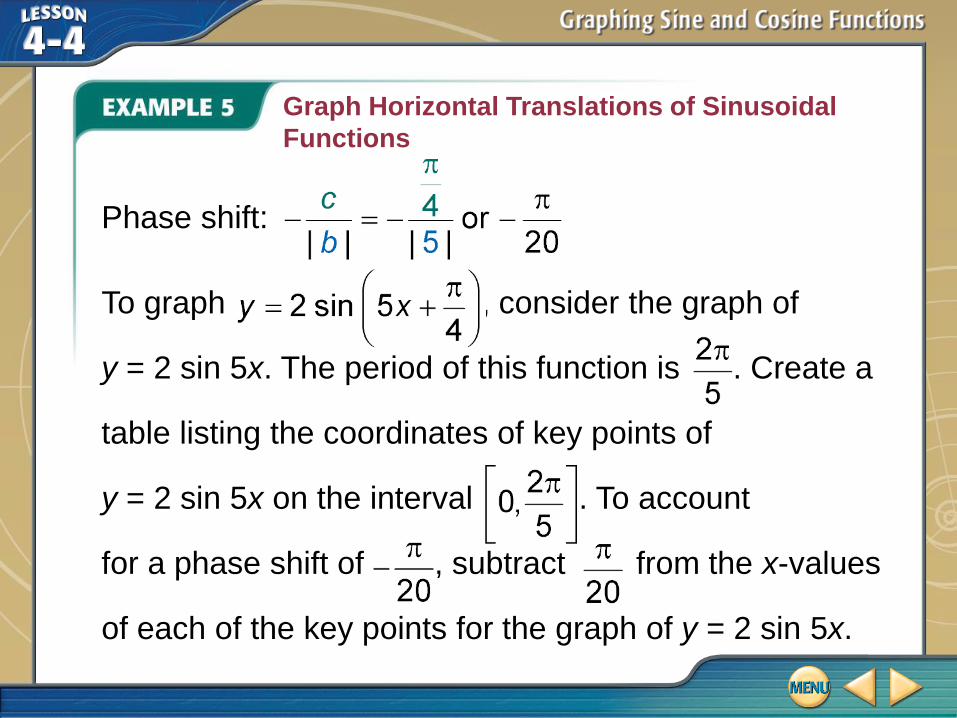
Graph Horizontal Translations of Sinusoidal
Functions
Phase shift:
To graph , consider the graph of
y = 2 sin 5x. The period of this function is . Create a
table listing the coordinates of key points of
y = 2 sin 5x on the interval . To account
for a phase shift of , subtract from the x-values
of each of the key points for the graph of y = 2 sin 5x.
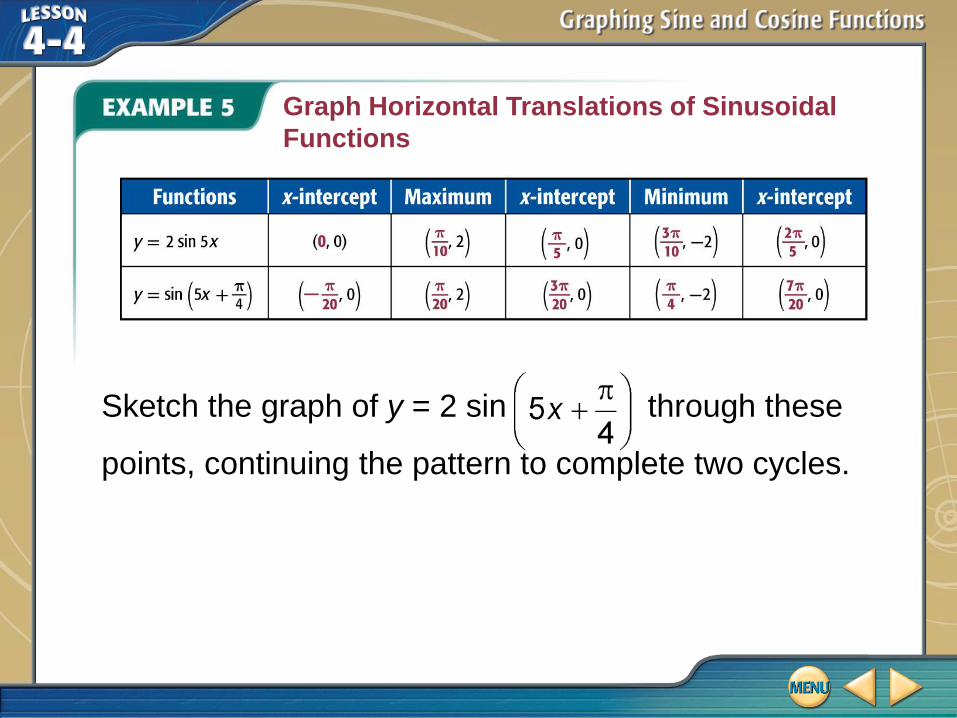
Graph Horizontal Translations of Sinusoidal
Functions
Sketch the graph of y = 2 sin through these
points, continuing the pattern to complete two cycles.
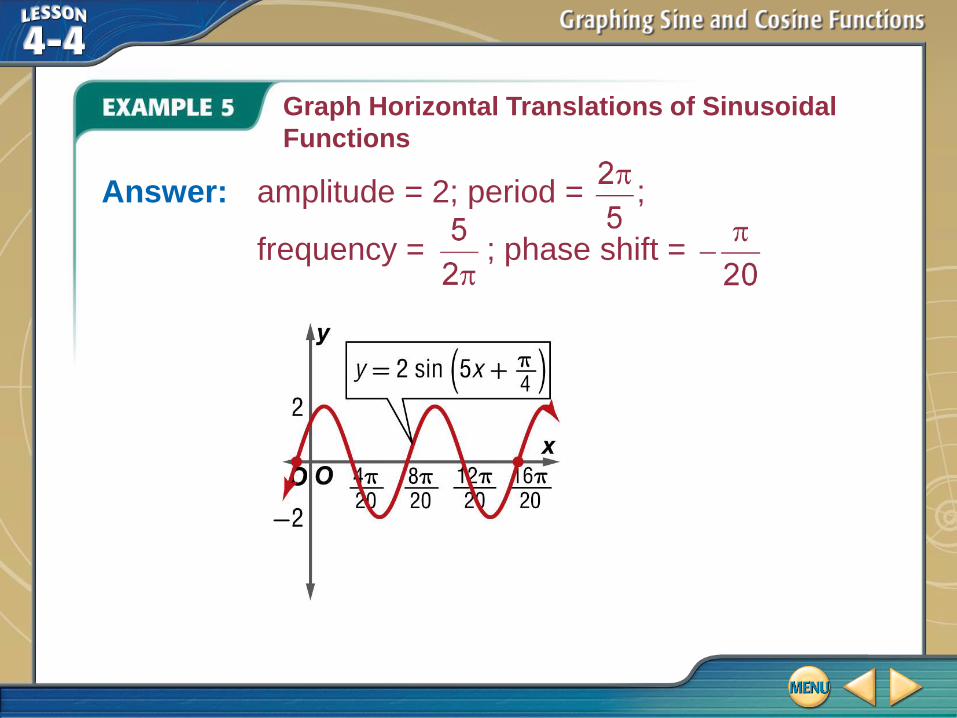
Graph Horizontal Translations of Sinusoidal
Functions
Answer: amplitude = 2; period = ;
frequency = ; phase shift =
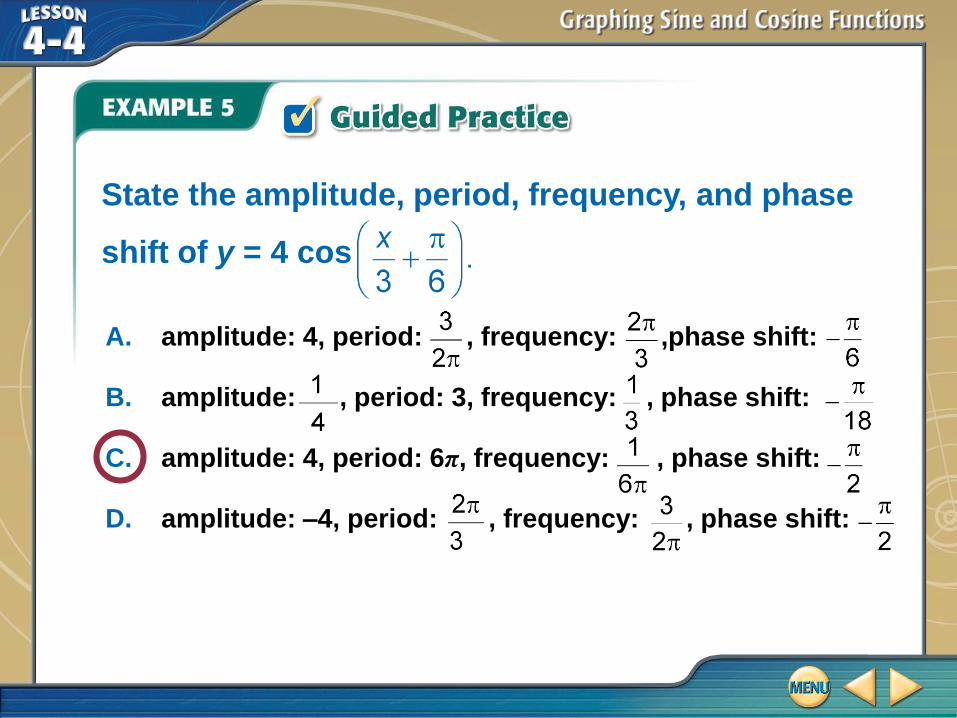
State the amplitude, period, frequency, and phase
shift of y = 4 cos
A. amplitude: 4, period: , frequency: ,phase shift:
B. amplitude: , period: 3, frequency: , phase shift:
C. amplitude: 4, period: 6π, frequency: , phase shift:
D. amplitude: –4, period: , frequency: , phase shift:
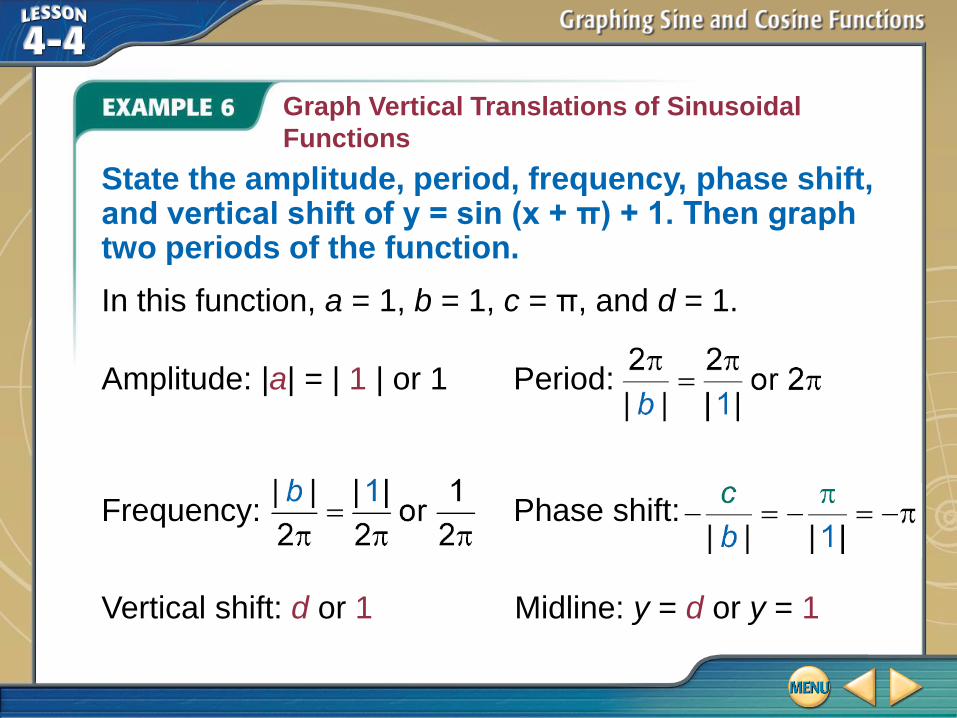
State the amplitude, period, frequency, phase shift, and vertical shift of y = sin (x + π) + 1. Then graph two periods of the function.
In this function, a = 1, b = 1, c = π, and d = 1.
Graph Vertical Translations of Sinusoidal
Functions
Amplitude: |a| = | 1 | or 1
Vertical shift: d or 1 Midline: y = d or y = 1
Period:
Frequency: Phase shift:
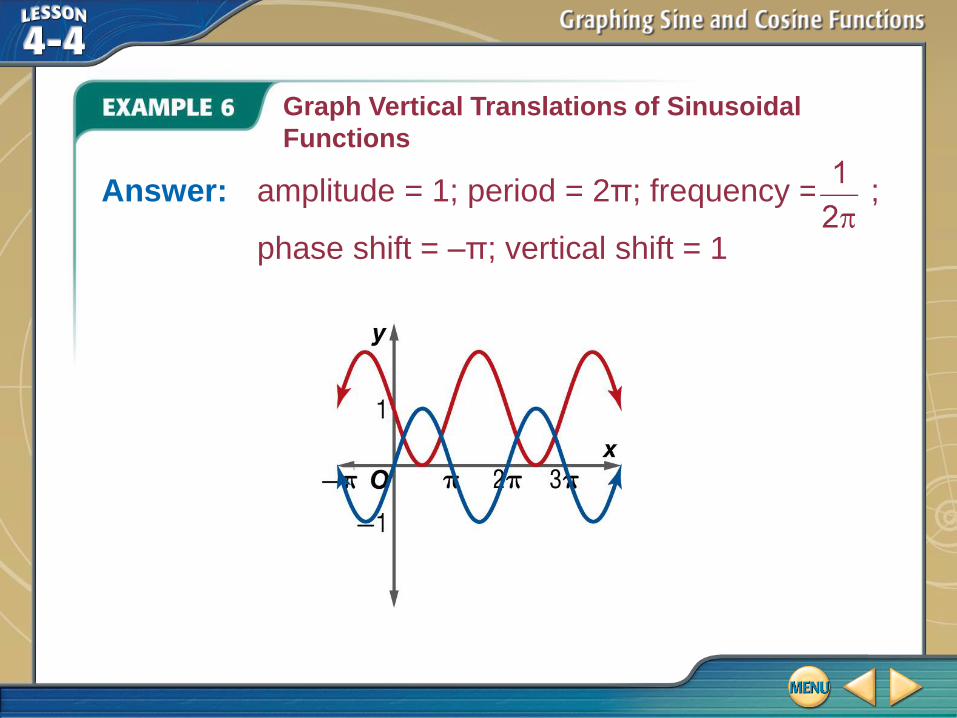
Graph Vertical Translations of Sinusoidal
Functions
Answer: amplitude = 1; period = 2π; frequency = ;
phase shift = –π; vertical shift = 1
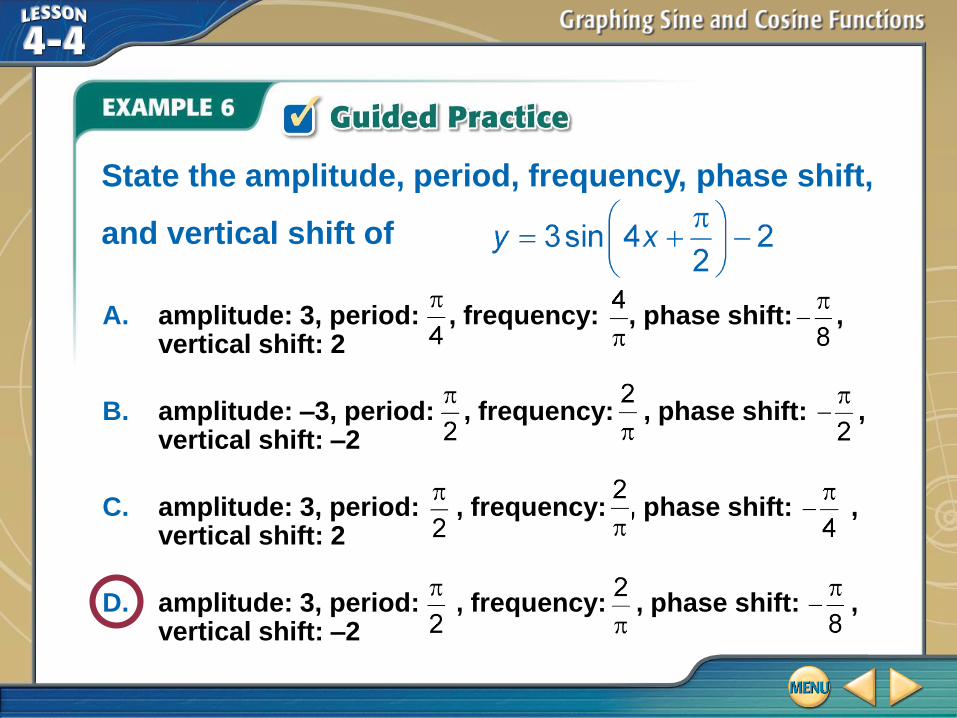
State the amplitude, period, frequency, phase shift,
and vertical shift of .
A. amplitude: 3, period: , frequency: , phase shift: , vertical shift: 2
B. amplitude: –3, period: , frequency: , phase shift: , vertical shift: –2
C. amplitude: 3, period: , frequency: , phase shift: , vertical shift: 2
D. amplitude: 3, period: , frequency: , phase shift: , vertical shift: –2
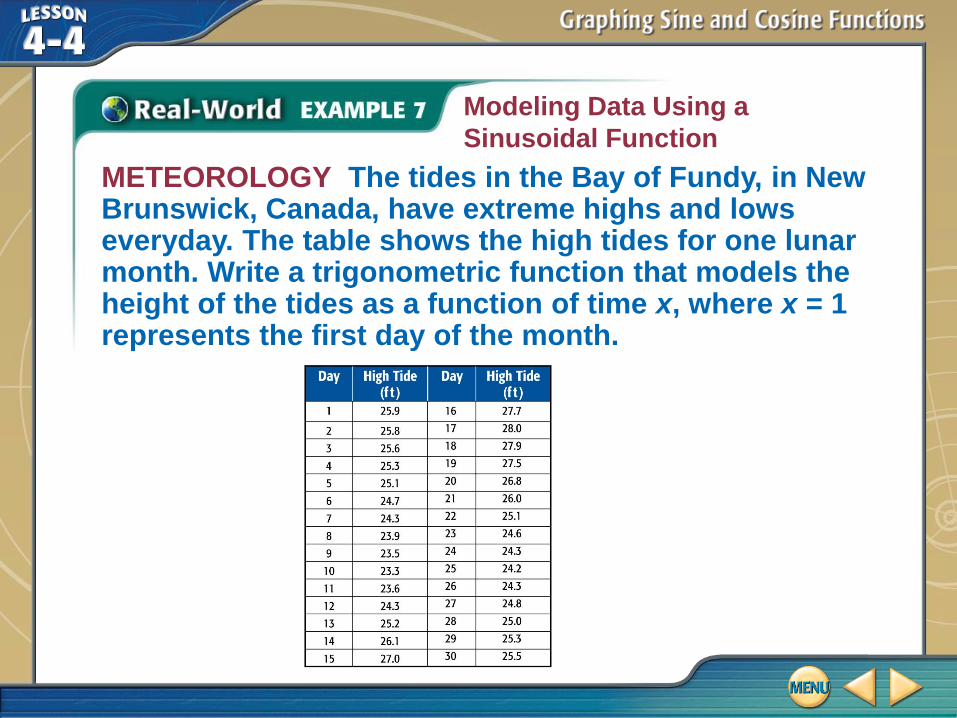
Modeling Data Using a
Sinusoidal Function
METEOROLOGY The tides in the Bay of Fundy, in New Brunswick, Canada, have extreme highs and lows everyday. The table shows the high tides for one lunar month. Write a trigonometric function that models the height of the tides as a function of time x, where x = 1 represents the first day of the month.
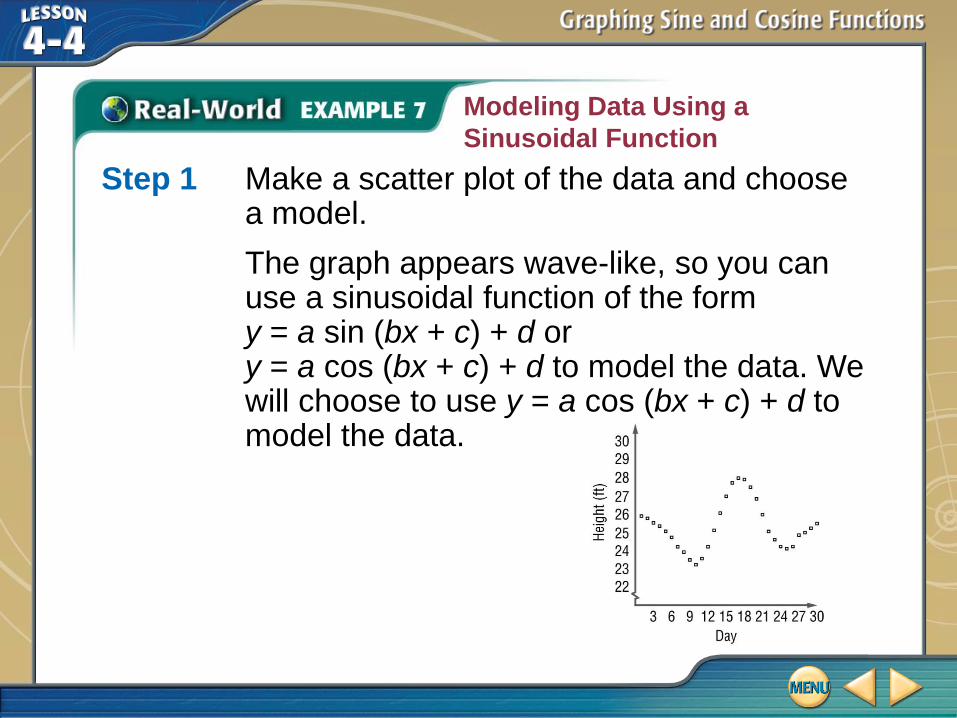
Modeling Data Using a
Sinusoidal Function
Step 1 Make a scatter plot of the data and choose a model.
The graph appears wave-like, so you can use a sinusoidal function of the form y = a sin (bx + c) + d or y = a cos (bx + c) + d to model the data. We will choose to use y = a cos (bx + c) + d to model the data.
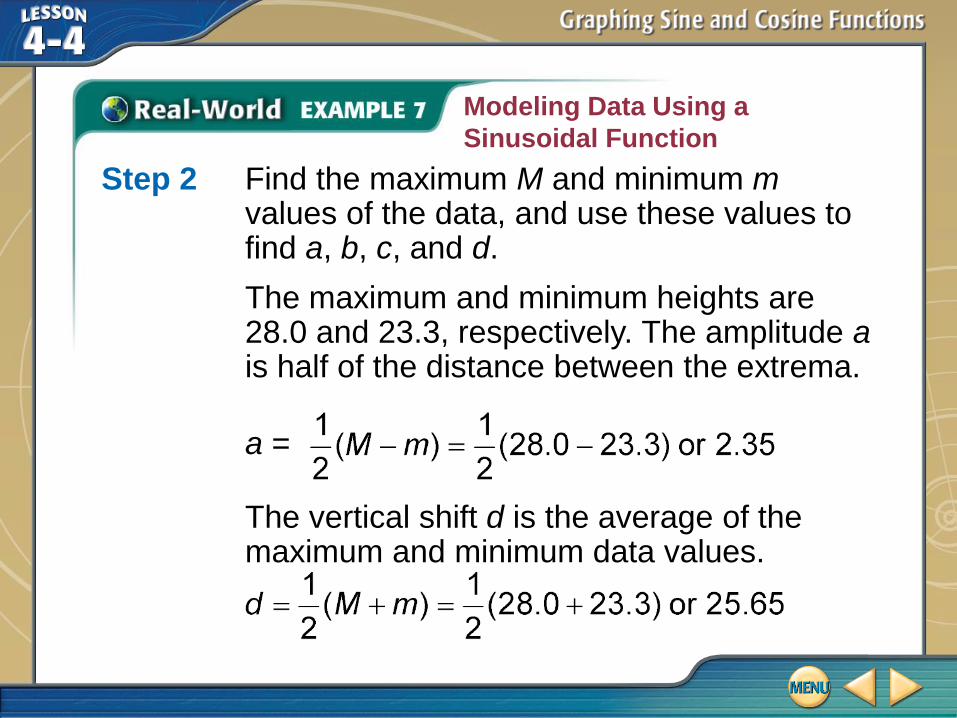
Modeling Data Using a
Sinusoidal Function
Step 2 Find the maximum M and minimum mvalues of the data, and use these values to find a, b, c, and d.
The maximum and minimum heights are 28.0 and 23.3, respectively. The amplitude ais half of the distance between the extrema.
a =
The vertical shift d is the average of the maximum and minimum data values.
Modeling Data Using a
Sinusoidal Function
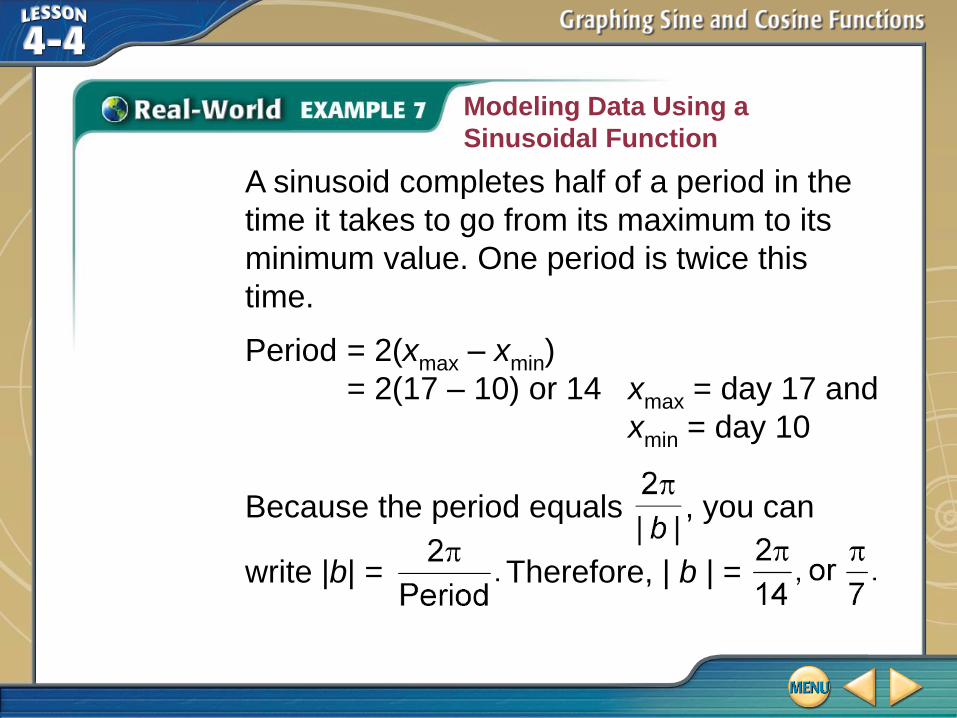
A sinusoid completes half of a period in the
time it takes to go from its maximum to its
minimum value. One period is twice this
time.
Period = 2(xmax – xmin)
= 2(17 – 10) or 14 xmax = day 17 and
xmin = day 10
Because the period equals , you can
write |b| = Therefore, | b | =
Modeling Data Using a
Sinusoidal Function
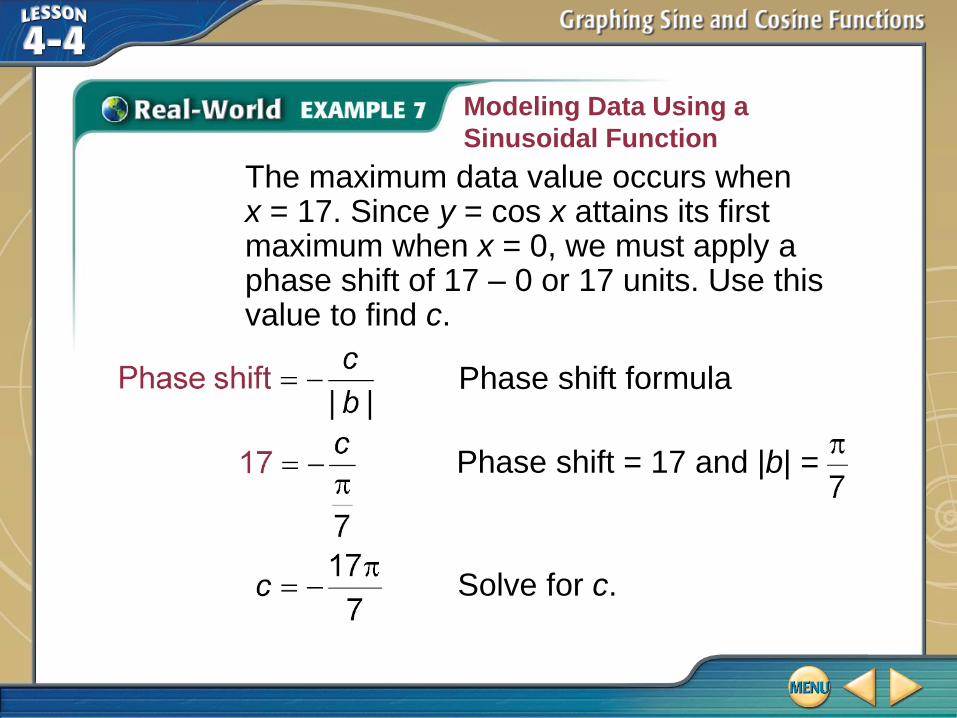
The maximum data value occurs when x = 17. Since y = cos x attains its first maximum when x = 0, we must apply a phase shift of 17 – 0 or 17 units. Use this value to find c.
Phase shift formula
Solve for c.
Phase shift = 17 and |b| =
Modeling Data Using a
Sinusoidal Function
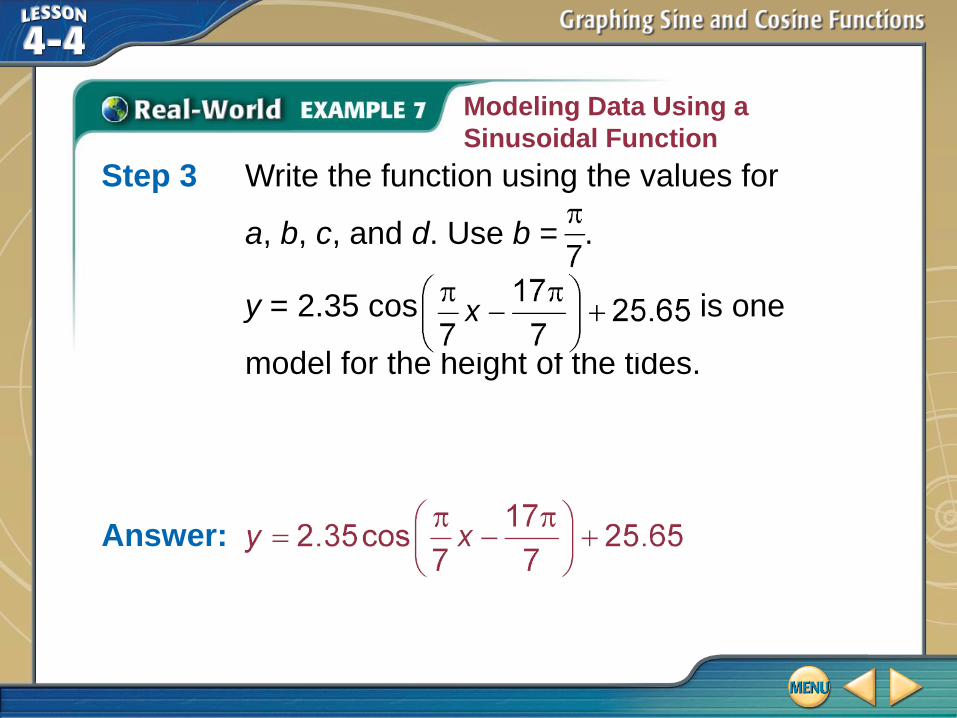
y = 2.35 cos is one
model for the height of the tides.
Answer:
Step 3 Write the function using the values for
a, b, c, and d. Use b = .
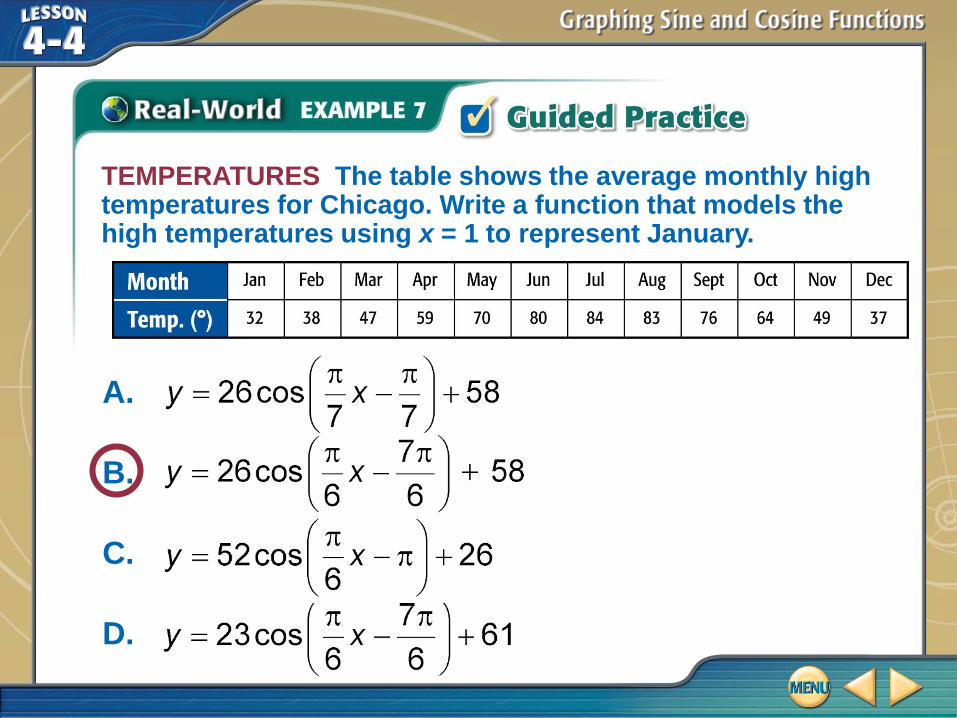
TEMPERATURES The table shows the average monthly high temperatures for Chicago. Write a function that models the high temperatures using x = 1 to represent January.
A.
B.
C.
D.