yıl/year - dergipark
TRANSCRIPT
Yıl/Year: 2019 Ay/Month: Ekim/October Cilt/Volume: 5 Sayı/Issue: 3
ISSN:2548-0162 https://dergipark.org.tr/tr/pub/gjeb
Sahibi (Owner)
Prof. Dr. Aydın Karapınar
Gazi Akademik Yayıncılık
Dergi İletişim (Journal Contact)
Elektronik posta (e-mail)
Web sayfası (Web page)
https://dergipark.org.tr/tr/pub/gjeb
Makale Gönderimi /Submit a Manuscript
https://dergipark.org.tr/tr/journal/346/submis-
sion/start
Yayın Merkezi (The Publication Centre)
Gazi Akademik Yayıncılık
Mebusevleri Mah. Önder Cad. No:32/1
Çankaya, 06570 Ankara, TURKEY
Tel: +90 312 231 61 11
Fax: +90 312 231 61 16
www.gazipublishing.com
Yayının Türü / The Type of Publication
Uluslararası Süreli Yayın / International Periodical
Journal
Hakemli Dergi/ Refereed Journal
Yayın Periyodu / Publication Period
Yılda üç sayı (Şubat-Haziran-Ekim) /
Tri-annual (February-June-October)
Yayın Dili / Publication Language
Türkçe ve İngilizce / Turkish and English
Tasarım/Designed by
Gazi Kitabevi Tic. Ltd. Şti.
Ankara, Turkey
Tel: 0312 223 77 73
Faks: 0312 215 14 50
www.gazikitabevi.com.tr
Yıl/Year: 2019 Ay/Month: Ekim/October Cilt/Volume: 5 Sayı/Issue: 3
ISSN:2548-0162 https://dergipark.org.tr/tr/pub/gjeb
Baş Editör /Editor in Chief
Aydın Karapınar (Ph.D., Prof., Ankara HBV University, Turkey)
Editörler (Managing Editors)
Figen Zaif (Ph.D., Prof., Ankara HBV University, Turkey)
Murat Atan (Ph.D., Prof., Ankara HBV University, Turkey)
Belgin Aydıntan (Ph.D., Prof., Ankara HBV University, Turkey)
Abdulkadir Köroğlu (Ph.D., Asst. Prof. Ankara HBV University, Turkey)
Editör Yardımcıları/Editorial Assistants
Cemre Eda Erkılıç (Ph.D., Lecturer, Ankara HBV University, Turkey)
Tuba Yumuşak (Ph.D., Lecturer, Anakar HBV University, Turkey
Yabancı Dil Editörü/Foreign Language Editor
Şahnaz Koçoğlu (Ph.D., Research Assistant, Ankara HBV University, Ankara)
Cihat Erbil (Ph.D., Research Assistant, Ankara HBV University, Ankara
Danışma Kurulu/Advisory Board
Ceyhun Çağlar Kılıç (Ph.D., Assoc. Prof., Akdeniz University, Turkey)
Dilaver Tengilimioğlu (Ph.D., Prof., Atılım University, Turkey)
Eray Çelik (Ph.D., Assoc. Prof., Yüzüncü Yıl University, Turkey)
Erdal Tanas Karagöl (Ph.D., Prof., Yıldırım Beyazıt University, Turkey)
Esin Cakan (Ph.D., Assoc. Prof., University of New Haven, USA)
Fernando Polo Garrido (Ph.D., Prof., Universitat Politecnica De Valencia, Spain)
Francissa Blasco Lopez (Ph.D., Prof., Universidad Comlutense de Madrid, Spain)
Hasan Kaval (Ph.D., Prof., Atılım University, Turkey)
Jülide Yıldırım Öcal (Ph.D., Prof., TED University, Turkey)
Metin Toprak (Ph.D., Prof., İstanbul University, Turkey)
Mehmet Altınöz (Ph.D., Assoc. Prof., Hacettepe University, Turkey)
Mehmet Yeşiltaş (Ph.D., Prof., Girne American University, Cyrus)
Murat Atan (Ph.D., Prof., Ankara HBV University, Turkey)
Latif Öztürk (Ph.D., Prof., Kırıkkale University, Turkey)
Veysel Yılmaz (Ph.D., Prof., Osmangazi University, Turkey)
Yıldız Ayanoğlu (Ph.D., Prof., Ankara HBV University, Turkey)
Fatih Sarıoğlu (Ph.D., Prof., Istanbul Medeniyet University, Turkey)
Yıl/Year: 2019 Ay/Month: Ekim/October Cilt/Volume: 5 Sayı/Issue: 3
ISSN:2548-0162 https://dergipark.org.tr/tr/pub/gjeb
Gazi İktisat ve İşletme Dergisi
Gazi Akademik Yayıncılık çatısı altında internet ortamında açık erişimli ve yılda üç sayı olarak yayımlanan
hakemli bir dergidir.
Bu dergide ileri sürülen fikirler makalelerin yazarlarına ait olup
Gazi İktisat ve İşletme Dergisinin görüşlerini yansıtmaz.
Taranan İndeksler/Indexing

Yıl/Year: 2019 Ay/Month: Ekim/October Cilt/Volume: 5 Sayı/Issue: 3
ISSN:2548-0162 https://dergipark.org.tr/tr/pub/gjeb
İÇİNDEKİLER / CONTENTS
1. Are Children a Normal Good or an Inferior Good? A Critique to the Neoclassical Theory
Çocuklar Normal Mal Mıdır, Yoksa Düşük Mal Mıdır? Neoklasik Teoriye Bir Eleştiri
Fuat Sekmen……….…………...………………………………………………………….........152-159
2. Financial Distress Of Adults: A Survey In Eskişehir, Turkey
Yetişkinlerde Finansal Sıkıntı: Türkiye, Eskişehir’de Bir Anket Uygulaması
Özlem Sayılır, Zeynep İlhan, Veysel Yılmaz ............................................................................ 160-169
3. TOPSIS Yönteminde Maliyet ve Karlılık Oranlarının Kullanılmasıyla Finansal Performansın
Ölçümü: Ana Metal Sanayi Sektöründen Bir Şirket Örneği
Measurement of Financial Performance by Using Cost and Profitability Ratios in TOPSIS Method: The
Case of a Company in the Iron and Steel Industry
Murat Yıldırım, Ömer Karakaya, İnci Merve Altan .............................................................. 170-181
4. Kadın Girişimciliğin Bibliyometrik Durum Analizi
Bibliometric Status Analysis of Women Entrepreneurship
Tuba Yumuşak .......................................................................................................................... 182-192
5. The Mediating Role of Organizational Commitment in the Organizational Justice’s Effect on
Job Satisfaction and Turnover Intention: A Research on Academic Staff
Örgütsel Adaletin İş Tatmini ve İşten Ayrılma Niyetine Etkisinde Örgütsel Bağlılığın Aracı Rolü:
Akademisyenler Üzerine Bir Araştırma
Edip Sabahattin Mete, Alev Sökmen ........................................................................................ 193-205
6. An Empirical Evidence on the Causality between Sectoral Economic Growth and Financial
Development in Turkey
Türkiye'de Sektörel Ekonomik Büyüme ile Finansal Gelişme Arasındaki Nedensellik Üzerine Ampirik
Bir Uygulama
Çiğdem Kurt Cihangir ............................................................................................................... 206-215
ISSN: 2548-0162 © 2019 Gazi Akademik Yayıncılık
Gazi İktisat ve İşletme Dergisi, 2019; 5(3): 152-159 https://dergipark.org.tr/tr/pub/gjeb
Are Children a Normal Good or an Inferior Good? A Critique to the
Neoclassical Theory1
Fuat Sekmen
Prof. Dr., Sakarya Üniversitesi, Siyasal Bilgiler Fakültesi, İktisat Bölümü, Sakarya, 54187, TURKEY,
e-posta: [email protected] ORDIC ID: https://orcid.org/0000-0002-8854-8737
ARTICLE INFO
ABSTRACT
Received: 24.01.2019
Accepted: 09.09.2019
Available online:24.10.2019 Article Type: Research
article
This study analyzes the neoclassical theory on the demand for children.
Neoclassical theory assumes that child demand is not different from a
commodity demand. The neoclassical theory takes child demand in the
utility function, like any other commodities. But, the demand for children
is different from things which increase our utility; such as car,
refrigerator, elevator, and other goods and services, whose price is
determined in the market through its sellers and buyers. However,
demand for children is determined by socio-cultural things. It is certain
that there is a relationship between economic growth and child rearing.
For example, economic growth raises the cost of children due the time
spent on child care becoming more valuable. But it cannot be called "child
demand is an inferior good".
Keywords: Demand for children,
economic growth, desired family size,
Neo-classical approach
Çocuklar Normal Mal Mıdır, Yoksa Düşük Mal Mıdır? Neoklasik Teoriye Bir
Eleştiri
MAKALE BİLGİSİ
ÖZ
Geliş Tarihi: 24.01.2019
Kabul Tarihi: 09.09.2019
Çevrimiçi Kullanım
Tarihi: 24.10.2019
Makale Türü: Araştırma
makalesi
Bu çalışma neoklasik teoriyi çocuk talebi üzerine analiz etmektedir.
Neoklasik teori çocuk talebinin herhangi bir mal talebinden farksız
olduğunu varsaymaktadır. Bu bakış açısından hareketle çocuk talebi,
diğer tüm mallar gibi, fayda fonksiyonu içerisine dahil edilir. Ne var ki
çocuk talebi faydamızı artıran araba, buzdolabı, asansör ve diğer mal ve
hizmetlerden farklıdır, zira bu tür malların fiyatları piyasada satıcılar ve
alıcılar tarafından belirlenir. Çocuk talebi ise sosyo-kültürel gerçeklikler
tarafından tayin edilir. Ekonomik büyüme ve çocuk yetiştirme arasında
bir ilişki olduğu muhakkaktır. Örneğin, iktisadi büyümeyle birlikte
çocuğa ayrılan vakit daha değerli hale geldiği için çocuk maliyetini de
artırmıştır. Yine de bu sonuç çocuk talebinin bir düşük mal olduğunu
göstermez.
Anahtar Kelimeler:
Çocuk talebi, ekonomik
büyüme, düşük mal,
neoklasik yaklaşım
1.Introduction
This study aims to raise awareness that the tools of neo-classical approach cannot be implemented
in each field. According to Neo-classical approach, the determination of goods, outputs, and income
Doi: https://dx.doi.org/10.30855/gjeb.2019.5.3.001
Sekmen, F. Gazi İktisat ve İşletme Dergisi, 2019; 5(3): 152-159
ISSN: 2548-0162 © 2019 Gazi Akademik Yayıncılık 153
distributions in markets is based on supply and demand conditions. Supply and demand together
determine equilibrium price and quantity. If all other things being equal, the higher the price of a good,
the less people will demand that goods. Also, neo-classical economics rest on rational choice theory, in
which individuals strive utility maximization with constrained income; firms struggle to realize profit
maximization with given production costs, and people act independently on the basis of full and relevant
information. In neo-classical theory, there is a certain justification of any act of firms or individuals; for
example, a firm’s layoff decisions are based on a balance between the benefits of laying off an additional
worker and the costs associated with this behavior. From the neo-classical point of view, there is
rationality behind the decision of a student who has to work and thus cannot regularly attend to the class
and thus passes with a low grade. Like firms’ layoff decision, a student’s nonattendance to class is based
on rationality. A theory which assumes that a student’s nonattendance decision is based on a balance
between the benefits of working in a job and the costs associated with that action will be a neo-classical
theory. Thus, rationality can be defined as all means to achieve ends.
Caplan (2006) expresses that in modern neoclassical economics, rationality includes responsiveness
to incentives. From this point of view, everything is normal and rational to achieve the goal. Why do
suicide bombers commit a crime even they know that they will surely die? Can we say that terrorists are
not rational? Caplan, in his defense of the rational choice model, relies on responsiveness to incentives
and makes logical and forceful explanations. For rational expectations, Caplan admits that terrorists
have some rather irrational beliefs, but attempts to defend rational expectations by claiming that
individuals form their irrational beliefs rationally. There is no doubt that Caplan does not have any idea
about what Holy book says: "if a person whoever kills an innocent, it is as if he has killed all mankind;
and whoever saves a person, it is as if he has saved all mankind.”
This study emphasizes that some human behavior may not be explained in the context of the
framework of neoclassical economics because all the results of human actions cannot be calculated
precisely, meaning that benefits and costs of all human actions cannot be determined as explained above.
Thus, Caplan's interpretation of the suicide bomber is not true, because God reveals that the one who
kills an innocent person will not go to heaven and it is assumed that he kills all humanity. Calculating
benefit and cost is not always possible and not rational as well. However, there are studies in the
literature that explain the behavior of some human actions; for example, fertility in consumer theory.
Gary Becker (1960) and Leibenstein (1974) have the pioneering works in the area of microeconomic
theory of fertility. These economists applied microeconomic tools in order to understand fertility
behavior and demand for children. The basic question is that whether the decline in child demand is a
result of income growth or from an increase in the absolute or relative cost of children. If we claim that
the demand for children has fallen as a result of the increase in income, we also accept that the demand
for children is different from normal goods demand, that is, it is inferior goods.
Studies that examine household behavior generally take into account expenditure and savings of
households, factors which determine household expenditure and savings or factors that determine
investments. However, this study analyzes the household's demand for children. The emphasis is that
the demand for children is strictly different from that of goods and services.
It is a fact that child demand and fertility rate have been declined, but this fact does not mean that
child demand and goods demand have the same law and rules. With the increase in the level of education,
the increase in the age of marriage has caused people to have fewer children. When this situation is
expressed in terms of the microeconomic context, the fertility rate has decreased with the increase in the
relative cost of children and result in an appropriate adjustment in decreasing child demand.
For the last 50 years, many demographers have expected that industrialization would decrease
fertility rates, thus family sizes fell with industrialization. Graph 1 shows that fertility rates are falling
steadily since 1960. Also, Graph 2 shows GDP per capita with current US dollars has increased
regularly, except for certain years, such as currency crises and depression years. According to this
explanation, the following hypothesis can be set up:
If it is assumed that all other things being constant, the more a country has higher GDP, the lower
the fertility rate she has.

Sekmen, F. Gazi İktisat ve İşletme Dergisi, 2019; 5(3): 152-159
ISSN: 2548-0162 © 2019 Gazi Akademik Yayıncılık 154
This hypothesis ignores some assumptions; for example, it does not consider increasing the number
of years that women are in school delays marriage, which in turn reduces the time duration that women
are exposed to the possibility of conception. Also, women’s labor participation has been increased with
education and the age of marriage has risen compared to previous years; for example, In Turkey, the age
of marriage is 31 for men, while the age of marriage for women is 28. In the 1960s, it is a normal result
that fertility was high when the age of marriage was 15 for women and 18 for men. In addition to change
in marriage age and duration of education, contraception and necessity of birth control increased with
education. All these changes have caused women to have fewer children. What should be noted here is
that women have fewer children than they desire. That is, as the level of income increases, the hypothesis
that fewer children are demanded can be evaluated as being correct without examining other factors, but
the decline in fertility and decrease in child demand depend on increase in education level and the delay
of marriages, meaning less demand for children is as a result of demographic and social change in
society.
Dixon- Mueller (1993) suggests that women's participation in the labor market has given women a
new identity and economic power. Thus, the dependence of women on men and children has been
reduced. Dixon-Mueller concludes that women's level of education and women's labor participation,
together with other commonly considered socioeconomic variables, including percentage of married
couples using contraception, are important in quantifying the variation in total fertility rate.
Thus, can we make the following hypothesis?
Industrialization has reduced the demand for children.
There are two facts: The first is that the industrialization reduces demand for children, and the
second is that children do not become inferior goods with increase in income. As the hypothesis implies,
the increase in the level of education of women and the increase in their participation in the labor market
lead to a decrease in the dependence of them on men and children. Industrialization and economic
growth raise the cost of children due the time spent on child care becoming more valuable. This may
not be true in the whole country. For example, rural fertility can be higher because the cost of rearing
when children contribute work to maintaining the farm is lower than in the city.
Turkey is considered as one of the emerging economy for several decades. Recently, we witnessed
that Turkey has elevated its status to an emerging power. Thus, it is important to see changes in fertility
rates and GDP in Turkey. Graph 1shows that fertility rates in Turkey have been significantly decreasing
since 1960s. On the other hand, as shown in graph 2, GDP per capita in Turkey with current US dollar
has been increasing since 1960s.
Graph 1. Fertility Rate in Turkey. (Source: Author’s own elaboration using WDI data).
2,000
3,000
4,000
5,000
6,000
7,000
60 65 70 75 80 85 90 95 00 05 10 15
Fertility Rates, total (births per woman)
Sekmen, F. Gazi İktisat ve İşletme Dergisi, 2019; 5(3): 152-159
ISSN: 2548-0162 © 2019 Gazi Akademik Yayıncılık 155
0
2,000
4,000
6,000
8,000
10,000
12,000
14,000
60 65 70 75 80 85 90 95 00 05 10 15
GDP per capita current US $
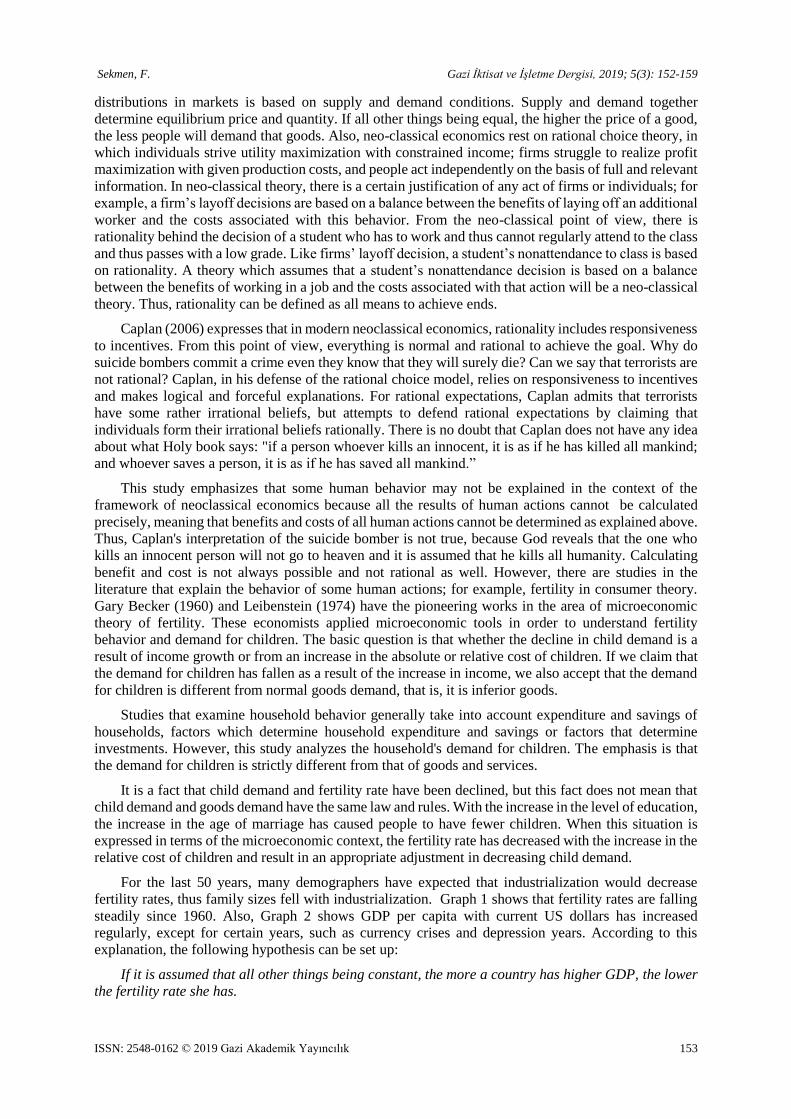
Figure 2. GDP per capita in Turkey with current US $. (Source: Author’s own elaboration using
WDI data).
Since the decline of the fertility rate started in France earlier than other countries, France has been
selected to represent the relationship between population growth and GDP in developed countries. The
reason for choosing France is the increase in fertility rate due to the longstanding family policies
implemented in recent years. Thus, France stands out from many European countries because of its
relatively high and stable fertility.
With the economic development of France and the rise in income levels, birth rates and population
growth rates have slowed down significantly since 1975. French government has begun to take measures
to increase birth rates in order to prevent the negative consequences of this situation. Posters that families
should have more children could be seen almost all over the country at that time. In addition to these
incentives, the French government allowed the migration of foreign workers from other countries,
especially Algeria, Morocco and Tunisia, in order to meet the labor needs.
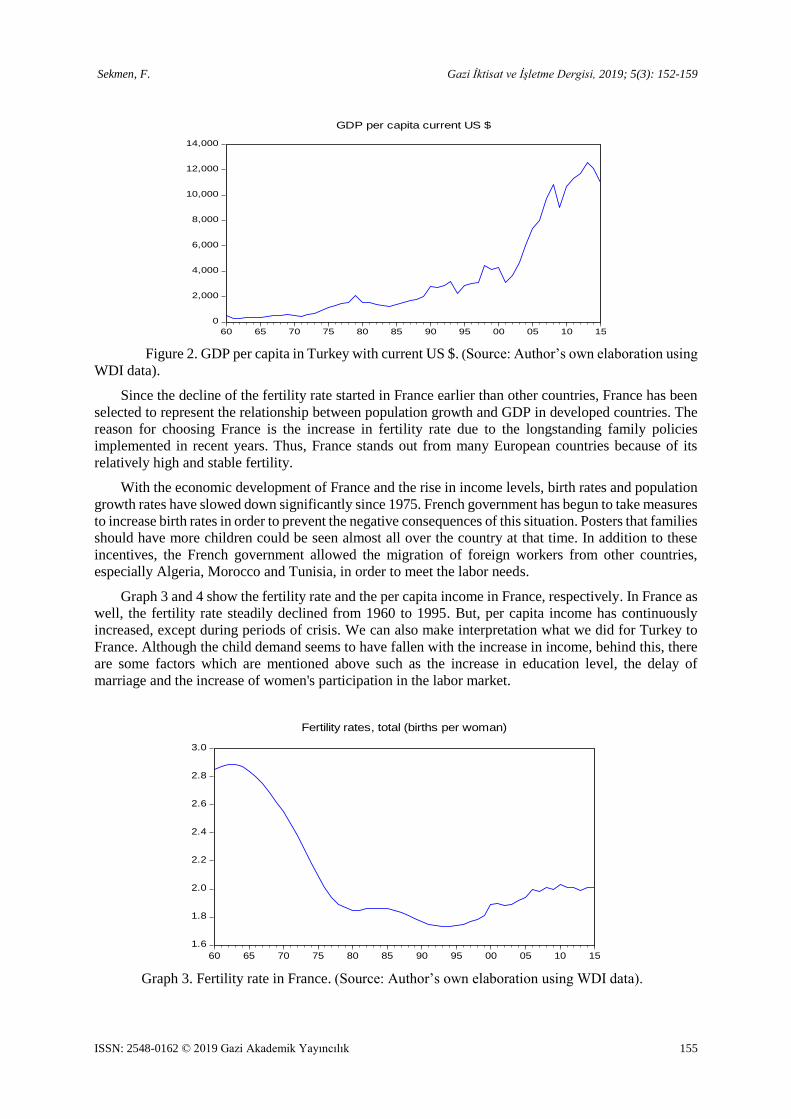
Graph 3 and 4 show the fertility rate and the per capita income in France, respectively. In France as
well, the fertility rate steadily declined from 1960 to 1995. But, per capita income has continuously
increased, except during periods of crisis. We can also make interpretation what we did for Turkey to
France. Although the child demand seems to have fallen with the increase in income, behind this, there
are some factors which are mentioned above such as the increase in education level, the delay of
marriage and the increase of women's participation in the labor market.
Graph 3. Fertility rate in France. (Source: Author’s own elaboration using WDI data).
1.6
1.8
2.0
2.2
2.4
2.6
2.8
3.0
60 65 70 75 80 85 90 95 00 05 10 15
Fertility rates, total (births per woman)

Sekmen, F. Gazi İktisat ve İşletme Dergisi, 2019; 5(3): 152-159
ISSN: 2548-0162 © 2019 Gazi Akademik Yayıncılık 156
0
10,000
20,000
30,000
40,000
50,000
60 65 70 75 80 85 90 95 00 05 10 15
GDP per capita current US $
Graph 4. GDP per capita with current US $ for France. (Source: Author’s own elaboration using
WDI data).
The explicit application of micro-economic methods to the analysis of child demand began in the
late 1950s and early 1960s when Leibenstein, Okun, Becker and others attempted to explain the effect
of the level of income and economic development on a family’s child demand (Cochrane, 1975).
An answer to what factors determine the number of children people will demand is given by Gary
Becker who places family-size goals in the framework of economic theory by treating children as a
consumption good analogous to cars, houses, and refrigerators (Blake, 1968).
Using the term ‘the economic approach’ to human behavior, Gary Becker and other neo-classical
economists forcefully argue that economic efficiency determines household behavior.2 They assume
that household seeks to maximize exogenously given joint utility functions, like any firm behavior to
maximize its profit, and they hypothesize that differences in household behavior represents efficient
responses to differences in prices and incomes which households face (Folbre, 1984). As it is known
that the theory of the firm assumes a profit maximization objective. Similarly, the theory of the consumer
effectively assumes utility maximization, with many restrictions on what provides utility. Neoclassical
economics focuses on prices, outputs, and income distributions in markets determined by demand and
supply.
According to Becker and other neoclassical economists, there must be a relationship between child
demand and income or standards of living. They state that as the rate of return to human capital and
education level increase, the cost of rearing children goes up. On the other hand, the opportunity cost of
mother’s time goes up as higher wages draw women out of the household into labor market, and finally
increase the cost of children. Therefore, the demand for children decreases and fertility level gradually
adjust as wages paid to women increase.
Also, in an article named ‘Child Endowments, and Quantity and Quality of Children’, Gary Becker
and Nigel Tomes (1976) include social interactions and special relation between quantity and quality of
children. And, Becker and Tomes conclude that large increase in expenditures on children would reduce
the demand for them because the cost of each child is directly related to the expenditure on each child.
In sum, it can be concluded that neoclassical theory states a negative relationship between the
quality of children and their size in the family since after a point, which shows the optimum child
demand, demand for children decreases.
2 It is known that the primary goal of neo-classical economics is to provide efficient allocation of scarce resources.

Sekmen, F. Gazi İktisat ve İşletme Dergisi, 2019; 5(3): 152-159
ISSN: 2548-0162 © 2019 Gazi Akademik Yayıncılık 157
2. Model
In this section, a child demand model will be created by using neoclassical tools. As it is known,
the concept of marginal change has an important meaning in neoclassical theory. Therefore, neoclassical
economists have been described as marginalists for a long time.
Since the neoclassical theory treats children as a commodity which is bought and sold and they also
have a price, children can be included in the utility function.
, , , i iU u C X Y L
where iU is utility of person i, C is demand for children,
iX demand for X commodity, Y is income
for i, and L is leisure.
Y wW
where w is wage rate, and W is working hours.
i i cY P X PC
where iP is the average price of commodities consumed by i.
T W L C . Where T is time spent on working, leisure, and on children.
In these conditions, what does determine child demand?
For this purpose, we need to reorganize the utility function and to get the derivative of the utility
function according to the child. Our aim is to find out how individual i’s utility changes when his/her
child demand changes?
, , ,ci i i c
i
Y PCU u C PX PC T W C
P
To find the ideal child demand, it needs to be taken derivatives with respect to child and equal those
derivatives to zero.
/ / / / / / 1 0i c i cU C U C U X P P U Y P U L
According to this model, child demand is a function of child price3 ( )cP , commodity price ( )iP ,
income ( )Y , and leisure (L) . This demand function can be expressed as followed:
* ( , , , )c iC f P P Y L
Now, suppose that consumer i’s wage rate increases. How does demand for children affected from
this increasing in wage rates?
In economic theory, income is a sole determinant to decide a good is a normal or an inferior one
because an inferior good is a good that is bought in smaller quantities as an individual’s income rises.
According to this definition, if children were normal goods, then their parents would demand more
children when they get richer. Thus, how the changes in wages and incomes affect child demand is
important. Therefore, only the effect of income change on child demand has been considered in the
model.
, , wW,T Ci
İ
wW PcC YU u C
P w
3 The price of the child includes all expenses incurred to the child and the time allocated to him or her.
Sekmen, F. Gazi İktisat ve İşletme Dergisi, 2019; 5(3): 152-159
ISSN: 2548-0162 © 2019 Gazi Akademik Yayıncılık 158
/ / / / / / 1 0i c iU C U C U X P P U Y Pc U L H
If the equation above is called as H, the implicit function theorem can be used to answer the
question.
*
*
/ w
/
C H
w H C
As it has been seen above, the implicit function consists of two parts, namely the numerator and the
denominator.
The numerator:
2 2 2 2
2 2
cc
i i i
PH U W U U W UW W P
w C X P C Y X P P Y
Sign: (+) (+) (-) (-) (+)
The sign of the numerator is positive.
Now, the denominator can be found as followed.
2
2 2 2 2 2 2
2 2 21 ( 1)( 1)c c c
i i i
P P PH U U U U U U
C C C X P C L X P X L P L
Sign: ?
+ - - - + + - - +
The main problem is to determine the sign of 2 2/U C because the sign of the second derivative
is ambiguous. If the second derivative of the utility function with respect to child demand is negative,
the sign of the denominator will be negative and this means that there is a positive association between
income and child demand. Thus, the derivative of child demand with respect to income has been found
positive. On the other hand, this result is completely different from the graph showing the increase in
income and the increase in population. Again, if the sign of 2 2/U C is accepted as positive, result
will be indeterminate.
*
*
/ w
/
C H
w H C
If it is accepted that the quality of children will be decreased as the number of children increase,
the sign of the second derivative will be negative, it means that after a point, it will be less to have
children as it is in the consumption of goods and services. Who determines that point? This is a crucial
question. When you decide to have another child, nobody can say anything about whether utility from
children will be decreased because of this new born, on the other hand, nobody can measure the quality
of your children. Therefore, we cannot mention about the equilibrium of child demand since children
are not a commodity whose values are determined by demand and supply conditions. The answer of the
question of how many children people will have is related to socio-cultural things.
Neoclassic economists, Lucas (1988) and Romer (1990) introduced the human capital formation as
an engine of growth. According to these authors, the stock of human capital determines long term
economic growth. Therefore, I expect that developing countries should focus on to increase educated
labor force and should increase the demand for children because the probability of genius children will
increase as the number of children increases. Thus, when I think from Lucas and Romer’s perspective,
child demand should increase contrary to other neoclassic economists, like Becker and others, to obtain
a sustainable growth. Also, when we consider ‘the endogenous growth model’ introduced by Lucas
(1988) and Romer (1994), we can understand why less developed regions should have rapid population
growth than developed ones, but it is not true that poor countries are rational and thus they have higher
fertility rate.
Sekmen, F. Gazi İktisat ve İşletme Dergisi, 2019; 5(3): 152-159
ISSN: 2548-0162 © 2019 Gazi Akademik Yayıncılık 159
Unlike the explanations of neo-classical economists, it is possible to express why the poor countries
in real life as having more children as follows:
There are multiple reasons why less developed countries have higher fertility rate. For example, in
a primarily agricultural or herding society, children represent family's wealth (they're low-cost workers
who can do simple tasks). Also, children provide old-age security in societies where they're expected to
look after their parents. In countries where infant mortality are high, parents do not expect that all of
their children will survive, thus they are more likely to have children than they really want.
3. Conclusion
The neoclassical theory takes child demand in the utility function, like any other commodities. But,
the demand for children is different from things which increase our utility; such as car, refrigerator,
elevator, and other goods and services, whose price is determined in the market through its sellers and
buyers. However, demand for children is determined by socio-cultural things. In addition to these
explanations, the neoclassic theory shows a contradiction to new growth theories, which emphasize
human capital in order to increase long term growth rates, explained by Romer and Lucas. In Lucas and
Romer’s model, there is no any explanation about returns to human capital will decrease as child demand
increases. Therefore, I can conclude that human being is a dominant factor to create value, and we cannot
take child demand in a utility function like any commodity and services.
References
Becker, G. S. (1960). An Economic Analysis of Fertility, nber. Erişim 01 Temmuz 2019,
http://www.nber.org/chapters/c2387.pdf
Becker, G. & Tomes, N. (1976). Child Endowments and Quantity and Quality of Children. The Journal of Political
Economy, 84(4), 143-162.
Blake, J. (1968). Are Babies Durables? A Critic of the Economic Theory of Reproductive Motivation. Population
Studies, 22(1), 5-25.
Caplan, B. (2006). Terrorism: The relevance of the rational choice model. Public Choice, 91-107. Erişim adresi:
http://econfaculty.gmu.edu/bcaplan/pdfs/terrorism.pdf
Cochrane, S.H. (1975). Children as By-products, Investment Goods and Consumer Goods: A review of Some
Micro-economic Models of Fertility. Population Studies, 29(3), 373-390.
Dixon-Mueller, R. (1993). Population policy & women's rights: Transforming reproductive choice. Westport,
Connecticut: Praeger.
Folbre, N. (1984). Household production in Philippinnpes: A Non-Neoclassical Approach. Economic Development
and Culture Change, 32(2), 303-330.
Leibenstein, H. (1974). An interpretation of the economic theory of fertility: Promising path or blind alley?.
Journal of Economic Literature, 12 (2) (June): 457-479.
Lucas, R.E., Jr. (1988). On the Mechanics of Economic Development. Journal of Monetary Economics, 22(4), 3-
42.
Romer, P. M. (1990). Endogenous Technological Change. Journal of Political Economy, 98(5), 71-102.
Romer, P. M. (1994). The Origins of Endogenous Growth. The Journal of Economic Perspectives, 8(1), 3-22.
The World Bank. World Development Indicators. Erişim adresi: http://datatopics.worldbank.org/world-
development-indicators/
ISSN: 2548-0162 © 2019 Gazi Akademik Yayıncılık
Gazi İktisat ve İşletme Dergisi, 2019; 5(3):160-169 https://dergipark.org.tr/tr/pub/gjeb
Financial Distress Of Adults: A Survey In Eskişehir, Turkey*
Özlem Sayılıra **, Zeynep İlhanb, Veysel Yılmazc
a Asst. Prof. Dr., Anadolu University, Faculty of Business Administration, Department of Business Administration, Eskişehir
26210, TURKEY. e-posta: [email protected] ORCID ID: https://orcid.org/0000-0001-9598-3545
b Research Assistant, Eskişehir Osmangazi University, Faculty of Science and Letter, Department of Statistics, Eskişehir
26480, TURKEY. e-posta: [email protected] ORCID ID: https://orcid.org/0000-0003-0986-9688
cProf. Dr., Eskişehir Osmangazi University, Faculty of Science and Letter, Department of Statistics, Eskişehir 26480,
TURKEY. e-posta: [email protected] ORCID ID: https://orcid.org/0000-0001-5147-5047
ARTICLE INFO
ABSTRACT
Received: 23.04.2019
Accepted: 26.08.2019
Available online:24.10.2019 Article Type: Research
article
As financial well-being is considered to be one of the most important
factors which may affect the level of financial satisfaction and
consequently the level of life satisfaction, financial distress has
emerged as an important subject of research. We measure the variables
of financial distress, financial management behavior and money attitude
for adults with a survey conducted on a sample of households living in
Eskişehir, Turkey and attempt to model the interrelationships between
these variables using Structural Equation Models. The results of the
model reveal that High Level of Financial Distress is associated
positively with Risky Financial Management Behavior and negatively
with Investment Oriented Financial Management Behavior. Moreover,
Money Oriented Financial Attitude and Investment Oriented Financial
Management Behavior are positively correlated. According to the
findings, married adults seem to be the most financially satisfied group,
whereas single adults seem to be the least financially satisfied group.
Yet, interestingly, they are the least financially distressed group as well.
Divorced adults, on the other hand, seem to be the most financially
distressed group. Middle aged adults seem to overview their financial
position more often than young adults. Both young and middle aged
women seem to overview their financial position more often than men.
Women tend to save more on a regular basis compared to men.
Similarly, young adults tend to save more on a regular basis.
Keywords:
Financial Distress,
Financial Management
Behavior, Money
Attitude, Structural
Equation Models.
* Funded by Eskişehir Osmangazi University BAP Project number: 2015-853 (16.12.2016) ** Corresponding Author
Doi: https://dx.doi.org/10.30855/gjeb.2019.5.3.002

Sayılır, Ö., İlhan, Z. & Yılmaz, V. Gazi İktisat ve İşletme Dergisi, 2019; 5(3): 160-169
ISSN: 2548-0162 © 2019 Gazi Akademik Yayıncılık 161
Yetişkinlerde Finansal Sıkıntı: Türkiye, Eskişehir’de Bir Anket Uygulaması
MAKALE BİLGİSİ
ÖZ
Geliş Tarihi: 23.04.2019
Kabul Tarihi: 26.08.2019
Çevrimiçi Kullanım
Tarihi: 24.10.2019
Makale Türü: Araştırma
makalesi
Finansal sağlık, finansal memnuniyeti ve ve bunun sonucunda yaşam
memnuniyetini etkileyebilecek en önemli faktörlerden biri olarak kabul
edildiğinden, finansal sıkıntı önemli bir araştırma konusu olarak ortaya
çıkmıştır. Çalışmada, Türkiye’nin Eskişehir kentinde yaşayan hane
halklarını temsil eden bir örneklem üzerinde anket uygulanarak;
Finansal Sıkıntı, Finansal Yönetim Davranışı, Paraya Karşı Tutum
değişkenleri ölçülmüş ve bu değişkenler arasındaki ilişkiler Yapısal
Eşitlik Modelleri ile modellenmeye çalışılmıştır. Modelin sonuçlarına
göre, yüksek derecedeki finansal sıkıntı, riskli finansal yönetim
davranışı ile pozitif, yatırım odaklı finansal yönetim davranışı ile negatif
ilişki göstermektedir. Ayrıca, para odaklı finansal tutum ve yatırım
odaklı finansal yönetim davranışı birbirleriyle pozitif ilişki
göstermektedir. Bulgulara göre, evli yetişkinler finansal yönden en
yüksek memnuniyete sahipken, bekar yetişkinler finansal yönden en
düşük memnuiyete sahip görünmektedir. Ancak, ilginç şekilde, bekar
yetişkin grubu aynı zamanda en az finansal sıkıntı yaşayan gruptur. Öte
yandan, boşanmış yetişkinler, en fazla finansal sıkıntı yaşayan gruptur.
Orta yaşlı yetişkinler, gençlere göre finansal durumlarını daha fazla
gözden geçirmektedir. Hem genç, hem orta yaşlı kadınlar, erkeklere
göre finansal durumlarını daha fazla gözden geçirmektedir. Kadınlar,
erkeklere göre daha fazla düzenli tasarruf yapma eğilimindedir. Benzer
şekilde, genç yetişkinler daha fazla düzenli tasarruf yapma
eğilimindedir.
Anahtar Kelimeler: Finansal Sıkıntı,
Finansal Yönetim
Davranışı, Paraya
Karşı Tutum, Yapısal
Eşitlik Modelleri
1. Introduction
Starting from the 1990’s and especially from 2000 and on, social scientists have started to be
more interested in personal finance issues such as financial satisfaction and personal financial
management. As long as individuals exhibit responsible financial behavior, they tend to feel more
comfortable about their financial position and more satisfied with it. As a result, their life satisfaction
tends to increase. In this regard, financial behavior and financial wellness has evolved as significant
topics of research on the personal finance agenda.
As emphasized by various scholars, financial wellness is among the most important factors, which
may influence financial satisfaction and accordingly life satisfaction (Xiao and others. 2014, p. 12;
Shim and others, 2009, p.719 , Porter and Garman 1993, p.160). Financial wellness of individuals and
households depends mostly on the decisions taken in the fields of spending, saving, investment and
borrowing (Xiao and others, 2009, p.66 ; Dowling and others, 2009, p.10 ; Joo and Grable, 2004,
p.45). Individuals who are not able to manage their personal financial issues tend to be more
vulnerable to financial problems and distress. In this respect, some studies provide evidence for the
relationship between the level of personal debt and personal financial behavior (Santos and Abreu,
2013, p.26; Lusardi and Tufano 2009, p. 24).
The meaning people attach to money and their fundamental perceptions and beliefs about money
determines their money attitude. Within the framework of Theory of Planned Behavior, money
attitude is reflected on personal financial management behavior and habits (Xiao, 2008). Taking into
consideration the effects of personal financial management decisions on financial distress,
determinants of financial behavior have been explored by various studies. Money attitude has been
suggested as one of the most important factors, which may impact how individuals behave in cash
management, credit management, financial planning matters (Parrota and Johnson,1998).
The purpose of the study is to measure the variables of financial distress, financial management
behavior and attitude towards money (money attitude) for adults in Turkey and model the
Sayılır, Ö., İlhan, Z. & Yılmaz, V. Gazi İktisat ve İşletme Dergisi, 2019; 5(3): 160-169
ISSN: 2548-0162 © 2019 Gazi Akademik Yayıncılık 162
interrelationships between these variables and demographic variables using Structural Equation
Models.
2. Literature
Positive financial behaviors contribute to financial satisfaction and financial satisfaction in turn
contributes to life satisfaction (Xiao et al., 2009). Financial well-being is also related to academic
success, as well as psychological and physical health (Shim and others, 2009). Individuals who exhibit
better financial behaviors tend to have lower levels of financial stress, and therefore, higher levels of
financial satisfaction. (Joo and Grable, 2009, p.39).
According to Gutter et al. (2011) financial well-being is significantly related to budgeting, saving,
risky credit card behaviors, and compulsive buying. Financial management practices, money attitudes,
and financial problems are found to predict financial satisfaction (Dowling and others, 2009, p.10).
Financial attitude and financial knowledge significantly positive relate to financial management
behaviors (Mien and Thao, 2015, p.12). Money attitudes and Financial Knowledge have a significant
positive impact on the personal financial management behavior of young adults, and financial
knowledge has a positive moderating impact on the relationship of money attitudes and personal
financial management behavior (Qamar and others, 2015, p. 305). Likewise, according to JBR (2014,
p. 78) the more positive financial attitudes the better the financial management practices and sound
financial management practices adopted are related to higher satisfaction with financial status.
Money is perceived as a symbol of success and as one of the tools to gain power and respect in a
myriad of cultures. Money has the power to affect the prosperity, financial wellness or financial
distress by generating financial comfort or financial problems. Hence, money attitude is among the
variables which may determine financial distress and financial satisfaction (Dowling and others, 2009,
p.10; Tatzel 2002, p.122; Wilhelm and others, 1993; Godwin and Carroll, 1986). Considering the
relationships identified in the literature between financial distress, financial behavior and money
attitude we build a theoretical model as exhibited below to investigate how these latent variables are
interrelated.
3. Methodology
SEM consists of two components, a measurement model and a structural model. The
measurement model assesses latent (unobserved) variables as linear functions of indicators (observed
variables). The structural model shows the direction and strengths of the relationships of the latent
variables. A typical structural equations model is defined:
=B+ + (1)
where is a column vector of m endogenous variables, is a column vector of n exogenous
variables, B is a matrix (m×m) of coefficients associated with the direct effects of endogenous variable
on another endogenous variable, is a matrix (m× n) of coefficients associated with the direct
effects of exogenous variable on another endogenous variable, and is a column vector of error terms
associated with endogenous variables. represents the covariance matrix (n×n) of exogenous
variable .
The measurement equations relating the latent variables to the measurement variables are
y= y + (2)
x= x + (3)
y(p×1) and x(q×1) are the column vectors of p measured endogenous variables, and q measured
exogenous variables, respectively. y and x are the corresponding factor loading(λij) matrices.
and are the error terms related to the measured variables and are uncorrelated. In the proposed
model, there are three endogenous variables (m = 2) and two exogenous variables (n = 2).

Sayılır, Ö., İlhan, Z. & Yılmaz, V. Gazi İktisat ve İşletme Dergisi, 2019; 5(3): 160-169
ISSN: 2548-0162 © 2019 Gazi Akademik Yayıncılık 163
In this study, Financial Distress, Financial Management Behavior and Money Attitude was
measured by a questionnaire. Financial Distress was measured by items adapted from the Financial
Wellness Scale developed by Prawitz et al. (2006). Financial Management Behavior was measured by
items adapted from the Financial Management Behavior Scale developed by Parrotta and Johnson
(1998). Money attitude was measured by items adapted from the Attitude Towards Money Scale
developed by Lima and Teo (1997). The items utilized were translated into Turkish and modified by
expert opinions before the pilot study.
The target population of the survey consists of female and male adults aged 18-69, from socio-
economic groups of A, B, C1, C2, D ve E. The sampling method employed is random quota sampling.
A pilot study was conducted with a sample of 100 people in 6 districts of Eskişehir in 2016, during
which people were surveyed face to face. The sample was constructed according to predetermined
quotas with respect to age, gender and socio-economic status (SES). After dropping a survey item
related to financial management behavior, all items related to the measured variables provided a high
level of reliability. (Cronbach Alpha of FD is 0.868; Cronbach Alpha of FB is 0.805; Cronbach Alpha
of ATM is 0.985). Survey questions were revised after the pilot study and it was conducted to 700
people in 6 districts of Eskişehir face to face.
We measured the latent variables of financial distress, financial management behavior and money
attitude for adults using survey data and attempted to model the interrelationships between these
variables using Structural Equation Models (SEM). SEM is a widely used statistical methodology in
social, behavioral, economic and other sciences to explore interrelationships among latent constructs,
which are measured by a set of observed indicators. It is a multi-variable statistical technique which
uses a linear approach in order to resolve complex theoretical structures containing intangible facts
(Yılmaz & Çelik, 2009). SEM consists of two components, a measurement model and a structural
model. The measurement model assesses latent (unobserved) variables as linear functions of indicators
(observed variables). The structural model shows the direction and strengths of the relationships of the
latent variables. We utilize Confirmatory Factor Analysis (CFA) in order to determine whether the
measurement model containing each sub-dimension are significant. Maximum Likelihood method is
used to predict the structural parameters. We employ Lisrel 9.1 to conduct factor analysis and to build
Structural Equation Models.
4. Findings
The sample size of the study can be considered “good” based on the KMO value (KMO=0.712).
50.4 per cent of the participants in the survey were female while 49.6 per cent were male. Age
frequencies and SES frequencies are shown in the tables below.
Table 1. Age Frequencies
Age Frequency %
18-24 116 16.6
25-34 142 20.3
35-44 133 19.0
45-54 123 17.6
55-64 90 13.0
65 and over 95 13.6
Total 700 100.0
Table 2. SES Frequencies
SES Frequency %
A 24 3.4
B 48 6.9
C1 166 23.7
C2 226 32.3
D 154 22.0
E 82 11,7
Total 700 100.0
Sayılır, Ö., İlhan, Z. & Yılmaz, V. Gazi İktisat ve İşletme Dergisi, 2019; 5(3): 160-169
ISSN: 2548-0162 © 2019 Gazi Akademik Yayıncılık 164
Data analysis included 615 questionnaires, since 85 questionnaires were excluded due to incorrect
or missing information. As a result of the factor rotations, we constructed 4 factors, which explained
66.054 per cent of the variations.
Factor B2 (High Level of Financial Distress) was measured by the following items:
B.4: How often do you worry about affording your normal monthly expenses?
B.6: How often do you have difficulty making ends meet?
Factor D (Money Oriented Financial Attitude) was measured by the following items:
D.2 : Money earns the respect of people to you.
D.4 : Easy earned money is spent unconsciously.
D.5 : Money is the most important thing in my life.
Factor C2 (Risky Financial Management Behavior) was measured by the following items:
C.1: I make a monthly expense budget. (This item was reverse coded)
C.3: I calculate my income and expenditures. (This item was reverse coded)
C.4: I overview my spending habits. (This item was reverse coded)
C.5: Sometimes I pay interest on my credit card debt as I pay my debt late.
C.8: I often spend more money than I have.
C.9: I usually pay a portion of my credit debt rather than all of it.
Factor C3 (Investment Oriented Financial Management Behavior) was measured by the following
items:
C.16 : I overview my financial position on a regular basis.
C.17 : I make savings on a regular basis.
C.18 : I make investments on a regular basis.
Factors B2, C2, VE C3 were measured by a 5-point Likert Scale of 1. Never/ 5. Always whereas
Factor D was measured by 5-point Likert Scale of 1. I definitely disagree /5. I definitely agree).
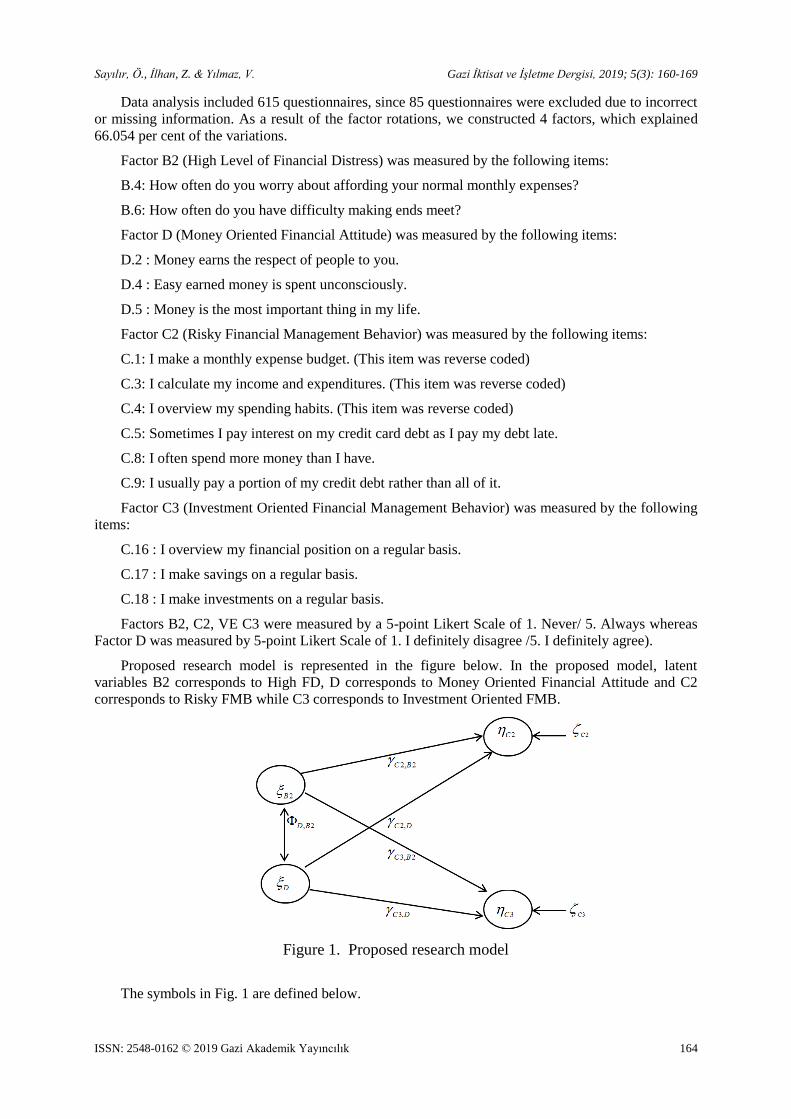
Proposed research model is represented in the figure below. In the proposed model, latent
variables B2 corresponds to High FD, D corresponds to Money Oriented Financial Attitude and C2
corresponds to Risky FMB while C3 corresponds to Investment Oriented FMB.
Figure 1. Proposed research model
The symbols in Fig. 1 are defined below.
Sayılır, Ö., İlhan, Z. & Yılmaz, V. Gazi İktisat ve İşletme Dergisi, 2019; 5(3): 160-169
ISSN: 2548-0162 © 2019 Gazi Akademik Yayıncılık 165
2B : High Level of Financial Distress,
D : Money Oriented Financial Attitude,
2C : Risky Financial Management Behavior,
3C : Investment Oriented Financial Management Behavior,
, 2D B : Correlation between Financial Distress and Money-Oriented Financial Attitude,
2, 2C B : The direct impact of High Level of Financial Distress on Risky Financial Management
Behavior,
3, 2C B : The direct impact of High Level of Financial Distress on Investment Oriented Financial
Management Behavior,
2,C D : The direct impact of Money-Oriented Financial Attitude on Risky Financial
Management Behavior,
3,C D : The direct impact of Money-Oriented Financial Attitude on Investment Oriented
Financial Management Behavior,
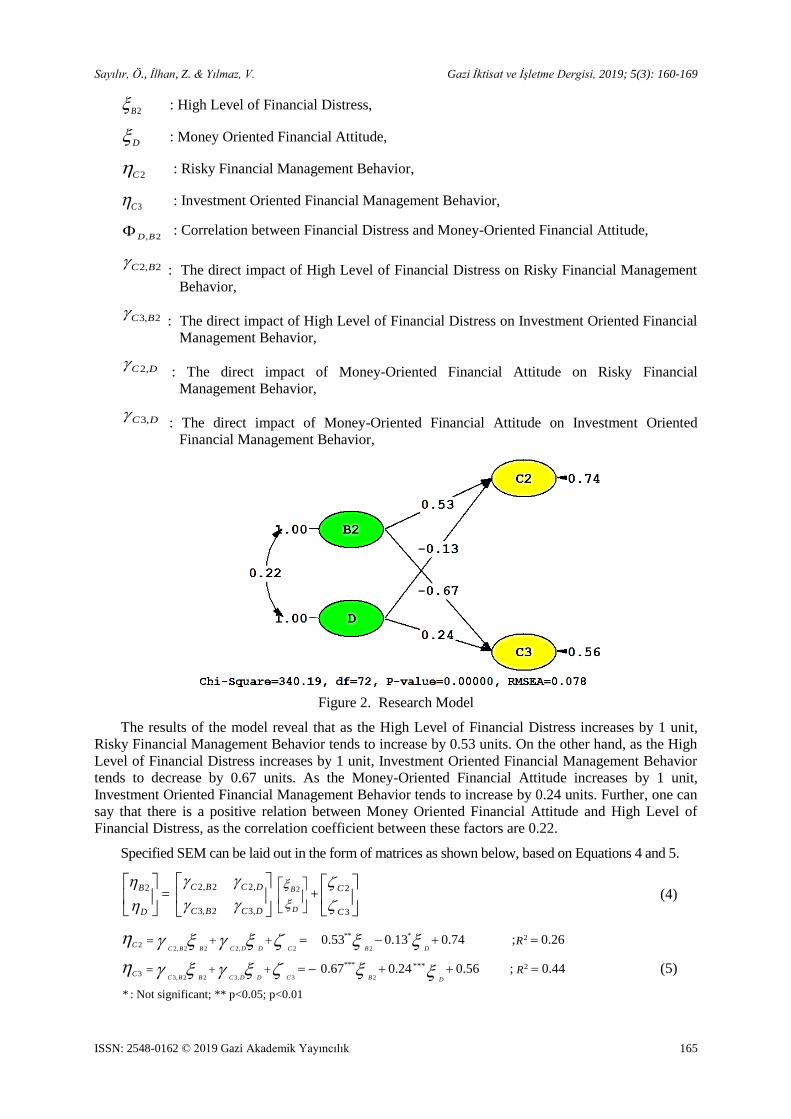
Figure 2. Research Model
The results of the model reveal that as the High Level of Financial Distress increases by 1 unit,
Risky Financial Management Behavior tends to increase by 0.53 units. On the other hand, as the High
Level of Financial Distress increases by 1 unit, Investment Oriented Financial Management Behavior
tends to decrease by 0.67 units. As the Money-Oriented Financial Attitude increases by 1 unit,
Investment Oriented Financial Management Behavior tends to increase by 0.24 units. Further, one can
say that there is a positive relation between Money Oriented Financial Attitude and High Level of
Financial Distress, as the correlation coefficient between these factors are 0.22.
Specified SEM can be laid out in the form of matrices as shown below, based on Equations 4 and 5.
2
B
D
=
2, 2 2,
3, 2 3,
C B C D
C B C D
2
B
D
+
2
3
C
C
(4)
2, 2 2 2, 2 2
3, 2 2 3, 3 2
** * 22
*** 23
***
* : Not significant; ** p<0.05; p<0.01
0.53 0.13 0.74 ; 0.26
0.67 0.24 0.56 ; 0.44
C B B C D D C B D
C B B C D D C B D
C
C
R
R
(5)

Sayılır, Ö., İlhan, Z. & Yılmaz, V. Gazi İktisat ve İşletme Dergisi, 2019; 5(3): 160-169
ISSN: 2548-0162 © 2019 Gazi Akademik Yayıncılık 166
Fit measures of the model are calculated as RMSEA=0.078 (Root-mean-square error
approximation), Root Mean Square Residual (RMR) = 0.045, Standardized RMR = 0.066, CFI=0.94
(Comparative Fit Index), GFI= 0.96 and Adjusted Goodness of Fit Index (AGFI) = 0.95 (Goodness-of-
fit). RMSEA, RMR and SRMR value equal to 0.05 or less reflects a perfect fit, values under 0.10
indicate an acceptable fit, while those above 0.10 indicate a bad fit. Other fitness criteria are between 0
and 1 and this means that closeness to 1 shows a better fit of the model (Jöreskog and Sörbom, 2001).
When all fitness criteria are considered, it is evident that our proposed model is valid.
Regarding, financial distress, 35 per cent of married respondents indicated that they are
financially satisfied whereas only 17 percent of single respondents indicated that they are financially
satisfied. The chi square test (p < 0.05) implies that there is a significant relationship between B.2 and
gender.
Regarding money attitude, men tend to associate money with respect more than women as 44
percent of the male respondents indicated that they agree with the statement “money earns the respect
of people to you”, while 39 percent of the male respondents indicated that they agree with that
statement. The chi square test (p < 0.05) implies that there is a significant relationship between D.2
and gender.
Regarding financial management behavior, 69 per cent of divorced respondents indicated that
they often or always pay interest on their credit card debt as they pay their debt late, whereas only 26
percent of the married respondents indicated that they often or always pay interest on their credit card
debt as they pay their debt late. The chi square test (p < 0.05) implies that there is a significant
relationship between C.5 and gender. Moreover, 64 per cent of women overview their financial
position often or always whereas 55 percent of men overview their financial often or always. The chi
square test (p < 0.05) implies that there is a significant relationship between C.16 and gender. Last but
not least, 74 per cent of women save on a regular basis whereas 63 percent of men save on a regular
basis. The chi square test (p < 0.05) implies that there is a significant relationship between C.17 and
gender. Cross Tabulation table of “I overview my financial position.” (C.16) according to age and
gender as well as Cross Tabulation table of “I save on a regular basis” (C.17) according to age and
gender is shown in the tables below.
Table 3. Cross Tabulation of “I overview my financial position.” (C.16) according to age and gender
Age
C.16 Total
Never Seldom Sometimes Often Always
18-24 Gender
Female 0 2 12 29 6 49
Male 1 4 10 20 4 39
Total 1 6 22 49 10 88
25-34 Gender
Female 7 17 27 13 64
Male 10 15 32 8 65
Toplam 17 32 59 21 129
35-44 Gender
Female 0 5 13 18 7 43
Male 2 12 20 38 5 77
Total 2 17 33 56 12 120
45-54 Gender
Female 8 21 25 6 60
Male 11 22 21 3 57
Total 19 43 46 9 117
55-64 Gender
Female 4 10 21 13 48
Male 5 11 17 2 35
Total 9 21 38 15 83
65 and
over
Gender Female 4 6 25 6 41
Male 6 10 17 4 37
Total 10 16 42 10 78
Total Gender
Female 0 30 79 145 51 305
Male 3 48 88 145 26 310
Total 3 78 167 290 77 615

Sayılır, Ö., İlhan, Z. & Yılmaz, V. Gazi İktisat ve İşletme Dergisi, 2019; 5(3): 160-169
ISSN: 2548-0162 © 2019 Gazi Akademik Yayıncılık 167
Around 20 per cent of women aged 25-34 always overview their financial position while only 12
per cent of men in the same age group always overview their financial position. Around 51 per cent
of women aged 45-54 always overview their financial position while only 42 per cent of men in he
same age group always overview their financial position.
Table 4. Cross Tabulation of “I save on a regular basis” (C.17) according to age and gender
Age
C.17 Total
Never Seldom Sometimes Often Always
18-24 Gender
Female 3 8 30 8 49
Male 3 11 2 5 39
Total 6 19 050 13 88
25-34 Gender
Female 1 3 6 43 11 64
Male 0 4 16 36 9 65
Total 7 22 79 20 129
35-44 Gender
Female 1 3 10 22 7 43
Male 0 6 21 43 7 77
Total 9 31 65 14 120
45-54 Gender
Female 5 16 32 7 60
Male 7 19 26 5 57
Total 12 35 58 12 117
55-64 Gender
Female 3 10 20 15 48
Male 3 8 20 4 35
Total 6 18 40 19 83
65 and
over
Gender Female 1 8 24 8 41
Male 2 13 15 7 37
Total 3 21 39 15 78
Total Gender
Female 2 18 58 171 56 305
Male 0 25 88 160 37 310
Total 43 146 331 93 615
Around 84 per cent of women aged 25-34 often or always save on a regular basis while 69 percent
of men in the same age group always or often save on a regular basis. Around 65 per cent of women
aged 45-54 always or often save on a regular basis while 54 per cent of men in the same age group
always overview their financial position.
5. Conclusion
In this study, we measure the variables of financial distress, financial management behavior and
money attitude for adults and model the interrelationships between these variables and demographic
variables using Structural Equation Models based on a survey which was conducted on a sample of
households living in Eskişehir, Turkey.
The results of the model reveal that High Level of Financial Distress is associated positively with
Risky Financial Management Behavior and negatively with Investment Oriented Financial
Management Behavior. According to the findings of the study, married adults seem to be the most
financially satisfied group, whereas single adults seem to be the least financially satisfied group. Yet,
interestingly, they are the least financially distressed group as well. Divorced adults, on the other hand,
seem to be the most financially distressed group. However, divorced adults are the group of adults
who set themselves financial goals and make plans to achieve these goals. The findings also reveal
that men tend to associate money with respect more than women, as 44 percent of the male
respondents indicated that they agree with the statement “money earns the respect of people to you”,
while 39 percent of the female respondents indicated that they agree with that statement.
Regarding financial management behavior habits, middle aged adults and women tend to exhibit
more responsible behavior. Middle aged adults seem to overview their financial position more often

Sayılır, Ö., İlhan, Z. & Yılmaz, V. Gazi İktisat ve İşletme Dergisi, 2019; 5(3): 160-169
ISSN: 2548-0162 © 2019 Gazi Akademik Yayıncılık 168
than young adults. Both young and middle aged women seem to overview their financial position
more often than men. Women tend to save more on a regular basis compared to men. Similarly, young
adults tend to save more on a regular basis.
As the SEM model implies, decreasing financial distress of adults in general can induce less risky
and more investment oriented financial management behavior. Providing adults with more financial
education help diminish financial distress. Considering that divorced adults seem to be more
vulnerable to financial distress and the tendency of this group to exhibit risky behavior when it comes
to personal financial management (69 per cent of divorced respondents indicated that they often or
always pay interest on their credit card debt as they pay their debt late), they should be given special
attention. The tendency of this group to set financial goals and to make plans imply that their
responsible financial behavior can be improved, and financial distress can be decreased by providing
financial counselling. Moreover, considering more responsible behavior of young female adults
(overviewing financial position and saving on a regular basis), this group of adults should be
encouraged to channel their savings into investments. The results imply that as Money-Oriented
Financial Attitude increases, Investment Oriented Financial Management Behavior tends to increase.
Focusing more on young female adults to strengthen money oriented attitude by offering them
financial education at early stages of life can empower them with the motivation and skills to save and
invest more.
References
Dowling, N. A., Corney, T. and Hoiles, L. (2009). Financial Management Practices and Money Attitudes as
Determinants of Financial Problems and Dissatisfaction in Young Male Australian Workers. Journal of
Financial Counseling and Planning, 20(2), 5-13.
Godwın, D. D. and Carroll, D. D. (1986). Financial management attitudes and behaviour of husbands and wives.
International Journal of Consumer Studies, 10, 77–96.
Gutter, M. and Copur, Z. J Fam. (2011). Financial Behaviors and Financial Well-Being of College Students:
Evidence from a National Survey. Econ Iss,32, 699. https://doi.org/10.1007/s10834-011-9255-2
JBR, S. B. (2014). Knowledge, Attitude and their Effect on the Recently Graduated Employees’ Financial
Management Practices and Satisfaction. Economic Literature, XII, 69-81, December.
Joo, S. and Grable, J. E. (2004). An Exploratory Framework of the Determinants of Financial Satisfaction,
Journal of Family and Economic Issues, 25(1), 25-50, Spring.
Jöreskog, K. G. and Sörbom, D. (1989). LISREL 7: A guide to the program and applications. Chicago : SPSS.
Lim, V. K. G. and Teo T. S. H. (1997). Sex, money and financial hardship: an empirical study of attitudes
towards money among undergraduates in Singapore. Journal of Economic Psychology, 18(4), 369-386.
Lusardi A. and Tufano P. (2009). Debt Literacy, Financial Experiences, and Overindebtedness, NBER Working
Paper, No. 14808, March.
Mien, NTN. and Thao TP. (2015). Factors affecting personal financial management behaviors: evidence from
Vietnam, Proceedings of the Second Asia-Pacific Conference on Global Business. Economics, Finance and
Social Sciences (AP15Vietnam Conference).
Parrotta, J. L. and Johnson, P. J. (1998). The Impact Of Financial Attitudes And Knowledge On Financial
Management And Satisfaction Of Recently Married Individuals. Association for Financial Counseling and
Planning Education, 59-75.
Porter, N. M. and Garman, E.T. (1993). Testing a Conceptual Model of Financial Well-Being, Financial
Counseling and Planning, 4, 135-164.
Prawitz, A. D., Garman, E. T., Sorhaindo, B., O’Neill, B., Kim, J., and Drentea, P. (2006). The InCharge
Financial Distress/Financial Well-Being Scale: Development, administration, and score interpretation.
Financial Counseling and Planning, 17(1), 34-50.
Qamar, M. A. J., Khemta, Muhammad A. N. and Jamil, H. (2016). How Knowledge and Financial Self-Efficacy
Moderate the Relationship between Money Attitudes and Personal Financial Management Behavior.
European Online Journal of Natural and Social Sciences, www.european-science.com, 5(2), 296-308.
Sayılır, Ö., İlhan, Z. & Yılmaz, V. Gazi İktisat ve İşletme Dergisi, 2019; 5(3): 160-169
ISSN: 2548-0162 © 2019 Gazi Akademik Yayıncılık 169
Santos, E. and Abreu, M. (2013). Financial Literacy, Financial Behaviour and Individuals’ Over-indebtedness,
Workıng Papers, ISSN: 0874-4548.
Shim, S., Xiao, J. J.; Barber, B.L. and Lyons, A.C. (2009). Pathways to life success: A conceptual model of
financial well-being for young adults, Journal of Applied Developmental Psychology, 30, 708–723.
Tatzel, M. (2002). ‘‘Money worlds’’ and well-being: An integration of money dispositions, materialism and
price-related behavior. Journal of Economic Psychology, 23, 103–126.
Wilhelm, M. S., Varcoe, K. and Fridrich, A.H. (1993). Financial Satisfaction and Assessment of Financial
Progress: Importance of Money Attitudes. Financial Counseling and Planning, 4, 181-199.
Xiao, J. J. (2008). Applying Behavior Theories to Financial Behavior. Handbook of Consumer Finance
Research, 69-81.
Xiao, J. J.; Tang, C. and Shim, S. (2009). Acting for Happiness: Financial Behavior and Life Satisfaction of
College Students, Soc Indic Res, 92, 53–68.
Xiao, J. J., Chen, C., and Chen, F. (2014). Consumer financial capability and financial satisfaction. Social
Indicators Research, 118(1), 415-432.
Yılmaz, V. and Çelik, E. H. (2009). Lisrel ile Yapısal Eşitlik Modellemesi. Ankara: Pegem Akademi.
ISSN: 2548-0162 © 2019 Gazi Akademik Yayıncılık
Gazi İktisat ve İşletme Dergisi, 2019; 5(3): 170-181 https://dergipark.org.tr/tr/pub/gjeb
TOPSIS Yönteminde Maliyet ve Karlılık Oranlarının Kullanılmasıyla
Finansal Performansın Ölçümü: Ana Metal Sanayi Sektöründen Bir Şirket
Örneği*
Murat Yıldırıma**, Ömer Karakayab, İnci Merve Altanc
a Doç. Dr., Karabük Üniversitesi, İşletme Fakültesi, İşletme Bölümü, Karabük 78050, TÜRKİYE.
e-posta: [email protected] ORCID ID: https://orcid.org/0000-0001-8582-8365
b Doktora Öğrencisi, Karabük Üniversitesi, Sosyal Bilimler Enstitüsü, İşletme, Karabük 78050, TÜRKİYE.
e-posta: [email protected] ORCID ID: https://orcid.org/0000-0002-7864-5226
c Doktora Öğrencisi, Karabük Üniversitesi, Sosyal Bilimler Enstitüsü, İşletme, Karabük 78050, TÜRKİYE.
e-posta: [email protected] ORCID ID: https://orcid.org/ 0000-0002-6269-7726
MAKALE BİLGİSİ
ÖZ
Geliş Tarihi: 03.05.2019
Kabul Tarihi: 26.09.2019
Çevrimiçi Kullanım
Tarihi: 24.10.2019
Makale Türü: Araştırma
makalesi
Çok ölçütlü karar verme yöntemlerinden birisi olan TOPSIS (Technique
for Order Preference by Similarity to Ideal Solution) yöntemi
işletmelerin finansal performansının ölçümünde yaygın kullanılan
yöntemlerden birisidir. TOPSIS yönteminin temelinde en düşük
maliyetli, en yüksek fayda sağlayan seçenek optimum seçenektir.
TOPSIS yönteminde kullanılacak finansal oranların, performansı
ölçülecek işletmelere göre isabetli seçilmesi yapılacak analizin
başarısını olumlu etkilemektedir. Üretim işletmelerinde, TOPSIS
yöntemi ile yapılan finansal performans analizinde mali tablolardan elde
edilen maliyet ve karlılık oranlarının kullanılması, yöntemin özüne
oldukça uygun düşmektedir. Bu çalışmanın amacı, üretim işletmelerinde
TOPSIS yöntemi ile yapılacak finansal performans analizinde maliyet
ve karlılık oranlarının başarısını test etmektir. Bu doğrultuda, Borsa
İstanbul Ana Metal Sanayi Endeksine kote olan bir şirketin başarısı
yıllara göre hesaplanmış ve elde edilen sonuçların doğruluğu ve
altındaki ekonomik nedenler incelenmiştir. 2008 ile 2017 yılları
arasındaki maliyet ve karlılık oranlarına göre 2008 yılı en başarılı yıl
iken 2015 yılı en az başarılı yıl olarak tespit edilmiştir. Analiz
sonucunda elde edilen bulgular temel analiz sonuçları ile doğrulanmakla
birlikte sektörde yaşanan ulusal ve uluslararası gelişmeler analizin
sonuçlarını desteklemektedir. Sonuç olarak yapılan çalışmada kullanılan
maliyet ve karlılık oranları TOPSIS yöntemi ile isabetli sonuçlar ortaya
koymuştur.
Anahtar Kelimeler: Çok Ölçütlü Karar
Verme, TOPSIS,
Maliyet ve Karlılık
Oranları, Finansal
Performans
Değerleme, Demir
Çelik
* Bu makale 4-6 Nisan 2019 tarihlerinde Karabük Üniversitesi’nde düzenlenen 4. Uluslararası Demir-Çelik
Sempozyumu’nda sunulan “TOPSIS Yöntemiyle Maliyet ve Karlılık Performansının Değerlendirilmesi: Bir Demir Çelik İşletmesi Örneği” adlı bildirinin genişletilmiş halidir.
** Corresponding Author
Doi: https://dx.doi.org/10.30855/gjeb.2019.5.3.003

Yıldıırm, M., Karakaya, Ö. & Altan, İ. M . Gazi İktisat ve İşletme Dergisi, 2019; 5(3): 170-181
ISSN: 2548-0162 © 2019 Gazi Akademik Yayıncılık 171
Measurement of Financial Performance by Using Cost and Profitability Ratios in
TOPSIS Method: The Case of a Company in the Iron and Steel Industry
ARTICLE INFO
ABSTRACT
Received: 03.05.2019
Accepted: 26.09.2019
Available online: 24.10.2019 Article Type: Research
article
TOPSIS method which is one of the multi-criteria decision-making
methods, is one of the most widely used methods in measuring the
financial performance of enterprises. In the TOPSIS method, the most
cost-effective, the highest-benefit option is the optimal option. For
accurate selection of financial ratios to be used in the TOPSIS method,
the features of the enterprise whose performance is to be measured
should be considered and such a selection process has a positive effect
on the success of the analysis. The use of the cost and profitability
ratios, obtained from financial statements, in the financial performance
analysis carried out with the TOPSIS method in production enterprises
is quite appropriate to the essence of the method. The aim of this study
is to test the success of cost and profitability ratios in the financial
performance analysis which will be carried out with the TOPSIS
method in production enterprises. Accordingly, the success of a
company listed in the Istanbul Stock Exchange Basic Metal Industry
Index was calculated by years and the accuracy of the obtained results
and the economic reasons underneath were examined. According to the
cost and profitability ratios between 2008 and 2017, 2008 was the most
successful year and 2015 was the least successful year. Although the
findings of the analysis are confirmed by the results of the fundamental
analysis, national and international developments in the sector support
the results of the analysis. As a result, the use of cost and profitability
ratios with the TOPSIS method in the study revealed accurate results.
Keywords:
Multi-Criteria
Decision-Making,
TOPSIS, Cost and
Profitability Ratios,
Financial Performance
Valuation, Iron and
Steel
1. Giriş
Küresel rekabet ortamında yaşanan ekonomik, sosyal ve kültürel alandaki değişim, gelişim ve
dönüşümler, siyasi sınırların önemini yitirdiği ve ekonomik bölgelerin önem kazandığı dünya pazarını
oluşturmuştur. Ortaya çıkan küresel anlamdaki bu pazar kavramı, işletmeleri dünya çapındaki
rakiplerini ve gelişmeleri dikkate alarak karar vermeye zorlamaktadır (Uslu, 1985, s. 19). Dolayısıyla
işletmeler küresel rekabet ortamında hayatta kalabilmek ve daha iyi bir konuma gelebilmek hatta bunu
sürdürebilir olarak sağlamak için stratejik planlamaları esnasında performanslarını geleceğe ışık
tutabilecek şekilde değerlendirmelidirler (Bakırcı vd., 2014, s. 9-19). Bu bağlamda işletmelerde
yapılan performans değerlendirmelerini dikkate alarak karar verme konumunda olan yöneticiler,
alacakları kararlarda rasyonel davranış sergilemelidir. Yöneticilerin, rasyonel hareket etmeleri adına
alacakları kararlarda; etkin, verimli ve tutumlu olmaları gerekmektedir. Karar almada etkinlik; karar
vericinin doğru kararı vermesini, verimlilik; verilen kararın fiilen gerçekleşme düzeyini, tutumluluk
ise; verilen kararın uygun zamanda ve makul maliyette gerçekleştirilmesini ifade etmektedir. Rasyonel
karar vermek için öncelikle karar vericinin doğru kararı alması sağlanmalıdır. Bu amaç doğrultusunda,
alınacak kararların objektif ve bilimsel temellere dayandırılması alınacak kararların rasyonellik
düzeyini artıracaktır.
İşletme düzeyinde ya da sektör bazında yapılacak olan finansal değerlendirmeler, işletmelerde
karar alıcı konumunda olan yöneticiler açısından önem taşımakla birlikte finansal bilgi kullanıcıları
açısından da önem arz etmektedir (Peker, 1988, s. 16). Diğer bir anlatımla, işletme yöneticileri
tarafından alınacak rasyonel kararlar tüm çıkar gruplarının yararına olacaktır. Dolayısıyla dinamik
ekonomik koşulların geçerli olduğu küresel piyasalarda, finansal performans değerlendirmesi gerek
işletme bazında gerekse sektör bazında zorunlu hale gelmiştir (Bakırcı vd., 2014, s. 9-19). İşletme
adına alınacak kararlarda bilimsel yöntemlerden yararlanılarak; objektif değerlendirme sonuçlarıyla
alınacak olan kararlar desteklenmeli, bu sayede karşılaşılması muhtemel olan riskler ve oluşabilecek
kayıpların minimuma indirilmesi sağlanarak rasyonel kararların alınmasına katkı sağlanmalıdır
Yıldıırm, M., Karakaya, Ö. & Altan, İ. M . Gazi İktisat ve İşletme Dergisi, 2019; 5(3): 170-181
ISSN: 2548-0162 © 2019 Gazi Akademik Yayıncılık 172
(Akyüz vd., 2011, s. 73-92). Bu bağlamda, çok ölçütlü karar verme teknikleri, farklı alternatif karar
kriterlere ve ağırlıklara göre optimum sonucu elde etmeyi amaçlaması noktasında, işletme
yöneticilerinin finansal değerlendirmelerle rasyonel kararlar almasını sağlamak amacıyla, karar aracı
olarak kullanılabilmektedir (Akbulut ve Rençber, 2015, s. 117-136). Bu çalışma, üretim işletmelerinde
TOPSIS yöntemi ile yapılacak finansal performans analizinde maliyet ve karlılık oranlarının başarısını
test etmeyi amaçlamaktadır.
TOPSIS yöntemi, işletmelerin finansal performans ölçümünde yaygın olarak kullanılan
yöntemlerden birisidir. TOPSIS yönteminin özünde, en düşük maliyetli, en yüksek fayda sağlayacak
seçenek optimum olarak kabul edilmektedir. Yapılacak analizde kullanılacak finansal oranların,
performansı ölçülecek işletmelere göre isabetli seçilmesi yapılacak analizin başarısını olumlu
etkileyecektir. Özellikle TOPSIS yöntemi ile üretim işletmelerinin finansal performansı analiz
edilirken maliyet ve karlılık oranlarının kullanılması, yöntemin özüne uygun düşmektedir. Finansal
performans analizlerinde kullanılan finansal oranlar kullanım amaçlarına göre değişim göstermekle
birlikte TOPSIS yönteminin doğasında olan maliyet minimizasyonu ve fayda maksimizasyonunu
yansıtmakta yetersiz kalabilmektedir (Sakarya ve Akkuş, 2015, s. 109-123). Bu noktada, çalışmada
kullanılan “maliyet ve karlılık oranları” sayesinde, TOPSIS yöntemiyle daha başarılı sonuçlar elde
edilebileceği düşünülmektedir. Bununla birlikte literatürdeki çalışmalar incelendiğinde TOPSIS
yöntemini kullanarak, sadece maliyet ve karlılık performansının değerlendirildiği çalışma yok denecek
kadar azdır. Bu bağlamda çalışmanın, alanda yapılacak çalışmalara katkı sağlayacağı
düşünülmektedir.
2. Literatür özeti
1981 yılında Hwang ve Yoon tarafından oluşturulan TOPSIS yöntemi; işletmelerin karar verme
sürecine katkı sağlamaktadır. TOPSIS yöntemi işletmelerin performanslarının ölçümünde birçok
sektörde gerek ulusal gerekse uluslararası çalışmalarda, kullanılmaktadır. Bu çerçevede işletme
performanslarının TOPSIS yöntemiyle değerlendirildiği yurtiçinde gerçekleştirilen çalışmalardan
bazıları aşağıda özetlenmiştir:
Yurdakul ve İç (2003), 1998 ile 2001 döneminde Borsa İstanbul'a kote olan beş büyük otomotiv
sanayi şirketinin finansal performansını TOPSIS yöntemiyle analiz etmişlerdir. Her yıl için elde edilen
performans puanıyla, ilgili şirketin hisse senedinin o yıl ki değeri karşılaştırılmıştır. Elde edilen
bulgular sonucunda, ilgili şirketlerin finansal performansları ile hisse senedi değerleri arasında büyük
ölçüde uyum olduğunu saptamışlardır.
Demireli (2010), çalışmasında ulusal olarak hizmet sunan kamu bankalarının finansal performans
ölçümünü TOPSIS yöntemi ile yapmıştır. 2001 ile 2007 yılları arasında kamu bankalarına ait finansal
oranların kullanıldığı çalışma sonucunda ilgili kamu bankalarının küresel ve yerel finansal krizlerden
etkilendikleri, finansal performans puanlarının yıllar itibariyle gelişmelere bağlı olarak dalgalanmalar
gösterdiği ve ilgili dönemde bankacılık sektöründe göze çarpan iyileşmenin yaşanmadığı sonucuna
varmıştır.
Dumanoğlu (2010), tarafından yapılan çalışmada Borsa İstanbul’da işlem görmekte olan on beş
çimento firmasının finansal performansı TOPSIS yöntemi ile analiz edilmiştir. 2004 ile 2009 yılları
arasında ilgili şirketlerin finansal tablolarından elde edilen oranlar, TOPSIS yöntemi ile puanlara
dönüştürülmüş ve elde edilen performans sonuçlarının değerlemesi ve karşılaştırılması yapılmıştır.
Dumanoğlu ve Ergül (2010), çalışmalarında Borsa İstanbul’da işlem görmekte olan on bir adet
teknoloji firmasının finansal performans ölçümünü TOPSIS yöntemini kullanarak yapmışlardır. İlgili
şirketlerin 2006 ile 2009 yılları arasındaki finansal oranlarının kullanıldığı analiz neticesinde, elde
edilen bulgular temel analiz sonuçları ile örtüşmektedir.
Çonkar vd. (2011), tarafından yapılan çalışmada Borsa İstanbul kurumsal yönetim endeksinde
işlem gören şirketlerin finansal performanslarıyla kurumsal yönetim notları arasındaki ilişki
araştırılmıştır. 2007 ve 2008 yılları için şirketlerin finansal oranları TOPSIS yöntemi yardımıyla başarı
puanlarına dönüştürülerek, bu puanlarla, ilgili şirketlerin kurumsal yönetim notları arasında ilişki olup
olmadığı araştırılmıştır. Yapılan değerlendirmelerin sonucunda kurumsal yönetim notları ile finansal
performans puanları arasında anlamlı bir ilişki bulunamamıştır.
Yıldıırm, M., Karakaya, Ö. & Altan, İ. M . Gazi İktisat ve İşletme Dergisi, 2019; 5(3): 170-181
ISSN: 2548-0162 © 2019 Gazi Akademik Yayıncılık 173
Uygurtürk ve Korkmaz (2012), çalışmalarında Borsa İstanbul'a kote olan on üç ana metal sanayi
şirketinin finansal performansını TOPSIS yöntemi ile analiz etmişlerdir. İlgili şirketlerin 2006 ile 2010
yıllarına ait finansal oranları kullanılarak, hesaplanan performans puanlarına göre işletmeleri
sıralamışlardır. Ana metal sanayi sektöründe faaliyette bulunan bu şirketlerin ilgili dönemde
performanslarında dalgalanmalar olduğu saptanmıştır.
Türkmen ve Çağıl (2012), tarafından yapılan çalışmada Borsa İstanbul bilişim endeksine kote
olan on iki adet şirketin finansal performansı, TOPSIS yöntemi ile analiz edilmiştir. 2007-2010
dönemi için hesaplanan finansal oranlar TOPSIS yöntemiyle puanlara dönüştürülerek şirketlerin
finansal performans derecelendirmeleri yapılmıştır.
Ergül (2014), çalışmasında Borsa İstanbul’a kote olan turizm ortaklıklarının finansal
performanslarının ölçümünü ELECTRE ve TOPSIS yöntemi ile yapmış, elde edilen bulguları
karşılaştırmalı olarak analiz etmiştir. 2005-2012 yıllarına ait finansal oranların kullanıldığı çalışmada
ELECTRE ve TOPSIS yöntemlerinin karar vermeyi sağlayan başarılı yöntemler olduğu belirlenmiştir.
Kahveci ve Turna (2016), çalışmalarında Borsa İstanbul’a kote olan turizm ortaklıklarının
finansal performans ölçümünü TOPSIS yöntemi ile yapmışlardır. 2010-2015 yıllarına ait finansal
oranlar kullanılarak hesaplanan finansal performans puanlarına göre şirketler bir sıralamaya tabi
tutulmuş ve sektörde faaliyet gösteren şirketlerin performans puanlarının belirlenmesinde etkili olan
öncelikli finansal oranlar belirlenmiştir.
Bayramoğlu ve Başarır (2016), çalışmalarında Borsa İstanbul’a kote olan altı adet sigorta
ortaklığının finansal oranlarını kullanarak TOPSIS yöntemi ile finansal performans değerlendirmesini
yapmışlardır. 2011 ile 2014 yıllarına ait finansal oranların kullanıldığı çalışmada dört ortaklığın, farklı
düzeylerde olmakla birlikte, finansal açıdan başarılı olduğunu; iki sigorta şirketinin ise başarısız
olduğunu saptamışlardır.
Orçun ve Eren (2017), çalışmalarında Borsa İstanbul’a kote olan teknoloji ortaklıklarının finansal
performans ölçümünü TOPSIS yöntemini kullanarak yapmışlardır. 2010 ile 2015 yılları için elde
edilen finansal performans sıralaması ile borsa getiri sıralamaları karşılaştırılmış ve herhangi bir
anlamlı ilişki tespit edilememiştir.
Metin vd. (2017), çalışmalarında Borsa İstanbul’a kote olan on bir adet enerji şirketinin finansal
performansını TOPSIS ve MOORA yöntemleri ile analiz etmişlerdir. 2010-2015 yılları arasındaki
finansal oranların kullanıldığı çalışmada, TOPSIS ve MOORA yöntemlerinin sonuçlarının değişkenlik
gösterdiği ve sadece üç firmanın finansal performans sıralamasının aynı çıktığı belirlenmiştir. Bununla
birlikte, tüm yıllarda en iyi ve en kötü finansal performans gösteren tek bir şirketin olmadığını
belirlemişlerdir.
Yurtdışında işletme performansının TOPSIS yöntemi ile analiz edildiği çeşitli çalışmalar
mevcuttur. Feng ve Wang (2000), yaptıkları çalışmada, Tayvan’da faaliyet gösteren beş havayolu
şirketinin finansal göstergelerini kullanarak belirlenen yirmi iki adet değişkene göre şirketlerin
performans düzeyini TOPSIS yöntemiyle incelemişlerdir. Çalışmanın sonucunda havayolu
şirketlerinin performanslarının değerlendirilmesinde finansal göstergelerin finansal olmayan
göstergelere göre daha etkili olduğunu belirlemişlerdir.
Aliakbarzadeh ve Tabriz (2014), yaptıkları çalışmada, faizsiz kredi fonunun piyasadaki
performansını ölçmeyi amaçlamışlardır. Çalışmada 2013-2014 yılları arasında Tose Asr Shomal adlı
faizsiz kredi fonunun piyasadaki performansını TOPSIS yöntemiyle analiz etmişlerdir. Yapılan
TOPSIS analizinin devamında fonun performansını ölçmek için anket uygulaması da yapmışlardır.
Anket uygulamasında hem finansal hem de finansal olmayan veriler birlikte kullanılmıştır. Daha sonra
anket sonuçlarıyla, Bulanık AHP ve TOPSIS yöntemleri birlikte kullanılarak performans ölçümünü
gerçekleştirmişlerdir. Çalışmanın sonucunda finansal kriterlerin finansal olmayan kriterlere göre daha
fazla öneme sahip olduğunu belirlemişlerdir.
Mandic vd. (2014), yaptıkları çalışmada, 2005-2010 yılları arasında Sırbistan Bankacılık
sektöründe faaliyet göstermekte olan bankaları analiz etmişlerdir. Çalışmada kriterlerin
ağırlıklandırılması için Fuzzy AHP kullanıldıktan sonra bankaların performanslarının ölçümü ve
sıralaması işlemi için TOPSIS yöntemi kullanılmıştır. Yapılan performans ölçümünde performans
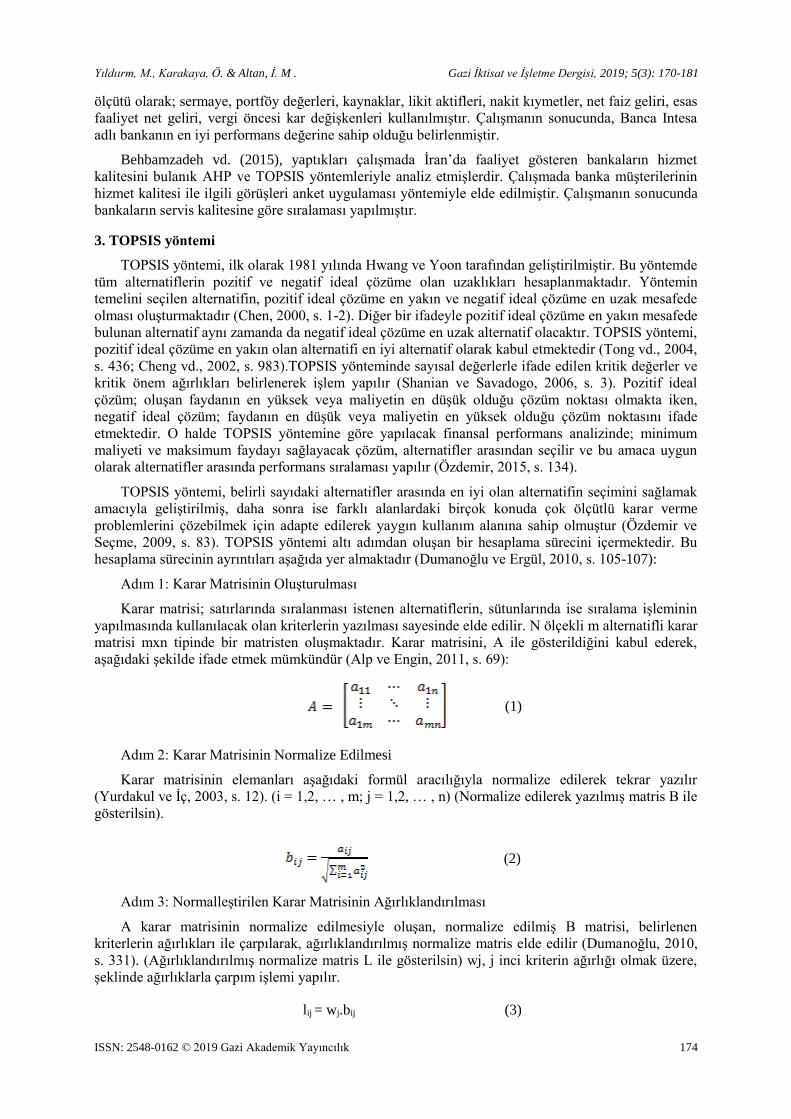
Yıldıırm, M., Karakaya, Ö. & Altan, İ. M . Gazi İktisat ve İşletme Dergisi, 2019; 5(3): 170-181
ISSN: 2548-0162 © 2019 Gazi Akademik Yayıncılık 174
ölçütü olarak; sermaye, portföy değerleri, kaynaklar, likit aktifleri, nakit kıymetler, net faiz geliri, esas
faaliyet net geliri, vergi öncesi kar değişkenleri kullanılmıştır. Çalışmanın sonucunda, Banca Intesa
adlı bankanın en iyi performans değerine sahip olduğu belirlenmiştir.
Behbamzadeh vd. (2015), yaptıkları çalışmada İran’da faaliyet gösteren bankaların hizmet
kalitesini bulanık AHP ve TOPSIS yöntemleriyle analiz etmişlerdir. Çalışmada banka müşterilerinin
hizmet kalitesi ile ilgili görüşleri anket uygulaması yöntemiyle elde edilmiştir. Çalışmanın sonucunda
bankaların servis kalitesine göre sıralaması yapılmıştır.
3. TOPSIS yöntemi
TOPSIS yöntemi, ilk olarak 1981 yılında Hwang ve Yoon tarafından geliştirilmiştir. Bu yöntemde
tüm alternatiflerin pozitif ve negatif ideal çözüme olan uzaklıkları hesaplanmaktadır. Yöntemin
temelini seçilen alternatifin, pozitif ideal çözüme en yakın ve negatif ideal çözüme en uzak mesafede
olması oluşturmaktadır (Chen, 2000, s. 1-2). Diğer bir ifadeyle pozitif ideal çözüme en yakın mesafede
bulunan alternatif aynı zamanda da negatif ideal çözüme en uzak alternatif olacaktır. TOPSIS yöntemi,
pozitif ideal çözüme en yakın olan alternatifi en iyi alternatif olarak kabul etmektedir (Tong vd., 2004,
s. 436; Cheng vd., 2002, s. 983).TOPSIS yönteminde sayısal değerlerle ifade edilen kritik değerler ve
kritik önem ağırlıkları belirlenerek işlem yapılır (Shanian ve Savadogo, 2006, s. 3). Pozitif ideal
çözüm; oluşan faydanın en yüksek veya maliyetin en düşük olduğu çözüm noktası olmakta iken,
negatif ideal çözüm; faydanın en düşük veya maliyetin en yüksek olduğu çözüm noktasını ifade
etmektedir. O halde TOPSIS yöntemine göre yapılacak finansal performans analizinde; minimum
maliyeti ve maksimum faydayı sağlayacak çözüm, alternatifler arasından seçilir ve bu amaca uygun
olarak alternatifler arasında performans sıralaması yapılır (Özdemir, 2015, s. 134).
TOPSIS yöntemi, belirli sayıdaki alternatifler arasında en iyi olan alternatifin seçimini sağlamak
amacıyla geliştirilmiş, daha sonra ise farklı alanlardaki birçok konuda çok ölçütlü karar verme
problemlerini çözebilmek için adapte edilerek yaygın kullanım alanına sahip olmuştur (Özdemir ve
Seçme, 2009, s. 83). TOPSIS yöntemi altı adımdan oluşan bir hesaplama sürecini içermektedir. Bu
hesaplama sürecinin ayrıntıları aşağıda yer almaktadır (Dumanoğlu ve Ergül, 2010, s. 105-107):
Adım 1: Karar Matrisinin Oluşturulması
Karar matrisi; satırlarında sıralanması istenen alternatiflerin, sütunlarında ise sıralama işleminin
yapılmasında kullanılacak olan kriterlerin yazılması sayesinde elde edilir. N ölçekli m alternatifli karar
matrisi mxn tipinde bir matristen oluşmaktadır. Karar matrisini, A ile gösterildiğini kabul ederek,
aşağıdaki şekilde ifade etmek mümkündür (Alp ve Engin, 2011, s. 69):
(1)
Adım 2: Karar Matrisinin Normalize Edilmesi
Karar matrisinin elemanları aşağıdaki formül aracılığıyla normalize edilerek tekrar yazılır
(Yurdakul ve İç, 2003, s. 12). (i = 1,2, … , m; j = 1,2, … , n) (Normalize edilerek yazılmış matris B ile
gösterilsin).
(2)
Adım 3: Normalleştirilen Karar Matrisinin Ağırlıklandırılması
A karar matrisinin normalize edilmesiyle oluşan, normalize edilmiş B matrisi, belirlenen
kriterlerin ağırlıkları ile çarpılarak, ağırlıklandırılmış normalize matris elde edilir (Dumanoğlu, 2010,
s. 331). (Ağırlıklandırılmış normalize matris L ile gösterilsin) wj, j inci kriterin ağırlığı olmak üzere,
şeklinde ağırlıklarla çarpım işlemi yapılır.
lij = wj.bij (3)
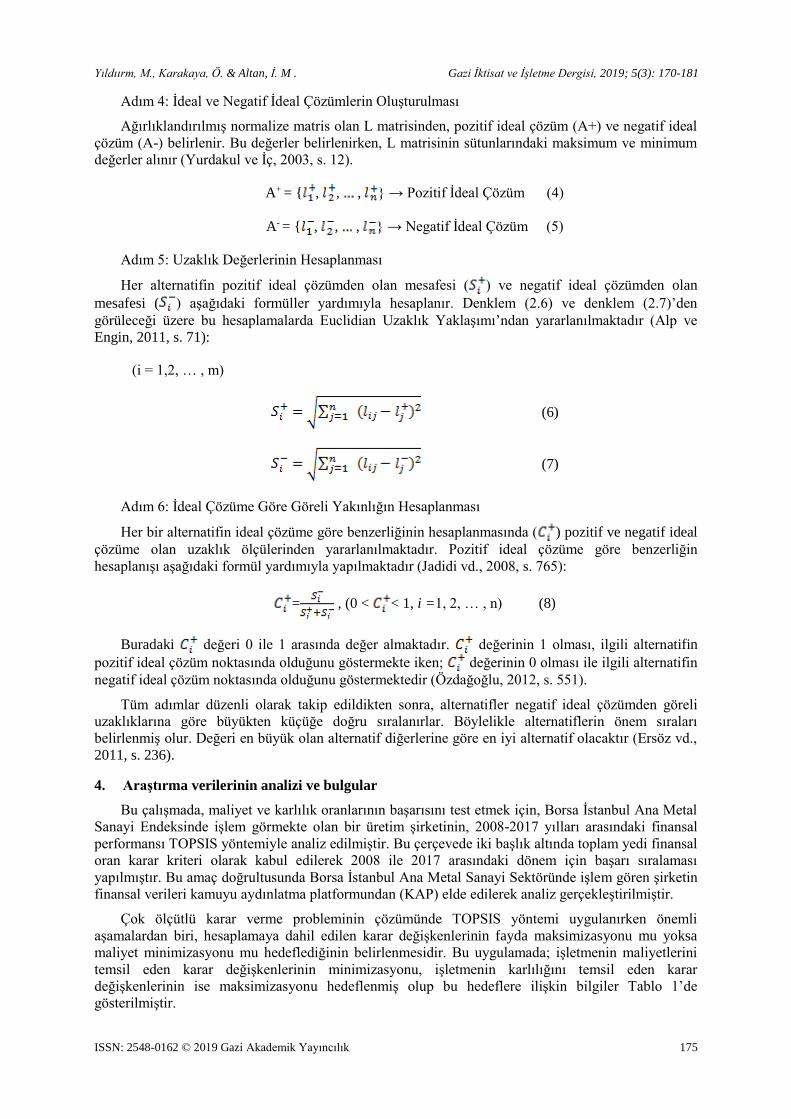
Yıldıırm, M., Karakaya, Ö. & Altan, İ. M . Gazi İktisat ve İşletme Dergisi, 2019; 5(3): 170-181
ISSN: 2548-0162 © 2019 Gazi Akademik Yayıncılık 175
Adım 4: İdeal ve Negatif İdeal Çözümlerin Oluşturulması
Ağırlıklandırılmış normalize matris olan L matrisinden, pozitif ideal çözüm (A+) ve negatif ideal
çözüm (A-) belirlenir. Bu değerler belirlenirken, L matrisinin sütunlarındaki maksimum ve minimum
değerler alınır (Yurdakul ve İç, 2003, s. 12).
A+ = { , , , } → Pozitif İdeal Çözüm (4)
A- = { , , , } → Negatif İdeal Çözüm (5)
Adım 5: Uzaklık Değerlerinin Hesaplanması
Her alternatifin pozitif ideal çözümden olan mesafesi ( ) ve negatif ideal çözümden olan
mesafesi ( ) aşağıdaki formüller yardımıyla hesaplanır. Denklem (2.6) ve denklem (2.7)’den
görüleceği üzere bu hesaplamalarda Euclidian Uzaklık Yaklaşımı’ndan yararlanılmaktadır (Alp ve
Engin, 2011, s. 71):
(i = 1,2, … , m)
(6)
(7)
Adım 6: İdeal Çözüme Göre Göreli Yakınlığın Hesaplanması
Her bir alternatifin ideal çözüme göre benzerliğinin hesaplanmasında ( ) pozitif ve negatif ideal
çözüme olan uzaklık ölçülerinden yararlanılmaktadır. Pozitif ideal çözüme göre benzerliğin
hesaplanışı aşağıdaki formül yardımıyla yapılmaktadır (Jadidi vd., 2008, s. 765):
= , (0 < < 1, i =1, 2, … , n) (8)
Buradaki değeri 0 ile 1 arasında değer almaktadır. değerinin 1 olması, ilgili alternatifin
pozitif ideal çözüm noktasında olduğunu göstermekte iken; değerinin 0 olması ile ilgili alternatifin
negatif ideal çözüm noktasında olduğunu göstermektedir (Özdağoğlu, 2012, s. 551).
Tüm adımlar düzenli olarak takip edildikten sonra, alternatifler negatif ideal çözümden göreli
uzaklıklarına göre büyükten küçüğe doğru sıralanırlar. Böylelikle alternatiflerin önem sıraları
belirlenmiş olur. Değeri en büyük olan alternatif diğerlerine göre en iyi alternatif olacaktır (Ersöz vd.,
2011, s. 236).
4. Araştırma verilerinin analizi ve bulgular
Bu çalışmada, maliyet ve karlılık oranlarının başarısını test etmek için, Borsa İstanbul Ana Metal
Sanayi Endeksinde işlem görmekte olan bir üretim şirketinin, 2008-2017 yılları arasındaki finansal
performansı TOPSIS yöntemiyle analiz edilmiştir. Bu çerçevede iki başlık altında toplam yedi finansal
oran karar kriteri olarak kabul edilerek 2008 ile 2017 arasındaki dönem için başarı sıralaması
yapılmıştır. Bu amaç doğrultusunda Borsa İstanbul Ana Metal Sanayi Sektöründe işlem gören şirketin
finansal verileri kamuyu aydınlatma platformundan (KAP) elde edilerek analiz gerçekleştirilmiştir.
Çok ölçütlü karar verme probleminin çözümünde TOPSIS yöntemi uygulanırken önemli
aşamalardan biri, hesaplamaya dahil edilen karar değişkenlerinin fayda maksimizasyonu mu yoksa
maliyet minimizasyonu mu hedeflediğinin belirlenmesidir. Bu uygulamada; işletmenin maliyetlerini
temsil eden karar değişkenlerinin minimizasyonu, işletmenin karlılığını temsil eden karar
değişkenlerinin ise maksimizasyonu hedeflenmiş olup bu hedeflere ilişkin bilgiler Tablo 1’de
gösterilmiştir.
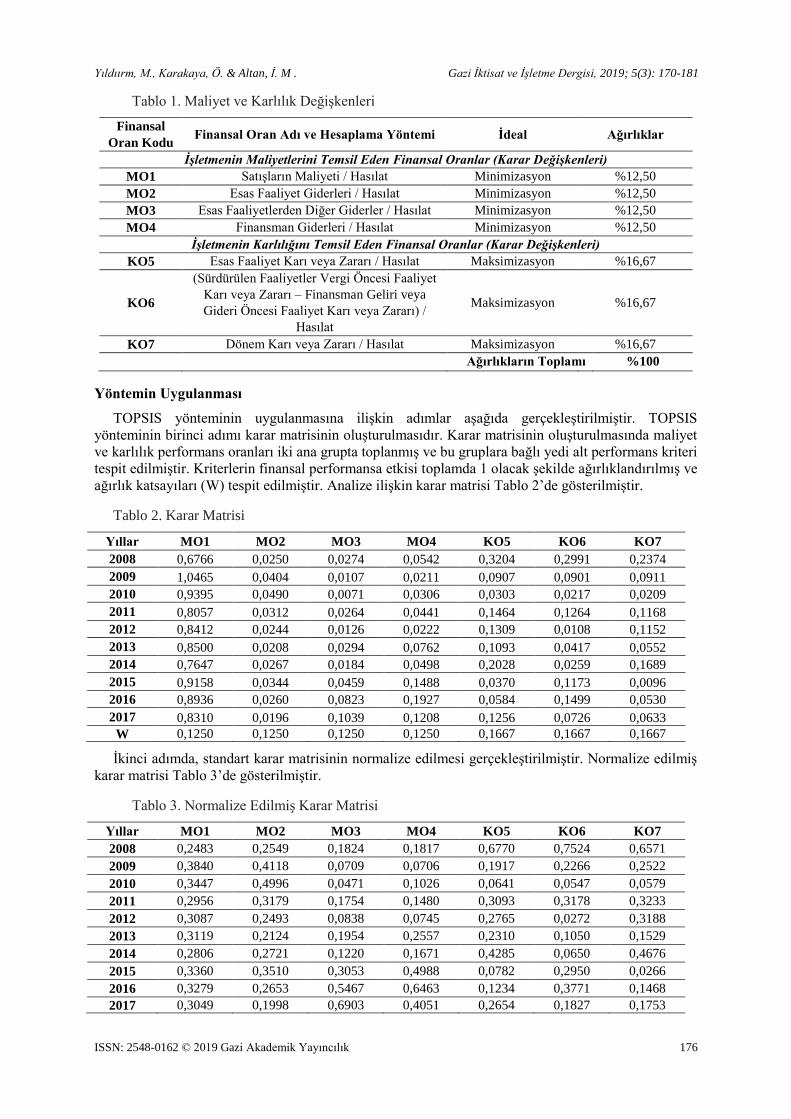
Yıldıırm, M., Karakaya, Ö. & Altan, İ. M . Gazi İktisat ve İşletme Dergisi, 2019; 5(3): 170-181
ISSN: 2548-0162 © 2019 Gazi Akademik Yayıncılık 176
Tablo 1. Maliyet ve Karlılık Değişkenleri
Finansal
Oran Kodu Finansal Oran Adı ve Hesaplama Yöntemi İdeal Ağırlıklar
İşletmenin Maliyetlerini Temsil Eden Finansal Oranlar (Karar Değişkenleri)
MO1 Satışların Maliyeti / Hasılat Minimizasyon %12,50
MO2 Esas Faaliyet Giderleri / Hasılat Minimizasyon %12,50
MO3 Esas Faaliyetlerden Diğer Giderler / Hasılat Minimizasyon %12,50
MO4 Finansman Giderleri / Hasılat Minimizasyon %12,50
İşletmenin Karlılığını Temsil Eden Finansal Oranlar (Karar Değişkenleri)
KO5 Esas Faaliyet Karı veya Zararı / Hasılat Maksimizasyon %16,67
KO6
(Sürdürülen Faaliyetler Vergi Öncesi Faaliyet
Karı veya Zararı – Finansman Geliri veya
Gideri Öncesi Faaliyet Karı veya Zararı) /
Hasılat
Maksimizasyon %16,67
KO7 Dönem Karı veya Zararı / Hasılat Maksimizasyon %16,67
Ağırlıkların Toplamı %100
Yöntemin Uygulanması
TOPSIS yönteminin uygulanmasına ilişkin adımlar aşağıda gerçekleştirilmiştir. TOPSIS
yönteminin birinci adımı karar matrisinin oluşturulmasıdır. Karar matrisinin oluşturulmasında maliyet
ve karlılık performans oranları iki ana grupta toplanmış ve bu gruplara bağlı yedi alt performans kriteri
tespit edilmiştir. Kriterlerin finansal performansa etkisi toplamda 1 olacak şekilde ağırlıklandırılmış ve
ağırlık katsayıları (W) tespit edilmiştir. Analize ilişkin karar matrisi Tablo 2’de gösterilmiştir.
Tablo 2. Karar Matrisi
Yıllar MO1 MO2 MO3 MO4 KO5 KO6 KO7
2008 0,6766 0,0250 0,0274 0,0542 0,3204 0,2991 0,2374
2009 1,0465 0,0404 0,0107 0,0211 0,0907 0,0901 0,0911
2010 0,9395 0,0490 0,0071 0,0306 0,0303 0,0217 0,0209
2011 0,8057 0,0312 0,0264 0,0441 0,1464 0,1264 0,1168
2012 0,8412 0,0244 0,0126 0,0222 0,1309 0,0108 0,1152
2013 0,8500 0,0208 0,0294 0,0762 0,1093 0,0417 0,0552
2014 0,7647 0,0267 0,0184 0,0498 0,2028 0,0259 0,1689
2015 0,9158 0,0344 0,0459 0,1488 0,0370 0,1173 0,0096
2016 0,8936 0,0260 0,0823 0,1927 0,0584 0,1499 0,0530
2017 0,8310 0,0196 0,1039 0,1208 0,1256 0,0726 0,0633
W 0,1250 0,1250 0,1250 0,1250 0,1667 0,1667 0,1667
İkinci adımda, standart karar matrisinin normalize edilmesi gerçekleştirilmiştir. Normalize edilmiş
karar matrisi Tablo 3’de gösterilmiştir.
Tablo 3. Normalize Edilmiş Karar Matrisi
Yıllar MO1 MO2 MO3 MO4 KO5 KO6 KO7
2008 0,2483 0,2549 0,1824 0,1817 0,6770 0,7524 0,6571
2009 0,3840 0,4118 0,0709 0,0706 0,1917 0,2266 0,2522
2010 0,3447 0,4996 0,0471 0,1026 0,0641 0,0547 0,0579
2011 0,2956 0,3179 0,1754 0,1480 0,3093 0,3178 0,3233
2012 0,3087 0,2493 0,0838 0,0745 0,2765 0,0272 0,3188
2013 0,3119 0,2124 0,1954 0,2557 0,2310 0,1050 0,1529
2014 0,2806 0,2721 0,1220 0,1671 0,4285 0,0650 0,4676
2015 0,3360 0,3510 0,3053 0,4988 0,0782 0,2950 0,0266
2016 0,3279 0,2653 0,5467 0,6463 0,1234 0,3771 0,1468
2017 0,3049 0,1998 0,6903 0,4051 0,2654 0,1827 0,1753
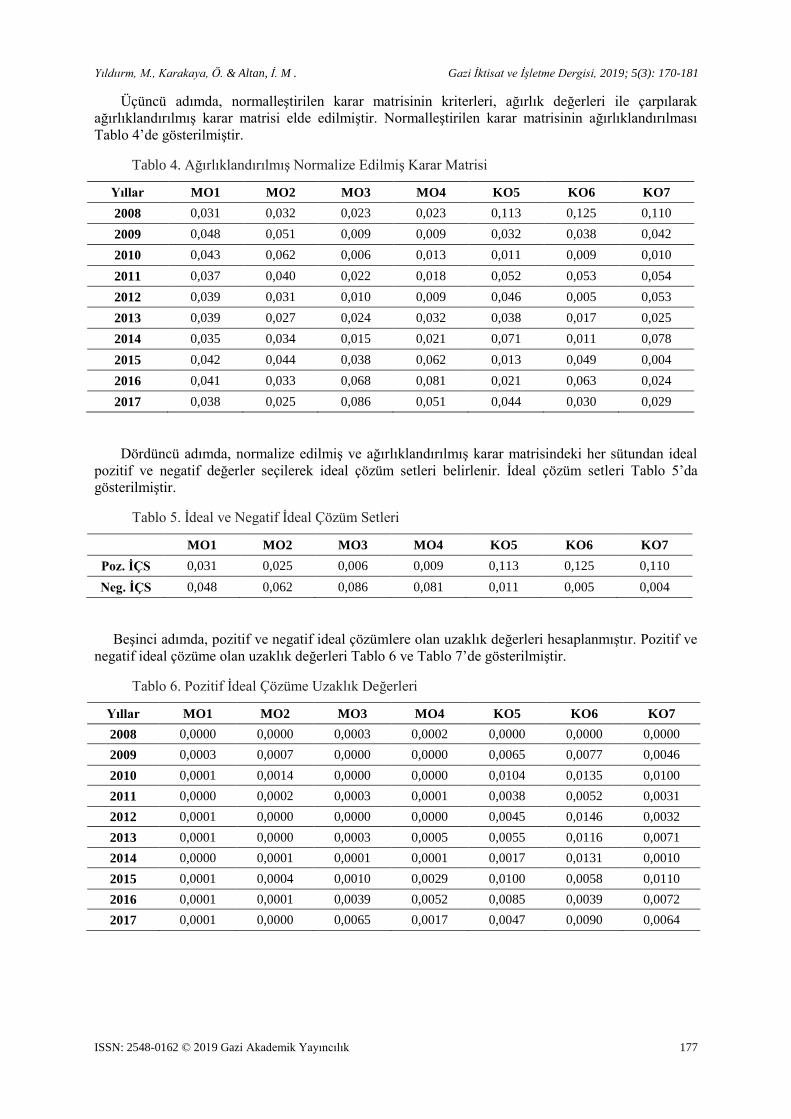
Yıldıırm, M., Karakaya, Ö. & Altan, İ. M . Gazi İktisat ve İşletme Dergisi, 2019; 5(3): 170-181
ISSN: 2548-0162 © 2019 Gazi Akademik Yayıncılık 177
Üçüncü adımda, normalleştirilen karar matrisinin kriterleri, ağırlık değerleri ile çarpılarak
ağırlıklandırılmış karar matrisi elde edilmiştir. Normalleştirilen karar matrisinin ağırlıklandırılması
Tablo 4’de gösterilmiştir.
Tablo 4. Ağırlıklandırılmış Normalize Edilmiş Karar Matrisi
Yıllar MO1 MO2 MO3 MO4 KO5 KO6 KO7
2008 0,031 0,032 0,023 0,023 0,113 0,125 0,110
2009 0,048 0,051 0,009 0,009 0,032 0,038 0,042
2010 0,043 0,062 0,006 0,013 0,011 0,009 0,010
2011 0,037 0,040 0,022 0,018 0,052 0,053 0,054
2012 0,039 0,031 0,010 0,009 0,046 0,005 0,053
2013 0,039 0,027 0,024 0,032 0,038 0,017 0,025
2014 0,035 0,034 0,015 0,021 0,071 0,011 0,078
2015 0,042 0,044 0,038 0,062 0,013 0,049 0,004
2016 0,041 0,033 0,068 0,081 0,021 0,063 0,024
2017 0,038 0,025 0,086 0,051 0,044 0,030 0,029
Dördüncü adımda, normalize edilmiş ve ağırlıklandırılmış karar matrisindeki her sütundan ideal
pozitif ve negatif değerler seçilerek ideal çözüm setleri belirlenir. İdeal çözüm setleri Tablo 5’da
gösterilmiştir.
Tablo 5. İdeal ve Negatif İdeal Çözüm Setleri
MO1 MO2 MO3 MO4 KO5 KO6 KO7
Poz. İÇS 0,031 0,025 0,006 0,009 0,113 0,125 0,110
Neg. İÇS 0,048 0,062 0,086 0,081 0,011 0,005 0,004
Beşinci adımda, pozitif ve negatif ideal çözümlere olan uzaklık değerleri hesaplanmıştır. Pozitif ve
negatif ideal çözüme olan uzaklık değerleri Tablo 6 ve Tablo 7’de gösterilmiştir.
Tablo 6. Pozitif İdeal Çözüme Uzaklık Değerleri
Yıllar MO1 MO2 MO3 MO4 KO5 KO6 KO7
2008 0,0000 0,0000 0,0003 0,0002 0,0000 0,0000 0,0000
2009 0,0003 0,0007 0,0000 0,0000 0,0065 0,0077 0,0046
2010 0,0001 0,0014 0,0000 0,0000 0,0104 0,0135 0,0100
2011 0,0000 0,0002 0,0003 0,0001 0,0038 0,0052 0,0031
2012 0,0001 0,0000 0,0000 0,0000 0,0045 0,0146 0,0032
2013 0,0001 0,0000 0,0003 0,0005 0,0055 0,0116 0,0071
2014 0,0000 0,0001 0,0001 0,0001 0,0017 0,0131 0,0010
2015 0,0001 0,0004 0,0010 0,0029 0,0100 0,0058 0,0110
2016 0,0001 0,0001 0,0039 0,0052 0,0085 0,0039 0,0072
2017 0,0001 0,0000 0,0065 0,0017 0,0047 0,0090 0,0064
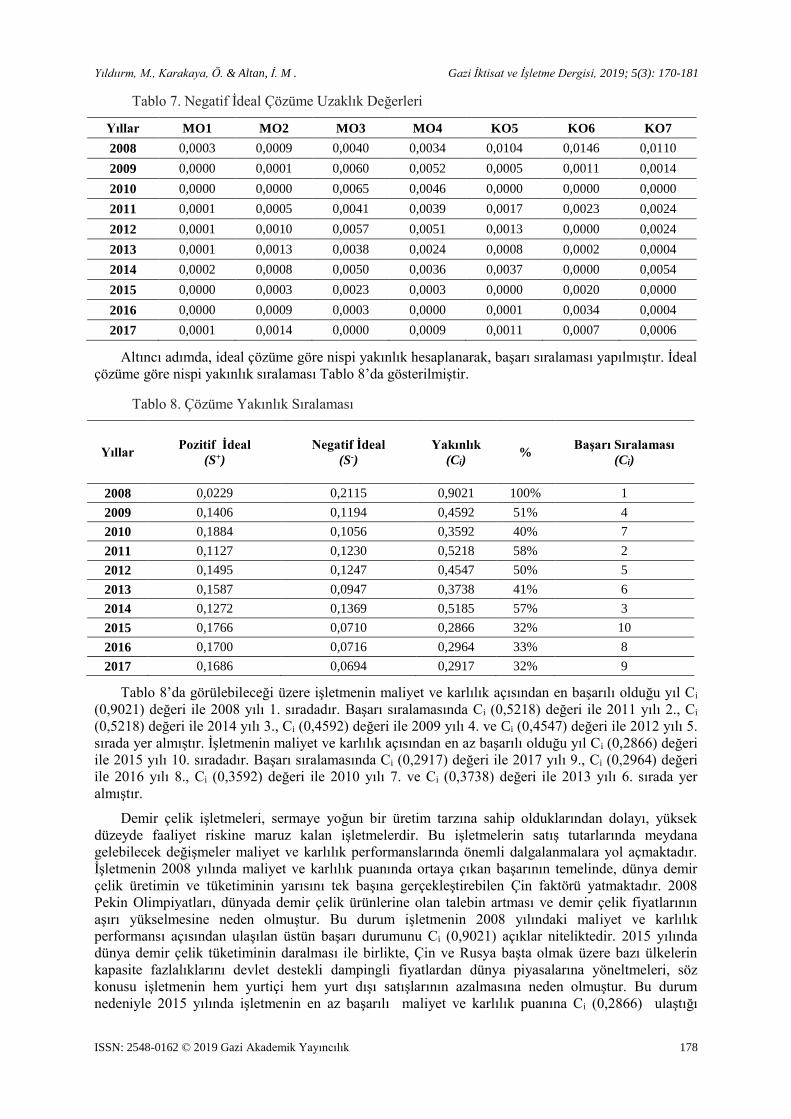
Yıldıırm, M., Karakaya, Ö. & Altan, İ. M . Gazi İktisat ve İşletme Dergisi, 2019; 5(3): 170-181
ISSN: 2548-0162 © 2019 Gazi Akademik Yayıncılık 178
Tablo 7. Negatif İdeal Çözüme Uzaklık Değerleri
Yıllar MO1 MO2 MO3 MO4 KO5 KO6 KO7
2008 0,0003 0,0009 0,0040 0,0034 0,0104 0,0146 0,0110
2009 0,0000 0,0001 0,0060 0,0052 0,0005 0,0011 0,0014
2010 0,0000 0,0000 0,0065 0,0046 0,0000 0,0000 0,0000
2011 0,0001 0,0005 0,0041 0,0039 0,0017 0,0023 0,0024
2012 0,0001 0,0010 0,0057 0,0051 0,0013 0,0000 0,0024
2013 0,0001 0,0013 0,0038 0,0024 0,0008 0,0002 0,0004
2014 0,0002 0,0008 0,0050 0,0036 0,0037 0,0000 0,0054
2015 0,0000 0,0003 0,0023 0,0003 0,0000 0,0020 0,0000
2016 0,0000 0,0009 0,0003 0,0000 0,0001 0,0034 0,0004
2017 0,0001 0,0014 0,0000 0,0009 0,0011 0,0007 0,0006
Altıncı adımda, ideal çözüme göre nispi yakınlık hesaplanarak, başarı sıralaması yapılmıştır. İdeal
çözüme göre nispi yakınlık sıralaması Tablo 8’da gösterilmiştir.
Tablo 8. Çözüme Yakınlık Sıralaması
Yıllar Pozitif İdeal
(S+)
Negatif İdeal
(S-)
Yakınlık
(Ci) %
Başarı Sıralaması
(Ci)
2008 0,0229 0,2115 0,9021 100% 1
2009 0,1406 0,1194 0,4592 51% 4
2010 0,1884 0,1056 0,3592 40% 7
2011 0,1127 0,1230 0,5218 58% 2
2012 0,1495 0,1247 0,4547 50% 5
2013 0,1587 0,0947 0,3738 41% 6
2014 0,1272 0,1369 0,5185 57% 3
2015 0,1766 0,0710 0,2866 32% 10
2016 0,1700 0,0716 0,2964 33% 8
2017 0,1686 0,0694 0,2917 32% 9
Tablo 8’da görülebileceği üzere işletmenin maliyet ve karlılık açısından en başarılı olduğu yıl Ci
(0,9021) değeri ile 2008 yılı 1. sıradadır. Başarı sıralamasında Ci (0,5218) değeri ile 2011 yılı 2., Ci
(0,5218) değeri ile 2014 yılı 3., Ci (0,4592) değeri ile 2009 yılı 4. ve Ci (0,4547) değeri ile 2012 yılı 5.
sırada yer almıştır. İşletmenin maliyet ve karlılık açısından en az başarılı olduğu yıl Ci (0,2866) değeri
ile 2015 yılı 10. sıradadır. Başarı sıralamasında Ci (0,2917) değeri ile 2017 yılı 9., Ci (0,2964) değeri
ile 2016 yılı 8., Ci (0,3592) değeri ile 2010 yılı 7. ve Ci (0,3738) değeri ile 2013 yılı 6. sırada yer
almıştır.
Demir çelik işletmeleri, sermaye yoğun bir üretim tarzına sahip olduklarından dolayı, yüksek
düzeyde faaliyet riskine maruz kalan işletmelerdir. Bu işletmelerin satış tutarlarında meydana
gelebilecek değişmeler maliyet ve karlılık performanslarında önemli dalgalanmalara yol açmaktadır.
İşletmenin 2008 yılında maliyet ve karlılık puanında ortaya çıkan başarının temelinde, dünya demir
çelik üretimin ve tüketiminin yarısını tek başına gerçekleştirebilen Çin faktörü yatmaktadır. 2008
Pekin Olimpiyatları, dünyada demir çelik ürünlerine olan talebin artması ve demir çelik fiyatlarının
aşırı yükselmesine neden olmuştur. Bu durum işletmenin 2008 yılındaki maliyet ve karlılık
performansı açısından ulaşılan üstün başarı durumunu Ci (0,9021) açıklar niteliktedir. 2015 yılında
dünya demir çelik tüketiminin daralması ile birlikte, Çin ve Rusya başta olmak üzere bazı ülkelerin
kapasite fazlalıklarını devlet destekli dampingli fiyatlardan dünya piyasalarına yöneltmeleri, söz
konusu işletmenin hem yurtiçi hem yurt dışı satışlarının azalmasına neden olmuştur. Bu durum
nedeniyle 2015 yılında işletmenin en az başarılı maliyet ve karlılık puanına Ci (0,2866) ulaştığı

Yıldıırm, M., Karakaya, Ö. & Altan, İ. M . Gazi İktisat ve İşletme Dergisi, 2019; 5(3): 170-181
ISSN: 2548-0162 © 2019 Gazi Akademik Yayıncılık 179
söylenebilir. Çin ve Rusya gibi ülkelerin devlet destekli dampingli ürünleri hem Türkiye’nin demir
çelik ürünleri ihracatını olumsuz etkilemiş hem de bu ürünlerin Türkiye’ye ithalatını artırmıştır. Bu
durum demir çelik sektörünün ve dolayısıyla ilgili işletmenin maliyet ve karlılık puanını olumsuz
etkilemiştir. Bu yönüyle Türkiye’nin (US dolar bazında) demir çelik ihracatı ile maliyet ve karlılık
performans puanları arasındaki ilişkinin görülmesi açısından Şekil 1’in oldukça dikkat çekici olduğu
düşünülmektedir. Şekil 1’de yıllar itibariyle Türkiye’nin (US dolar bazında) demir çelik ihracatı ile
maliyet ve karlılık performans puanları dönüştürülerek1 karşılaştırılmıştır.
20.456
12.00713.286
16.610 17.13315.761 15.183
11.75210.797
11.500
9.021
4.5923.592
5.2184.547
3.7385.185
2.866 2.964 2.9170
5.000
10.000
15.000
20.000
25.000
2007 2008 2009 2010 2011 2012 2013 2014 2015 2016 2017 2018
İhracat Yakınlık (Ci)
Şekil 1. Türkiye'nin Demir Çelik İhracatı(Milyon USD) ve İşletmenin Maliyet ve Karlılık Puanları ile
Karşılaştırılması (Kaynak: Türkiye Demir ve Demir Dışı Metaller Meclisi Sektör Raporu 2013-2017).
Şekil 1’de Türkiye’nin demir çelik ihracatı ile işletmenin maliyet ve karlılık performansı arasında
güçlü bir pozitif ilişki olduğu görülebilir. Bu iki değişken arasındaki korelasyon katsayısı (r) 0,854
olarak hesaplanmıştır. Türkiye demir çelik ürünleri ihracatının 20.456 Milyon Dolar olduğu 2008
yılında maliyet ve karlılık puanın Ci (0,9021) olması ve ihracatın 11.752 Milyon Dolar olduğu 2015
yılında maliyet ve karlılık puanın Ci (0,2866) olması oldukça anlamlıdır.
5. Sonuç
Çalışmada, üretim işletmelerinde TOPSIS yöntemi ile yapılacak finansal performans analizinde
önerilen maliyet ve karlılık oranlarının başarısı ortaya konulmaya çalışılmıştır. Bu amaç
doğrultusunda, Borsa İstanbul Ana Metal Sanayi Endeksine kote olan bir üretim şirketinin, 2008-2017
yılları arasındaki maliyet ve karlılık oranları, çok ölçütlü karar verme yöntemlerinden TOPSIS
yöntemiyle değerlendirilmiş ve başarı durumu sıralanmıştır.
Yapılan analiz sonucunda elde edilen maliyet ve karlılık puanlarına göre, ilgili işletmenin en
başarılı olduğu yılın 2008 yılı olduğu görülürken, en az başarılı olduğu yılın ise 2015 yılı olduğu
görülmüştür. İşletmenin satışlarında meydana gelen dalgalanmaların, işletmenin finansal
performansında dalgalanmalara yol açtığı görülmektedir. Bu durum sermaye yoğun faaliyet gösteren
işletmeler için oldukça normal bir durumdur. Özellikle, dünya demir çelik ürünlerine talebin tavan
yaptığı 2008 yılının en başarılı yıl olması; mevcut yerli ve yabancı pazarların kaybedildiği 2015 yılının
ise en az başarılı yıl olması elde edilen sonuçların isabeti bakımından oldukça anlamlıdır. Bu durum
ilgili dönemde Türkiye demir çelik ürünlerinin ihracat rakamları ile desteklenmektedir.
Analiz sonucunda elde edilen bulgular, TOPSIS yönteminin ve kullanılan oranların başarısını
doğrulanmakla birlikte sektörde yaşanan ulusal ve uluslararası gelişmeler analizin sonuçlarını
desteklemektedir. Sonuç olarak yapılan çalışmada kullanılan maliyet ve karlılık oranları TOPSIS
1 İlgili puanlar 1.000 ile çarpılarak aynı grafikte gösterilmesi sağlanmıştır.
Yıldıırm, M., Karakaya, Ö. & Altan, İ. M . Gazi İktisat ve İşletme Dergisi, 2019; 5(3): 170-181
ISSN: 2548-0162 © 2019 Gazi Akademik Yayıncılık 180
yöntemi ile isabetli sonuçlar ortaya koymuştur. Çalışmada kullanılan maliyet ve karlılık oranlarının
özellikle üretim işletmelerinin performans ölçümlerinde kullanılması bu alanda yapılacak diğer
çalışmalara da katkı sağlayacaktır.
Kaynakça
Akbulut, R. ve Rençber, Ö. (2015). BİST’te İmalat Sektöründeki İşletmelerin Finansal Performansları Üzerine
Bir Araştırma. Muhasebe ve Finansman Dergisi, (65), 117-136. DOI: 10.25095/mufad.396520
Akyüz, Y., Bozdoğan, T. ve Hantekin, E. (2011). TOPSIS Yöntemiyle Finansal Performansın Değerlendirilmesi
ve Bir Uygulama. Afyon Kocatepe Üniversitesi, İ.İ.B.F. Dergisi, 13(1), 73-92.
Aliakbarzadeh, A. ve Akbar, A. T. (2014). Performance Evaluation and Ranking The Branches of Bank Using
FAHP and TOPSIS Case Study: Tose Asr Shomal Interest-Free Loan Fund. International Journal of
Academic Research in Business and Social Sciences, 4(12), 199-217.
Alp, S. ve Taylan, E. (2011). Trafik Kazalarının Nedenleri ve Sonuçları Arasındaki İlişkinin TOPSİS ve AHP
Yöntemleri Kullanılarak Analizi ve Değerlendirilmesi. İstanbul Ticaret Üniversitesi Fen Bilimleri Dergisi,
19, 65-87.
Bakırcı, F., Shiraz, S.S. ve Sattary, A. (2014). BIST’da Demir, Çelik Metal Ana Sanayii Sektöründe Faaliyet
Gösteren İşletmelerin Finansal Performans Analizi: VZA Süper Etkinlik ve TOPSIS Uygulaması. Ege
Akademik Bakış Dergisi, 14(1), 19.
Bayramoğlu, M. F. ve Başarır, Ç. (2016). Borsa İstanbul’da İşlem Gören Sigorta Şirketlerinin Karşılaştırmalı
Finansal Analizi. Anadolu Üniversitesi Sosyal Bilimler Dergisi, 16(4), 135-144.
Behbamzadeh, R., Alaghebandha, M. ve Azizi, A. (2015). A Mixed-Integer Model with Genetic Algorithm for
Multi-Objective Assembly Line Balancing Problem in Fuzzy Manufacturing Environment. International
Journal of Engineering Innovation & Research, 4(1), 172-178.
Büyükmirza, K. (1995). Maliyet ve Yönetim Muhasebesi. Ankara: Barış Yayınevi.
Chen, C. T. (2000). Extensions of the TOPSIS for Group Decision-Making under Fuzzy Environment. Fuzzy
Sets and Systems, 114, 1-9.
Cheng, S., Chan, C. W. ve Huang, G. H. (2002). Using Multiple Criteria Decision Analysis for Supporting
Decisions of Solid Waste Management. Journal of Environment Science Health, 37(6), 975-990.
Çınar, Y. (2004). Çok Nitelikli Karar Verme ve Bankaların Mali Performanslarının Değerlendirilmesi Örneği,
(Yayınlanmamış Yüksek Lisans Tezi). Ankara Üniversitesi Sosyal Bilimler Enstitüsü, Ankara.
Çonkar, M. K., Elitaş, C. ve Atar, G. (2011). İMKB Kurumsal Yönetim Endeksi’ndeki Firmaların Finansal
Performanslarının TOPSIS Yöntemi ile Ölçümü ve Kurumsal Yönetim Notu İle Analizi. İstanbul
Üniversitesi İktisat Fakültesi Mecmuası, 61(1), 81-115.
Demireli, E. (2010). TOPSIS Çok Kriterli Karar Verme Sistemi: Türkiye’deki Kamu Bankaları Üzerine Bir
Uygulama. Girişimcilik ve Kalkınma Dergisi, 5(1), 101-112.
Dumanoğlu, S. (2010). İMKB’de İşlem Gören Çimento Şirketlerinin Mali Performansının TOPSIS Yöntemi ile
Değerlendirilmesi. Marmara Üniversitesi İ.İ.B.F. Dergisi, 29(2), 323-339.
Dumanoğlu, S. ve Ergül, N. (2010). İMKB'de İşlem Gören Teknoloji Şirketlerinin Mali Performans Ölçümü.
Muhasebe ve Finansman Dergisi, 48, 101-111.
Ergül, N. (2014). BİST-Turizm Sektöründeki Şirketlerin Finansal Performans Analizi. Çankırı Karatekin
Üniversitesi İktisadi ve İdari Bilimler Fakültesi Dergisi, 4(1), 325-340.
Ersöz, F., Kabak, M. ve Yılmaz, Z. (2011). Lisansüstü Öğreniminde Ders Seçimine Yönelik Bir Model Önerisi.
Afyon Kocatepe Üniversitesi İktisadi ve İdari Bilimler Fakülte Dergisi, 13(2), 227-249.
Feng, C.M. ve Rong-Tsu, W. (2000). Performance Evaluation for Airlines Including the Consideration of
Financial Ratios. Journal of Air Transport Management, 6, 133-142.
Jadidi O., Hong Tang, S., Firouzi, F., Mardiana, Y. R. ve Zulkifli, N. (2008). TOPSIS and Fuzzy Multi-
Objective Model Integration for Supplier Selection Problem. Journal of Achievements in Materials and
Manufacturing Engineering, 31(2), 762-769.
Kahveci, M. ve Turna, İ. (2016). BİST’te İşlem Gören Turizm İşletmelerinin TOPSIS Tekniği ile Finansal
Performanslarının Analizi ve Değerlendirilmesi. Muhasebe ve Denetime Bakış Dergisi, 48, 99-114.
Kim, G., Park, C. S. ve Yoon, K. P. (1997). Identifying Investment Opportunities for Advanced Manufacturing
Systems with Comparative-Integrated Performance Measurement. International Journal of Production
Economics, 50, 23-33.

Yıldıırm, M., Karakaya, Ö. & Altan, İ. M . Gazi İktisat ve İşletme Dergisi, 2019; 5(3): 170-181
ISSN: 2548-0162 © 2019 Gazi Akademik Yayıncılık 181
Mandic, K., Delibasic, B., Knezevic, S. ve Benkovic, S. (2014). Analysis of the Financial Parameters of Serbian
Banks Through the Application of the Fuzzy AHP and TOPSIS Methods. Economic Modelling, 43, 30-37.
Metin, S., Yaman, S. ve Korkmaz, T. (2017). Finansal Performansın TOPSIS ve MOORA Yöntemleri İle
Belirlenmesi: BIST Enerji Firmaları Üzerine Karşılaştırmalı Bir Uygulama. Kahramanmaraş Sütçü İmam
Üniversitesi Sosyal Bilimler Dergisi, 14(2), 371-394.
Orçun, Ç. ve Eren, B. S. (2017). TOPSIS Yöntemiyle Finansal Performansların Değerlendirilmesi: XUTEK
Üzerinde Bir Uygulama. Muhasebe ve Finansman Dergisi, Temmuz, 139-154.
Özdağoğlu, A. (2012). Üretim Yapan İşletmeler İçin Hidrolik Giyotin Alternatiflerinin TOPSIS Yöntemi ile
İncelenmesi. Ege Akademik Bakış, 12(4), 549-562.
Özdemir, A. İ. ve Seçme, N. Y. (2009). İki Aşamalı Stratejik Tedarikçi Seçiminin Bulanık TOPSIS Yöntemi İle
Analizi. Afyon Kocatepe Üniversitesi İ.İ.B.F. Dergisi, 11(2), 79-112.
Özdemir, M. (2015). TOPSIS, İşletmeciler, Mühendisler ve Yöneticiler İçin Operasyonel, Yönetsel ve Stratejik
Problemlerin Çözümünde Çok Kriterli Karar Verme Yöntemleri. Bursa: Dora Yayınevi, 133-153.
Peker, A. (1988). Modern Yönetim Muhasebesi. İstanbul: Fatih Yayınevi Matbaası.
Sakarya, Ş. ve Akkuş, H. (2015). Finansal Performansın Ölçülmesinde Geleneksel Oranlar ile Nakit Akım
Oranlarının Karşılaştırmalı Analizi: BİST Çimento Şirketleri Üzerine TOPSIS Yöntemi ile Bir Uygulama.
Afyon Kocatepe Üniversitesi İİBF Dergisi, 17 (1), 109-123. http://dergipark.gov.tr/akuiibfd/issue/1615/20223
Saldanlı, A. ve Sırma, İ. (2014). Topsis Yönteminin Finansal Gösterge Olarak Kullanılabilirliği. Marmara
Üniversitesi Öneri Dergisi, 11(41), 185-202.
Shanian, A. ve Savadogo, O. (2006). TOPSIS Multiple-Criteria Decision Support Analysis for Material
Selection of Metallic Bipolar Plates for Polymer Electrolyte Fuel Cell. Journal of Power Sources, 1-10.
TOBB. (2013). Türkiye Demir ve Demir Dışı Metaller Meclisi Sektör Raporu. Türkiye Odalar ve Borsalar
Birliği, Ankara
TOBB. (2017), Türkiye Demir ve Demir Dışı Metaller Meclisi Sektör Raporu. Türkiye Odalar ve Borsalar
Birliği, Ankara
Tong, L., Wang, C., Chen, C. C. ve Chen, C. (2004). Dynamic Multiple Responses by Ideal Solution Analysis.
Europan Journal of Operational Research, 156, 433-444.
Türkmen, S. Y. ve Çağıl, G. (2012). İMKB’ye Kote Bilişim Sektörü Şirketlerinin Finansal Performanslarının
TOPSIS Yöntemi ile Değerlendirilmesi. Maliye Finans Yazıları, 26(59), 59-78.
Uslu, S. (1985). Maliyet Muhasebesi. Ankara: Çözüm Yayıncılık.
Uygurtürk, H. ve Korkmaz, T. (2012). Finansal Performansın TOPSIS Çok Kriterli Karar Verme Yöntemi ile
Belirlenmesi: Ana Metal Sanayi İşletmeleri Üzerine Bir Uygulama. Eskişehir Osmangazi Üniversitesi İİBF
Dergisi, 7, 95-115.
Yeh, C. (2003). The Selection of Multiattribute Decision Making Methods For Scholarship Student Selection,
International Journal of Selection and Assessment, 11(4), 289-296.
Yurdakul, M. ve İç, Y. T. (2003). Türk Otomotiv Firmalarının Performans Ölçümü ve Analizine Yönelik
TOPSIS Yöntemini Kullanan Bir Örnek Çalışma. Gazi Üniversitesi Mühendislik Mimarlık Fakültesi Dergisi,
18(1), 1-18.
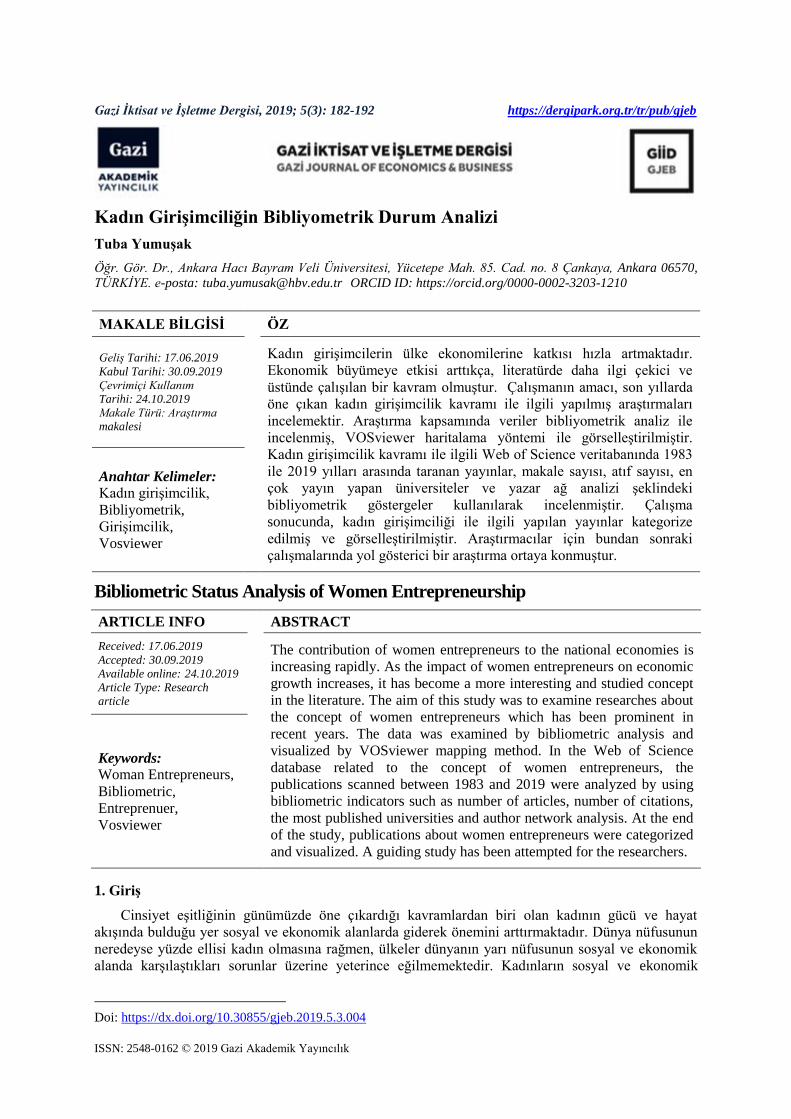
ISSN: 2548-0162 © 2019 Gazi Akademik Yayıncılık
Gazi İktisat ve İşletme Dergisi, 2019; 5(3): 182-192 https://dergipark.org.tr/tr/pub/gjeb
Kadın Girişimciliğin Bibliyometrik Durum Analizi1
Tuba Yumuşak
Öğr. Gör. Dr., Ankara Hacı Bayram Veli Üniversitesi, Yücetepe Mah. 85. Cad. no. 8 Çankaya, Ankara 06570,
TÜRKİYE. e-posta: [email protected] ORCID ID: https://orcid.org/0000-0002-3203-1210
MAKALE BİLGİSİ
ÖZ
Geliş Tarihi: 17.06.2019
Kabul Tarihi: 30.09.2019
Çevrimiçi Kullanım
Tarihi: 24.10.2019
Makale Türü: Araştırma
makalesi
Kadın girişimcilerin ülke ekonomilerine katkısı hızla artmaktadır.
Ekonomik büyümeye etkisi arttıkça, literatürde daha ilgi çekici ve
üstünde çalışılan bir kavram olmuştur. Çalışmanın amacı, son yıllarda
öne çıkan kadın girişimcilik kavramı ile ilgili yapılmış araştırmaları
incelemektir. Araştırma kapsamında veriler bibliyometrik analiz ile
incelenmiş, VOSviewer haritalama yöntemi ile görselleştirilmiştir.
Kadın girişimcilik kavramı ile ilgili Web of Science veritabanında 1983
ile 2019 yılları arasında taranan yayınlar, makale sayısı, atıf sayısı, en
çok yayın yapan üniversiteler ve yazar ağ analizi şeklindeki
bibliyometrik göstergeler kullanılarak incelenmiştir. Çalışma
sonucunda, kadın girişimciliği ile ilgili yapılan yayınlar kategorize
edilmiş ve görselleştirilmiştir. Araştırmacılar için bundan sonraki
çalışmalarında yol gösterici bir araştırma ortaya konmuştur.
Anahtar Kelimeler: Kadın girişimcilik,
Bibliyometrik,
Girişimcilik,
Vosviewer
Bibliometric Status Analysis of Women Entrepreneurship
ARTICLE INFO
ABSTRACT
Received: 17.06.2019
Accepted: 30.09.2019
Available online: 24.10.2019 Article Type: Research
article
The contribution of women entrepreneurs to the national economies is
increasing rapidly. As the impact of women entrepreneurs on economic
growth increases, it has become a more interesting and studied concept
in the literature. The aim of this study was to examine researches about
the concept of women entrepreneurs which has been prominent in
recent years. The data was examined by bibliometric analysis and
visualized by VOSviewer mapping method. In the Web of Science
database related to the concept of women entrepreneurs, the
publications scanned between 1983 and 2019 were analyzed by using
bibliometric indicators such as number of articles, number of citations,
the most published universities and author network analysis. At the end
of the study, publications about women entrepreneurs were categorized
and visualized. A guiding study has been attempted for the researchers.
Keywords:
Woman Entrepreneurs,
Bibliometric,
Entreprenuer,
Vosviewer
1. Giriş
Cinsiyet eşitliğinin günümüzde öne çıkardığı kavramlardan biri olan kadının gücü ve hayat
akışında bulduğu yer sosyal ve ekonomik alanlarda giderek önemini arttırmaktadır. Dünya nüfusunun
neredeyse yüzde ellisi kadın olmasına rağmen, ülkeler dünyanın yarı nüfusunun sosyal ve ekonomik
alanda karşılaştıkları sorunlar üzerine yeterince eğilmemektedir. Kadınların sosyal ve ekonomik
Doi: https://dx.doi.org/10.30855/gjeb.2019.5.3.004
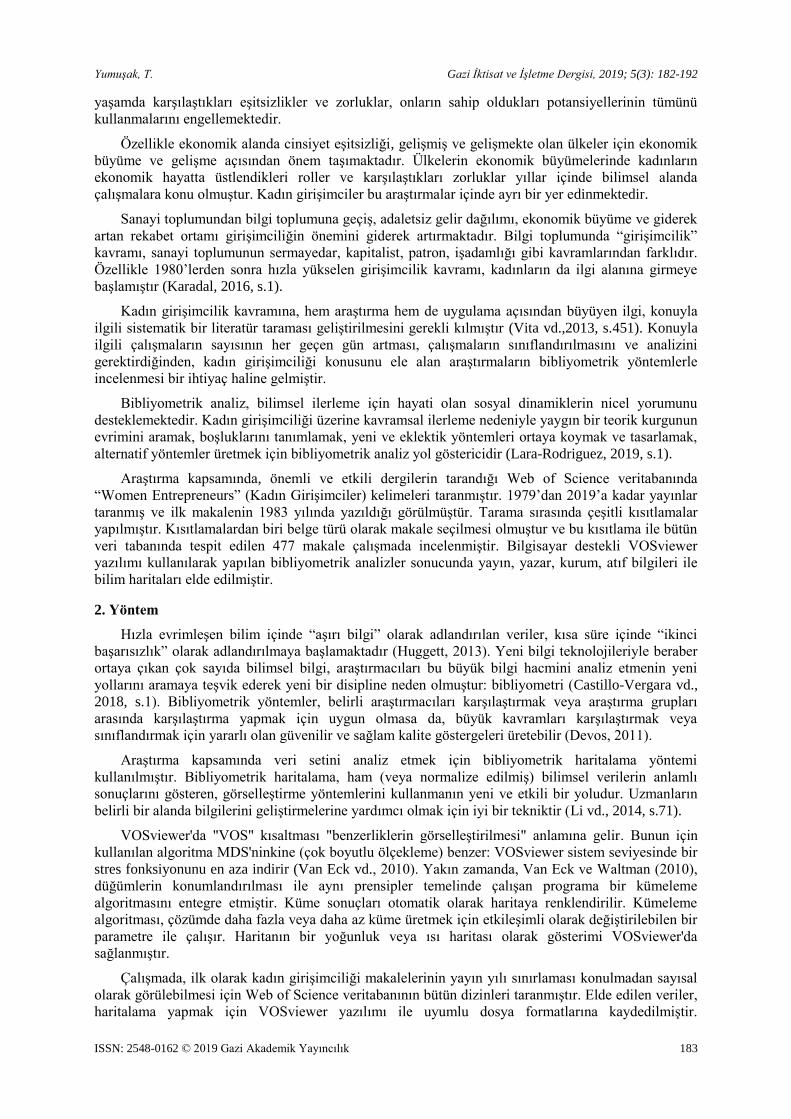
Yumuşak, T. Gazi İktisat ve İşletme Dergisi, 2019; 5(3): 182-192
ISSN: 2548-0162 © 2019 Gazi Akademik Yayıncılık 183
yaşamda karşılaştıkları eşitsizlikler ve zorluklar, onların sahip oldukları potansiyellerinin tümünü
kullanmalarını engellemektedir.
Özellikle ekonomik alanda cinsiyet eşitsizliği, gelişmiş ve gelişmekte olan ülkeler için ekonomik
büyüme ve gelişme açısından önem taşımaktadır. Ülkelerin ekonomik büyümelerinde kadınların
ekonomik hayatta üstlendikleri roller ve karşılaştıkları zorluklar yıllar içinde bilimsel alanda
çalışmalara konu olmuştur. Kadın girişimciler bu araştırmalar içinde ayrı bir yer edinmektedir.
Sanayi toplumundan bilgi toplumuna geçiş, adaletsiz gelir dağılımı, ekonomik büyüme ve giderek
artan rekabet ortamı girişimciliğin önemini giderek artırmaktadır. Bilgi toplumunda “girişimcilik”
kavramı, sanayi toplumunun sermayedar, kapitalist, patron, işadamlığı gibi kavramlarından farklıdır.
Özellikle 1980’lerden sonra hızla yükselen girişimcilik kavramı, kadınların da ilgi alanına girmeye
başlamıştır (Karadal, 2016, s.1).
Kadın girişimcilik kavramına, hem araştırma hem de uygulama açısından büyüyen ilgi, konuyla
ilgili sistematik bir literatür taraması geliştirilmesini gerekli kılmıştır (Vita vd.,2013, s.451). Konuyla
ilgili çalışmaların sayısının her geçen gün artması, çalışmaların sınıflandırılmasını ve analizini
gerektirdiğinden, kadın girişimciliği konusunu ele alan araştırmaların bibliyometrik yöntemlerle
incelenmesi bir ihtiyaç haline gelmiştir.
Bibliyometrik analiz, bilimsel ilerleme için hayati olan sosyal dinamiklerin nicel yorumunu
desteklemektedir. Kadın girişimciliği üzerine kavramsal ilerleme nedeniyle yaygın bir teorik kurgunun
evrimini aramak, boşluklarını tanımlamak, yeni ve eklektik yöntemleri ortaya koymak ve tasarlamak,
alternatif yöntemler üretmek için bibliyometrik analiz yol göstericidir (Lara-Rodriguez, 2019, s.1).
Araştırma kapsamında, önemli ve etkili dergilerin tarandığı Web of Science veritabanında
“Women Entrepreneurs” (Kadın Girişimciler) kelimeleri taranmıştır. 1979’dan 2019’a kadar yayınlar
taranmış ve ilk makalenin 1983 yılında yazıldığı görülmüştür. Tarama sırasında çeşitli kısıtlamalar
yapılmıştır. Kısıtlamalardan biri belge türü olarak makale seçilmesi olmuştur ve bu kısıtlama ile bütün
veri tabanında tespit edilen 477 makale çalışmada incelenmiştir. Bilgisayar destekli VOSviewer
yazılımı kullanılarak yapılan bibliyometrik analizler sonucunda yayın, yazar, kurum, atıf bilgileri ile
bilim haritaları elde edilmiştir.
2. Yöntem
Hızla evrimleşen bilim içinde “aşırı bilgi” olarak adlandırılan veriler, kısa süre içinde “ikinci
başarısızlık” olarak adlandırılmaya başlamaktadır (Huggett, 2013). Yeni bilgi teknolojileriyle beraber
ortaya çıkan çok sayıda bilimsel bilgi, araştırmacıları bu büyük bilgi hacmini analiz etmenin yeni
yollarını aramaya teşvik ederek yeni bir disipline neden olmuştur: bibliyometri (Castillo-Vergara vd.,
2018, s.1). Bibliyometrik yöntemler, belirli araştırmacıları karşılaştırmak veya araştırma grupları
arasında karşılaştırma yapmak için uygun olmasa da, büyük kavramları karşılaştırmak veya
sınıflandırmak için yararlı olan güvenilir ve sağlam kalite göstergeleri üretebilir (Devos, 2011).
Araştırma kapsamında veri setini analiz etmek için bibliyometrik haritalama yöntemi
kullanılmıştır. Bibliyometrik haritalama, ham (veya normalize edilmiş) bilimsel verilerin anlamlı
sonuçlarını gösteren, görselleştirme yöntemlerini kullanmanın yeni ve etkili bir yoludur. Uzmanların
belirli bir alanda bilgilerini geliştirmelerine yardımcı olmak için iyi bir tekniktir (Li vd., 2014, s.71).
VOSviewer'da "VOS" kısaltması "benzerliklerin görselleştirilmesi" anlamına gelir. Bunun için
kullanılan algoritma MDS'ninkine (çok boyutlu ölçekleme) benzer: VOSviewer sistem seviyesinde bir
stres fonksiyonunu en aza indirir (Van Eck vd., 2010). Yakın zamanda, Van Eck ve Waltman (2010),
düğümlerin konumlandırılması ile aynı prensipler temelinde çalışan programa bir kümeleme
algoritmasını entegre etmiştir. Küme sonuçları otomatik olarak haritaya renklendirilir. Kümeleme
algoritması, çözümde daha fazla veya daha az küme üretmek için etkileşimli olarak değiştirilebilen bir
parametre ile çalışır. Haritanın bir yoğunluk veya ısı haritası olarak gösterimi VOSviewer'da
sağlanmıştır.
Çalışmada, ilk olarak kadın girişimciliği makalelerinin yayın yılı sınırlaması konulmadan sayısal
olarak görülebilmesi için Web of Science veritabanının bütün dizinleri taranmıştır. Elde edilen veriler,
haritalama yapmak için VOSviewer yazılımı ile uyumlu dosya formatlarına kaydedilmiştir.

Yumuşak, T. Gazi İktisat ve İşletme Dergisi, 2019; 5(3): 182-192
ISSN: 2548-0162 © 2019 Gazi Akademik Yayıncılık 184
VOSviewer yazılımında haritaları elde etmek üzere anahtar kelimeler belirlenmiştir. Veri seti, yıllar
içindeki araştırma konularını yansıtacak anahtar kelime ile analize dahil edilmiştir. Sonuç olarak kadın
girişimciliğinin zaman içindeki gelişimi ortaya konulmuştur. Veriler, tamamlayıcılık amaçlı ağ
haritalarında ve tablolarda sunulmuştur. Tablolarda yalnızca en sık kullanılmış on anahtar kelimeye
yer verilirken, ağ haritalarında anahtar kelimelerinin ortaya çıkma ve bağlantı özelliklerine ilişkin
yoğunluk temelini gösteren bir şekil sunulmuştur. Çalışmanın bir diğer amacı olan atıf analizlerinin
yapılabilmesi için 477 makalenin toplam atıf ve ortalama atıf sayıları hesaplanmıştır.
3. Bulgular
Araştırma bulgularında öncelikle yayınlanan doküman sayısı ve bu göstergelerden elde edilen
oransal bibliyometrik göstergelere dayanan performans analizi sonuçları verilmektedir. Daha sonra
VOSviewer haritaları verilmiştir.
Tablo 1’de taranan makalelerin yıllara göre dağılımı yer almaktadır. Tabloda görüldüğü üzere
konu ile ilgili yayın sayısının yıllar itibariyle arttığı görülmektedir. Kadın girişimciliği ile ilgili 1983
yılında yalnızca bir makale bulunurken 2018 yılı içinde makale sayısı 68’e yükselmiştir. 2005 yılından
sonra konu ile ilgili yayınların hızla artış gösterdiği görülmektedir. Kadın girişimciliği konusu ile ilgili
son beş yılda yayınlanmış toplam makale sayısı 227 olup, 1983’ten bu yana yazılmış makale sayısının
neredeyse yarısıdır. Tablo sonucuna göre son yıllarda kadın girişimciler akademisyenlerin çalışma
alanlarında giderek artarak yer bulmaktadır.
Tablo 1. Yıllara göre maale sayıları
MAKALE
YILI
MAKALE
SAYISI
2019 23
2018 68
2017 48
2016 49
2015 39
2014 21
2013 20
2012 18
2011 16
2010 21
2009 11
2008 14
2007 15
2006 21
2005 10
2004 8
2003 5
2002 5
2001 15
2000 5
1999 3
1998 5
1997 6
1995 3
1994 10
1993 4
1992 3
1990 1
1989 2
1988 2
1987 2
1986 3
1983 1

Yumuşak, T. Gazi İktisat ve İşletme Dergisi, 2019; 5(3): 182-192
ISSN: 2548-0162 © 2019 Gazi Akademik Yayıncılık 185
Tablo 2’de Web of Science’da Kadın girişimciliğinin taranması sonucunda alanına beş ve daha
fazla katkısı olan 13 üniversitenin, konu ile ilgili yayınlanan makale sayısı verilmiştir. University of
North Carolina 13 makale ile kadın girişimciliği alanında literatüre en çok katkı sağlayan üniversitedir.
Tablo 2. Kadın girişimciliğe Katkısı Olan İlk 13 Üniversite ve Makale Sayıları
Örgüt Çalışma Sayısı
Unıversity of North Carolina 13
Unıversity of North Carolina Greensboro 10
Siena Coll 9
Akademıa Leona Kozmınskiego W Warszawıe 8
Babson College 8
Brock University 8
Unıversıty of Urbino 6
Lancaster University 5
The World Bank 5
Unıversıtı Kebangsaan Malaysia 5
Universıtı Malaya 5
Unıversity of London 5
University of Wisconsin System 5
Tablo 3’de “Kadın girişimci” kelimeleri taranarak, incelenmiş makaleler içerisinde en çok
makalesi olan 6 yazar verilmiştir. Konuyla ilgili en çok katkı sağlayan, 9 makale ile Smith-Hunter’dır.
Kaciak ve Welsh 8 makale ile ikinci sırada bulunmaktadır. Tablo oluşturulurken yazarlara ait en az beş
makalenin bulunması sınırlılığı kullanılmıştır. Kadın Girişimci kavramı ile ilgili 5’ten az makalesi
olan yazarlar tabloya eklenmemiştir.
Tablo 3. Kadın Girişimciliğe Katkısı Olan Yazarlar ve Makale Sayıları
Yazar Adı Çalışma Sayısı
SMITH-HUNTER, Andrea E. 9
KACIAK, Eugene 8
WELSH, Dianne H.B. 8
BRUSH, Candida G. 5
WELTER, Friederike 5
CESARONI, Francesca M. 5
Tablo 4’te görüldüğü üzere makalelerin çoğunluğu İngilizce yazılmıştır. Yedi makale İspanyolca,
ikişer makale Fransızca ve Portekizce dillerinde yazılmıştır. Genel kabul gören bilim dilinin İngilizce
olması ve Web of Science veritabanının İngilizce olması bunda en büyük etkendir.
Tablo 4. Makale Dili
Çalışmanın Dili Çalışma Sayısı
İngilizce 457
İspanyolca 7
Fransızca 2
Portekizce 2
Çince 1
3.1. VOSviewer haritaları
VOSviewer haritaları elde edilirken görsel karışıklık yaratmamak adına belirli kısıtlamalar
uygulanmıştır. Kısıtlamalar sayesinde daha belirgin ve anlaşılır haritalar elde edilmiştir.

Yumuşak, T. Gazi İktisat ve İşletme Dergisi, 2019; 5(3): 182-192
ISSN: 2548-0162 © 2019 Gazi Akademik Yayıncılık 186
Harita 1’de Kadın Girişimciler kavramına katkısı olan 67 ülke varken, en az beş makale ile katkısı
olan ülke sayısı 17’dir. Maviden sarıya değişen renkler ülkelerin katkı sayılarını vermektedir. Yine
haritada ülkelerin her biri için olan yuvarlakların büyüklüğü ülkenin katkı sayısına göre değişmektedir.
En küçük yuvarlak en az katkı yapan ülkeyi en büyük yuvarlak en fazla katkısı olan ülkeyi temsil
etmektedir. Kadın girişimcilik kavramına en çok katkıyı Amerika Birleşik Devletleri, İngiltere,
Kanada ve İspanya yapmıştır.
Harita 1. Kadın girişimciliğine en çok katkısı olan ülkeler
Harita 2’de yazılan makalelerin anahtar kelimeleri içerisinde en az 10 kez tekrar edilmiş 19
kelimenin aralarındaki temsili bağlantının haritası verilmiştir. Kelimelerin birbirlerine olan

Yumuşak, T. Gazi İktisat ve İşletme Dergisi, 2019; 5(3): 182-192
ISSN: 2548-0162 © 2019 Gazi Akademik Yayıncılık 187
bağlantıları, makalelerde beraber anahtar kelime olarak kullanıldıklarını göstermektedir. Toplam
anahtar kelime sayısı 5236 olup tekrar edilmiş kelimeler şöyledir: Women entrepreneurs, women,
entrepreneurship, entrepreneurs, female entrepreneurs, motivation, challenges, women entrepreneur,
india, woman entrepreneur, female entrepreneurship, entrepreneur, empowerment, social capital,
economic development, women entrepreneurship, performance, africa, microfinance, gender en çok
kullanılan 20 kelimedir.
Harita 2. Kadın Girişimcilik konusunda yazılan makalelerde en çok geçen anahtar kelimeler
Kadın girişimciliği çalışan 18 yazarın makale sayıları, atıfları ve birbirleri ile olan ilişkileri temsili
bağlantılar kurularak istatistiksel analizlerle desteklenen bilgiler ile birlikte Harita 3’te verilmiştir. En
az 50 atıfı olan 18 makale harita hazırlanırken ele alınmıştır. Haritada bulunan yuvarlakların
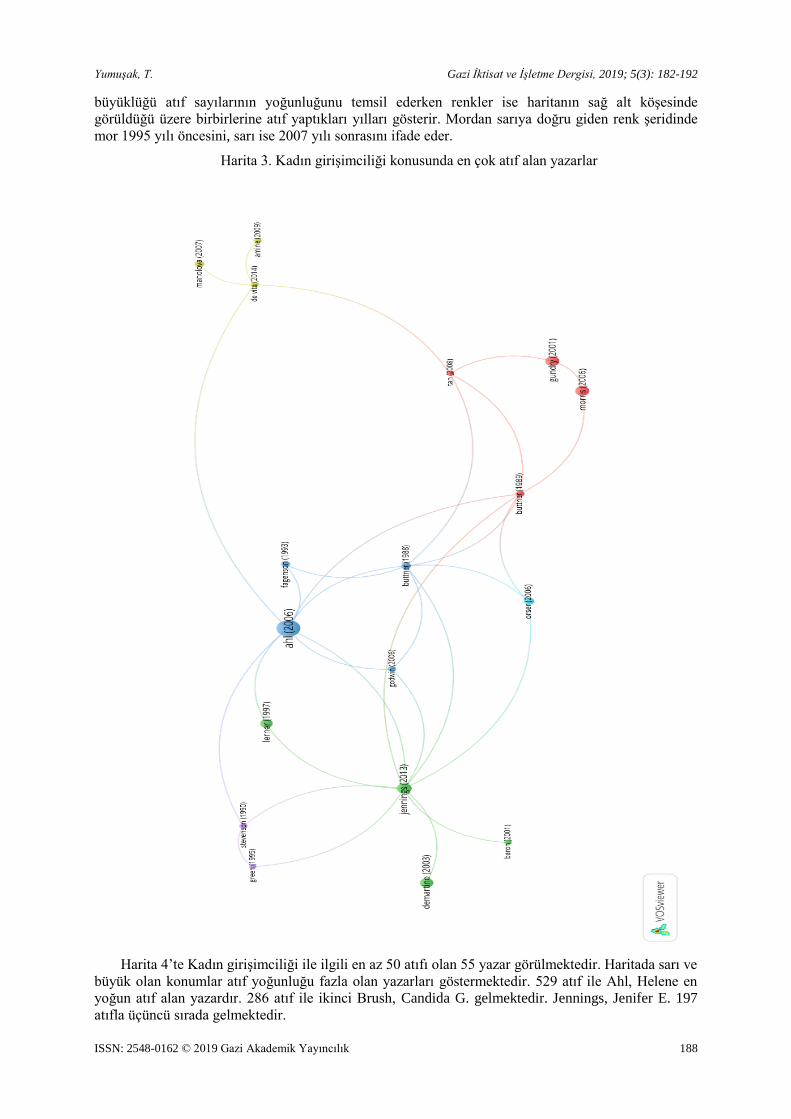
Yumuşak, T. Gazi İktisat ve İşletme Dergisi, 2019; 5(3): 182-192
ISSN: 2548-0162 © 2019 Gazi Akademik Yayıncılık 188
büyüklüğü atıf sayılarının yoğunluğunu temsil ederken renkler ise haritanın sağ alt köşesinde
görüldüğü üzere birbirlerine atıf yaptıkları yılları gösterir. Mordan sarıya doğru giden renk şeridinde
mor 1995 yılı öncesini, sarı ise 2007 yılı sonrasını ifade eder.
Harita 3. Kadın girişimciliği konusunda en çok atıf alan yazarlar
Harita 4’te Kadın girişimciliği ile ilgili en az 50 atıfı olan 55 yazar görülmektedir. Haritada sarı ve
büyük olan konumlar atıf yoğunluğu fazla olan yazarları göstermektedir. 529 atıf ile Ahl, Helene en
yoğun atıf alan yazardır. 286 atıf ile ikinci Brush, Candida G. gelmektedir. Jennings, Jenifer E. 197
atıfla üçüncü sırada gelmektedir.
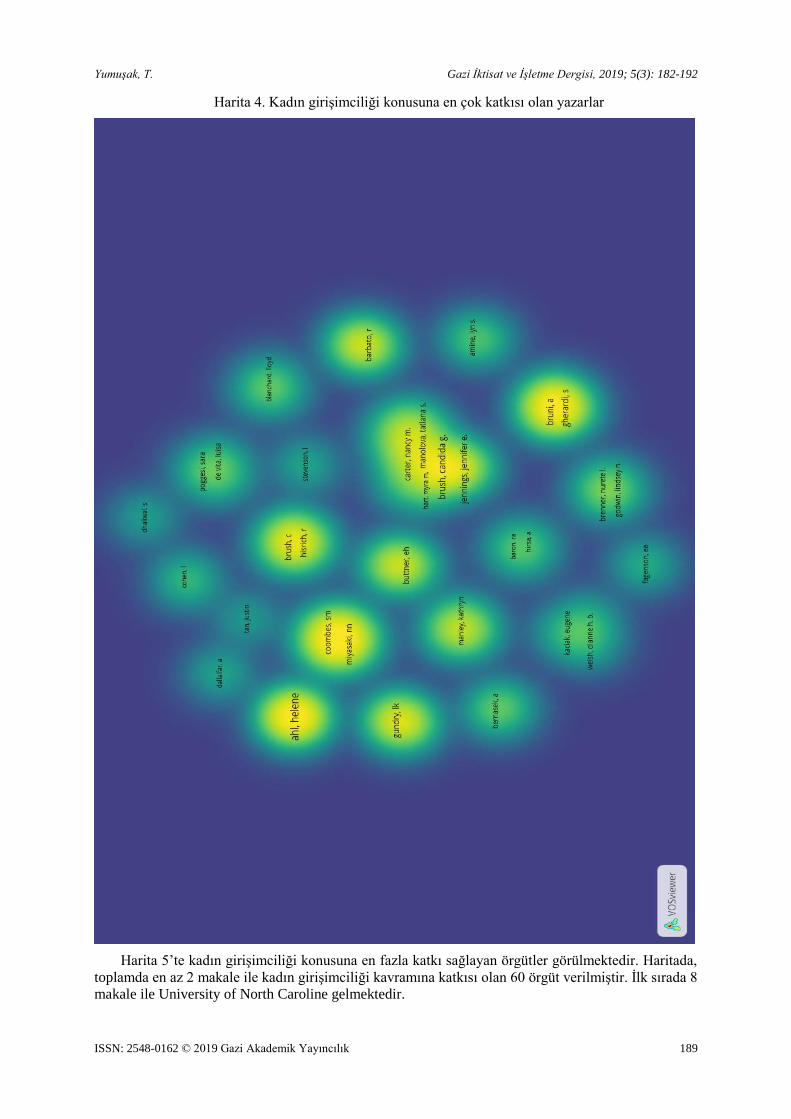
Yumuşak, T. Gazi İktisat ve İşletme Dergisi, 2019; 5(3): 182-192
ISSN: 2548-0162 © 2019 Gazi Akademik Yayıncılık 189
Harita 4. Kadın girişimciliği konusuna en çok katkısı olan yazarlar
Harita 5’te kadın girişimciliği konusuna en fazla katkı sağlayan örgütler görülmektedir. Haritada,
toplamda en az 2 makale ile kadın girişimciliği kavramına katkısı olan 60 örgüt verilmiştir. İlk sırada 8
makale ile University of North Caroline gelmektedir.
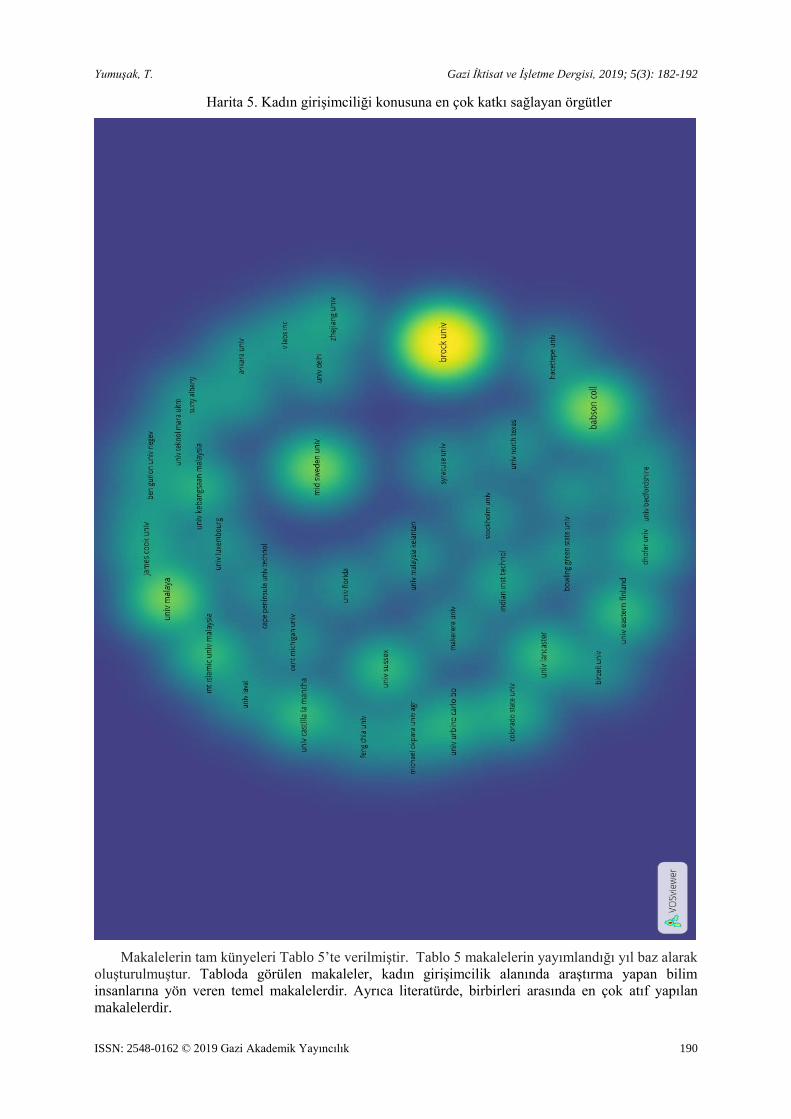
Yumuşak, T. Gazi İktisat ve İşletme Dergisi, 2019; 5(3): 182-192
ISSN: 2548-0162 © 2019 Gazi Akademik Yayıncılık 190
Harita 5. Kadın girişimciliği konusuna en çok katkı sağlayan örgütler
Makalelerin tam künyeleri Tablo 5’te verilmiştir. Tablo 5 makalelerin yayımlandığı yıl baz alarak
oluşturulmuştur. Tabloda görülen makaleler, kadın girişimcilik alanında araştırma yapan bilim
insanlarına yön veren temel makalelerdir. Ayrıca literatürde, birbirleri arasında en çok atıf yapılan
makalelerdir.

Yumuşak, T. Gazi İktisat ve İşletme Dergisi, 2019; 5(3): 182-192
ISSN: 2548-0162 © 2019 Gazi Akademik Yayıncılık 191
Tablo 5. Kadın girişimcilik kavramı ile ilgili en çok atıf almış makalelerin künyesi
Makale Künyesi Web Of Science Google Scholar
Ahl, H, 2006, Why Research On Women Entrepreneurs Needs New
Directions, Entrepreneurshıp Theory And Practıce 30/ 5 Pages: 595-
621
503 1434
Jennings, Jennifer E.; Brush, Candida G., 2013, Research On
Women Entrepreneurs: Challenges To (And From) The Broader
Entrepreneurship Literature? Academy Of Management, 7/1 Pages:
663-715
202 503
Bruni, A; Gherardi, S; Poggio, B., 2004, Entrepreneur-Mentality,
Gender And The Study Of Women Entrepreneurs Journal Of
Organızatıonal Change Management, 17/3 Pages: 256-268
194 567
Gundry, Lk; Welsch, Hp., 2001, The Ambitions Entrepreneur: High
Growth Strategies Of Women-Owned Enterprises Journal Of
Busıness Venturıng 16/5 Pages: 453-470
190 621
Morris, Mh; Miyasaki, Nn; Watters, Ce; Coombes, Sm, 2006, The
Dilemma Of Growth: Understanding Venture Size Choices Of
Women Entrepreneurs Journal Of Small Business
Management 44/ 2 Pages: 221-244
176 584
Demartino, R; Barbato, R., 2003, Differences Between Women And
Men Mba Entrepreneurs: Exploring Family Flexibility And Wealth
Creation As Career Motivators Journal Of Busıness Venturıng 18 /6
Pages: 815-832
167 523
Lerner, M; Brush, C; Hisrich, R 1997 Israeli Women Entrepreneurs:
An Examination Of Factors Affecting Performance JOURNAL OF
BUSINESS VENTURING 12 /4 Pages: 315-339
155 593
Orser, Barbara J.; Riding, Allan L.; Manley, K.,2006, Women
Entrepreneurs And Financial Capital ENTREPRENEURSHIP
THEORY AND PRACTICE 30/5 Pages: 643-665
109 339
Manolova, Tatiana S.; Carter, Nancy M.; Manev, Ivan M.; Et Al.
2007, The Differential Effect Of Men And Women Entrepreneurs'
Human Capital And Networking On Growth Expectancies İn
Bulgaria ENTREPRENEURSHIP THEORY AND PRACTICE 31/3
Pages: 407-426
95 264
Buttner, Eh; Rosen, B., 1988, Bank Loan Offıcers Perceptıons Of
The Characterıstıcs Of Men, Women, And Successful Entrepreneurs
Journal Of Busıness Venturıng , 3 /3 Pages: 249-258
94 350
4. Sonuç
Araştırma kapsamında, sosyal bilimler alanında çalışan akademisyenler için güncel konulardan
biri olan kadın girişimciliği ile ilgili Web of Science veritabanında taranan makalelere bibliyometrik
analiz yapılmıştır. Kadın girişimciliği kavramının literatür taraması, hem tablolaştırılmış hem de
görselleştirilmiştir. Araştırmacılar için kadın girişimciliği konusunda yol gösterici bir çalışma ortaya
konmuştur.
Web of Science veritabanında 1979-2019 yılları arasındaki kadın girişimciliği (women
entrepreneurs) ile ilgili makaleler taranmış, WoS Core Collection veritabanından bir savedrects
dosyası şeklinde alınmıştır. Taranan 477 yayın bibliyometrik olarak farklı yönlerden (makalelerin atıf
analizi, en çok atıf almış yazarlar, anahtar kelimeler, araştırmaya katılan ülkeler ve yayın dilleri) analiz
edilmiş ve VOSviewer yazılımı ile haritalandırılmıştır.
Araştırma sonucunda, kadın girişimciliği konusunda altı yazarın öne çıktığı görülmüştür. Bu
yazarlar; Smith-Hunter, Andrea E., Kaciak, Eugene, Welsh, Dianne H.B., Welter, Friederike,
Cesaroni, Francesca M., Brush ve Candida G.’dir. Web of Science veritabanının İngilizce olmasından
dolayı taranan makalelerin dili çoğunlukla İngilizcedir. Konuyla ilgili en az 50 atıfı olan 55 yazar
haritalandırılmıştır. Kadın girişimciliği ile ilgili en çok çalışmaya ev sahipliği yapmış örgütler, hem
tablo olarak sıralanmış hem de haritalandırılmıştır. University of North Carolina 13 yayınla konuya en

Yumuşak, T. Gazi İktisat ve İşletme Dergisi, 2019; 5(3): 182-192
ISSN: 2548-0162 © 2019 Gazi Akademik Yayıncılık 192
çok katkı yapan üniversite olmuştur. Ülke bazında bakıldığında, kadın girişimciliği kavramına en çok
katkıyı, Amerika Birleşik Devletleri, İngiltere, Kanada ve İspanya yapmıştır.
Bibliyometrik analiz araştırmacılar için araştırdıkları konu ile ilgili bir yol göstericidir. Araştırma
alanıyla ilgili ayrıntılı ve bütünsel bir görüş sağlamaktadır. Elde edilen kuşbakışı görünüm araştırma
başında ve sürecinde teorik ve pratik olarak araştırmacılara büyük kolaylık sağlar. Bibliyometrik
analiz, Web of Science veritabanı dışında başka veritabanlarına da uygulanabilir. VOSviewer
haritalama yöntemi ile farklı veritabanları (dosyalamaya uygun) belirli bir konu çerçevesinde
karşılaştırılabilir.
Kaynakça
AHL, H. (2005). Why Research on Women Entrepreneurs Needs New Directions. Entrepreneurship Theory and
Practice, 30(5), 595-671.
Brunı, A., Gherardı, S. ve Poggıo, B. (2004). Entrepreneur-mentality, Gender and the Study of Women
Entrepreneurs. Journal of Organizational Change Management, 17(3), 256-268.
Castillo-Vergara, M., Alvarez-Marın, A. ve Placencıo-Hidalgo, D. (2018), A Bibliometric Analysis of Creativity
in The field of Business Economics, Journal of Business Research, 85, 1-9.
DeMartino, R. ve Barbato, R. (2003). Differences between women and men MBA entrepreneurs: exploring
family flexibility and wealth creation as career motivators. Journal of Business Venturing, 18, 815-832.
Devos, P. (2011). Research and bibliometrics: A long history. Clinics and Research in Hepatology and
Gastroenterology, 35, 336–337.
Gundry, L. K. ve Welsch, H. P. (2001). The Ambitions Entrepreneurs: High Growth Strategies of Women-
owned Enterprises. Journal of Business Venturing, 16(5), 453-470.
Huggett, S. (2013). Journal bibliometrics indicators and citation ethics: A discussion of current issues.
Atherosclerosis, 230(2), 275–277.
Karadal, H. (2016). Girişimcilik Uygulamalı Girişimcilik Eğitimi&Güncel Konular. Girişimci Destekleri & İş
Planı. İstanbul: Beta Basım A.Ş.
Khalil, G. M. ve Crawford, C. A. G. (2015). A Bibliometric Analysis of Us-Based Research On The Behavioral
Risk Factor Surveillance System. American Journal of Preventive Medicine, 48(1), 50-57.
Lara-Rodriguez, J. S., Rojas-Contreras, C. ve Duque Oliva, E. J. (2019), Discovering emerging research topics
for brand personality: A bibliometric analysis. Australasian Marketing Journal, 1-12.
Lerner, M. ve Brush, C. (1997). Israeli Women Entrepreneurs: An Examination of Factors Affecting
Performance. Journal of Business Venturing, 12, 315-339.
LI, J., GUO X., SHEN, S. ve ALEKSANDAR, J. (2014). Bibliometric mapping of “International Symposium
on Safety Science and Technology (1998-2012)”. Procedia Engineering, 84, 70 – 79.
Morris, M. H., Mıyasakı, N. N., Watters, C. E. ve Coombes, S. M. (2006). The Dilemma of Growth:
Understanding Venture Size Choices of Women Entrepreneurs. Journal of Small Business Management,
44(2), 221-244.
Orser, B. J., Riding, A. L. ve Manley, K. (2006). Women Entrepreneurs and Financial Capital. Entrepreneurship
Theory and Practice, 643-665.
Welsh, D. H. B., Kaciak, E. ve Shamah, R. (2018). Determinants of women entrepreneurs’ firm performance in a
hostile environment. Journal of Business Research, 88, 481-491.
Van Eck, N. J. ve Waltman, L. (2010). Software survey: VOSviewer, a computer program for bibliometric
mapping. Scientometrics, 84(2), 523-538.
Van Eck, N. J., Waltman, L., Dekker, R. ve Van Den Berg, J. (2010). A Comparison of Two Techniques for
Bibliometric Mapping: Multidimensional Scaling and VOS. Journal of the American Society for Information
Science and Technology, 61(12), 2405-2416.
Vita, L. D., Mari, M. ve Poggesi, S. (2014). Women entrepreneurs in and from developing countries: Evidences
from the literatüre. European Management Journal, 32, 451-460.
ISSN: 2548-0162 © 2019 Gazi Akademik Yayıncılık
Gazi İktisat ve İşletme Dergisi, 2019; 5(3): 193-205 https://dergipark.org.tr/tr/pub/gjeb
The Mediating Role of Organizational Commitment in the Organizational
Justice’s Effect on Job Satisfaction and Turnover Intention: A Research on
Academic Staff
Edip Sabahattin Mete a*, Alev Sökmen b
a Dr., General Manager, Delta Electronics, Koza Sokak No:71 Gaziosmanpaşa, 06700 Ankara, TURKEY. e-mail:
[email protected] ORCID ID: https://orcid.org/0000-0002-8950-0006
b Dr., Başkent University, Vocational School of Social Sciences, Bağlıca Kampüsü Fatih Sultan Mahallesi Eskişehir Yolu 18.km
Etimesgut, 06790 Ankara, TURKEY. e-mail: [email protected] ORCID ID: https://orcid.org/0000-0002-2143-839X
ARTICLE INFO ABSTRACT
Received: 28.06.2019
Accepted: 09.09.2019
Available online:24.10.2019 Article Type:Research
article
Over the last couple of decades, surge in the number of universities
established in Turkey has become significant which leads to increased
attention to the faculty members responsible for helping young
individuals prepare for their professional career. The retention of high-
skilled academic staff seeking continual and frequent support from the
faculty management has long been a central objective of the institutions
involved in higher education system. Within this respect, facilitating
organizational justice among faculty members appears to be one of the
prime issues due to its impact on their levels of organizational
commitment, job satisfaction and turnover intention. From an
organizational behavioral context, the major purpose of this study is to
examine the effects of organizational justice and organizational
commitment on job satisfaction and turnover intention in a sample consist
of 235 academicians of a foundation university. The study reveals that
the levels of organizational commitment and job satisfaction of the
academic staff may increase while the level of turnover intention may
decrease when their perception on organizational justice increases. Data
obtained from this study were analyzed by SPSS 25 package software.
The quantitative research methods including frequency, correlation and
regression analyses were utilized and the reliability of the scales was
validated through Cronbach's alpha reliability coefficients in this study.
The study aims to provide an extensive understanding on how
organizational justice directly impacts retention rates of the academic
staff through essential organizational behaviors such as organizational
commitment, job satisfaction and turnover intention which are critical
indications of employee well-being.
Keywords:
Organizational Justice,
Organizational
Commitment, Job
Satisfaction, Turnover
Intention, Academic
Staff
* Corresponding Author
Doi: https://dx.doi.org/10.30855/gjeb.2019.5.3.005

Mete, E. S. & Sökmen, A. Gazi İktisat ve İşletme Dergisi, 2019; 5(3): 193-205
ISSN: 2548-0162 © 2019 Gazi Akademik Yayıncılık 194
Örgütsel Adaletin İş Tatmini ve İşten Ayrılma Niyetine Etkisinde Örgütsel
Bağlılığın Aracı Rolü: Akademisyenler Üzerine Bir Araştırma
MAKALE BİLGİSİ
ÖZ
Geliş Tarihi: 28.06.2019
Kabul Tarihi: 09.09.2019
Çevrimiçi Kullanım
Tarihi: 24.10.2019
Makale Türü: Araştırma
makalesi
Son yıllarda Türkiye’de kurulan üniversite sayısında gözlenen önemli
artış, dikkatleri, genç bireyleri profesyonel kariyerlerine hazırlamaya
yardımcı olmaktan sorumlu akademisyenler üzerinde yoğunlaştırmıştır.
Fakülte yönetiminin daimi desteğine ihtiyaç duyan üstün yetenekli
akademisyenlerin görevlerinde kalıcılıklarının sağlanması,
yükseköğrenim kuruluşlarının uzunca bir süredir esas hedefi haline
gelmiştir. Bu bağlamda, akademisyenlerin örgütsel bağlılık, iş tatmini ve
işten ayrılma niyeti düzeylerini etkilemesi bakımından fakülte üyeleri
arasında örgütsel adaletin sağlanması başlıca sorunlardan biri olarak
gündeme gelmektedir. Örgütsel davranış bağlamında, bu çalışmanın asıl
amacı; örgütsel adaletin ve örgütsel bağlılığın, iş tatmini ve işten ayrılma
niyeti üzerindeki etkilerini bir vakıf üniversitesinde görevli 235
akademisyenden oluşan bir örneklem üzerinde incelemektir. Bu çalışma,
akademik personelin örgütsel adalet algılarının artması durumunda
örgütsel bağlılık ve iş tatmini düzeylerinin artarken işten ayrılma
düzeylerinin ise azaldığını ortaya çıkarmaktadır. Bu çalışma sonucunda
elde edilen veriler, SPSS 25 paket programı ile analiz edilmiştir. Bu
çalışma kapsamında frekans, korelasyon ve regresyon analizlerini
kapsayan nicel araştırma yöntemlerinden yararlanılmış olup; çalışmada
kullanılan ölçeklerin güvenilirliği, Cronbach alfa güvenilirlik katsayıları
ile doğrulanmıştır. Bu çalışma ile örgütsel adaletin; örgütsel bağlılık, iş
tatmini ve işten ayrılma gibi çalışanların esenliğinin önemli göstergesi
olan temel örgütsel davranışlar üzerinden akademik personelin
görevlerinde kalıcı olma oranına nasıl doğrudan etki ettiğine yönelik
ayrıntılı bir kavrayış sağlanması amaçlanmaktadır.
Anahtar Kelimeler:
Örgütsel Adalet,
Örgütsel Bağlılık, İş
Tatmini, İşten Ayrılma
Niyeti, Akademik
Personel
1. Introduction
Education is a critical and indispensable part in the development of any country. Particularly for
developing countries, investment in education has vital importance for sustainable development and
growth. The number of universities established in Turkey has dramatically risen in the past few decades.
According to the statistical data obtained from the Council of High Education, the total number of
universities and academics in Turkey has reached up to 206 and 167 237, respectively, as of the year
2019. The results show that higher education has been determined to be crucial element in country’s
investment strategy for strengthening the structure of its education system that gives important role to
academics whose priority is to provide high quality teaching for students. An analysis of organizational
behaviors affecting academic staff helps to generate implications about their working conditions. In this
regard, Organizational Justice (OJ) appears to be one of the essential topics to be examined through the
lens of psychological well-being of employees.
The concept of OJ was first introduced into the literature by Greenberg (1987) and over the past
three decades, OJ has become a popular topic and a broad range of studies on this topic have emerged
in the disciplines relating to behavioral sciences, sociology, psychology, strategic management and
organizational theory. Many of those which were conducted from educational perspective targeted
teaching professionals (DiPaola and Hoy, 2005a; DiPaola and Hoy, 2005b; DiPaola and Guy, 2009; Hoy
and Tarter, 2004; Hoy and Sweetland, 2000; 2001; Burns and DiPaola, 2013). Greenberg (1987) defines
OJ as employee’s attitude in response to the perception of justice. OJ refers to the extent of perceived
fairness of an employee against behavior exerted by an organization that results with attitudinal response
of an employee (Fox, Spector, and Miles, 2001; Lam, Schaubroeck, and Aryee, 2002).
Mete, E. S. & Sökmen, A. Gazi İktisat ve İşletme Dergisi, 2019; 5(3): 193-205
ISSN: 2548-0162 © 2019 Gazi Akademik Yayıncılık 195
Fair treatments displayed by the organization directly influences work-related behaviors of the
employees such as Organizational Commitment (OC), Job Satisfaction (JS) and Turnover Intention (TI)
besides job performance of the employees (Cohen-Caharash and Spector, 2001; Colquitt et al., 2001).
Thus, OJ has been accepted to be one of the major driving forces for any organization to successfully
implement its overall activities (Greenberg, 1990b). OJ evolved from two-factor model, which consist
of procedural and distributive justice, to four-factor model with the inclusion of interpersonal and
informational justice. Sweeney and McFarlin (1993) proposed a model demonstrating the relationships
between two dimensions of OJ as personal and organizational outcomes in which distributive justice
was correlated with satisfaction while procedural justice was correlated with OC. These findings are in
consistent with the studies conducted by Folger and Konovsky (1989) and McFarlin and Sweeney
(1992).
2. Conceptual framework and literature review
2.1. Organizational justice
The word justice generally represents the acts of righteousness, honest behaviors and fair
approaches. The employees’ perception of justice is occurred when they analyze their work-related
behaviors as well as the procedures administrating the way of allocation of these work-related outputs
(Cropanzano and Prehar, 2001). OJ has its roots in Equity Theory coined by Adams (1965) which is
based on the perceptions of individuals resulted from their judgments regarding their level of inputs in
comparison with resulting outputs. Social Exchange Theory has also played a major role in the
development of the concept OJ. According to Bies (2001), perceptions of the employees are formed
based on Interactional Justice (IJ) and Procedural Justice (PJ). OJ implies employees’ perceptions of
equality emerged as the outcome of objective treatments exhibited by the organization (Ambrose et al.,
2007; Cropanzano and Rupp, 2003) which in turn having positive impacts on employees’ job
performance. The concept of OJ involves four dimensions namely distributive, procedural, interactional
and informational justice, which was originally developed as two-dimensional construct (Colquitt, 2001;
Colquitt, Greenberg, and Zapata-Phelan, 2005). According to the Moorman (1991), OJ refers to the
patterns in which employees determine if they have experienced fair treatment by the organization and
the influence of these determinations on other work related outcomes.
2.1.1. Distributive justice
Distributive Justice (DJ) is defined as the distribution of resources or outcomes by the organization
in a fair manner and individuals’ perceived fairness regarding the allocation of resources (Folger and
Konovsky, 1989) that may be associated with payment, praise, rewards etc. The results of the research
conducted to elucidate the outcomes linked with the allocation of resources suggests that DJ has positive
effect on JS whereas has negative effect on TI of the employees (Lee, 2000). According to Adams (1965)
DJ can be nourished when the resources or outcomes are perceived to be equally distributed by
employees. DJ has found to be directly correlated with satisfaction of employees particularly relating to
payment (Deconinck and Stillwell, 2004). Deconinck and Stillwell (2004) argue that DJ may be viewed
as one of the major determinants of employee satisfaction when they feel that organization fairly
allocates the rewards. McFarlin and Sweeney (1992) argued that DJ plays a significant role in
forecasting the work-related results of the employees. Lambert (2003) reported the effect of DJ on
employees’ work related behavior such as JS. Perceived fairness of resource allocation within an
organization is associated with increased levels of OC and JS (Cohen-Charash and Spector, 2001;
Colquitt et al., 2001).
2.1.2. Procedural justice
PJ refers to the assessment of OJ in association with policies and processes (Blakely et al., 2005;
Sjahruddin and Sudiro, 2013). PJ focuses on methods while DJ is based on results (Nadiri and Tanova,
2010). Kim and Mauborgne (1998) suggested that employees’ level of discretionary collaboration varies
according to the extent of fair treatment displayed by the organization which thus affects employees’
level of commitment to the organization and they are less likely to collaborate with their organization
in case of exposure to unfair procedure of the organization. Lee (2000) reported the direct correlation

Mete, E. S. & Sökmen, A. Gazi İktisat ve İşletme Dergisi, 2019; 5(3): 193-205
ISSN: 2548-0162 © 2019 Gazi Akademik Yayıncılık 196
between PJ and JS in which employees are more likely to accept decisions when they experience fair
procedure rather than unfair procedure. Lambert, Hogan, and Griffin (2007) found that PJ have more
significant effect both on OC and JS as compared to DJ. Cloutier and Vilhuber (2008) identified the
multidimensionality of the PJ in which justice of the salary determination process was evaluated by the
perceptions of employees on allocation procedures, decision-makers, system transparency. This study
shows the direct effect of procedural characteristics about decision-makers on JS (Cloutier and Vilhuber,
2008). According to the study conducted by Wittmer, Martin and Tekleab (2010), who argued the
significance of supervisors’ training and performance appraisal, PJ have found to be correlated with job
attitudes and TI of the employees and this result was not supported by the findings of Bagdadle,
Roberson and Poalele (2006) who found the indirect impact of the PJ on TI.
2.1.3. Informational justice and interpersonal justice as interactional justice
The interactional justice (IJ) dimension which was initially developed by Bies and Moag (1986),
deals with the communication aspect of fairness and adequate explanations concerning decisions in the
organization (Bies and Moag, 1986). Based on their research on interpersonal treatment during
recruitment process, they described four criteria to define this construct namely as justification,
truthfulness, respect and propriety (Colquitt, 2001). Greenberg (1990a) later analyzed this construct
from two dimensional perspectives which are explanations and sensitivity. Deluga (1994) suggested that
IJ occurs when managers attempt to build trust in the form of fairness, loyalty, integrity, openness,
discreetness, promise fulfillment and related trustworthy behaviors within an organization. IJ, which is
described as employees’ perception on fairness based on interpersonal treatment (Nadiri and Tanova,
2010), is composed of interpersonal and informational justice. Greenberg (1993) was the first researcher
to state that it may be logical to divide interactional into two sub-dimensions as interpersonal and
informational justice by expressing their independent influences from each other (Colquitt et al., 2001).
Interpersonal justice refers to the way managers treat employees and the reactions of employees
accordingly (Cohen-Charash and Spector, 2001). Colquitt (2001) incorporated two facets as respect and
relevance into interpersonal justice. Interpersonal justice involves with respectful attitudes exhibited by
managers in their relationships with other members of an organization who take part in distributive and
procedural decision-making process. Interpersonal justice is formed within an organization when
employees are treated respectfully and sensitively (Heather and Spence, 2004).
Informational justice refers to the extent to which employees are informed about how the decisions
relating to them are taken in the organization (Heather and Spence, 2004). Colquitt (2001) incorporated
two facets as accuracy and justification into the informational justice. Informational justice forms if
employees perceive their managers as an honest person when they give information to them.
Informational justice also refers to employees’ perceived equality on the information used in decision
making process of organization.
2.2. Organizational justice and organizational commitment
OC is described as the strength of an individual’s identification with and employees’ engagement
to a particular organization (Mowday, Steers and Porter, 1979). The concept organizational commitment
has been investigated by many researchers with great deal of attention. The positive and significant
relationship between OC and OJ has been evidenced by some researchers (Chang and Dubinsky, 2005).
OC is also defined as affective involvement of employees with organizational vision, mission, values
and goals of an organization (Landsman, 2008; Jaskyte and Lee, 2009). In the literature, there are some
studies imply that PJ dimension of OJ is concerned with OC (Tremblay et al., 2010; Hung et al., 2004;
Lambert, 2003; Simons and Roberson, 2003; Memarzadeh and Mahmoudi, 2010). Some researchers
including Rezaiean et al. (2010), Loi et al. (2001) and Lambert et al. (2007) observed that PJ is more
influential on OC than IJ whereas some suggest that DJ have stronger effect than PJ on OC (Phromket
et al., 2012). Nili et al. (2012) claimed that four dimensions of OJ have an effect on OC in their study
conducted among municipal employees in Iran.
Mete, E. S. & Sökmen, A. Gazi İktisat ve İşletme Dergisi, 2019; 5(3): 193-205
ISSN: 2548-0162 © 2019 Gazi Akademik Yayıncılık 197
2.3. Organizational justice and job satisfaction
JS, in particular, is deemed to be one of the important organizational behavior which serves as an
indication for employee retention. According to the definition of Locke (1969), JS is “the pleasurable
emotional state resulting from the appraisal of one’s job as achieving or facilitating the achievement of
one’s job values”. JS is also described as the positive feelings arise from job experience which will then
induce employees (Locke and Latham, 1990b). Spector (1985, 1997) defines JS as the degree to which
employees are satisfied or dissatisfied with their jobs. In addition, Spector (1985) also describes JS as
employees’ response towards their jobs and the influence occurs when employees compare the actual
results with those expected. Mowday et al. (1982) argue that JS is viewed as particularly related with
job while OC is accepted more general issue for an organization. In the literature, findings of some
researchers evidenced the direct link between JS and OJ in which all dimensions of OJ are positively
correlated with JS (Colquitt et al., 2001). Among those reviewed, there are many studies particularly
reported the positive correlation between PJ and DJ and JS (Lambert, 2003; Nadiri and Tanova, 2009;
Promket et al., 2012, Jespen and Rodlwell, 2007; Choi, 2011; Elamin and Alomain, 2011). Lambert
(2003) and Mamarzadeh and Mohmoudi (2010) suggest that PJ has more significant effect on JS as
compared to DJ. The findings of Lambert et al. (2007) also verified the positive and significant
correlation between PJ and JS which are in consistent with those obtained by Jahangir et al. (2006) and
Koh and Boo (2004). Lambert et al. (2007) reported that DJ has significant impact on JS, as well. The
results imply that employees who experienced high levels of DJ may keen on performing their jobs.
According to McFarlin and Sweeney (1992), DJ has multifaceted influences when it comes to the
negative affective and personal responses which make employees feel dissatisfied with their jobs. There
are also studies supported the view that IJ have more significant effect on JS as compared to DJ and PJ
(Elamin and Alomain, 2011). In addition those indicated the correlation between JS and IJ dimension
of OJ is also proved by some researchers (Choi, 2011; Simons and Roberson, 2003).
2.4. Organizational justice and turnover intention
The term turnover intention involves employees’ purposeful and conscious willingness to quit
their organizations and their intention for searching alternative job opportunities (Tett and Meyer, 1993).
If the new alternative is favorable as compared to existing one, it gives a stimulus for leaving the
organization and results with actual withdrawal (Lee, 2000). TI rate in an organization involves with the
number of employees’ discretionary leaves within a year and increased levels of TI thus bring negative
results for the organization (Smith and Clark, 2011). Bluedorn (1982) expressed JS as a phenomenon
preceding OC in the model he proposed for TI. Nevertheless, OC has been found to be associated with
TI, empirical research conducted so far implied that actual turnover is directly resulted from intention
to leave (Bluedorn, 1982). Although researchers have conducted a great deal of study focusing on the
effect of OJ on OC and JS, it has been argued that variables particularly playing mediator role have not
been sufficiently examined in the relationship between OJ and work-related behaviors so far (Abu
Elanain, 2010). Lee (2000) found that only perception of DJ made a contribution to TI. According to
Alexander and Ruderman (1987), TI directly results from the perceived unfairness by employees in
terms of DJ. Lee (2000) discovered the contribution of employee perception on DJ in his research. İyigün
and Tamer (2012) found negative impact of PJ and DJ on TI in his research conducted among 156
employees working in an electronic store chain in Turkey.
2.5. Organizational commitment and job satisfaction
In the literature, OC and JS have found to be significantly related with each other (Tai et al., 1998).
Boles et al. (2007) reported that JS has various aspects which are significantly associated with OC.
According to Markovits et al. (2007), affective organizational commitment has the strongest impact on
JS. The relationship between OC and JS was demonstrated in the previous studies (Yang, 2009). Mete
et al. (2016) found the positive significant relationship between the JS and OC (r=0.28, p>0.01) in their
studies conducted among IT employees working at the Ministry of the Turkish Government. There are
also some studies implying that OC is considered as dependent variable whereas JS is considered as
independent variable (Mowday et al., 1982; Gaertner, 1999; Lok and Crawford, 2001). OC is deemed
to be the result of JS. JS is suggested as a constituent of OC (Kovach, 1977). Medlin and Green (2009)
suggested that positively affected employees exhibit JS which thus positively associated with OC and
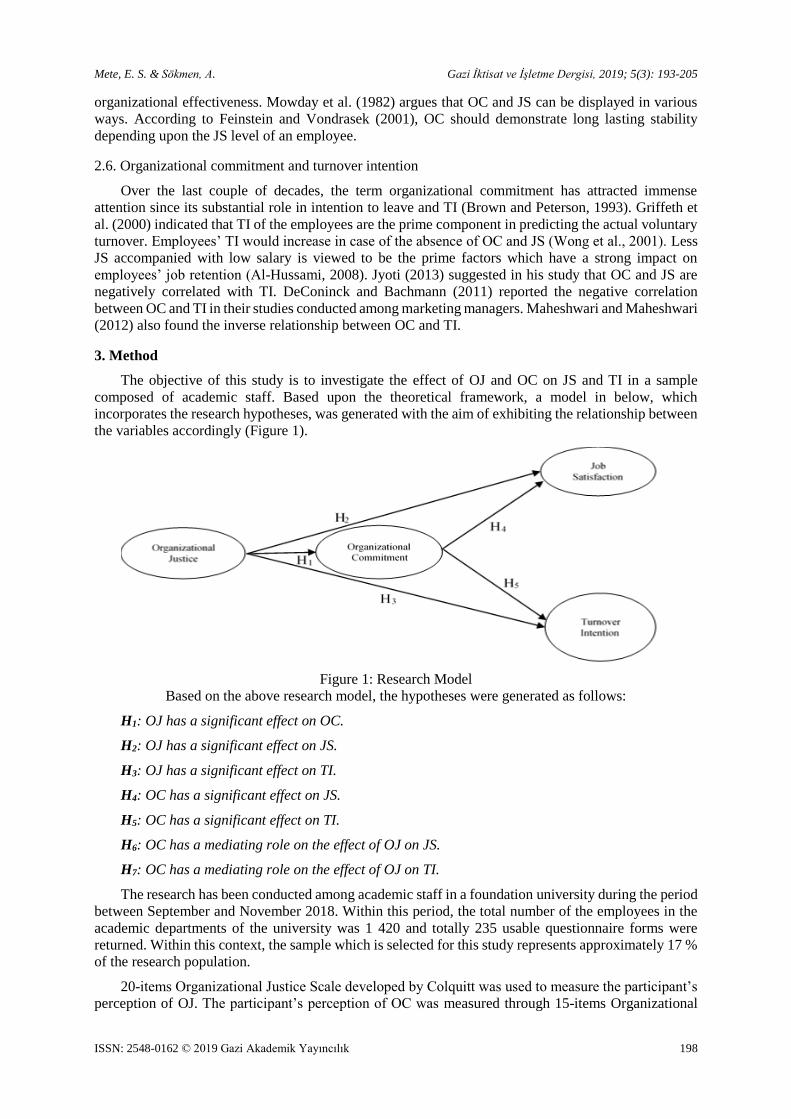
Mete, E. S. & Sökmen, A. Gazi İktisat ve İşletme Dergisi, 2019; 5(3): 193-205
ISSN: 2548-0162 © 2019 Gazi Akademik Yayıncılık 198
organizational effectiveness. Mowday et al. (1982) argues that OC and JS can be displayed in various
ways. According to Feinstein and Vondrasek (2001), OC should demonstrate long lasting stability
depending upon the JS level of an employee.
2.6. Organizational commitment and turnover intention
Over the last couple of decades, the term organizational commitment has attracted immense
attention since its substantial role in intention to leave and TI (Brown and Peterson, 1993). Griffeth et
al. (2000) indicated that TI of the employees are the prime component in predicting the actual voluntary
turnover. Employees’ TI would increase in case of the absence of OC and JS (Wong et al., 2001). Less
JS accompanied with low salary is viewed to be the prime factors which have a strong impact on
employees’ job retention (Al-Hussami, 2008). Jyoti (2013) suggested in his study that OC and JS are
negatively correlated with TI. DeConinck and Bachmann (2011) reported the negative correlation
between OC and TI in their studies conducted among marketing managers. Maheshwari and Maheshwari
(2012) also found the inverse relationship between OC and TI.
3. Method
The objective of this study is to investigate the effect of OJ and OC on JS and TI in a sample
composed of academic staff. Based upon the theoretical framework, a model in below, which
incorporates the research hypotheses, was generated with the aim of exhibiting the relationship between
the variables accordingly (Figure 1).
Figure 1: Research Model
Based on the above research model, the hypotheses were generated as follows:
H1: OJ has a significant effect on OC.
H2: OJ has a significant effect on JS.
H3: OJ has a significant effect on TI.
H4: OC has a significant effect on JS.
H5: OC has a significant effect on TI.
H6: OC has a mediating role on the effect of OJ on JS.
H7: OC has a mediating role on the effect of OJ on TI.
The research has been conducted among academic staff in a foundation university during the period
between September and November 2018. Within this period, the total number of the employees in the
academic departments of the university was 1 420 and totally 235 usable questionnaire forms were
returned. Within this context, the sample which is selected for this study represents approximately 17 %
of the research population.
20-items Organizational Justice Scale developed by Colquitt was used to measure the participant’s
perception of OJ. The participant’s perception of OC was measured through 15-items Organizational

Mete, E. S. & Sökmen, A. Gazi İktisat ve İşletme Dergisi, 2019; 5(3): 193-205
ISSN: 2548-0162 © 2019 Gazi Akademik Yayıncılık 199
Commitment Scale developed by Mowday et al. (1979), job satisfaction of the participants was
measured through 3-items Job Satisfaction Scale developed by Cellucci and De Vries (1978), and
participants’ TI was measured through 3-items Turnover Intention Scale developed by Bluedorn (1982).
All scales were used in the survey are five-point Likert-type scale ranging from (1) Strongly Disagree
to (5) strongly Agree). The scales were distributed electronically and were delivered by hand for
enhanced participation.
4. Results of the analyses
Data obtained as a result of this study were evaluated by SPSS 25 package software. Data relating
to the demographic features of the participants were explained by frequency analysis and percentage
values. Correlation and regression analyses were applied for hypotheses testing.
130 female and 105 male participated in this research. 64.9 % are married and 35.1 % are single
among the participants. When the distribution of participants by age is examined, 18.4 % are between
20-29 years old, 16.2 % are between 30-39 years old and 65.4 % are 40 years old and above. Of the
participants, 14.7 % have an undergraduate degree, 22.4 % have a master’s degree and 62.9 % have a
doctorate degree. When looking into the distribution of the participants by years of service, 14.8 % have
work experience between 0 and 5 years, 26.4 % have work experience between 6 and 10 years, 38.6 %
have work experience between 11 and 15 years and 20.2 % have work experience more than 16 years.
Table 1. Cronbach Alfa Coefficients And Correlation Values of the Variables
1 2 3 4
Organizational Justice (OJ) [0.972]
Organizational Commitment (OC) .489** [0.890]
Job Satisfaction (JS) .472** .499** [0.874]
Turnover Intention (TI) -.406** -.412** -.689** [0.886]
**Correlation is significant at 0.01 level (two-way), [Cronbach Alfa reliability coefficients are shown
in brackets]
The reliability values that are used in this research are 0.972 for Organizational Justice Scale, 0.890
for Organizational Commitment Scale, 0.874 for Job Satisfaction Scale and 0.886 for Turnover Intention
Scale. The values show that reliability coefficients of these scales are acceptable.
The correlation analysis was conducted to demonstrate the relationships between the variables. As
a result of the analysis, it was found that there is a positive and significant relationship between OJ and
OC (r=0.489, p>0.01); there is a positive and significant relationship between OJ and JS (r=0.472,
p>0.01), there is a negative and significant relationship between OJ and TI (r=-0.406, p>0.01).
Significant positive relationship between OC and JS (r=0.499, p>0.01) and significant negative
relationship between OC and TI (r=-0.412, p>0.01) were also determined.
Table 2. Regression Analysis
Independent
Variable Dependent Variables
Organizational
Justice
(OJ)
Organizational Commitment
(OC)
Job Satisfaction
(JS)
Turnover Intention
(TI)
ß Sig ß Sig ß Sig
0.489 0.000 0.472 0.000 -0.406 0.000
𝑅2 = 0.288
𝐹 = 61.565
𝑅2 = 0.273
𝐹 = 60.583
𝑅2 = 0.186
𝐹 = 42.565
Organizational
Commitment
(OC)
Job Satisfaction (JS) Turnover Intention (TI)
ß Sig ß Sig
0.499 0.000 -0.412 0.000
𝑅2 = 0.286
𝐹 = 61.537
𝑅2 = 0.196
𝐹 = 45.013
The results obtained from the regression analysis suggest that OJ have significant influences on
OC (ß=0.489; p<0.001) and 28.8 % ratio of explanatory power with R-squared value (R2) of 0.288, JS
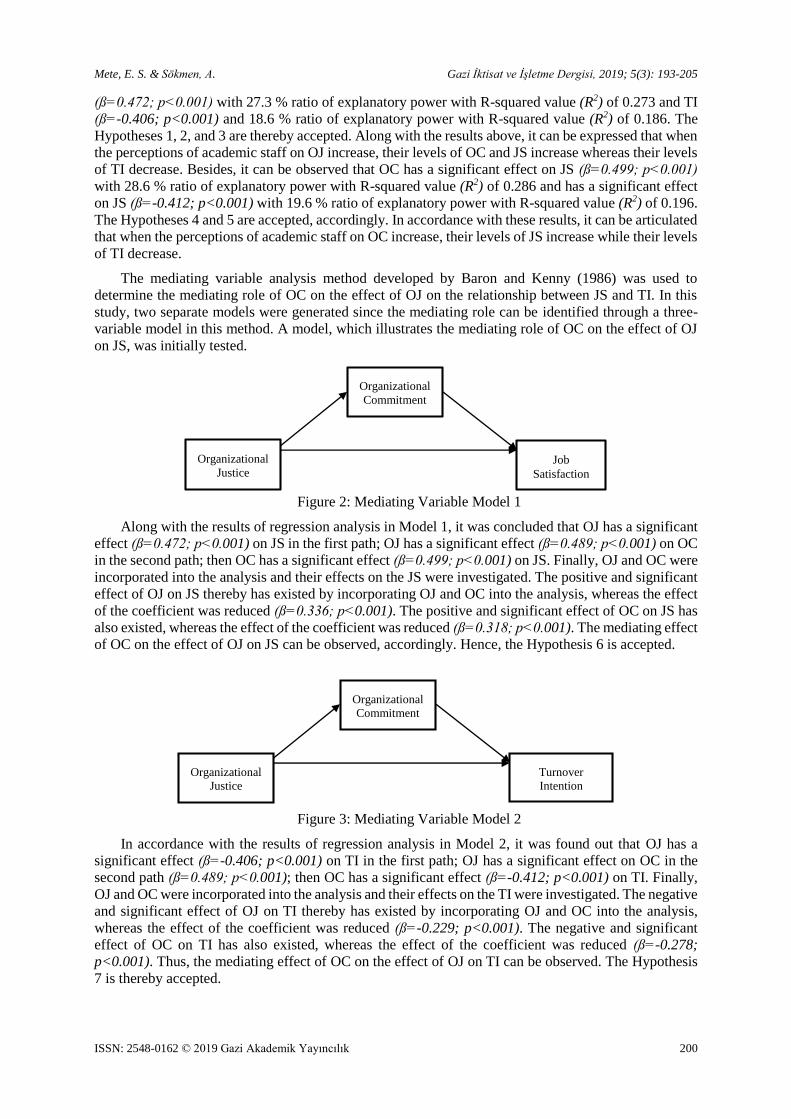
Mete, E. S. & Sökmen, A. Gazi İktisat ve İşletme Dergisi, 2019; 5(3): 193-205
ISSN: 2548-0162 © 2019 Gazi Akademik Yayıncılık 200
Organizational
Commitment
Organizational
Justice
Job
Satisfaction
Organizational
Commitment
Organizational
Justice
Turnover
Intention
(ß=0.472; p<0.001) with 27.3 % ratio of explanatory power with R-squared value (R2) of 0.273 and TI
(ß=-0.406; p<0.001) and 18.6 % ratio of explanatory power with R-squared value (R2) of 0.186. The
Hypotheses 1, 2, and 3 are thereby accepted. Along with the results above, it can be expressed that when
the perceptions of academic staff on OJ increase, their levels of OC and JS increase whereas their levels
of TI decrease. Besides, it can be observed that OC has a significant effect on JS (ß=0.499; p<0.001)
with 28.6 % ratio of explanatory power with R-squared value (R2) of 0.286 and has a significant effect
on JS (ß=-0.412; p<0.001) with 19.6 % ratio of explanatory power with R-squared value (R2) of 0.196.
The Hypotheses 4 and 5 are accepted, accordingly. In accordance with these results, it can be articulated
that when the perceptions of academic staff on OC increase, their levels of JS increase while their levels
of TI decrease.
The mediating variable analysis method developed by Baron and Kenny (1986) was used to
determine the mediating role of OC on the effect of OJ on the relationship between JS and TI. In this
study, two separate models were generated since the mediating role can be identified through a three-
variable model in this method. A model, which illustrates the mediating role of OC on the effect of OJ
on JS, was initially tested.
Figure 2: Mediating Variable Model 1
Along with the results of regression analysis in Model 1, it was concluded that OJ has a significant
effect (ß=0.472; p<0.001) on JS in the first path; OJ has a significant effect (ß=0.489; p<0.001) on OC
in the second path; then OC has a significant effect (ß=0.499; p<0.001) on JS. Finally, OJ and OC were
incorporated into the analysis and their effects on the JS were investigated. The positive and significant
effect of OJ on JS thereby has existed by incorporating OJ and OC into the analysis, whereas the effect
of the coefficient was reduced (ß=0.336; p<0.001). The positive and significant effect of OC on JS has
also existed, whereas the effect of the coefficient was reduced (ß=0.318; p<0.001). The mediating effect
of OC on the effect of OJ on JS can be observed, accordingly. Hence, the Hypothesis 6 is accepted.
Figure 3: Mediating Variable Model 2
In accordance with the results of regression analysis in Model 2, it was found out that OJ has a
significant effect (ß=-0.406; p<0.001) on TI in the first path; OJ has a significant effect on OC in the
second path (ß=0.489; p<0.001); then OC has a significant effect (ß=-0.412; p<0.001) on TI. Finally,
OJ and OC were incorporated into the analysis and their effects on the TI were investigated. The negative
and significant effect of OJ on TI thereby has existed by incorporating OJ and OC into the analysis,
whereas the effect of the coefficient was reduced (ß=-0.229; p<0.001). The negative and significant
effect of OC on TI has also existed, whereas the effect of the coefficient was reduced (ß=-0.278;
p<0.001). Thus, the mediating effect of OC on the effect of OJ on TI can be observed. The Hypothesis
7 is thereby accepted.

Mete, E. S. & Sökmen, A. Gazi İktisat ve İşletme Dergisi, 2019; 5(3): 193-205
ISSN: 2548-0162 © 2019 Gazi Akademik Yayıncılık 201
5. Discussions and limitations
Although this study has been validated by quantitative analyses, limited data was generated due to
the single source investigated. Research population, which is composed of universities with various
organizational structures, provides larger data for multi-faceted evaluation. Despite the limitations, the
findings obtained in this study may provide a multifaceted insight by contributing the analysis of
mediator variables besides direct effects of the variables. The models proposed in this study clearly
illustrate how OC, JS and TI of employees are influenced by OJ.
6. Future research
The study is expected to enlighten the future research on how organizational justice shapes the
work-related behaviors of the employees. Future researches may be aimed to explore the larger research
populations including diverse set of universities located in different regions. Not only foundation but
also private and state universities could be examined in terms of the academicians’ perceived justice and
their behavioral outcomes which may yield greater data to analyze. The variables investigated in this
study may further be expanded to explore the impacts of OJ on organizational citizenship behaviors of
the employees. Based on the notion that interactional facet of OJ, particularly, can be resulted with high
levels of employees’ organizational citizenship behaviors as a critical factor for employee retention.
7. Conclusion
Rapid and accelerated changes resulted from globalization have given significant responsibilities
and have posed challenges on the employees. Justice is an important organizational element conducive
to the integration of employees into their organizations as reflections of OC and JS. From managerial
point of view, developing honest communications with employees, establishing fair culture in the
organization and building interpersonal relationships to enhance trustworthiness are important to
maintain justice within an organization which then affects overall functions by creating valuable assets
for organization. The quality of relationships between managers and subordinates plays a substantial
role in creating corporate culture pivoting on superior performance of the members of organization. OJ
facilitates an environment where leaders display behaviors towards the recognition of employees’
intrinsic worth and high-quality characteristics such as knowledge and skills. The purpose of the present
study is to outline the effect of OJ on JS and TI of the academic staff in a foundation university. These
findings also indicate the mediating role of OC on the relationship among OJ, JS and TI as proposed in
Mediating Variable Model 1 and Mediating Variable Model 2. The results of this study is consistent
with the data collected by Rai (2013) among 511 staff members from 10 various health and rehabilitation
centers in a southern state in the United States. Organizational efficiency is crucial for almost all
enterprises around the world. The results obtained in this study highlight the importance of OJ and OC
as the antecedents of JS and TI, which thus influence employee retention in an academic environment.
References
Abu Elanain, H. M. (2010). Testing the direct and indirect relationship between organizational justice and workout
comes in a non-Western Context of the UA. Journal of Management Development, 29(1), 5-27.
Adams, J.S. (1965). Inequity in Social Exchange. In L. Berkowitz (Ed.), Advances in experimental social
psychology (pp.267-299). New York, NY: Academic Press.
Al-Hussami, M. (2008). A study of nurses’ job satisfaction: The relationship to organizational commitment,
perceived organizational support, transactional leadership, transformational leadership, and level of education.
European Journal of Scientific Research, 22(2), 286-295.
Alexander, S., & Ruderman, M. (1987). The role of procedural and distributive justice in organization behavior.
Social Justice Research, 1(2), 177-198.
Ambrose, M., Hess, R.L., & Ganesan, S. (2007). The relationship between justice and attitudes: An examination
of justice effects on event and system related attitudes. Organizational Behavior and Human Decision
Processes, 103(7), 21-36.
Baron, R. M., & Kenny, D. A. (1986). The moderator–mediator variable distinction in social psychological
research: Conceptual, strategic, and statistical considerations. Journal of Personality and Social Psychology,
51(6), 1173-1182.

Mete, E. S. & Sökmen, A. Gazi İktisat ve İşletme Dergisi, 2019; 5(3): 193-205
ISSN: 2548-0162 © 2019 Gazi Akademik Yayıncılık 202
Bies, R.J. (2001). Interactional (In)justice: The Sacred and The Profane. In J. Greenberg and R. Cropanzano (Eds.),
Advances in organizational justice (pp. 89-118). Stanford, CA: Stanford University Press.
Bies, R.J., & Moag, J.F. (1986). Interactional Justice: Communication Criteria of Fairness. In R.J. Lewicki, B.H.
Sheppard, and M.H. Bazerman, (Eds.), Research on Negotiations in Organizations (pp. 43-55). Greenwich,
CT: JAI Press.
Blakely, G. L., Andrews, M. C., & dan Moorman, R. H. (2005). The moderating effects of equity sensitivity on
the relationship between organizational citizenship behaviors. Journal of Business and Psychology, 20(2), 259-
273.
Bluedorn, A.C. (1982). A unified model of turnover from organizations. Human Relations, 35, 135-153.
Boles, J., Madupalli, R., Rutherford, B., & Wood, J. A. (2007). The relationship of facets of salesperson job
satisfaction with affective organizational commitment. Journal of Business and Industrial Marketing, 22(5),
311–321.
Brown, S.P., & Peterson, R.A. (1993). Antecedents and consequences of salesperson job satisfaction: Meta-
analysis and assessment of causal effects. Journal of Marketing Research, 30(1) 63–77.
Burns, W. R. T., & DiPaola, M. F. (2013). A study of organizational justice, organizational citizenship behavior,
and student achievement in high schools. American Secondary Education, 42(1), 4–23.
Cellucci, A. J., & DeVries, D. L. (1978). Measuring managerial satisfaction: A manual for the MJSQ. Greensboro,
NC: Center for Creative Leadership.
Chang, C., & Dubinsky, A. J. (2005). Organizational justice in sales force: A literature review with propositions.
Journal of Business to Business Marketing, 12(1), 35-71.
Choi, S. (2011). Organizational justice and employee work attitude: The federal case. The American Review of
Public Administration, 41(2) 185-204.
Cloutier, J., & Vilhuber, L. (2008). Procedural justice criteria in salary determination. Journal of Managerial
Psychology, 23(6), 713-740.
Cohen-Charash, Y., & Spector, P.E. (2001). The role of justice in organizations: A meta-analysis. Organizational
Behavior and Human Decision Processes, 86, 278-324.
Colquitt, J. (2001). On the dimensionality of organizational justice: A construct validation of a measure. Journal
of Applied Psychology, 86, 386-400.
Colquitt, J. A., Greenberg, G., & Zapata-Phelan, C. P. (2005). What is organizational justice? A historical
overview. In J. Greenberg & J. A. Colquitt (Eds.), Handbook of Organizational Justice (pp. 3–55). Mahwah,
NY: Erlbaum.
Cropanzano, R., & Prehar, C. A. (2001). Emerging justice concerns in an era of changing psychological contracts.
In R. Cropanzano (Ed.), Series in applied psychology. Justice in the workplace: From theory to practice (pp.
245-269). Mahwah, NJ, US: Lawrence Erlbaum Associates Publishers.
Cropanzano, R., & Rupp, D.E. (2003). An overview of organizational justice: Implication for work motivation. In
Porter, L.W., Bigley, G.A. and Steers, R.M. (Eds), Motivation and work behavior (pp. 82-95). Burr Ridge, IL:
McGraw-Hill Irwin.
DeConinck J.B., & Bachmann, D. (2011), Organizational commitment and turnover intentions of marketing
managers. Journal of Applied Business Research, 10(3), 87-95.
DeConinck, J. B., & Stilwell, C. D. (2004). Incorporating organizational justice, role states, pay satisfaction and
supervisor satisfaction in a model of turnover intentions. Journal of Business Research, 57(3), 225-
231.doi:10.1016/S0148-2963(02)00289-8.
Deluga, R. J. (1994). Supervisor trust building, leader-member exchange and organizational citizenship behaviour.
Journal of Occupational and Organizational Psychology, 67, 315–326.
Dipaola, M., & Guy, S. (2009). The impact of organizational justice on climate and trust in high schools. Journal
of School Leadership, 19, 382-405.
DiPaola, M. F., & Hoy, W. K. (2005a). Organizational citizenship of faculty and achievement of high school
students. The High School Journal, 88, 35-44.
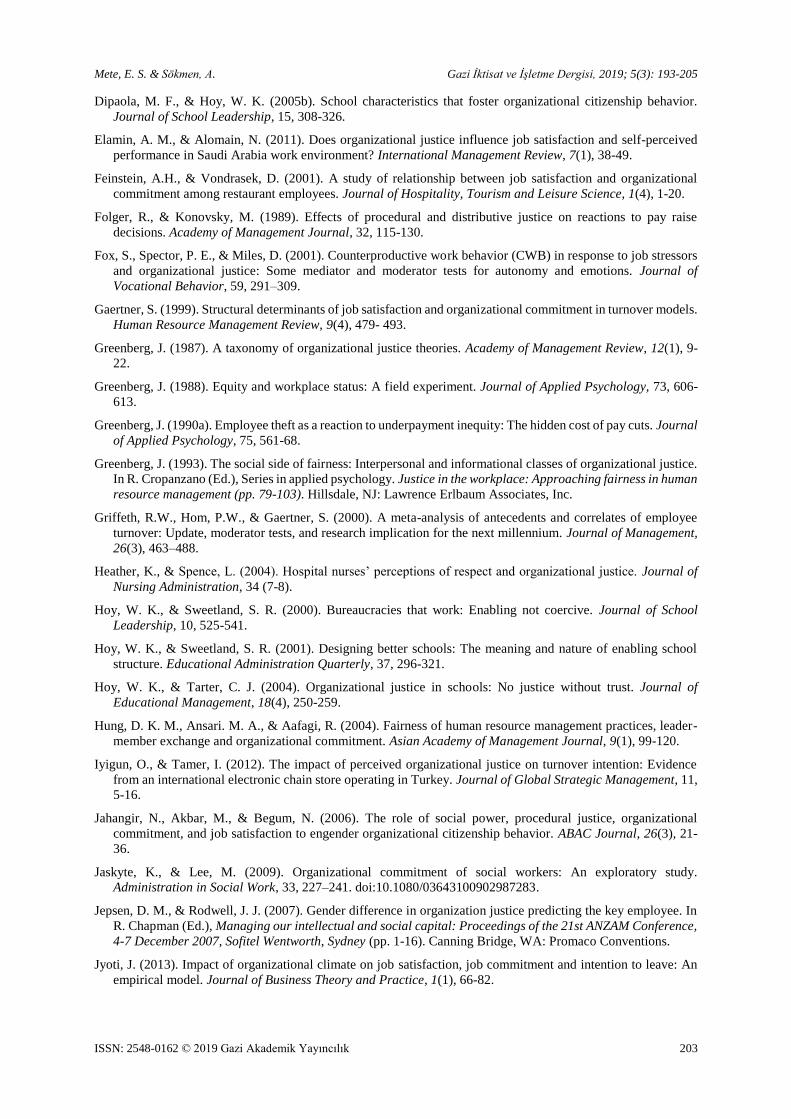
Mete, E. S. & Sökmen, A. Gazi İktisat ve İşletme Dergisi, 2019; 5(3): 193-205
ISSN: 2548-0162 © 2019 Gazi Akademik Yayıncılık 203
Dipaola, M. F., & Hoy, W. K. (2005b). School characteristics that foster organizational citizenship behavior.
Journal of School Leadership, 15, 308-326.
Elamin, A. M., & Alomain, N. (2011). Does organizational justice influence job satisfaction and self-perceived
performance in Saudi Arabia work environment? International Management Review, 7(1), 38-49.
Feinstein, A.H., & Vondrasek, D. (2001). A study of relationship between job satisfaction and organizational
commitment among restaurant employees. Journal of Hospitality, Tourism and Leisure Science, 1(4), 1-20.
Folger, R., & Konovsky, M. (1989). Effects of procedural and distributive justice on reactions to pay raise
decisions. Academy of Management Journal, 32, 115-130.
Fox, S., Spector, P. E., & Miles, D. (2001). Counterproductive work behavior (CWB) in response to job stressors
and organizational justice: Some mediator and moderator tests for autonomy and emotions. Journal of
Vocational Behavior, 59, 291–309.
Gaertner, S. (1999). Structural determinants of job satisfaction and organizational commitment in turnover models.
Human Resource Management Review, 9(4), 479- 493.
Greenberg, J. (1987). A taxonomy of organizational justice theories. Academy of Management Review, 12(1), 9-
22.
Greenberg, J. (1988). Equity and workplace status: A field experiment. Journal of Applied Psychology, 73, 606-
613.
Greenberg, J. (1990a). Employee theft as a reaction to underpayment inequity: The hidden cost of pay cuts. Journal
of Applied Psychology, 75, 561-68.
Greenberg, J. (1993). The social side of fairness: Interpersonal and informational classes of organizational justice.
In R. Cropanzano (Ed.), Series in applied psychology. Justice in the workplace: Approaching fairness in human
resource management (pp. 79-103). Hillsdale, NJ: Lawrence Erlbaum Associates, Inc.
Griffeth, R.W., Hom, P.W., & Gaertner, S. (2000). A meta-analysis of antecedents and correlates of employee
turnover: Update, moderator tests, and research implication for the next millennium. Journal of Management,
26(3), 463–488.
Heather, K., & Spence, L. (2004). Hospital nurses’ perceptions of respect and organizational justice. Journal of
Nursing Administration, 34 (7-8).
Hoy, W. K., & Sweetland, S. R. (2000). Bureaucracies that work: Enabling not coercive. Journal of School
Leadership, 10, 525-541.
Hoy, W. K., & Sweetland, S. R. (2001). Designing better schools: The meaning and nature of enabling school
structure. Educational Administration Quarterly, 37, 296-321.
Hoy, W. K., & Tarter, C. J. (2004). Organizational justice in schools: No justice without trust. Journal of
Educational Management, 18(4), 250-259.
Hung, D. K. M., Ansari. M. A., & Aafagi, R. (2004). Fairness of human resource management practices, leader-
member exchange and organizational commitment. Asian Academy of Management Journal, 9(1), 99-120.
Iyigun, O., & Tamer, I. (2012). The impact of perceived organizational justice on turnover intention: Evidence
from an international electronic chain store operating in Turkey. Journal of Global Strategic Management, 11,
5-16.
Jahangir, N., Akbar, M., & Begum, N. (2006). The role of social power, procedural justice, organizational
commitment, and job satisfaction to engender organizational citizenship behavior. ABAC Journal, 26(3), 21-
36.
Jaskyte, K., & Lee, M. (2009). Organizational commitment of social workers: An exploratory study.
Administration in Social Work, 33, 227–241. doi:10.1080/03643100902987283.
Jepsen, D. M., & Rodwell, J. J. (2007). Gender difference in organization justice predicting the key employee. In
R. Chapman (Ed.), Managing our intellectual and social capital: Proceedings of the 21st ANZAM Conference,
4-7 December 2007, Sofitel Wentworth, Sydney (pp. 1-16). Canning Bridge, WA: Promaco Conventions.
Jyoti, J. (2013). Impact of organizational climate on job satisfaction, job commitment and intention to leave: An
empirical model. Journal of Business Theory and Practice, 1(1), 66-82.
Mete, E. S. & Sökmen, A. Gazi İktisat ve İşletme Dergisi, 2019; 5(3): 193-205
ISSN: 2548-0162 © 2019 Gazi Akademik Yayıncılık 204
Kim, W. C., & Mauborgne, R.. (1998). Procedural justice, strategic decision making, and the knowledge economy.
Strategic Management Journal, 19(4), 323-38.
Koh, H. C., & Boo, H.Y. (2004). Organizational ethics and employee satisfaction and Commitment. Management
Decision, 42 (5), 677- 693.
Kovach, K.A. (1997). Organization size, job satisfaction, absenteeism and turnover. Washington, D.C.: University
Press of America.
Lam, S. S. K., Schaubroeck, J., & Aryee, S. (2002). Relationship between organizational justice and employee
work outcomes: A cross-national study. Journal of Organizational Behavior, 23(1), 1-18. doi:
10.1002/job.131.
Lambert, E. (2003). The impact of organizational justice on correctional staff. Journal of Criminal Justice, 31(5),
155-168.
Lambert, E., Hogan, N., & Griffin, M. L. (2007). The impact of distributive and procedural justice on correctional
staff job stress, job satisfaction, and organizational commitment. Journal of Criminal Justice, 35, 644-656.
Landsman, M. (2008). Pathways to organizational commitment. Administration in Social Work, 32, 103–
132.doi:10.1300/J147v32n02_07.
Lee, H.R. (2000). An empirical study of organizational justice as mediator of the relationship among leader-
member exchange and job satisfaction, organizational commitment and turnover intentions in the lodging
industry. Published PHD Thesis, Virginia Polytechnic Institute and State University.
Locke, E. A. (1969). What is job satisfaction? Organizational Behavior and Human Performance, 4(4), 309-336.
doi:10.1016/0030-5073(69)90013-0.
Locke, E. A., & Latham, P. G. (1990b). Work motivation and satisfaction: Light at the end of the tunnel.
Psychological Science, 1, 240–246.
Loi, R., Hang-Hue, N., & Foley, S. (2006). Linking employees' justice perceptions to organizational commitment
and intention to leave: The mediating role of perceived organizational support. Journal of Occupational and
Organizational Psychology, 79, 101-120.
Lok, P., & Crawford, J. (2001). Antecedents of organizational commitment and the mediating role of job
satisfaction. Journal of Managerial Psychology, 16(8), 594-613.
Maheshwari, R., & Maheshwari, H. P. (2012). Analyzing the dynamics of the relationship between organizational
factors, attitude factors and organizational commitment and turnover intentions of faculty members in self-
financed professional institutions in Delhi and NCR, Opinion. International Journal of Business Management,
2(2), 56-69.
Markovits, Y., Davis, A. J., & van Dick, R. (2007). Organizational commitment profiles and job satisfaction among
Greek private and public sector employees. International Journal of Cross Cultural Management, 7(1), 77-99.
McFarlin, D., & Sweeney, P. (1992). Distributive and procedural justice as predictors of satisfaction with personal
and organizational outcomes. Academy of Management Journal, 35, 626-37.
Medlin, B., & Green, Jr., K.E. (2009). Enhancing performance through goal setting, engagement, and optimism.
Industrial Management and Data Systems, 109(7), 943-956.
Memarzadeh, G., & Mahmoudi, R. K. (2010). Applying organizational concepts in the Iran public sector: A
preliminary empirical work on justice. European Journal of Social Sciences, 14(4), 594-605.
Mete, E.S., Sökmen, A., & Bıyık, Y. (2016). The relationship between organizational commitment, organizational
identification, person-organization fit and job satisfaction: A research on IT employees. International Review
of Management and Business Research, 5(3), 870-901.
Moorman, R. H. (1991). Relationship between organizational justice and organizational citizenship behaviors: Do
fairness perceptions influence employee citizenship?. Journal of Applied Psychology, 76(6), 845-
855.doi:10.1037/0021-9010.76.6.845.
Mowday, R.T., Steers, R.M., & Porter, L.W. (1979). The measurement of organizational commitment. Journal of
Vocational Behavior, 14(2), 224-247.
Mowday, R.T., Porter, L.W., & Steers, R.M. (1982). Employee organization linkages: The psychology of
commitment, absenteeism, and turnover. New York, NY: Academic Press.
Mete, E. S. & Sökmen, A. Gazi İktisat ve İşletme Dergisi, 2019; 5(3): 193-205
ISSN: 2548-0162 © 2019 Gazi Akademik Yayıncılık 205
Nadiri, H., & Tanova, C. (2009). An investigation of the role of justice in turnover intentions, job satisfaction and
organizational citizenship behavior in hospitality industry. International Journal of Hospitality Management,
28(4), 586-93.
Nili, M., Hendijani, M., & Shekarchizadeh, A. (2012). Measuring the Impact of Perceived Justice on
Organizational Construct in Isfahan Municipality. Interdisciplinary Journal of Contemporary Research in
Behavior, 4(5), 857-869.
Promket, C., & Thanyaphirak, V. (2012). An Empirical Study of Organizational Justice as a Mediator of the
Relationships Among Organizational Culture, Employee Satisfaction, and Employee Commitment in
Rafamangala University of Technology, Isan Sakm Nakhon Campus, Thailand. Review of Business Research,
12(2), 47-58.
Rai, G.S. (2013). Impact of organizational justice on satisfaction, commitment and turnover intention: Can fair
treatment by organizations make a difference in their workers’ attitudes and behaviors? International Journal
of Human Sciences, 10(2), 260-284.
Rezaiean, A., Givi, M.E., Givi, H.E., & Nasrabadi, M.B. (2010). The relationship between organizational justice
and organizational citizenship behaviors: The mediating role of organizational commitment, satisfaction and
trust. Research Journal of Business Management, 4, 112-120.
Sweeney, P.D., & McFarlin, D.B. (1993). Workers evaluations of the 'Ends' and the 'Means': An examination of
four models of distributive and procedural justice. Organizational Behavior and Human Decision Processes,
55, 23-40.
Sjahruddin, H., Armanu, Sudiro A., & Normijati. (2013). Personality effect on organizational citizenship
behaviour (OCB): Trust in manager and organizational commitment mediator of organizational justice in
Makassar City hospitals (Indonesia). European Journal of Business and Management, 5(9), 95-104.
Simons, T., & Roberson, Q. (2003). Why managers should care about fairness: The effects of aggregate perception
on organizational outcomes. Journal of Applied Psychology, 88(3), 432-443.
Smith, R.J., & Clark, S.J. (2011). Does job research loss reduce burnout and job exit for professionally trained
social workers in child welfare? Children and Services Review, 33, 1950-1959.
Spector, P. E. (1985). Higher-order need strength as a moderator of the job scope-employee outcome relationship:
A meta-analysis. Journal of Occupational Psychology, 58, 119–127.
Spector, P. E. (1997). Job Satisfaction: Application, assessment, causes, and consequences. Thousand Oaks, CA:
Sage Publications.
Tai, T.W.C., Bame, S.I., & Robinson, C.D. (1998). Review of nursing turnover research, 1977–1996. Social
Science and Medicine, 47(12), 1905–1924.
Tett, R.P., & Meyer, J.P. (1993). Job satisfaction, organizational commitment, turnover intention, and turnover:
Path analyses based on meta-analytic findings. Personnel Psychology, 46, 259-293.
Tremblay, M., Cloutierb, J. Simardb, G., Cheneverta, D., & Vandenberghe, C. (2010). The role of HRM practices,
procedural justice, organizational support and trust in organizational commitment and in-role and extra-role
performance. The International Journal of Human Resource Management, 21(3), 405–433.
Wittmer, J. L., Martin, J. E., & Tekleab, A. G. (2010). Procedural Justice and work outcomes in a unionized setting:
The mediating role of leader-member exchange. American Journal of Business, 25(2), 55-70.
Wong, C. S., Wong, Y. T., Hui, C., & Law, K. S. (2001). The significant role of Chinese employee’s organizational
commitment: Implications for managing employees in Chinese societies. Journal of World Business, 36(3),
326–340.
Yang, J. (2009). Antecedents and consequences of job satisfaction in the hotel industry Jen-Te. International
Journal of Hospitality Management, 29(4), 609-619.

ISSN: 2548-0162 © 2019 Gazi Akademik Yayıncılık
Gazi İktisat ve İşletme Dergisi, 2019; 5(3): 206-215 https://dergipark.org.tr/tr/pub/gjeb
An Empirical Evidence on the Causality between Sectoral Economic Growth
and Financial Development in Turkey1
Çiğdem Kurt Cihangir
Dr. Öğr. Üyesi, Hitit Üniversitesi İktisadi ve İdari Bilimler Fakültesi İşletme Bölümü, Akkent No: 4, Çorum 19030, TÜRKİYE.
e-posta: [email protected] ORCID ID: https://orcid.org/0000-0003-1761-1038
ARTICLE INFO
ABSTRACT
Geliş Tarihi: 04.07.2019
Kabul Tarihi: 09.09.2019
Çevrimiçi Kullanım
Tarihi: 24.10.2019
Makale Türü: Araştırma
makalesi
In this study, the causal relationships of financial development indicators
and trade openness with total economic growth, economic growth of
manufacturing industry and construction sectors, are investigated in the
2003Q1 - 2018Q3 period. As a result of Johansen cointegration analysis
with three seperate models, it is determined that there is a long-term
relationship between the variables, valid for all models. According to the
results of the Granger causality test, the direction of the relationship
between financial development and economic growth changes according
to the financial development indicator. Accordingly, a mutual causal
relationship of the total economic growth and the manufacturing industry
economic growth with the private sector loans, which is indicator of
quantitative financial development, is identified. As the economic growth
in the construction sector leads to financial development, it is determined
that the demand-following view is dominant.
Key Words:
Sectoral Economic
Growth, Financial
Development, Trade
Openness, Causality.
Türkiye'de Sektörel Ekonomik Büyüme ile Finansal Gelişme Arasındaki
Nedensellik Üzerine Ampirik Bir Uygulama
MAKALE BİLGİSİ
ÖZ
Received: 04.07.2019
Accepted: 09.09.2019
Available online: 24.10.2019 Article Type: Research
article
Bu çalışmada 2003Ç1-2018Ç3 döneminde finansal kalkınma
göstergeleri ve ticari açıklık ile ekonomik büyüme arasındaki nedensellik
ilişkisi, hem toplam ekonomik büyüme hem de imalat sanayi ve inşaat
sektörlerinin ekonomik büyümesi açısından araştırılmıştır. Üç ayrı
modelle yapılan Johansen eşbütünleşme analizi sonucunda, tüm modeller
için geçerli olmak üzere, değişkenler arasında uzun dönem ilişki olduğu
belirlenmiştir. Granger nedensellik testi tahmin sonuçlarına göre,
finansal gelişme ile ekonomik büyüme arasındaki ilişkinin tespitinde,
finansal gelişme göstergesinin belirleyici olduğu sonucuna ulaşılmıştır.
Buna göre, miktar ölçütlü finasal kalkınma göstergesi olan özel sektör
kredileri ile toplam ekonomik büyüme ve imalat sanayi ekonomik
büyümesi arasında karşılıklı bir nedensellik ilişkisi belirlenmiştir. İnşaat
sektöründe ise ekonomik büyüme finansal kalkınmaya neden olduğu için
talep takipli görüşün baskın olduğu tespit edilmiştir.
Anahtar Kelimeler:
Sektörel Ekonomik
Büyüme, Finansal
Kalkınma, Ticari
Açıklık, Nedensellik.
Doi: https://dx.doi.org/10.30855/gjeb.2019.5.3.006

Kurt Cihangir, Ç. Gazi İktisat ve İşletme Dergisi, 2019; 5(3): 206-215
ISSN: 2548-0162 © 2019 Gazi Akademik Yayıncılık 207
1. Introduction
Globalization is a process in which goods and services, production factors, technological
accumulation and financial resources are freely circulated among countries and the factors, goods,
services and financial markets are increasingly integrated (Şenses, 2004, p. 13). In order to measure the
integration of countries economically into the world, trade openness and financial openness indicators
are taken into consideration. Trade and financial openness are defined as the removal of national
restrictions on the free movement of goods, services, labor, and capital between countries, (Yapraklı,
2007).
Trade liberalization is to soften the protection walls for both imports and exports and to bring
foreign investment and competition to the economy (Rruka, 2004, p. 8). Trade openness, as a result of
trade liberalization, refers to the policies implemented by countries in their trade relations with the
outside world. Indicators of trade openness can be classified into three criteria(Wacziarg, 2001, p. 402).
The first is the output criteria, which represents the amount of trade or the components of the trade.
Second, there are policy indicators, which reflect the attitude of the country's institutions towards other
countries, for example, tariff rates, non-tariff barriers. Finally, the deviation criteria are deviations
between the amount of trade realized and the estimated free trade amounts.
Even though the history of trade liberalization movements is old, financial liberalization, which is
its complement, gained momentum in the 1980s. Increasing trade relations, developments in the
information communication sector, technological innovations allowed capital to move freely. Increasing
the number of financial instruments accelerated financial liberalization movements by offering the
opportunity to diversify risk for investors (Eichengreen & Mussa, 1998, p. 17). Thereby, financial
liberalization is the result of regulations in money and capital markets (Onur, 2005) and in the broadest
sense is the removal of controls on international capital movements.
It can be said that the concepts of trade openness and financial openness are reflected in the national
market as financial development. It is expected that economic and financial indicators in the national
market will ultimately affect economic growth. The relationship between financial development and
economic growth has been the subject of interest for many researchers and different results have
emerged. The theoretical and empirical literature can be summarized in four headings as the demand-
following, supply-leading, studies indicating that there is mutual interaction and is not a relationship.
Demand-following and supply-leading hypotheses are developed by Patrick (1966). While the economic
growth in demand-following hypothesis causes financial development, the development of the financial
system in the supply-leading hypothesis is accepted as the cause of economic growth. According to the
mutual interaction approach put forward by Arthur Lewis (1955), economic growth leads to financial
development by increasing demand for financial services, and financial development provides economic
growth by transferring the resources needed by the real sector (Kirkpatrick & Green, 2002, p. 207;
Türedi & Berber, 2010, p. 302). Lucas (1988) argues that financial growth does not affect economic
growth as the source of economic growth depends on physical and human capital.
Determining the variables that can measure the level of financial development is more complex
than the indicators of trade openness, because the aspect of the causal relationship between financial
development and growth can vary according to the indicators. In order to achieve correct results, the
most comprehensive indicators to reflect the economic conditions and the situation of the country
concerned should be identified. Lynch (1996) recommends the use of monetary aggregates, loans-
related sizes, capital markets-related indicators, structural indicators, change indicators as indicators of
financial development.
In this study, unlike the studies in the literature, both total GDP and GDP of manufacturing industry
and construction sectors are analyzed. In this way, it is thought that economic growth will contribute to
sectoral restructuring and sustainable economic growth by identifying sectors that are motor/driving
forces of economic growth. Accordingly, the main dynamics affecting the GDP of manufacturing
industry and construction sectors, and total GDP are investigated on the basis of integration with the
world.
In this study, the causal relationship between sectoral economic growth and trade openness and the
determined financial development indicators are investigated. The financial development indicators are
Kurt Cihangir, Ç. Gazi İktisat ve İşletme Dergisi, 2019; 5(3): 206-215
ISSN: 2548-0162 © 2019 Gazi Akademik Yayıncılık 208
determined according to quantitative, structural and change criteria as suggested by Lynch (1996). As
the quantitative criterions the stock exchange trading volume / GDP, private sector loans to represent
the intermediation activities of the banking sector / GDP; as the structural criterion the M2 money supply
definition / GDP; and as the change criteria the difference between loan interest rate and deposit interest
rate are taken. When the literature is examined, no study that examines economic growth with these
variables on a sectoral basis has been found. Another contribution of this study to the literature is the
period of 2003Q1- 2018Q3. This period is characteristic in the world economy in terms of both the 2008
global crisis and the impact of policies implemented after the crisis on the markets. The aim of this study
is to determine the basic dynamics of economic growth of manufacturing industry, and construction
sectors, and total economic growth in order to ensure sustainable economic growth. Also, it is to
contribute to the creation of policies appropriate to the sectors that need to be supported.
The study was conducted amidst few limitations. First, only the banking system, capital markets,
broad monetary definition, and change indicators were used as financial development indicators.
Second, the services and the agricultural sectors were excluded from the analysis, to determine the
relationship between manufacturing industry and construction sectors with financial development. In
the study, it is found that there is a mutual causal relationship between the total GDP and private sectors
loans. The results are evaluated on a sectoral basis as follows. There is dominant the supply-leading
vision in manufacturing industry sector; that is, financial development is interpreted as causing
economic growth. There is dominant the demand-side vision in construction sector, because economic
growth is the cause of financial development.
The rest of the paper is organised as follows. Section 2 reviews the related literature. Section 3
presents the data used and empirical applications. Section 4 concludes, providing some policy
implications.
2. Literature review
Amount of studies have been carried out to investigate the relationship between economic growth
and trade openness and financial development, which are two main sources of liberalization. The studies
investigating the causal relationship are given below.
Some of these studies arguing that economic growth causes financial development are as follows:
In the study of Awojobi (2013), the relationship between domestic output, trade openness and financial
development are investigated using the Granger causality test in Greece for the period 1960-2009.
According to the results, there is relationship between financial development and economic growth.
Also, economic growth is an accelerator for trade openness, and there is one-directional causality from
the trade sector to financial development. Saaed and Hussain (2015) examined the causal relationship
between financial development, trade openness and economic growth in Kuwait for the period 1977-
2012 with Granger causality tests. The results show that there is one-directional causality between
economic growth and financial development and between trade openness and economic growth. Also,
while economic growth is the Granger cause of financial development, trade openness is the Granger
cause of economic growth.
In Ersoy’s (2011) study of Turkey for the period 1980-2008, the causal relationship to financial
development and to economic growth from financial openness is not found. But there is one-directional
causal relationship to financial openness from financial development in the long-term. In the study of
Özel (2012), Turkey's economy is examined with the VAR model in the quarter period 1991 - 2010.
According to results of this study financial openness is determined as the Granger cause of both GDP
and trade openness. Kar et al. (2014) are stated that mutual causality between economic growth and
trade openness. Also, they indicated that the economic development ist he cause of the financial
development. Variables of the study are trade openness (total trade to the GDP), financial development,
domestic credit to income, private sector credit to income, and the market capitalization ratio, GDP
series. In the study of Öztürk (2008), using the VAR framework and Granger test, the causality between
financial development and economic growth for the period 1975-2005 in Turkey is investigated. The
results show that there is not a long-run causal relationship between variables. But, there is a one-
directional causality running to financial development from economic growth.
Kurt Cihangir, Ç. Gazi İktisat ve İşletme Dergisi, 2019; 5(3): 206-215
ISSN: 2548-0162 © 2019 Gazi Akademik Yayıncılık 209
Çınar and Nulambeh (2017) stated that one-directional causality towards trade openness from GDP,
inflation and exports, to per capita income from inflation and direct foreign investment, imports are
found in Turkey's economy for the period 1974-2015. In study of Cihangir and Öztürk (2018), the
relationship between trade openness, designated financial development indicators (financial openness,
private sector domestic credit volume/GDP and exchange trading volume/GDP) and sectoral (total
GDPs of all sectors, construction sector, manufacturing sector, services sector) economic growth are
investigated using Johansen-Juselius Cointegration Test and VECM over the period 2002Q1 - 2017Q4
for Turkey's economy. According to the results, there is a long-term relationship between the variables
but there is no short-term relationship.
The studies arguing that financial development causes economic growth are as follows: Yapraklı
(2007) investigate causal relationship between trade openness, financial openness and economic growth
for the quarter period 1990-2006 in Turkey's economy. As a result of the study, one-directional causality
relation from trade openness to financial openness is determined. Türedi and Berber (2010) proved a
mutual causal relationship between trade openness and economic growth, and one-directional causal
relationship from financial development to economic growth in Turkish economy over the period 1970
- 2007 using VAR and causality test. Also, there is a relationship between the variables in the long term.
Demir et al. (2017) examine the causality between trading openness, financial openness, and economic
growth with Granger casualty test and VAR analysis for the period 1991Q4 - 2016Q3 in Turkey.
Variables of the study are trade openness, financial openness, economic growth, exchange rate, direct
foreign investment, interest rate and BİST 100 index. The results show that there is one-directional
causal relationship from the financial market data to economic growth and from the direct foreign
investment to financial openness. Trade and financial openness positively influence economic growth.
Jung (1986) examined the causal relationship between financial development and economic growth
using the Granger causality test in 56 countries for the period of 1950-1980. It is determined that the
causality relation is from financial development to economic growth in underdeveloped countries and
from economic growth to financial development in developed countries.
Studies suggesting a mutual relationship between financial development and economic growth as
follows: Pradhan et al. (2015) are investigated that the causal relationship between financial depth, trade
openness and economic growth data during 1994-2011 in India. According to this study, economic
growth is positively affected from trade openness and there is a mutual causal relationship between
financial depth and economic growth.
In the study of Yücel (2009), the causal relationship between financial development, trade openness
and economic growth in Turkey for the period 1989M1-2007M11 is investigated. The results of Granger
causality test are indicated that there are mutual causality relations between financial development and
economic growth and between trade openness and economic growth. Yıldırım and Çevik (2017)
detected a causal relationship from economic growth to financial openness in the period 1993-2016 in
Turkey using Granger causality test and asymmetric causality test. According to the result of the Granger
causality test, there is a mutual causal relationship between economic growth and financial openness.
There are also studies suggesting that there is no relationship between liberalization policies and
economic growth. Such as, Menyah et al. (2014) investigated the relationship between financial
development and trade liberalization with growth in the 21 African countries using the Granger causality
test for the period 1965-2008. According to the results of this study, the related variables have no
significant effect on growth.
3. Data and methodology
3.1. Data Description
In this study, the causal relationship between manufacturing industry and construction sectors’s
GDPs and trade openness, Private Sector Domestic Loan Use / GDP, Stock Exchange Trading Volume
/ GDP, and M2 / GDP, and the difference between loan interest rate and deposit interest rate indicators
are investigated for the period of 2003Q1 – 2018Q3.
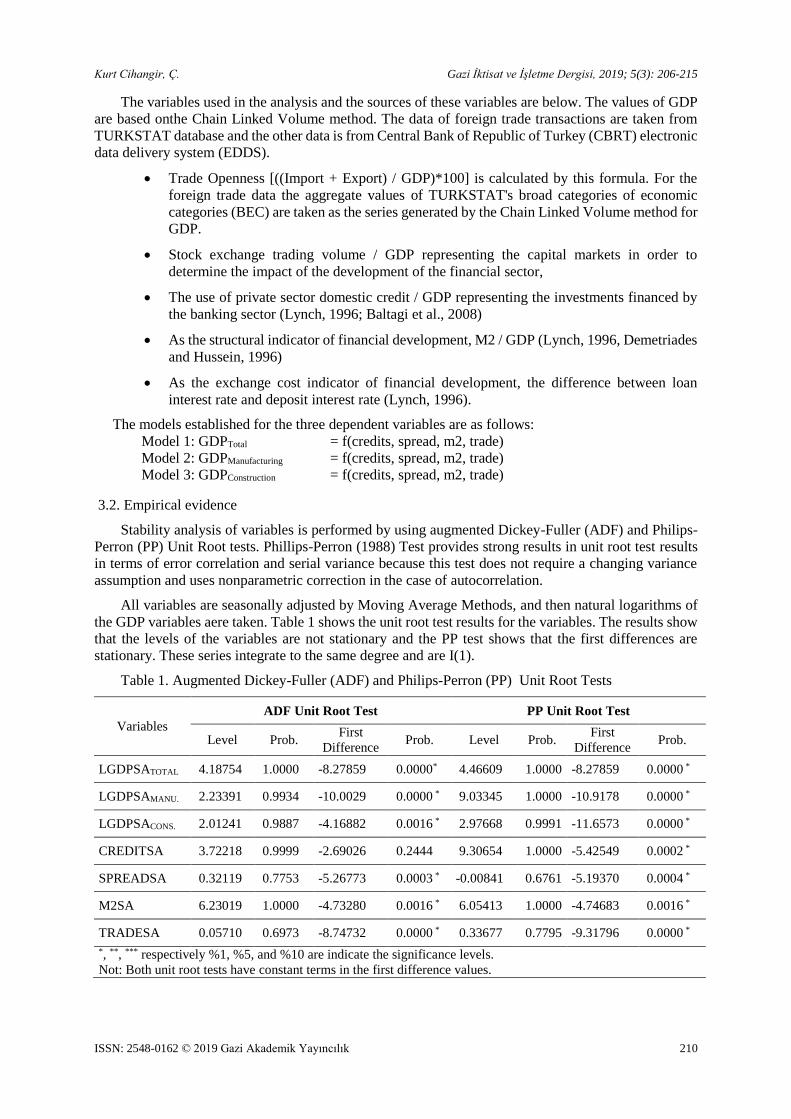
Kurt Cihangir, Ç. Gazi İktisat ve İşletme Dergisi, 2019; 5(3): 206-215
ISSN: 2548-0162 © 2019 Gazi Akademik Yayıncılık 210
The variables used in the analysis and the sources of these variables are below. The values of GDP
are based onthe Chain Linked Volume method. The data of foreign trade transactions are taken from
TURKSTAT database and the other data is from Central Bank of Republic of Turkey (CBRT) electronic
data delivery system (EDDS).
Trade Openness [((Import + Export) / GDP)*100] is calculated by this formula. For the
foreign trade data the aggregate values of TURKSTAT's broad categories of economic
categories (BEC) are taken as the series generated by the Chain Linked Volume method for
GDP.
Stock exchange trading volume / GDP representing the capital markets in order to
determine the impact of the development of the financial sector,
The use of private sector domestic credit / GDP representing the investments financed by
the banking sector (Lynch, 1996; Baltagi et al., 2008)
As the structural indicator of financial development, M2 / GDP (Lynch, 1996, Demetriades
and Hussein, 1996)
As the exchange cost indicator of financial development, the difference between loan
interest rate and deposit interest rate (Lynch, 1996).
The models established for the three dependent variables are as follows:
Model 1: GDPTotal = f(credits, spread, m2, trade)
Model 2: GDPManufacturing = f(credits, spread, m2, trade)
Model 3: GDPConstruction = f(credits, spread, m2, trade)
3.2. Empirical evidence
Stability analysis of variables is performed by using augmented Dickey-Fuller (ADF) and Philips-
Perron (PP) Unit Root tests. Phillips-Perron (1988) Test provides strong results in unit root test results
in terms of error correlation and serial variance because this test does not require a changing variance
assumption and uses nonparametric correction in the case of autocorrelation.
All variables are seasonally adjusted by Moving Average Methods, and then natural logarithms of
the GDP variables aere taken. Table 1 shows the unit root test results for the variables. The results show
that the levels of the variables are not stationary and the PP test shows that the first differences are
stationary. These series integrate to the same degree and are I(1).
Table 1. Augmented Dickey-Fuller (ADF) and Philips-Perron (PP) Unit Root Tests
Variables
ADF Unit Root Test PP Unit Root Test
Level Prob. First
Difference Prob. Level Prob.
First
Difference Prob.
LGDPSATOTAL 4.18754 1.0000 -8.27859 0.0000* 4.46609 1.0000 -8.27859 0.0000 *
LGDPSAMANU. 2.23391 0.9934 -10.0029 0.0000 * 9.03345 1.0000 -10.9178 0.0000 *
LGDPSACONS. 2.01241 0.9887 -4.16882 0.0016 * 2.97668 0.9991 -11.6573 0.0000 *
CREDITSA 3.72218 0.9999 -2.69026 0.2444 9.30654 1.0000 -5.42549 0.0002 *
SPREADSA 0.32119 0.7753 -5.26773 0.0003 * -0.00841 0.6761 -5.19370 0.0004 *
M2SA 6.23019 1.0000 -4.73280 0.0016 * 6.05413 1.0000 -4.74683 0.0016 *
TRADESA 0.05710 0.6973 -8.74732 0.0000 * 0.33677 0.7795 -9.31796 0.0000 *
*, **, *** respectively %1, %5, and %10 are indicate the significance levels.
Not: Both unit root tests have constant terms in the first difference values.

Kurt Cihangir, Ç. Gazi İktisat ve İşletme Dergisi, 2019; 5(3): 206-215
ISSN: 2548-0162 © 2019 Gazi Akademik Yayıncılık 211
The variables must be stationary for the Granger causality test to be applied. Accordingly, if the mean
and variance of a series are constant over time and the covariance of the series does not change over
time, the series is stationary. In a model set up with non-stationary series, the causal relationship may
not be correctly identified. The exception to this is that the series move together in the long run, that is,
there is a cointegration relationship between the series. While the Vector Autoregressive Model (VAR)
is used to determine the causal relationship between variables that are non-stationary and do not have a
cointegration relationship, it is appropriated to use the Vector Error Correction Model (VECM) for the
causal relationship between variables that are non-stationary but have a cointegration relationship
(Yavuz, 2005).
In order to investigate the cointegration relationship, the optimal lag length should be determined.
According to LR (Log Likelihood), FPE (Akaike Information Criterion), SIC (Schwarz Information
Criterion) and HQ (Hannan-Quinn Information Criterion) criteria, which are taken into consideration in
calculating optimal lag length in VAR Model. The lag length determined for these Models is given
respectively 2, 1, and 2 (see. Appendix 1).
Table 2. Results of Johansen's Cointegration Test
LGDPSATOTAL
H0 λtrace %5 Critical
Value Prob. H0 λmax
%5 Critical
Value Prob.
r = 0 73.01681 69.81889 0.0272* r = 0 29.72722 33.87687 0.1446
r ≤ 1 - - - r ≤ 1 - - -
LGDPSAMANUFACTURING
H0 λtrace %5 Critical
Value Prob. H0 λmax
%5 Critical
Value Prob.
r = 0 87.81591 69.81889 0.0010 * r = 0 32.36360 33.87687 0.0749
r ≤ 1 55.45231 47.85613 0.0082 * r ≤ 1 30.07458 27.58434 0.0234 *
LGDPSACONSTRUCTION
H0 λtrace %5 Critical
Value Prob. H0 λmax
%5 Critical
Value Prob.
r = 0 76.73404 69.81889 0.0126 * r = 0 31.85212 33.87687 0.0855
r ≤ 1 44.88192 47.85613 0.0926 r ≤ 1 - - - * Statistical significance at the 5% level.
The basic hypothesis (H0) that there is no long-term equilibrium relationship between variables at
5% significance level for all models is rejected. Therefore, according to the Johansen Cointegration test,
there is a long-term equilibrium relationship between the variables since there is at least one cointegrated
relationship in the models (Table 2).
If there is a cointegration relationship between the variables, the short-term relationship should also
be investigated. The vector error correction model is used to determine the short term relationship among
the variables. Accordingly, if the error correction coefficient is negative and statistically significant,
there is a short term relationship between the variables. There was no correlation between variables in
the short-time for all three models based on the estimation results of the vector error correction model
(See. Appendix 2).
Granger causality test is very sensitive to the choice of lag length (Gujarati, 2004, p. 703). In this
study, the optimal lag length test is performed for each model and the optimal lag length is determined
as respectively 2, 1, and 2 for all three models (See. Appendix 1). Table 3 shows the results of the
Granger causality test estimation.
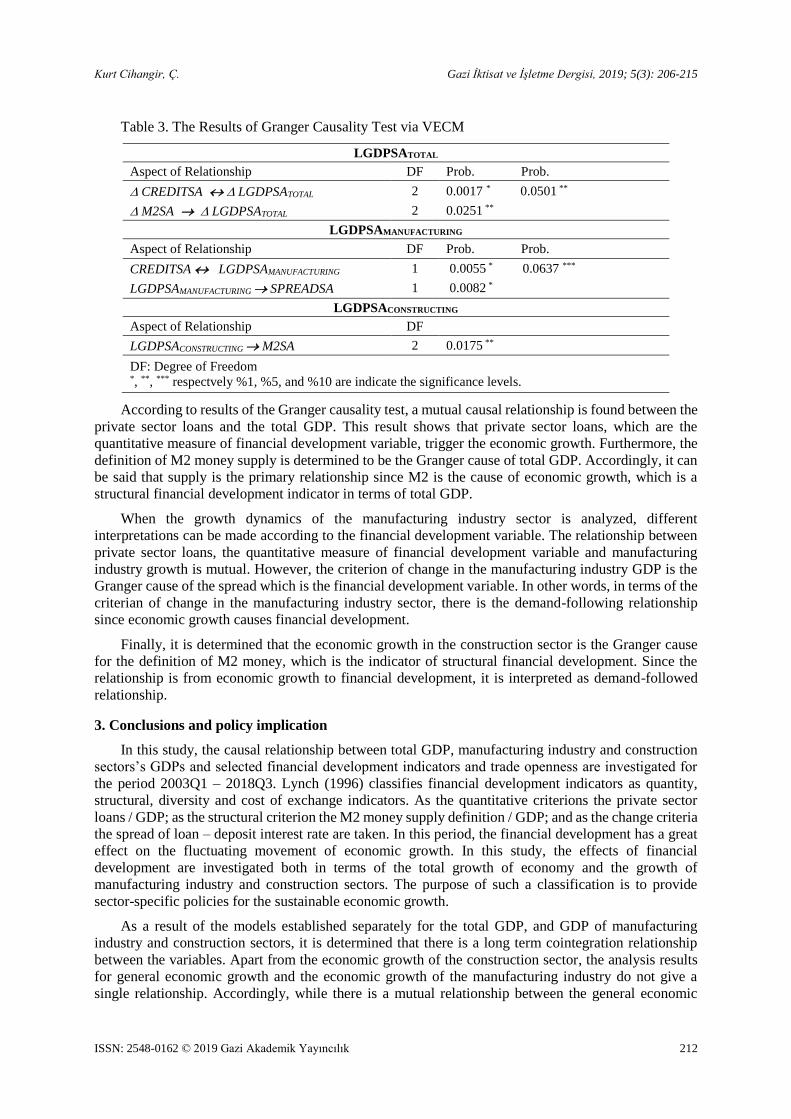
Kurt Cihangir, Ç. Gazi İktisat ve İşletme Dergisi, 2019; 5(3): 206-215
ISSN: 2548-0162 © 2019 Gazi Akademik Yayıncılık 212
Table 3. The Results of Granger Causality Test via VECM
LGDPSATOTAL
Aspect of Relationship DF Prob. Prob.
CREDITSA LGDPSATOTAL 2 0.0017 * 0.0501 **
M2SA LGDPSATOTAL 2 0.0251 **
LGDPSAMANUFACTURING
Aspect of Relationship DF Prob. Prob.
CREDITSA LGDPSAMANUFACTURING 1 0.0055 * 0.0637 ***
LGDPSAMANUFACTURING SPREADSA 1 0.0082 *
LGDPSACONSTRUCTING
Aspect of Relationship DF
LGDPSACONSTRUCTING M2SA 2 0.0175 **
DF: Degree of Freedom *, **, *** respectvely %1, %5, and %10 are indicate the significance levels.
According to results of the Granger causality test, a mutual causal relationship is found between the
private sector loans and the total GDP. This result shows that private sector loans, which are the
quantitative measure of financial development variable, trigger the economic growth. Furthermore, the
definition of M2 money supply is determined to be the Granger cause of total GDP. Accordingly, it can
be said that supply is the primary relationship since M2 is the cause of economic growth, which is a
structural financial development indicator in terms of total GDP.
When the growth dynamics of the manufacturing industry sector is analyzed, different
interpretations can be made according to the financial development variable. The relationship between
private sector loans, the quantitative measure of financial development variable and manufacturing
industry growth is mutual. However, the criterion of change in the manufacturing industry GDP is the
Granger cause of the spread which is the financial development variable. In other words, in terms of the
criterian of change in the manufacturing industry sector, there is the demand-following relationship
since economic growth causes financial development.
Finally, it is determined that the economic growth in the construction sector is the Granger cause
for the definition of M2 money, which is the indicator of structural financial development. Since the
relationship is from economic growth to financial development, it is interpreted as demand-followed
relationship.
3. Conclusions and policy implication
In this study, the causal relationship between total GDP, manufacturing industry and construction
sectors’s GDPs and selected financial development indicators and trade openness are investigated for
the period 2003Q1 – 2018Q3. Lynch (1996) classifies financial development indicators as quantity,
structural, diversity and cost of exchange indicators. As the quantitative criterions the private sector
loans / GDP; as the structural criterion the M2 money supply definition / GDP; and as the change criteria
the spread of loan – deposit interest rate are taken. In this period, the financial development has a great
effect on the fluctuating movement of economic growth. In this study, the effects of financial
development are investigated both in terms of the total growth of economy and the growth of
manufacturing industry and construction sectors. The purpose of such a classification is to provide
sector-specific policies for the sustainable economic growth.
As a result of the models established separately for the total GDP, and GDP of manufacturing
industry and construction sectors, it is determined that there is a long term cointegration relationship
between the variables. Apart from the economic growth of the construction sector, the analysis results
for general economic growth and the economic growth of the manufacturing industry do not give a
single relationship. Accordingly, while there is a mutual relationship between the general economic
Kurt Cihangir, Ç. Gazi İktisat ve İşletme Dergisi, 2019; 5(3): 206-215
ISSN: 2548-0162 © 2019 Gazi Akademik Yayıncılık 213
growth and the private sector loans; it is determined that there is supply-leading relationship between
growth and M2 money definition. In other words financial development causes economic growth.
There is a mutual relationship between the economic growth in manufacturing industry and private
sector loans. However, when the spread of loan - deposit interest rate is evaluated, it is determined that
there is a demand - following relationship. As the economic growth in the construction sector causes the
financial development, it is determined that there is a demand-followed relationship between the
economic growth and the financial development in this sector.
The industrial sector plays an important role in ensuring sustainable economic growth, because it is
more suitable than other sectors to support and increase the country's productivity, employment level
and production and use of technology. The policies implemented by policy makers to develop the
industrial sector will also serve as the locomotive for the economy. In this sense, according to the results
of the analysis, policies that can develop this sector-specific loan alternatives or create demand can be
developed. For examples, bank loans can be redirected to support the manufacturing industry, especially
sectors with high technology weight and added value, instead of the construction sector that creates
temporary benefits. Also, as investment incentives, the supports of the KOSGEB (Small and Medium
Enterprise Development of Turkey) and tax advantages can be increased. Trainings can be organized to
manage these resources and that is as important as access to financial resources. Projects that increase
the industry and university cooperation can be extended in accordance with regional conditions.
Ultimately, sustainable economic growth can only be achieved in this way.
References
Awojobi, O. (2013). Does Trade Openness and Financial Liberalization Foster Growth: An Empirical Study of
Greek Economy. International Journal of Social Economics, 40(6), 537-555.
Baltagi, B. H., Demetriades, P. O. and Law, S. H. (2008). Financial Development and Openness: Evidence from
Panel Data. Journal of Development Economics, 89(2), 285–296. Retrieved from
http://ideas.repec.org/p/max/cprwps/107.html
Cihangir, Ç. K. and Öztürk, S. (2018). Sektörel Büyüme ile Ticari Açıklık ve Finansal Gelişmişlik İlişkisi: Türkiye
Örneği, in International Conference on Empirical& Economic Social Sciences, 27-28 Jun, Bandırma, Turkey,
945-971.
Çınar, M. and Nulambeh, N. (2017). Trade Openness, Foreign Direct Investment and Economic Growth: An
Empirical Study of Turkey, Paradoks Ekonomi. Sosyoloji ve Politika Dergisi, 13(2), 57-70.
Demetriades, P. O. and Hussein, K. A. (1996). Does Financial Development Cause Economic Growth? Time-
Series Evidence from 16 Countries. Journal of Development Economics, 51(2), 387–411.
http://doi.org/10.1016/S0304-3878(96)00421-X
Demir, S., Tıraş, H. T. and Çoşkun, Y. (2017). The Effects of Trading and Financial Openness on Economic
Growth: Turkey Case. Journal of Strategic Research in Social Science, 3(4), 147-170.
Eichengreen, B. and Mussa, M. (1998). Capital Account Liberalization and the IMF. Finance and Development,
December, 16-19.
Ersoy, İ. (2011). The Impact of Financial Openness on Financial Development, Growth and Volatility in Turkey:
Evidence from the ARDL Bounds Tests. Economic Research-Ekonomska Istraživanja, 24(3), 33-44.
Jung, W. S. (1986). Financial Development and Economic Growth: International Evidence. Economic
Development and Cultural Change, 34(2), 333-346.
Kar, M., Nazlıoğlu, Ş. and Ağır, H. (2014). Trade Openness, Financial Development and Economic Growth in
Turkey: Linear and Nonlinear Causality Analysis. Journal of BRSA Banking & Financial Markets, 8(1),
63-86.
Kirkpatrick, C. and Green, C. (2002). Finance and Development: An Overview of the Issues. Journal of
International Development, 14(2), 207–209.
Lucas, R. E. (1988). On the Mechanics on Economic Development. Journal of Monetary Economics, 22, 3-42.
Lynch, D. (1996). Measuring Financial Sector Development: A Study of Selected Asia-Pasific Countries. The
Developing Economies, 34(1), 1-27.

Kurt Cihangir, Ç. Gazi İktisat ve İşletme Dergisi, 2019; 5(3): 206-215
ISSN: 2548-0162 © 2019 Gazi Akademik Yayıncılık 214
Menyah, K., Nazlioglu, S. and Wolde-Rufael, Y., (2014). Financial Development, Trade Openness and Economic
Growth in African Countries: New Insights from a Panel Causality Approach. Economic Modelling, 37, 386-
394.
Onur, S. (2005). Finansal Liberalizasyon ve GSMH Büyümesi Arasındaki İlişki. Zonguldak Karaelmas
Üniversitesi Sosyal Bilimler Dergisi, 1(1), 127-152.
Özel, H. A. (2012). Küreselleşme Sürecinde Ticari ve Finansal Açıklığın Ekonomik Büyüme Üzerine Etkisi:
Türkiye Örneği. Çanakkale Onsekiz Mart Üniversitesi Yönetim Bilimleri Dergisi, 10(19), 21-43.
Öztürk, I. (2008). Financial Development and Economic Growth: Evidence from Turkey. Applied Econometrics
and International Development, 8(1), 85-98.
Patrick, H. (1966). Financial Development and Economic Growth in Underdeveloped Countries. Economic
Development and Cultural Change, 14(2), 174-189.
Phillips, P. C. B. and Perron, P. (1988). Testing for a Unit Root in Time Series Regression. Biometrika, 75(2),
335-346.
Pradhan, Rudra P., Arvin, Mak B. and Norman, Neville R. (2015). A Quantitative Assessment of the Trade
Openness – Economic Growth Nexus in India. International Journal of Commerce and Management, 25(3),
267-293.
Rruka, D. (2004). Decoding the Effects of Trade Volume and Trade Policies on Economic Growth: A Cross-
Country Inversitagiton. EconWPA International Trade Series, No: 0405003,
http://www.econpapers.repec.org/paper/wpawuwpit/0405003.htm
Saaed A. A. J. and Hussain, M. A. (2015). The Causal Relationship among Trade Openness, Financial
Development and Economic Growth: Evidence from Kuwai, Journal of Emerging Issues in Economics.
Finance and Banking (JEIEFB) An Online International Research Journal, 4(1), 1385-1413.
Şenses, F. (2004). Neoliberal Küreselleşme Kalkınma İçin Bir Fırsat mı, Engel mi?, Kalkınma ve Küreselleşme,
in Dedeoğlu, S., Subaşat, T. (Ed.), 1.Baskı. İstanbul: Bağlam Yayınları, 13-54.
Türedi, S. and Berber, M. (2010). Finansal Kalkınma, Ticari Açıklık ve Ekonomik Büyüme Arasındaki İlişki:
Türkiye Üzerine Bir Analiz. Erciyes Üniversitesi İktisadi ve İdari Bilimler Fakültesi Dergisi, 35, 301-316.
Yapraklı, S. (2007). Ticari ve Finansal Dışa Açıklık ile Ekonomik Büyüme Arasındaki İlişki: Türkiye Üzerine Bir
Uygulama. İstanbul Üniversitesi İktisat Fakültesi Ekonometri ve İstatistik Dergisi, 5, 67-89.
Yıldırım, D. Ç. and Çevik, E. I. (2017). Finansal Dışa Açıklık ile Ekonomik Büyüme İlişkisi: Asimetrik
Nedensellik Testi Sonuçları. Finans Politik & Ekonomik Yorumlar, 54(625), 41-51.
Yücel, F. (2009). Causal Relationships between Financial Development, Trade Openness and Economic Growth:
The case of Turkey. Journal of Social Sciences, 5(1), 33-42.
Wacziarg, R. (2001). Measuring the Dinamic Gains from Trade. The World Bank Economic Review, 15(3), 393-
429.
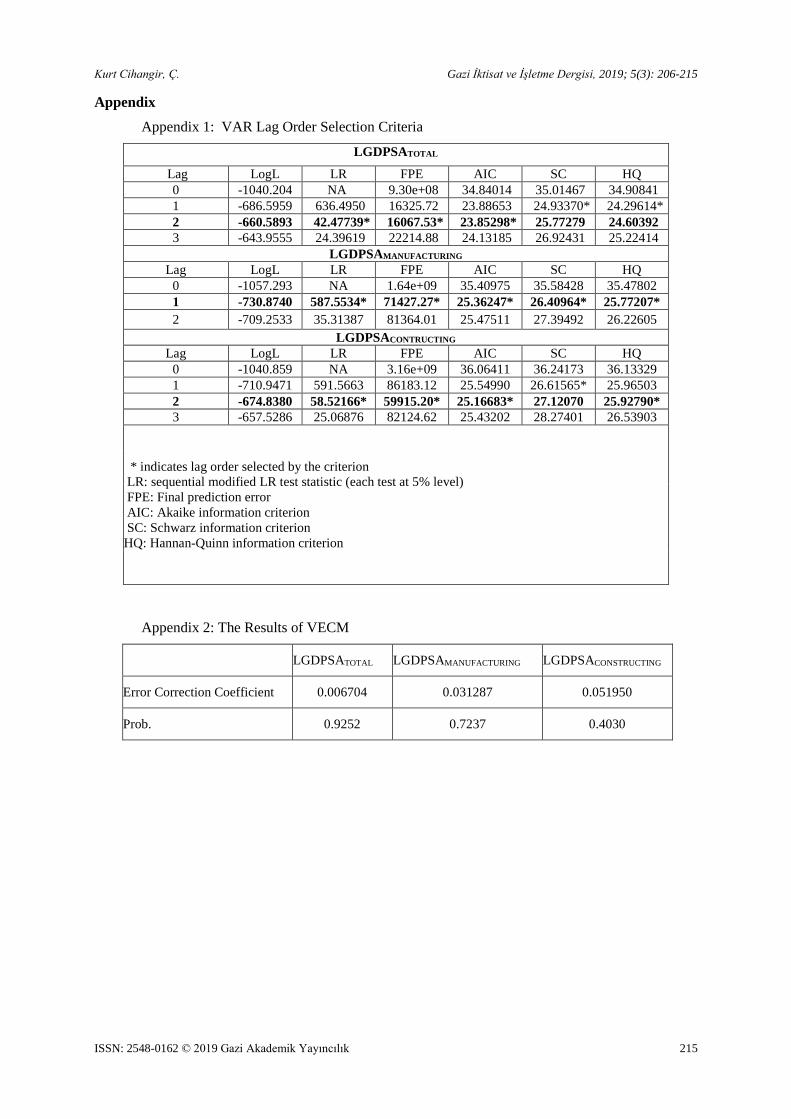
Kurt Cihangir, Ç. Gazi İktisat ve İşletme Dergisi, 2019; 5(3): 206-215
ISSN: 2548-0162 © 2019 Gazi Akademik Yayıncılık 215
Appendix
Appendix 1: VAR Lag Order Selection Criteria
LGDPSATOTAL
Lag LogL LR FPE AIC SC HQ
0 -1040.204 NA 9.30e+08 34.84014 35.01467 34.90841
1 -686.5959 636.4950 16325.72 23.88653 24.93370* 24.29614*
2 -660.5893 42.47739* 16067.53* 23.85298* 25.77279 24.60392
3 -643.9555 24.39619 22214.88 24.13185 26.92431 25.22414
LGDPSAMANUFACTURING
Lag LogL LR FPE AIC SC HQ
0 -1057.293 NA 1.64e+09 35.40975 35.58428 35.47802
1 -730.8740 587.5534* 71427.27* 25.36247* 26.40964* 25.77207*
2 -709.2533 35.31387 81364.01 25.47511 27.39492 26.22605
LGDPSACONTRUCTING
Lag LogL LR FPE AIC SC HQ
0 -1040.859 NA 3.16e+09 36.06411 36.24173 36.13329
1 -710.9471 591.5663 86183.12 25.54990 26.61565* 25.96503
2 -674.8380 58.52166* 59915.20* 25.16683* 27.12070 25.92790*
3 -657.5286 25.06876 82124.62 25.43202 28.27401 26.53903
* indicates lag order selected by the criterion
LR: sequential modified LR test statistic (each test at 5% level)
FPE: Final prediction error
AIC: Akaike information criterion
SC: Schwarz information criterion
HQ: Hannan-Quinn information criterion
Appendix 2: The Results of VECM
LGDPSATOTAL LGDPSAMANUFACTURING LGDPSACONSTRUCTING
Error Correction Coefficient 0.006704 0.031287 0.051950
Prob. 0.9252 0.7237 0.4030