xi3 voyager userguide_en
TRANSCRIPT

BusinessObjects Voyager User'sGuide
BusinessObjects Voyager XI 3.0

© 2008 Business Objects. All rights reserved. Business Objects owns the followingU.S. patents, which may cover products that are offered and licensed by Business
Copyright
Objects: 5,555,403; 5,857,205; 6,289,352; 6,247,008; 6,490,593; 6,578,027;6,831,668; 6,768,986; 6,772,409; 6,882,998; 7,139,766; 7,299,419; 7,194,465;7,222,130; 7,181,440 and 7,181,435. Business Objects and the Business Objectslogo, BusinessObjects, Business Objects Crystal Vision, Business Process OnDemand, BusinessQuery, Crystal Analysis, Crystal Applications, Crystal Decisions,Crystal Enterprise, Crystal Insider, Crystal Reports, Desktop Intelligence, Inxight,the Inxight Logo, LinguistX, Star Tree, Table Lens, ThingFinder, Timewall, Letthere be light, Metify, NSite, Rapid Marts, RapidMarts, the Spectrum Design, WebIntelligence, Workmail and Xcelsius are trademarks or registered trademarks inthe United States and/or other countries of Business Objects and/or affiliatedcompanies. All other names mentioned herein may be trademarks of their respectiveowners.
Business Objects products in this release may contain redistributions of softwarelicensed from third-party contributors. Some of these individual components may
Third-partyContributors
also be available under alternative licenses. A partial listing of third-partycontributors that have requested or permitted acknowledgments, as well as requirednotices, can be found at: http://www.businessobjects.com/thirdparty

ContentsIntroduction to BusinessObjects Voyager 13Chapter 1
About this guide.........................................................................................14What is BusinessObjects Voyager?.....................................................14Who should read this guide?................................................................17
Understanding OLAP 19Chapter 2
OLAP Overview.........................................................................................20Multi-dimensional data cubes....................................................................21Hierarchical data........................................................................................22
Getting Started with BusinessObjects Voyager 25Chapter 3
Opening a workspace and analyzing data.................................................26Some essential terminology.......................................................................26Create a Voyager workspace....................................................................30Define a query...........................................................................................32Add charts and more crosstabs.................................................................32
Adding a chart to the page...................................................................32Adding another crosstab to the page...................................................35
Using Queries to Analyze Cube Data 39Chapter 4
Creating and defining queries to answer your business questions...........40Defining queries.........................................................................................40Modifying queries.......................................................................................45Adding queries...........................................................................................48Creating complex queries by nesting dimensions.....................................49
BusinessObjects Voyager User's Guide 3

Linking a component to a different query...................................................51Deleting queries.........................................................................................52Queries and visual components explained................................................52
Using Charts to Visualize Data 55Chapter 5
Overview of Voyager charts.......................................................................56Chart types................................................................................................57
Cluster bar charts.................................................................................58Stacked bar charts...............................................................................59Percent stacked bar charts...................................................................603D bar charts........................................................................................61Multi-series line charts..........................................................................62Multi-series pie charts..........................................................................63
Adding a chart to the analysis window......................................................63Changing chart types...........................................................................66
Adding data to a chart................................................................................66Defining a query using an empty chart component..............................67Modifying a query in a chart.................................................................67
Scrolling through large data sets in charts................................................68Customizing charts....................................................................................69
Chart name and comments..................................................................70Chart color palettes..............................................................................71Chart styles..........................................................................................71Display font...........................................................................................72Suppressing null values in charts.........................................................72Displaying parent members..................................................................72Displaying visual totals.........................................................................73Hiding the chart dimension panel.........................................................73Displaying hierarchical chart labels......................................................74Hiding the chart legend........................................................................74Chart axis labels...................................................................................74
4 BusinessObjects Voyager User's Guide
Contents

Selecting Members to Display in Crosstabs and Charts 77Chapter 6
Overview of member selection..................................................................78Selecting individual members from a list of all members...........................80Selecting members by searching..............................................................81Selecting all members at a particular level in the dimension.....................83Selecting parent, child, or sibling members...............................................84Changing the displayed measures............................................................85Hiding members from view........................................................................85Setting the slice member...........................................................................86Deselecting members................................................................................87Showing only selected members in the Member Selector.........................88Displaying member names and captions...................................................89Displaying the parent names of all members............................................89
Sorting, Filtering, and Ranking Data 91Chapter 7
Sorting data columns or rows....................................................................92Sorting within hierarchies.....................................................................95Removing a sort...................................................................................96Automatically removed sorts................................................................97
Filtering the data in crosstabs and charts..................................................97Adding a second filter...........................................................................99Removing a filter..................................................................................99Automatically removed filters.............................................................100
Ranking the data in the crosstab.............................................................100Adding a second rank.........................................................................102Removing a rank................................................................................102Automatically removed ranks.............................................................103
Displaying sorts, filters, and ranks applied to the query..........................103Hidden sorts, filters, and ranks................................................................103
BusinessObjects Voyager User's Guide 5
Contents

Combining a filter and rank......................................................................104Combining a sort and filter.......................................................................104Combining a sort and rank......................................................................104Excluding null values...............................................................................104
Highlighting Exceptions in Data 107Chapter 8
Overview of exception highlighting..........................................................108Applying exception highlighting...............................................................109Removing exception highlighting.............................................................114
Defining Calculations 115Chapter 9
Overview of calculations..........................................................................116Visual totals.............................................................................................116
To add the default totals.....................................................................118To add commonly used visual totals (Aggregate, Sum, Average, andCount).................................................................................................119To add other visual totals....................................................................119Changing to a different visual total.....................................................120Removing visual totals.......................................................................120Visual totals on filtered data...............................................................121Visual totals on axes with nested dimensions....................................121Visual totals on charts........................................................................122
Basic calculations....................................................................................122Adding a basic calculation..................................................................123
Custom calculations.................................................................................124Adding a custom calculation...............................................................127Mathematical operations....................................................................129Time-based operations.......................................................................133Rank calculation.................................................................................136
6 BusinessObjects Voyager User's Guide
Contents

Exploring Different Views of Your Data 139Chapter 10
Swapping dimensions..............................................................................140Swapping dimensions containing sorts, filters, and ranks..................141
Removing dimensions.............................................................................141Nesting dimensions.................................................................................142
Changing the order of nested dimensions.........................................143Changing the slice of data.......................................................................143Drilling down and drilling up.....................................................................144Drilling through to underlying relational data...........................................148
The relational table viewer.................................................................149Exporting drill-through data................................................................149
Copying a component to compare variations in data..............................150Resizing and moving components...........................................................151
Formatting Crosstab Data 153Chapter 11
Formatting data in the crosstab...............................................................154Resizing columns.....................................................................................156Resizing rows..........................................................................................156
Using Pages in the Workspace 159Chapter 12
Working with pages in the workspace.....................................................160Inserting and deleting pages...................................................................160Modifying page captions..........................................................................161Navigating to a page in the workspace....................................................162
Saving and Sharing Voyager Workspaces 163Chapter 13
Saving Voyager workspaces...................................................................164Automatically saved workspaces.......................................................166Saving Voyager workspaces for sharing with others..........................167
BusinessObjects Voyager User's Guide 7
Contents

Sending a Voyager workspace to another user.......................................168Sending a Voyager workspace to another BusinessObjects Enterpriseuser....................................................................................................168Sending a Voyager workspace to an email recipient.........................170
Opening an existing Voyager workspace................................................170Using openDocument to share workspaces............................................171
Exporting Data to Microsoft Excel or Comma-Separated-Values (.csv)Files 173
Chapter 14
Exporting data from Voyager to Excel.....................................................174Exporting data from Voyager to comma-separated-values (.csv) files.....175
Printing 177Chapter 15
Printing Voyager workspaces..................................................................178Print raw data...........................................................................................179Print a crosstab as it appears on the screen...........................................180Print a chart as it appears on the screen.................................................181Print options.............................................................................................182
Using Voyager with Microsoft SQL Server 2005 Analysis Services 185Chapter 16
Overview of Microsoft SQL Server 2005 Analysis Services....................186Using Analysis Services 2005 hierarchies in Voyager.............................188
Using Voyager with SAP 189Chapter 17
Logging on to SAP...................................................................................190Member Selector with SAP data........................................................191
Using variables........................................................................................191Mandatory and optional variables......................................................192Variable types.....................................................................................195More about variables..........................................................................199
8 BusinessObjects Voyager User's Guide
Contents

Free characteristics.................................................................................201Key figures and formatted values............................................................201
Formatting with no key figures...........................................................201Display attributes.....................................................................................202Compounded characteristics...................................................................202Mutually exclusive hierarchies.................................................................203Unbalanced and ragged hierarchies........................................................203
Using Voyager with Oracle Hyperion Essbase Data Sources 205Chapter 18
Overview of Oracle Hyperion Essbase features support in Voyager.......206Attribute dimensions................................................................................207
Using attribute dimensions to filter data.............................................208Attribute Calculations dimension........................................................210
Dynamic Time Series...............................................................................212Creating a calculation that returns a period-to-date value.................212
Alias tables..............................................................................................213Setting the active alias table...............................................................214Searching for members by their aliases.............................................215
User Interface Reference 217Chapter 19
Workspace reference...............................................................................218Analysis window reference......................................................................219Tab panel reference.................................................................................220
Data tab..............................................................................................220Structure tab.......................................................................................229Properties tab.....................................................................................231
Toolbar reference.....................................................................................233Toolbar overview................................................................................234View tab panel button.........................................................................235Save button........................................................................................235
BusinessObjects Voyager User's Guide 9
Contents

Export button......................................................................................236Print button.........................................................................................236Copy button........................................................................................237Paste button.......................................................................................237Delete button......................................................................................238Calculation button...............................................................................238Sort button..........................................................................................239Rank button........................................................................................241Filter button........................................................................................241Exception Highlighting button.............................................................242Measure Formatting button................................................................242Display Member Settings button........................................................243Swap Axis button................................................................................243Visual Totals button............................................................................243Insert Crosstab button........................................................................244Chart buttons......................................................................................244Help button.........................................................................................246
Crosstab component reference...............................................................246Understanding the crosstab...............................................................247Crosstab title bar................................................................................250Crosstab dimension panel..................................................................250Crosstab grid......................................................................................252Crosstab buttons................................................................................255Crosstab display options....................................................................256Crosstab tooltips.................................................................................259
Chart component reference.....................................................................260Chart dimension panel.......................................................................261Chart range slider...............................................................................264Chart title bar......................................................................................266Chart graphic......................................................................................266Chart types.........................................................................................268
10 BusinessObjects Voyager User's Guide
Contents

Chart display options..........................................................................272Member Selector reference.....................................................................278
Member Selector member tree...........................................................279Member Selector toolbar....................................................................280
Rank Editor dialog box.............................................................................285Filter Editor dialog box.............................................................................286Set Variables dialog box (SAP only)........................................................287
Connecting to OLAP data sources 289Chapter 20
OLAP data connections...........................................................................290Adding an OLAP cube connection to a workspace.................................291
Viewing OLAP data in the workspace................................................291Changing to a different OLAP cube connection......................................292Removing an OLAP cube connection from a workspace........................293Re-establishing a disabled connection....................................................294
Get More Help 297Appendix A
Index 301
BusinessObjects Voyager User's Guide 11
Contents
12 BusinessObjects Voyager User's Guide
Contents

Introduction toBusinessObjects Voyager
1

• What is BusinessObjects Voyager? on page 14• Who should read this guide? on page 17• Access our product documentation online at: http://support.businessob
jects.com/documentation
About this guideThis guide describes how to analyze your business data in BusinessObjectsVoyager. It is intended for business analysts.
This guide provides you with information and procedures for the followingtasks:
• Analyzing OLAP data.
• Using BusinessObjects Enterprise to save your Voyager workspaces forother members of your organization to view over the Web.
• Printing and exporting your workspaces.
What is BusinessObjects Voyager?
Voyager is a powerful, web-based OLAP analysis tool that can help you togain insight into business data and make intelligent decisions that impactcorporate performance.
OLAP data is displayed in the Voyager analysis window with crosstabs andcharts. You create a workspace, add crosstab and chart objects to theanalysis window, connect those objects to OLAP data sources, and theninteractively define queries to explore your data.
Voyager is intuitive and easy to use, while providing unique analysiscapabilities, including the ability to simultaneously view data from differentcubes and providers. For example, you can view sales data from a MicrosoftAnalysis Services cube on the same page as finance data from an OracleHyperion Essbase cube.
Voyager is accessed from BusinessObjects InfoView in a web browser. Allyou need is a connection to a BusinessObjects Enterprise system that hasVoyager installed. You do not need to install Voyager on your local machine.
14 BusinessObjects Voyager User's Guide
Introduction to BusinessObjects Voyager1 About this guide

The Voyager web application is available only as a Java web application.There is no corresponding Voyager application for .NET.
For a list of the supported data sources, please see the VoyagerAdministrator's Guide.
Note: SAP BW connectivity is available as a separate add-on to Voyager.Please contact Business Objects for further details.
This is a typical Voyager page, containing a crosstab and a chart:
The crosstab and chart are connected to the cube they represent. With thecontrols on the crosstab, users can reorient the crosstab, swap dimensions,and "slice and dice" the data to get answers to business problems.
BusinessObjects Voyager User's Guide 15
1Introduction to BusinessObjects VoyagerAbout this guide

Voyager integration with BusinessObjects Enterprise
Voyager works within the InfoView portal of BusinessObjects Enterprise, andVoyager workspaces can be managed from within the BusinessObjectsEnterprise Central Management Console.
• Anyone with web access and the appropriate permissions inBusinessObjects Enterprise can access Voyager.
• Voyager workspaces can be published to the Web with BusinessObjectsEnterprise.
Publishing Voyager workspaces to the Web
BusinessObjects Enterprise has a multi-tier server architecture that enablesyou to distribute Voyager workspaces to a large number of users, acrossand beyond your organization, over the Web.
By publishing workspaces to the Web, you make your analyses accessibleto everyone in your organization.
About the documentation set
The documentation set for Voyager comprises these guides and online helpproducts:
Voyager Administrator's Guide
This guide contains detailed information that is useful to a systemadministrator when installing, configuring, and administering Voyager.
Voyager User's Guide
This guide contains the conceptual information, procedures, and referencematerial required to use Voyager.
Voyager Online Help
The online help contains the same information as the User's Guide. It isavailable from various Help buttons in the Voyager interface, including theapplication toolbar.
16 BusinessObjects Voyager User's Guide
Introduction to BusinessObjects Voyager1 About this guide

Getting started
To get started working with Voyager workspaces and analyzing data, seeOpening a workspace and analyzing data on page 26.
Who should read this guide?
The Voyager documentation system is tailored to the specific needs of theuser. This User's Guide is intended for data analysts who will use Voyagerto work with OLAP data.
BusinessObjects Voyager User's Guide 17
1Introduction to BusinessObjects VoyagerAbout this guide

18 BusinessObjects Voyager User's Guide
Introduction to BusinessObjects Voyager1 About this guide

Understanding OLAP
2

Voyager is a tool for viewing and analyzing business data, specifically OLAP(Online Analytical Processing) data. This section explains OLAP.
OLAP OverviewRelational databases store data as individual records. Each record maycontain a number of fields, but all these fields relate to just one record. Forexample, a Product record might have a number of fields containinginformation about that Product, such as sales transactions to differentcustomers in different regions.
Online Transaction Processing (OLTP) applications are used to query thisinformation and keep it up to date. OLTP is designed to enable a largenumber of users to update and retrieve comparatively small numbers ofindividual records quickly.
Although relational databases hold data in a one-dimensional format—onerecord at a time—business problems are usually multi-dimensional. A typicalrequirement would be to analyze Sales by Product by Region, for example.If this were to give a clear picture of the business, it would involvesummarizing and analyzing a large number of different records. Usingtraditional OLTP applications for decision support therefore involves retrievingthousands of records and summarizing them on the fly to build databasetables. This is not what OLTP applications were designed to do, andoperations of this sort on a large database can take hours and even days ofprocessing time to complete.
Online Analytical Processing (OLAP) applications are designed from thestart with online data analysis in mind. To reduce processing time to theminimum, database data is summarized and pre-consolidated into matrixtable format. Because these tables usually have three (or more) dimensions,they are referred to as data "cubes". If a relational database can read about200 records a second and write 20, a good OLAP server, using row andcolumn arithmetic, can consolidate 20,000 to 30,000 cells (equivalent torelational records) a second. This, the much smaller storage space OLAPdata requires, and faster access due to more efficient indexing, are the keysto OLAP reporting speed, which is two or three orders of magnitude fasterthan relational technology.
20 BusinessObjects Voyager User's Guide
Understanding OLAP2 OLAP Overview

Multi-dimensional data cubesTo understand multi-dimensional data, first think of a spreadsheet showinghow different products are selling in different markets:
This spreadsheet shows sales for each Product within each Region. Thisdata has two dimensions: Product (shown in the rows), and Region (shownin the columns). Also, each dimension comprises several members; in thisexample, members of the Region dimension include USA, Canada, and theUK.
A spreadsheet like this is of limited use as it only shows sales performanceat one point in time. To track performance for different Time periods, businessanalysts would need to stack up several spreadsheets, one for each timeperiod, like this:
Together, these spreadsheets show a third dimension, Time, to add to thefirst two (Product and Region).
Another way of representing these stacked-up data cells is in the form of acube:
BusinessObjects Voyager User's Guide 21
2Understanding OLAPMulti-dimensional data cubes

We call this the "data cube".
The data cube allows analysts to slice data in different ways in order to getanswers to different business questions, such as:
• How are our products selling in each region (view Product by Region,as before)?
• How do our products sell at different times of the year in each market(Product by Region by Time)?
• How do our products sell at different times of the year (view Product byTime)?
This example has only three dimensions. OLAP applications can handlemany more than three.
A fourth dimension might allow analysts to slice up the data by Customer,for example.
This is harder to picture than three dimensions, but it works in the same way;with another dimension, there are more possible ways of slicing the cube,to provide answers to questions such as 'Which UK customer buys the most(or least) of a certain product at Christmas?'
Hierarchical dataOLAP also allows analysts to organize each one of the data dimensions intoa hierarchy of sub-groups and totals to reflect the organization of theirbusiness.
22 BusinessObjects Voyager User's Guide
Understanding OLAP2 Hierarchical data

For example, the staff of a toy shop might want to store figures for groupsof products and all products, as well as for individual products, like this:
OLAP allows analysts to view data forAll Toys at the top level, then drill-downto lower and lower levels of detail, so that they can discover the precisesource of a particular performance variation in their data.
By allowing analysts to use several dimensions in their data cube, with thepossibility of a hierarchy in each dimension, OLAP reflects the way theypicture their business, and is not constrained by the structure of informationstorage.
Through OLAP, analysts can gain a better understanding of their businessby viewing, comparing and working with information in ways simply notpossible before.
BusinessObjects Voyager User's Guide 23
2Understanding OLAPHierarchical data

24 BusinessObjects Voyager User's Guide
Understanding OLAP2 Hierarchical data

Getting Started withBusinessObjects Voyager
3

This section shows you how to create a Voyager workspace and beginworking with your data.
Opening aworkspace and analyzing dataTo begin using Voyager to work with your OLAP data, you will need to dothe following:
• Create a Voyager workspace on page 30
• Define a query on page 32
• Add charts and more crosstabs on page 32
Or, if you want to open an existing workspace, see Opening an existingVoyager workspace on page 170.
You may also want to read a few brief definitions of some terms that areused throughout this guide.
• Some essential terminology on page 26
Some essential terminologyBefore you read any further in the documentation, it would be useful tounderstand some basic OLAP and Voyager terminology. SeeUnderstandingOLAP on page 19 for an overview of generic OLAP concepts and terminology.
26 BusinessObjects Voyager User's Guide
Getting Started with BusinessObjects Voyager3 Opening a workspace and analyzing data

1. Application toolbar2. Tab panel3. Metadata explorer4. Analysis window
Voyager terms
A Voyager data-analysis document.workspace
The main Voyager window, containing your crosstaband chart components.For more information about the analysis window, seeWorkspace reference on page 218.
analysis window
A two-dimensional table object that you drag into theanalysis window to begin analyzing your data.For more information about crosstabs, see Crosstabcomponent reference on page 246.
crosstab component
BusinessObjects Voyager User's Guide 27
3Getting Started with BusinessObjects VoyagerSome essential terminology

A bar, line, or pie chart object that you drag into theanalysis window to visualize your data.For more information about charts, see Chart compo-nent reference on page 260.
chart component
The panel containing the Data, Structure, and Proper-ties tabs.For more information about the tab panel and tabs, seeTab panel reference on page 220.
tab panel
The area within the Data tab that displays cube dimen-sions and members in a tree structure, indented toshow parent-child relationships.For more information about the metadata explorer, seeData tab metadata explorer on page 224.
metadata explorer
A collection of related data members. The memberscan be organized in a hierarchical structure (for exam-ple in a Geography dimension) or a flat structure (forexample in a Measures dimension).For more information about how dimensions modelbusiness scenarios, and how dimensions are represent-ed in Voyager, see Understanding OLAP on page 19and Data tab on page 220.
dimension
A dimension that represents a characteristic of thedata and not the data itself. For example, Customersor Products could be fact dimensions.
fact dimension
A dimension that represents the actual data; that is,the numbers. For example, Accounts could be ameasures dimension.
measures dimension
A base unit of data, representing an entity in a multi-dimensional OLAP database. A member can haveparent and child members.
member
28 BusinessObjects Voyager User's Guide
Getting Started with BusinessObjects Voyager3 Some essential terminology

The Voyager control that you use to select membersfor displaying in your crosstabs and charts.For more information about the Member Selector, seeMember Selector reference on page 278.
Member Selector
A two-dimensional view of a multi-dimensional cube.For example, if your data cube contains the three di-mensions Product, Market, and Year, and you want toanalyze how your products performed in all markets inthe year 2006, you would select only 2006 data fromthe Year dimension. The selected data would then bea two-dimensional slice.For more information about slices, seeMulti-dimension-al data cubes on page 21 and Queries and visualcomponents explained on page 52.
slice
A specific view of data from the OLAP cube that youwant to analyze.For more information about queries, see Queries andvisual components explained on page 52.
query
Any of the three spatial axes on a Voyager crosstabor chart component. For example, a Voyager crosstabappears as a two-dimensional table, similar to an Excelspreadsheet. The crosstab has two "view" axes, similarto Excel's vertical and horizontal axes. The two viewaxes are called the row axis and column axis. In addi-tion, by visualizing the two-dimensional object as beinga "slice" of a three-dimensional object, and allowingthe position of the slice to change, you can think of athird axis as being perpendicular to the screen. This isthe slice axis.Therefore, a Voyager crosstab axis is any one of thosethree spatial axes.When you define queries to analyze your data, youdrag data dimensions or members onto those axes.
axis
BusinessObjects Voyager User's Guide 29
3Getting Started with BusinessObjects VoyagerSome essential terminology

A connection to an OLAP data source or "cube." Typi-cally, cubes are located on remote servers. When youadd a connection to your workspace, the connectionprovides all the information required for your workspaceto access the data in that cube.For more information about connections, see Connect-ing to OLAP data sources on page 289.
connection
Create a Voyager workspaceVoyager workspaces provide an intuitive interface for viewing and studyingdata cubes.
A Voyager workspace is an interactive document that allows you to connectto and analyze OLAP data. The data is visualized in crosstab and chartcomponents that you add to the pages in the workspace. You can add up tofour components per page, and there is no limit to the number of pages.
For more information about workspaces, see Workspace reference onpage 218.
To create a Voyager workspace
1. Start the Java version of InfoView and log on.For information about logging on to InfoView, see the BusinessObjectsEnterprise InfoView User's Guide.
2. In InfoView, click Document List.3. Then click New > Voyager Workspace.
A workspace is created for you, containing an empty crosstab and anundefined query. The Choose Connection dialog box is also displayed.
Note: If your system administrator has not granted you sufficient rights,“Voyager Workspace” does not appear in the New menu. For moreinformation about rights and access levels, see the VoyagerAdministrator's Guide.
30 BusinessObjects Voyager User's Guide
Getting Started with BusinessObjects Voyager3 Create a Voyager workspace

4. Click a connection in the list, and then click OK to add it to yourworkspace.
Alternatively, you can double-click the desired connection to add it to yourworkspace.
Note: Voyager includes a set of sample cubes that you can use to explorethe many analysis features Voyager provides. Your system administratorcan install these sample cubes and create connections for them so thatyou can add them to your workspaces. For more information, see"Installing sample data cubes" in the BusinessObjects VoyagerAdministrator's Guide.
5. If the connection requires authentication, type your credentials in theLogon dialog box and click OK.
If authentication succeeds, the connection appears in the activeconnections list at the top of the Data tab, and the metadata explorerdisplays the data objects contained in the data source.
If authentication fails, first verify that you entered your credentials correctly.If authentication continues to fail, see your system administrator. Your
BusinessObjects Voyager User's Guide 31
3Getting Started with BusinessObjects VoyagerCreate a Voyager workspace

credentials may not be set up properly in the Central ManagementConsole, or the OLAP server may be offline.
Related Topics• Define a query on page 32• Add charts and more crosstabs on page 32
Define a queryOnce you have added a connection, you can define a query and beginworking with your data in the analysis window. For information on queriesand how to define them, see Creating and defining queries to answer yourbusiness questions on page 40.
After you define a basic query, you can add charts and more crosstabs, andmanipulate your data using operations such as sorting, filtering, exceptionhighlighting, and calculations. For more information about those and otherVoyager features, see the relevant sections of this User's Guide.
Related Topics• Create a Voyager workspace on page 30• Add charts and more crosstabs on page 32
Add charts and more crosstabsWhen you create a new workspace, Voyager automatically adds an emptycrosstab component to each page and creates an undefined query linked toeach crosstab. You can add charts and more crosstabs, up to a maximumof four components per page.
For detailed information about charts and crosstabs, seeOverview of Voyagercharts on page 56, Chart component reference on page 260, and Crosstabcomponent reference on page 246.
Adding a chart to the page
Once you've created a workspace and defined a query on the crosstab, youcan add a chart simply by clicking a button on the application toolbar.
32 BusinessObjects Voyager User's Guide
Getting Started with BusinessObjects Voyager3 Define a query

To add a chart to a page
• Click one of the chart buttons on the application toolbar.The application toolbar contains buttons for adding these components toyour page:• Vertical cluster bar chart• Vertical stacked bar chart• Vertical percent stacked bar chart• Horizontal cluster bar chart• Horizontal stacked bar chart• Horizontal percent stacked bar chart• 3D bar chart• Multi-series line chart• Multi-series pie chart
The chart is added to the page, below or to the right of existingcomponents. Existing components are resized automatically toaccommodate the added component.
BusinessObjects Voyager User's Guide 33
3Getting Started with BusinessObjects VoyagerAdd charts and more crosstabs

Alternatively, you can drag a chart from the application toolbar into theanalysis window, to the position you select. The drop location is highlightedas you move the mouse cursor in the analysis window.
To enlarge the view of a component when there are multiplecomponents on a page, you can maximize and restore the componentusing the Maximize/Restore button in the component's title bar.
Related Topics• Resizing and moving components on page 151• Linking a component to a different query on page 51
34 BusinessObjects Voyager User's Guide
Getting Started with BusinessObjects Voyager3 Add charts and more crosstabs

To delete a component from the page
1. Click the Delete button on the right side of the component's title bar.
Alternatively, you can select a component and click Delete in theapplication toolbar, or press Del.
2. Click Yes in the confirmation dialog box to delete the component.
Adding another crosstab to the page
You can add a second crosstab if you want to explore a different view ofyour data, or if you want to compare data from two separate data sources.If you add a second new crosstab to the page, Voyager creates an undefinedquery and links the second crosstab to it. You can then define a differentcube view with the new query. Or, you can copy the first crosstab and makechanges to the copy.
BusinessObjects Voyager User's Guide 35
3Getting Started with BusinessObjects VoyagerAdd charts and more crosstabs

If you add a second chart to the page, the new chart is automatically linkedto the most recent query: the second query. You can then compare two cubeviews, each with a crosstab and chart, on a single page.
To enlarge the view of a component when there are multiple componentson a page, you can maximize and restore the component using theMaximize/Restore button in the component's title bar.
Related Topics• Resizing and moving components on page 151• Copying a component to compare variations in data on page 150• Linking a component to a different query on page 51
36 BusinessObjects Voyager User's Guide
Getting Started with BusinessObjects Voyager3 Add charts and more crosstabs

To add a crosstab to a page
• Click the Crosstab button on the application toolbar.
The crosstab is added to the page, below or to the right of existingcomponents.
Alternatively, you can drag a crosstab from the application toolbar intothe analysis window, to the position you select. The drop location ishighlighted as you move the mouse cursor in the analysis window.
Related Topics• Create a Voyager workspace on page 30• Define a query on page 32
BusinessObjects Voyager User's Guide 37
3Getting Started with BusinessObjects VoyagerAdd charts and more crosstabs

38 BusinessObjects Voyager User's Guide
Getting Started with BusinessObjects Voyager3 Add charts and more crosstabs

Using Queries to AnalyzeCube Data
4

This section introduces the concept of querying, which is the technique you'lluse in Voyager to obtain information from your data.
Creating and defining queries to answeryour business questions
To get answers to your business questions in Voyager, you define queriesand view the results of your queries in crosstabs and charts.
• Defining queries on page 40
• Modifying queries on page 45
• Adding queries on page 48
• Creating complex queries by nesting dimensions on page 49
• Linking a component to a different query on page 51
• Deleting queries on page 52
• Queries and visual components explained on page 52
Defining queriesYou define queries by populating a crosstab with data. Start by choosingdimensions or members to add to the crosstab's row, column, and slice axes.Then you can expand and refine the query using the many analysis toolsthat Voyager provides.
You can also define queries using a chart component if you prefer. For details,see Adding data to a chart on page 66.
For more information on using the crosstab and chart, see Queries and visualcomponents explained on page 52, Crosstab component reference on page246 and Chart component reference on page 260.
To define a new query
1. On the Data tab, locate the dimension or members that you want to addto the first axis in your crosstab.
40 BusinessObjects Voyager User's Guide
Using Queries to Analyze Cube Data4 Creating and defining queries to answer your business questions

For more information on the Data tab and how it displays dimensions andmembers, see Data tab on page 220.
2. Click the dimension or members to select or deselect them.• Click a member to select it; click the member again to deselect it.
• To select or deselect a range of members, hold down the Shift keyas you click members.
• You do not need to hold down the Ctrl key to select multiple individualmembers.
3. When you have selected the dimension or members that you want toplace on the first axis, drag them from the Data tab to the appropriatedrop zone in the crosstab:
BusinessObjects Voyager User's Guide 41
4Using Queries to Analyze Cube DataDefining queries

To add the selected items to the crosstab's rows, drag them to the"Drop Row" area.
•
• To add the selected items to the crosstab's columns, drag them to the"Drop Column" area.
• To add the selected items to the crosstab's slice, drag them to the"Drop Slice" area.
• If you are placing members of a measures dimension onto a crosstab,you can also drag them to the cell drop zone; the main grid of thecrosstab component.
42 BusinessObjects Voyager User's Guide
Using Queries to Analyze Cube Data4 Defining queries

You can also use the buttons above the metadata explorer on the Datatab to populate your crosstab. First, select a component in the analysiswindow, and then click one of these buttons to add the members to thecrosstab:
• Click Add to Rows to add the selected dimension or members tothe rows on the crosstab.
• Click Add to Columns to add the selected dimension or membersto the columns on the crosstab.
• Click Add to Slice to add the selected dimension or members tothe slice axis.
4. Repeat step 3 for the other crosstab axes.
When you have added dimensions or members to the view axes (rowsand columns), Voyager validates your query and displays the requesteddata.
BusinessObjects Voyager User's Guide 43
4Using Queries to Analyze Cube DataDefining queries

Note:
• You cannot add members from the same dimension to two axes.• When you place a dimension on an axis, the dimension's default
member is automatically selected. The default member for a dimensioncan be specified on the cube server, depending on your OLAP provider.Otherwise, the default member is the first top-level member of thedimension.
• If you add fact dimensions (non-measures dimensions) or membersof fact dimensions to the two view axes, leaving the slice axis empty,Voyager automatically adds the default member of the measuresdimension to the query and populates the crosstab with data. Theselected measure is displayed in the crosstab's title bar. You canchange to a different measure by clicking the Member Selector buttonon the title bar.
• With SAP BW data sources, hierarchies that belong to the samedimension are mutually exclusive. For example, consider an SAP BWcube that contains a dimension Customer that contains threehierarchies: Country_1, Country_2, and Country_3. Only one ofthese hierarchies can be included in a single crosstab or chart query.You cannot specify Country_1 on the row axis and Country_3 on theslice axis in the same query.
44 BusinessObjects Voyager User's Guide
Using Queries to Analyze Cube Data4 Defining queries

Related Topics• Modifying queries on page 45• Adding queries on page 48• Creating complex queries by nesting dimensions on page 49• Linking a component to a different query on page 51• Deleting queries on page 52• Queries and visual components explained on page 52
Modifying queriesYou can modify a query in several ways:
• Open the Member Selector and select different members for the crosstabor chart. For information on selecting members, see Selecting Membersto Display in Crosstabs and Charts on page 77, and Member Selectorreference on page 278.
• Apply functions from the Voyager application toolbar. For information onusing the toolbar, see Toolbar reference on page 233.
• Drill up or down on members. For information on drilling, see Drilling downand drilling up on page 144.
• Drag new dimensions or members from the same connection onto thecrosstab's or chart's drop zones, or drag dimensions between axes, ordrag dimensions off the component.
To modify a query by dragging new metadata ontothe crosstab or chart
1. On the Data tab, locate the dimension or members that you want to addto the first axis in your crosstab or chart.
For more information on the Data tab and how it displays dimensions andmembers, see Data tab on page 220.
2. Click the dimension or members to select or deselect them.• Click a member to select it; click the member again to deselect it.
• To select or deselect a range of members, hold down the Shift keyas you click members.
BusinessObjects Voyager User's Guide 45
4Using Queries to Analyze Cube DataModifying queries

• You do not need to hold down the Ctrl key to select multiple individualmembers.
3. When you have selected the dimension or members that you want toplace on the first axis, drag them from the Data tab to the appropriatedrop zone in the crosstab or chart.
You can choose to replace the existing members with the selectedmembers, or add the selected members to the existing members.
To replace existing members in the crosstab or chart with the selectedmembers on the Data tab, drag the selected members to the center dropzone; the existing dimension is highlighted. When you release the mousebutton, the selected members replace the existing members in thecrosstab or chart.
To add the selected members to existing members in the crosstab, dragthe selected members to the left or right drop zone; the left or right dropzone is highlighted. When you release the mouse button, the selectedmembers are "nested" beside the existing members. This technique isused to create complex queries. For more information, see Creatingcomplex queries by nesting dimensions on page 49.
46 BusinessObjects Voyager User's Guide
Using Queries to Analyze Cube Data4 Modifying queries

You can also use the buttons above the metadata explorer area on theData tab to populate your crosstab. First, select a component in theanalysis window, and then click one of these buttons to add the membersto the crosstab:
• Click Add to Rows to add the selected dimension or members tothe row axis on the crosstab.
• Click Add to Columns to add the selected dimension or membersto the column axis on the crosstab.
• Click Add to Slice to add the selected dimension or members tothe slice axis.
4. Repeat step 3 for the other crosstab or chart axes.
BusinessObjects Voyager User's Guide 47
4Using Queries to Analyze Cube DataModifying queries
When you have added dimensions or members to the crosstab or chartaxes, Voyager validates your query and displays the requested data.
Note:
• You cannot add members from the same dimension to two axes.• When you place a dimension on a row, column, or slice axis, the
dimension's default member is automatically selected. With MicrosoftAnalysis Services, the dimension's default member can be set on theOLAP server. For other OLAP providers, the default member is thefirst member on the top level of the dimension.
Related Topics• Defining queries on page 40• Adding queries on page 48• Creating complex queries by nesting dimensions on page 49• Linking a component to a different query on page 51• Deleting queries on page 52• Queries and visual components explained on page 52
Adding queriesVoyager automatically adds an empty crosstab to each new page, and createsan undefined query for each crosstab. You define those queries by draggingdimensions and members onto crosstabs or charts.
If you want two or more different views of your data on the same page, youcan manually add multiple queries to your page with the Add Query button.
Note: Voyager also creates a new undefined query when you manually adda new crosstab to a page.
To manually add a query to a page
• On the Structure tab, click Add Query to add a query to the currentpage.
The new query appears on the Structure tab, with an automaticallyassigned name.
48 BusinessObjects Voyager User's Guide
Using Queries to Analyze Cube Data4 Adding queries

Related Topics• Defining queries on page 40• Modifying queries on page 45• Creating complex queries by nesting dimensions on page 49• Linking a component to a different query on page 51• Deleting queries on page 52• Queries and visual components explained on page 52
Creating complex queries by nestingdimensions
Although OLAP cubes can contain many dimensions, the Voyager crosstaband chart components have only three axes. When you want to include datafrom more than three dimensions in your queries, you nest dimensions.
Nesting dimensions means placing two or more dimensions on the sameaxis. For example, you may want to view data for different sizes of stores,in different cities, against the products the stores sell. You could nest theStores and Cities dimensions on one axis.
To nest dimensions
1. In the metadata explorer, locate the dimension or members that you wantto nest with an existing dimension on the crosstab
For more information on the metadata explorer and how it displaysdimensions and members, see Data tab metadata explorer on page 224.
2. Click the dimension or members to select or deselect them.• Click a member to select it; click the member again to deselect it.
• To select or deselect a range of members, hold down the Shift keyas you click members.
• You do not need to hold down the Ctrl key to select multiple individualmembers.
3. When you have selected the dimension or members that you want tonest, drag them from the Data tab to the left or right drop zone.
BusinessObjects Voyager User's Guide 49
4Using Queries to Analyze Cube DataCreating complex queries by nesting dimensions

When you release the mouse button, the selected members are "nested"with the existing members.
4. Repeat these steps to nest members on another axis.
Note:
• You cannot add members from the same dimension to two axes.• When you place a dimension on a row, column, or slice axis, the
dimension's default member is automatically selected. With MicrosoftAnalysis Services, the dimension's default member can be set on the
50 BusinessObjects Voyager User's Guide
Using Queries to Analyze Cube Data4 Creating complex queries by nesting dimensions

OLAP server. For other OLAP providers, the default member is thefirst member on the top level of the dimension.
Related Topics• Defining queries on page 40• Modifying queries on page 45• Adding queries on page 48• Linking a component to a different query on page 51• Deleting queries on page 52• Queries and visual components explained on page 52
Linking a component to a different queryYou can move a component from one query to another on the Structure tab.
For example, if you've defined two queries, Query 1 and Query 2, and youhave a chart linked to Query 2, you may want to move the chart to Query 1to see the chart visualization of the data in Query 1.
To link a component to a different query
1. Click the component on the Structure tab.2. Drag the highlighted component to a different query on the Structure tab.
Related Topics• Defining queries on page 40• Modifying queries on page 45• Adding queries on page 48• Creating complex queries by nesting dimensions on page 49• Deleting queries on page 52• Queries and visual components explained on page 52
To link a component to a new empty query
1. On the Structure tab, Click Add Query to add a new query to theworkspace.
BusinessObjects Voyager User's Guide 51
4Using Queries to Analyze Cube DataLinking a component to a different query

2. Click the component on the Structure tab.3. Drag the highlighted component to the new query on the Structure tab.
The component will be blank because the new query is not yet defined.
Deleting queriesWhen you delete chart or crosstab components, queries that thosecomponents were linked to are not automatically removed, so your workspacemay contain unused queries.
To delete a query
1. Select the query on the Structure tab.2. Click Delete on the Structure tab toolbar.
Alternatively, you can press the DEL key.
Note: If you try to delete a query that has crosstab or chart componentslinked to it, you are prompted to confirm that you want to remove thequery and any linked components.
Related Topics• Defining queries on page 40• Modifying queries on page 45• Adding queries on page 48• Creating complex queries by nesting dimensions on page 49• Linking a component to a different query on page 51• Queries and visual components explained on page 52
Queries andvisual components explained
Queries
A query defines a specific view of data from the OLAP cube that you wantto analyze. This view is often referred to as a "slice" because the view yousee is a two-dimensional "slice" of a multi-dimensional cube. For example,
52 BusinessObjects Voyager User's Guide
Using Queries to Analyze Cube Data4 Deleting queries

if you want to analyze data in a Sales cube, you could define a query forStore Costs by Year.
To define a query, you specify the measures and dimensions that you wantto include in the cube view. You do this by dragging the dimensions ormembers that you want to analyze onto the crosstab or chart component. Inthe preceding example, Store Costs and Year are the two dimensions thatyou would use when defining this query.
Although Voyager workspaces can contain multiple pages, a query is validonly on a single page. Therefore a query on page 1 does not affect thecontents of page 2.
It is important to understand that the query stores the structure and valuesof the data but the crosstab and chart visual components display the data.
Visual components
You can display a cube view in different types of visual components: forexample a crosstab, or a horizontal bar chart.
Crosstab and chart components contain clearly identified drop zones. Youdrag dimensions or members from the Data tab to these drop zones to definea query, and Voyager displays the results of the query in the component.
A crosstab and chart belonging to the same query can be thought of as linkedbecause they display the same view or set of cube data. In other words, theyrefer or point to the same query. If you modify the query in any way on onevisual component, the equivalent action is performed on any of the linkedcomponents. For example, if you drill down on USA to display data for stateson the crosstab component, any linked charts also re-render to display datafor states.
When you add a new crosstab component to a page, Voyager automaticallycreates a new undefined query. However, inserting a chart component doesn'tadd a new query to the page. New charts are always linked to the activequery, which is the last query that was added to the page manually by youor automatically by Voyager.
Once dimensions or members have been added to a component, the queryand visual components are fixed to the connection. You cannot drag membersfrom a different connection into this component.
BusinessObjects Voyager User's Guide 53
4Using Queries to Analyze Cube DataQueries and visual components explained
Related Topics• Defining queries on page 40• Modifying queries on page 45• Adding queries on page 48• Creating complex queries by nesting dimensions on page 49• Linking a component to a different query on page 51• Deleting queries on page 52
54 BusinessObjects Voyager User's Guide
Using Queries to Analyze Cube Data4 Queries and visual components explained

Using Charts to VisualizeData
5

This section explains how you can present your business data by using thedifferent types of chart provided by BusinessObjects Voyager.
Overview of Voyager chartsYou can add charts to your Voyager workspaces to present your datagraphically. Charts can often emphasize irregularities or trends in your data,and help you focus your business analysis on those areas.
Voyager provides several chart types to help you visualize data:
• Cluster bar charts• Stacked bar charts• Percent stacked bar charts• 3D bar charts• Multi-series line charts• Multi-series pie charts
Chart and crosstab components are linked to queries. Therefore, if a chartand a crosstab are linked to the same query, both components display thesame data, and both components update simultaneously whenever you makechanges to either component. This interaction allows you to repeatedly defineand refine your queries, and see the graphical results of your changes inreal time.
You can also unlink, or disconnect, a chart component from its current query,and link it to a different query or to a new query.
Charts can be easily customized. You can change the chart type, or changethe appearance of the chart to increase clarity. You can also drill down ondata in the chart to examine the data in more detail.
This section describes each of the chart types, how to add a chart to a page,how to add data to a chart, and how to customize a chart's appearance.
Click one of these links to learn more about a particular chart type:
• Cluster bar charts on page 58• Stacked bar charts on page 59• Percent stacked bar charts on page 60• 3D bar charts on page 61• Multi-series line charts on page 62• Multi-series pie charts on page 63
56 BusinessObjects Voyager User's Guide
Using Charts to Visualize Data5 Overview of Voyager charts

Related Topics• Chart types on page 57• Adding a chart to the analysis window on page 63• Adding data to a chart on page 66• Scrolling through large data sets in charts on page 68• Customizing charts on page 69• Linking a component to a different query on page 51
Chart typesVoyager provides a variety of chart types to help you visualize your data.
Related Topics• Adding a chart to the analysis window on page 63• Adding data to a chart on page 66• Scrolling through large data sets in charts on page 68• Customizing charts on page 69• Chart component reference on page 260
BusinessObjects Voyager User's Guide 57
5Using Charts to Visualize DataChart types

Cluster bar charts
Cluster bar charts show values compared across categories, or over time;for example, sales for each region by month. Several values (a "cluster") areshown grouped together in each category or time period.
58 BusinessObjects Voyager User's Guide
Using Charts to Visualize Data5 Chart types

Voyager provides both horizontal bar and vertical bar chart types.
Stacked bar charts
Stacked bar charts show how related sets of values compare to each otherand contribute to a total. For example, if you create a bar chart that illustratessales per product, you can use a stacked bar chart to show data from severalyears, one year on top of another.
BusinessObjects Voyager User's Guide 59
5Using Charts to Visualize DataChart types

Voyager provides both horizontal and vertical stacked bar chart types.
Percent stacked bar charts
Percent stacked bar charts show visually what percentage a membercontributes to a total. Percent stacked bar charts are similar to stacked barcharts except that all bars are the same length and represent 100% of atotal. The size of each segment of a percent stacked bar represents thepercentage that a member contributes to the total.
60 BusinessObjects Voyager User's Guide
Using Charts to Visualize Data5 Chart types

Voyager provides both horizontal and vertical percent stacked bar charttypes.
3D bar charts
BusinessObjects Voyager User's Guide 61
5Using Charts to Visualize DataChart types

3D bar charts are used to compare data visually in three dimensions.Typically, a 3D chart would show a series of data across categories and overtime.
Multi-series line charts
62 BusinessObjects Voyager User's Guide
Using Charts to Visualize Data5 Chart types

Line charts are used to show trends in data over time or categories. Eachline in the chart represents a data series. Markers are shown at each pointin the line where a data value exists.
Multi-series pie charts
Pie charts display the sizes of items that compose a data series, proportionalto the sum of the items. A pie chart is used to show the relative contributionsof values, and is useful when you want to emphasize a significant elementin the data. Each pie in a multi-series pie chart represents a category; eachpie slice represents a data series.
Adding a chart to the analysis windowVisual components, such as a crosstab or any of the chart types, are addedto the analysis window by using the application toolbar.
BusinessObjects Voyager User's Guide 63
5Using Charts to Visualize DataAdding a chart to the analysis window
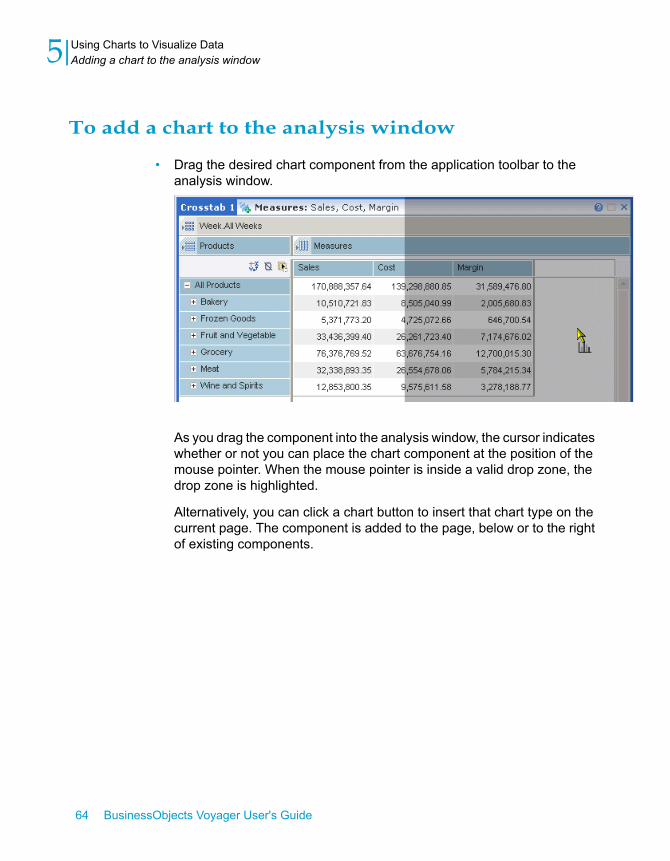
To add a chart to the analysis window
• Drag the desired chart component from the application toolbar to theanalysis window.
As you drag the component into the analysis window, the cursor indicateswhether or not you can place the chart component at the position of themouse pointer. When the mouse pointer is inside a valid drop zone, thedrop zone is highlighted.
Alternatively, you can click a chart button to insert that chart type on thecurrent page. The component is added to the page, below or to the rightof existing components.
64 BusinessObjects Voyager User's Guide
Using Charts to Visualize Data5 Adding a chart to the analysis window

Before your chart will show any data, you must add a data connection tothe page, and add data to the chart. For more information about addinga data connection, see Connecting to OLAP data sources on page 289.For more information about adding data to a chart, see Adding data to achart on page 66.
BusinessObjects Voyager User's Guide 65
5Using Charts to Visualize DataAdding a chart to the analysis window

Changing chart types
You can change the chart type to any of the available types.
To change the chart type
• Right-click the chart, point to Chart Type, and click the chart type youwant to switch to.
Related Topics• Chart types on page 57• Adding data to a chart on page 66• Scrolling through large data sets in charts on page 68• Customizing charts on page 69
Adding data to a chartWhen you add a chart to a page, the chart is linked to the most recent queryon the page (although you can use the Structure tab to move the chart toanother query). Therefore, the chart is automatically populated with data ifthe query has been previously defined.
For example, if a page contains only a single crosstab, and if that crosstabhas been used to define a query (data has been added to the crosstab), thenwhen you add a new chart to the page, the chart is populated with the samedata that is in the crosstab.
Typically, the chart's data series correspond to the crosstab's rows, and thechart's categories correspond to the crosstab's columns. In a pie chart, eachindividual pie object corresponds to a column in the crosstab, and the pieslices represent individual row members.
If you add a chart to a new page that contains only an empty crosstab andan undefined query, you will need to define the query to add data to the chart.For more information about creating and defining queries, see Definingqueries on page 40.
You can also use the chart component to define a query.
66 BusinessObjects Voyager User's Guide
Using Charts to Visualize Data5 Adding data to a chart

Related Topics• Chart types on page 57• Adding a chart to the analysis window on page 63• Scrolling through large data sets in charts on page 68• Customizing charts on page 69
Defining a query using an empty chart component
If you want to create a page that contains only a chart component, you canuse an empty chart component to create a query, without first having todefine the data view in a crosstab component.
Each chart component has drop zones, which represent areas you can dragdata onto from the Data tab.
To create a query using a chart component
1. Ensure the workspace has a data connection.2. In a new page or existing page, delete all crosstab and chart components.3. Drag a chart component into the empty analysis window.4. In the metadata explorer, expand the list of members and select the data
you want in your chart.5. Drag the highlighted members onto one of the drop zones in the chart
component to create a query.
If the generated query is valid, the chart displays the data returned fromthe query.
For more information about creating queries by dragging members ontoa chart, see Defining queries on page 40.
Modifying a query in a chart
You can modify your query in a chart much like you would modify a query ina crosstab. For example, you can swap dimensions using the chartcomponent's dimension panel, and use the Member Selector to choosedifferent members for the chart axes.
BusinessObjects Voyager User's Guide 67
5Using Charts to Visualize DataAdding data to a chart

For more information on modifying queries, see Modifying queries on page45 and Chart dimension panel on page 261.
Scrolling through large data sets in chartsWhen you work with large data sets, displaying all of the data on a chart canmake it difficult or impossible to distinguish between individual risers or lineson the chart. With all chart types except for the 3D bar chart type, Voyageradds a range slider to the chart component when the data set is too large tobe displayed legibly.
1. Overview scroll bar2. Selected range3. Range slider bars4. Hide/restore button5. Paging buttons
The chart range slider lets you select a portion of the data set to be expandedand displayed in the main chart graphic, so that you can see the individualrisers. You can also use the range slider to scroll through the chart.
Note: You can hide the range slider by clicking the arrow at the edgeof the range slider. To restore the range slider, click the arrow again.
Defining the size of the selected range
First, define the size of the selected range by dragging the range slider barsin the range slider.
The selected range is shown with a white background in the range sliderwhen using the Default or Shadow chart styles, or with a black backgroundwhen using the Presentation styles.
68 BusinessObjects Voyager User's Guide
Using Charts to Visualize Data5 Scrolling through large data sets in charts

Moving the selected range within the range slider
Drag the selected range within the range slider to view different subsets ofthe data that are currently represented in the range slider. Alternatively, youcan use the paging buttons at the ends of the range slider to move theselected range.
Scrolling the range slider within the full data set
When the data set is very large, the range slider may not show the entiredata set. In that case, use the overview scroll bar to scroll the range sliderwithin the full data set.
Related Topics• Chart range slider on page 264• Chart types on page 57• Adding a chart to the analysis window on page 63• Adding data to a chart on page 66• Customizing charts on page 69
Customizing chartsVoyager provides several options for customizing the appearance of yourcharts. All these options are available from the Properties tab.
BusinessObjects Voyager User's Guide 69
5Using Charts to Visualize DataCustomizing charts

Related Topics• Chart types on page 57• Adding a chart to the analysis window on page 63• Adding data to a chart on page 66• Scrolling through large data sets in charts on page 68
Chart name and comments
The chart's name appears on the chart itself both on screen and when printed.The chart's comments appear only if you print the chart to a PDF. For moreinformation, see Chart display options on page 272.
70 BusinessObjects Voyager User's Guide
Using Charts to Visualize Data5 Customizing charts

To set name and comments properties for a chart
1. In the tab panel, click the Properties tab.2. Click the chart to select it.3. On the Properties tab, type a name for your chart in the Name field.
The name that you type here appears on the chart's title bar, and is usedto identify the chart on the Structure tab.
4. Type any comments that you want to appear below the printed chart inthe Comments field.
5. Click Apply.
Chart color palettes
You can choose from several predefined color palettes for displaying yourcharts. For details on the palettes available, see Chart display options onpage 272.
To change the color palette of your chart
1. In the tab panel, click the Properties tab.2. Click the chart to select it.3. On the Properties tab, choose a value for the Palette property, and then
click Apply.
Chart styles
You can choose from several predefined styles for displaying your charts.For details on the styles available, see Chart display options on page 272.
To change the style of your chart
1. In the tab panel, click the Properties tab.2. Click the chart to select it.
BusinessObjects Voyager User's Guide 71
5Using Charts to Visualize DataCustomizing charts

3. On the Properties tab, choose a value for the Style property, and thenclick Apply.
Display font
You can set the character font used in your charts. For details, see Font onpage 274.
To change the font used on your chart
1. In the tab panel, click the Properties tab.2. Click the chart to select it.3. On the Properties tab, choose a font for the Font property, and then click
Apply.
Suppressing null values in charts
Depending on the type of chart and the type of data the chart displays, youmay want to simplify the chart by hiding null values.
For details on suppressing null values in charts, see Excluding null valueson page 104 and Suppress NULL Values on page 274.
Displaying parent members
On a chart, parent members are hidden by default. For example, if a piechart contains a parent member and all its child members, the parent memberis not normally displayed in the pie chart because the parent member wouldalways occupy exactly half of the pie chart.
You can, however, turn on the display of parent members on a chart.
To display parent members on a chart
1. In the tab panel, click the Properties tab.
72 BusinessObjects Voyager User's Guide
Using Charts to Visualize Data5 Customizing charts

2. Click the chart to select it.3. On the Properties tab, set the Show Parents property to Yes, and then
click Apply.
Displaying visual totals
On a chart, visual totals are hidden by default. For example, if a pie chartcontains several members and a visual total representing the sum of theother members, the sum is not normally displayed in the pie chart becausethe sum would always occupy exactly half of the pie chart.
You can, however, turn on the display of visual totals on a chart.
To display visual totals on charts
1. In the tab panel, click the Properties tab.2. Click the chart to select it.3. On the Properties tab, set the Show Visual Totals property to Yes, and
then click Apply.
Hiding the chart dimension panel
If you want more room for displaying the chart graphic, you can hide thechart dimension panel.
To hide the chart dimension panel
1. In the tab panel, click the Properties tab.2. Click the chart to select it.3. On the Properties tab, set the Show Dimension Panel property to No,
and then click Apply.
BusinessObjects Voyager User's Guide 73
5Using Charts to Visualize DataCustomizing charts

Displaying hierarchical chart labels
Hierarchical chart labels show you the parent-child relationships betweenmembers on the chart.
To display hierarchical labels on the chart
1. In the tab panel, click the Properties tab.2. Click the chart to select it.3. On the Properties tab, set the Show Hierarchical Labeling property to
Yes, and then click Apply.
Hiding the chart legend
You can control whether or not the chart legend is visible.
To hide the chart legend
1. In the tab panel, click the Properties tab.2. Click the chart to select it.3. On the Properties tab, set the Show Legend property to No, and then
click Apply.
Chart axis labels
You can add labels to the chart axes. See Descriptions of chart displayoptions on page 273 for details on the chart axis labels.
To add labels to the chart axes
1. In the tab panel, click the Properties tab.2. Click the chart to select it.3. On the Properties tab, type labels in any of these fields:
74 BusinessObjects Voyager User's Guide
Using Charts to Visualize Data5 Customizing charts

Category Label•
• Value Label
• Data Series Label
4. Click Apply.
BusinessObjects Voyager User's Guide 75
5Using Charts to Visualize DataCustomizing charts

76 BusinessObjects Voyager User's Guide
Using Charts to Visualize Data5 Customizing charts

Selecting Members toDisplay in Crosstabs andCharts
6

This section explains how to select members to include in your crosstab andchart components.
Related Topics• Member Selector reference on page 278
Overview of member selectionYou can use the Member Selector or the metadata explorer to choose themembers to be displayed in your crosstabs and charts. The Member Selectorincludes features that let you search for members, aggregate search results,select members by level, and select parent, child, and sibling members. Themetadata explorer provides only basic manual selection of members.
The rest of this section describes selecting members using the MemberSelector. For more information about the metadata explorer, see Data tabmetadata explorer on page 224.
78 BusinessObjects Voyager User's Guide
Selecting Members to Display in Crosstabs and Charts6 Overview of member selection

When you place a dimension on any of the three axes on chart andcrosstab components, a Member Selector button is shown beside thedimension name. The Member Selector helps you choose members of thedimensions you place on those axes.
Additionally, a measures Member Selector in the component's title barlets you select members of the measures dimension whether or not you haveexplicitly added the measures dimension to one of the three axes. If you addonly fact dimensions to the axes, the crosstab is still populated with data;Voyager automatically selects the default member of the measures dimensionand uses that member's data to populate the crosstab. At all times, themeasures used to populate the crosstab with data are shown in the crosstab'stitle bar, and you can use the measures Member Selector to select measuresfor the crosstab.
You can select members in several ways:
• Select individual members from the list of all members in the dimension.
For details, see Selecting individual members from a list of all memberson page 80.
• Search for members.
For details, see Selecting members by searching on page 81.
• Select all members at the same level in the dimension.
For details, see Selecting all members at a particular level in the dimensionon page 83.
• Select parent, child, or sibling members.
For details, see Selecting parent, child, or sibling members on page 84.
Related Topics• Hiding members from view on page 85• Setting the slice member on page 86• Deselecting members on page 87• Showing only selected members in the Member Selector on page 88• Displaying member names and captions on page 89• Displaying the parent names of all members on page 89• Member Selector reference on page 278
BusinessObjects Voyager User's Guide 79
6Selecting Members to Display in Crosstabs and ChartsOverview of member selection
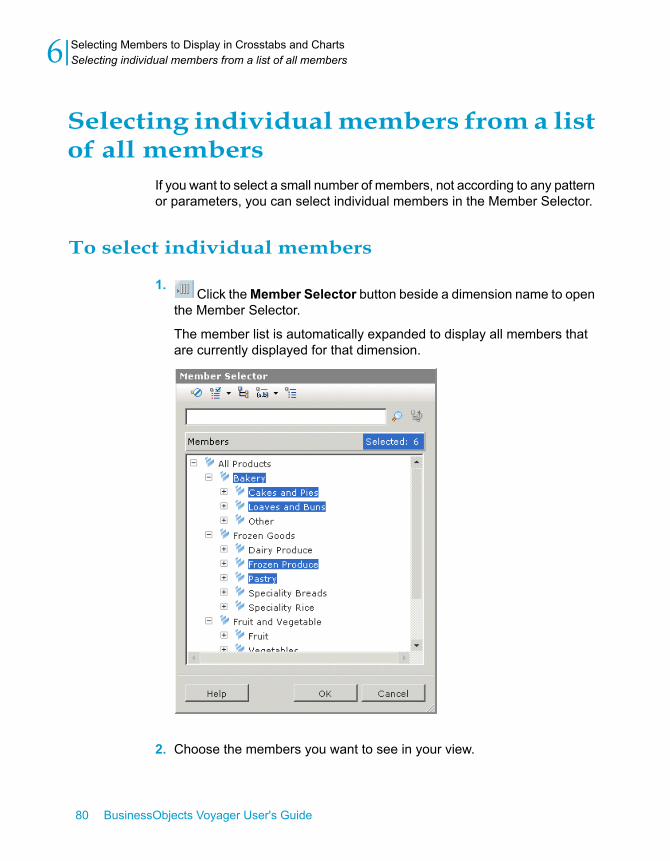
Selecting individualmembers from a listof all members
If you want to select a small number of members, not according to any patternor parameters, you can select individual members in the Member Selector.
To select individual members
1.Click the Member Selector button beside a dimension name to open
the Member Selector.
The member list is automatically expanded to display all members thatare currently displayed for that dimension.
2. Choose the members you want to see in your view.
80 BusinessObjects Voyager User's Guide
Selecting Members to Display in Crosstabs and Charts6 Selecting individual members from a list of all members

Click a member to select it; click the member again to deselect it.•
• To select or deselect a range of members, hold down the Shift keyas you click members.
• You do not need to hold down the Ctrl key to select multiple individualmembers.
3. Click OK to update the crosstab or chart.
Note: If you deselect all members, the OK button in the Member Selectoris disabled because you must select at least one member for eachdimension on the crosstab.
Selecting members by searchingUsing the search capabilities of the Member Selector, you can search formembers by specifying member names or captions.
Because selections from multiple search results are cumulative, you can usemultiple searches to build the set of members you want to analyze.
For example, if you wanted to analyze sales of books and magazines, youwould perform these steps:
• Perform a search for "book" in the Member Selector.
• Select appropriate members from the search results.
• Without closing the Member Selector, perform a second search for"magazine."
• Select members from the second search results.
When you click OK, all selected members from both searches are displayed.
For more information about searching for members in the Member Selector,including tips on search-string syntax and using wildcards, see Displayingmember names and captions on page 89 andMember Selector Start Searchbutton on page 283.
BusinessObjects Voyager User's Guide 81
6Selecting Members to Display in Crosstabs and ChartsSelecting members by searching

To search for member names or captions
1.Click the Member Selector button beside the dimension name to
open the Member Selector.2. In the Member Selector, click Display Mode to choose which
member text to search.If you want to search by member names only, select Name. If you wantto search by member captions only, select Caption. If you want to searchby both member names and captions, select either Name : Caption orCaption : Name.
3. Type a search string in the text box at the top of the Member Selector.4. Click Search or press Enter.
Members that match the search string are displayed in a hierarchical list.
82 BusinessObjects Voyager User's Guide
Selecting Members to Display in Crosstabs and Charts6 Selecting members by searching

Also, any members that were already included in the query are highlightedin the search results.
5. Select any members that you want to include in the query.• Click a member to select it; click the member again to deselect it.
• To select or deselect a range of members, hold down the Shift keyas you click members.
• You do not need to hold down the Ctrl key to select multiple individualmembers.
6. If you want to perform additional searches to select more members, repeatsteps 3 to 5.
7. Click OK.
Note: Clicking the Return to Member List button returns you to thecomplete member list. All selected members remain selected.
Selecting allmembers at a particular levelin the dimension
You may want to select all members at the same level in the dimension. Ifthe number of members in the dimension is large, it may be faster to use theSelect Level button in the Member Selector toolbar.
To select all members at a level
1.Click the Member Selector button beside the dimension name to
open the Member Selector.2. Click Select Level on the Member Selector toolbar.3. Select a level from the list.
All members at that level in the dimension are selected.
BusinessObjects Voyager User's Guide 83
6Selecting Members to Display in Crosstabs and ChartsSelecting all members at a particular level in the dimension

Alternatively, you can right-click a member, point to Select, and chooseAll at this level to select all members at that level in the dimension.
Selecting parent, child, or siblingmembers
After you've selected one or more members in the Member Selector, youmay want to select the parent of a member, or the children or siblings of amember.
For example, for the member Quarter 2, its parent member could be 2007,its child members could be April, May, and June, and its sibling memberscould be Quarter 1, Quarter 3, and Quarter 4.
84 BusinessObjects Voyager User's Guide
Selecting Members to Display in Crosstabs and Charts6 Selecting parent, child, or sibling members

To select parent, child, or sibling members
1.Click the Member Selector button beside the dimension name to
open the Member Selector.2. Right-click a member in the Member Selector, point to Select, and choose
Parent, Children, or Siblings.
Changing the displayed measuresWhenever data is displayed in the crosstab, the measures used in the
current query are displayed in the crosstab's title bar. If a measures dimensionhas not been added to any of the crosstab's three axes, you can still changethe measure by using the Member Selector in the title bar.
Related Topics• Crosstab title bar on page 250• Chart title bar on page 266
Hiding members from viewYou can hide members from the crosstab or chart in two ways:
• Deselect the members in the Member Selector.
• Select one or more members in the crosstab or chart, right-click one ofthe selected members, and select Hide Member.
To select multiple individual members, hold down the Ctrl key whileselecting members. To select a range of members, select one end pointof the range, hold down the Shift key, and then select the second endpoint.
The two methods are equivalent. If you want to restore a hidden member tothe crosstab or chart, use the Member Selector to re-select the hiddenmember.
BusinessObjects Voyager User's Guide 85
6Selecting Members to Display in Crosstabs and ChartsChanging the displayed measures

Setting the slice memberA query defines a specific view of data from an OLAP cube. This view isoften referred to as a "slice" because the view you see is a two-dimensional"slice" of a multi-dimensional cube.
A slice member is the active member in a slice dimension. For moreinformation on slice dimensions, see Crosstab component reference onpage 246.
If you already have a dimension placed on the slice axis, you can use theMember Selector to set new slice members for the axis. Alternatively, youcan drag members from the metadata explorer on the Data tab to the sliceaxis.
You can specify either a single member or multiple members for your sliceaxis, depending on which cube provider your crosstab is connected to andwhich type of dimension you are choosing slice members from. You canspecify only a single member from a Measures dimension for the slice axis.
If you connect to a cube provider that supports custom aggregation, you canspecify multiple members on a slice dimension. Microsoft Analysis Services2000/2005 and SAP BW support custom aggregates. Oracle HyperionEssbase does not support custom aggregates.
Therefore, if your data source is Essbase, you cannot place multiple membersin the slice area.
For more information on custom aggregates, see Custom aggregates andmultiple members on a slice dimension on page 228.
To specify members for the slice axis using theMember Selector
1.Click the Member Selector button beside the slice dimension name
to open the Member Selector.2. In the Member Selector, select one or more members and click OK.
The page is redrawn to show the data for the chosen slice members.
86 BusinessObjects Voyager User's Guide
Selecting Members to Display in Crosstabs and Charts6 Setting the slice member

To specify members for the slice axis using the Datatab
1. In the metadata explorer, select the members you want to use as yourslice.
2. Drag the members onto a slice axis drop zone.
Alternatively, you can click the Add to Slice button.
If the slice axis is already populated, drag the members to the center dropzone on the slice axis to swap the existing slice members with the selectedmembers. Or, drag the members to a side drop zone to nest the slicemembers with the existing members.
See Overview of member selection on page 78 for more information onselecting members.
Deselecting membersYou can deselect members by clicking them individually in the MemberSelector, or you can deselect groups of members simultaneously:
• Deselect all members.• Deselect all members at a level.• Deselect parent, child, or sibling members.
To deselect all members
1.Click the Member Selector button beside the dimension name to
open the Member Selector.2. Click Deselect All on the Member Selector toolbar.
All members within the tree are deselected.
Note: After you deselect all members, the OK button in the MemberSelector is disabled because you must select at least one member foreach dimension on the crosstab.
BusinessObjects Voyager User's Guide 87
6Selecting Members to Display in Crosstabs and ChartsDeselecting members

To deselect all members at a level
1.Click the Member Selector button beside the dimension name to
open the Member Selector.2. Right-click any member at the level you want to deselect, point to
Deselect, and choose All at this level.
To deselect parent, child, or sibling members
1.Click the Member Selector button beside the dimension name to
open the Member Selector.2. Right-click a member, point to Deselect, and choose Parent, Children,
or Siblings.
Showing only selected members in theMember Selector
The Member Selector can either show the entire list of members within adimension, or show only the members that have been selected for displayin the crosstab or chart. This can be useful when you have a dimension thatcontains a very large number of members, and only a few of the membersare selected.
Todisplay only themembers that have been selected
1.Click the Member Selector button beside the dimension name to
open the Member Selector.2. Click Show Selected Members.
Click the button again to toggle the display back to the entire list ofmembers.
88 BusinessObjects Voyager User's Guide
Selecting Members to Display in Crosstabs and Charts6 Showing only selected members in the Member Selector

Displaying member names and captionsYou can change the way that member names and captions are shown in theMember Selector. You can choose to display only the member names asthey are defined on the OLAP server, only the captions as they are definedby the cube designer, or both the server names and the captions. When bothnames and captions are displayed, you can search for members by namesor captions.
To change the display ofmember names and captions
1.Click the Member Selector button beside the dimension name to
open the Member Selector.2. Click Display Mode.3. Select one of these display modes:
• Caption
• Name
• Caption : Name
• Name : Caption
See Member Selector Display Mode button on page 282 for moreinformation on these display modes.
Note: The default display mode is Caption.
Displaying the parent names of allmembers
You can choose whether to display the parent names of all members in theMember Selector. For example, if a member name is "Wednesday", and itsparents are "2002", "Qtr 2", "June", and "Wk 1", the member name isdisplayed like this:Wednesday (2002 > Qtr 2 > June > Wk 1)
BusinessObjects Voyager User's Guide 89
6Selecting Members to Display in Crosstabs and ChartsDisplaying member names and captions

To toggle the display ofmember parent names in theMember Selector
1.Click the Member Selector button beside the dimension name to
open the Member Selector.2. Click Show Parent.
90 BusinessObjects Voyager User's Guide
Selecting Members to Display in Crosstabs and Charts6 Displaying the parent names of all members

Sorting, Filtering, andRanking Data
7

This section shows you how to sort, filter, and rank your data.
Sorting can be useful, for example, if you want to see sales regions in orderof their revenue. Once you sort your data, it is easy to see which sales regionis the most successful.
Filters and ranks let you hide much of your data, so you can concentrate onthe information that is important to you.
Sorting data columns or rowsVoyager provides these options for sorting rows and columns in the crosstab:
• Ascending
• Descending
• Maintain Hierarchies
• Clear
An ascending sort orders your data with the smaller data at the top or to theleft. A descending sort orders your data with larger data at the top or to theleft. By default, data is sorted without regard to the hierarchical structure ofthe dimension. To sort data while retaining the hierarchical structure of thedimension, see Sorting within hierarchies on page 95.
92 BusinessObjects Voyager User's Guide
Sorting, Filtering, and Ranking Data7 Sorting data columns or rows

You can add a sort to one column member and one row member. On an axisthat has nested dimensions, the selected member must be on the innermostdimension.
Cells that are uninitialized (null) or invalid are ranked in value below anyother cells; they appear last in a descending and first in an ascending sort.They are shown as nulls in the crosstab. For information about displayingnull values, see Display NULL Values As on page 257.
For more information about sort types, see Sort button on page 239.
To sort data columns or rows in ascending order
1. In the crosstab, select the row or column member heading that you wantto sort.
2. Click Sort.
Alternatively, you can click the arrow beside the Sort button and clickAscending, or right-click the member heading, point to Sort, and thenselect Ascending.
BusinessObjects Voyager User's Guide 93
7Sorting, Filtering, and Ranking DataSorting data columns or rows

An icon appears beside the member name, indicating the direction of thesort.
To sort data columns or rows in descending order
1. In the crosstab, select the row or column member heading that you wantto sort.
2. Click the arrow beside the Sort button, and then click Descending.
Alternatively, right-click the member heading, point to Sort, and then selectDescending.
An icon appears beside the member name, indicating the direction of thesort.
To reverse the sort direction
• In the crosstab, click the sort icon beside the member name.
The icon changes to reflect the new sort direction.
Note:
• The sort button is disabled until you select a single row or column ina crosstab.
• If your crosstab contains nested dimensions, you can add a sort onlyto a member of the innermost dimension.
For more information about sorting and the different sort types, see Sortbutton on page 239.
Related Topics• Combining a sort and filter on page 104• Combining a sort and rank on page 104
94 BusinessObjects Voyager User's Guide
Sorting, Filtering, and Ranking Data7 Sorting data columns or rows

Sorting within hierarchies
If you turn on the Maintain Hierarchies option, you can apply ascending anddescending sorts with the hierarchy of the data preserved—parent membersare sorted in order, and child members below the parents are sorted in theirown order.
The Maintain Hierarchies option is applied at the axis level. If you apply theoption to the row axis, but not to the column axis, then any sorts that youapply to members on the row axis will maintain hierarchies, but sorts thatyou apply to members on the column axis will not maintain hierarchies.
The Maintain Hierarchies option remains turned on until you explicitly toggleit off again.
BusinessObjects Voyager User's Guide 95
7Sorting, Filtering, and Ranking DataSorting data columns or rows

To sort data columns or rows with hierarchical grouping
1. In the crosstab, select the row or column member heading that you wantto sort.
2. Click the arrow beside the Sort button, and then click MaintainHierarchies.
Alternatively, right-click the member heading, point to Sort, and then selectMaintain Hierarchies.
A check mark indicates whether the Maintain Hierarchies option is onor off.
3. Select Ascending or Descending to apply the sort.
Removing a sort
You can manually remove a sort, or Voyager can remove sorts automatically.Whenever you swap, replace, or nest dimensions on the row or column axes,all sorts are automatically removed from the query. However, sorts are notautomatically removed if you perform a "swap axis" operation.
To manually remove a sort
1. In the crosstab, select the row or column member heading that you wantto remove a sort from.
2. Click the arrow beside the Sort button, and then click Clear.
Alternatively, you can right-click the member heading, point to Sort,and then click Clear, or right-click the Sort icon beside the sorted member'sname and click Clear Sort.
Note: If the crosstab contains a sort on the other axis, that sort remainsin effect.
96 BusinessObjects Voyager User's Guide
Sorting, Filtering, and Ranking Data7 Sorting data columns or rows

Automatically removed sorts
When any of the following actions is performed, all existing sorts, filters, andranks that are applied to that axis (the "target" axis) are automaticallyremoved:
• Swapping dimensions, removing a dimension, or adding a dimension.
• Changing the order of nested dimensions.
• Swapping a dimension to the slice axis.
Swapping the positions of the row and column dimensions with the SwapAxis button does not remove sorts, filters, or ranks from the query.
Filtering the data in crosstabs and chartsYou can filter data so that only the data that you're interested in is includedin your crosstabs and charts. To filter out data, you apply a condition to oneor more rows or columns in the crosstab. If a cell value does not satisfy thefilter condition, its entire row or column is removed from the crosstab.
A filter is applied to one or more row members, or one or more columnmembers, but not to both row and column members simultaneously. On anaxis that has nested dimensions, the selected members must be on theinnermost dimension.
Filtering is performed on the original, unformatted values of cells. Thisbehavior can lead to apparent small discrepancies in excluding or includingcells. For example, a value displayed as 100.00 would be excluded after afilter has been applied excluding only numbers greater than 100, if its originalvalue were 100.005.
For more information about filters, see Filter button on page 241 and FilterEditor dialog box on page 286.
To apply a new filter
1. In the crosstab, select the row or column member headings that you wantto apply the filter to.
BusinessObjects Voyager User's Guide 97
7Sorting, Filtering, and Ranking DataFiltering the data in crosstabs and charts

2. Click Filter.
Alternatively, right-click any of the selected member headings, point toFilter, and then click Set.
3. In the Filter Editor dialog box, select the type of filter you want to add tothe selected rows or columns.
For details on the types of filters you can apply, see Filter Editor dialogbox on page 286.
4. Choose a condition and type values for your filter.
For example, if you are applying a "greater than" filter, enter the minimumnumber that you want to be included in that row or column.
5. Click OK.
The target rows or columns are filtered, and a Filter icon appears besidethe member names.
To modify an existing filter
1. In the crosstab, select the row or column member heading that you wantto modify a filter for.
2. Click Filter.
Alternatively, right-click the member heading, point to Filter, and click Set,or click the Filter icon beside the filtered member's name.
The Filter Editor dialog box opens, showing the existing filter's conditionand values.
3. Make the desired changes to the filter and click OK.
For details on the types of filters you can apply, see Filter Editor dialogbox on page 286.
Note:
• The filter button is disabled until you select a single row or column ina crosstab.
98 BusinessObjects Voyager User's Guide
Sorting, Filtering, and Ranking Data7 Filtering the data in crosstabs and charts

• If your crosstab contains nested dimensions, you can add a filter onlyto a member of the innermost dimension.
Related Topics• Combining a filter and rank on page 104• Combining a sort and filter on page 104
Adding a second filter
When you add a second filter to a different member on the same crosstabaxis, the second filter is applied to the results of the first filter. Both filters arein effect, and the crosstab displays only the rows or columns that satisfy bothfilter conditions.
Removing a filter
You can manually remove a filter, or Voyager can remove filters automatically.Whenever you swap, replace, or nest dimensions on the row or column axes,all filters are automatically removed from the query. However, filters are notautomatically removed if you perform a "swap axis" operation.
To manually remove a filter
1. In the crosstab, right-click the row or column member heading that youwant to remove a filter from.
2. Point to Filter, and then click Clear.
Alternatively, you can right-click the Filter icon beside the filteredmember's name and click Clear Filter.
Only the target filter is removed. If the crosstab contains other filters,those remain in effect.
BusinessObjects Voyager User's Guide 99
7Sorting, Filtering, and Ranking DataFiltering the data in crosstabs and charts

Automatically removed filters
When any of the following actions is performed, all existing sorts, filters, andranks that are applied to that axis (the "target" axis) are automaticallyremoved:
• Swapping dimensions, removing a dimension, or adding a dimension.
• Changing the order of nested dimensions.
• Swapping a dimension to the slice axis.
Swapping the positions of the row and column dimensions with the SwapAxis button does not remove sorts, filters, or ranks from the query.
Ranking the data in the crosstabA rank is a type of filter that selects cell values based on their contributionto an overall total. The selected cells are then sorted in ascending ordescending order, depending on the rank condition.
For example, a data analyst may start with a crosstab that shows all productbrands. She then performs a ranking action to see only the unit sales of theTop 20 product brands, sorted from highest to lowest unit sales.
A rank action is performed on a single column or row. On an axis that hasnested dimensions, the selected member must be on the innermostdimension.
100 BusinessObjects Voyager User's Guide
Sorting, Filtering, and Ranking Data7 Ranking the data in the crosstab

For more information about ranking, see Rank button on page 241 and RankEditor dialog box on page 285.
To add a rank
1. In the crosstab, select the row or column member heading that you wantto apply a rank to.
2. Click Rank.
Alternatively, right-click the member heading, point to Rank, and clickSet.
3. From the Rank Editor dialog box, select a rank Condition, and then enterthe Number of Members or the Percentage of Total.
For details on the types of ranks you can apply, see Rank Editor dialogbox on page 285.
4. Click OK.
The target row or column is ranked, and a Rank icon appears beside themember name.
To modify an existing rank
1. In the crosstab, select the row or column member heading that you wantto modify a rank for.
2. Click Rank.
Alternatively, right-click the member heading, point to Rank, and thenclick Set, or click the Rank icon beside the ranked member's name.
The Rank Editor dialog box opens, showing the values defined for theexisting rank.
3. Make the desired changes to the rank and click OK.
For details on the types of ranks you can apply, see Rank Editor dialogbox on page 285.
Note:
BusinessObjects Voyager User's Guide 101
7Sorting, Filtering, and Ranking DataRanking the data in the crosstab

• The Rank button is disabled until you select a single row or column ina crosstab.
• The Clear option is disabled until you select a single row or column ina crosstab, that has a rank applied to it.
Related Topics• Combining a filter and rank on page 104• Combining a sort and rank on page 104
Adding a second rank
When you add a second rank to a different member on the same crosstabaxis, the second rank is applied to the results of the first rank. Both ranksare in effect, and the crosstab displays only the rows or columns that satisfyboth rank conditions.
For example, if you apply a "Top 20" rank to one member, and then apply a"Top 10" rank to another member on the same axis, the crosstab displaysthe top 10 members out of those 20 members.
Removing a rank
You can manually remove a rank, or Voyager can remove ranks automatically.Whenever you swap, replace, or nest dimensions on the row or column axes,all ranks are automatically removed from the query. However, ranks are notautomatically removed if you perform a "swap axis" operation.
To manually remove a rank
1. In the crosstab, right-click the row or column member heading that youwant to remove a rank from.
2. Point to Rank, and then click Clear.
Alternatively, you can right-click the Rank icon beside the rankedmember's name and click Clear Rank.
Only the target rank is removed. If the crosstab contains other ranks,those remain in effect.
102 BusinessObjects Voyager User's Guide
Sorting, Filtering, and Ranking Data7 Ranking the data in the crosstab

Automatically removed ranks
When any of the following actions is performed, all existing sorts, filters, andranks that are applied to that axis (the "target" axis) are automaticallyremoved:
• Swapping dimensions, removing a dimension, or adding a dimension.
• Changing the order of nested dimensions.
• Swapping a dimension to the slice axis.
Swapping the positions of the row and column dimensions with the SwapAxis button does not remove sorts, filters, or ranks from the query.
Displaying sorts, filters, and ranksapplied to the query
In addition to the sort, filter, and rank icons that are displayed in memberheadings, you can see a summary of all sorts, filters, and ranks that havebeen applied to any members on the crosstab, in a single list.
Click the Display Member Settings button in the crosstab's button areato open the list. In the Member Settings dialog box, you can review theconditions applied to your data, and remove any conditions you no longerwant to apply.
For more information, see Hidden sorts, filters, and ranks on page 103.
Hidden sorts, filters, and ranksIf you apply a sort, filter, or rank condition to a member in a crosstab, andthen that member is hidden, the sort, filter, or rank still applies. Memberscan become hidden if you perform a focused drill-down, if you manually hideor deselect members, or if you apply a second condition that excludes thefirst member.
BusinessObjects Voyager User's Guide 103
7Sorting, Filtering, and Ranking DataDisplaying sorts, filters, and ranks applied to the query

If your data has hidden conditions applied, you can click the DisplayMember Settings button to view the list of conditions. Then, you can use theMember Selector to restore the hidden members to the crosstab if desired.
For more information, see Displaying sorts, filters, and ranks applied to thequery on page 103.
Combining a filter and rankWhen you apply both a filter and a rank to the same row or column, thereturned data reflects both operations. If you then remove either the filter orthe rank, the remaining operation is reapplied to the query's entire data set.
Combining a sort and filterWhen you apply both a sort and a filter to the same row or column, thereturned data reflects both operations. The values are filtered, and orderedbased on the sort operation. If you then remove either the sort or the filter,the remaining operation is reapplied to the query's entire data set.
Combining a sort and rankWhen you apply both a sort and a rank to the same row or column, thereturned data reflects both operations. The values are ranked, and orderedbased on the explicit sort operation. If you then remove either the sort or therank, the remaining operation is reapplied to the query's entire data set.
When you apply a sort and a rank to the same member, the explicitly appliedsort always overrides the sort applied by the ranking operation.
Excluding null valuesNull values are database entries that have not been initialized with any realdata values. For example, if a database record for a house contains a fieldfor the number of rooms in the house, but no number has been entered inthat field for that house, the value of that cell is null.
104 BusinessObjects Voyager User's Guide
Sorting, Filtering, and Ranking Data7 Combining a filter and rank

You can clarify the visual display of your crosstabs and charts by filteringout rows and columns that contain only null values.
The null suppression applies to the entire query; therefore, all crosstab andchart components linked to that query are affected by the suppression.
You can suppress entire rows, columns, or both rows and columns.
To filter out all null rows and columns from a query
• Click the Null Suppression button in the crosstab component.
Rows and columns containing only null values are removed from thecrosstab view. When null suppression is active, the Null Suppressionbutton remains depressed to indicate that the crosstab containssuppressed data.
To restore the removed rows and columns, click the Null Suppressionbutton again.
To filter out only null rows or null columns from aquery
1. Select a chart or crosstab component linked to the query.2. Click the Properties tab.3. In the Suppress NULL Values field, select Column only or Row only.4. Click Apply.
Entire rows or entire columns containing only null values are removedfrom the crosstab view.
On all components that belong to the same query, the Null Suppressionbutton is depressed to indicate that null suppression is turned on for thisquery.
To remove null suppression
1. Select a chart or crosstab component linked to the query.
BusinessObjects Voyager User's Guide 105
7Sorting, Filtering, and Ranking DataExcluding null values

2. Click the Properties tab.3. In the Suppress NULL Values field, select Off.4. Click Apply.
All null suppression is removed from the query.
Alternatively, you can click the Null Suppression button on a crosstabcomponent to set null suppression to "rows and columns" mode, and thenclick the button again to turn off null suppression.
For more details on null suppression, see Crosstab Null Suppressionbutton on page 255, Crosstab display options on page 256, and Chartdisplay options on page 272.
Note: By default, null values in the crosstab are displayed as empty cells,but you can change the way null values are displayed. For details, seeProperties tab on page 231.
106 BusinessObjects Voyager User's Guide
Sorting, Filtering, and Ranking Data7 Excluding null values
Highlighting Exceptions inData
8
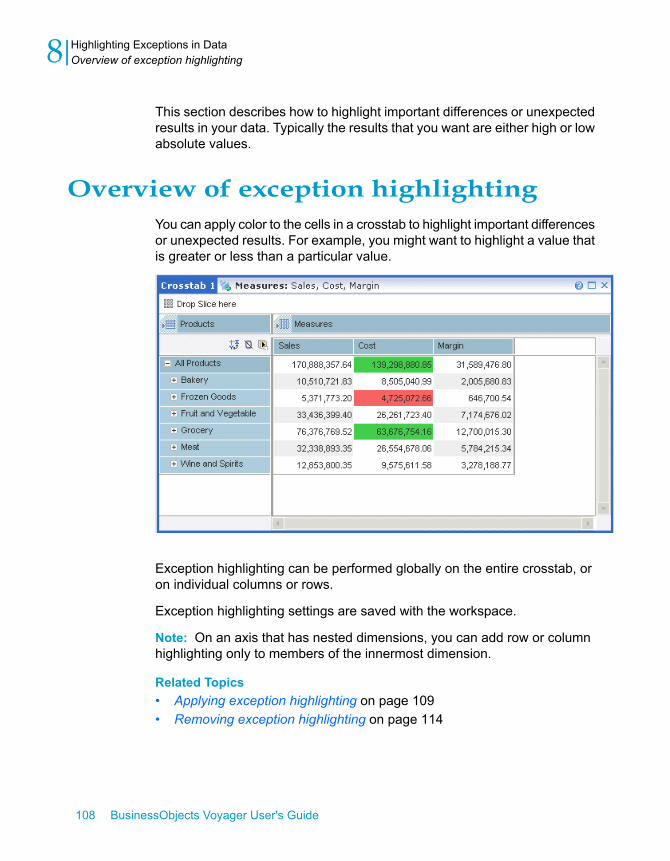
This section describes how to highlight important differences or unexpectedresults in your data. Typically the results that you want are either high or lowabsolute values.
Overview of exception highlightingYou can apply color to the cells in a crosstab to highlight important differencesor unexpected results. For example, you might want to highlight a value thatis greater or less than a particular value.
Exception highlighting can be performed globally on the entire crosstab, oron individual columns or rows.
Exception highlighting settings are saved with the workspace.
Note: On an axis that has nested dimensions, you can add row or columnhighlighting only to members of the innermost dimension.
Related Topics• Applying exception highlighting on page 109• Removing exception highlighting on page 114
108 BusinessObjects Voyager User's Guide
Highlighting Exceptions in Data8 Overview of exception highlighting

Applying exception highlightingYou can apply exception highlighting to individual rows and columns of thecrosstab, or to the entire crosstab.• Row and column highlighting
Row and column exception highlighting is used to distinguish values thatare inside or outside given ranges, in selected columns or rows. Forexample, if you were analyzing sales figures and wanted to know whichregions had sales lower than a certain value, you could apply exceptionhighlighting to find those poorly performing regions.
• Global highlighting
Global exception highlighting is used to distinguish values that are insideor outside given ranges, across the entire crosstab. For example, if youwere analyzing sales figures across your entire organization, and wantedto know which stores, regardless of location or size, had sales higherthan a certain value, you could apply global exception highlighting to findthose top-performing stores.
You can define up to seven ranges in Voyager, by specifying end points forthe ranges. When you enter a value in the Exception Highlighting dialog box,that value defines the starting point for a new range. The new range includesall values that are equal to or greater than the value you entered, and lessthan the next starting point.
To apply row and column exception highlighting
1. In the crosstab, select the row or column member headings that you wantto apply highlighting to.
2. Click Exception Highlight.Alternatively, you can right-click any of the selected row or column memberheadings, point to Highlight Exceptions, and click Set.
BusinessObjects Voyager User's Guide 109
8Highlighting Exceptions in DataApplying exception highlighting

The Exception Highlighting dialog box opens, with one end point defined:Minimum. The default range is defined as Minimum to Maximum.
3. Add appropriate ranges of values, up to a maximum of seven ranges.
Related Topics• To add a range on page 111• To delete a range on page 112• To change the start or end point of a range on page 113• To change the highlight color of a range on page 113
To apply global exception highlighting
1. Click the Select All button in the crosstab component.2. Click Exception Highlight.
Alternatively, you can right-click any data cell in the crosstab, point toGlobal Exception Highlighting, and click Set.
110 BusinessObjects Voyager User's Guide
Highlighting Exceptions in Data8 Applying exception highlighting

The Exception Highlighting dialog box opens, with one end point defined:Minimum. The default range is defined as Minimum to Maximum.
3. Add appropriate ranges of values, up to a maximum of seven ranges.
Related Topics• To add a range on page 111• To delete a range on page 112• To change the start or end point of a range on page 113• To change the highlight color of a range on page 113
To add a range
1. Type a value in the "Enter range point" field at the top of the dialogbox, and press Enter or click Add to add that value as another end point.
The new end point is added to the list, and is used to divide the defaultrange into two ranges: Minimum to end point, and end point to Maximum.
Voyager selects colors for the highest and lowest ranges automatically,leaving any other ranges you define unhighlighted. You can add highlightcolors to those other ranges, or change the colors used to highlight thehighest and lowest ranges.
BusinessObjects Voyager User's Guide 111
8Highlighting Exceptions in DataApplying exception highlighting

2. If you want to define more ranges, continue adding end points.
3. Click OK when you have defined all the ranges you need.
To delete a range
1. For global exception highlighting, click the Select All button in thecrosstab. For row and column exception highlighting, select the row orcolumn member heading that you want to remove exception highlightingranges from.
2. Click Exception Highlight.Alternatively, for global highlighting you can right-click any data cell in thecrosstab, point to Global Exception Highlighting, and click Set, or forrow and column highlighting you can right-click a row or column memberheading, point to Highlight Exceptions, and click Set.
3. In the Exception Highlighting dialog box, select the range you want todelete by clicking anywhere on the row.
4. Click the Delete button to delete the selected range.
112 BusinessObjects Voyager User's Guide
Highlighting Exceptions in Data8 Applying exception highlighting

To change the start or end point of a range
1. For global exception highlighting, click the Select All button in thecrosstab. For row and column exception highlighting, select the row orcolumn member heading whose highlighting you want to modify.
2. Click Exception Highlight.Alternatively, for global highlighting you can right-click any data cell in thecrosstab, point to Global Exception Highlighting, and click Set, or forrow and column highlighting you can right-click a row or column memberheading, point to Highlight Exceptions, and click Set.
3. In the Exception Highlighting dialog box, select the range you want tomodify by clicking anywhere on the row.
The cell in the Point column changes to edit mode; you can now modifythe value.
4. Enter a new value for that point and press Enter, or click outside that cellwith the mouse.
The new point is set, and the ranges are updated. The ranges are alsore-sorted so that ranges are ordered from lowest to highest based on thestarting points.
To change the highlight color of a range
1. For global exception highlighting, click the Select All button in thecrosstab. For row and column exception highlighting, select the row orcolumn member heading whose highlighting you want to modify.
2. Click Exception Highlight.Alternatively, for global highlighting you can right-click any data cell in thecrosstab, point to Global Exception Highlighting, and click Set, or forrow and column highlighting you can right-click a row or column memberheading, point to Highlight Exceptions, and click Set.
3. In the Exception Highlighting dialog box, click theColor Picker buttonfor the range you want to modify.
4. Choose a color from the palette.
BusinessObjects Voyager User's Guide 113
8Highlighting Exceptions in DataApplying exception highlighting

5. If desired, change the colors of other ranges, and then click OK to applythe new colors to the crosstab.
Removing exception highlightingYou can remove exception highlighting at any time, to restore your originalview of the data.
To remove exception highlighting from rows orcolumns
1. In the crosstab, select the row or column member headings that you wantto remove highlighting from.
2. Right-click one of the selected member headings, point to ExceptionHighlighting, and then click Clear.
To remove global exception highlighting
1. Click the Select All button in the crosstab.2. Right-click any data cell in the crosstab, point to Exception Highlighting,
and then select Clear.
114 BusinessObjects Voyager User's Guide
Highlighting Exceptions in Data8 Removing exception highlighting

Defining Calculations
9

This section describes the calculation types available to help you analyzeyour data.
Overview of calculationsCrosstabs that contain raw multidimensional data are not always easy toread or understand. Sometimes, there are trends which are hidden by thedata, or are only revealed when new information is derived from the data.Revealing these trends is accomplished by applying calculations to the dataon the crosstab.
Voyager calculations include both visual totals, which aggregate the datacurrently displayed in the crosstab, and calculated members, which arecalculations that behave as members. You can manipulate the calculatedmembers much like standard data members.
Some basic Voyager calculations are predefined; you don't need to specifyany parameters before applying them to your data. However, you can createcustom calculations if the basic calculations don't meet your requirements.
You can create multiple calculations to enhance your analysis further, or tohighlight different aspects of the data.
These types of calculations are available in Voyager:
• Visual totals on page 116
• Basic calculations on page 122
• Custom calculations on page 124
Visual totalsVisual totals are dynamic aggregations of your data, such as sums oraverages, displayed in rows or columns added to the crosstab. Visual totalsaggregate the data in the crosstab without regard to members' relationshipsin the hierarchy. For example, if your crosstab displays the members Drinkand Food, and also the child members Bread and Meat, the visual totalaggregates the data for all four members despite Bread and Meat beingchild members of Food.
Visual totals appear at the bottom or at the right side of the crosstab but arenot created as members like other calculations are. (For example, visual
116 BusinessObjects Voyager User's Guide
Defining Calculations9 Overview of calculations

totals do not appear in the Member Selector.) They can be added andremoved individually, or all turned on and off simultaneously.
A typical visual total calculation would be the sum of all values in a row orcolumn, although you can apply other summary calculations as well:
DescriptionName
Sums a range of cell values.Sum
Averages a range of cell values.Average
Counts the number of non-null cells in a range.Count
Returns the minimum value in a range of cell values.Min
Returns the maximum value in a range of cell values.Max
Returns the median value for a range of cell values. Themedian is the middle value in a set.Median
Returns the variance for a range of cell values.Variance
Returns the standard deviation for a range of cell valuesusing the unbiased population formula. Standard deviationis the square root of the variance.
Standard Devia-tion
BusinessObjects Voyager User's Guide 117
9Defining CalculationsVisual totals

DescriptionName
The Aggregate total is available only for Microsoft AnalysisServices data sources. The aggregate operation appliesthe aggregation operation specified on the server to therange of cell values.
Aggregate
These calculations are dynamic; the result set is always based on themembers that have been selected in the query. For example, if you add aSum calculation row, the calculation sums the values from all row members.If you then remove a row member, the calculation adjusts automatically forthe removed member, summing only the values from visible row members.
For more information about the different visual total calculations, see Customcalculations on page 124.
Note:
• Visual totals ignore cells that are the result of other calculations.• Visual totals do not take into account parent-child relationships when
calculating cell values in a range. For example, if both a parent memberand its child member are specified on an axis, and the visual total addedis a Sum, the child member is added to the Sum twice: once as a singlemember and again as a contribution to the total of its parent member.
To add the default totals
For Microsoft data sources, the default totals are the aggregate type that isdefined on the server. For other data sources, the default totals are sums.
• On the toolbar, click the Visual Totals button.
Alternatively, you can click the Select All button in the crosstab, right-clickany data cell in the crosstab, and select Show Visual Totals.
118 BusinessObjects Voyager User's Guide
Defining Calculations9 Visual totals

The default totals are added to the crosstab, and an icon identifies thenew row and column as visual totals. Also, the Visual Totals button isdepressed, indicating that totals are applied to the crosstab.
Toadd commonlyusedvisual totals (Aggregate, Sum,Average, and Count)
1. On the toolbar, click the arrow beside the Visual Totals button.2. Point to either Rows or Columns, and then select a total type.
Note:
• For Microsoft data sources, the default total type is Aggregate. Forother data sources, the default total type is Sum.
• If you want to add more than one visual total to an axis, you can repeatthese steps, or you can select More instead of Rows or Columns.
An icon identifies the added rows and columns as visual totals. Also, theVisual Totals button is depressed, indicating that totals are applied tothe crosstab.
To add other visual totals
1. On the toolbar, click the arrow beside the Visual Totals button.2. Click More and select any totals you want to display on the crosstab.
You can also choose to subtotal each dimension if you have nesteddimensions. For more information, see Visual totals on axes with nesteddimensions on page 121.
3. Click OK to turn on the totals.
BusinessObjects Voyager User's Guide 119
9Defining CalculationsVisual totals

An icon identifies the added rows and columns as visual totals. Also,the Visual Totals button is depressed, indicating that totals are appliedto the crosstab.
Changing to a different visual total
Once you've added a visual total to a crosstab, you can easily change it toa different type.
To change a visual total to a different type
1. Right-click a visual total in the crosstab.2. If you want to change the visual total to one of the commonly used types
(Aggregate, Sum, Average, and Count), select it from the list.Or, if you want to apply one of the other available totals, select More.
Alternatively, you can click the Visual Total icon to open the VisualTotals dialog box.
Removing visual totals
You can either turn off all totals simultaneously or remove individual totals.
To turn off all visual totals simultaneously
• Click the Visual Totals button to turn off the totals.
Alternatively, you can click the Select All button in the crosstab, right-clickany data cell in the crosstab, and clear the check mark beside ShowVisual Totals.
Note: Both the Visual Totals button and the Show Visual Totals menuitem toggle on and off all visual totals. If you have chosen to displayseveral totals, they are all turned on and off simultaneously with the VisualTotals button or Show Visual Totals menu item.
120 BusinessObjects Voyager User's Guide
Defining Calculations9 Visual totals

To remove individual visual totals
• Click the arrow beside the Visual Totals button, click More, andthen clear any totals you want to remove from the crosstab.
Alternatively, you can right-click a visual total and select Remove Total.
Visual totals on filtered data
If a visual total calculation is applied to filtered data, three visual total rowsor columns are added:
• Displayed—Calculates totals based on the values allowed by the filter.
• Excluded—Calculates totals based on the values excluded by the filter.
• All—Calculates totals based on the full, unfiltered set of members.
Visual totals on axes with nested dimensions
If you apply visual totals to a crosstab with nested dimensions, you can alsodisplay subtotals of the inner dimensions.
When subtotals are displayed, the visual total is displayed as the last memberat the top level of the inner dimension.
BusinessObjects Voyager User's Guide 121
9Defining CalculationsVisual totals

Visual totals on charts
When visual totals are enabled on a crosstab, any chart components linkedto the same query also display the visual totals, if the Show Visual Totalsproperty is set to Yes for those charts.
Basic calculationsBasic calculations are simple arithmetic calculations involving two members;for example, the sum of two column members. Basic calculations do not takeany additional parameters. If you want to create more complex calculations,see Custom calculations on page 124.
The basic calculations are available from the drop-down list on theCalculation button.
DescriptionCalculation
Adds the values in the selected rows or columns.Add
122 BusinessObjects Voyager User's Guide
Defining Calculations9 Basic calculations

DescriptionCalculation
Subtracts the values in the selected rows or columns. The cellvalues from the second selected row or column are subtractedfrom the values in the first selected row or column.
Subtract
Multiplies the values in the selected rows or columns.Multiply
Divides the values in the selected rows or columns.The cell values from the first selected member row or columnare divided by the values in the second selected row or column.
Divide
Divides the values in the selected rows or columns, and express-es the resulting values as percentages.The cell values from the first selected member row or columnare divided by the values in the second selected row or column,and multiplied by 100.
Percentage
Related Topics• Custom calculations on page 124
Adding a basic calculation
When you add a basic calculation to the crosstab, it is added immediatelyto the right of the right-most selected member (for column-based calculations)or immediately below the bottom-most selected member (for row-basedcalculations).
To add a basic calculation to the crosstab
1. Select two members in the crosstab.
For subtraction, division, and percentage calculations, the calculation isdefined in the order in which you select the members. That is, if you clickthe Food member first, and then the Drink member, a subtractioncalculation would result in Food - Drink.
2. On the application toolbar, click the arrow beside the Calculationbutton and select the type of basic calculation you want to create.
BusinessObjects Voyager User's Guide 123
9Defining CalculationsBasic calculations

The calculation is added to the crosstab as a calculated member.
To edit a calculation
1. Right-click the calculation member header.2. Point to Calculation and then click Edit.
Alternatively, you can click the icon in the calculation's member header.
3. In the Calculation Editor dialog box, change the calculation type ordefinition, and then click OK.
The calculation in the crosstab updates to reflect any changes you made.
To delete a calculation
1. Right-click the calculation member header.2. Point to Calculation and then click Remove.
Alternatively, you can right-click the icon in the calculation's memberheader and select Remove Calculation.
Custom calculationsIf the visual totals and basic calculations do not satisfy your need for moredetailed analysis of information from the data cube, you can create customcalculations. With custom calculations, you define the parameters of thecalculations:
124 BusinessObjects Voyager User's Guide
Defining Calculations9 Custom calculations

• The arguments of arithmetic calculations can be any combination of twomembers or fixed numeric values.
• The arguments of other calculations can be a set of manually selectedmembers, or a range of members.
Note: Each calculated member can have only one operation. To createcomplex calculations with multiple operations, you create calculations thatoperate on other calculated members.
The following custom calculations are available from the Calculation Editordialog box.
Arithmetic calculations
DescriptionCalculation
Adds two members or values.Addition
Subtracts two members or values.Subtraction
Multiplies two members or values.Multiplication
Divides two members or values.Division
Rounds the target member's values to a specified number ofdecimal places.Round
Calculates the square root of the target member's values.Square Root
Summary calculations
DescriptionCalculation
Calculates the average (mean) for the values of the specifiedmembers.Average
Calculates the maximum for the values of the specified mem-bers.Maximum
Calculates the minimum for the values of the specified mem-bers.Minimum
BusinessObjects Voyager User's Guide 125
9Defining CalculationsCustom calculations

DescriptionCalculation
Calculates the median for the values of the specified members.Median
Variance and standard deviation
DescriptionCalculation
Calculates the variance for the values of the specified members.Variance
Calculates the standard deviation for the values of the specifiedmembers.
Standard Devi-ation
Available only with Microsoft Analysis Services data sources.Aggregates the values for the specified members according tothe aggregation scheme defined for the measure in the cube.
Rollup
Percentage calculations
DescriptionCalculation
Calculates the values of the base member as a percentage ofthe target member.Percentage
Calculates the difference between the base and target valuesas a percentage of the target member.
Percent Differ-ence
Calculates the percentage contribution of members to the parentor grandparent total.
PercentageContribution
Time-based calculations
DescriptionCalculation
Available only with Essbase data sources, and only on the timedimension. For details on using these calculations, seeDynamicTime Series on page 212.
Dynamic TimeSeries
126 BusinessObjects Voyager User's Guide
Defining Calculations9 Custom calculations

DescriptionCalculation
Available only with measures dimensions. Returns the measurevalues from an earlier time period.Prior Period
Available only with measures dimensions. Returns the measurevalues from a parallel reporting period.Parallel Period
Available only with measures dimensions. Calculates themoving average for the values of the measure over rolling timeperiods.
Moving Aver-age
Available only with measures dimensions. Aggregates measurevalues over a time period.Period to Date
Rank calculation
DescriptionCalculation
Ranks members within the dimension, level, set, or siblings.Rank
Related Topics• To edit a calculation on page 124• To delete a calculation on page 124• Basic calculations on page 122
Adding a custom calculation
When you add a custom calculation to the crosstab, it is added as a newmember to the right of or below the last member you selected before clickingthe Calculation button.
To add a custom calculation to the crosstab
1. Select a member heading in the crosstab.
The custom calculation will be added to the right of or below this member.
BusinessObjects Voyager User's Guide 127
9Defining CalculationsCustom calculations

2. On the application toolbar, click Calculation.
Alternatively, you can right-click the member heading, point to Calculation,and click Add.
3. In the Calculation Editor dialog box, select the type of operation you wantto use for the calculation.
See these sections for information about the different types of calculationsavailable:
• Mathematical operations on page 129
• Time-based operations on page 133
• Rank calculation on page 136
4. Optionally change the default caption.5. Enter any additional information required to define the custom calculation.6. Click OK.
The calculation is added to the crosstab as a calculated member.
128 BusinessObjects Voyager User's Guide
Defining Calculations9 Custom calculations

Mathematical operations
There is a large selection of mathematical operations that can be performedon your data to aid you in analysis. You can select simple arithmeticoperations, such as addition or subtraction, or you can perform morecomplicated operations on your data, such as standard deviation functions,or averages.
Mathematical operations are separated into categories.
Arithmetic operations
As you might expect, arithmetic operations constitute the four most common,or "simple" calculations: Addition, Subtraction, Product (Multiplication), andDivision. Arithmetic operations also include additional calculations: Round,and Square Root.
In the case of simple operations, you can define calculations to perform theoperation on two members, or perform the operation on one member and aconstant value. For example, you can create an addition calculation wherethe values of two members are added together, or you can add the value ofa single member to a constant value.
Simple arithmetic operations
Addition, subtraction, division, or product operations require the selection oftwo arguments. The arguments can each be a member or a fixed value.
BusinessObjects Voyager User's Guide 129
9Defining CalculationsCustom calculations

Rounding operation
The rounding operation displays values with fewer decimal places than theactual values contain. For example, the actual values in a member might bethe following:
142.3251
589.8386
27.2727
You can add a Round calculation, set to 1 decimal place, to produce thesevalues instead:
142.3
589.8
27.3
If the leftmost removed digit is 5 or greater, the last retained digit is roundedup; if the leftmost removed digit is less than 5, the last retained digit is roundeddown.
Square root
The square root operation calculates the number that can be multiplied byitself to equal the selected value.
Summary operations
Summary operations are intended to derive new information from thecomparison of two or more members in your crosstab. Because of this, inorder to calculate summary operations, you must select two or more membersprior to indicating which operation to perform.
130 BusinessObjects Voyager User's Guide
Defining Calculations9 Custom calculations

Average
The average is calculated by adding all the values in the selected memberand dividing by the total number of values in the member. This operation isalso known as the mean of all values.
Maximum
The values of the selected members are compared and the largest of thevalues is selected.
Minimum
The values of the selected members are compared and the smallest of thevalues is selected.
Median
The median is the middle value in a set. The number of values above themedian is equal to the number of values below the median.
Variance and standard deviation
When working in probability and statistics, two related calculations which arecommonly applied to data are variance and standard deviation. Bothcalculations are a measure of how spread out values in a set of data arefrom the average.
Consider the following sample data from a selected member:
{10, 10, 10, 10, 10}
In such a set of numbers, the average is 10, and the variance and standarddeviation are 0. This is because there is no spread of values (they are all10).
But now consider a different set of values from a selected member:
{0, 5, 10, 15, 20}
In this set of numbers the average is also 10, but the variance is 50 and thestandard deviation is approximately 7.07.
BusinessObjects Voyager User's Guide 131
9Defining CalculationsCustom calculations

Variance
The variance is a measure of how much a set of numbers varies from theaverage. When the values in a set are all close to the average, variance issmall. When the values in a set are significantly larger and smaller than theaverage, the variance is large. Variance is calculated using the unbiasedpopulation formula (that is, divided by N-1).
Standard Deviation
Standard deviation is the square root of the variance. The standard deviationis calculated using the unbiased population formula.
Rollup
The rollup aggregates the values of the selected members using theaggregation scheme defined in the data server. Rollup is available only fordata provided by Microsoft SQL Server Analysis Services connections.
Percentage operations
Voyager provides three types of percentage calculations:
• Percentage
• Percentage difference
• Percentage contribution
Percentage values are automatically formatted as percentages in thecrosstab.
Percentage
This operation calculates the values of the base member as a percentageof the target member.Percentage = (base / target) * 100
Percentage difference
This operation is useful for showing percentage changes of a measure overtime. It is calculated by first determining the difference between the value of
132 BusinessObjects Voyager User's Guide
Defining Calculations9 Custom calculations

a base member and the value of a target member, then dividing the differenceby the value of the target member.Percent difference = ((base - target) / target) * 100
Percentage contribution
This operation calculates the values of members as percentages of a specifictotal. For example, the populations of a city and its regions might be thefollowing:
800,000Entire city
200,000East side
200,000South side
400,000North side
The percentage contribution of the North side is 50%.
You can specify which total to base the percentage calculation on:
• Dimension total—The percentage contribution is calculated based onthe overall dimension's total.
• Parent total—The percentage contribution is calculated based on theimmediate parent's total.
Time-based operations
Frequently, there is a need to show data in reference to time. A dimensionof data relating to time is a common and necessary concept in analysis,because business is measured by activity, and activity is based heavily uponthe concept of time. Time relates to other common dimensions in a datacube because virtually everything is measured relative to various points intime; for example, an asset or other balance within a balance sheet, orrevenues over time within an income statement.
You can define time-based calculations only on a measures dimension.Additionally, you can create a time-based calculation only if there is a timedimension selected on the crosstab.
BusinessObjects Voyager User's Guide 133
9Defining CalculationsCustom calculations

Note: For information about Essbase Dynamic Time Series calculations,see Dynamic Time Series on page 212.
Prior Period
The Prior Period calculation is an analysis of the change in a measurementover a prior operating period.
A typical calculation of the Prior Period is sales comparison between themost recent quarter, such as Q3, and the previous quarter, Q2.
The unit of measure of time is determined by the dimensions defined in yourdata. For example, if there is a time dimension in months, months are theunit of time measurement used for the Prior Period.
You must supply information in the Calculation Editor dialog box tosuccessfully set up a Prior Period calculation:
• The dimension to calculate the Prior Period for.
• Which time dimension to use for the calculation, if there is more than onedimension in the data cube that is of the type time.
• The number of periods to go back from the current period. The defaultvalue is 1.
Parallel Period
The Parallel Period calculation is an analysis and comparison of a selectedperiod in time with the same period in the past.
A typical calculation of the Parallel Period is sales comparison between themost recent quarter this year, and the same quarter from the previous year:Compare Q2 sales from this year with Q2 sales from last year.
The unit of measure of time is determined by the dimensions defined in yourdata. For example, if there is a time dimension in months, months are theunit of time measurement used for the Parallel Period.
The time interval represents the length of time between the two periods.Taking the typical time intervals of Year, Quarter, and Month, a time intervalof one Year would indicate a comparison of quarters or months between thecurrent year and the previous year.
134 BusinessObjects Voyager User's Guide
Defining Calculations9 Custom calculations

You must supply information in the Calculation Editor dialog box in order tosuccessfully set up a Parallel Period calculation:
• The dimension to calculate the Parallel Period for.
• Which time dimension to use for the calculation, if there is more than onedimension in the data cube that is of the type time.
• The time interval to use for the Parallel Period.
• The number of periods to go back from the current period. The defaultvalue is 1.
Moving Average
Moving Averages, also known as Rolling Averages, are popular because oftheir "smoothing" effect on data that fluctuates over time. In situations wherevalues change wildly within seasons, or undergo other cyclical volatility,Moving Averages provide meaningful data analysis.
Periodicity (the number of periods) indicates how the Moving Average isdetermined:
• If the periodicity is an odd number, the average for each dimensionmember is calculated with that member at the "center" of the movingaverage. For example, if the periodicity is 3, the value preceding themember, the member itself, and the value after the member are used tocalculate the Moving Average.
• If the periodicity is an even number, two averages are calculated, thenthe average of those two averages is further calculated to form the MovingAverage.
You must supply information in the Calculation Editor dialog box in order tosuccessfully set up a Moving Average calculation:
• The dimension to calculate the Moving Average for.
• The number of periods to calculate the Moving Average for.
Period to Date
The Period to Date is a measure of the sum or aggregation of values overa range of time intervals.
BusinessObjects Voyager User's Guide 135
9Defining CalculationsCustom calculations

A typical calculation of the Period to Date is the accumulation of values fromthe beginning of a year until the current month. A further calculation may bemade to compare the Period to Date with the Period to Date for a previousyear.
In the Calculation Editor dialog box, the Period field defines the time periodfor the calculation. For example, if you choose Year for the period, the Periodto Date calculation returns the sum of all months starting from January ofthe current year.
You must provide information in the Calculation Editor dialog box to set upa Period to Date calculation:
• The measure whose values you want to aggregate; for example, storesales.
• The aggregation function for the calculation: Sum (default), Average,Maximum, or Minimum.
• Which time dimension to use for the calculation, if there is more than onedimension in the data cube that is of the type time.
• The period to base the calculation on.
Rank calculation
You can use the rank operation to assign a ranking to the members of adimension based on their values.
For example, you may want to show the ranking of the selected valuescompared to each other, or you may want to show the ranking compared toall values that the selected data shares a parent with.
These rank types are available:
• All members in the dimension—Show rankings as compared with allmembers in the dimension.
• Members at the same level—Show rankings as compared with all othermembers at the same level in the data hierarchy.
• Members with the same parent—Show rankings as compared with allother members that the member shares a parent with (siblings).
136 BusinessObjects Voyager User's Guide
Defining Calculations9 Custom calculations

• Members displayed in the crosstab—Show rankings as compared withall displayed members on the same axis.
To add a Rank calculation, first select the member containing the data thatyou want to rank, and then click the Calculation button.
BusinessObjects Voyager User's Guide 137
9Defining CalculationsCustom calculations

138 BusinessObjects Voyager User's Guide
Defining Calculations9 Custom calculations

Exploring Different Views ofYour Data
10

After you've created a workspace, defined a query, added calculations, andapplied filtering, you may still need to adjust your view of the data to suit youranalysis needs. This section explains how to change the view of yourbusiness data by swapping and nesting dimensions, changing the currentslice, and exploring hierarchical dimensions.
This section also describes how you can compare two views of the samedata; for example, if you want to compare an exploratory view with a baselineview.
Swapping dimensionsYou can swap dimensions with others to reorient the view of data in thecrosstab or chart.
You can swap a row or column dimension with one of the slice dimensions,or with another row or column dimension.
To swap all rows with all columns
• Click the Swap Axis button in the crosstab or chart component.
To swap two dimensions
1. Drag a dimension toward the dimension that you want to swap it with.
You can swap row, column, or slice dimensions.
2. When the center drop zone is highlighted as shown, release the mousebutton to swap the two dimensions.
140 BusinessObjects Voyager User's Guide
Exploring Different Views of Your Data10 Swapping dimensions

Swapping dimensions containing sorts, filters, andranks
When you swap dimensions, or add a new dimension to a row or columnaxis, all existing sorts, filters, and ranks are automatically removed from thequery. However, if you swap the positions of the row and column dimensionsusing the Swap Axis button, the sorts, filters, and ranks are preserved.
See Sorting data columns or rows on page 92, Filtering the data in crosstabsand charts on page 97, and Ranking the data in the crosstab on page 100for more information about sorting, filtering, and ranking.
Removing dimensionsYou can remove dimensions from the crosstab's or chart's axes to simplifyyour analysis.
To remove a dimension from a chart or crosstabcomponent
• Drag the dimension from the dimension panel to any location outside thechart or crosstab component.Alternatively, you can right-click the dimension, and select Remove.
BusinessObjects Voyager User's Guide 141
10Exploring Different Views of Your DataRemoving dimensions

Nesting dimensionsDisplaying two or more dimensions in a particular row or column in thecrosstab is known as nesting. When you nest dimensions, the one nearestthe cells is called the inner dimension, and any others are called the outerdimensions.
To nest dimensions
1. Drag a dimension toward the dimension that you want to nest it with.
You can nest row, column, or slice dimensions.
2. When one of the side drop zones is highlighted, release the mouse buttonto nest the two dimensions.
142 BusinessObjects Voyager User's Guide
Exploring Different Views of Your Data10 Nesting dimensions

Note: After you nest dimensions, you can apply sorting, filtering, andranking only to the inner dimensions.
Changing the order of nested dimensions
You can change the order of the dimensions in a row or column by swappingthe dimensions. See Swapping dimensions on page 140.
Changing the slice of dataSlice dimensions have an active slice member that determines the currentview. To alter the active slice member, use the Member Selector on thecorresponding dimension.
The slice Member Selector is similar to the Member Selector for row andcolumn dimensions, except that you can select only one slice member at atime. Some data sources however, for example Microsoft Analysis Services,allow you to select multiple slice members.
To select a member from a slice
1.Click the Member Selector button beside the slice dimension name
to open the Member Selector.2. In the Member Selector, select a member from the list.3. Click OK.
The data in the crosstab updates to show the view for the new slice.
Note: When you drag a dimension to the slice axis, it returns to the defaultmember.
Related Topics• Overview of member selection on page 78
BusinessObjects Voyager User's Guide 143
10Exploring Different Views of Your DataChanging the slice of data

Drilling down and drilling upOften you want to explore data in a hierarchical dimension more closely tofind reasons for unexpected performance. In a crosstab or chart, you canexpand a member to show its constituent child members. This is called drillingdown.
Collapsing the member structure to show only the parent member is calleddrilling up.
A plus sign next to a member indicates that the member can be drilleddown to show its child members; a minus sign indicates that the memberhas been expanded-drilled down, and can be collapsed to hide its childmembers.
You can perform either expanded drill or focused drill operations on members.
Expanded drill
If you perform an expanded drill down on the member Bakery, you seeBakery and its child members, as well as any other members that arecurrently selected on the same view axis. For example, if Bakery, Grocery,and Meat are currently displayed on the row axis of your crosstab, applyingan expanded drill down on Bakery to display its children does not removeGrocery and Meat from the row axis.
If you perform an expanded drill up on Bakery, the view returns to the statethat existed before the expanded drill down.
Focused drill
If you perform a focused drill down on Bakery, you see only the childmembers of Bakery. Grocery and Meat are removed.
144 BusinessObjects Voyager User's Guide
Exploring Different Views of Your Data10 Drilling down and drilling up
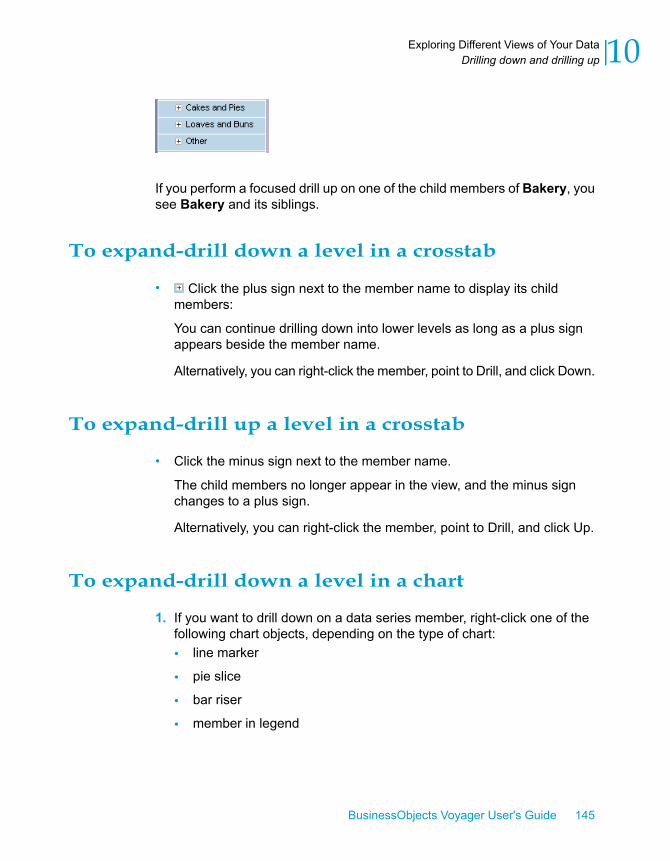
If you perform a focused drill up on one of the child members of Bakery, yousee Bakery and its siblings.
To expand-drill down a level in a crosstab
• Click the plus sign next to the member name to display its childmembers:
You can continue drilling down into lower levels as long as a plus signappears beside the member name.
Alternatively, you can right-click the member, point to Drill, and click Down.
To expand-drill up a level in a crosstab
• Click the minus sign next to the member name.
The child members no longer appear in the view, and the minus signchanges to a plus sign.
Alternatively, you can right-click the member, point to Drill, and click Up.
To expand-drill down a level in a chart
1. If you want to drill down on a data series member, right-click one of thefollowing chart objects, depending on the type of chart:• line marker
• pie slice
• bar riser
• member in legend
BusinessObjects Voyager User's Guide 145
10Exploring Different Views of Your DataDrilling down and drilling up

Or, if you want to drill down on a category member, right-click a membercaption on the category axis. For definitions of data series and categorymembers, see Chart component reference on page 260.
2. Select Drill Down to display the child members.
You can continue drilling down into lower levels. When you have drilleddown as far as your data allows, the Drill Down option is unavailable.
To expand-drill up a level in a chart
1. Right-click one of the following chart objects, depending on the type ofchart:• line marker
• pie slice
• bar riser
• member in legend
• member caption on category axis
2. Select Drill Up to display the parent member.
The child members no longer appear in the view.
To focus-drill down a level in a crosstab
• Double-click the member you want to drill down.
The child members replace their parent.
Alternatively, you can right-click the member, point to Drill, and clickFocused Down.
To focus-drill up a level in a crosstab
• Hold down Shift and double-click the member you want to drill up.
The parent member and its siblings replace the child members.
146 BusinessObjects Voyager User's Guide
Exploring Different Views of Your Data10 Drilling down and drilling up

Alternatively, you can right-click the member, point to Drill, and clickFocused Up.
To focus-drill down a level in a chart
• To drill down on a data series member, double-click one of the followingchart objects, depending on the type of chart:• line marker
• pie slice
• bar riser
• member in legend
Or, to drill down on a category member, double-click a member captionon the category axis. For definitions of data series and category members,see Chart component reference on page 260.
You can continue drilling down into lower levels. When you have drilleddown as far as your data allows, the Drill Down option is unavailable.
Alternatively, you can right-click the chart object, and click Focused DrillDown.
To focus-drill up a level in a chart
• Hold down the Shift key, and double-click one of the following chartobjects, depending on the type of chart, to display the parent member:• line marker
• pie slice
• bar riser
• member in legend
• member caption on category axis
The child members no longer appear in the view.
Alternatively, you can right-click the chart object, and click Focused DrillUp.
BusinessObjects Voyager User's Guide 147
10Exploring Different Views of Your DataDrilling down and drilling up

Drilling through to underlying relationaldata
When you analyze OLAP data, you may want to explore data from theunderlying relational transactions that contributed to a particular cell value.To find out more about these transaction records, you can drill through.
Note:
• Drill-through capability is available only with Microsoft SQL Server 2000Analysis Services or later data sources.
• With Microsoft SQL Server 2000 Analysis Services, drill-through capabilitymust be enabled at the cube level by your database administrator. Also,you must be granted permission to perform a drill-through operation in acube role by the database administrator.
To drill through to relational data
• Right-click the cell representing the value you are interested in, and selectDrill Through.
If relational data is available, the underlying data appears in a new browserwindow.
148 BusinessObjects Voyager User's Guide
Exploring Different Views of Your Data10 Drilling through to underlying relational data

The relational table viewer
The relational table viewer displays the transaction data that results fromperforming the drill-through action.
You can page through the relational data using the buttons at the upper-rightcorner of the viewer.
Note: Jumping to the last page can take several minutes if the result setcomprises a very large number of records.
Exporting drill-through data
You can export the relational data to Microsoft Excel or to acomma-separated-values file (.csv).
To export data from the relational table viewer to Excel
1. In the relational table viewer, click Export and then select Excel.2. In the dialog box, specify whether you want to view the file or save the
file to disk, and then click OK.
If you choose to save the file to disk, specify the name and location ofthe file that you want to export your data to.
If you choose to view the file, it opens immediately in Excel.
To export data from the relational table viewer to a .csv file
1. In the relational table viewer, click Export and then select CSV.2. In the dialog box, specify whether you want to view the file or save the
file to disk, and then click OK.
If you choose to save the file to disk, specify the name and location ofthe file that you want to export your data to.
BusinessObjects Voyager User's Guide 149
10Exploring Different Views of Your DataDrilling through to underlying relational data

If you choose to view the file, it opens immediately in your .csv file viewer,which is Microsoft Excel by default.
Note: If you choose to export data to Excel from a published workspace,and then save the newly created Excel worksheet, the data is saved ona local hard disk rather than to BusinessObjects Enterprise.
Copying a component to comparevariations in data
You can copy a component to compare variations in data. For example, ifyou have a set of data displayed in a crosstab and chart, but you want tomake small adjustments to your view and compare the changes with youroriginal view, you can copy the components.
You can copy a component to the same page or to a different page. Whenyou copy components, the queries associated with the original componentsare also copied.
To copy a component
1. Select the component that you want to copy.2. Click Copy on the application toolbar.
Alternatively, you can press CTRL+C to copy the component.
3. Click Paste on the application toolbar to paste a copy of yourcomponent onto the current page.
Alternatively, you can press CTRL+V to paste the component.
If you want to paste the copied component onto another page, changeto a different page before you paste the component.
The copied component is added below or to the right of existingcomponents on the page.
150 BusinessObjects Voyager User's Guide
Exploring Different Views of Your Data10 Copying a component to compare variations in data

Resizing and moving componentsYou can drag any chart or crosstab component from its current position toany other valid position.
These are the valid positions:
BusinessObjects Voyager User's Guide 151
10Exploring Different Views of Your DataResizing and moving components
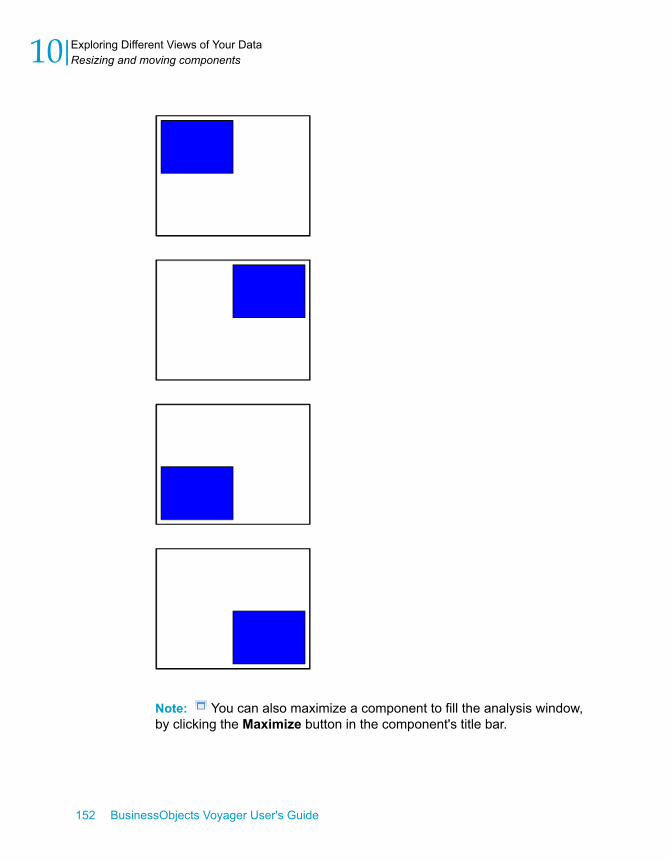
Note: You can also maximize a component to fill the analysis window,by clicking the Maximize button in the component's title bar.
152 BusinessObjects Voyager User's Guide
Exploring Different Views of Your Data10 Resizing and moving components

Formatting Crosstab Data
11

This section describes how to change the appearance of your data by addingformatting and by resizing rows and columns.
Formatting data in the crosstabYou can format your data to suit your analysis or presentation requirements.Formatting options include the following:
• Decimal places• Thousands separator• Appearance of negative values• Scale
Note on formatting
Formatting alters only the appearance of the data, not the value of the dataitself. For example, displayed data may be rounded off. To see the real valuesof the data, set the "Display formatted cell values" property to "No" on theProperties tab.
Thousands separator
You can display or suppress the thousands separator. For example, a valueof 1000 can be displayed as 1,000.
Negative values
You can configure how negative values are displayed. For example, you candisplay a negative value of 1000 as -1000 or (1000).
Decimal places
Although the default number of decimal places is 2, you can set this numberto be anything from 0 (show numbers as integers) to 99. Remember thatchanging the number of displayed decimal places does not affect the valueof the data.
Scale
You can scale the displayed values to make them easier to read in thecrosstab. For example, if a column contains several values between
154 BusinessObjects Voyager User's Guide
Formatting Crosstab Data11 Formatting data in the crosstab

5,000,000 and 20,000,000, you can select the Millions scale to display thosevalues as 5M to 20M.
To set the format of displayed data
1. Click the Formatting button on the application toolbar to open theFormatting Measures dialog box.
Note: Data must be present on the row and column axes before theFormatting button is enabled.
2. On the Type list, click the number format that you want to use.
The formatting options depend on the type that you selected:
Voyager uses the display format defined on the server.Server
You can set the number of decimal places, include a thou-sands separator, choose how negative values are displayed,or scale values.
Number
You can show values as percentages and set the numberof decimal places.Percentage
BusinessObjects Voyager User's Guide 155
11Formatting Crosstab DataFormatting data in the crosstab

You can show values in scientific notation and set the num-ber of decimal places.Scientific
3. Set the options and then click OK to apply the formatting to the data.
Resizing columnsCrosstab column widths are defined by the Column Width property on theProperties tab. If the default width obscures member headings or restrictsthe number of cells displayed in the crosstab, you may want to resize thecolumns.
To resize a column
1. Point to a column heading separator; the resize symbol appears:
2. Drag the separator to the column width you require.
You can also set the column width on the Properties tab. Changing thissetting applies the new column width to all columns, and overrides anyresizing previously applied to individual columns.
Resizing rowsCell data may span multiple lines. You can resize rows to show all the datawithin a cell.
To resize a row
1. Point to a row heading separator; the resize symbol appears:
156 BusinessObjects Voyager User's Guide
Formatting Crosstab Data11 Resizing columns

2. Drag the separator to the row height you require.
You can also set the row height on the Properties tab. Changing thissetting applies the new row height to all rows, and overrides any resizingpreviously applied to individual rows.
BusinessObjects Voyager User's Guide 157
11Formatting Crosstab DataResizing rows

158 BusinessObjects Voyager User's Guide
Formatting Crosstab Data11 Resizing rows

Using Pages in theWorkspace
12

This section shows you how to use multiple pages in your Voyagerworkspaces.
Working with pages in the workspaceA Voyager workspace contains multiple pages, with the default workspacecontaining three pages.
Pages are useful for grouping related analyses together in one workspace.For example, one Voyager workspace might represent the solution to aparticular problem, with each page representing a step in the solution.
You navigate between pages by using the page tabs and paging control atthe bottom of the analysis window. Pages can be renamed, added, copied,and removed by right-clicking a page tab.
When you save your workspaces, the active page status and the state ofthe tab panel are preserved. For example, if you save a workspace with page3 active, page 3 will be active the next time the workspace is opened, andthe tab panel will reflect the metadata and queries on page 3.
Note: Each page has its own set of queries and components, which are notshared and which cannot be linked across pages. Queries and componentson one page can therefore have the same names as queries and componentson other pages.
Related Topics• Inserting and deleting pages on page 160• Modifying page captions on page 161• Navigating to a page in the workspace on page 162• Copying a component to compare variations in data on page 150
Inserting and deleting pagesAlthough a workspace always contains at least one page, you can add asmany pages as you want, and delete any pages that you no longer want.
160 BusinessObjects Voyager User's Guide
Using Pages in the Workspace12 Working with pages in the workspace

To insert a page
1. Right-click a page tab.2. Select Insert After.
A new page is created and a new page tab is inserted to the right of thepage tab that you clicked. The new page becomes the active page.
To delete a page
1. Right-click the page tab corresponding to the page you want to remove.2. Select Delete.
If the page to be deleted contains a crosstab or chart component, aconfirmation dialog box appears. Click Yes to confirm the page deletion.
If the deleted page was the active page, the page to the left of the deletedpage becomes the active page.
Modifying page captionsPage captions appear in the page tabs at the bottom of the analysis window.When you create a new workspace, or add a new page to a workspace,Voyager adds a default caption; however, you can change these captions.
To change a page caption
1. Right-click the page tab and select Rename.
The caption text is highlighted and ready to be edited.
2. Type a new caption for the page.
Note: The maximum length of a caption is 60 characters.
3. Click outside the page tab, or press Enter to save the changed caption.
BusinessObjects Voyager User's Guide 161
12Using Pages in the WorkspaceModifying page captions

Navigating to a page in the workspaceIf you have created multiple pages in your workspace, you can navigatebetween the pages by using the page tabs and paging control at the bottomof the analysis window.
162 BusinessObjects Voyager User's Guide
Using Pages in the Workspace12 Navigating to a page in the workspace

Saving and SharingVoyager Workspaces
13

This section shows you how to save your Voyager workspaces and sharethem with other users.
Saving Voyager workspacesBusinessObjects Voyager saves its workspaces to the BusinessObjectsEnterprise repository. From the repository, you can open your workspacesvia the web, from any machine that has an internet connection.
You can choose to save your changes to the existing workspace, or to savethe modified workspace as a new workspace in the repository.
Note: To save a workspace to the BusinessObjects Enterprise repository,you must have sufficient rights. See your system administrator if you are notsure whether you have such rights.
If you leave your workspace idle, Voyager automatically saves the workspaceto your Favorites folder as "Voyager autosave" before your sessionterminates. Typically, a session is terminated after approximately 20 minutesof inactivity, unless your system administrator has set the timeout durationto a different value.
Note: Because the "Voyager autosave" workspace is overwritten every timea workspace is automatically saved, you should manually save workspacesthat you want to keep, with unique filenames.
In addition to saving workspaces, you can also export data from Voyagerworkspaces to Microsoft Excel or to a comma-separated-values file.
Related Topics• Exporting Data to Microsoft Excel or Comma-Separated-Values (.csv)Files on page 173
To save a newly created workspace
1. On the application toolbar, click Save.
164 BusinessObjects Voyager User's Guide
Saving and Sharing Voyager Workspaces13 Saving Voyager workspaces

2. Type a new title and select a location to save the workspace to.
In the Location area of the Save Document page, browse to the folderwhere you want to save your workspace. The default folder is yourFavorites folder.
You can also enter the following optional information:
• A description of the workspace.
• One or more keywords to serve as search criteria.
3. If desired, select the categories to which you want to save the workspace.
For information on using and managing categories, consult yourBusinessObjects Enterprise documentation.
4. Click OK.
BusinessObjects Voyager User's Guide 165
13Saving and Sharing Voyager WorkspacesSaving Voyager workspaces

To save your changes as a new workspace
1. On the application toolbar, click the arrow beside the Save button,and choose Save As.
2. Type a new title and select a location to save the workspace to.
In the Location area of the Save Document page, browse to the folderwhere you want to save your workspace. The default folder is yourFavorites folder.
You can also enter the following optional information:
• A description of the workspace.
• One or more keywords to serve as search criteria.
3. If desired, select the categories to which you want to save the workspace.
For information on using and managing categories, consult yourBusinessObjects Enterprise documentation.
4. Click OK.
To save changes to your existing workspace
• On the application toolbar, click Save.
Related Topics• Sending a Voyager workspace to another user on page 168
Automatically saved workspaces
When your workspace has been idle for several minutes, Voyagerautomatically saves a copy of the workspace to your Favorites folder beforeyour session terminates.
If you then return to your session before the session is terminated, theauto-save cycle is reset, and your workspace is auto-saved again the nexttime your workspace becomes idle for several minutes.
166 BusinessObjects Voyager User's Guide
Saving and Sharing Voyager Workspaces13 Saving Voyager workspaces

Saving Voyager workspaces for sharing with others
If you want to share your Voyager workspaces over the web with otheranalysts and end users, you can save your workspaces to a public folder inthe BusinessObjects Enterprise repository.
Note: To save a workspace to a public folder in the BusinessObjectsEnterprise repository, you must have sufficient rights. See your systemadministrator if you are not sure whether you have such rights.
To save your workspace in a public folder
1. On the application toolbar, click the arrow beside the Save button,and choose Save As.
2. Type a title for your workspace.3. In the Location area of the Save Document page, expand the Public
Folders folder and browse to the folder where you want to save yourworkspace.
You can also enter the following optional information:
• A description of the workspace.
• One or more keywords to serve as search criteria.
4. If desired, select the categories to which you want to save the workspace.
For information on using and managing categories, consult yourBusinessObjects Enterprise documentation.
5. Click OK.
Related Topics• Saving Voyager workspaces on page 164• Sending a Voyager workspace to another user on page 168
BusinessObjects Voyager User's Guide 167
13Saving and Sharing Voyager WorkspacesSaving Voyager workspaces

Sending aVoyagerworkspace to anotheruser
If you have sufficient rights, you can send a saved workspace to anotherBusinessObjects Enterprise user or to an email recipient.
Send functionality exists as a regular part of InfoView. You can send Voyagerworkspaces to these destinations:
• InfoView Inbox.
• Email address (either as a link to the workspace, or as an attachment).
Note: To send a Voyager workspace to another user or an email recipient,you must first save it to the repository.
For more information on sending workspaces from InfoView, see theBusinessObjects Enterprise InfoView User's Guide.
Related Topics• Saving Voyager workspaces on page 164
Sending a Voyager workspace to anotherBusinessObjects Enterprise user
You can send a workspace to another BusinessObjects Enterprise user'sInbox. You can send either a copy of the workspace file itself, or a shortcutto the workspace in the BusinessObjects Enterprise repository.
To send a workspace to a BusinessObjects Enterprise user
1. In the Document List in InfoView, navigate to the folder that contains theworkspace that you want to send.
2. Select the workspace.3. Click Send To.4. Select Business Objects Inbox.5. If you want to specify the Inboxes to send the workspace to, clear the
Use the Job Server's defaults option.
168 BusinessObjects Voyager User's Guide
Saving and Sharing Voyager Workspaces13 Sending a Voyager workspace to another user

Or, if you want to send the workspace to the Inboxes that are configuredon the BusinessObjects Enterprise Job Server, select the "Use the JobServer's defaults" option. Then skip to step 9.
6. Add recipients to the Selected Recipients list.7. Select a target name for the workspace.8. Select the Shortcut option to send the workspace as a hyperlink, or select
the Copy option to send the workspace as a file attachment.9. Click Submit to send the workspace.
For more information on sending objects from InfoView, see theBusinessObjects Enterprise InfoView User's Guide.
To send a workspace to an email recipient
1. In the Document List in InfoView, navigate to the folder that contains theworkspace that you want to send.
2. Select the workspace.3. Click Send To.4. Select Email.
Note: If you receive this error message: "The destination pluginrequired for this action is disabled. If you require this functionality,please contact your system administrator", inform your systemadministrator that the BusinessObjects Enterprise Destination Job Serverhas not been configured.
5. If you want to specify the email address to send the workspace to, clearthe Use the Job Server's defaults option.
Or, if you want to send the workspace to the email address that isconfigured on the BusinessObjects Enterprise Job Server, select the "Usethe Job Server's defaults" option. Then skip to step 7.
6. Enter the appropriate parameters.7. Click Submit to send the email.
For more information on sending objects from InfoView, see theBusinessObjects Enterprise InfoView User's Guide.
BusinessObjects Voyager User's Guide 169
13Saving and Sharing Voyager WorkspacesSending a Voyager workspace to another user

Sending a Voyager workspace to an email recipient
You can send your workspace to an email recipient by including a hyperlinkto the workspace in the email.
Opening an existing Voyager workspaceIf you have already saved workspaces to the BusinessObjects Enterpriserepository, you can open any of these workspaces for further editing. Or, ifother analysts have saved workspaces to public folders in the repository,you can open these workspaces as well.
To open an existing Voyager workspace
1. Start the Java version of InfoView and log on.For information about logging on to InfoView, see the BusinessObjectsEnterprise InfoView User's Guide.
2. In the Document List in InfoView, locate the workspace that you want toopen.
You can browse through the repository folders or within categories.
You can also search for workspaces by keyword, title, description, andother parameters. For more information on searching for objects in therepository, see the BusinessObjects Enterprise InfoView User's Guide.
3. Double-click the workspace name to open it.
170 BusinessObjects Voyager User's Guide
Saving and Sharing Voyager Workspaces13 Opening an existing Voyager workspace

If none of the connections used on the current page of the workspacerequire you to enter your authentication credentials, the workspace opensat the current page.
If any of the connections used on the current page require yourauthentication credentials, you are prompted for your logon credentials.Type your credentials and click OK to log on to each data connection.Or, if you have more than one connection and you want to log on withthe same credentials for all connections on the current page, select "Applythese credentials to all connections on the same page" before you clickOK.
If your authentication for all connections on the page succeeds, theconnections are set to "active" status, all queries on the page areexecuted, and the workspace opens at the current page.
If authentication fails, see Re-establishing a disabled connection onpage 294, or see your system administrator. Your credentials may not beset up properly in the Central Management Console, or the OLAP servermay be offline.
Note: When you navigate to other pages in the workspace, you may beprompted for your credentials again if components on those pages arelinked to other connections that require authentication.
Using openDocument to shareworkspaces
In some types of Business Objects documents, for example Crystal Reportsand Web Intelligence documents, you can create hyperlinks to Voyagerworkspaces.
Use the openDocument function to create these hyperlinks. For moreinformation about using openDocument, see the "Viewing Reports andDocuments using URLs" section of the COM Developer Guide and APIReference or .NET Developer Guide and API Reference, included withBusinessObjects Enterprise.
Example URL syntax for openDocumenthttp://<server>:8080/OpenDocument/opendoc/openDocument.jsp?sType=amw&sIDType=InfoObject&sPath=<path>&sDocName=<doc
BusinessObjects Voyager User's Guide 171
13Saving and Sharing Voyager WorkspacesUsing openDocument to share workspaces

umentname>
Note:
• Replace <server> with the name of the machine that houses theBusinessObjects Enterprise repository where the Voyager workspace isstored.
• Replace <path> with the path to the workspace in the repository. Forexample, if your workspace is stored in your My Favorites folder, youwould replace <path> with My+Favorites.
• Replace <document name> with the name of the workspace in therepository.
172 BusinessObjects Voyager User's Guide
Saving and Sharing Voyager Workspaces13 Using openDocument to share workspaces

Exporting Data to MicrosoftExcel orComma-Separated-Values(.csv) Files
14

This section describes how to export data to Microsoft Excel or tocomma-separated values (.csv) files.
Exporting data from Voyager to ExcelYou can export data from Voyager queries to Microsoft Excel, to allow Excelusers to share your data. The data can either be viewed immediately in Excel,or saved to an .xls file that can be opened with Excel or third-partyapplications. To view your data immediately in Excel, you must have Excelalready installed on your machine.
Data is exported in the orientation displayed in the crosstab. If the query hasonly a chart component associated with it, data from that query is exportedbut the chart visualization is not. Rows in the exported file correspond torows in the crosstab, or data series in the chart. Columns in the exported filecorrespond to columns in the crosstab, or categories in the chart.
Sorts, filters, and ranks are preserved in the exported data. Calculated datais exported, but the calculation formulas are not preserved.
To export data from Voyager to Excel
1. Go to the page that contains the component whose data you want toexport, and select the component.
2. On the application toolbar, click Export.3. In the dialog box, specify whether you want to view the file or save the
file to disk, and then click OK.
If you choose to save the file to disk, specify the name and location ofthe file that you want to export your data to.
If you choose to view the file, it opens immediately in Excel.
Note: The Export button is disabled until the current page contains avalid query.
174 BusinessObjects Voyager User's Guide
Exporting Data to Microsoft Excel or Comma-Separated-Values (.csv) Files14 Exporting data from Voyager to Excel

Exporting data from Voyager tocomma-separated-values (.csv) files
You can export data from Voyager queries to comma-separated-value format,to allow users of other applications to share your data. The comma-separatedvalues can either be viewed immediately in an application such as Excel, orsaved to a .csv file.
Data is exported in the orientation displayed in the crosstab. If the query hasonly a chart component associated with it, data from that query is exportedbut the chart visualization is not. Rows in the exported file correspond torows in the crosstab, or data series in the chart. Columns in the exported filecorrespond to columns in the crosstab, or categories in the chart.
Sorts, filters, and ranks are preserved in the exported data. Calculated datais exported, but the calculation formulas are not preserved.
To export data from Voyager to a .csv file
1. Go to the page that contains the component whose data you want toexport, and select the component.
2. On the application toolbar, click the arrow beside the Export button,and select CSV.
3. In the dialog box, specify whether you want to view the file or save thefile to disk, and then click OK.
If you choose to save the file to disk, specify the name and location ofthe file that you want to export your data to.
If you choose to view the file, it opens immediately in your .csv file viewer,which is Microsoft Excel by default.
Note: The Export button is disabled until the current page contains avalid query.
BusinessObjects Voyager User's Guide 175
14Exporting Data to Microsoft Excel or Comma-Separated-Values (.csv) FilesExporting data from Voyager to comma-separated-values (.csv) files

176 BusinessObjects Voyager User's Guide
Exporting Data to Microsoft Excel or Comma-Separated-Values (.csv) Files14 Exporting data from Voyager to comma-separated-values (.csv) files

Printing
15

This section shows you how to print your Voyager workspaces.
Printing Voyager workspacesAlthough Voyager is primarily an analysis tool, you may want to print yourworkspace pages for sharing your analyses with colleagues. Using the printingcapability in Voyager, you can do the following:
• Print raw data on page 179
• Print a crosstab as it appears on the screen on page 180
• Print a chart as it appears on the screen on page 181
Voyager creates a PDF representing the data or components that you wantto print, and opens it in a new browser window using your default PDF viewer.You can then print hard copies of the data from the PDF viewer.
Note: A component must have dimensions on both of its view axes beforeit appears in the list of components in the Print dialog box.
178 BusinessObjects Voyager User's Guide
Printing15 Printing Voyager workspaces

Name and Comments from the Properties tab
When you print chart and crosstab components, the names of the componentsare printed in the page headers. If you have added comments to anycomponents, the comments are printed in the page footers. For moreinformation about names and comments, see Properties tab on page 231.
Formatted values or actual values
From the Properties tab in the tab panel, you can control whether formattedvalues or actual values are displayed in the crosstab. When you print acrosstab, the formatting of the cell values in the print output matches theon-screen display.
Related Topics• Print options on page 182
Print raw dataYou can choose to print raw data instead of the crosstab or chartrepresentations of your data. If you have a crosstab associated with yourquery, the crosstab formatting is not applied. Data is formatted to fit the pagesize and page orientation print options that you select. For more informationabout print options, see Print options on page 182.
To print raw data to a PDF
1. Click Print on the application toolbar.2. Select Data.3. Select the component that you want to print data from in the list in the
Print Range area.4. Choose your print options.
For descriptions of the available print options, see Print options onpage 182.
5. Click OK.
BusinessObjects Voyager User's Guide 179
15PrintingPrint raw data

Your data is converted to a PDF and opened in a new browser windowusing your default PDF viewer. You can then print hard copies of the datafrom the PDF viewer.
Related Topics• Print a crosstab as it appears on the screen on page 180• Print a chart as it appears on the screen on page 181• Print options on page 182
Print a crosstab as it appears on the screenWhen you print a crosstab component, it appears as it appears on screen,with minor exceptions. The crosstab is sized to fill the available space onthe page, while preserving its aspect ratio.
The crosstab's name, as defined on the Properties tab, is printed above thecrosstab. If comments are defined on the Properties tab, they are printedbelow the crosstab.
Crosstab formatting included in print output
The following crosstab formatting is preserved in the print output:
• Exception highlighting colors.
• Cell formatting; both the number formatting and the style (such as negativenumbers shown in red).
• Dimension and level coloring.
• Any column or row resizing.
• Member indenting.
• Member aliases.
Member drill indicators (plus and minus signs) are not shown in the printoutput.
Member headings that don't fit within the column widths may be truncateddifferently from how they are truncated on screen.
180 BusinessObjects Voyager User's Guide
Printing15 Print a crosstab as it appears on the screen

Column and row sizes in print output
You may have resized some of the columns or rows in the crosstab. Whenyou print the crosstab, all rows and columns are scaled by the same amount,so any resizing that you have applied is preserved, relative to the sizes ofother rows and columns.
To print a crosstab to a PDF
1. Click Print on the application toolbar.2. Select Component.3. Select the component that you want to print from the list in the Print Range
area.4. Choose your print options.
For descriptions of the available print options, see Print options onpage 182.
5. Click OK.
Your data is converted to a PDF and opened in a new browser windowusing your default PDF viewer. You can then print hard copies of the datafrom the PDF viewer.
Related Topics• Print raw data on page 179• Print a chart as it appears on the screen on page 181• Print options on page 182
Print a chart as it appears on the screenWhen you print a chart component, it appears as it appears on screen, withminor exceptions. The chart is sized to fill the available space on the page,while preserving its aspect ratio.
The chart's name, as defined on the Properties tab, is printed above thechart. If comments are defined on the Properties tab, they are printed belowthe chart.
BusinessObjects Voyager User's Guide 181
15PrintingPrint a chart as it appears on the screen

To print a chart to a PDF
1. Click Print on the application toolbar.2. Select Component.3. Select the component that you want to print from the list in the Print Range
area.4. Choose your print options.
For descriptions of the available print options, see Print options onpage 182.
5. Click OK.
Your data is converted to a PDF and opened in a new browser windowusing your default PDF viewer. You can then print hard copies of the datafrom the PDF viewer.
Related Topics• Print raw data on page 179• Print a crosstab as it appears on the screen on page 180• Print options on page 182
Print optionsThese print options are available:
DescriptionOption
Choose from these paper sizes: Letter, Legal, A4, andA3.Paper Size
Select one of the available fonts. The fonts availablein the Print dialog box and in the chart Properties tabare default fonts. Your system administrator can en-able additional fonts.For more information on fonts, see Font on page 274.
Font
Select Landscape or Portrait orientation.Page Orientation
182 BusinessObjects Voyager User's Guide
Printing15 Print options

DescriptionOption
When you print a crosstab, you can choose the printorder of pages:• Down then over (default).
• Over then down.
For example, you might choose "Over thendown" so that all columns in the crosstab appearon consecutive pages.
Print Direction
Related Topics• Print raw data on page 179• Print a crosstab as it appears on the screen on page 180• Print a chart as it appears on the screen on page 181
BusinessObjects Voyager User's Guide 183
15PrintingPrint options

184 BusinessObjects Voyager User's Guide
Printing15 Print options

Using Voyager withMicrosoft SQL Server 2005Analysis Services
16

This section describes how to use BusinessObjects Voyager to takeadvantage of new features in Microsoft SQL Server 2005 Analysis Services.
Overview of Microsoft SQL Server 2005Analysis Services
BusinessObjects Voyager can connect to Microsoft SQL Server 2005 AnalysisServices data sources and can take advantage of new features in AnalysisServices 2005 such as perspectives and display folders. This sectiondescribes these features and shows you how to use them in your Voyagerworkspaces. Some definitions are included to help you understand AnalysisServices 2005 terminology.
Dimensions
Dimensions in Analysis Services 2005 are collections of hierarchies.
Hierarchies
Attributes are the building blocks of dimensions, and are used in AnalysisServices 2005 to organize measures contained in a cube.
In Analysis Services 2005, a dimension is a collection of attributes thatdescribe the data that is provided by the tables in a data source view.
A business user cannot see the attributes in a dimension from a clientapplication such as Voyager. The attributes must first be organized intohierarchies before their members can be navigated in a cube.
Two types of hierarchies can be created from attributes: attribute hierarchiesand user hierarchies.
• An attribute hierarchy is created for every attribute in a dimension, andhas the same name as the attribute. The attribute hierarchy enables usersto browse the members of an attribute.
An attribute hierarchy has only one level. Attribute hierarchies ensurethat a cube's cells can be referenced without relying on user hierarchies,so that security and calculations are independent of a cube's navigationpaths. To the business user, an attribute hierarchy appears no differentfrom hierarchies that you create, and allows business users to browsemembers of an attribute.
186 BusinessObjects Voyager User's Guide
Using Voyager with Microsoft SQL Server 2005 Analysis Services16 Overview of Microsoft SQL Server 2005 Analysis Services

Attribute hierarchies replace the concept of virtual dimensions found inearlier versions of Analysis Services.
• A user hierarchy is any hierarchy other than an attribute hierarchy. A userhierarchy is composed of attributes that are organized into levels thatprovide navigation paths in a cube. The member structures of userhierarchies can take one of four basic forms, depending on how membersare related to each other:
• Balanced hierarchies
• Unbalanced hierarchies
• Ragged hierarchies
• Parent-child hierarchies
Because user hierarchies, unlike attribute hierarchies, can contain manylevels, they are often referred to as multilevel hierarchies.
Fact tables
A fact table is a database table that contains measures or metrics of abusiness process. For example, a fact table for a grocery store might includemeasures such as Sales, Inventory, and Profit.
Dimension tables
A dimension table is a database table that contains attributes that describethe business entities of an enterprise. The attributes are used by data analyststo constrain and group database queries. For example, a Store table mightinclude store locations and sizes.
Measure groups
A measure group contains one or more measures from the same fact table.All Analysis Services 2005 cubes and perspectives contain at least onemeasure group.
In Voyager, measure groups are shown on the Data tab only; they do notappear in the Member Selector. Also, you cannot select a measure group;only the members within a group.
BusinessObjects Voyager User's Guide 187
16Using Voyager with Microsoft SQL Server 2005 Analysis ServicesOverview of Microsoft SQL Server 2005 Analysis Services

Display folders
Display folders are optional folders that can be configured on the AnalysisServices server to organize hierarchies into folder structures. The folderstructures make it easier for users to navigate the hierarchies grouped undera single dimension from a client application.
In Voyager, display folders are shown on the Data tab only; they do notappear in the Member Selector. Also, you cannot select a display folder; onlythe hierarchies within the display folders.
Perspectives
Cubes can be very large and thus difficult to navigate in SQL Server AnalysisServices. A single cube can represent the contents of an entire datawarehouse, with each measure group in a cube representing a single facttable, and each dimension representing a dimension table in the datawarehouse. This prospect can be daunting to users, who often need tointeract with only a small portion of a cube to satisfy their business intelligenceand reporting requirements.
In Analysis Services 2005, a perspective can reduce the perceived complexityof a cube by allowing you to define a viewable subset of the cube. Theperspective's definition controls which objects in a cube are visible to abusiness intelligence application.
Voyager treats perspectives as regular cubes. For example, perspectivesappear as regular cubes when you create a new connection in the CentralManagement Console.
Related Topics• Using Analysis Services 2005 hierarchies in Voyager on page 188
Using Analysis Services 2005 hierarchiesin Voyager
Voyager treats attribute and user hierarchies in Analysis Services 2005 asdimensions.
188 BusinessObjects Voyager User's Guide
Using Voyager with Microsoft SQL Server 2005 Analysis Services16 Using Analysis Services 2005 hierarchies in Voyager

Using Voyager with SAP
17

This section discusses the features available as part of Voyager's integrationwith SAP.
Note: An SAP dimension is a collection of SAP hierarchies. However, in theVoyager documentation set, the term “dimension”is used to refer to groupsof members. Therefore, a Voyager dimension is equivalent to an SAP“hierarchy”, although Voyager still respects the SAP dimension/hierarchygroupings.
Logging on to SAPLogging on to SAP is the same as logging on to any other data source, withthe exception that if there are variables requiring user entry, the Set Variablesdialog box opens so that you can select values for the variables.
The Set Variables dialog box contains at least one row, and can containseveral, depending on the complexity of the data structure and the numberof variables set up by the SAP administrator in the SAP query cube. Eachrow represents a different variable.
190 BusinessObjects Voyager User's Guide
Using Voyager with SAP17 Logging on to SAP

Depending on the type of variable, there may be additional controls. Forexample, characteristic selection (complex) variables require an operator forcomparison to a value, so you must indicate the operator and the variablevalue.
If default or personalized variables are set up, rows of the Set Variablesdialog box may already contain values. You can accept these values, or youcan select different values.
Note: There are terminology differences between SAP data sources andthe Voyager interface. In references to SAP data, the SAP-specific term"hierarchy" is used in place of the Voyager-centric equivalent term"dimension". In addition, data from more than one hierarchy, or data from adimension is returned to the Voyager interface as a single hierarchy.
Related Topics• Using variables on page 191
Member Selector with SAP data
Although you can type in the member key of the variable, you can also selectnew values using the Member Selector.
The Member Selector has all the same functionality for SAP queries as forany other Voyager query. For more information about the Member Selector,see Selecting Members to Display in Crosstabs and Charts on page 77.
Related Topics• Logging on to SAP on page 190• Using variables on page 191• Compounded characteristics on page 202• Mutually exclusive hierarchies on page 203• Unbalanced and ragged hierarchies on page 203
Using variablesVariables are defined by SAP administrators on the underlying data in anSAP query cube. When you select a hierarchy or set of members with definedvariables to display in Voyager, you must first select values to act as filterson the data that is returned and displayed.
BusinessObjects Voyager User's Guide 191
17Using Voyager with SAPUsing variables
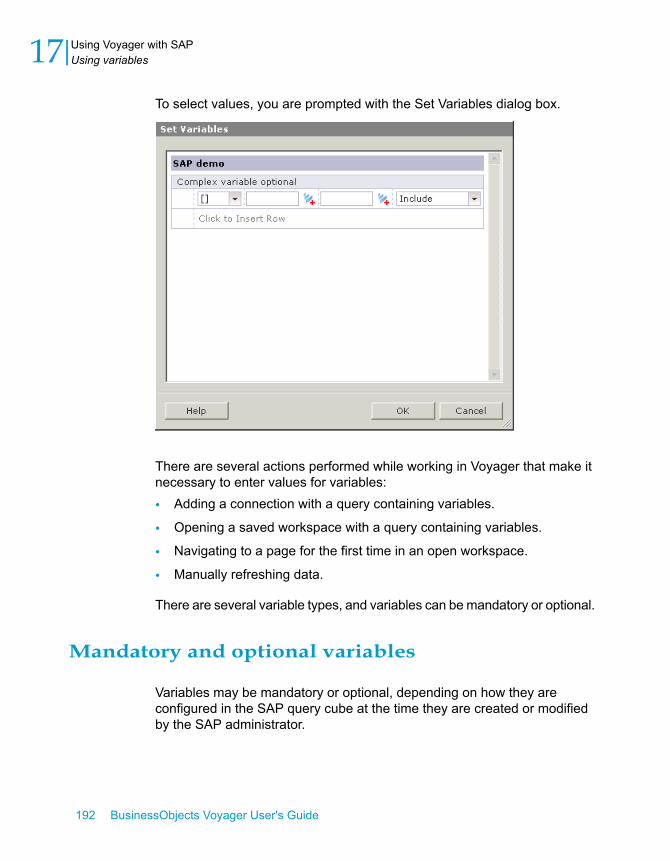
To select values, you are prompted with the Set Variables dialog box.
There are several actions performed while working in Voyager that make itnecessary to enter values for variables:
• Adding a connection with a query containing variables.
• Opening a saved workspace with a query containing variables.
• Navigating to a page for the first time in an open workspace.
• Manually refreshing data.
There are several variable types, and variables can be mandatory or optional.
Mandatory and optional variables
Variables may be mandatory or optional, depending on how they areconfigured in the SAP query cube at the time they are created or modifiedby the SAP administrator.
192 BusinessObjects Voyager User's Guide
Using Voyager with SAP17 Using variables

If variables are set up to be mandatory, initial values may be allowed. Formore information about mandatory variables and initial values, seeMandatoryvariables on page 193.
If variables are set up to be optional, default or personalized values are alsoset up for those variables.
Mandatory variables
Mandatory variables are variables that you must provide a value for whenthe Set Variables dialog box opens. Mandatory variables are denoted withan asterisk next to their name. If you do not enter a value and attempt tocontinue, Voyager alerts you and presents the Set Variables dialog box againwith warning flags next to mandatory variables.
Mandatory initial values
If allowed, an initial value, denoted with a number sign ("#") can be selectedfrom the Member Selector in the Set Variables dialog box. This explicitlyselects all data records, including those which do not correspond to a memberon the hierarchy.
Mandatory initial values not allowed
Initial values may not be allowed to be selected. In this case, a hash mark("#") does not appear in the Member Selector in the Set Variables dialogbox. If you type this character and attempt to continue, Voyager alerts youand presents the Set Variables dialog box again with warning flags next tothe mandatory variables where initial values are not allowed.
Related Topics• Optional variables on page 193• Default and personalized values for variables on page 194
Optional variables
Optional variables are variables which you do not have to select values forwhen prompted. Queries with optional variables you do not select values forreturn data based on either personalized values or default values, dependingon which of those two types of values have been set up for the variable.
BusinessObjects Voyager User's Guide 193
17Using Voyager with SAPUsing variables

Related Topics• Default and personalized values for variables on page 194• Mandatory variables on page 193
Default and personalized values for variables
Variables may be set up by the SAP administrator to have either default orpersonalized values. Default or personalized values will be used wheneveryou do not select a value for variables that have default or personalizedvalues.
Default values
Default values are values that Voyager automatically selects if they weredefined by the SAP administrator for a variable in the Set Variables dialogbox.
Default values are set up by an SAP administrator at the time the variablesare created or modified. Default values are the same for all users.
You cannot set default values for variables through Voyager.
Personalized values
Personalized values are similar to default values, except personalized valuesare visible to only you and no other users. Other users may have their ownpersonalized values; however, you cannot see them. If you have personalizedvalues that also have default values, your personalized values are used.
Voyager does not allow you to set personalized values; it only displays yourpersonalized values. See your SAP administrator to learn how to setpersonalized values for variables.
Related Topics• Optional variables on page 193• Mandatory variables on page 193
194 BusinessObjects Voyager User's Guide
Using Voyager with SAP17 Using variables
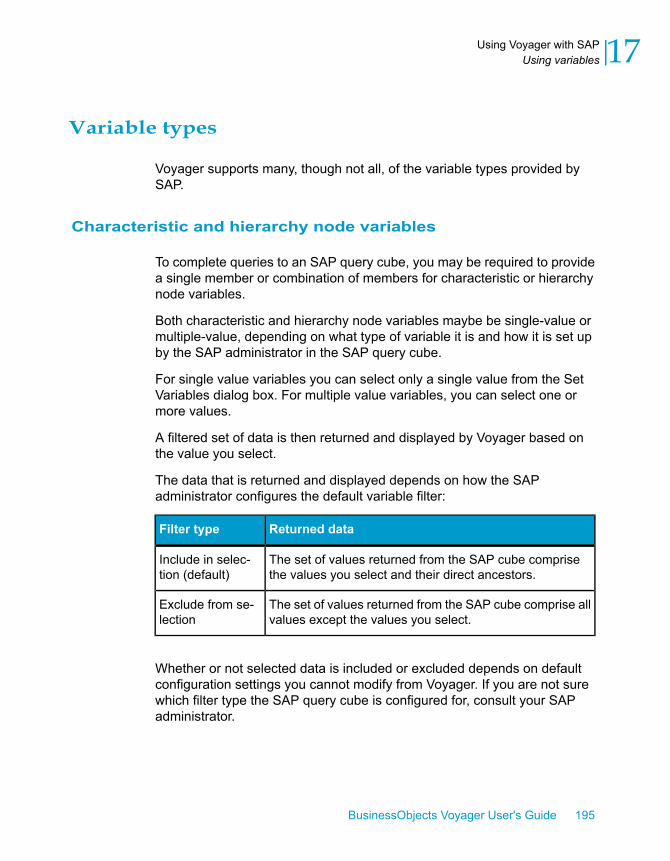
Variable types
Voyager supports many, though not all, of the variable types provided bySAP.
Characteristic and hierarchy node variables
To complete queries to an SAP query cube, you may be required to providea single member or combination of members for characteristic or hierarchynode variables.
Both characteristic and hierarchy node variables maybe be single-value ormultiple-value, depending on what type of variable it is and how it is set upby the SAP administrator in the SAP query cube.
For single value variables you can select only a single value from the SetVariables dialog box. For multiple value variables, you can select one ormore values.
A filtered set of data is then returned and displayed by Voyager based onthe value you select.
The data that is returned and displayed depends on how the SAPadministrator configures the default variable filter:
Returned dataFilter type
The set of values returned from the SAP cube comprisethe values you select and their direct ancestors.
Include in selec-tion (default)
The set of values returned from the SAP cube comprise allvalues except the values you select.
Exclude from se-lection
Whether or not selected data is included or excluded depends on defaultconfiguration settings you cannot modify from Voyager. If you are not surewhich filter type the SAP query cube is configured for, consult your SAPadministrator.
BusinessObjects Voyager User's Guide 195
17Using Voyager with SAPUsing variables

Hierarchy node variables
Hierarchy node variables are defined on a custom multi-level hierarchy.These custom hierarchies are created on the SAP query cube by an SAPadministrator.
When you are prompted by the Set Variables dialog box, you select a singleor multiple members from the custom hierarchy.
Characteristic variables
Characteristic variables are defined on the default flat hierarchies of adimension. There are different types of characteristic variables.
When you are prompted by the Set Variables dialog box, you select a singleor multiple members to be returned from the default flat hierarchy.
Related Topics• Hierarchy variables on page 196• Characteristic interval (range) variables on page 197• Complex characteristic selection variables on page 197• More about variables on page 199
Hierarchy variables
A hierarchy variable can be defined by an SAP administrator on a dimensionin a query cube. Dimensions contain a hierarchy or multiple hierarchiesgrouped together into a single logical collection.
The hierarchy you select in the Set Variables dialog box restricts thehierarchies you can use on that dimension to the chosen hierarchy.
Hierarchy variables often come paired with hierarchy node variables, whereboth variables apply to the same dimension. The hierarchy node variablecan dynamically apply to whichever hierarchy has been selected for thehierarchy variable. In these cases, you make a selection for the hierarchyvariable before making a selection for the hierarchy node variable.
Related Topics• Characteristic and hierarchy node variables on page 195• More about variables on page 199
196 BusinessObjects Voyager User's Guide
Using Voyager with SAP17 Using variables

Characteristic interval (range) variables
Characteristic interval variables consist of two members that you select usingthe Set Variables dialog box. The two members create a range which is usedas a filter for the data returned and displayed in Voyager from the SAP querycube.
When selecting members, you must ensure that you create a valid range byspecifying a second member that occurs after the first selected member inthe hierarchy.
Related Topics• Characteristic and hierarchy node variables on page 195• Complex characteristic selection variables on page 197• More about variables on page 199
Complex characteristic selection variables
Complex characteristic selection variables allow you to select one or moreconditions from the Set Variables dialog box which are then used to filter thedata returned and displayed in Voyager from the SAP query cube.
The member(s) you indicate are used differently, depending on what typeof operation you select:
MeaningOperation
Display data from members whose values are between the valuesof the two members entered in the Set Variables dialog box.[ ]
Display data from members whose values are not between thevalues of the two members entered in the Set Variables dialog box.< >
Display data from members whose values are equal to the valueof the single member entered.=
Display data from members whose values are greater than thevalue of the single member entered.>
BusinessObjects Voyager User's Guide 197
17Using Voyager with SAPUsing variables

MeaningOperation
Display data from members whose values are less than the valueof the single member entered.<
Display data from members whose values are greater than or equalto the value of the single member entered.=>
Display data from members whose values are less than or equalto the value of the single member entered.<=
Related Topics• Characteristic and hierarchy node variables on page 195• Characteristic interval (range) variables on page 197• More about variables on page 199
Key date variables
Key date variables are single-value variable types where you can indicate aspecific date for the data you want to see (provided that data is configuredin the cube to be time-dependent). Time-dependent metadata is filteredbased on the key date variable.
Metadata can be configured in the SAP system to have a range of dates todetermine when it is valid. When you indicate a date in the key date variable,Voyager returns and displays only data that has a range containing the dateyou indicate.
The types of metadata that can be time-dependent are:
• Master data.
• Currency exchange rates.
• Hierarchies (an entire hierarchy can be configured so that it is valid onlyfor a period of time).
• Hierarchy members.
198 BusinessObjects Voyager User's Guide
Using Voyager with SAP17 Using variables

Key date variables with other variables in one query
Although you may be prompted to pass multiple variables to produce a query,Voyager supports only one key date variable in a query. Also, the value forthe key date variable must be specified first, because it limits the dataavailable to other variables.
Related Topics• More about variables on page 199
Formula variables
Formulas are calculations that may have been defined by an administratoron the key figures (or measures) hierarchy.
If Voyager requires you to enter a formula variable, you must enter anumerical value only. The value you enter is then used to complete theformula, and the data returned is the result of the formula.
Related Topics• More about variables on page 199
Currency variables
A currency variable is a special type of variable used to convert values basedon an exchange rate table. The exchange rates used to perform theconversion are set at the cube, and are not visible from Voyager.
Related Topics• More about variables on page 199
More about variables
There are methods of presenting and structuring data that are specific toSAP query cubes.
BusinessObjects Voyager User's Guide 199
17Using Voyager with SAPUsing variables

Variables in hidden hierarchies
The SAP administrator may set up hierarchies in the underlying SAP querycube so that they are not visible to you in Voyager. In situations where thereis hidden data, but you are prompted in the Set Variables dialog box toprovide variables to filter the data (including the hidden hierarchies), Voyagermay return and display data from those hidden hierarchies.
Variables in structures
The SAP administrator may set up variables in structures. A structure isdefined in an SAP query cube, and can contain a single dimension or multipledimensions.
Variables in restricted key figures
The SAP administrator may set up variables in restricted key figures. Arestricted key figure is a key figure (also known as a measure hierarchy) thatis filtered by a slice. The slice can be defined on one or more hierarchies.
You are prompted by the Set Variables dialog box to enter the value whichis then used by Voyager to filter ("restrict") the key figure.
Multiple structures
Voyager supports variables in multiple structures. For more than one structurein a cube, there are intersections of selections between the structures. Theintersecting cells can be filtered by a variable.
Related Topics• Using variables on page 191
200 BusinessObjects Voyager User's Guide
Using Voyager with SAP17 Using variables

Free characteristicsFree characteristics are areas of the SAP query cube where characteristicdimensions can be put. Free characteristic dimensions can contain filters,variables, and hierarchies. These dimensions are used for navigation.
In Voyager, these characteristics are treated as any other dimensions, andcannot be distinguished as free characteristics. Free characteristics appearand behave in Voyager as hierarchies.
Related Topics• Logging on to SAP on page 190• Member Selector with SAP data on page 191• Mutually exclusive hierarchies on page 203
Key figures and formatted valuesBy default, Voyager retrieves and displays formatted cell values. Key figures(measures hierarchies) that have been formatted to display a specific uniton the cube are displayed with the correct unit formatting in Voyager.
Related Topics• Logging on to SAP on page 190• Member Selector with SAP data on page 191
Formatting with no key figures
The SAP administrator can create an SAP query cube that has no visiblekey figures (no visible measures hierarchy). There is no measures formattingfor these query cubes because they contain no measures (or the measuresare not visible).
Related Topics• Logging on to SAP on page 190• Member Selector with SAP data on page 191
BusinessObjects Voyager User's Guide 201
17Using Voyager with SAPFree characteristics

Display attributesMembers have several string properties which are visible in Voyager:
• Key
• Short description
• Medium description
• Long description
• Key and short description
• Key and medium description
• Key and long description
These string properties can be viewed and changed from the Properties tabof the Tab panel.
Note: Key and text properties are concatenated into a single string, and aretherefore displayed in a single column or row caption field. They do notappear as separate columns or rows.
Compounded characteristicsAn SAP administrator can connect several characteristic dimensions togetherinto one entity, known as a compounded characteristic. Once thesedimensions are combined together, they can only be used in combination.
When a variable is created on top of a compounded characteristic, you canselect only the value using the combination of the compounded dimensions.You cannot select values from only one of the dimensions that make up thecompounded characteristic.
Related Topics• Logging on to SAP on page 190• Member Selector with SAP data on page 191• Mutually exclusive hierarchies on page 203
202 BusinessObjects Voyager User's Guide
Using Voyager with SAP17 Display attributes

Mutually exclusive hierarchiesIn SAP BW data sources, hierarchies that belong to the same dimension aremutually exclusive. For example, consider an SAP BW cube that contains adimensionCustomer that contains three hierarchies:Country_1,Country_2,and Country_3. Only one of these hierarchies can be included in a singlecrosstab or chart query. You cannot specify Country_1 on the row axis andCountry_3 on the slice axis in the same query.
Related Topics• Logging on to SAP on page 190• Member Selector with SAP data on page 191• Compounded characteristics on page 202• Unbalanced and ragged hierarchies on page 203
Unbalanced and ragged hierarchiesVoyager supports unbalanced and ragged hierarchies.
Related Topics• Logging on to SAP on page 190• Member Selector with SAP data on page 191• Mutually exclusive hierarchies on page 203
BusinessObjects Voyager User's Guide 203
17Using Voyager with SAPMutually exclusive hierarchies

204 BusinessObjects Voyager User's Guide
Using Voyager with SAP17 Unbalanced and ragged hierarchies

Using Voyager with OracleHyperion Essbase DataSources
18
This section describes how to use BusinessObjects Voyager to takeadvantage of extended features in Oracle Hyperion Essbase data sources.
Overview of Oracle Hyperion Essbasefeatures support in Voyager
Voyager contains an Essbase driver that can connect to Oracle HyperionEssbase data sources and take advantage of extended Essbase featuressuch as aggregate storage, attribute dimensions, Dynamic Time Series, andmultiple alias tables. This section describes these features and shows howyou can use them in your Voyager workspaces.
Note: Voyager supports connections to Essbase cubes that have MetaReadpermissions defined on members. Voyager respects the restrictions put inplace by such permissions, by limiting the members that users can see inthe metadata explorer and Member Selector. Any cells containing data thathas been restricted by MetaRead permissions, such as data for all ancestorsof a restricted member, appear as NULL cells (blank by default). This meansthat the default view of data is often blank, because the default memberselection consists of the top level parent members. Users can see data bychanging their member selection to members that don't have restricteddescendants.
Here are brief overviews of the extended Essbase features:
Aggregate storage
One strength of Essbase is in financial applications where the stored datain cubes is dense. The type of storage that is used for dense cubes is calledblock storage. To facilitate the use of Essbase in applications where the datais sparse, aggregate storage is used. Aggregate storage offers significantperformance improvements in applications with sparse data and candramatically reduce the amount of disk storage used.
Attribute dimensions
Attribute dimensions contain information that describes characteristics of thedata. Attribute dimensions cannot be used directly as standard dimensionsbut must be associated with standard dimensions.
206 BusinessObjects Voyager User's Guide
Using Voyager with Oracle Hyperion Essbase Data Sources18 Overview of Oracle Hyperion Essbase features support in Voyager

For example, a Product dimension could have an associated attributedimension with members such as color, size, and target market segment.
Dynamic Time Series
A time series such as Q1 (first quarter of the year) is a static time seriesbecause it aggregates data across a fixed set of calendar months. In contrast,a dynamic time series aggregates data up to the selected date.
Examples of dynamic time series are history-to-date, year-to-date,period-to-date, and month-to-date.
Multiple alias tables
An alias is an alternate name for a dimension member. An alias table mapsa specific set of alias names to the members in a dimension. Multiple aliastables enable the same dimension members to be referenced by differentnames.
For example, in a product dimension, the default member names might bethe product UPC codes. One alias table might show the product names whileanother alias table could show the internal stock codes. Thus, depending onthe application, the product dimension can be referred to in three differentways.
Related Topics• Attribute dimensions on page 207• Dynamic Time Series on page 212• Alias tables on page 213
Attribute dimensionsWith Oracle Hyperion Essbase Analytic Services, you can retrieve andanalyze data not only from the perspective of dimensions, but also in termsof characteristics, or attributes, of those dimensions. For example, you cananalyze product profitability based on size or packaging. Or you can reacha more effective conclusion from your analysis by incorporating a marketattribute such as the population size of each market region.
Such an analysis could tell you that decaffeinated drinks that are sold in cansin small markets are less profitable than you had anticipated.
BusinessObjects Voyager User's Guide 207
18Using Voyager with Oracle Hyperion Essbase Data SourcesAttribute dimensions

To get more detailed information, you can filter the analysis by specificattribute criteria, including minimum or maximum sales, and profits of differentproducts in similar market segments. To enable this type of analysis, youcreate attribute dimensions in the database outline.
Attribute dimensions capture the attributes of something else. They do notexist as dimensions on their own. An attribute dimension must be associatedwith a standard dimension. A standard dimension is any dimension that isnot tagged as an attribute dimension.
On the Data tab, attribute dimensions are differentiated from standarddimensions by displaying them with different icons:
dimension
attribute dimension
measures dimension
time dimension
Using attribute dimensions to filter data
You can filter the data for a base dimension by selecting a member of anassociated attribute dimension.
For example, if your base dimension is Product, and it has an associatedattribute dimension Caffeinated, you might select an attribute dimensionmember named Caffeinated_True. The viewpoint displays data for basedimension members that are associated with the selected attribute member.In this example, data is displayed for caffeinated drink products only. Nullvalues are displayed for decaffeinated drink products.
208 BusinessObjects Voyager User's Guide
Using Voyager with Oracle Hyperion Essbase Data Sources18 Attribute dimensions

To filter data by using an attribute dimension
1. Move the base dimension to either the row or column axis.
For example, you could move the Product dimension to an axis.
2. Move the attribute dimension to the slice axis.3. In the attribute dimension on the slice axis, select the member that you
want to filter on.
For example, you could select the Caffeinated_True member.
Note: If you select the parent member of the attribute dimension, whichin this case is Caffeinated, the crosstab displays data for base dimensionmembers associated with any of the attribute dimension's child members.
4. Close the Member Selector.
The crosstab displays data for base dimension members associated withonly the selected attribute member. In this example, data is displayed forcaffeinated drink products only. Null values are displayed fornon-caffeinated drink products.
BusinessObjects Voyager User's Guide 209
18Using Voyager with Oracle Hyperion Essbase Data SourcesAttribute dimensions

Attribute Calculations dimension
Normally, the value of a parent member is equal to the sum of the values ofits child members. For example, consider this simple cube view:
18books
7fiction
5reference
6history
210 BusinessObjects Voyager User's Guide
Using Voyager with Oracle Hyperion Essbase Data Sources18 Attribute dimensions

Books is the parent member; fiction, reference, and history are childmembers. The value of books is equal to the sum of the values of the childmembers.
When you use attribute dimensions to filter data for a base dimension, youcan also use the Attribute Calculations dimension to change the values ofparent members to calculated values other than sums.
The Attribute Calculations dimension contains these members:
• Count: count of members that match an attribute• Sum: sum of values of child members• Avg: average of values of child members• Min: minimum value of child members• Max: maximum value of child members
When you select one of these members in the Attribute Calculationsdimension, all parent members in the base dimension return calculated valuesbased on the member that you selected. For example, if you selected theAvg member in the Attribute Calculations dimension, the simple cube viewwould look like this:
6books
7fiction
5reference
6history
The value for the parent member books is now the average of the valuesof the child members.
Count member
The Count member is a special case. Use the Count member when youwant a count of members in the base dimension that match the attribute thatyou have selected.
For example, if you have selected an attribute member paperback, and iffiction and history books are paperback but reference books are notpaperback, then the simple cube view would look like this:
BusinessObjects Voyager User's Guide 211
18Using Voyager with Oracle Hyperion Essbase Data SourcesAttribute dimensions

2books
1fiction
nullreference
1history
The calculation returns a count of book types that are printed in paperback.
Note: If the parent member Attribute Calculations is selected instead ofone of the child members (Sum, Count, Avg, Min, Max), the calculated valuesdefault to Sums.
Dynamic Time SeriesDynamic Time Series members in Essbase are used to dynamically calculateperiod-to-date values. A time series such as Q1 (first quarter of the year) isa static time series because it aggregates data across a fixed set of calendarmonths. In contrast, a dynamic time series aggregates data up to the selecteddate.
Examples of dynamic time series are history-to-date, year-to-date,period-to-date, and month-to-date.
Creating a calculation that returns a period-to-datevalue
You can add a calculation that returns a period-to-date value and displayson the time dimension.
To create a calculation that returns a period-to-date value
1. Select any member within the time dimension where you want toadd the calculation and click Calculation on the application toolbar.
2. In the Calculation Editor dialog box, choose the Dynamic Time Seriesoperation, and type a caption for the calculation.
212 BusinessObjects Voyager User's Guide
Using Voyager with Oracle Hyperion Essbase Data Sources18 Dynamic Time Series

3. In the Definition area, select one of the available Dynamic Time Seriesfunctions.
4. Click the Member Selector icon to select a leaf member.
A leaf member is a member that has no child members. Leaf membersare at the ends of branches in a tree structure.
For example, if you choose the Year-to-Date function, and if you want tocalculate aggregate values for the year up to August, you would choosethe leaf member August.
5. Click OK in the Member Selector and OK in the Calculation Editor.
The Dynamic Time Series calculation is added to the crosstab.
Alias tablesAn alias is an alternate name for a dimension member. Dimension membernames that are stored in a database outline are often not recognizable to abusiness user. For example, an SKU (Stock Keeping Unit: a number that isassociated with a product for inventory purposes) may not help a businessuser to determine what information is contained in the member. Aliasesprovide alternate ways to display the same member information so that itcan be understood by different audiences.
Aliases are created by a system administrator and are stored in one or moretables as part of a database outline. An alias table maps a set of alias namesto member names.
When a database outline is created, Analytic Services creates an emptyalias table named Default. If no other alias tables are created, aliases arestored in the Default alias table. In a new workspace, the member captionsare retrieved from the Default alias table.
Related Topics• Data tab connections buttons on page 222
BusinessObjects Voyager User's Guide 213
18Using Voyager with Oracle Hyperion Essbase Data SourcesAlias tables

Setting the active alias table
The active alias table is the table that is currently being used to displaymember aliases. When you change the active alias table, all member captionsfor the connection are based on the selected alias table.
The active alias table is applied to all viewpoints in the workspace. If thereare charts and crosstabs on several pages of the workspace, all linked tothe same connection, those components will all display the aliases from theactive alias table.
The aliases from the active alias table are displayed in these components:
• Member Selector
• crosstab axis
• chart axis and legend
The active alias table is saved with the workspace so that when theworkspace is re-opened, the active alias table is the same one that wasactive in the previous session.
Note: If aliases have been defined for dimension members, those aliasesare displayed. Members that do not have aliases defined in the active aliastable will be displayed using member names.
For example, if you select the Long Names alias table but the Productdimension members do not have any aliases in this table, then instead ofdisplaying an alias like "Diet Cola", Voyager displays the member name"100-20".
To set the active alias table
1. In the connections area on the Data tab, select the Essbase connectionwhose alias table you want to change.
2. Click Select Alias Table.
A list of all available alias tables for the selected cube is displayed.
3. Select an alias table from the list and click OK.
214 BusinessObjects Voyager User's Guide
Using Voyager with Oracle Hyperion Essbase Data Sources18 Alias tables

Searching for members by their aliases
You can search for members by their aliases in the Member Selector. First,set the active alias table from the Data tab. For details, see Setting the activealias table on page 214. Then, search for members as usual in the MemberSelector. See Selecting members by searching on page 81.
Note:
• The search is case-insensitive.• You can search only for aliases in the active alias table.
BusinessObjects Voyager User's Guide 215
18Using Voyager with Oracle Hyperion Essbase Data SourcesAlias tables

216 BusinessObjects Voyager User's Guide
Using Voyager with Oracle Hyperion Essbase Data Sources18 Alias tables

User Interface Reference
19

This section describes in detail all of the functionality of the user interfaceelements within BusinessObjects Voyager. For help with performing tasksin Voyager, see the appropriate sections in the rest of this User's Guide.
Workspace referenceA workspace is a Voyager data-analysis object. You create a workspace inVoyager, analyze your data in it, and save it as a single file in theBusinessObjects Enterprise repository. You can then re-open the workspaceto continue your analysis, or share the workspace with other users.
1. Application toolbar2. Tab panel3. Metadata explorer4. Analysis window
A workspace contains the analysis window where you analyze data, the tabpanel where you manage metadata and the visual components of youranalysis, and the application toolbar.
218 BusinessObjects Voyager User's Guide
User Interface Reference19 Workspace reference

The default workspace contains three pages, each with an empty crosstaband undefined query. You can add crosstab and chart components to theanalysis window, or add additional pages to the workspace, as your analysisincreases in scope.
Related Topics• Analysis window reference on page 219• Tab panel reference on page 220• Toolbar reference on page 233• Crosstab component reference on page 246• Chart component reference on page 260
Analysis window referenceThe main work area in Voyager is called the analysis window. You use theanalysis window to select, add, delete, and move crosstab and chartcomponents. You can add up to four components to the analysis window, inany combination of crosstabs and charts.
Crosstab and chart components can occupy any of the four quadrants in theanalysis window, or two adjacent quadrants, or all four quadrants if you havea single component on the page.
The areas in the analysis window where you can drag components to fromthe toolbar are called drop zones. The locations of the component drop zoneschange as you add or reposition components in the analysis window.
For example, when there are three components in the analysis window, thelocations of the drop zones depend on how the existing components arepositioned. If there are two components at the top of the analysis windowand one at the bottom, there are only two drop zones: at the lower-left andlower-right sides of the analysis window. If there are two components at theleft of the analysis window and one at the right, the drop zones are at theupper-right and lower-right sides of the analysis window.
Related Topics• Workspace reference on page 218• Tab panel reference on page 220• Toolbar reference on page 233• Crosstab component reference on page 246
BusinessObjects Voyager User's Guide 219
19User Interface ReferenceAnalysis window reference

• Chart component reference on page 260
Tab panel referenceThe tab panel, the pane at the left side of the Voyager workspace, containsthe Data, Structure, and Properties tabs. These tabs are used to definequeries, view dimensions and members, add and change data connections,and view component properties.
Related Topics• Workspace reference on page 218• Analysis window reference on page 219• Toolbar reference on page 233• Crosstab component reference on page 246• Chart component reference on page 260
Data tab
On the Data tab, you add predefined connections to data sources (cubes),and view the dimensions and members defined in those data sources.
220 BusinessObjects Voyager User's Guide
User Interface Reference19 Tab panel reference

Related Topics• Tab panel reference on page 220• Structure tab on page 229• Properties tab on page 231
Data tab connections area
At the top of the Data tab is a list of active connections that have been addedto the workspace. When you create a new workspace, you are prompted to
BusinessObjects Voyager User's Guide 221
19User Interface ReferenceTab panel reference
add the first connection, but you can later add as many connections as youwant.
Click Add Connection to see a list of connections that your systemadministrator has defined. Any connections that you have already added toyour workspace do not appear in this list.
For more information about connections, see OLAP data connections onpage 290. For information about defining OLAP connections, see "CreatingOLAP data source connections" in the Administrator's Guide.
Once you have added at least one connection, you can select the connectionto view the metadata for that cube in the metadata explorer, and define yourquery in the analysis window.
If any of your connections are disabled, Voyager does not execute the queriesthat are based on the disabled connections. The disabled connections stillappear in the active connections list, but are unavailable. SeeRe-establishinga disabled connection on page 294 for more information.
Related Topics• Data tab connections buttons on page 222• Data tab metadata explorer on page 224• Data tab metadata explorer buttons on page 226• Data tab on page 220• Structure tab on page 229• Properties tab on page 231
Data tab connections buttons
Above the connections area on the Data tab are buttons that you can useto add, remove, and refresh data connections.
For more information about adding and removing data connections, seeAdding anOLAP cube connection to a workspace on page 291 andRemovingan OLAP cube connection from a workspace on page 293.
222 BusinessObjects Voyager User's Guide
User Interface Reference19 Tab panel reference

Add Connection button
Click this button to add a connection to the list of active connections on theData tab.
Remove Connection button
Click this button to remove a connection from the list of active connectionson the Data tab. The button is enabled when a connection is selected on thelist.
Edit SAP Variable Values button
Click this button to refresh your page variables against the SAP BW datasource that your page is connected to.
Note:
• This button is visible only when an SAP BW connection that containsvariables is added to the workspace.
• This button is enabled only when an SAP BW connection that containsvariables is selected in the Data tab connections area.
Select Alias Table button
Click this button to select an alias table to use with your Essbase members.
Note:
• This button appears only when an Essbase connection is added to theworkspace.
• This button is enabled only when an Essbase connection is selected inthe Data tab connections area.
• For more information on Essbase alias tables, see Alias tables onpage 213.
Help button
Click this button to open a help topic about the Data tab connections area.
BusinessObjects Voyager User's Guide 223
19User Interface ReferenceTab panel reference

Related Topics• Data tab connections area on page 221• Data tab metadata explorer on page 224• Data tab metadata explorer buttons on page 226• Data tab on page 220• Structure tab on page 229• Properties tab on page 231
Data tab metadata explorer
The metadata explorer displays cube dimensions and members in a treestructure, indented to show parent-child relationships.
dimension or SAP hierarchy
attribute dimension(Essbase only)
measures or key figures dimension
time dimension
parent member
leaf member
Note:
• Microsoft uses the term "dimension" to refer to a collection of relatedhierarchies of members. In this guide however, the term "dimension"refers to a collection of related members. Microsoft hierarchies are treatedand referred to as dimensions.
224 BusinessObjects Voyager User's Guide
User Interface Reference19 Tab panel reference

• SAP uses the term "characteristic" to refer to a collection of relatedhierarchies of members. In this guide however, the term "dimension"refers to a collection of related members. SAP hierarchies are treatedand referred to as dimensions.
• Oracle Hyperion Essbase data sources support attribute dimensions. Forinformation on attribute dimensions, seeAttribute dimensions on page 207.
You define queries using the metadata explorer. You select dimensions andmembers for your query and add them to a crosstab or chart in the analysiswindow.
You can select individual dimensions and members, or ranges of members:
• Click individual dimensions or members to select and deselect them.
• Hold down the Shift key as you click members, to select or deselectranges of members.
For information about how to define a query, seeDefining queries on page 40.For more information about using crosstabs and charts, see Crosstabcomponent reference on page 246 and Chart component reference onpage 260.
Aliases (for Essbase data only)
If your data source is Essbase, the displayed member names may be"aliases", which are captions that can make member names easier tounderstand. Depending on how the data cube was originally set up, theremay be more than one set of aliases available to describe the data. For moreinformation on alias tables, see Alias tables on page 213.
Note:
• All dimensional metadata for the entire cube is shown in the metadataexplorer.
• For specific information about Microsoft SQL Server 2005 AnalysisServices data sources and how to work with them on the Data tab, seeUsing Voyager with Microsoft SQL Server 2005 Analysis Services onpage 185.
• For specific information about SAP BW data sources and how to workwith them on the Data tab, see Using Voyager with SAP on page 189, andthe documentation for the BusinessObjects Integration Kit for SAP.
BusinessObjects Voyager User's Guide 225
19User Interface ReferenceTab panel reference

• For specific information about Oracle Hyperion Essbase data sourcesand how to work with them on the Data tab, see Using Voyager withOracle Hyperion Essbase Data Sources on page 205.
Related Topics• Data tab connections area on page 221• Data tab connections buttons on page 222• Data tab metadata explorer buttons on page 226• Data tab on page 220• Structure tab on page 229• Properties tab on page 231
Data tab metadata explorer buttons
Above the metadata explorer area on the Data tab, there are buttons thatyou can use to populate your crosstab or chart, instead of draggingdimensions and members into the analysis window.
To populate your crosstab or chart component, first select the component,then select a dimension or members in the metadata explorer area, and thenclick one of the buttons to add the dimension or members to the component.
The slice axis is a special case. See Understanding the crosstab on page247 and Custom aggregates and multiple members on a slice dimension onpage 228 for more information about using the slice axis.
Add to Rows button
The button is enabled when a visual component is selected on the page,and at least one dimension or member is selected in the metadata explorer.
• If the crosstab rows are empty, click this button to add the selecteddimension or members to the crosstab row axis.
• If the crosstab's rows contain members from the same dimension as theselected members, click this button to replace the existing members withthe selected members.
• If the crosstab rows contain members not from the same dimension asthe selected members, click this button to nest the existing membersinside the selected members in the row axis.
226 BusinessObjects Voyager User's Guide
User Interface Reference19 Tab panel reference

Note: If members from the source dimension are already specified on acrosstab axis other than the row axis, the existing members from thesource dimension are removed from the crosstab.
Add to Columns button
The button is enabled when a visual component is selected on the page,and at least one dimension or member is selected in the metadata explorer.
• If the crosstab columns are empty, click this button to add the selecteddimension or members to the crosstab's column axis.
• If the crosstab columns contain members from the same dimension asthe selected members, click this button to replace the existing memberswith the selected members.
• If the crosstab columns contain members not from the same dimensionas the selected members, click this button to nest the existing membersinside the selected members on the column axis.
Note: If members from the source dimension are already specified on acrosstab axis other than the column axis, the existing members from thesource dimension are removed from the crosstab.
Add to Slice button
Requirements for adding members to the slice area are different fromrequirements for adding members to the row and column axes. With OracleHyperion Essbase data sources, you can add only a single member to theslice area. With Microsoft Analysis Services 2000/2005 and SAP BW datasources, you can add multiple members to the slice area.
For information about custom aggregates and using multiple members on aslice, see Custom aggregates and multiple members on a slice dimensionon page 228.
The button is enabled when a visual component is selected on the page,and at least one member is selected in the metadata explorer.
• If the crosstab slice area is empty, click this button to add the selecteddimension or members to the crosstab's slice area.
BusinessObjects Voyager User's Guide 227
19User Interface ReferenceTab panel reference

• If the crosstab's slice area contains members from the same dimensionas the selected members, click this button to replace the existing memberswith the selected members.
• If the crosstab's slice area contains members not from the same dimensionas the selected members, click this button to nest the existing membersinside the selected members on the slice axis.
Help button
Click this button to open a help topic about the metadata explorer.
Related Topics• Data tab connections area on page 221• Data tab connections buttons on page 222• Data tab metadata explorer on page 224• Data tab on page 220• Structure tab on page 229• Properties tab on page 231
Custom aggregates andmultiple members on a slice dimension
A custom aggregate is a group of members that a user selects, that do notroll up to an existing parent member in a dimension.
For example, if you are interested in sales figures by region, then when youselect CA, you see the aggregated sales for all cities in the state of California.But if you are interested in only the cities of Los Angeles and Portland, youcannot select one single member in the dimension that gives you theaggregated sales for just these two cities. Or if you are interested in only afew cities in the state of California, but not all of them, again there is no singlemember that gives you the aggregated sales for just those cities.
If you connect to a cube provider that supports custom aggregation, you canspecify multiple members on a slice dimension. Microsoft Analysis Services2000/2005 and SAP BW support custom aggregates. Oracle HyperionEssbase does not support custom aggregates.
Therefore, if your data source is Essbase, you cannot place multiple membersin the slice area.
228 BusinessObjects Voyager User's Guide
User Interface Reference19 Tab panel reference

Note: You cannot place multiple members from a measures dimension onthe slice axis.
Structure tab
The Structure tab shows the relationships between queries and visualcomponents (crosstabs and charts) on the current page. The Structure tabalso lets you add new queries and move visual components between queries.
Related Topics• Tab panel reference on page 220• Data tab on page 220• Properties tab on page 231
Structure tree
The structure tree shows the queries and visual components on the currentpage.
You can expand the nodes of the tree by clicking the plus sign besideexpandable tree nodes, and you can collapse them by clicking the minussign.
Components and queries in the structure tree
Visual components are linked to queries. On the Structure tab, you canchange the query that a visual component is linked to by dragging thecomponent from one query to another.
BusinessObjects Voyager User's Guide 229
19User Interface ReferenceTab panel reference

For example, you may have two crosstabs, Crosstab 1 and Crosstab 2, linkedto separate queries, Query 1 and Query 2. When you add a chart, Chart 1,it is automatically linked to the most recent query, which is Query 2. Therefore,Chart 1 reflects the same data as Crosstab 2 because both components arelinked to the same query. If instead you want to visualize the data in Crosstab1, not Crosstab 2, you can drag Chart 1 onto Query 1 in the structure tree.
If you want only a chart, with no crosstab, click the Add Query button In theStructure tab. You can then drag the chart onto the new query. Any data inthe chart is removed because the new query is undefined.
Related Topics• Structure tab buttons on page 230• Data tab on page 220• Structure tab on page 229• Properties tab on page 231
Structure tab buttons
The top of the Structure tab contains buttons that you can use to add queriesto your page, and delete queries.
Add Query button
Click this button to manually create a new query on the current page. Forinformation about creating and defining queries, see Creating and definingqueries to answer your business questions on page 40.
Remove Query button
Click this button to delete a query. When you click the button, the query thatyou have selected on the Structure tab is deleted from the page. If you tryto delete a query that has crosstab or chart components linked to it, you areprompted to confirm that you want to remove the query and any linkedcomponents.
For more information, see Deleting queries on page 52.
230 BusinessObjects Voyager User's Guide
User Interface Reference19 Tab panel reference

Help button
Click this button to open a help topic about the Structure tab.
Related Topics• Structure tree on page 229• Data tab on page 220• Structure tab on page 229• Properties tab on page 231
Properties tab
The Properties tab displays a set of properties for the selected object. Youcan select a crosstab or chart, and view the properties for that object on theProperties tab. The properties available to view or modify on the Propertiestab depend on the component selected.
BusinessObjects Voyager User's Guide 231
19User Interface ReferenceTab panel reference

These object properties can be modified on the Properties tab:
Properties that can be modifiedObject
• Name on page 257• Comments on page 257• Display NULL Values As on page 257• Suppress NULL Values on page 257• Column Width on page 258• Row Height on page 258• Wrap Text on page 258• Display Formatted Cell Values on page 258
crosstab
232 BusinessObjects Voyager User's Guide
User Interface Reference19 Tab panel reference

Properties that can be modifiedObject
• Name on page 273• Comments on page 273• Palette on page 274• Style on page 274• Font on page 274• Suppress NULL Values on page 274• Show Parents on page 274• Show Visual Totals on page 275• Show Dimension Panel on page 275• Show Hierarchical Labeling on page 275• Show Legend on page 275• Category Label on page 275• Value Label on page 276• Data Series Label on page 277
chart
For descriptions of these properties and how to use them, see Crosstabdisplay options on page 256 and Chart display options on page 272.
Related Topics• Tab panel reference on page 220• Data tab on page 220• Structure tab on page 229
Toolbar referenceYou can perform most of your data-analysis tasks with the Voyagerapplication toolbar.
Note: Some of the toolbar buttons may be disabled, depending on the rightsthat have been assigned to users within the Central Management Console,and depending on which object or component is selected in the analysiswindow.
For more information on rights in the Central Management Console, seeyour system administrator or the BusinessObjects Voyager Administrator'sGuide.
BusinessObjects Voyager User's Guide 233
19User Interface ReferenceToolbar reference

For details on using the application toolbar buttons, see the following topics:
Related Topics• Workspace reference on page 218• Analysis window reference on page 219• Tab panel reference on page 220• Crosstab component reference on page 246• Chart component reference on page 260
Toolbar overview
The application toolbar contains buttons for the most commonly usedfunctions in Voyager. You can create, save, print, and customize your pageswith the toolbar buttons.
Several buttons have more than one function associated with them. Forexample, the Calculation button is used to perform several types ofcalculations.
Some of these multi-function buttons have a default action associated withthem. For example, clicking the arrow beside the Sort button displays thesort operations that can be applied to the selected member, but clicking theSort button itself applies the default Ascending sort.
Some toolbar buttons, such as the Crosstab and Chart buttons, representcomponents that you can drag into the analysis window.
234 BusinessObjects Voyager User's Guide
User Interface Reference19 Toolbar reference

Note: Many of the toolbar functions are also duplicated in context-sensitiveright-click menus. For example, if you right-click a dimension or a member,a menu that contains relevant options appears.
View tab panel button
This button toggles the tab panel on and off.
Save button
Use this button to save your workspace to the Business Objectsrepository. Click the Save button to execute the default Save function, orclick the arrow beside the Save button to display options for saving your file.
These save options are available:
FunctionOption
Saves the current workspace.If you have created a new workspace and have not yet saved it,choosing the Save function executes instead the Save As function.
Save
Saves the current workspace as a new repository object. Theworkspace can be newly created or a modification of an existingworkspace.The Save As function allows you to choose the location and nameof your new workspace.
Save As
BusinessObjects Voyager User's Guide 235
19User Interface ReferenceToolbar reference

For more information about saving your workspaces, see Saving Voyagerworkspaces on page 164.
Export button
Use this button to export data from a query to Microsoft Excel orcomma-separated-values format.
Click the Export button to export data to Excel, or click the arrow beside theExport button to choose from the export options.
Note: The exported file contains only crosstab data. Any charts that werein the original workspace are not retained in the exported file.
For more information about exporting, see Exporting data from Voyager toExcel on page 174 and Exporting data from Voyager tocomma-separated-values (.csv) files on page 175.
Print button
Use this button to print your data to a PDF file. When you click this button,the Export/Print to PDF dialog box opens. From the dialog box, you can
236 BusinessObjects Voyager User's Guide
User Interface Reference19 Toolbar reference

choose to print a selected component or raw data. Within your PDF fileviewer, you can then save your output as a PDF file, or send it to your printer.
For more information about printing, see Printing Voyager workspaces onpage 178.
Copy button
Use this button to copy the currently selected crosstab or chartcomponent. After copying the component, you can paste the componentonto the same page or a different page.
Note: The Copy button is disabled until you select a crosstab or chartcomponent.
Related Topics• Copying a component to compare variations in data on page 150
Paste button
Use this button to paste the copied crosstab or chart component to thesame page or a different page.
Note: The Paste button is disabled until you copy a crosstab or chartcomponent.
Related Topics• Copying a component to compare variations in data on page 150
BusinessObjects Voyager User's Guide 237
19User Interface ReferenceToolbar reference

Delete button
Use this button to delete the selected crosstab or chart from the page.
Note: The Delete button is disabled until you select a crosstab or chartcomponent.
Calculation button
Use this button to add a calculation (calculated member) to the crosstab.
Click the Calculation button to open the Calculation Editor dialog box if youwant to create custom calculations, or click the arrow beside the Calculationbutton to choose from predefined basic calculations.
Note: The Calculation button is disabled until you select one or moremembers in a crosstab. If you select two members, you can access the basicarithmetic calculations as well as the custom calculations.
These calculation options are available:
DescriptionCalculation
Adds the values in the selected rows or columns.Add
Subtracts the values in the selected rows or columns.The cell values from the second selected row or column are sub-tracted from the values in the first selected row or column.
Subtract
Multiplies the values in the selected rows or columns.Multiply
Divides the values in the selected rows or columns.The cell values from the first selected member row or column aredivided by the values in the second selected row or column.
Divide
238 BusinessObjects Voyager User's Guide
User Interface Reference19 Toolbar reference

DescriptionCalculation
Divides the values in the selected rows or columns, and expressesthe resulting values as percentages.The cell values from the first selected member row or column aredivided by the values in the second selected row or column, andmultiplied by 100.
Percentage
Displays the Calculation Editor dialog box. Use this dialog box todefine the parameters of a new custom calculation you want to addto the crosstab. For more information about custom calculations,see Overview of calculations on page 116.
More
Opens the Calculation Editor dialog box so that you can changethe definition of an existing calculation.Edit
Deletes the selected calculation.Remove
For more information about calculations, see Overview of calculations onpage 116.
Sort button
Use this button to sort the data in the crosstab.
Click the Sort button to apply the default ascending sort, or click the arrowbeside the Sort button to display a list of sorting options that you can selectfrom.
These sorting options are available:
FunctionOption
Sorts the selected row or column in ascending order.The hierarchical structure of the members is maintained if theMaintain Hierarchies option is selected.
Ascending(default)
BusinessObjects Voyager User's Guide 239
19User Interface ReferenceToolbar reference
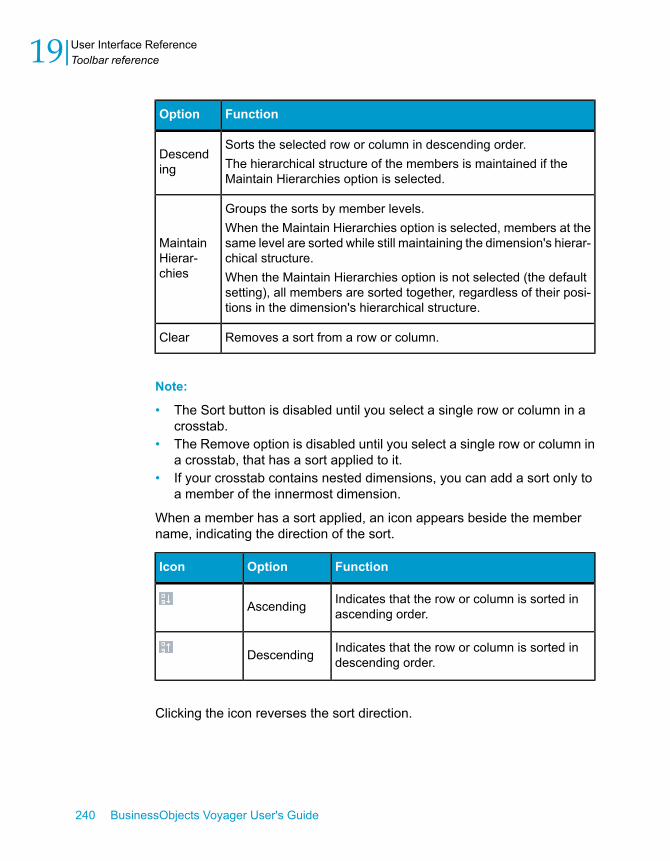
FunctionOption
Sorts the selected row or column in descending order.The hierarchical structure of the members is maintained if theMaintain Hierarchies option is selected.
Descending
Groups the sorts by member levels.When the Maintain Hierarchies option is selected, members at thesame level are sorted while still maintaining the dimension's hierar-chical structure.When the Maintain Hierarchies option is not selected (the defaultsetting), all members are sorted together, regardless of their posi-tions in the dimension's hierarchical structure.
MaintainHierar-chies
Removes a sort from a row or column.Clear
Note:
• The Sort button is disabled until you select a single row or column in acrosstab.
• The Remove option is disabled until you select a single row or column ina crosstab, that has a sort applied to it.
• If your crosstab contains nested dimensions, you can add a sort only toa member of the innermost dimension.
When a member has a sort applied, an icon appears beside the membername, indicating the direction of the sort.
FunctionOptionIcon
Indicates that the row or column is sorted inascending order.Ascending
Indicates that the row or column is sorted indescending order.Descending
Clicking the icon reverses the sort direction.
240 BusinessObjects Voyager User's Guide
User Interface Reference19 Toolbar reference

For more information about sorting and the different sort types, see Sortingdata columns or rows on page 92.
Rank button
Use this button to rank the data in the crosstab.
Click the Rank button to open the Rank Editor dialog box.
For more information about ranking and the different ranking types, seeRanking the data in the crosstab on page 100 and Rank Editor dialog box onpage 285.
Note: The Rank button is disabled until you select a single row or columnin a crosstab.
When a member has a rank applied, the rank icon appears beside themember name:
Filter button
Use this button to filter the data displayed in crosstabs and charts.
Click the Filter button to open the Filter Editor dialog box. For more informationabout filtering and the different filter types, see Filtering the data in crosstabsand charts on page 97 and Filter Editor dialog box on page 286.
Note:
• The Filter button is disabled until you select a row or column in a crosstab.• If your crosstab contains nested dimensions, you can add a filter only to
members of the innermost dimension.
When a member has a filter applied, an icon appears beside the membername:
BusinessObjects Voyager User's Guide 241
19User Interface ReferenceToolbar reference

Exception Highlighting button
Use this button to apply color to the cells in a crosstab, highlightingimportant differences or unexpected results.
For example, you might want to highlight a value that is greater or less thana predetermined value.
Exception highlighting is performed on one or more columns, or one or morerows, but not on rows and columns simultaneously. On an axis that hasnested dimensions, the selected members must be on the innermostdimension.
For more information about Exception Highlighting, see HighlightingExceptions in Data on page 107.
Note: The Exception Highlighting button is disabled until you select a memberin a crosstab.
Measure Formatting button
Use this button to change the appearance of your data by addingformatting.
Some of the types of formatting you can add are:
• The way the numbers in your crosstab are displayed (for example, inscientific notation).
• The number of decimal places displayed (any number from 0 to 99; thedefault is 2).
• The way negative values are displayed.
242 BusinessObjects Voyager User's Guide
User Interface Reference19 Toolbar reference

For more information about formatting measures, see Formatting CrosstabData on page 153.
Display Member Settings button
Click this button to display a list of all sort, filter, and rank conditions thatare applied to the current query.
All applied conditions are included in the list whether or not the membersthat the conditions are applied to are visible in the crosstab. You can removeany conditions that you no longer want to apply to your data.
For more information, see Displaying sorts, filters, and ranks applied to thequery on page 103 and Hidden sorts, filters, and ranks on page 103.
Swap Axis button
Use this button to swap the horizontal and vertical crosstab axes.
All members on the row axis swap places with all members on the columnaxis.
Any sorts, filters, and ranks in the query are preserved.
Note: The Swap Axis button is disabled until you select a crosstab or chart.
Visual Totals button
Use this button to add visual totals to the crosstab. Visual totals includethese calculations:
• Sum
• Average
• Count
• Minimum
• Maximum
BusinessObjects Voyager User's Guide 243
19User Interface ReferenceToolbar reference

• Median
• Variance
• Standard Deviation
• Aggregate
You can click the button to turn on the default calculations for both rows andcolumns, or you can click the arrow beside the button to choose from theother available totals.
For more information about visual totals, see Visual totals on page 116.
Insert Crosstab button
Use the Insert Crosstab button to place a crosstab onto your page. Youcan place up to four visual components on a page, in any combination ofcrosstabs and charts.
To place a crosstab on a page, drag the Crosstab from the application toolbarinto the analysis window. Alternatively, you can click the Crosstab button toinsert the crosstab on the current page. The component is added to the page,below or to the right of existing components; however, you can repositioncomponents in the analysis window later.
For more information about crosstabs, see Crosstab component referenceon page 246.
Chart buttons
Use the chart buttons to place a chart onto your page. You can place up tofour visual components on a page, in any combination of crosstabs andcharts.
To place a chart on a page, drag a chart from the application toolbar into theanalysis window. Alternatively, you can click a chart button to insert that charttype on the current page. The component is added to the page, below or tothe right of existing components; however, you can reposition componentsin the analysis window later.
244 BusinessObjects Voyager User's Guide
User Interface Reference19 Toolbar reference
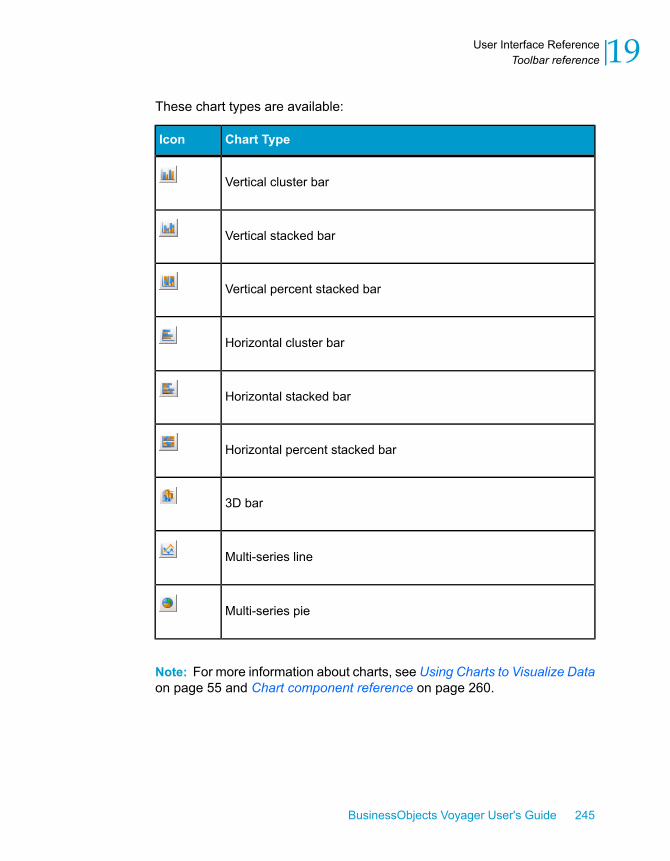
These chart types are available:
Chart TypeIcon
Vertical cluster bar
Vertical stacked bar
Vertical percent stacked bar
Horizontal cluster bar
Horizontal stacked bar
Horizontal percent stacked bar
3D bar
Multi-series line
Multi-series pie
Note: For more information about charts, see Using Charts to Visualize Dataon page 55 and Chart component reference on page 260.
BusinessObjects Voyager User's Guide 245
19User Interface ReferenceToolbar reference

Help button
Use this button to open a help topic about the application toolbar.
Crosstab component referenceThe crosstab component comprises the main crosstab grid and a dimensionpanel above the grid. The dimension panel is where you place dimensionsand members to define a query.
The crosstab provides you with a dynamic view of your business data. Youcan interactively change your row, column, and slice dimensions by draggingthem between drop zones in the crosstab or from the Data tab to the crosstab.This makes it easy for you to view trends over time, or track other changesin your data.
The crosstab presents a spreadsheet-like display of the data in the cube.You can sort the rows and columns of the crosstab, add calculations, highlightexceptions, and even hide data that is irrelevant to your analysis.
The diagram below illustrates the elements of the crosstab component:
1. Dimension panel2. Slice dimension3. Row dimension4. Column dimension
246 BusinessObjects Voyager User's Guide
User Interface Reference19 Crosstab component reference

5. Row members6. Column members
Related Topics• Understanding the crosstab on page 247• Crosstab title bar on page 250• Crosstab dimension panel on page 250• Crosstab grid on page 252• Crosstab buttons on page 255• Crosstab display options on page 256• Crosstab tooltips on page 259• Workspace reference on page 218• Analysis window reference on page 219• Tab panel reference on page 220• Toolbar reference on page 233• Chart component reference on page 260
Understanding the crosstab
The crosstab comprises three axes, although only two can be displayed onthe screen.
• Row axis: the vertical axis that displays rows of data.
• Column axis: the horizontal axis that displays columns of data.
• Slice axis: the axis that is perpendicular to the two-dimensional crosstabdisplay.
Dimensions that are placed on the row axis are called row dimensions.Similarly, you also use column dimensions and slice dimensions in youranalyses. See Understanding OLAP on page 19 for more information ondimensions and slices.
This image shows an example of the crosstab display.
BusinessObjects Voyager User's Guide 247
19User Interface ReferenceCrosstab component reference
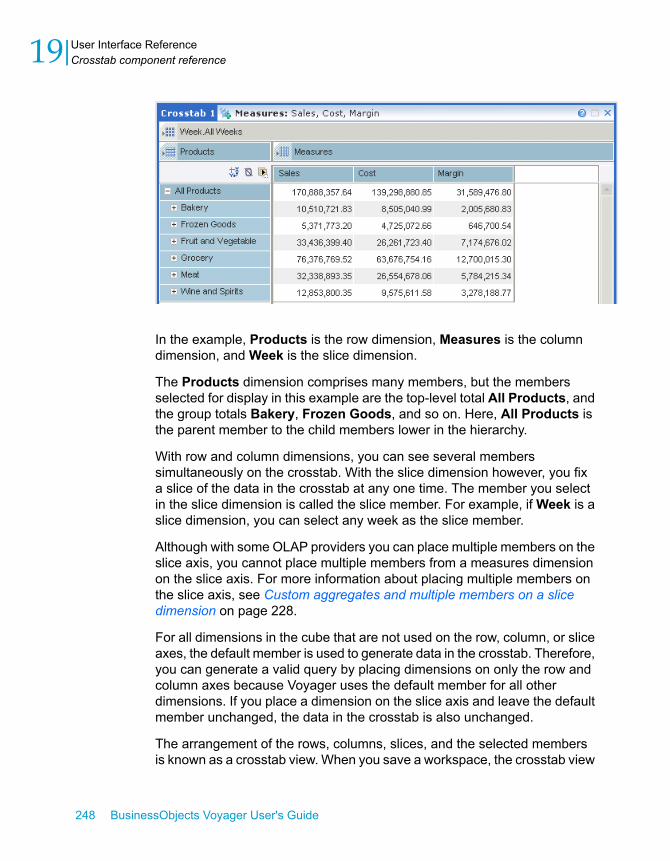
In the example, Products is the row dimension, Measures is the columndimension, and Week is the slice dimension.
The Products dimension comprises many members, but the membersselected for display in this example are the top-level total All Products, andthe group totals Bakery, Frozen Goods, and so on. Here, All Products isthe parent member to the child members lower in the hierarchy.
With row and column dimensions, you can see several memberssimultaneously on the crosstab. With the slice dimension however, you fixa slice of the data in the crosstab at any one time. The member you selectin the slice dimension is called the slice member. For example, if Week is aslice dimension, you can select any week as the slice member.
Although with some OLAP providers you can place multiple members on theslice axis, you cannot place multiple members from a measures dimensionon the slice axis. For more information about placing multiple members onthe slice axis, see Custom aggregates and multiple members on a slicedimension on page 228.
For all dimensions in the cube that are not used on the row, column, or sliceaxes, the default member is used to generate data in the crosstab. Therefore,you can generate a valid query by placing dimensions on only the row andcolumn axes because Voyager uses the default member for all otherdimensions. If you place a dimension on the slice axis and leave the defaultmember unchanged, the data in the crosstab is also unchanged.
The arrangement of the rows, columns, slices, and the selected membersis known as a crosstab view. When you save a workspace, the crosstab view
248 BusinessObjects Voyager User's Guide
User Interface Reference19 Crosstab component reference

is also saved. The next time you open the workspace, the crosstab looksthe same as when you saved it.
To see a different view of the data (for example, to view Products againstWeek rather than Products against Measures), you can swap the twodimensions. This is also known as "reorienting" or "pivoting" the crosstab.See Swapping dimensions on page 140.
You can also display more than one dimension on a row or column axis; forexample, you can place both aMeasures dimension and a Years dimensionon the same axis to show data from the Measures dimension over severalyears. This is called "nesting dimensions". See Nesting dimensions onpage 142.
Definitions:
Drop zones are the locations in the dimension panel where dimen-sions or members can be dropped, to define and manipulatequeries.
Dropzones
The row axis is the vertical axis on the crosstab.Row axis
The column axis is the horizontal axis on the crosstab.Columnaxis
The slice axis, although it cannot be represented visually by thetwo-dimensional crosstab, is the third dimension, perpendicular tothe row and column axes on the crosstab.
Slice axis
Related Topics• Crosstab component reference on page 246• Crosstab title bar on page 250• Crosstab dimension panel on page 250• Crosstab grid on page 252• Crosstab buttons on page 255• Crosstab display options on page 256• Crosstab tooltips on page 259
BusinessObjects Voyager User's Guide 249
19User Interface ReferenceCrosstab component reference

Crosstab title bar
The title bar contains the following elements:
• The name of the crosstab component.• The names of measures used in the current query, with a Member Selector
button for changing the measure.• A button for maximizing or minimizing the component.• A button for opening a help topic about crosstabs.• A button for deleting the component from the analysis window.
The names of measure members that are used to retrieve data values in aquery are displayed in the title bar of any component that is linked to thequery.
If the measures dimension is not placed on any of the axes in the component,the title bar displays the name of the default member of the measuresdimension.
Related Topics• Crosstab component reference on page 246• Understanding the crosstab on page 247• Crosstab dimension panel on page 250• Crosstab grid on page 252• Crosstab buttons on page 255• Crosstab display options on page 256• Crosstab tooltips on page 259
Crosstab dimension panel
You can place either a single dimension or member, or groups of selectedmembers, on the row, column, and slice drop zones in the dimension panel.You can also nest dimensions to help you define more complex queries.
For more information about defining queries, seeDefining queries on page 40.
For more information about nesting dimensions, seeCreating complex queriesby nesting dimensions on page 49.
250 BusinessObjects Voyager User's Guide
User Interface Reference19 Crosstab component reference

Member drop zones in the crosstab
The crosstab's dimension panel contains drop zones for placing dimensionswhen you define a query. An additional drop zone, in the crosstab grid, isused to add members of a measures dimension to the crosstab. See Celldrop zone on page 253 for more information.
You drag a dimension or members to the center drop zone to add membersto an empty axis, or to replace existing members on that axis.
You drag a dimension or members to the left or right drop zone to addmembers to existing members on that axis. The new members are nestedbeside the existing members. For more information, see Creating complexqueries by nesting dimensions on page 49.
BusinessObjects Voyager User's Guide 251
19User Interface ReferenceCrosstab component reference

Dimension functions
You can right-click a dimension on the dimension panel to access thesefunctions:
• Display—selects a format for displaying member names.
• Remove—removes the dimension from the crosstab.
Related Topics• Crosstab component reference on page 246• Understanding the crosstab on page 247• Crosstab title bar on page 250• Crosstab grid on page 252• Crosstab buttons on page 255• Crosstab display options on page 256• Crosstab tooltips on page 259
Crosstab grid
The crosstab grid is where member headings and data are displayed.
Row and column resizing
You can drag the edges of row and column member headings to resize them.
252 BusinessObjects Voyager User's Guide
User Interface Reference19 Crosstab component reference

Icons in member headings
If you have applied any filtering, sorting, ranking, or calculations to a member,icons are displayed in the member heading.
Member functions
You can right-click a member heading in the crosstab grid to access thesefunctions:
• Drill—For information on drilling up and down on members, see Drillingdown and drilling up on page 144.
• Sort—For information on sorting data, see Sorting data columns or rowson page 92.
• Filter—For information on filtering data, see Filtering the data in crosstabsand charts on page 97.
• Rank—For information on ranking data, see Ranking the data in thecrosstab on page 100.
• Exception Highlighting—For information on highlighting exceptions indata, see Overview of exception highlighting on page 108.
• Calculation—For information on adding and defining calculations, seeOverview of calculations on page 116.
• Hide Member—For information on hiding members, seeHiding membersfrom view on page 85.
Cell drop zone
The crosstab and chart components have similar drop zones in the dimensionpanel, but the crosstab component has one additional drop zone in the maincell area. This drop zone is for the purpose of changing or adding membersof a measures dimension only. You cannot drop members of a non-measuresdimension on the cell drop zone, and you cannot drop the entire measuresdimension on the cell drop zone.
BusinessObjects Voyager User's Guide 253
19User Interface ReferenceCrosstab component reference

When you drop measures on the cell drop zone, those measures are placedon the column axis.
If you have already placed some members of a measures dimension on therow or column axis, dropping additional measures onto the cell drop zoneadds those measures to the other measures on the same axis.
If you have already placed a measure member on the slice axis, droppinganother member onto the cell drop zone swaps the measures dimension tothe column axis and adds the new member to the selection.
Related Topics• Crosstab component reference on page 246• Understanding the crosstab on page 247• Crosstab title bar on page 250• Crosstab dimension panel on page 250• Crosstab buttons on page 255• Crosstab display options on page 256• Crosstab tooltips on page 259
254 BusinessObjects Voyager User's Guide
User Interface Reference19 Crosstab component reference

Crosstab buttons
At the upper-left corner of the crosstab component are buttons for changingthe view of the crosstab.
Related Topics• Crosstab component reference on page 246• Understanding the crosstab on page 247• Crosstab title bar on page 250• Crosstab dimension panel on page 250• Crosstab grid on page 252• Crosstab display options on page 256• Crosstab tooltips on page 259
Crosstab Swap Axis button
Use this button to swap the horizontal and vertical crosstab axes.
All members on the row axis swap places with all members on the columnaxis.
Any sorts, filters, and ranks in the query are preserved.
Crosstab Null Suppression button
Use this button to suppress all rows and columns that contain only nullcell values from being displayed in the crosstab.
When suppression is active, the Suppression button remains depressed toindicate that the crosstab contains suppressed data. Click the NullSuppression button again to restore the null data to the displayed crosstab.
BusinessObjects Voyager User's Guide 255
19User Interface ReferenceCrosstab component reference

You can also suppress null rows only, or null columns only. For details, seeCrosstab display options on page 256 andChart display options on page 272.
Crosstab Select All button
Click this button to select all cells in the crosstab before applying globalexception highlighting or adding visual totals.
Related Topics• Applying exception highlighting on page 109• Visual totals on page 116
Crosstab display options
The following options are available to customize the appearance of thecrosstab. You can access these options from the Properties tab.
ValuesOption
Text string up to 50 charactersName on page 257
Text string up to 255 charactersComments on page 257
Text string up to 50 charactersDisplay NULL Values As on page 257
Off, Column and Row, Column only,Row onlySuppress NULL Values on page 257
Numeric valueColumn Width on page 258
Numeric valueRow Height on page 258
Yes, NoWrap Text on page 258
Yes, NoDisplay Formatted Cell Values onpage 258
256 BusinessObjects Voyager User's Guide
User Interface Reference19 Crosstab component reference

Descriptions of crosstab display options
Name
This option defines the name of the crosstab component. The name isdisplayed in the crosstab's title bar, and is printed in the page header whenyou print a crosstab. The name is also used to identify the crosstab on theStructure tab. The default value is the name generated automatically byVoyager when the crosstab is created.
Comments
In addition to the crosstab's name, you can add comments to describe thecrosstab, up to a maximum of 255 characters. Comments are optional andare not displayed on the crosstab component, but if you print a crosstab toa PDF document, the comments appear beneath the crosstab component.
Display NULL Values As
This option defines how null values are displayed. You can type any text thatyou want, up to a maximum of 50 characters. The input is always treated astext, even if numeric values are entered.
By default, null values are displayed as empty cells.
Suppress NULL Values
This option defines how complete rows and columns of null values aredisplayed.
Note: When null values in a crosstab are suppressed, null values in anycharts linked to the same query are also suppressed.
These null-suppression options are available:
FunctionOption
Restores all suppressed null values to the crosstab.Off
BusinessObjects Voyager User's Guide 257
19User Interface ReferenceCrosstab component reference

FunctionOption
Hides all columns and rows that contain only null cell values.
Note: The Column and Row option is equivalent to clickingthe Null Suppression button in the crosstab.
Column andRow
Hides all columns that contain only null cell values.Column only
Hides all rows that contain only null cell values.Row only
Column Width
This option defines the width of crosstab columns, in pixels. The value youenter applies to all columns in the crosstab.
The minimum allowed value is 20.
Row Height
This option defines the height of crosstab rows, in pixels. The value you enterapplies to all rows in the crosstab.
The minimum allowed value is 20.
Wrap Text
This option defines whether text in crosstab cells wraps.
The default value is No.
Display Formatted Cell Values
This option defines whether cell values are displayed with or without theformatting defined in the Measure Formatting dialog box. For more informationabout formatting measures, see Formatting Crosstab Data on page 153.
The default value is Yes.
Related Topics• Properties tab on page 231
258 BusinessObjects Voyager User's Guide
User Interface Reference19 Crosstab component reference

• Crosstab component reference on page 246• Understanding the crosstab on page 247• Crosstab title bar on page 250• Crosstab dimension panel on page 250• Crosstab grid on page 252• Crosstab buttons on page 255• Crosstab tooltips on page 259
Crosstab tooltips
The tooltip for a member heading displays the member level and caption.
Related Topics• Crosstab component reference on page 246• Understanding the crosstab on page 247• Crosstab title bar on page 250• Crosstab dimension panel on page 250• Crosstab grid on page 252• Crosstab buttons on page 255• Crosstab display options on page 256
BusinessObjects Voyager User's Guide 259
19User Interface ReferenceCrosstab component reference

Chart component reference
1. Dimension panel2. Slice dimension3. Data series dimension4. Category dimension5. Data series members
The chart component comprises the main chart graphic and a dimensionpanel above the graphic. The dimension panel is where you place dimensionsand members to define a query. With large data sets, a range slider is alsodisplayed to help you navigate the data in the chart.
For more information about charts, see Using Charts to Visualize Data onpage 55.
Definitions:
Drop zones are the locations in the dimension panel where dimen-sions or members can be dropped, to define and manipulatequeries.
Dropzones
260 BusinessObjects Voyager User's Guide
User Interface Reference19 Chart component reference

A data series is a set of related data points that are plotted on achart.Each data series is represented by a unique color, and is includedin the chart legend.For example, each line in a multi-series line chart, or each bar colorin a cluster bar chart, represents a data series.
Data se-ries
Categories are the groupings that elements of a data series belongto.
Categories
Related Topics• Chart dimension panel on page 261• Chart range slider on page 264• Chart title bar on page 266• Chart graphic on page 266• Chart types on page 268• Chart display options on page 272• Workspace reference on page 218• Analysis window reference on page 219• Tab panel reference on page 220• Toolbar reference on page 233• Crosstab component reference on page 246
Chart dimension panel
You can place either a single dimension or member, or groups of selectedmembers, on the data series, category, and slice drop zones in the dimensionpanel. You can also nest dimensions to help you define more complexqueries.
You can hide the dimension panel to allow the chart graphic to occupy morescreen area. See Properties tab on page 231 for details.
For more information about defining queries, seeDefining queries on page 40.
For more information about nesting dimensions, seeCreating complex queriesby nesting dimensions on page 49.
BusinessObjects Voyager User's Guide 261
19User Interface ReferenceChart component reference

Related Topics• Chart component reference on page 260• Chart range slider on page 264• Chart title bar on page 266• Chart graphic on page 266• Chart types on page 268• Chart display options on page 272
Member drop zones in the chart
The chart's dimension panel contains drop zones for placing dimensionswhen you define a query.
You drag a dimension or members to the center drop zone to add membersto an empty axis, or to replace existing members on that axis.
You drag a dimension or members to the left or right drop zone to addmembers to existing members on that axis. The new members are nestedbeside the existing members. For more information, see Creating complexqueries by nesting dimensions on page 49.
262 BusinessObjects Voyager User's Guide
User Interface Reference19 Chart component reference

Dimension functions
You can right-click a dimension on the dimension panel to access thesefunctions:
• Display—selects a format for displaying member names.
BusinessObjects Voyager User's Guide 263
19User Interface ReferenceChart component reference

• Remove—removes the dimension from the chart.
Chart range slider
1. Overview scroll bar2. Selected range3. Range slider bars4. Hide/restore button5. Paging buttons
The chart range slider lets you scroll through charts that contain large datasets. It appears automatically when the data set in the chart is too large tobe displayed legibly in the main chart graphic. The range slider is availablewith all chart types except for the 3D bar chart type.
Range slider bars
The range slider bars let you resize and reposition the selected range withinthe range slider control. You move the bars to the approximate positions youwant, and when you release the mouse button, Voyager snaps the bars tothe nearest logical data points.
Selected range
The area between the range slider bars is the selected range. This range isexpanded in the main chart graphic. You can also drag the selected rangewithin the range slider to scroll through the chart.
Overview scroll bar
With very large data sets, the range slider cannot display the full data setlegibly. Instead, the overview scroll bar represents the full data set while therange slider represents only a portion of the full data set. The relative size
264 BusinessObjects Voyager User's Guide
User Interface Reference19 Chart component reference

of the scroll box within the overview scroll bar indicates the percentage ofthe full data set being displayed in the range slider.
Use the overview scroll bar to move the range slider to different subsets ofthe full data set.
Hide/restore button
To allow the main chart graphic to occupy more space in the chart component,you can hide the range slider by clicking the arrow button at the edge of therange slider. Click the arrow button again to restore the range slider.
Paging buttons
The arrow buttons at the ends of the range slider move the selected rangeby one "page" of elements within the range slider. A page is defined as thecurrent size of the selected range.
With very large data sets, the range slider represents only a portion of thefull data set. In that case, the arrow buttons move the selected range by onepage of elements as usual, until the selected range reaches the end of therange slider. Clicking an arrow button again moves the selected range furtherbut also moves the range slider within the full data set.
Autoscaling in the range slider
In the range slider, the values are scaled automatically to fit the slider. Forexample, if the subset of data currently being displayed in the range sliderincludes values between 1 and 100, the number 2 is represented by a veryshort riser. But if you scroll the range slider to a different subset of data thatincludes values only between 1 and 2, the values are scaled so that thenumber 2 is represented by a long riser.
For more information about using the chart range slider, see Scrolling throughlarge data sets in charts on page 68.
Related Topics• Chart component reference on page 260• Chart dimension panel on page 261• Chart title bar on page 266• Chart graphic on page 266• Chart types on page 268
BusinessObjects Voyager User's Guide 265
19User Interface ReferenceChart component reference

• Chart display options on page 272
Chart title bar
The title bar contains the following elements:
• The name of the chart component.• The names of measures used in the current query, with a Member Selector
button for changing the measure.• A button for maximizing or minimizing the component.• A button for opening a help topic about charts.• A button for deleting the component from the analysis window.
The names of measure members that are used to retrieve data values in aquery are displayed in the title bar of any component that is linked to thequery.
If the measures dimension is not placed on any of the axes in the component,the title bar displays the name of the default member of the measuresdimension.
Related Topics• Chart component reference on page 260• Chart dimension panel on page 261• Chart range slider on page 264• Chart graphic on page 266• Chart types on page 268• Chart display options on page 272
Chart graphic
The chart graphic displays the data returned by the defined query.
Member functions
You can right-click a member heading in the crosstab grid to access thesefunctions:
266 BusinessObjects Voyager User's Guide
User Interface Reference19 Chart component reference

• Drill Up, Drill Down, Focused Drill Up, Focused Drill Down—Forinformation on drilling up and down on members, see Drilling down anddrilling up on page 144.
• Hide Member—For information on hiding members, seeHiding membersfrom view on page 85.
• Chart Type—For information on chart types, seeChart types on page 268.
Related Topics• Chart component reference on page 260• Chart dimension panel on page 261• Chart range slider on page 264• Chart title bar on page 266• Chart types on page 268• Chart display options on page 272
Charts with large data sets
Voyager automatically sizes chart elements to fill the available spaceefficiently, using intelligent caption display techniques to fit as many legiblemember captions into the chart as possible. However, if a chart has a largedata set, the chart may not be able to display all elements, or some captionsmay be omitted from the chart.
Member captions in charts
If your chart includes many members on an axis, Voyager staggers andreorients the captions to try to display as many captions as possible. However,if the number of captions is very large, only a subset of the member captionsis displayed on the chart, so that the remaining captions are legible.
Member captions that are omitted from the chart can be viewed in tooltipswhen you rest the mouse pointer over members.
See Chart range slider on page 264 for more information about large datasets in charts.
BusinessObjects Voyager User's Guide 267
19User Interface ReferenceChart component reference

Chart colors and style
Voyager provides several color palettes and styles for displaying your charts.For more information about customizing chart colors and styles, see Chartdisplay options on page 272.
Nested dimensions on a chart axis
In all chart types except multi-series pie, the innermost dimension membersare grouped along the category axis by outer dimension members. Thenesting is shown vertically, with the member captions for the outer dimensionappearing beneath captions for the inner dimension.
In multi-series pie charts, each category in the nested axis is representedby a pie.
Data type considerations
The measures defined on a cube might not be based on the same unit ofmeasure or data type. For example, measures such as Unit Sales, StoreCost, and Store Sales use the data type double, but the Sales Count measureuses the data type integer. When the chart is rendered, all numeric valuesare converted to the data type double.
Chart types
Voyager provides these chart types:
Cluster bar chart type on page 269Cluster bar chart
Stacked bar chart type on page 270Stacked bar chart
Percent stacked bar chart type onpage 270Percent stacked bar chart
268 BusinessObjects Voyager User's Guide
User Interface Reference19 Chart component reference

3D bar chart type on page 2713D bar chart
Multi-series line chart type onpage 271Multi-series line chart
Multi-series pie chart type onpage 271Multi-series pie chart
Related Topics• Chart component reference on page 260• Chart dimension panel on page 261• Chart range slider on page 264• Chart title bar on page 266• Chart graphic on page 266• Chart display options on page 272
Cluster bar chart type
This type of chart is primarily used for comparisons across categories, butcan also be used to discover trends.
Horizontal bar chart
Categories are organized vertically, and values horizontally, to emphasizevariation of a data series over different categories. Each riser represents adata series, with the chart legend specifying the color for each data series.Each label on the vertical axis represents a category. Values are displayedon the horizontal axis.
Vertical bar chart
Categories are organized horizontally, and values vertically, to emphasizevariation of a data series over different categories. Each riser represents adata series, with the chart legend specifying the color for each data series.Each label on the horizontal axis represents a category. Values are displayedon the vertical axis.
For more information about bar charts, see Cluster bar charts on page 58.
BusinessObjects Voyager User's Guide 269
19User Interface ReferenceChart component reference

Stacked bar chart type
This type of chart is used for comparisons and to show the absolutecontributions of sets of values across categories.
Horizontal stacked bar chart
Categories are organized vertically, and values horizontally, to emphasizethe variation of several data series over different categories. Each riserrepresents all of the data series, with the chart legend specifying the colorfor each data series. Each label on the vertical axis represents a category.Values are displayed on the horizontal axis.
Vertical stacked bar chart
Categories are organized horizontally, and values vertically, to emphasizethe variation of several data series over different categories. Each riserrepresents all of the data series, with the chart legend specifying the colorfor each data series. Each label on the horizontal axis represents a category.Values are displayed on the vertical axis.
For more information about stacked bar charts, see Stacked bar charts onpage 59.
Percent stacked bar chart type
This type of chart is used for comparisons and to show the relativecontributions of sets of values across categories.
Horizontal percent stacked bar chart
Categories are organized vertically, and values horizontally, to emphasizethe variation of several data series over different categories. Each riserrepresents all of the data series, with the chart legend specifying the colorfor each data series. Each label on the vertical axis represents a category.Percentages are displayed on the horizontal axis.
270 BusinessObjects Voyager User's Guide
User Interface Reference19 Chart component reference

Vertical percent stacked bar chart
Categories are organized horizontally, and values vertically, to emphasizethe variation of several data series over different categories. Each riserrepresents all of the data series, with the chart legend specifying the colorfor each data series. Each label on the horizontal axis represents a category.Percentages are displayed on the vertical axis.
For more information about percent stacked bar charts, see Percent stackedbar charts on page 60.
3D bar chart type
This type of chart compares data points in three dimensions. The x-axis isthe category axis; the y-axis is the data series axis; and the z-axis is thevalue axis.
For more information about 3D bar charts, see 3D bar charts on page 61.
Multi-series line chart type
A line chart displays trends over time or categories. It is also available withmarkers displayed at each data value. Each line in a multi-series line chartcorresponds to a data series, with the chart legend specifying the color foreach data series. Each label on the horizontal axis represents a category.Values are displayed on the vertical axis.
For more information about line charts, see Multi-series line charts onpage 62.
Multi-series pie chart type
Pie charts display the sizes of items that compose a data series, proportionalto the sum of the items. A pie chart is used to show the relative contributionsof values, and is useful when you want to emphasize a significant elementin the data. Each pie in a multi-series pie chart represents a category; eachpie slice represents a data series.
BusinessObjects Voyager User's Guide 271
19User Interface ReferenceChart component reference

Note: Voyager automatically optimizes pie chart labels by identifying theminimum and maximum values, and labeling only the slices that are outsidethe lower 25% of this range.
Related Topics• Multi-series pie charts on page 63
Chart display options
The following options are available to customize your charts. You can accessthese options from the Properties tab.
ValuesOption
Text string up to 50 charactersName on page 273
Text string up to 255 charactersComments on page 273
DefaultCoolWarmHotLavenderRoseDesertForestOceanMonochrome
Palette on page 274
DefaultShadowPresentationPresentation Shadow
Style on page 274
Fonts set up by your system adminis-tratorFont on page 274
272 BusinessObjects Voyager User's Guide
User Interface Reference19 Chart component reference

ValuesOption
OffColumn and RowColumn onlyRow only
Suppress NULL Values on page 274
Yes, NoShow Parents on page 274
Yes, NoShow Visual Totals on page 275
Yes, NoShow Dimension Panel on page 275
Yes, NoShowHierarchical Labeling on page 275
Yes, NoShow Legend on page 275
Text string up to 50 charactersCategory Label on page 275
Text string up to 50 charactersValue Label on page 276
Text string up to 50 charactersData Series Label on page 277
Descriptions of chart display options
Name
This option defines the name of the chart component. The name is displayedin the chart's title bar, and is printed in the page header when you print achart. The name is also used to identify the chart on the Structure tab. Thedefault value is the name generated automatically by Voyager when the chartis created.
Comments
In addition to the chart's name, you can add comments to describe the chart,up to a maximum of 255 characters. Comments are optional and are notdisplayed on the chart component, but if you print a chart to a PDF document,the comments appear beneath the chart component.
BusinessObjects Voyager User's Guide 273
19User Interface ReferenceChart component reference

Palette
Voyager provides several predefined color palettes to help you customizeyour chart components.
Style
Voyager provides these styles for customizing your charts:
Visual effectsStyle
noneDefault
3D effectShadow
Black backgroundPresentation
Black background, 3D effectPresentation Shadow
Font
The fonts available in the Print dialog box and in the chart Properties tab aredefault fonts. Your system administrator can enable additional fonts.
Suppress NULL Values
This option defines how null values are displayed in the chart. The settingsrefer to the data as they would be represented in a crosstab component,even if there is no crosstab linked to the same query in your analysis.
For example, the "Row only" setting refers to the crosstab representation ofthe chart's data. If there were a crosstab linked to the same query that thechart is linked to, and if that crosstab contained entire rows of null values,then those rows would be suppressed. The corresponding changes are madeto the chart.
The default value is Off. For details, seeSuppress NULL Values on page 257.
Show Parents
This option toggles the display of single parent members on and off. Thedefault value is No, which means that parent members will not be displayed
274 BusinessObjects Voyager User's Guide
User Interface Reference19 Chart component reference

on the chart if their child members are displayed on the chart. For moreinformation, see Displaying parent members on page 72.
Show Visual Totals
This option toggles the display of visual totals on and off. The default valueis No. For more information, see Displaying visual totals on page 73.
Show Dimension Panel
This option toggles the chart dimension panel display on or off. Hiding thedimension panel allows the chart graphic to occupy more screen area. Thedefault value is Yes.
Show Hierarchical Labeling
When hierarchical labeling is on, the chart axis labels show the parent-childrelationships of the members. The default value is No. Hierarchical labelingis applied only when the Show Parents option is set to Yes.
Show Legend
Choose Yes if you want the chart legend to be displayed. The default valueis Yes.
Note: If there is limited space available in the chart component, the chartlegend is automatically removed.
Category Label
The category axis corresponds to one of the following axes, depending onthe type of chart:
Category AxisChart Type
HorizontalVertical cluster bar chart
HorizontalVertical stacked bar chart
HorizontalVertical percent stacked bar chart
BusinessObjects Voyager User's Guide 275
19User Interface ReferenceChart component reference

Category AxisChart Type
VerticalHorizontal cluster bar chart
VerticalHorizontal stacked bar chart
VerticalHorizontal percent stacked bar chart
Lower-left3D bar chart
HorizontalMulti-series line chart
Not applicableMulti-series pie chart
Value Label
The value axis corresponds to one of the following axes, depending on thetype of chart:
Value AxisChart Type
VerticalVertical cluster bar chart
VerticalVertical stacked bar chart
VerticalVertical percent stacked bar chart
HorizontalHorizontal cluster bar chart
HorizontalHorizontal stacked bar chart
HorizontalHorizontal percent stacked bar chart
Vertical3D bar chart
VerticalMulti-series line chart
Not applicableMulti-series pie chart
276 BusinessObjects Voyager User's Guide
User Interface Reference19 Chart component reference
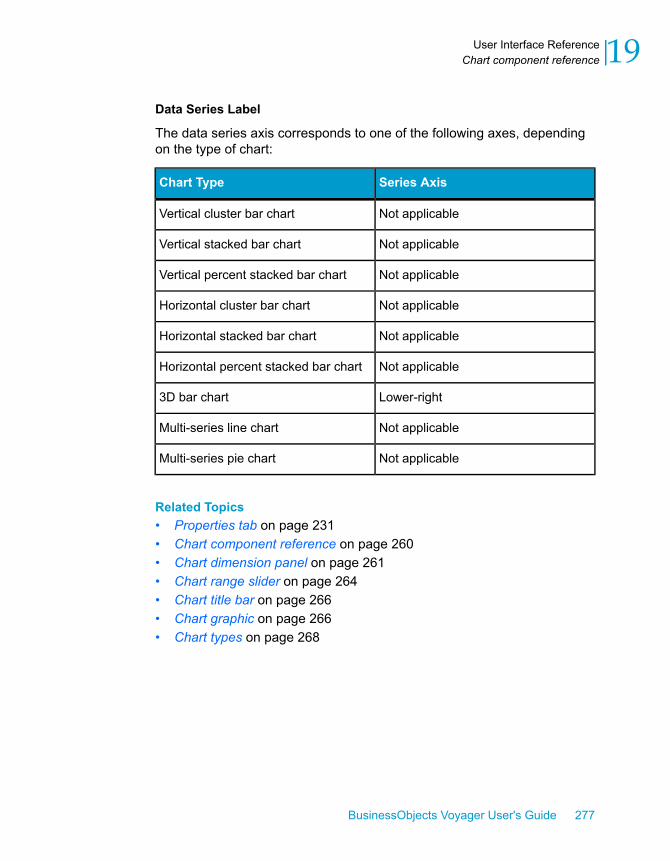
Data Series Label
The data series axis corresponds to one of the following axes, dependingon the type of chart:
Series AxisChart Type
Not applicableVertical cluster bar chart
Not applicableVertical stacked bar chart
Not applicableVertical percent stacked bar chart
Not applicableHorizontal cluster bar chart
Not applicableHorizontal stacked bar chart
Not applicableHorizontal percent stacked bar chart
Lower-right3D bar chart
Not applicableMulti-series line chart
Not applicableMulti-series pie chart
Related Topics• Properties tab on page 231• Chart component reference on page 260• Chart dimension panel on page 261• Chart range slider on page 264• Chart title bar on page 266• Chart graphic on page 266• Chart types on page 268
BusinessObjects Voyager User's Guide 277
19User Interface ReferenceChart component reference

Member Selector reference
The Member Selector is where you select members for displaying inyour crosstabs and charts. To open the Member Selector, click the MemberSelector button beside the name of a dimension in a crosstab or chart.
Additionally, you can change the member of the Measures or Key Figuresdimension by clicking the Member Selector button beside the Measures orKey Figures dimension name in the component title bar.
When you open the Member Selector, the member list is automaticallyexpanded to show all members that are currently displayed in the crosstabor chart.
The Member Selector dialog box can be resized by dragging the sizing handleat the lower-right corner.
278 BusinessObjects Voyager User's Guide
User Interface Reference19 Member Selector reference

For information about using the Member Selector to choose members foryour crosstabs and charts, see Overview of member selection on page 78.
Member Selector member tree
The Member Selector tree displays all members of the dimension in ahierarchical list. Members are indented to indicate which level of thedimension they belong to. The number of selected members is displayedabove the member tree.
Selecting individual members in the member tree
You can select individual members or ranges of members in several ways:
• Click individual members to select and deselect them.
• Hold down the Shift key as you click members, to select or deselectranges of members.
Note: If you deselect all members, the OK button in the Member Selectoris disabled because you must select at least one member for each dimensionon the crosstab.
For more information about selecting individual members, see Selectingindividual members from a list of all members on page 80.
Resizing the Member Selector dialog box
Member names may not be displayed fully in the default Member Selectordialog box size, because of long member names or large indents for low-levelmembers. The Member Selector can be resized to accommodate thesemember names by dragging the lower-right corner of the dialog box.
Member Selector functions
You can right-click a member in the Member Selector to access theseselection functions:
• All at this level—selects all members at the same level in the dimensionhierarchy as the current member.
BusinessObjects Voyager User's Guide 279
19User Interface ReferenceMember Selector reference

• Parent—selects the parent member of the current member.• Children—selects all child members of the current member.• Siblings—selects all sibling members of the current member. Siblings are
members at the same level that also have the same parent member.
Related Topics• Overview of member selection on page 78
Member Selector toolbar
Often, you can select or deselect members more efficiently by using thebuttons on the Member Selector toolbar:
Deselect all selected members. See MemberSelector Deselect All button on page 281.Deselect All
Select all members at a chosen level in the di-mension. See Member Selector Select Levelbutton on page 282.
Select Level
Toggle between showing all members withinthe dimension, and showing only the selectedmembers. See Member Selector Show Select-ed Members button on page 282.
ShowSelectedMem-bers/Show All Mem-bers
Select a display mode for member names andcaptions. The default mode is Caption. SeeMember Selector Display Mode button onpage 282.
Display Mode
Toggle between appending the parent namesto the member names, and just displaying themembers as chosen with the Display Modebutton. See Member Selector Show Parentbutton on page 283.
Show Parent
Search for members. See Member SelectorStart Search button on page 283.Start Search
280 BusinessObjects Voyager User's Guide
User Interface Reference19 Member Selector reference
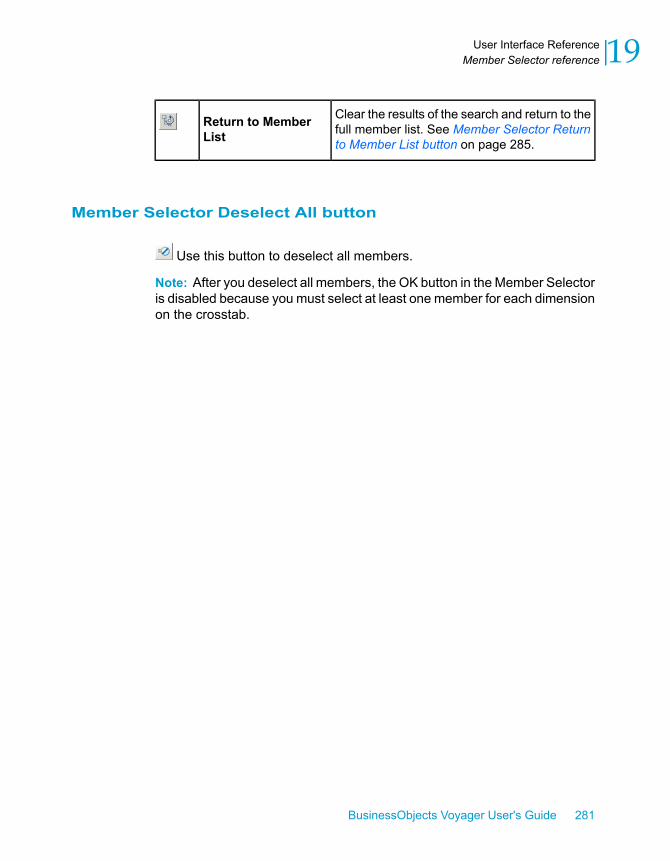
Clear the results of the search and return to thefull member list. See Member Selector Returnto Member List button on page 285.
Return to MemberList
Member Selector Deselect All button
Use this button to deselect all members.
Note: After you deselect all members, the OK button in the Member Selectoris disabled because you must select at least one member for each dimensionon the crosstab.
BusinessObjects Voyager User's Guide 281
19User Interface ReferenceMember Selector reference

For more information about deselecting members, see Deselecting memberson page 87.
Member Selector Select Level button
Use this button to select all members at a particular level in thedimension.
For more information about displaying all members at a particular level, seeSelecting all members at a particular level in the dimension on page 83.
Member Selector Show Selected Members button
Use the Show Selected Members button to toggle between showing allmembers within the dimension, and showing only the selected members.
For more information, see Showing only selected members in the MemberSelector on page 88.
Member Selector Display Mode button
Use this button to choose a display mode for member names andcaptions in the Member Selector. Choose from one of these available modes:
• Caption
• Name
• Caption : Name
• Name : Caption
282 BusinessObjects Voyager User's Guide
User Interface Reference19 Member Selector reference

For more information about displaying captions, see Displaying membernames and captions on page 89.
Member Selector Show Parent button
Use this button to toggle between appending the parent names to themember names, and just displaying the members as chosen with the DisplayMode button.
For example, if you toggle the display of parent members on, a membername might look like this: Wednesday (2002 > Qtr 2 > June > Wk 1).
For more information about displaying parent and child members, seeDisplaying the parent names of all members on page 89.
Member Selector Start Search button
The Member Selector provides search capabilities to help you selectmembers based on their names or captions. Use this button to initiate atext-based search.
Searching for members using a text string
You can type a text string in the text field at the top of the Member Selectorto search for members within the dimension. When you execute the search,the Member Selector finds all matching members, and displays them in ahierarchical view. That is, the member's level in the dimension is indicatedby its indent level in the Member Selector.
If no members match the search string, "No members found." is displayed.
You can search member names and captions. For details, see To searchfor member names or captions on page 82.
Use the Return to Member List button to clear the search results andreturn to the full member list. Any members that you selected from the searchresults remain selected.
Voyager uses the same search techniques as popular internet searchengines:
BusinessObjects Voyager User's Guide 283
19User Interface ReferenceMember Selector reference

Search ResultSearchString
Selects all members that contain the word book , such as book, library book , and book store .
Note: If you search for book , your search will not find amember named booklet . To find booklet , you could searchfor book* . See Using wildcards in your search on page 285.
book
Selects only members that contain the exact text inside thequotation marks.In this example, the search would find glass bowls but notglass soup bowls .
"glassbowls"
Multiple terms include an implicit AND, so in this example, thesearch would select all members that contain both the wordsglass and bowls :• glass bowls
• glass soup bowls
glass bowls
Selects members which contain either the word glass or theword bowls .The OR must be capitalized.In this example, the search would find members with thesenames:• glass bowls
• glass soup bowls
• soup bowls
• glass
Note: If OR is one of the words you want to search for, youmust enclose the OR in quotation marks: "OR" OR CA (to per-form a search for the states Oregon and California).
glass ORbowls
Note: Search terms are not case-sensitive. Searching for book is the sameas searching for Book or BOOK or boOk .
284 BusinessObjects Voyager User's Guide
User Interface Reference19 Member Selector reference

Using wildcards in your search
You can use wildcard characters in your search string. For example, if youwant to search for all SKU (Stock Keeping Unit) numbers beginning with"9348", you can specify the search string "9348*".
RepresentsWildcard
Represents a string of zero or more characters. For example, asearch for 9348* finds both 9348 and 934827AB .*
Member Selector Return to Member List button
Use this button to clear the search results and return to the full memberlist. Any members that you selected from the search results remain selected.
Rank Editor dialog boxUse the Rank Editor dialog box to define the parameters of the rank youwant to add to the crosstab.
You need to provide two parameters to define a rank: a condition and a value.
First you select one of the following conditions:
BusinessObjects Voyager User's Guide 285
19User Interface ReferenceRank Editor dialog box

• Top members by value.
• Bottom members by value.
• Top contributors to % of total.
• Bottom contributors to % of total.
Then you enter either the Number of Members value or a percentage. TheNumber of Members value can be any integer between 1 and 2^31 (2.14E9).
The sort direction applied by the rank operation depends on the selectedoperator. If you choose a "Top members by value" or "Top contributors to %of total" rank, the rank also applies a descending sort. If you choose a "Bottommembers by value" or "Bottom contributors to % of total" rank, the rank alsoapplies an ascending sort.
Related Topics• Ranking the data in the crosstab on page 100
Filter Editor dialog boxYou define filter conditions in the Filter Editor dialog box.
The following conditions can be used to define a filter:
286 BusinessObjects Voyager User's Guide
User Interface Reference19 Filter Editor dialog box

DescriptionCondition
Shows cells that are equal to a specified numeric value.equal to
Shows cells that are not equal to a specified numericvalue.not equal to
Shows cells that are less than a specified numeric val-ue.less than
Shows cells that are less than or equal to a specifiednumeric value.less than or equal to
Shows cells that are greater than a specified numericvalue.greater than
Shows cells that are greater than or equal to a specifiednumeric value.
greater than or equalto
Shows cells that are between two specified numericvalues, including cells that are equal to either of thenumeric values.
between two numbers
Shows cells that are not within the range specified bytwo numeric values. Cells that are equal to either of thenumeric values are not displayed.
outside two numbers
Shows cells that contain null values.missing
Related Topics• Filtering the data in crosstabs and charts on page 97
Set Variables dialog box (SAP only)Queries to an SAP query cube often rely on one or more variables. Whenvariables form part of the query, Voyager cannot return and display data untilyou have selected values for the variables that are part of the query.
To select (or enter) values for SAP query variables, use the Set Variablesdialog box. You are prompted with this dialog box any time a query must beexecuted.
BusinessObjects Voyager User's Guide 287
19User Interface ReferenceSet Variables dialog box (SAP only)

There are several actions performed while working in Voyager that make itnecessary to enter values for variables:
• Adding a connection.
• Opening a saved workspace.
• Navigating to a page for the first time in an open workspace.
• Manually refreshing data.
The Set Variables dialog box contains at least one row, and can containseveral, depending on the complexity of the data structure and the numberof variables set up by the SAP administrator in the SAP query cube. Eachrow represents a different variable.
Depending on the type of variable, there may be additional controls. Forexample, characteristic selection (complex) variables require an operator forcomparison to a value, so you must indicate the operator and the variablevalue.
If default or personalized variables are set up, rows of the Set Variablesdialog box may already contain values. You can accept these values, or youcan select different values.
Related Topics• Using Voyager with SAP on page 189
288 BusinessObjects Voyager User's Guide
User Interface Reference19 Set Variables dialog box (SAP only)

Connecting to OLAP datasources
20

This section describes how to add connections to OLAP data sources.
OLAP data connectionsBefore you can begin working with data in Voyager, you must add aconnection to the workspace.
A connection is a repository object that contains all the information that isrequired for Voyager to connect to an OLAP cube. Connections are createdand managed by your system administrator. Any connections created byyour system administrator appear in the list of connections in the ChooseConnection dialog box, and are available to be added to a Voyagerworkspace.
You can add several connections to your workspace, and use a differentconnection for each query in your workspace. However, once metadata hasbeen specified, the query and visual components are fixed to the connection.You cannot drag metadata from a different connection into this component.
290 BusinessObjects Voyager User's Guide
Connecting to OLAP data sources20 OLAP data connections
Note: For specific information about using SAP BW data sources, seeUsingVoyager with SAP on page 189 and the documentation for the BusinessObjectsIntegration Kit for SAP.
Related Topics• Adding an OLAP cube connection to a workspace on page 291• Changing to a different OLAP cube connection on page 292• Removing an OLAP cube connection from a workspace on page 293• Re-establishing a disabled connection on page 294
Adding an OLAP cube connection to aworkspace
On the Data tab, you can add OLAP data source connections to yourworkspace, and change your current connection to a different cube.
To add a data source connection to a workspace
1. Click Add Connection on the Data tab.2. In the Choose Connection dialog box, select the desired connection and
click OK.
Alternatively, you can double-click the desired connection.
3. If the connection requires authentication, type your credentials in theAuthentication dialog box and click OK.
If authentication succeeds, the connection appears in the activeconnections list, and the Data tab tree changes to reflect the newconnection. If authentication fails, see your system administrator. Yourcredentials may not be set up properly in the Central ManagementConsole, or the OLAP server may be offline.
Viewing OLAP data in the workspace
Once you have a connection added to your workspace, you can define aquery and begin working with your data in the analysis window. For
BusinessObjects Voyager User's Guide 291
20Connecting to OLAP data sourcesAdding an OLAP cube connection to a workspace

information on queries and how to define them, see Creating and definingqueries to answer your business questions on page 40.
Related Topics• OLAP data connections on page 290• Changing to a different OLAP cube connection on page 292• Removing an OLAP cube connection from a workspace on page 293• Re-establishing a disabled connection on page 294
Changing to a different OLAP cubeconnection
If you are currently working with one data source, but want to work with adifferent data source, you can change to a different connection on the Datatab. However, you cannot use data from the second connection in acomponent that already contains data from the first connection. You mustadd a new crosstab or chart, and add the data from the second connectionto that new component.
To change to a different data source connection
1. If the connection that you want to change to has not yet been addedto your workspace, click Add Connection on the Data tab.
Or, if the connection that you want to change to has already been addedto your workspace, select the connection from the connections list on theData tab. The contents of the member tree change to reflect the newconnection. Skip to step 4 of this procedure.
2. In the Choose Connection dialog box, select the desired connection andclick OK.
Alternatively, you can double-click the desired connection.
3. If the connection requires authentication, type your credentials in theAuthentication dialog box and click OK.
If authentication succeeds, the connection appears in the activeconnections list, and the Data tab tree changes to reflect the newconnection. If authentication fails, see your system administrator. Your
292 BusinessObjects Voyager User's Guide
Connecting to OLAP data sources20 Changing to a different OLAP cube connection

credentials may not be set up properly in the Central ManagementConsole, or the OLAP server may be offline.
4. Add a new crosstab or chart component to the analysis window.
You can now add data from the new connection to the new component.
Note: You cannot add data from the new connection to a component thatalready contains data from another connection.
Related Topics• OLAP data connections on page 290• Adding an OLAP cube connection to a workspace on page 291• Removing an OLAP cube connection from a workspace on page 293• Re-establishing a disabled connection on page 294
Removing an OLAP cube connectionfrom a workspace
On the Data tab, you can remove OLAP data source connections from yourworkspace.
To remove adata source connection fromaworkspace
1. In the connections area on the Data tab, select the connection you wantto remove from your workspace.
2. Click Remove Connection.
Alternatively, you can right-click the connection on the Data tab, andchoose Remove.
If any objects currently use that connection, a warning message appears.To confirm that those objects will be discarded, and the connectionremoved, click Yes.
Related Topics• OLAP data connections on page 290• Adding an OLAP cube connection to a workspace on page 291
BusinessObjects Voyager User's Guide 293
20Connecting to OLAP data sourcesRemoving an OLAP cube connection from a workspace
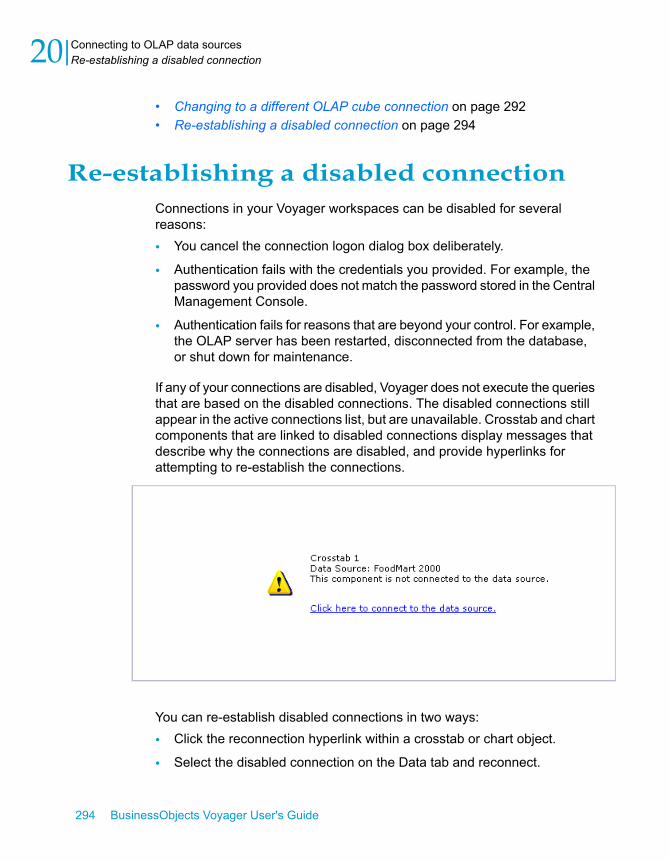
• Changing to a different OLAP cube connection on page 292• Re-establishing a disabled connection on page 294
Re-establishing a disabled connectionConnections in your Voyager workspaces can be disabled for severalreasons:
• You cancel the connection logon dialog box deliberately.
• Authentication fails with the credentials you provided. For example, thepassword you provided does not match the password stored in the CentralManagement Console.
• Authentication fails for reasons that are beyond your control. For example,the OLAP server has been restarted, disconnected from the database,or shut down for maintenance.
If any of your connections are disabled, Voyager does not execute the queriesthat are based on the disabled connections. The disabled connections stillappear in the active connections list, but are unavailable. Crosstab and chartcomponents that are linked to disabled connections display messages thatdescribe why the connections are disabled, and provide hyperlinks forattempting to re-establish the connections.
You can re-establish disabled connections in two ways:
• Click the reconnection hyperlink within a crosstab or chart object.
• Select the disabled connection on the Data tab and reconnect.
294 BusinessObjects Voyager User's Guide
Connecting to OLAP data sources20 Re-establishing a disabled connection

To re-establish a connection by clicking a hyperlinkwithin an object
1. Click the Click here to connect to the data source hyperlink within acrosstab or chart object.
2. If required, enter your logon credentials.
To re-establish a connection from the Data tab
1. Select the disabled connection from the list on the Data tab.
A "Click here to connect to the data source" hyperlink is displayed on theData tab.
2. Click the link and enter your logon credentials if required.
Alternatively, you can right-click the disabled connection on the Data tab,click Reconnect, and enter your logon credentials if required.
Related Topics• OLAP data connections on page 290• Adding an OLAP cube connection to a workspace on page 291• Changing to a different OLAP cube connection on page 292• Removing an OLAP cube connection from a workspace on page 293
BusinessObjects Voyager User's Guide 295
20Connecting to OLAP data sourcesRe-establishing a disabled connection

296 BusinessObjects Voyager User's Guide
Connecting to OLAP data sources20 Re-establishing a disabled connection

Get More Help
A
Online documentation library
Business Objects offers a full documentation set covering all products andtheir deployment. The online documentation library has the most up-to-dateversion of the Business Objects product documentation. You can browsethe library contents, do full-text searches, read guides on line, and downloadPDF versions. The library is updated regularly with new content as it becomesavailable.
http://support.businessobjects.com/documentation/product_guides/
Additional developer resources
http://devlibrary.businessobjects.com
Online customer support
The Business Objects Customer Support web site contains information aboutCustomer Support programs and services. It also has links to a wide rangeof technical information including knowledgebase articles, downloads, andsupport forums.
http://www.businessobjects.com/support/
Looking for the best deployment solution for your company?
Business Objects consultants can accompany you from the initial analysisstage to the delivery of your deployment project. Expertise is available inrelational and multidimensional databases, in connectivities, database designtools, customized embedding technology, and more.
For more information, contact your local sales office, or contact us at:
http://www.businessobjects.com/services/consulting/
Looking for training options?
From traditional classroom learning to targeted e-learning seminars, we canoffer a training package to suit your learning needs and preferred learningstyle. Find more information on the Business Objects Education web site:
http://www.businessobjects.com/services/training
298 BusinessObjects Voyager User's Guide
Get More HelpA

Send us your feedback
Do you have a suggestion on how we can improve our documentation? Isthere something you particularly like or have found useful? Drop us a line,and we will do our best to ensure that your suggestion is included in the nextrelease of our documentation:
mailto:[email protected]
Note: If your issue concerns a Business Objects product and not thedocumentation, please contact our Customer Support experts. For informationabout Customer Support visit: http://www.businessobjects.com/support/.
Business Objects product information
For information about the full range of Business Objects products, visit:http://www.businessobjects.com.
BusinessObjects Voyager User's Guide 299
AGet More Help

300 BusinessObjects Voyager User's Guide
Get More HelpA

Index3D bar charts 61, 244, 271
Aactive slice member, definition of 143adding
a chart 32, 63, 244a crosstab 35, 244a data connection 291data 40data to charts 66queries 229, 230
aggregate storage, Essbase 206aggregates 116, 243alias tables, Essbase 206, 213, 222analysis window 218, 219analysis window, definition 26application toolbar. See toolbar 233arithmetic calculations 129ascending sort 92, 239Attribute Calculations dimension 210attribute dimensions, Essbase 206, 207, 208authentication 30automatically removed sorts, filters, and ranks
97autosave 164, 166averages 116axes 52, 247axis, definition 26
Bbar chart 270bar charts 58, 244, 269, 270, 271blank cells 255
BusinessObjects Enterprise 16
Ccalculations
adding to crosstab 238adding, editing, and deleting 123arithmetic 122basic 122custom 124mathematical 124, 129overview 116statistical 124time-based 124visual totals 116, 243
calculations, custom 127captions 81, 280
modifying page 161captions and names 89, 252, 263categories, definition 260category dimensions 260Category Label property 273Central Management Console 16changing dimensions. See swapping
dimensions 140characteristic variables, SAP 195characteristics, SAP 201, 202chart, definition 26charts 56, 218
3D bar 61, 271adding data to 66adding to page 32, 63, 244axis labels 74bar charts 58captions 267
BusinessObjects Voyager User's Guide 301

charts (continued)chart graphic 266chart types 66, 268cluster bar 269colors 71, 268customizing 69data types 268defining queries in 67dimension panel 73, 261displaying parent members 72displaying visual totals 73drop zones 262font 72hide range slider 264hierarchical labels 74legend 74line charts 62, 271modifying queries 67name and comments 70nested dimensions 268overview scroll bar 264paging 264percent stacked bar 270percent stacked bar charts 60pie charts 63, 271properties 69, 231, 272range slider 68, 264reference 260scrolling 68, 264stacked bar charts 59, 270styles 71, 268title bar 266with large data sets 68, 267
child members 84cluster bar charts 58, 244, 269color, applying to cells 108, 242colors, chart 71column axis, definition 247column dimensions 246column members 246column width 257columns, resizing 156
Comments property 257, 273comparing changes 150components
connecting 229copying 150moving 229
connecting components to queries 51connecting to OLAP data 290connections 221, 290
adding 222, 291changing 292data 220disabled 294removing 222, 293
connections, definition 26copying a component 237copying components 150, 237counts 116, 243creating a new workspace 26, 30crosstab 218, 247
adding to page 35, 244buttons 255changing column width 156changing row height 156data format 154definition 26dimension panel 250filtering data 97, 241grid 252pivoting 140properties 231, 256ranking data 100, 241reference 246title bar 250
csv file, exporting data to 175cube connections 290cubes 20, 21
changing to different 292sample connections 30
currency variables, SAP 199custom aggregate 228customizing charts 69
302 BusinessObjects Voyager User's Guide
Index
customizing crosstabs 256
Ddata
adding 40adding to charts 66connections 221, 290displaying in crosstab 247filtering 97, 241ranking 100, 241sorting 239
data cube, illustration of 21data series
definition 260dimension 260
Data Series Label property 273data source
changing to different 292Data tab 40, 45, 220decimal places 154default variables, SAP 194defining queries 40definitions 26, 247, 260deleting 32
a chart 238, 260a crosstab 238, 246a data connection 293dimensions 141members 85queries 52, 230
descending sort 92, 239dimension panel 246, 250, 260, 261dimension tables 186dimension, definition 21, 26dimensions 224, 246, 247
attribute 208description of 22in Microsoft SQL Server 2005 186nesting 49, 142removing 141, 252selecting members 80, 279
dimensions (continued)slice 247swapping 140, 243, 255
disabled connections 294disconnecting components 51display folders 186Display Formatted Cell Values property 257Display NULL Values As property 257displaying data in the crosstab 247distributing Voyager workspaces 164, 167drill through 148
exporting data from 149relational data viewer 149
drilling down 144expanding a parent member 145, 147focusing on children 146
drilling up 145, 146, 147collapsing members 145, 146, 147displaying parent members 146
drop zone 32, 40, 45, 52, 142, 151, 219, 251, 252, 262
drop zones, definition 247, 260dynamic time series, Essbase 206, 212
Eediting charts 69email 168, 170empty cells 255Essbase. See Oracle Hyperion Essbase data
sources 206, 207Excel, exporting data to 174, 236exceptions, highlighting. See highlighting
exceptions 108expanded drill 144exporting data
to .csv file 175to Excel 174to Microsoft Excel or .csv file 236
BusinessObjects Voyager User's Guide 303
Index

Ffact dimension, definition 26fact tables 186filter and rank combined 104filter and sort combined 104filter editor dialog box 286filtering data 97
clearing a filter 99multiple filters 99using the toolbar button 241
filters, removing 99, 100filters, sorts, and ranks 243focused drill 144Font property 273font, chart 72formatting 154
data in the crosstab 154using the toolbar button 242
formula variables, SAP 199
Gglobal exception highlighting 109, 256graphs. See charts 56grid, crosstab 252
Hhelp, online 246hidden hierarchies, SAP 200hidden sorts, filters, and ranks 103, 243hiding members 85hiding tab panel 235hierarchies, in Microsoft SQL Server 2005 186hierarchy 22, 224hierarchy node variables, SAP 195hierarchy variables, SAP 196highlighting exceptions 109, 242
adding a range 111changing a range 113changing colors 113
highlighting exceptions (continued)deleting a range 112overview 108removing 114using the toolbar button 242
Iicons 252inactivity timeout 164, 166inbox, InfoView 168InfoView 16, 30inserting a chart 244inserting a crosstab 244
Kkey date variables, SAP 198key figures dimension 224key figures, SAP 201, 278
Llarge data sets 267leaf member 224line charts 62, 244, 271linked components 52, 56linking components to queries 51linking, reports 171
Mmain window 219maintaining hierarchies in sorts 239mandatory variables, SAP 193maximize 32, 151measure formatting 242measure groups 186measure, definition 26measures 278
changing 85
304 BusinessObjects Voyager User's Guide
Index

measures dimension 224, 250, 266measures drop zone 252Member Selector 26, 78
Deselect All button 281deselecting members 87Display Mode button 282functions 279parent names 89reference 278Return to Member List button 285searching for members 81, 283Select Level button 282selecting individual members with 80, 279selecting members by level 83selecting parent, child, or sibling members
84Show Parent button 283Show Selected Members button 282showing only selected members 88Start Search button 283toolbar 280using with SAP 191
member, definition 21, 26members 224, 279
calculated 238hiding 85parent names 89row and column 80selecting 278
metadata explorer 40, 45, 78, 218, 224, 226metadata explorer, definition 26MetaRead permissions, Essbase 206Microsoft SQL Server 2005 186
hierarchies 188modifying the slice of data 143moving average calculations 135moving components 151moving components to other queries 51multiple structures, SAP 200
NName property 257, 273names and captions 89, 252, 263negative numbers 154nested dimensions 45, 49, 142
changing order of 143creating 142
null values, excluding 104, 255number formatting 154
OOLAP (Online Analytical Processing) 20OLAP server, connecting to 290OLTP (Online Transaction Processing) 20online help 246openDocument 171opening a workspace 26opening existing workspaces 170optional variables, SAP 193Oracle Hyperion Essbase data sources 206
alias tablessearching captions 215setting active table 214
Attribute Calculations dimension 210attribute dimensions 207, 224Dynamic Time Series
in calculations 212
Ppage tabs 218pages 160
adding and deleting 160renaming 161
paging control 218Palette property 273parallel period calculations 134parent member 84, 224parent names 89PDF file, creating 178
BusinessObjects Voyager User's Guide 305
Index
percent stacked bar chart 60, 244, 270percentage calculations 132percentage, number format 154period to date calculations 135period-to-date, Essbase 212personalized variables, SAP 194perspectives 186pie charts 63, 244, 271pivoting the crosstab 140, 243, 247, 255printing 178, 236
charts 181crosstabs 180options 182raw data 179to PDF 178
prior period calculations 134Properties tab 231public folder 167publishing 16, 167
Qqueries 40
adding 48, 229complex 49defining 32, 40defining using a chart 67deleting 52explained 52linking components 51modifying 45new 51undefined 48
query, definition 26
Rragged hierarchies 203range slider 68rank and filter combined 104rank and sort combined 104rank calculations 136
rank editor dialog box 285ranking data 100, 241
clearing a rank 102multiple ranks 102
ranks, filters, and sorts 243reconnecting 294relational data 148relational table viewer 149removing 293
a data connection 293a filter 99a rank 102a sort 96crosstabs or charts 238dimensions 141, 252, 263members 85queries 230
renaming pages 161reorienting the crosstab 247report linking 171resizing columns 156resizing components 151resizing rows 156restore 32restore tab panel 235restricted key figures, SAP 200restrictions, MetaRead permissions 206row axis, definition 247row dimension 246row height 257row member 246rows, resizing 156
Ssample cubes 30SAP 201
characteristics 201, 202hidden hierarchies 200key figures 201logging on 190multiple structures 200
306 BusinessObjects Voyager User's Guide
Index

SAP (continued)restricted key figures 200set variables dialog box 287string properties 202structures 200variables 190, 195, 222
saving workspaces 164, 166, 167, 235scaling values 154scientific, number format 154scrolling through charts 68, 264searching for members 81, 283selecting all data cells 256selecting members 78, 80, 278
by level 83deselecting 87parent, child, or sibling 84
sending Voyager workspaces to others 168, 170
server, number format 154server. See OLAP server 290session timeout 164, 166set variables (SAP) 287Set Variables dialog box 191sharing Voyager workspaces 167, 168, 170sharing Voyager workspaces using
openDocument 171Show Dimension Panel property 273Show Hierarchical Labeling property 273Show Legend property 273Show Parents property 273Show Visual Totals property 273sibling members 84slice 21slice axis, definition 247slice dimension
multiple members 228slice dimensions 246, 247, 260
changing the slice 143slice member 86slice, definition 26, 52, 86sort and filter combined 104sort and rank combined 104
sorting data 92clearing a sort 96on swapped dimensions 100, 103using the toolbar button 239within hierarchies 95
sorts, automatically removed 97sorts, filters, and ranks 243SQL Server 2005. See Microsoft SQL Server
2005 186stacked bar chart 59, 244, 270stacked dimensions. See nested dimensions
142string properties 202Structure tab 48, 229structures, SAP 200Style property 273summaries 116summary calculations 130sums 116, 243Suppress NULL Values property 257, 273suppressing null values 255swap axis 140, 255swapping dimensions 140
containing sorts, filters, or ranks 97, 100, 103
description of 243, 255using the toolbar button 243, 255
Ttab panel 218
definition 26hiding and restoring 235reference 220
terms and definitions 26text wrapping 257thousands separator 154time calculations 133time dimension 224timeout 164, 166title bar 246, 250, 260, 266toggle tab panel 235
BusinessObjects Voyager User's Guide 307
Index

toolbar 218Calculation button 238chart buttons 244Copy button 237Crosstab button 244Delete button 238Display Member Settings button 243Exception Highlighting button 242Export button 236Filter button 241Formatting Measures button 242Help button 246overview 234Paste button 237Print button 236Rank button 241reference 233Save button 235Select All button 256Sort button 239Suppression button 255Swap Axis button 243, 255View Tab Panel button 235Visual Totals button 243
toolbar, Member Selector 280tooltips 259totals 116, 243
Uunbalanced hierarchies 203URL syntax for openDocument 171
VValue Label property 273variables, SAP 190, 191, 195, 222variance and standard deviation calculations
131view tab panel 235visual totals 116, 243
changing 120on charts 122removing 120with filtered data 121with nested dimensions 121
visual totals, displaying 73
Wwildcards 283workspace, definition 26workspaces 26
creating new 26, 30distributing 164, 167exporting to Microsoft Excel or .csv file 236opening 26, 170printing 178, 236reference 218saving 164, 166, 167, 235sending to others 168, 170sharing using openDocument 171
wrapping text 257
Zzeroes 255
308 BusinessObjects Voyager User's Guide
Index