wydział elektrotechniki, elektroniki, informatyki - cire.pl · wydział elektrotechniki,...
TRANSCRIPT
Wydział Elektrotechniki, Elektroniki, Informatyki
i Automatyki
PRACA DYPLOMOWA MAGISTERSKA
Capacity markets
Rynki zdolności wytwórczych
Autor: Izabela Musiał
Nr albumu: 193723
Kierujący pracą: Prof. dr hab. Władysław Mielczarski
Łódź, 24 czerwca 2015
1
2
TABLE OF CONTENTS
1. INTRODUCTION 5
1.1 OBJECTIVES 5
1.2 THESIS STRUCTURE AND ORGANIZATION 5
2. ELECTRICITY MARKET OPERATION 6
2.1. TYPES OF ENERGY MARKETS 6
2.1.1. MONOPOLY 6
2.1.2 PURCHASING AGENCY (SINGLE BUYER) 8
2.1.3 WHOLESALE MARKET 10
2.1.4 WHOLESALE AND RETAIL MARKET 11
2.2. POOL VS. BILATERAL MARKET 12
2.2.1 POOL MARKET 13
2.2.2 BILATERAL MARKET 15
2.2.3 THE DIFFERENCES BETWEEN POOL AND BILATERAL CONTRACTS 15
CONTRACTS FOR DIFFERENCES (CFD) 17
BALANCING MARKET 18
2.3 COPPER PLATE VS. NODAL 19
2.3.1 NODAL PRICING 19
2.3.2 COPPER PLATE (UNIFORM PRICING) 20
2.3.3 COMPARISON 20
2.4 ANCILLARY SERVICES (AS) 21
2.4.1 FREQUENCY CONTROL 21
2.4.2 VOLTAGE CONTROL 23
2.4.3 BLACK START 23
2.4.4 BALANCING 23
2.4.5 REMOTE GENERATION CONTROL 23
2.4.6 GRID LOSS COMPENSATION 23
2.4.7 EMERGENCY CONTROL ACTIONS 24
2.4.8 DISTRIBUTED GENERATION (DG) ACTING AS AS 24
2.5 ENERGY ONLY MARKET 25
STORAGE 26
3
INVESTMENT COSTS 26
DAILY AND ANNUAL DEMAND CURVE – VOLL, 'MISSING MONEY' AND 'MISSING CAPACITY'
PROBLEMS 26
CHANGE OF ATTITUDE 30
DEMAND SIDE RESPONSE (DSR) 30
REGULATIONS IN THE DEREGULATED MARKET 31
3. CAPACITY MARKET 33
3.1. CAPACITY MECHANISMS 33
4. AN OVERVIEW OF ENERGY MARKETS 36
4.1. USA 36
4.1.1 PJM 40
DAY-AHEAD MARKET 41
REAL-TIME MARKET 41
ANCILLARY SERVICES 41
FINANCIAL TRANSMISSION RIGHTS 42
RELIABILITY PRICING MODEL 42
4.1.2 ISO NEW ENGLAND 43
DAY-AHEAD ENERGY MARKET 44
REAL-TIME ENERGY MARKET 44
ANCILLARY SERVICES 44
FINANCIAL TRANSMISSION RIGHTS 45
ISO NEW ENGLAND MARKET SUMMARY 47
4.2 UNITED KINGDOM 47
4.2.1 CONTRACTS FOR DIFFERENCES 50
4.3.2 CAPACITY MARKET 54
4.2.3 CARBON PRICE FLOOR 59
4.2.4 EMISSIONS PERFORMANCE STANDARDS 60
4.2.5 CONCLUSIONS FROM BRITISH MARKET 61
4.3 FRANCE 62
4.3.1 CAPACITY OBLIGATIONS 65
4.4 SPAIN 66
4.4.1 NEW CAPACITY INVESTMENT COMPENSATION 70
4
4.4.2 REMUNERATION TO THE EXISTING PLANTS 70
4.5 SWEDEN 71
4.5.1 ENERGY MARKET 72
4.5.2 CAPACITY MECHANISMS 73
4.6 SUMMARY 73
5 POLISH POWER MARKET 76
5.1 HISTORY 76
5.2 OVERVIEW OF ENERGY MARKET IN POLAND 78
5.3 ORGANIZATION OF THE ENERGY MARKET 80
5.4 CAPACITY MECHANISMS 85
5.4.1 OPERATIONAL RESERVE 85
5.4.2 INTERVENTION COLD RESERVE 86
5.5 POLISH ENERGY MARKET SITUATION 87
6. POSSIBLE CAPACITY MECHANISMS IN POLAND 89
6.1 CENTRALIZED CAPACITY MARKET 89
6.2 DECENTRALIZED CAPACITY MARKET 91
6.3 CONTRACTS FOR DIFFERENCE 93
6.4 CONCLUSIONS 94
7. BILIOGRAPHY 96
8. SUMMARY 102
8. STRESZCZENIE 102
5
1. INTRODUCTION 1.1 Objectives
The main purpose of this thesis is to present the current situation of the Polish energy market, the safety of energy system and possible capacity mechanisms that could improve it. In order to do so, the types of energy market and capacity mechanism are described. Since a lot of countries introduced some of the possible capacity mechanisms there is a brief description of chosen solutions that can be taken as a base for establishing capacity mechanisms in Poland.
1.2 Thesis structure and organization The thesis consists of 6 main chapters divided into subchapters:
1. Introduction and thesis structure
2. An overview of energy market structure
3. An overview of possible capacity mechanisms
4. An overview of capacity mechanisms in selected countries
5. An overview of Polish energy market
6. Proposals of improvement of energy security in Poland
At the end of this thesis there is a bibliography and abstract in Polish and English.
6
2. ELECTRICITY MARKET OPERATION 2.1. Types of energy markets
Since the history of energy markets reaches the first half of the 20th century many types and structures has developed.
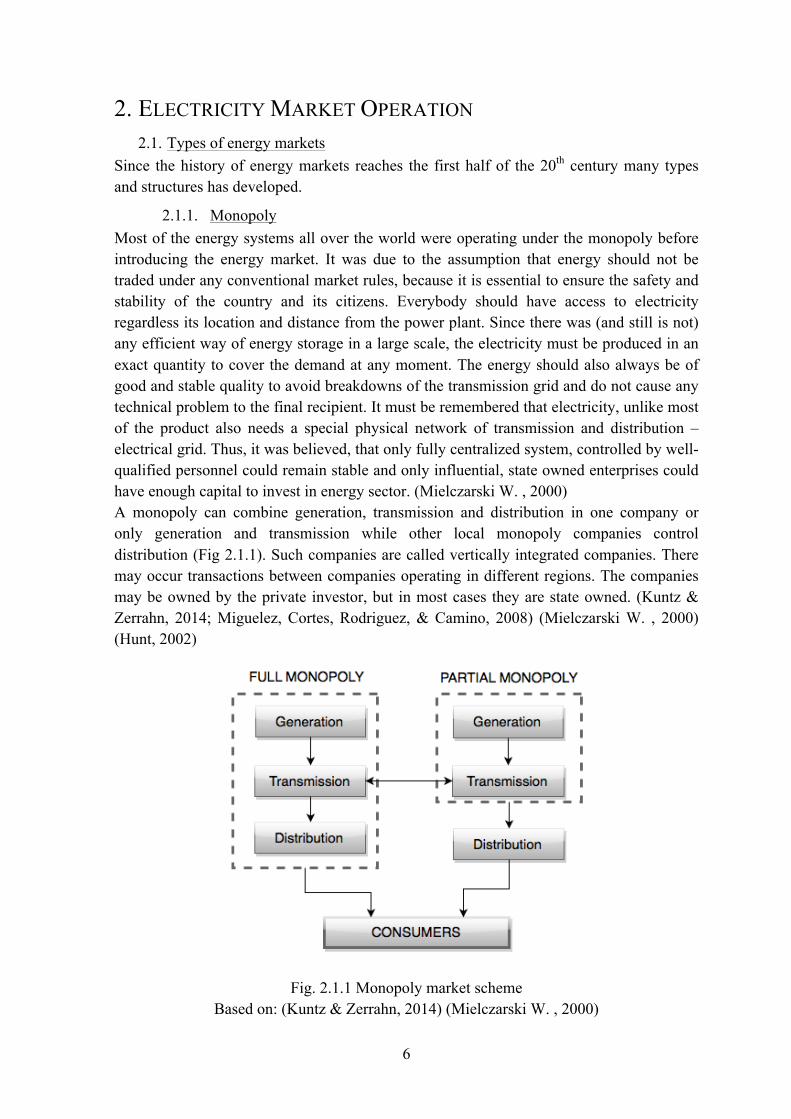
2.1.1. Monopoly Most of the energy systems all over the world were operating under the monopoly before introducing the energy market. It was due to the assumption that energy should not be traded under any conventional market rules, because it is essential to ensure the safety and stability of the country and its citizens. Everybody should have access to electricity regardless its location and distance from the power plant. Since there was (and still is not) any efficient way of energy storage in a large scale, the electricity must be produced in an exact quantity to cover the demand at any moment. The energy should also always be of good and stable quality to avoid breakdowns of the transmission grid and do not cause any technical problem to the final recipient. It must be remembered that electricity, unlike most of the product also needs a special physical network of transmission and distribution – electrical grid. Thus, it was believed, that only fully centralized system, controlled by well-qualified personnel could remain stable and only influential, state owned enterprises could have enough capital to invest in energy sector. (Mielczarski W. , 2000) A monopoly can combine generation, transmission and distribution in one company or only generation and transmission while other local monopoly companies control distribution (Fig 2.1.1). Such companies are called vertically integrated companies. There may occur transactions between companies operating in different regions. The companies may be owned by the private investor, but in most cases they are state owned. (Kuntz & Zerrahn, 2014; Miguelez, Cortes, Rodriguez, & Camino, 2008) (Mielczarski W. , 2000) (Hunt, 2002)
Fig. 2.1.1 Monopoly market scheme
Based on: (Kuntz & Zerrahn, 2014) (Mielczarski W. , 2000)
7
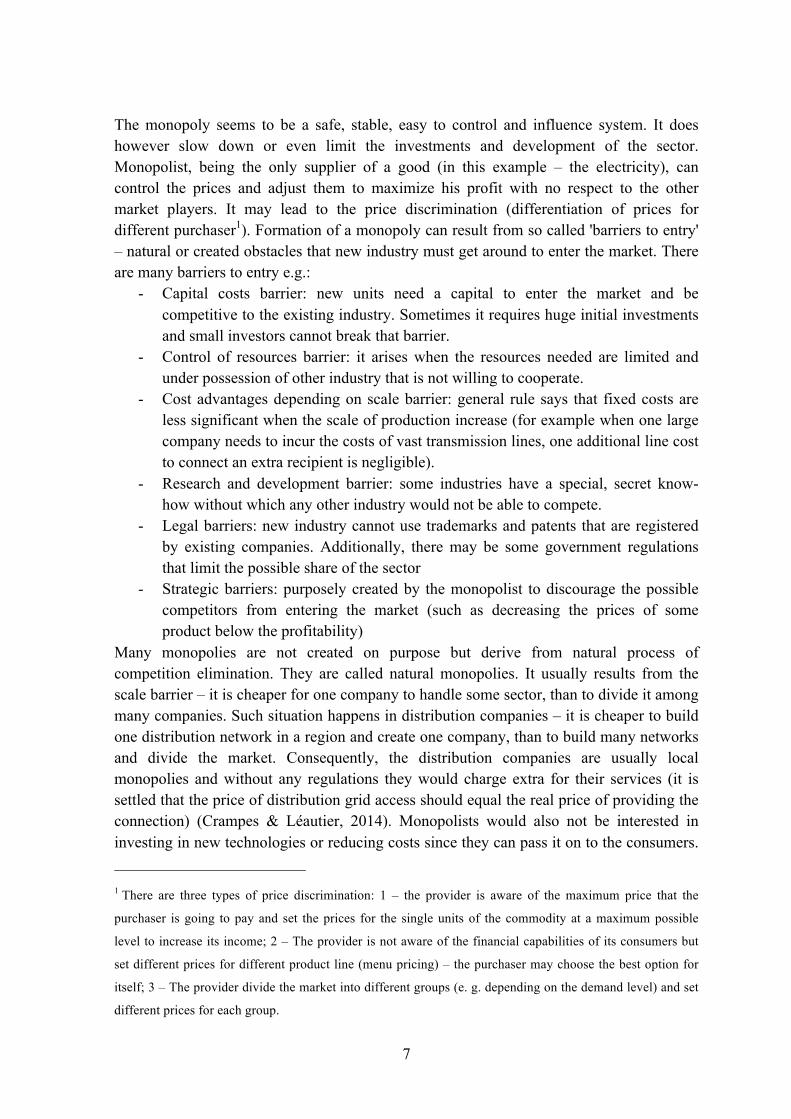
The monopoly seems to be a safe, stable, easy to control and influence system. It does however slow down or even limit the investments and development of the sector. Monopolist, being the only supplier of a good (in this example – the electricity), can control the prices and adjust them to maximize his profit with no respect to the other market players. It may lead to the price discrimination (differentiation of prices for different purchaser1). Formation of a monopoly can result from so called 'barriers to entry' – natural or created obstacles that new industry must get around to enter the market. There are many barriers to entry e.g.:
- Capital costs barrier: new units need a capital to enter the market and be competitive to the existing industry. Sometimes it requires huge initial investments and small investors cannot break that barrier.
- Control of resources barrier: it arises when the resources needed are limited and under possession of other industry that is not willing to cooperate.
- Cost advantages depending on scale barrier: general rule says that fixed costs are less significant when the scale of production increase (for example when one large company needs to incur the costs of vast transmission lines, one additional line cost to connect an extra recipient is negligible).
- Research and development barrier: some industries have a special, secret know-how without which any other industry would not be able to compete.
- Legal barriers: new industry cannot use trademarks and patents that are registered by existing companies. Additionally, there may be some government regulations that limit the possible share of the sector
- Strategic barriers: purposely created by the monopolist to discourage the possible competitors from entering the market (such as decreasing the prices of some product below the profitability)
Many monopolies are not created on purpose but derive from natural process of competition elimination. They are called natural monopolies. It usually results from the scale barrier – it is cheaper for one company to handle some sector, than to divide it among many companies. Such situation happens in distribution companies – it is cheaper to build one distribution network in a region and create one company, than to build many networks and divide the market. Consequently, the distribution companies are usually local monopolies and without any regulations they would charge extra for their services (it is settled that the price of distribution grid access should equal the real price of providing the connection) (Crampes & Léautier, 2014). Monopolists would also not be interested in investing in new technologies or reducing costs since they can pass it on to the consumers.
1 There are three types of price discrimination: 1 – the provider is aware of the maximum price that the
purchaser is going to pay and set the prices for the single units of the commodity at a maximum possible
level to increase its income; 2 – The provider is not aware of the financial capabilities of its consumers but
set different prices for different product line (menu pricing) – the purchaser may choose the best option for
itself; 3 – The provider divide the market into different groups (e. g. depending on the demand level) and set
different prices for each group.
8
These are only some of the reasons that the monopoly needs to be supervised by the regulator who would control their actions and set some targets to encourage development. There is a problem however how the regulator can determine those targets. Such regulator is almost always not fully aware of the company's potential so it do not know how much such company can improve its production. According to Jean-Jacques Laffont and Jean Tirole the best way is to accept that there is an asymmetry of information between the generator and regulator. The regulator, bearing in mind this asymmetry, proposes an array of possible contracts among which the generator can choose. The company chooses the contract that best fit its situation. The contracts that require more cost-generating improvements in generators performance provide the generator with high informational rent. But even the regulator would have to be allocated to particular company and therefore be not completely objective. The only way to reduce costs and prompt development is to implement the competition. (Gulczyński, 2009) Breaking the monopoly and allowing private companies to the sector in every country that underwent this revolution was a complicated and long process. The main target was to reduce the costs of energy generation, transmission and distribution with guaranteeing the competitiveness in the market. The introduction of new entities to the market could not lead to the reduction of electricity's quality and destabilization of the system. The main assumptions made in the energy market (Mielczarski W. , 2000):
- Electric energy should be treated as any other product and follow the market rules: it can be generated and sold on the competitive markets
- Electricity transmission is a service provided by the Transmission System Operators (TSOs) and Distribution System Operators (DSOs)
- TSOs and DSOs are operating under local monopolists and they need to be regulated by the special regulating authority.
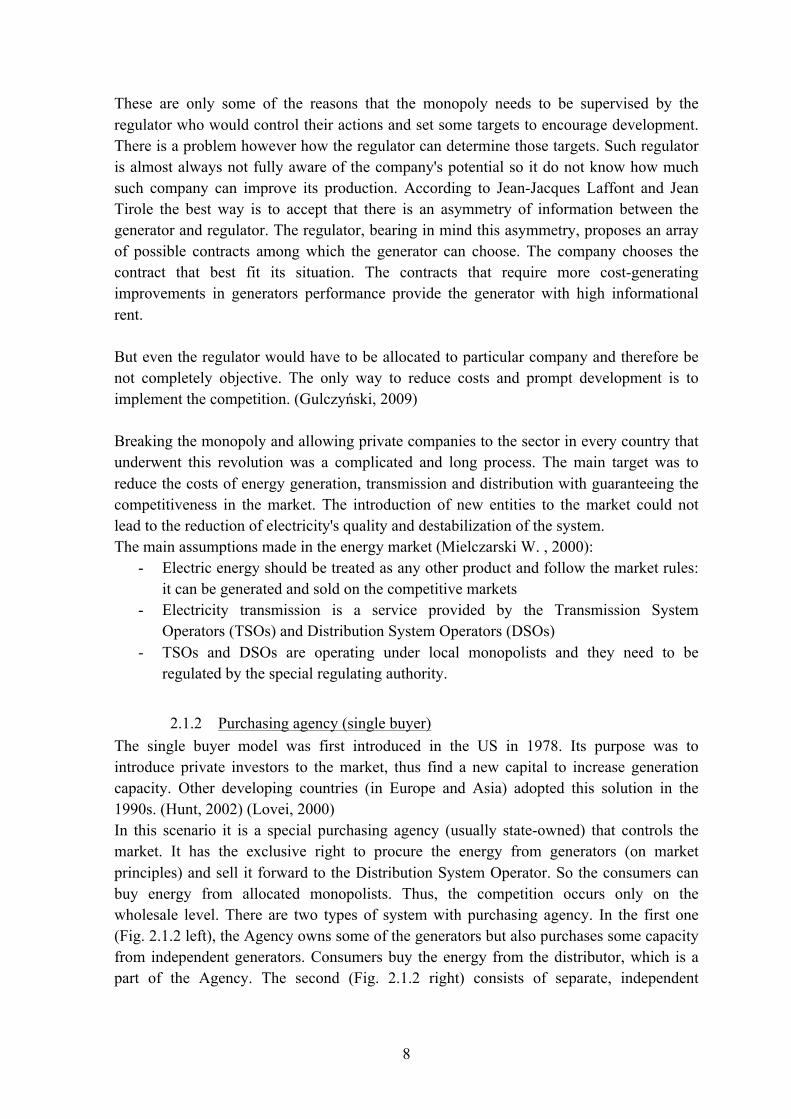
2.1.2 Purchasing agency (single buyer) The single buyer model was first introduced in the US in 1978. Its purpose was to introduce private investors to the market, thus find a new capital to increase generation capacity. Other developing countries (in Europe and Asia) adopted this solution in the 1990s. (Hunt, 2002) (Lovei, 2000) In this scenario it is a special purchasing agency (usually state-owned) that controls the market. It has the exclusive right to procure the energy from generators (on market principles) and sell it forward to the Distribution System Operator. So the consumers can buy energy from allocated monopolists. Thus, the competition occurs only on the wholesale level. There are two types of system with purchasing agency. In the first one (Fig. 2.1.2 left), the Agency owns some of the generators but also purchases some capacity from independent generators. Consumers buy the energy from the distributor, which is a part of the Agency. The second (Fig. 2.1.2 right) consists of separate, independent
9
distributions that submit their bids to the purchasing agency. Then, the energy is sold to distribution companies that sign contracts with the final consumers. (Hunt, 2002)
Fig. 2.1.2 Purchasing agency system with vertically integrated company (left) and fully
independent system (right) Based on: (Kuntz & Zerrahn, 2014) (Hunt, 2002)
The Agency establishes energy price and loads distribution. Its role is to control the market development and set targets (such as share of certain technologies and fuel, location of generators), by introducing different strategies. Since above-mentioned targets are specified only by the purchasing agency the competition between generators is strongly limited. It may hamper the development of new technologies, and cost minimization based on the generators' location or efficiency. The prices of generated electricity is always regulated and based on the long-term usually life-of-the-plant contracts between purchasing agency and generators. The contracts consist of two parts: fixed costs and variable costs. Such contracts are the only way to obtain assurance that the investor who builds the new generator will have someone to sell it to (so the investment would be profitable). If there were many purchasers on the market, no need for long-term contracts would occur – there would be probably always someone willing to sign short-term contracts with generator. Additionally, some of the contracts are nondispatchable. Independent generators are afraid, that the purchasing agency will be favorable towards its own generators (when vertically integrated companies exist) or towards for some reasons privileged generators. To secure themselves, they sign contracts according to which their share cannot be changed. So the generator gives take-or-pay quote and becomes the only one to decide when it should generate. Nondispatchable contracts can be signed only with very few small generators; otherwise the purchasing agency would have no control over dispatch (Hunt, 2002).
10
A problem occurs when in some country (this happens often in Asia) it is a foreigner investor who wants to invest in generation. Those generators also sign long-term contracts, however not in the local currency but dollars or other strong currency. This brings additional risk connected with the exchange rate. In Mexico in 1999 a reform was introduced to deal with this problem – all the exchange rate costs were weighed on the consumers. Purchasing agency ensures the easy balancing between the demand and supply. The transmission and dispatch are done by one agency and can be easily controlled. Moreover, this system encourages new investments, since the unalterable, long-term contracts cause that the whole market, technology and credit risk are weighted on costumers not generators. With the single buyer, there is a wholesale, equal for everybody electricity price, which simplifies the price regulations. There are however many disadvantages discussed by the Laszlo Lovei (Lovei, 2000). First of the problem with long-term contracts is that even if new, better technologies arise, the purchasing agency is still bound to the old generators. Next, when the purchasing agency is owned by the government, all the decisions about transmission development, new investments, additional capacity in generators is taken by the government officials, who are worrying about only short-term consequences and do not make any investment that will have a beneficial effect in future. Hence there could be little interest in expanding interconnections and cross-boarder electricity trade. Other disadvantage concerns the lobbies. Since the market is controlled by the government-owned purchasing agency then some powerful interest groups may try to influence government's officials to change the politics. Moreover, because the purchasing agency is always associated with the government, some politically unpopular but necessary changes would not be implemented. Besides, the agency in case there are some delinquent generators, can pass the responsibility for excessive costs to the government. This could not only weaken the credibility of the government but could also lead to macroeconomic instability. Finally, without fully competitive market, the response to the demand change is completely opposite than it should be. While in the competitive market the decrease in demand causes the decrease of the prices to stimulate more demand, in the single buyer market demand decreases causes increase of the electricity price. It is caused by the take-or-pay, fixed quotes that have to be covered by the lower number of customers. (Lovei, 2000) Obviously, many of those problems do not take place when the single buyer model is extended and operates as the mandatory competitive pool, or with stock and bilateral contracts.
2.1.3 Wholesale market In the wholesale market design, generators offer their services and sell energy to the distributors on the wholesale market. Any consumer can purchase energy in the wholesale market, but additional costs make it profitable only for large consumers. There need to be many small consumers (as well as many producers) to maintain the development of the competition. The final distributors are also monopolists over particular consumers, although there is a full competition in the wholesale market. (Hunt, 2002)
11
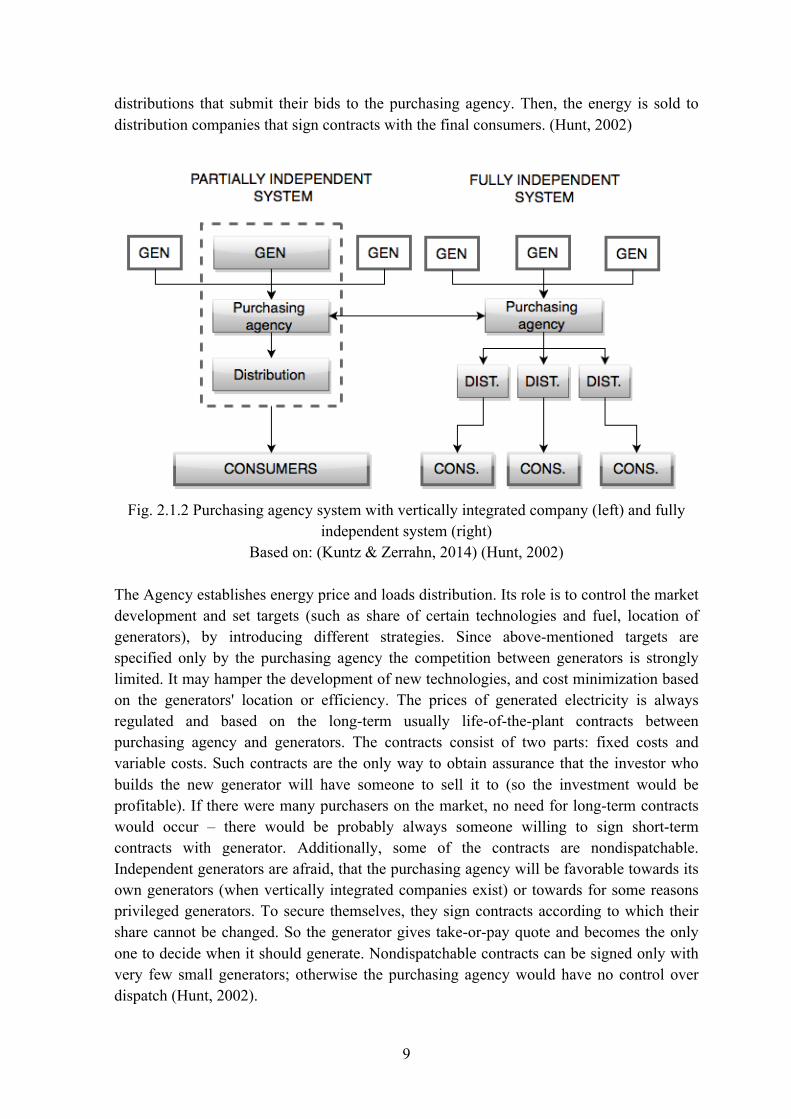
Consumers are allowed to make bilateral contracts with the generators. This market can operates as a centralized, decentralized market or stock. Since the consumers must purchase the energy from particular distributors (to which network they are connected), the retail level is centralized and operates with regulated prices.
Fig. 2.1.3 Wholesale market scheme
Based on: (Kuntz & Zerrahn, 2014) (Hunt, 2002)
Since the consumers cannot change their distributor and pay all the cost, the new problem arises: how to motivate distributors to purchase the electricity at the lowest cost? The regulator could set the maximum spot price, but it must bear in mind that distributors have limited possibilities to influence the price demanded by the generators. Without the retail market neither distributors, nor generators would not be interested in cost minimization. (Crampes & Léautier, 2014) This kind of market is usually only temporary. In most cases the consumers that purchase the cheaper energy on the wholesale market after some time sell it further to other consumers and become retailers. To improve competition and to make the system more efficient, next to the wholesale market there need to be retail market (Mielczarski W. , 2000).
2.1.4 Wholesale and retail market This is the most competitive and advanced type of market. Apart from the competition in the wholesale market it additionally introduces the competition in the retail level. The consumers can always choose their supplier among the available, the prices are regulated only by the 'invisible hand of the market'.
12
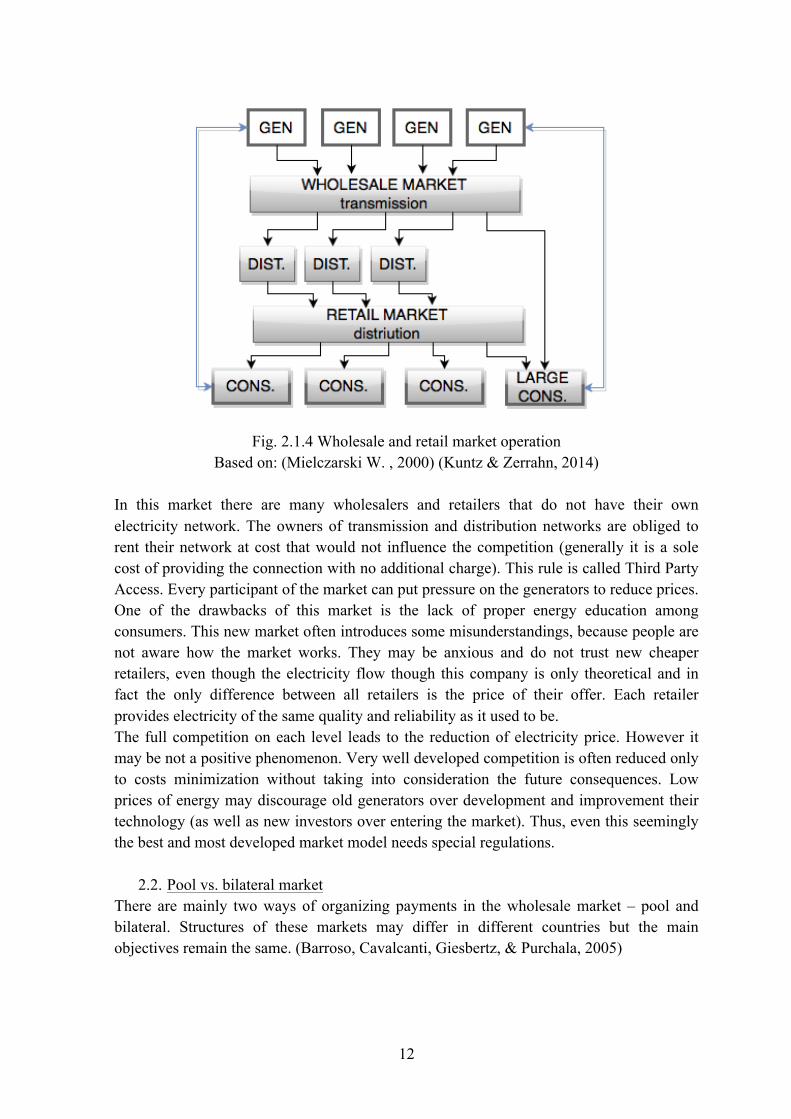
Fig. 2.1.4 Wholesale and retail market operation
Based on: (Mielczarski W. , 2000) (Kuntz & Zerrahn, 2014)
In this market there are many wholesalers and retailers that do not have their own electricity network. The owners of transmission and distribution networks are obliged to rent their network at cost that would not influence the competition (generally it is a sole cost of providing the connection with no additional charge). This rule is called Third Party Access. Every participant of the market can put pressure on the generators to reduce prices. One of the drawbacks of this market is the lack of proper energy education among consumers. This new market often introduces some misunderstandings, because people are not aware how the market works. They may be anxious and do not trust new cheaper retailers, even though the electricity flow though this company is only theoretical and in fact the only difference between all retailers is the price of their offer. Each retailer provides electricity of the same quality and reliability as it used to be. The full competition on each level leads to the reduction of electricity price. However it may be not a positive phenomenon. Very well developed competition is often reduced only to costs minimization without taking into consideration the future consequences. Low prices of energy may discourage old generators over development and improvement their technology (as well as new investors over entering the market). Thus, even this seemingly the best and most developed market model needs special regulations.
2.2. Pool vs. bilateral market There are mainly two ways of organizing payments in the wholesale market – pool and bilateral. Structures of these markets may differ in different countries but the main objectives remain the same. (Barroso, Cavalcanti, Giesbertz, & Purchala, 2005)
13
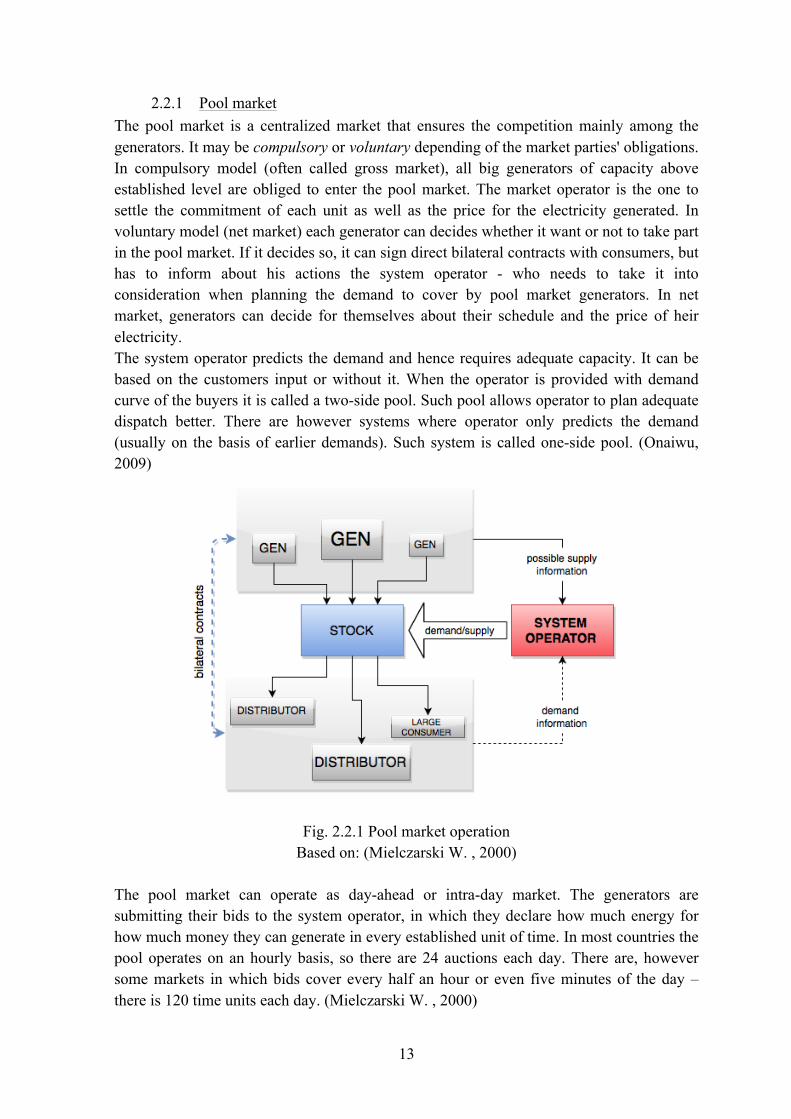
2.2.1 Pool market The pool market is a centralized market that ensures the competition mainly among the generators. It may be compulsory or voluntary depending of the market parties' obligations. In compulsory model (often called gross market), all big generators of capacity above established level are obliged to enter the pool market. The market operator is the one to settle the commitment of each unit as well as the price for the electricity generated. In voluntary model (net market) each generator can decides whether it want or not to take part in the pool market. If it decides so, it can sign direct bilateral contracts with consumers, but has to inform about his actions the system operator - who needs to take it into consideration when planning the demand to cover by pool market generators. In net market, generators can decide for themselves about their schedule and the price of heir electricity. The system operator predicts the demand and hence requires adequate capacity. It can be based on the customers input or without it. When the operator is provided with demand curve of the buyers it is called a two-side pool. Such pool allows operator to plan adequate dispatch better. There are however systems where operator only predicts the demand (usually on the basis of earlier demands). Such system is called one-side pool. (Onaiwu, 2009)
Fig. 2.2.1 Pool market operation
Based on: (Mielczarski W. , 2000)
The pool market can operate as day-ahead or intra-day market. The generators are submitting their bids to the system operator, in which they declare how much energy for how much money they can generate in every established unit of time. In most countries the pool operates on an hourly basis, so there are 24 auctions each day. There are, however some markets in which bids cover every half an hour or even five minutes of the day – there is 120 time units each day. (Mielczarski W. , 2000)
14
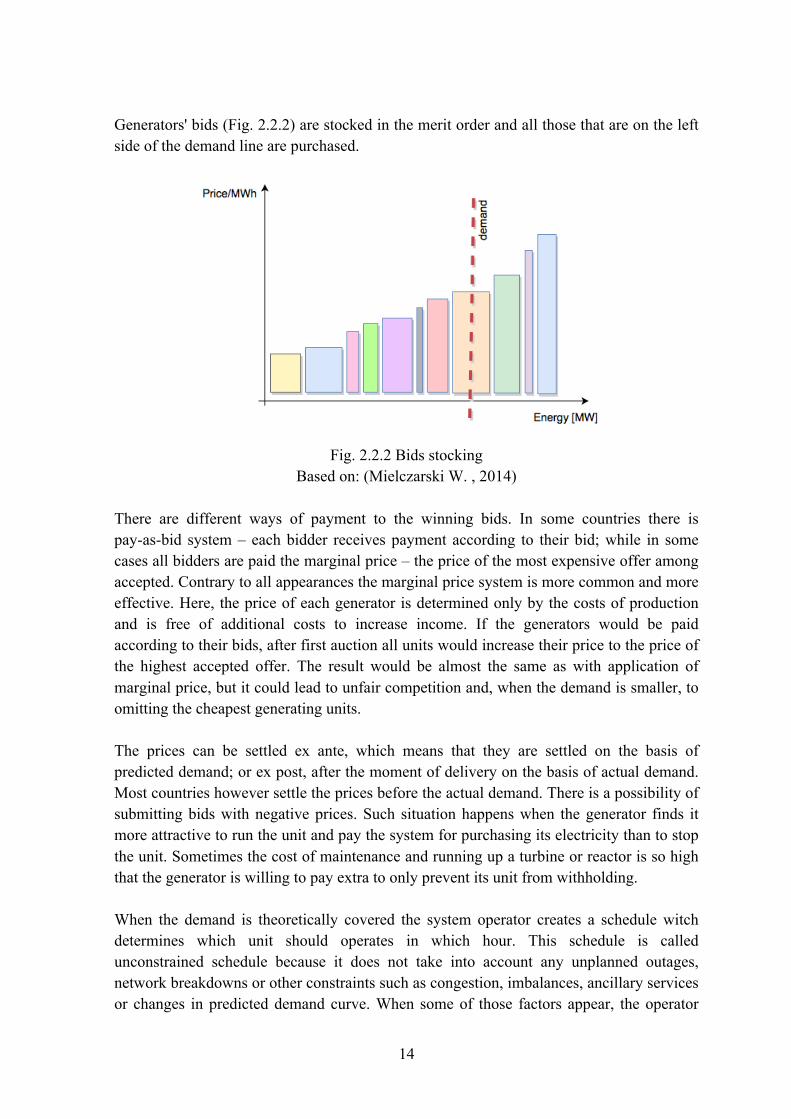
Generators' bids (Fig. 2.2.2) are stocked in the merit order and all those that are on the left side of the demand line are purchased.
Fig. 2.2.2 Bids stocking
Based on: (Mielczarski W. , 2014)
There are different ways of payment to the winning bids. In some countries there is pay-as-bid system – each bidder receives payment according to their bid; while in some cases all bidders are paid the marginal price – the price of the most expensive offer among accepted. Contrary to all appearances the marginal price system is more common and more effective. Here, the price of each generator is determined only by the costs of production and is free of additional costs to increase income. If the generators would be paid according to their bids, after first auction all units would increase their price to the price of the highest accepted offer. The result would be almost the same as with application of marginal price, but it could lead to unfair competition and, when the demand is smaller, to omitting the cheapest generating units. The prices can be settled ex ante, which means that they are settled on the basis of predicted demand; or ex post, after the moment of delivery on the basis of actual demand. Most countries however settle the prices before the actual demand. There is a possibility of submitting bids with negative prices. Such situation happens when the generator finds it more attractive to run the unit and pay the system for purchasing its electricity than to stop the unit. Sometimes the cost of maintenance and running up a turbine or reactor is so high that the generator is willing to pay extra to only prevent its unit from withholding.
When the demand is theoretically covered the system operator creates a schedule witch determines which unit should operates in which hour. This schedule is called unconstrained schedule because it does not take into account any unplanned outages, network breakdowns or other constraints such as congestion, imbalances, ancillary services or changes in predicted demand curve. When some of those factors appear, the operator
15
amends the previous plan and creates a constrained schedule with the intra-day market. (Glachant & Finon, 2003)
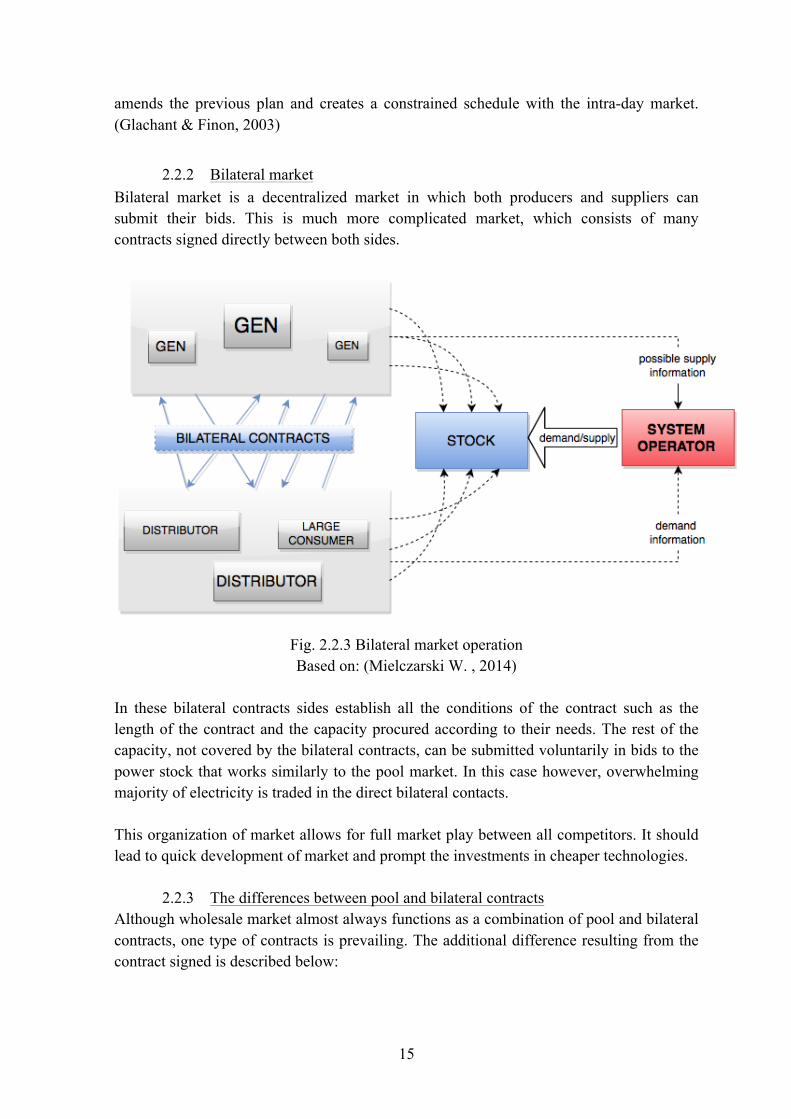
2.2.2 Bilateral market Bilateral market is a decentralized market in which both producers and suppliers can submit their bids. This is much more complicated market, which consists of many contracts signed directly between both sides.
Fig. 2.2.3 Bilateral market operation Based on: (Mielczarski W. , 2014)
In these bilateral contracts sides establish all the conditions of the contract such as the length of the contract and the capacity procured according to their needs. The rest of the capacity, not covered by the bilateral contracts, can be submitted voluntarily in bids to the power stock that works similarly to the pool market. In this case however, overwhelming majority of electricity is traded in the direct bilateral contacts. This organization of market allows for full market play between all competitors. It should lead to quick development of market and prompt the investments in cheaper technologies.
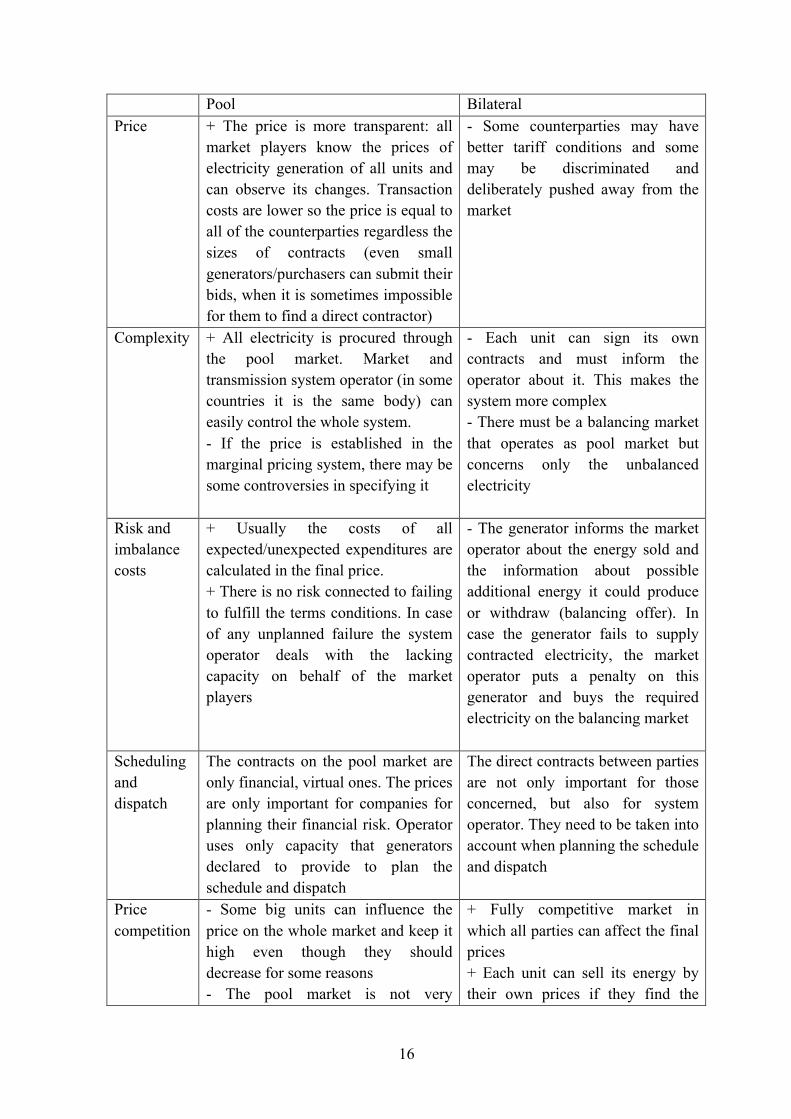
2.2.3 The differences between pool and bilateral contracts Although wholesale market almost always functions as a combination of pool and bilateral contracts, one type of contracts is prevailing. The additional difference resulting from the contract signed is described below:
16
Pool Bilateral Price + The price is more transparent: all
market players know the prices of electricity generation of all units and can observe its changes. Transaction costs are lower so the price is equal to all of the counterparties regardless the sizes of contracts (even small generators/purchasers can submit their bids, when it is sometimes impossible for them to find a direct contractor)
- Some counterparties may have better tariff conditions and some may be discriminated and deliberately pushed away from the market
Complexity + All electricity is procured through the pool market. Market and transmission system operator (in some countries it is the same body) can easily control the whole system. - If the price is established in the marginal pricing system, there may be some controversies in specifying it
- Each unit can sign its own contracts and must inform the operator about it. This makes the system more complex - There must be a balancing market that operates as pool market but concerns only the unbalanced electricity
Risk and imbalance costs
+ Usually the costs of all expected/unexpected expenditures are calculated in the final price. + There is no risk connected to failing to fulfill the terms conditions. In case of any unplanned failure the system operator deals with the lacking capacity on behalf of the market players
- The generator informs the market operator about the energy sold and the information about possible additional energy it could produce or withdraw (balancing offer). In case the generator fails to supply contracted electricity, the market operator puts a penalty on this generator and buys the required electricity on the balancing market
Scheduling and dispatch
The contracts on the pool market are only financial, virtual ones. The prices are only important for companies for planning their financial risk. Operator uses only capacity that generators declared to provide to plan the schedule and dispatch
The direct contracts between parties are not only important for those concerned, but also for system operator. They need to be taken into account when planning the schedule and dispatch
Price competition
- Some big units can influence the price on the whole market and keep it high even though they should decrease for some reasons - The pool market is not very
+ Fully competitive market in which all parties can affect the final prices + Each unit can sell its energy by their own prices if they find the
17
competitive as the purchasers have no influence on the electricity prices (fixed demand) + To influence the electricity price, the purchasers sign direct hedging contracts in which they specify the maximum price they are willing to pay for the electricity regardless the pool prices (contracts for differences)
procurer - Without pool market it may happen that large generators will overcharge for electricity, since their capacity is always required
Table 2.2.1 Comparison of pool and bilateral market Based on: (Onaiwu, 2009) (Barroso, Cavalcanti, Giesbertz, & Purchala, 2005)
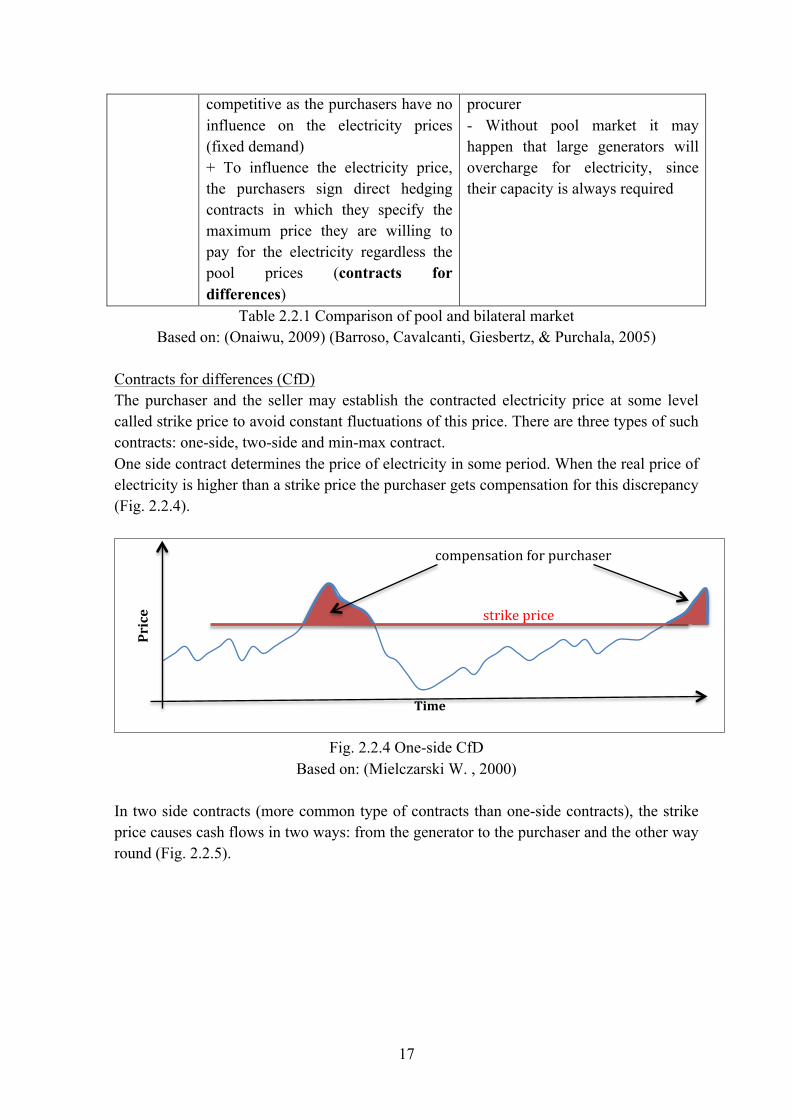
Contracts for differences (CfD) The purchaser and the seller may establish the contracted electricity price at some level called strike price to avoid constant fluctuations of this price. There are three types of such contracts: one-side, two-side and min-max contract. One side contract determines the price of electricity in some period. When the real price of electricity is higher than a strike price the purchaser gets compensation for this discrepancy (Fig. 2.2.4).
Fig. 2.2.4 One-side CfD
Based on: (Mielczarski W. , 2000)
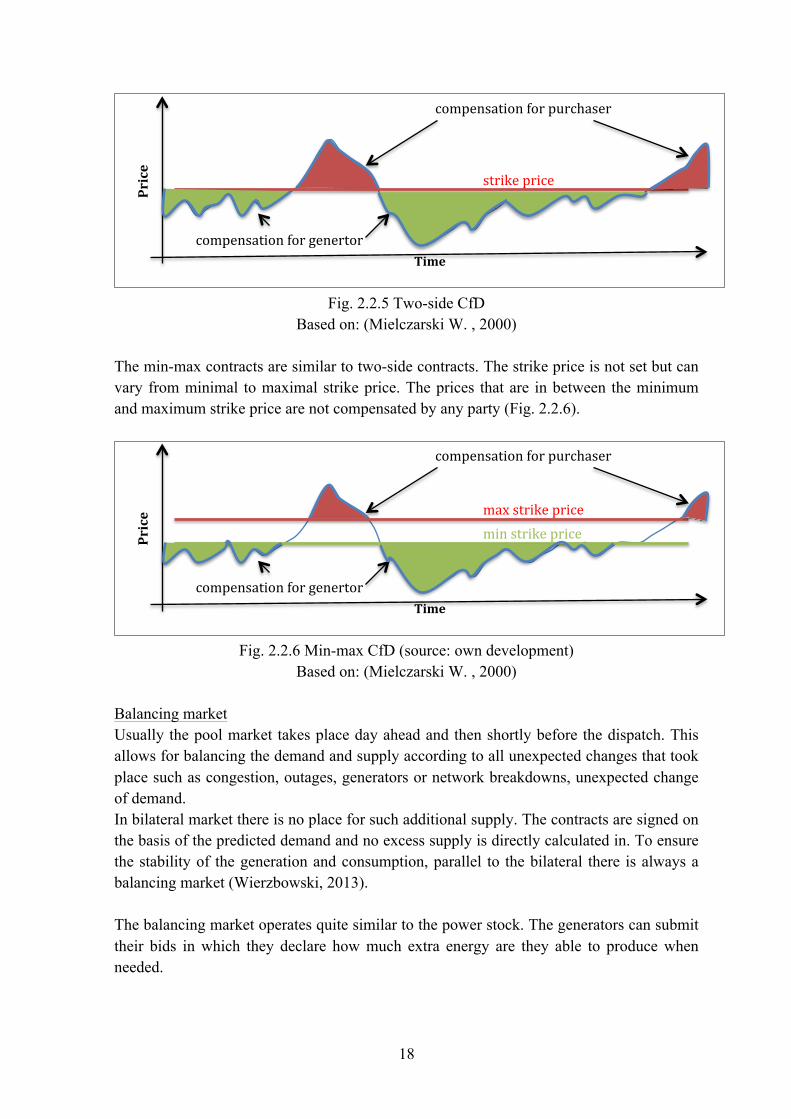
In two side contracts (more common type of contracts than one-side contracts), the strike price causes cash flows in two ways: from the generator to the purchaser and the other way round (Fig. 2.2.5).
Price
Time
strike price
compensation for purchaser
18
Fig. 2.2.5 Two-side CfD
Based on: (Mielczarski W. , 2000)
The min-max contracts are similar to two-side contracts. The strike price is not set but can vary from minimal to maximal strike price. The prices that are in between the minimum and maximum strike price are not compensated by any party (Fig. 2.2.6).
Fig. 2.2.6 Min-max CfD (source: own development)
Based on: (Mielczarski W. , 2000) Balancing market Usually the pool market takes place day ahead and then shortly before the dispatch. This allows for balancing the demand and supply according to all unexpected changes that took place such as congestion, outages, generators or network breakdowns, unexpected change of demand. In bilateral market there is no place for such additional supply. The contracts are signed on the basis of the predicted demand and no excess supply is directly calculated in. To ensure the stability of the generation and consumption, parallel to the bilateral there is always a balancing market (Wierzbowski, 2013). The balancing market operates quite similar to the power stock. The generators can submit their bids in which they declare how much extra energy are they able to produce when needed.
Price
Time
strike price
compensation for purchaser
compensation for genertor
Price
Time
max strike price
compensation for purchaser
compensation for genertor
min strike price
19
Each unit must divide its capacity into small parts and each part becomes a single bid with particular price. The number of bids depend on market design in each country. The bids are stocked according to the generators will and submitted to the balancing market. All bids of all units are stocked in the merit order as it happens in the power stock described before. If there is a need for capacity the operator accept those cheapest bids that fully cover the excessive demand.
2.3 Copper plate vs. nodal Only about half of the final electricity cost derives from the generation costs, the rest is a result of the transmission. The transmission network is a very complicated system so the cost of transmissions has many sources such as:
- Capex (capital expenditures) are all the expenses that need to be incurred to build a transmission network. This is one-off expenditure but it is usually repaid for years
- Opex (operating expenditures) are all the expenditures connected to the maintaining the network in the good conditions: repairs, renovations, refurbishments and others
- Loses: each electricity flow is accompanied by loses according to the Ohm's and Kirchhoff's laws. In high voltage lines it is about 2,2% when in low voltage 7-8%
- Balancing loses: some energy introduced to the network do not reach the consumers because of the electricity thefts
- Congestion costs: all electric power transmission lines have specified capacity. When a line is fully congested there is a need of using other, maybe longer line which results in high loses
- Fixed costs such as allowances - Ancillary services: all devices to maintain the good quality of current
There are two systems of payments for the above-mentioned transmission costs: copper plate or nodal pricing.
2.3.1 Nodal pricing It is possible to calculate loses and thus the price of electricity in every node of transmission grid. In nodal pricing each consumer should get different price for electricity purchased according to his or her location and distance from the nearest generator. This system occurs in PJM, New York, and New England markets in the USA, New Zealand and in Singapore. (Hunt, 2002) (Ding & Fuller, 2013) Nodal pricing system is based on an assumption that the price of transmission should be added to the electricity price in the bids since it is a part of it. This should motivate the transmission operators to minimize transmission costs, because it cannot just imperceptibly pass it to the consumers. High transmission costs are clearly visible in the electricity offers. The schedule of dispatch then is created with respect to physical constraints and laws of power flows.
20
2.3.2 Copper plate (uniform pricing) In the copper plate system, all consumers pay the same for the unit of electricity regardless their location and distance to generation. The price is established and equal to all the recipients. Still, when there is tangible transmission cost, it must be somehow covered by the consumers. This cost is calculated (by averaging the nodal prices or recalculating the actual dispatch omitting transmission loses) and divided equally into consumers and added to their bills in two ways: by transmission charges or by coefficient factor added to the clearing price (Ding & Fuller, 2013) (Wierzbowski, 2013) (Hunt, 2002). So the cost of transmission is separate from the cost of electricity and do not influence it. It must be still remembered that in the copper plate pricing, since all the transmission constraints are ignored, aside to the tentative dispatch there need to be an additional auction (usually intra-day auction) to create re-dispatch (the actual dispatch that takes into account physical laws). In some systems (for example in Greece) there is a system that links both copper plate and nodal pricing – zonal pricing. The prices of electricity in this case differ from region to region. Zones can operate in two ways: the market can consist of zones that act as independent uniform systems or each zone can be operated as a one collective node of all nodes in the zone. Within the zones the constraints are negligent (Harvey & Hogan, 2000) only interzonal limitations and congestion are taken into account and determine the market. When intrazonal connections become visibly congested or interzonal connections become too frequent/ infrequent it is a signal to create new zones. Creating new zones can cause that some of the zones would have too many ownerships of the units in one place when some others quite the opposite. Such a situation can lead to the high zonal prices. To avoid it, the new zones should be crated on condition that the new market will be still competitive. (Harvey & Hogan, 2000)
2.3.3 Comparison Theoretically, the nodal pricing system seems to be better since it accounts for all transmission constraints and does not cause any need for creating re-dispatch. However, the price differentiation between each market participants may cause some problems in understanding the process of accepting bids (when there are different transmission charges for different participants it may become confusing why some offers have been accepted and some rejected). Such a problem does not appear in the zonal pricing. (Ding & Fuller, 2013). When it comes to economical efficiency, nodal pricing is a more efficient mechanism. The transmission cost differentiation can influence the investors to build new, large electricity-consuming plants and factories near generators. Zonal or copper plate pricing is less efficient. The total possible social surplus is much lower. However, Ding and Fuller proved that when the dispatch is created on the basis of optimal power flow and social surplus maximization (respecting transmission constraints), but the pricing is done in the zonal or copper plate system with constrained system, the social surplus is not different than in the nodal system. It is however, differently divided among market participants (Ding & Fuller, 2013).
21
The discussion on the quality and potential of abovementioned types of pricing for electricity is based on one common target – the aim to deal with the problem of congestion.
2.4 Ancillary services (AS) Since the vast implementation of the renewable generation, the electricity production is more and more dependent on the weather forecasts. Renewables have the priority to sell their energy and this is the reason why it is becoming almost impossible to prepare adequate schedule for electricity generation in day-ahead market. Uncertainties and fluctuations of electricity generated call for some mechanisms that may insure the security of the supply of electricity that has required quality. Such mechanisms are called ancillary services and are usually separated from the electricity-only exchange. Ancillary services are commonly mistaken for system services. System services are all services that are offered by some part of an electricity system (e.g. grid operator) to the system members. Ancillary services however are all services needed to provide adequate services that are rendered by the electricity purchasers and other system users to the part of electricity system. So AS are all the services that need to be implemented in order to provide the transmission of electric power flow of required, established quality. All parts of the electricity system can provide or use AS. Generators can do both. They provide AS by e.g. offering their services when there is a need for additional capacity not covered by the scheduled unit, but also need to have this reserve in other generators in case of their possible outage. Consumers allowed to the wholesale market and distribution companies are usually beneficiaries of AS but they may also behave as providers by reducing their need for AS. They can do so by improving their load patterns introducing demand side response, implementing their own generators or energy storage systems. (Miguelez, Cortes, Rodriguez, & Camino, 2008). AS are supposed to deal with the control of a current's frequency and voltage, the stability of a system, load of the network and the restart of the system. It is estimated, that the AS constitute 10% of total cost of generation and transmission of electricity. Their main tasks are (Thermal Working Group, 2004) (Rebours, Kirschen, Trotignon, & Rossignol, 2007) (Chuang & Schwaegerl, 2009) (Olek & Wierzbowski, 2014) (Scherer, Zima, & Andersson, 2013):
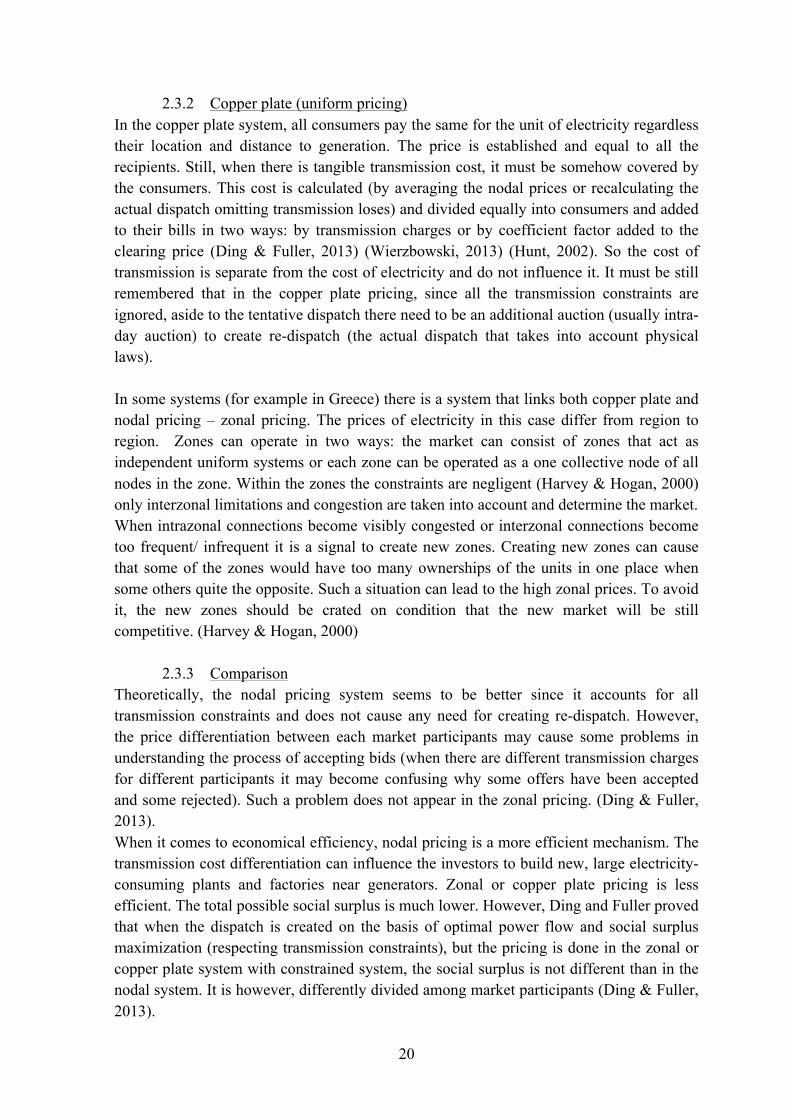
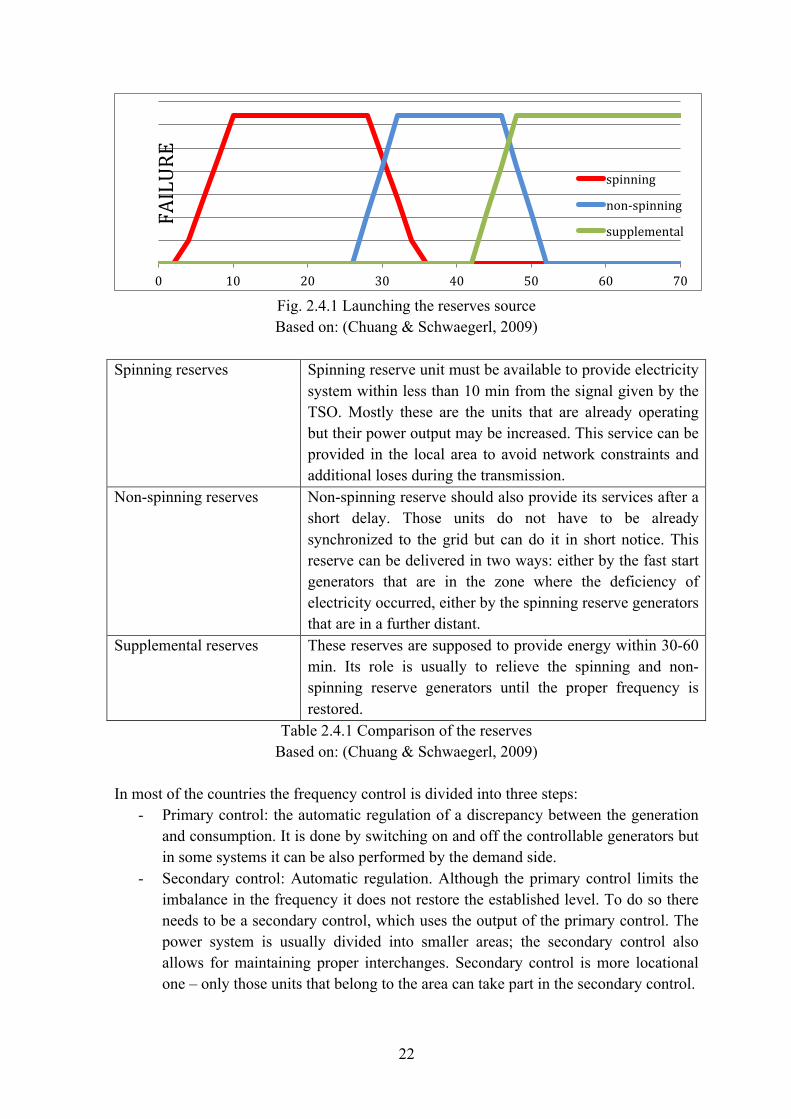
2.4.1 Frequency control Active power is inseparable to the power system's frequency, thus to ensure the safety of the power system, the frequency must be wholly controllable. It is the Transmission System Operator who controls the frequency because the frequency depends on the operation of the generator. To be able to maintain system frequency at a level of 60Hz in U.S. and 50Hz in Europe, there need to be some frequency controlled reserve available (which results from the active power reserve). There are three types of operating reserves:
22
Fig. 2.4.1 Launching the reserves source Based on: (Chuang & Schwaegerl, 2009)
Spinning reserves Spinning reserve unit must be available to provide electricity
system within less than 10 min from the signal given by the TSO. Mostly these are the units that are already operating but their power output may be increased. This service can be provided in the local area to avoid network constraints and additional loses during the transmission.
Non-spinning reserves Non-spinning reserve should also provide its services after a short delay. Those units do not have to be already synchronized to the grid but can do it in short notice. This reserve can be delivered in two ways: either by the fast start generators that are in the zone where the deficiency of electricity occurred, either by the spinning reserve generators that are in a further distant.
Supplemental reserves These reserves are supposed to provide energy within 30-60 min. Its role is usually to relieve the spinning and non-spinning reserve generators until the proper frequency is restored.
Table 2.4.1 Comparison of the reserves Based on: (Chuang & Schwaegerl, 2009)
In most of the countries the frequency control is divided into three steps:
- Primary control: the automatic regulation of a discrepancy between the generation and consumption. It is done by switching on and off the controllable generators but in some systems it can be also performed by the demand side.
- Secondary control: Automatic regulation. Although the primary control limits the imbalance in the frequency it does not restore the established level. To do so there needs to be a secondary control, which uses the output of the primary control. The power system is usually divided into smaller areas; the secondary control also allows for maintaining proper interchanges. Secondary control is more locational one – only those units that belong to the area can take part in the secondary control.
0 10 20 30 40 50 60 70
spinning
non-‐spinning
supplemental
FAILURE
23
- Tertiary: It is the last, manual regulation of commitment and dispatch of generating units. It is supposed to support secondary control reserves after some long-term large disturbances. It is also activated to manage congestions in the transmission grid, or as an instrument to obtain certain financial goals.
2.4.2 Voltage control According to the European standards the voltage variations of distributed energy cannot surpass 10%. The main problem with maintaining the adequate voltage level occurs in the low voltage lines in which the resistance is proportionally high. To provide the final recipients with a satisfactory voltage level, at the beginning of the line the voltage is set at a higher level, which is reducing constantly to reach the established one. Another problem connected with voltage, and also occurring mostly in the low voltage network, are the voltage harmonics that cause the distortion of the voltage waveform. The harmonics are caused by non-linear electric loads connected to the grid (such as synchronous motors, incandescent lamps or resistive heaters). Harmonics are increasing the current in the system, cause the flows in the neutral lines, increase power loses and can negatively influence the operation of electrical devices in the system. One way of dealing with the voltage reduction problem is to control the voltage level. Another one is to provide sufficient reactive power in the transmission grid. Reactive power losses are much more noticeable during long distance transportation of electricity than active power loses. Insufficient reactive power leads to the voltage drops and consequently to the increase of power consumption. This increased power consumption causes further voltage reductions and may be a source of a collapse of the power system.
2.4.3 Black start In case of total or a partial shutdown of a power system the generating unit needs to be able to start operating normally and connect itself to the grid. To start most of the generators there needs to be some additional source of electricity. Black start capability defines the unit's ability to restore. The electricity required to start generator can flow directly from the transmission and distribution lines, but also can be provided by the additional on-site small independent plant.
2.4.4 Balancing Balancing takes place when large generating unit is undergoing an unscheduled outage. In such case, the whole schedule of generation needs to be rewritten to provide required equilibrium between the demand and supply.
2.4.5 Remote generation control Remote generation control capability defines the automation of the system and particular generating units. It allows for controlling frequency by regulating remotely the output of generators.
2.4.6 Grid loss compensation The electricity provider is obliged to provide electricity of proper voltage and frequency. The grid loss compensation AS are compensating all loses that occurred during the electricity flow from generators to recipients.
24
2.4.7 Emergency control actions Emergency control actions are all the actions that can be taken in case any sudden failure in the power system to maintain the stability. Some of such actions are: generation rescheduling, forced demand/supply reduction, entering power system stabilizers, use of dynamic-braking resistors.
2.4.8 Distributed generation (DG) acting as the AS Distributed generation is a set of small generators (depending on different sources up to 1MW (Olek & Wierzbowski, 2014) or 10 MW (Triggianese, Liccardo, & Marino, 2007)) connected to the electric power system. Typical DG technologies are: photovoltaic, wind turbines, gas or bio-gas CHP micro turbines, fuel cells, micro water turbines. Distributed generation is responsible for many disturbances in the power system. First of all, despite CHP and water turbines that are not very common yet, most of the DG are operating in an unpredictable manner since they are completely dependent on their fuel supply (wind or sun power) that is frequently changing. Thus, as it was mentioned before, the schedule of generators must undergo constant changes. The VOLL, which also results from the growing number of DG, causes the rise of electricity prices. Moreover the large concentrations of DG can cause reverse power flows to which the distribution network is not technically prepared (Olek & Wierzbowski, 2014). However, it is possible to benefit from the DG and such benefits were proved by many scientists (Olek & Wierzbowski, 2014) (Kashyap & Dheeraj Reedy, 2013) (Chuang & Schwaegerl, 2009) (Miguelez, Cortes, Rodriguez, & Camino, 2008) and others. The tasks of the DG as the AS can be divided into two fields: Reducing global demand: Unlike large power stations, they are close to the loads and allow for providing services locally. Those local DG can operate as on-site units, which are all the photovoltaic panels placed on the roof of the buildings, small wind turbines fuel cells or micro CHP generators. DG can be also treated as the emergency power units or district energy systems for closely locating buildings like universities or hospitals. Therefore there is no concern of lines congestion or voltage decrease caused by the transmission and the global demand is decreased. If there is a system that controls real time demand and supply it could be possible to use DG as peak units. (Kashyap & Dheeraj Reedy, 2013) Improving the quality of electricity: DG can be used for voltage regulation, reactive power and harmonics compensation. One way to use distributed generation as the AS that improves the quality of electricity, is to benefit from the wind turbines. This case was discussed by Triggianese, Laccardo and Marino in 2005. First wind turbines were a fixed-speed turbines that can operate with the optimum efficiency only in case of optimal wind flow. Such turbines consume large amount of reactive power after some system fault and need additional reactive power to avoid voltage collapse. A bit more advanced option is a turbine with fixed speed but with changeable number of poles per phase. In the most modern and advanced turbines the rotational speed is completely variable, thus the turbine can operate within the wide range of wind speed. Such wind turbine is connected to the induction or synchronous generator that can be doubly-feed. Doubly-feed generators have windings that transfer power from
25
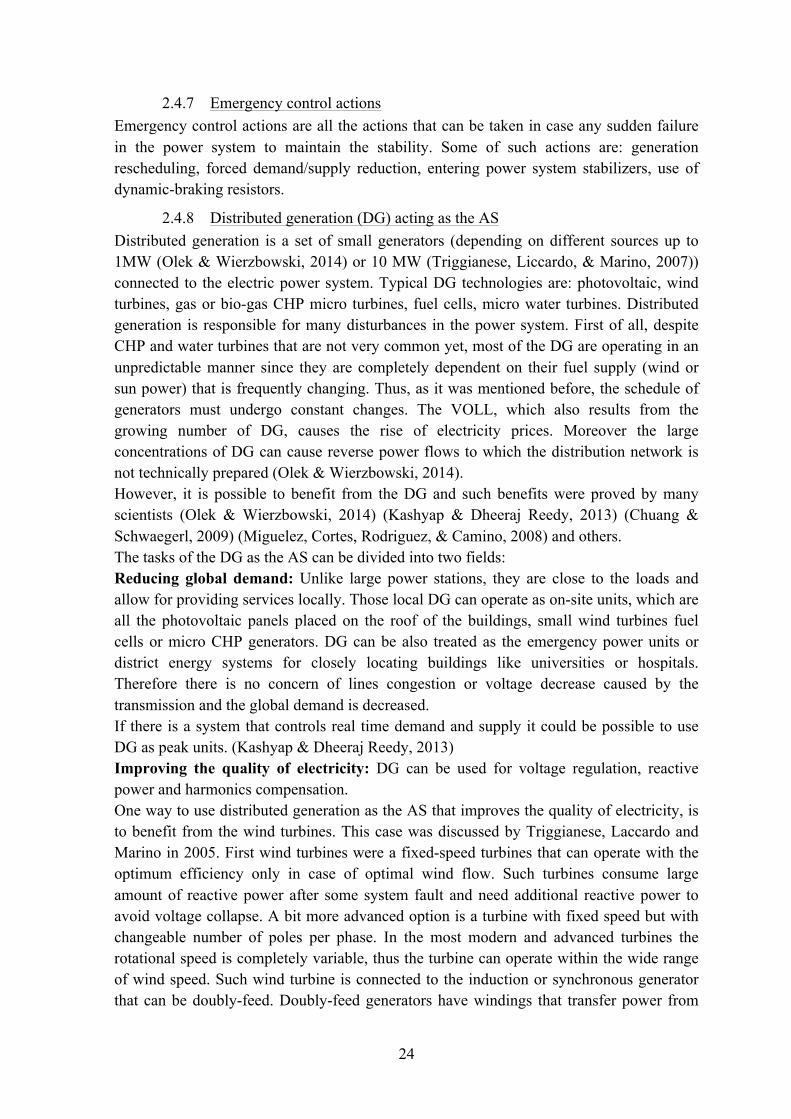
the rotor (through the electronic converter) and the stator (directly). Those power turbines can be turn off after system fault without any consumption of reactive power and do not cause voltage collapse (Triggianese, Liccardo, & Marino, 2007).
Fig. 2.4.2. Variable speed turbines with synchronous generator (left) and doubly-fed
generator (right) GB – gear box; SG – squirell-cage induction generator; DFIG – doubly-fed induction generator
Based on: (Triggianese, Liccardo, & Marino, 2007)
Back-to-back converter consists of two sides: machine side converter and grid side. While the machine side converter is responsible for the machine efficiency, the grid side converter can improve the quality of the electricity in the grid. The converters allow for regulating the current frequencies so, when properly programmed can restore the required balance in the system between the active and reactive power (the processes are called active power filtering and reactive power compensation (Triggianese, Liccardo, & Marino, 2007) (Bandzul, 2005). The main services that a variable speed wind turbine can provide are (Rebours, Kirschen, Trotignon, & Rossignol, 2007):
A. Voltage regulation – the current introduced to the system must have no variations. Consequently, the active power that depends on the atmospheric conditions must be also steady. Current variations result in the variations in the voltage amplitude, but can be compensated by the reactive power produced by the converter.
B. Reactive power compensation – when there is not enough reactive power in the system the DG can operate as a reactive power compensator
C. Harmonic currents compensation – in case the harmonics appear in the system the DG can introduce the compensating harmonics that would neutralize this phenomenon.
2.5 Energy only market Most of the energy markets in the world trade exclusively in the volumes of electricity in the wholesale and retail markets. The generators are paid for the electricity produced and the consumers are charged only for the precise amount of electricity consumed. However, because of the specific characteristic of the traded commodity and the behavior of market participants the energy market must deal with many problems that do not occur in other product markets. The main characteristics and problems connected to the electricity market and whole design of the system are:
26
Storage Electricity cannot be stored. It also travels at the speed of light so the total generation and consumption must be equal in any moment. The speed of travel also requires an extremely fast response to all disturbances in the system. Thus, the whole electricity sector must be well managed at all times without a delay. Investment costs The investment costs in new unit are very high so the amount of possible investors, even if system is fully liberalized is quite limited. Additionally according to calculations carried by Joskow (Joskow, Competitive Electrocoty Markets and Investment in New Generating Capacity , 2006) the costs of capital required to invest in new capacity unit (that would operate in the competitive wholesale spot market) would lead to the electricity prices much higher than those in the old regime (according to which the companies are vertically integrated, regulated and all the risk is transferred to the consumers). In the "State of the Market Reform" (Patton, 2005) report of Regional Transmission Organization (RTO) in the US there is a simulation of investment costs and possible incomes of a new combustion turbine from the energy only market and ancillary services (the calculation was made for the 1999-2005). It has been demonstrated that the income from this peaking unit each year did not exceed the 40% or annual capital costs. Although the prices of electricity have changed from that time, this alarming example is still up to date. Energy only markets cannot provide sufficient net revenues to ensure profitability of investment in new generation
The possible income from each unit in the pure energy market (without any government incentives, hedging contracts and policies) is hard to predict. Short-term electricity prices are fluctuating widely and retail customers are not willing to sign contracts with duration longer than 2 or 3 years (since the electricity prices may decrease sharply somewhere in future). In addition even the government incentivizing policies cannot be taken for granted because of the frequent changes of the political guidelines.
Daily and annual demand curve – VOLL, 'missing money' and 'missing capacity' problems
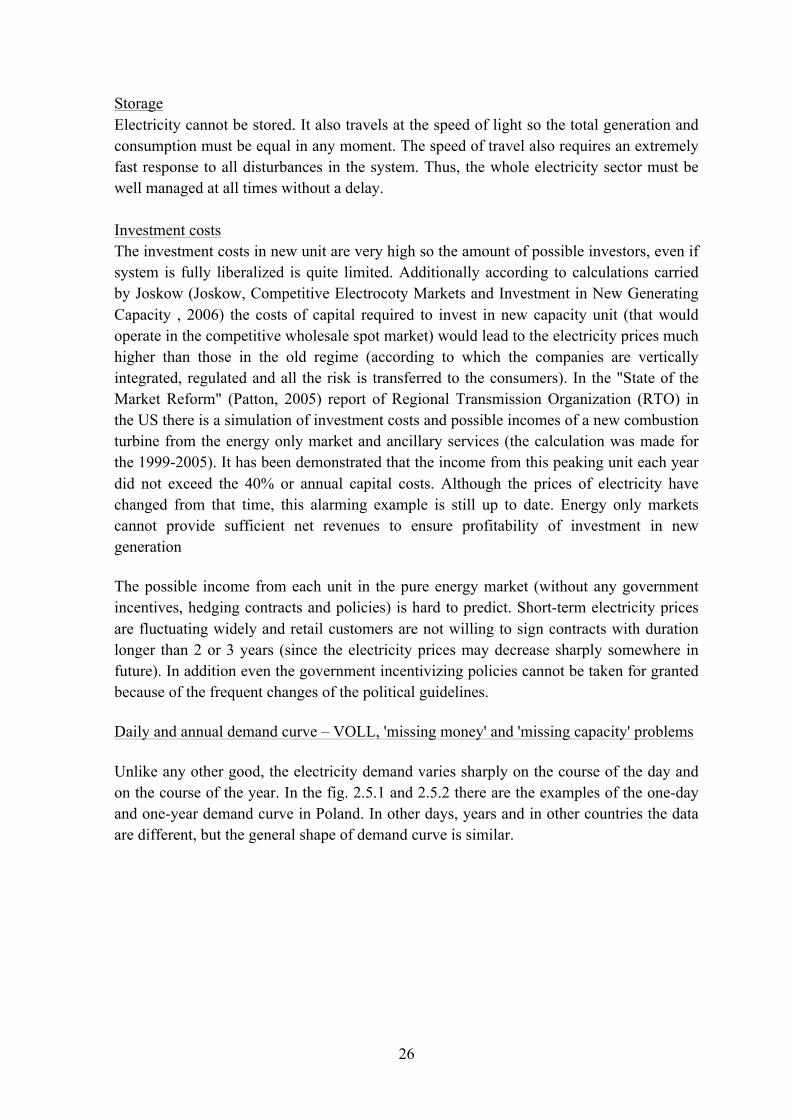
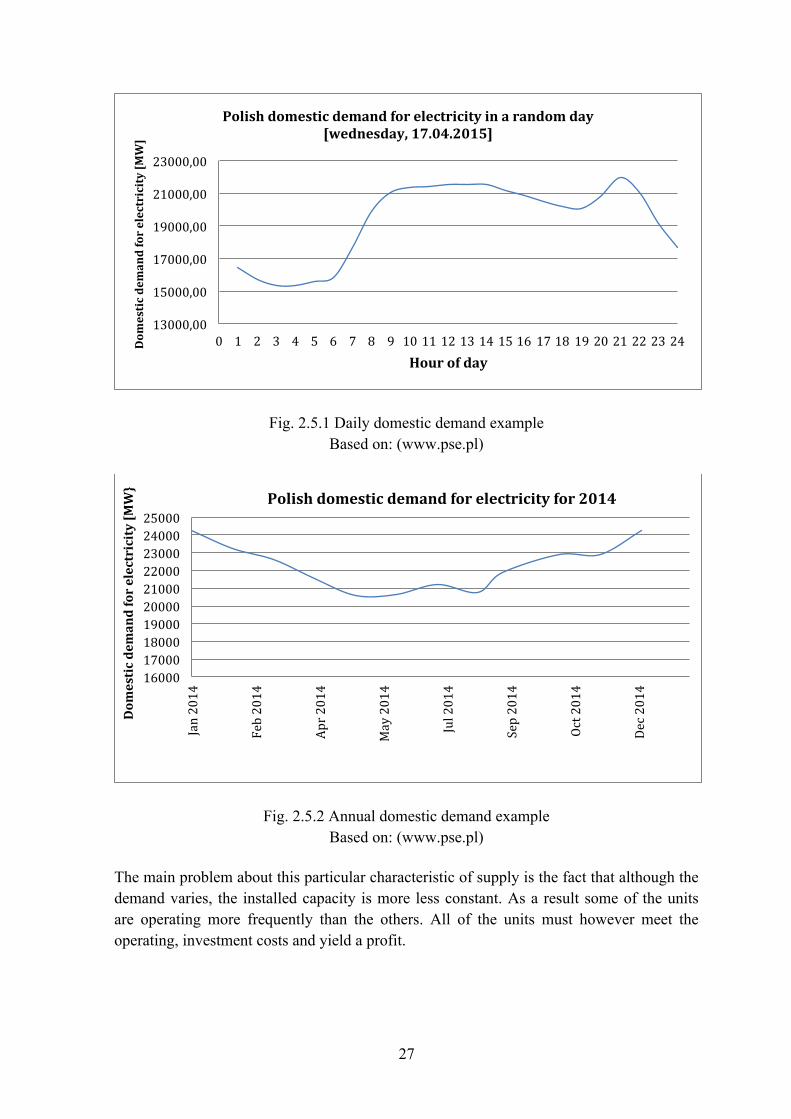
Unlike any other good, the electricity demand varies sharply on the course of the day and on the course of the year. In the fig. 2.5.1 and 2.5.2 there are the examples of the one-day and one-year demand curve in Poland. In other days, years and in other countries the data are different, but the general shape of demand curve is similar.
27
Fig. 2.5.1 Daily domestic demand example Based on: (www.pse.pl)
Fig. 2.5.2 Annual domestic demand example Based on: (www.pse.pl)
The main problem about this particular characteristic of supply is the fact that although the demand varies, the installed capacity is more less constant. As a result some of the units are operating more frequently than the others. All of the units must however meet the operating, investment costs and yield a profit.
13000,00
15000,00
17000,00
19000,00
21000,00
23000,00
0 1 2 3 4 5 6 7 8 9 10 11 12 13 14 15 16 17 18 19 20 21 22 23 24 Dom
estic demand for electricity [MW]
Hour of day
Polish domestic demand for electricity in a random day [wednesday, 17.04.2015]
16000 17000 18000 19000 20000 21000 22000 23000 24000 25000
Jan 2014
Feb 2014
Apr 2014
May 2014
Jul 2014
Sep 2014
Oct 2014
Dec 2014
Dom
estic demand for electricity [MW}
Polish domestic demand for electricity for 2014
28
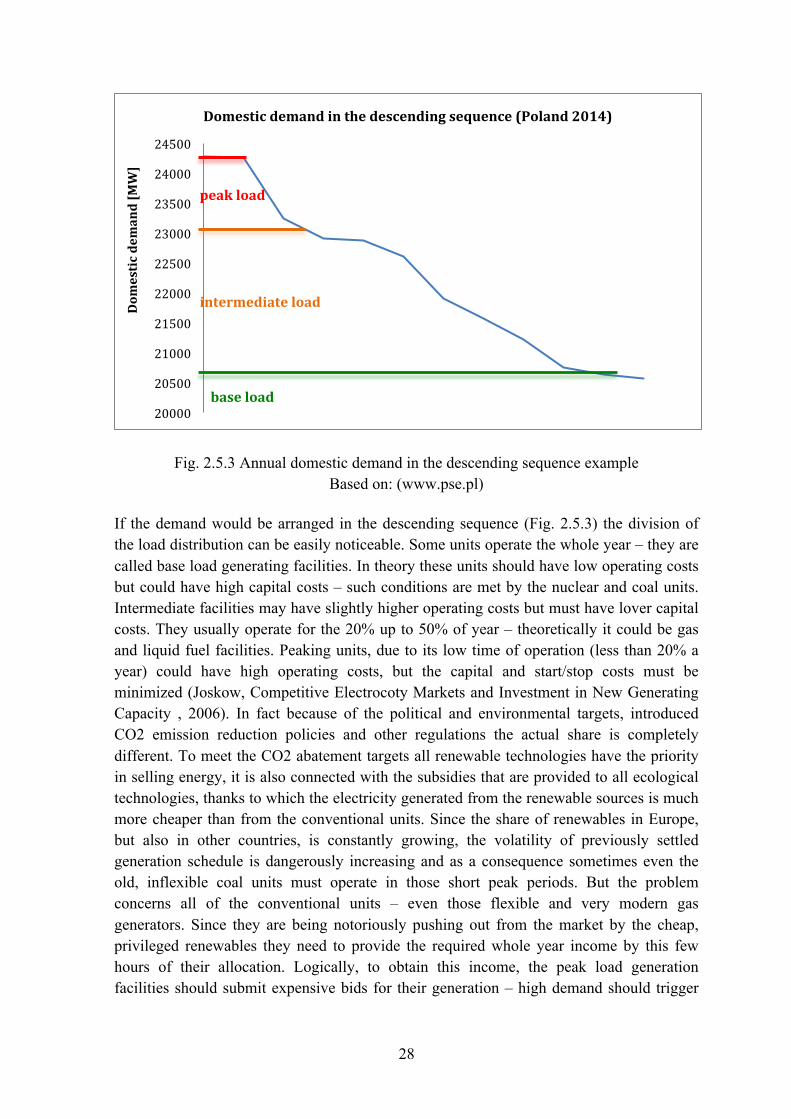
Fig. 2.5.3 Annual domestic demand in the descending sequence example Based on: (www.pse.pl)
If the demand would be arranged in the descending sequence (Fig. 2.5.3) the division of the load distribution can be easily noticeable. Some units operate the whole year – they are called base load generating facilities. In theory these units should have low operating costs but could have high capital costs – such conditions are met by the nuclear and coal units. Intermediate facilities may have slightly higher operating costs but must have lover capital costs. They usually operate for the 20% up to 50% of year – theoretically it could be gas and liquid fuel facilities. Peaking units, due to its low time of operation (less than 20% a year) could have high operating costs, but the capital and start/stop costs must be minimized (Joskow, Competitive Electrocoty Markets and Investment in New Generating Capacity , 2006). In fact because of the political and environmental targets, introduced CO2 emission reduction policies and other regulations the actual share is completely different. To meet the CO2 abatement targets all renewable technologies have the priority in selling energy, it is also connected with the subsidies that are provided to all ecological technologies, thanks to which the electricity generated from the renewable sources is much more cheaper than from the conventional units. Since the share of renewables in Europe, but also in other countries, is constantly growing, the volatility of previously settled generation schedule is dangerously increasing and as a consequence sometimes even the old, inflexible coal units must operate in those short peak periods. But the problem concerns all of the conventional units – even those flexible and very modern gas generators. Since they are being notoriously pushing out from the market by the cheap, privileged renewables they need to provide the required whole year income by this few hours of their allocation. Logically, to obtain this income, the peak load generation facilities should submit expensive bids for their generation – high demand should trigger
20000
20500
21000
21500
22000
22500
23000
23500
24000
24500 Dom
estic demand [MW]
Domestic demand in the descending sequence (Poland 2014)
peak load
intermediate load
base load
29
high prices. However, because the peak units have shorter and shorter time of operation, the price should increase drastically.
The average value that the customers are willing to pay in order to avoid any disturbances in providing the electricity is called the Value of Lost Load (sometimes Value of Security of Electricity Supply). Although according to the market rules the price of electricity in the peak load could reach thousands of euros per MWh the Value of Lost Load is a factor that is used to estimate the price cap (maximum allowed price) for the electricity.
Usually there should be at least three VOLLs depending on the type of the consumer: VOLL for domestic consumers, VOLL for small and medium-sized enterprises and VOLL for industrial and commercial electricity users. There could be also different values depending on the time of the year and peak/not peak periods (London Economics, 2013).
VOLL could be determined in one of three ways (Leahy & Tol , 2010):
• Developed by Beenstock et al. in 1998. This method is based on the surveys that are filled by the consumers in which they specify their willingness to pay for security of supply.
• Developed by Corwin and Miles in 1978. The VOLL is estimated on the basis of previous outages. This method is not adequate enough for economies that are rapidly developing. In such economies the prices for electricity that the customers were willing to pay are usually not equal to those in future.
• The last method is based on the production function technique. This is a very accurate method according to which it is possible to calculate the economical loses incurred by the specified sector (to which the VOLL is applied) when the electricity supply is suspended. It is done by dividing the Gross Value Added ("a productivity metric that measures the difference between output and intermediate consumption" – definition by investopedia.com) by the amount of electricity used.
Because of the VOLL and PRICE CAP that influence electricity prices in the peak demand, the peak units cannot obtain enough income to stay profitable. This phenomenon is caused the missing money problem. This problem aroused in most of the countries all over the world where there is energy only market and a share of renewables is significant.
As a consequence of above-mentioned phenomenon, another one arises. Since the peak units are unprofitable, many of them threaten to close down themselves or already did it. This plus the uncertainty of investment in all likelihood will lead to the problem of missing capacity, which is the lack of sufficient capacity installed to ensure safe and undisturbed electricity supply. So the demand is growing, old plants built in the 1960's and 1970's should shortly retire and there energy only market even with some regulations do not bring enough incentives to encourage new investment.
30
Change of attitude Before electricity market the security of supply was the main target of the energetic industry. The economics was put aside and there was no particular interest in costs reduction. Moreover, apart from Spain and Italy, in most countries in Europe, there was an excessive capacity and there was no threat of loosing it (Joskow, Competitive Electrocoty Markets and Investment in New Generating Capacity , 2006). The targets of at that time new electricity market was to ensure supply security, reliability of the system, resource adequacy and diversity with the market mechanisms. The electricity markets were introduced when the problem of missing money and missing capacity was not taken into account yet. Demand side response (DSR) To make any market work properly the consumers must be fully enabled to response to the prices of good purchased. The same applies to the electricity market. The customers should be always able to manage their electricity consumption taking into account the actual price of electricity. Unfortunately, in most of the markets there is no possibility of introducing such mechanism. Usually, the consumers sign contracts with fixed price for the electricity purchased although the price for electricity on the wholesale market varies from hour to hour (in some countries e.g. Australia it varies each five minutes). This volatility of price on the wholesale market and no immediate response by the consumers weaken the market mechanisms. The demand side response can operate in three ways (Parliament Office of Science and Technology):
- Turn-down DSR: consumers reduce their demand on the peak load. - Turn-up DSR: consumers increase their demand on when the overall domestic
demand is very low. - DSR by on-site generation: consumers use their own energy storage or small
generation systems to decrease demand on the peak hours or support the system by releasing additional energy.
DSR can be automated (the special contractor that regulates the DSR decides when to limit the customers consumption and turn off their machines) or fully independent (these are the customers that decides on their consumption profile). The fully responsive DSR would require special real-time electricity meters, which should provide them with an actual electricity price. Consumers would be allowed to adjust their demand to the retail electricity prices (Joskow & Tirole, Retail Electricity Competition, 2004). It is estimated that in Europe only 10% of DSR potential is currently used. If there was more interest in augmenting the DSR and introducing compete, real time pricing, the peak load demand could be reduced by 10% which would bring the savings of €10 billion per year in the European Union (Kuntz & Zerrahn, 2014). Without the adequate DSR there would be no full competition on the retail market, the market mechanisms would be limited and the energy market would not be sufficient to maintain system security.
31
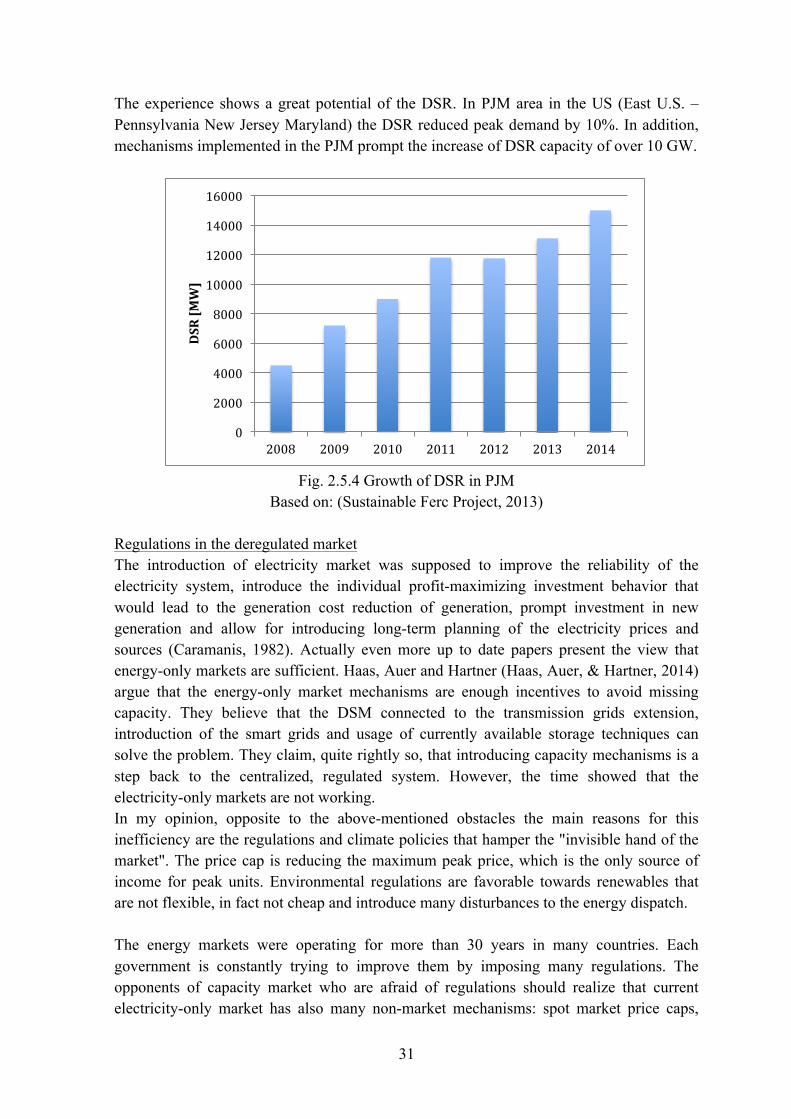
The experience shows a great potential of the DSR. In PJM area in the US (East U.S. – Pennsylvania New Jersey Maryland) the DSR reduced peak demand by 10%. In addition, mechanisms implemented in the PJM prompt the increase of DSR capacity of over 10 GW.
Fig. 2.5.4 Growth of DSR in PJM
Based on: (Sustainable Ferc Project, 2013)
Regulations in the deregulated market The introduction of electricity market was supposed to improve the reliability of the electricity system, introduce the individual profit-maximizing investment behavior that would lead to the generation cost reduction of generation, prompt investment in new generation and allow for introducing long-term planning of the electricity prices and sources (Caramanis, 1982). Actually even more up to date papers present the view that energy-only markets are sufficient. Haas, Auer and Hartner (Haas, Auer, & Hartner, 2014) argue that the energy-only market mechanisms are enough incentives to avoid missing capacity. They believe that the DSM connected to the transmission grids extension, introduction of the smart grids and usage of currently available storage techniques can solve the problem. They claim, quite rightly so, that introducing capacity mechanisms is a step back to the centralized, regulated system. However, the time showed that the electricity-only markets are not working. In my opinion, opposite to the above-mentioned obstacles the main reasons for this inefficiency are the regulations and climate policies that hamper the "invisible hand of the market". The price cap is reducing the maximum peak price, which is the only source of income for peak units. Environmental regulations are favorable towards renewables that are not flexible, in fact not cheap and introduce many disturbances to the energy dispatch. The energy markets were operating for more than 30 years in many countries. Each government is constantly trying to improve them by imposing many regulations. The opponents of capacity market who are afraid of regulations should realize that current electricity-only market has also many non-market mechanisms: spot market price caps,
0
2000
4000
6000
8000
10000
12000
14000
16000
2008 2009 2010 2011 2012 2013 2014
DSR [M
W]

32
required operating reserve, non-price rationing protocols, administrative protocols for managing system emergencies and ancillary services. (Joskow, Market Imperfections Versus Regulatory Imperfections, 2010) However, it can be easily noticeable that those regulations are not enough. To improve or even maintain supply security, reliability, resource adequacy and diversity some capacity mechanisms must be introduced.
33
3. CAPACITY MARKET 3.1. Capacity mechanisms
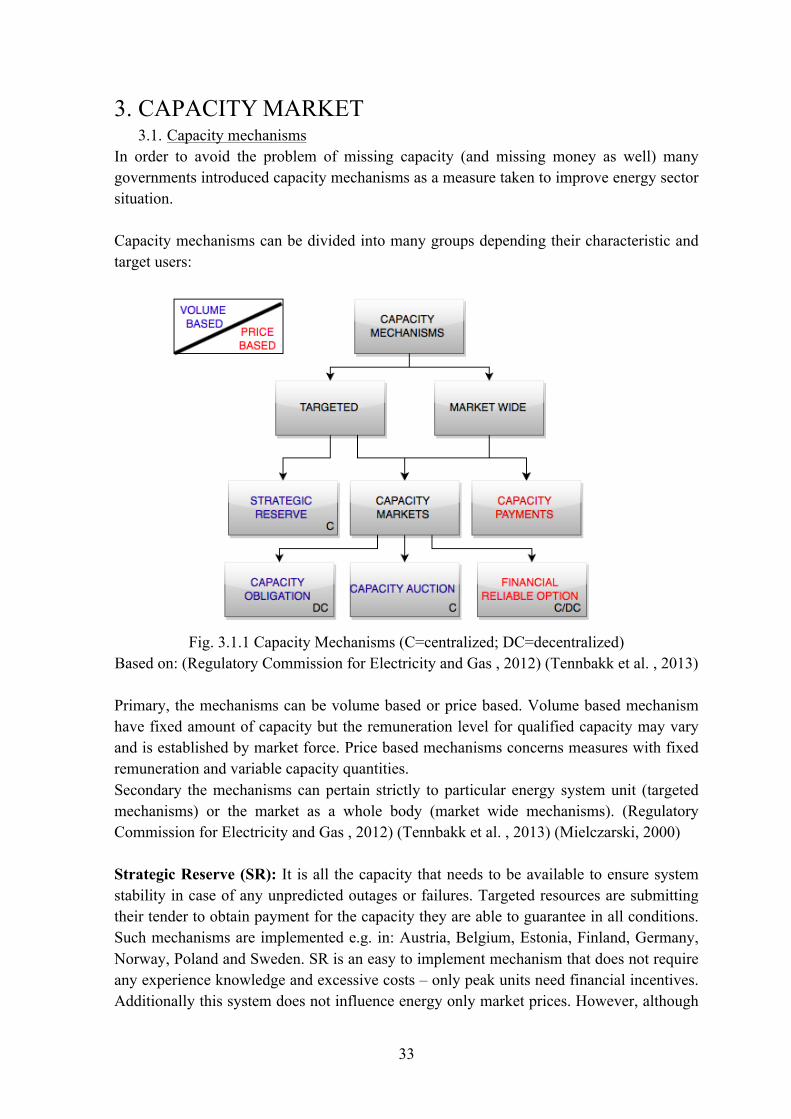
In order to avoid the problem of missing capacity (and missing money as well) many governments introduced capacity mechanisms as a measure taken to improve energy sector situation. Capacity mechanisms can be divided into many groups depending their characteristic and target users:
Fig. 3.1.1 Capacity Mechanisms (C=centralized; DC=decentralized)
Based on: (Regulatory Commission for Electricity and Gas , 2012) (Tennbakk et al. , 2013)
Primary, the mechanisms can be volume based or price based. Volume based mechanism have fixed amount of capacity but the remuneration level for qualified capacity may vary and is established by market force. Price based mechanisms concerns measures with fixed remuneration and variable capacity quantities. Secondary the mechanisms can pertain strictly to particular energy system unit (targeted mechanisms) or the market as a whole body (market wide mechanisms). (Regulatory Commission for Electricity and Gas , 2012) (Tennbakk et al. , 2013) (Mielczarski, 2000) Strategic Reserve (SR): It is all the capacity that needs to be available to ensure system stability in case of any unpredicted outages or failures. Targeted resources are submitting their tender to obtain payment for the capacity they are able to guarantee in all conditions. Such mechanisms are implemented e.g. in: Austria, Belgium, Estonia, Finland, Germany, Norway, Poland and Sweden. SR is an easy to implement mechanism that does not require any experience knowledge and excessive costs – only peak units need financial incentives. Additionally this system does not influence energy only market prices. However, although
34
the main idea of introducing capacity mechanisms is to deal with missing money phenomenon, SR support only existing plants. SR does not bring much support to prompt refurbishing or building new power stations. Capacity Market Mechanisms: consist of 3 sub-mechanisms: Capacity Obligation (CO), Capacity Auction (CA) and financial reliable option (RO). The first one – capacity obligation – assumes that all the suppliers are responsible for providing adequate capacity and purchase it from generators. Apart from contracting with generators, the supplier can also purchase capacity by capacity certificates or can possess its own generators for this purpose. The required capacity should be usually about 10% above the peak demand. The price for the electricity purchased is established by bilateral contracts between generators and suppliers that can take form of call option. Generator is paid for being available to provide electricity in present or in future. Generators must fulfill the terms of agreement otherwise have to face penalties. The second – capacity auction – is more centralized option. Auctions are carried by the TSO or Regulator few years in advance (For example in UK the auction takes place 4 years ahead and then, the clearing auction one year ahead). The auction set the price of electricity according to which the payments are made. This option provides the regulator with information about one, transparent price for capacity obligation since all the bids are of the same kind and are submitted to the operator/regulator. The last one – reliability option – is a financial instrument according to which the generators claim that they will forego the possible income in the hours of high demand when the market electricity price is above the strike price in order to gain some additional revenues. The purchases however, agree to pay higher constant electricity fee to avoid those sharp growths of electricity price. Capacity payments: Generator is rewarded not only for energy purchased, but also he gets additional remuneration for his available capacity. The payment is set centrally for all or part of the generators (in some cases only new generators are allowed to submit their capacity bids). It can be fixed or depending on the amount of already purchased capacity (first generators that register their ability to provide capacity gets higher remuneration than the last ones). The main disadvantage of such system is the threat that it can become more profitable to strive for capacity payments that for income from electricity sold. There is a need for capacity trade along with electricity trade across borders to keep adequate efficiency and competition. Capacity from the foreign countries should be also available. Lack of cross-boarder capacity mechanisms could also lead to areas where too much capacity is congested and areas with lack of capacity installed. Nevertheless, in EU where a lot of pressure is put to create internal united energy market capacity mechanisms may become an obstacle to maintain reliable cross-boarder system. The main reason of such threat is the diversity of possible mechanisms. It becomes very problematic when neighboring countries have different capacity mechanisms implemented or some of them did not have any capacity mechanism at all. Furthermore it is not clear how to solve inter-connection congestion management. Should the foreign generators, whose capacity reserve
35
been purchased, somehow 'book' the adequate load of interconnection to be able to sell the electricity if such need occurs? What should have priority – capacity mechanisms or normal electricity trade? There is already a problem with the lack of required interconnections. The reservations of the cross-boarder lines for the length of the capacity contract would strongly deteriorate the congestion problem. In addition, the booking of a transmission cannot be free of charge. As a result the entities that want to sell their capacity mechanism abroad would have to face additional costs and therefore their competitiveness on the domestic market would decline. How to avoid the leakage of capacity that has been subsidized in one country to the other with more attractive capacity prices? What is more the fines for not providing electricity contracted in foreign capacity market may cause that it would be more profitable to suddenly withdraw the scheduled unit from the domestic energy-only market in order to avoid penalties in the foreign capacity market. If there happens a coincidence of lack of capacity in both of the countries a series of serious problem may arise. Therefore, although it is unquestionable that capacity mechanisms must be implemented there is still no proper design of effective inter-connection capacity trade. One of the ideas to solve this problem is to provide interconnection capacity as a reliability source but without allowing any particular generator to apply for the foreign capacity payment. Thus, the whole areas (countries) would be providing/purchasing capacity without pointing any particular unit to be responsible for that. Such system however does not allow for full competition and requires extremely precise scheduling (and weather forecasts). (Meulman & Meray, 2012) (Tennbakk et al. , 2013) (Regulatory Commission for Electricity and Gas , 2012)
36
4. AN OVERVIEW OF ENERGY MARKETS 4.1. USA
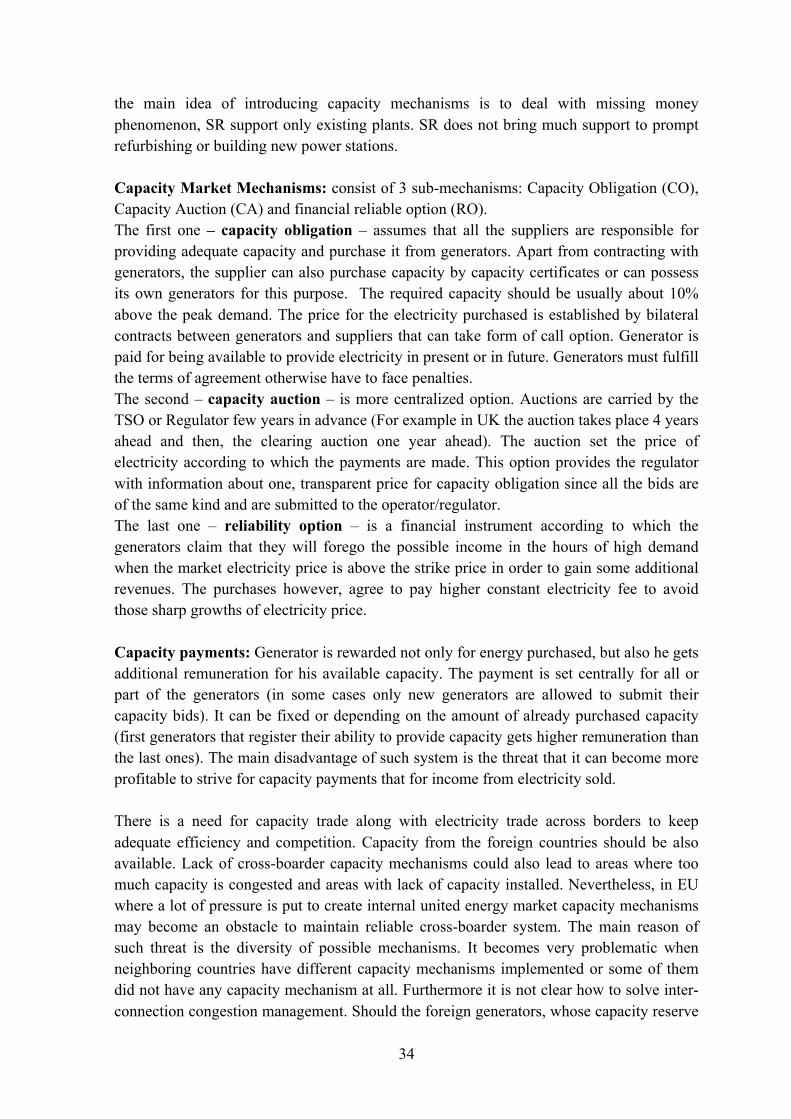
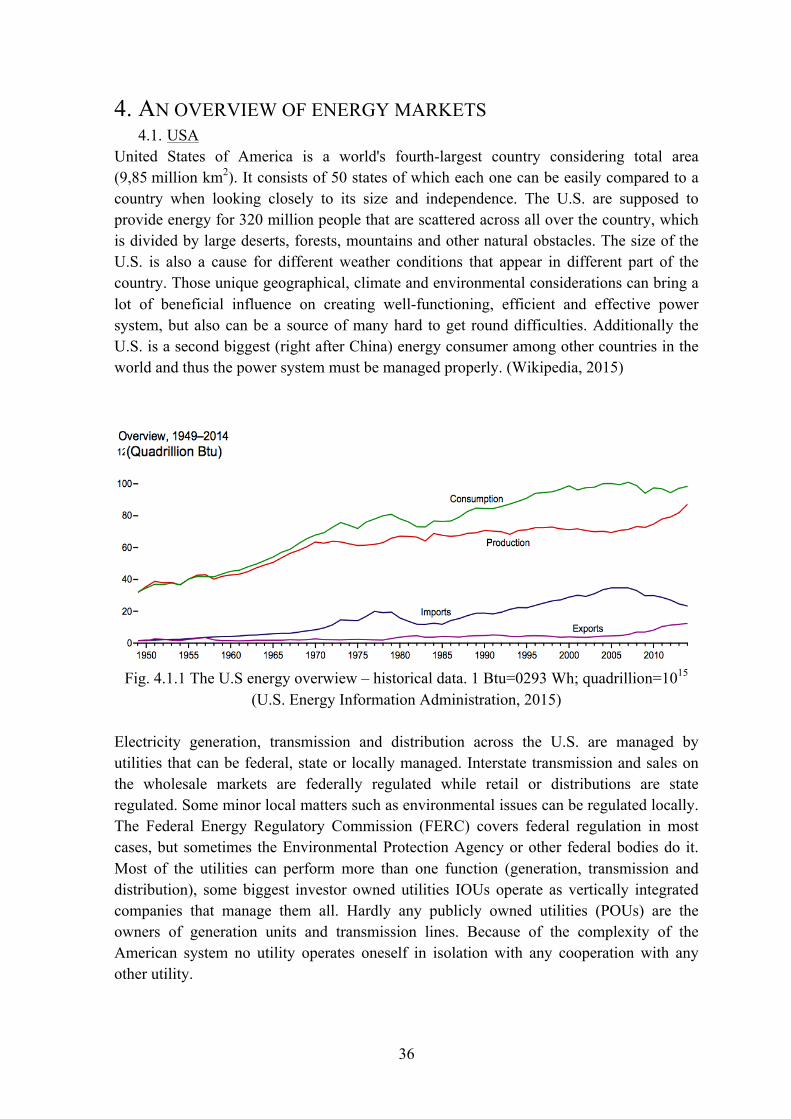
United States of America is a world's fourth-largest country considering total area (9,85 million km2). It consists of 50 states of which each one can be easily compared to a country when looking closely to its size and independence. The U.S. are supposed to provide energy for 320 million people that are scattered across all over the country, which is divided by large deserts, forests, mountains and other natural obstacles. The size of the U.S. is also a cause for different weather conditions that appear in different part of the country. Those unique geographical, climate and environmental considerations can bring a lot of beneficial influence on creating well-functioning, efficient and effective power system, but also can be a source of many hard to get round difficulties. Additionally the U.S. is a second biggest (right after China) energy consumer among other countries in the world and thus the power system must be managed properly. (Wikipedia, 2015)
Fig. 4.1.1 The U.S energy overwiew – historical data. 1 Btu=0293 Wh; quadrillion=1015 (U.S. Energy Information Administration, 2015)
Electricity generation, transmission and distribution across the U.S. are managed by utilities that can be federal, state or locally managed. Interstate transmission and sales on the wholesale markets are federally regulated while retail or distributions are state regulated. Some minor local matters such as environmental issues can be regulated locally. The Federal Energy Regulatory Commission (FERC) covers federal regulation in most cases, but sometimes the Environmental Protection Agency or other federal bodies do it. Most of the utilities can perform more than one function (generation, transmission and distribution), some biggest investor owned utilities IOUs operate as vertically integrated companies that manage them all. Hardly any publicly owned utilities (POUs) are the owners of generation units and transmission lines. Because of the complexity of the American system no utility operates oneself in isolation with any cooperation with any other utility.
37
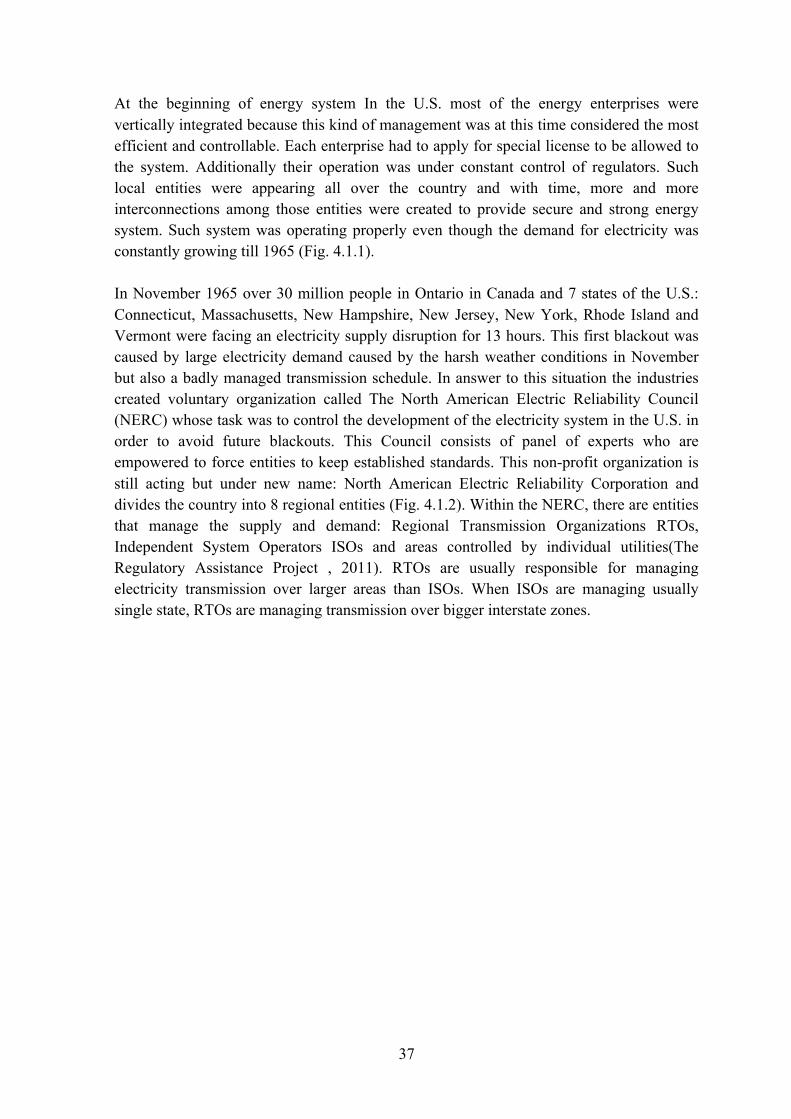
At the beginning of energy system In the U.S. most of the energy enterprises were vertically integrated because this kind of management was at this time considered the most efficient and controllable. Each enterprise had to apply for special license to be allowed to the system. Additionally their operation was under constant control of regulators. Such local entities were appearing all over the country and with time, more and more interconnections among those entities were created to provide secure and strong energy system. Such system was operating properly even though the demand for electricity was constantly growing till 1965 (Fig. 4.1.1). In November 1965 over 30 million people in Ontario in Canada and 7 states of the U.S.: Connecticut, Massachusetts, New Hampshire, New Jersey, New York, Rhode Island and Vermont were facing an electricity supply disruption for 13 hours. This first blackout was caused by large electricity demand caused by the harsh weather conditions in November but also a badly managed transmission schedule. In answer to this situation the industries created voluntary organization called The North American Electric Reliability Council (NERC) whose task was to control the development of the electricity system in the U.S. in order to avoid future blackouts. This Council consists of panel of experts who are empowered to force entities to keep established standards. This non-profit organization is still acting but under new name: North American Electric Reliability Corporation and divides the country into 8 regional entities (Fig. 4.1.2). Within the NERC, there are entities that manage the supply and demand: Regional Transmission Organizations RTOs, Independent System Operators ISOs and areas controlled by individual utilities(The Regulatory Assistance Project , 2011). RTOs are usually responsible for managing electricity transmission over larger areas than ISOs. When ISOs are managing usually single state, RTOs are managing transmission over bigger interstate zones.
38
Fig. 4.1.2 Reliability regions: WECC – Western Reliability Coordinating Council; MRO –
Midwest Reliability Organization; SPP – Southwest Power Pool; ERCOT – Electric Reliability Council of Texas NPCC – Northeast Power Coordinating Council; RFC –
Reliability First; SERC – Reliability Corporation; FRCC – Florida Reliability Coordinating Council
Based on: (RAP, 2011)
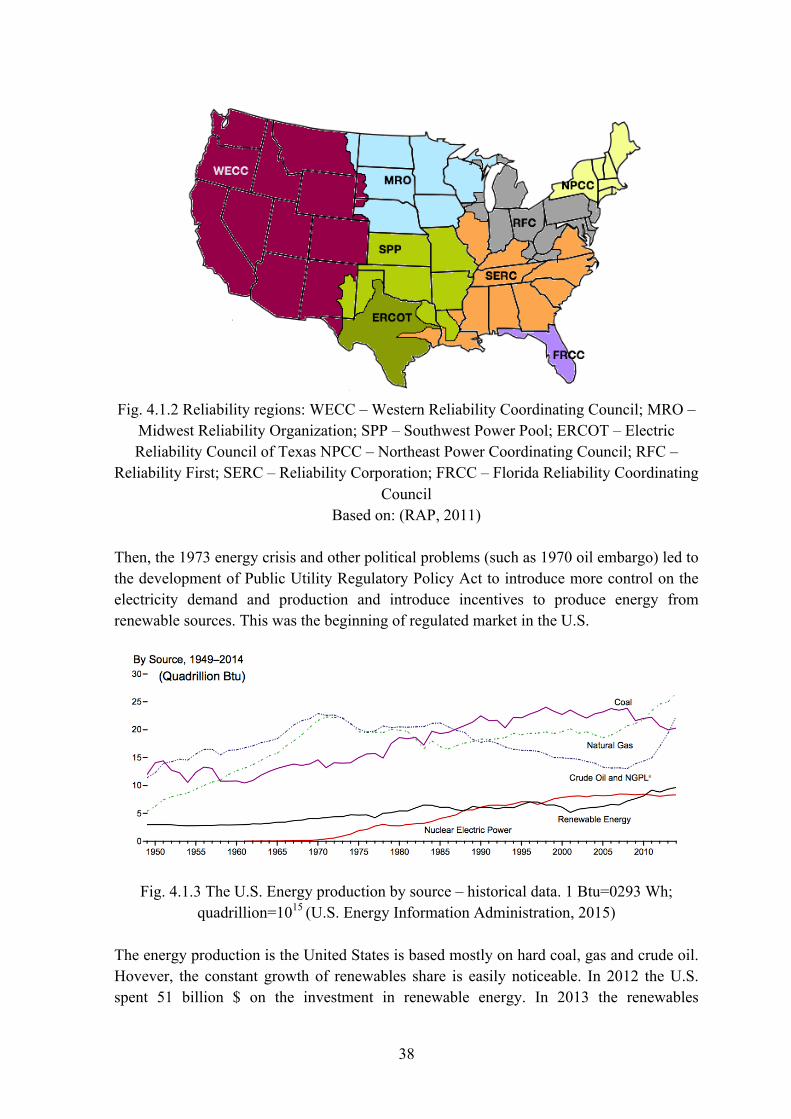
Then, the 1973 energy crisis and other political problems (such as 1970 oil embargo) led to the development of Public Utility Regulatory Policy Act to introduce more control on the electricity demand and production and introduce incentives to produce energy from renewable sources. This was the beginning of regulated market in the U.S.
Fig. 4.1.3 The U.S. Energy production by source – historical data. 1 Btu=0293 Wh;
quadrillion=1015 (U.S. Energy Information Administration, 2015)
The energy production is the United States is based mostly on hard coal, gas and crude oil. Hovever, the constant growth of renewables share is easily noticeable. In 2012 the U.S. spent 51 billion $ on the investment in renewable energy. In 2013 the renewables
39
constituuted a 11% of total energy produced (U.S. windpower totaled 168 MWh). The share of renewables is predicted to reach 240 GW in 2040. (EIA, 2014) Across the country the electricity is distributed in three alternating current interconnection zones (Fig. 4.1.4). All zones operate at frequency of 60 Hz but each zone at different phase. Since there is no direct interconnection between zones, to transfer energy there are applied HCDC (High-Voltage Direct Current) system in which the AC current is rectified to DC current, then it is passing the border and is again converted to DC current consistent with the phase of the new zone current. There are 6 DC ties that are connecting Western to Eastern Interconnection. One tie connects the U.S. to Canada. Texas zone is not connected to the Western Interconnection at all, but has two ties with the Eastern Interconnection. (Sherer, 2010)
Fig. 4.1.4 Interconnection zones
Based on: (RAP, 2011)
Those interconnection zones are divided into several organized competitive markets and several less coordinated markets (Fig. 4.1.5):
Fig. 4.1.5 The U.S. Energy Markets
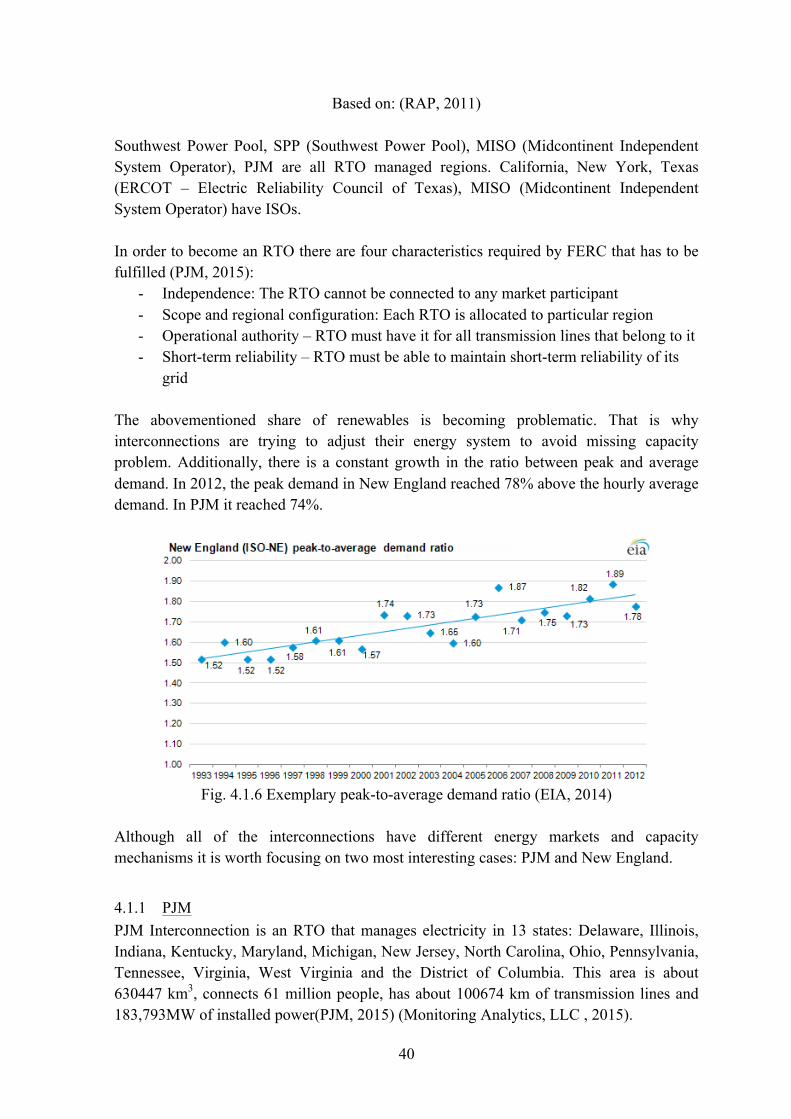
40
Based on: (RAP, 2011) Southwest Power Pool, SPP (Southwest Power Pool), MISO (Midcontinent Independent System Operator), PJM are all RTO managed regions. California, New York, Texas (ERCOT – Electric Reliability Council of Texas), MISO (Midcontinent Independent System Operator) have ISOs. In order to become an RTO there are four characteristics required by FERC that has to be fulfilled (PJM, 2015):
- Independence: The RTO cannot be connected to any market participant - Scope and regional configuration: Each RTO is allocated to particular region - Operational authority – RTO must have it for all transmission lines that belong to it - Short-term reliability – RTO must be able to maintain short-term reliability of its
grid The abovementioned share of renewables is becoming problematic. That is why interconnections are trying to adjust their energy system to avoid missing capacity problem. Additionally, there is a constant growth in the ratio between peak and average demand. In 2012, the peak demand in New England reached 78% above the hourly average demand. In PJM it reached 74%.
Fig. 4.1.6 Exemplary peak-to-average demand ratio (EIA, 2014)
Although all of the interconnections have different energy markets and capacity mechanisms it is worth focusing on two most interesting cases: PJM and New England.
4.1.1 PJM PJM Interconnection is an RTO that manages electricity in 13 states: Delaware, Illinois, Indiana, Kentucky, Maryland, Michigan, New Jersey, North Carolina, Ohio, Pennsylvania, Tennessee, Virginia, West Virginia and the District of Columbia. This area is about 630447 km3, connects 61 million people, has about 100674 km of transmission lines and 183,793MW of installed power(PJM, 2015) (Monitoring Analytics, LLC , 2015).
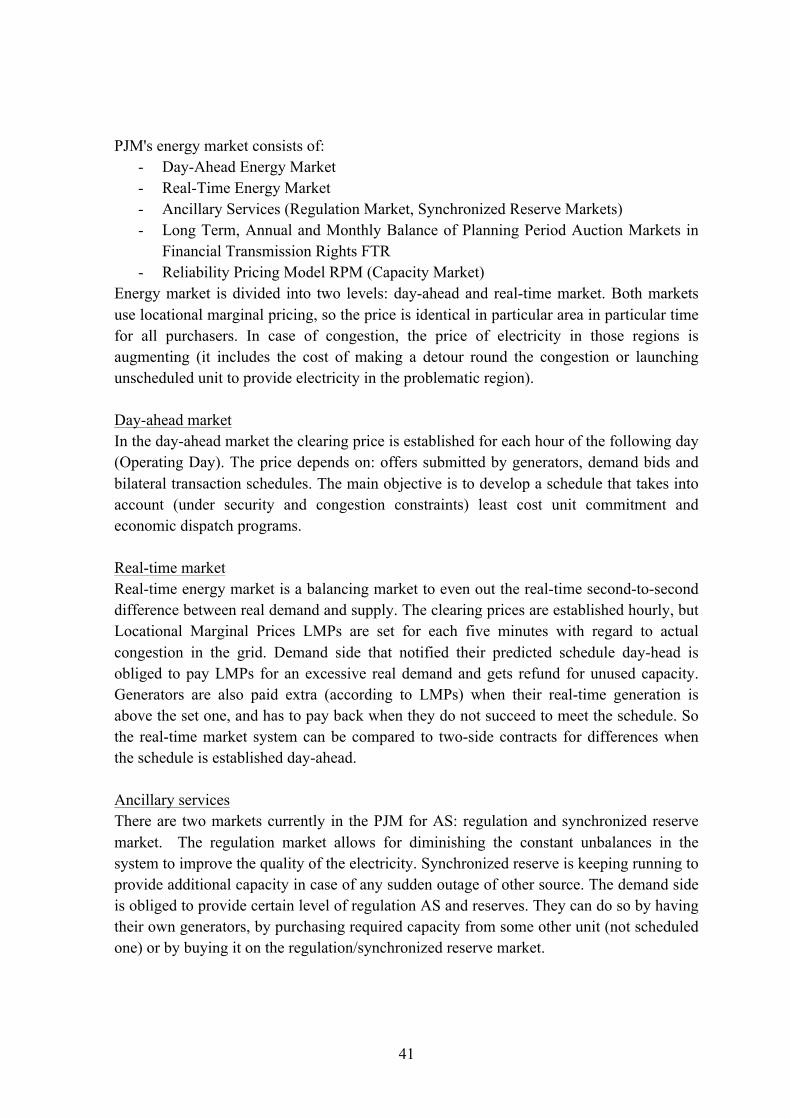
41
PJM's energy market consists of:
- Day-Ahead Energy Market - Real-Time Energy Market - Ancillary Services (Regulation Market, Synchronized Reserve Markets) - Long Term, Annual and Monthly Balance of Planning Period Auction Markets in
Financial Transmission Rights FTR - Reliability Pricing Model RPM (Capacity Market)
Energy market is divided into two levels: day-ahead and real-time market. Both markets use locational marginal pricing, so the price is identical in particular area in particular time for all purchasers. In case of congestion, the price of electricity in those regions is augmenting (it includes the cost of making a detour round the congestion or launching unscheduled unit to provide electricity in the problematic region). Day-ahead market In the day-ahead market the clearing price is established for each hour of the following day (Operating Day). The price depends on: offers submitted by generators, demand bids and bilateral transaction schedules. The main objective is to develop a schedule that takes into account (under security and congestion constraints) least cost unit commitment and economic dispatch programs. Real-time market Real-time energy market is a balancing market to even out the real-time second-to-second difference between real demand and supply. The clearing prices are established hourly, but Locational Marginal Prices LMPs are set for each five minutes with regard to actual congestion in the grid. Demand side that notified their predicted schedule day-head is obliged to pay LMPs for an excessive real demand and gets refund for unused capacity. Generators are also paid extra (according to LMPs) when their real-time generation is above the set one, and has to pay back when they do not succeed to meet the schedule. So the real-time market system can be compared to two-side contracts for differences when the schedule is established day-ahead. Ancillary services There are two markets currently in the PJM for AS: regulation and synchronized reserve market. The regulation market allows for diminishing the constant unbalances in the system to improve the quality of the electricity. Synchronized reserve is keeping running to provide additional capacity in case of any sudden outage of other source. The demand side is obliged to provide certain level of regulation AS and reserves. They can do so by having their own generators, by purchasing required capacity from some other unit (not scheduled one) or by buying it on the regulation/synchronized reserve market.
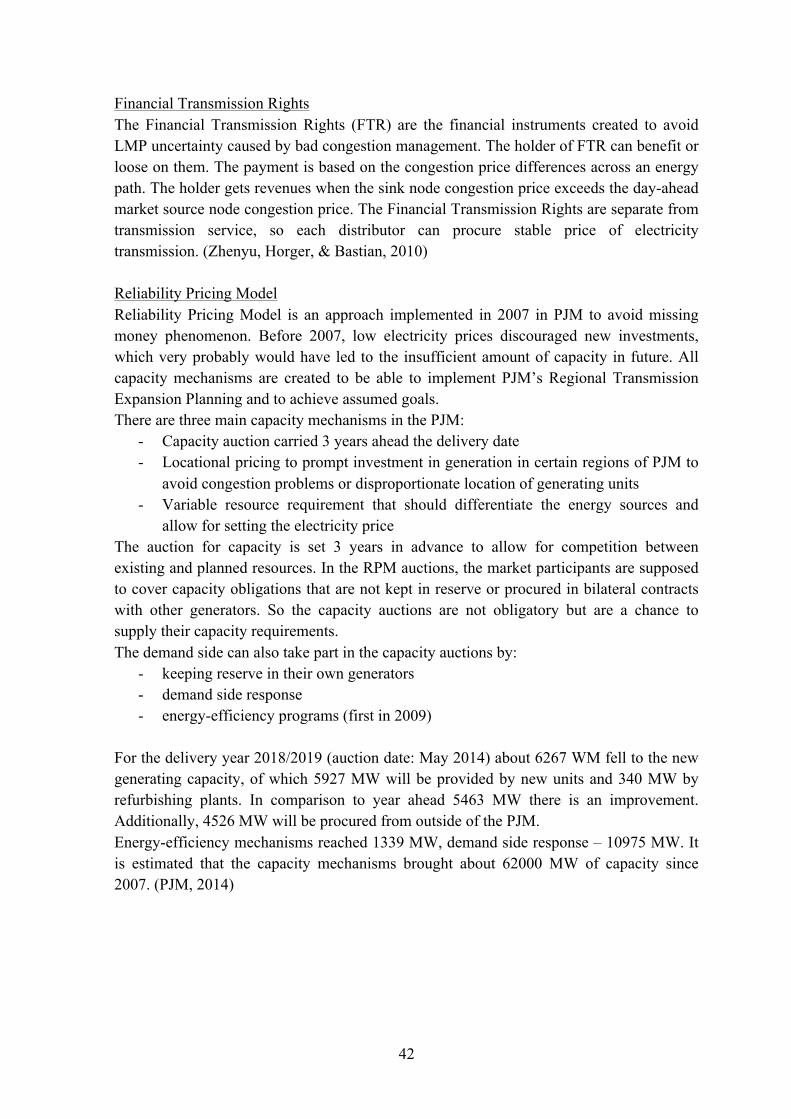
42
Financial Transmission Rights The Financial Transmission Rights (FTR) are the financial instruments created to avoid LMP uncertainty caused by bad congestion management. The holder of FTR can benefit or loose on them. The payment is based on the congestion price differences across an energy path. The holder gets revenues when the sink node congestion price exceeds the day-ahead market source node congestion price. The Financial Transmission Rights are separate from transmission service, so each distributor can procure stable price of electricity transmission. (Zhenyu, Horger, & Bastian, 2010) Reliability Pricing Model Reliability Pricing Model is an approach implemented in 2007 in PJM to avoid missing money phenomenon. Before 2007, low electricity prices discouraged new investments, which very probably would have led to the insufficient amount of capacity in future. All capacity mechanisms are created to be able to implement PJM’s Regional Transmission Expansion Planning and to achieve assumed goals. There are three main capacity mechanisms in the PJM:
- Capacity auction carried 3 years ahead the delivery date - Locational pricing to prompt investment in generation in certain regions of PJM to
avoid congestion problems or disproportionate location of generating units - Variable resource requirement that should differentiate the energy sources and
allow for setting the electricity price The auction for capacity is set 3 years in advance to allow for competition between existing and planned resources. In the RPM auctions, the market participants are supposed to cover capacity obligations that are not kept in reserve or procured in bilateral contracts with other generators. So the capacity auctions are not obligatory but are a chance to supply their capacity requirements. The demand side can also take part in the capacity auctions by:
- keeping reserve in their own generators - demand side response - energy-efficiency programs (first in 2009)
For the delivery year 2018/2019 (auction date: May 2014) about 6267 WM fell to the new generating capacity, of which 5927 MW will be provided by new units and 340 MW by refurbishing plants. In comparison to year ahead 5463 MW there is an improvement. Additionally, 4526 MW will be procured from outside of the PJM. Energy-efficiency mechanisms reached 1339 MW, demand side response – 10975 MW. It is estimated that the capacity mechanisms brought about 62000 MW of capacity since 2007. (PJM, 2014)
43
Fig. 4.1.7 Capacity by source in MW
Based on: (PJM, 2014)
4.1.2 ISO New England ISO New England Interconnection was created by the FERC in 1997 as an ISO. Despite leaving 'ISO' in the name, since 2005 ISO New England operates as an RTO. Now the Interconnection covers the six states: Connecticut, Maine (excluding parts managed by New Brunswick System Operator), Massachusetts, New Hampshire, Rhode Island and Vermont. ISO New England acts as a Transmission Provider, Interchange Coordinator, Transmission Operator, Reliability Coordinator and Balancing Authority over managed area. ISO New England consists of 14 million people (6,5 million households and businesses), has 250 generators with 31000 MW of capacity installed, 13680 km of transmission lines and 13 interconnections to New York and Canada. In 2014 it served 127176 GWh. The total demand is predicted to grow about 1% annually (peak demand 1,3% annually). (ISO New England, 2015)
Fig. 4.1.8 Electricity generation by source
Based on: (ISO New England, 2015)
5927
340
4526
1339
10975
New generating units Refurbishing plants
Imported capacity
Energy-‐efQiciency resources Demand side response
44%
34%
9%
8% 5%
1%
Natural gas
Nuclear
RES
Hydro
Coal
Oil
44
Electricity production is based mostly on natural gas. Its share has grown from 15% in 2000 to 44% in 2014. The share of renewables (800 MW of wind power, 500 MW of solar PV), nuclear and hydro generation has risen slightly (by about 1% each) for the last decade. Accordingly the share of coal and oil has decreased by 13% and 21% respectively. 16% of electricity is imported. The region is very dependent on natural gas, which has reduced the emissions, however the existing gas pipelines are insufficient for growing demand and high demand in winter. The ISO must keep reserve in coal and oil power plants that are used in winter periods. The retirement of this sources may cause blackouts in future. Nowadays ISO New England energy market consists of (ISO New England):
- Day-Ahead Energy Market - Real-Time Energy Market - Ancillary Services Market - Financial Transmission Rights - Forward Capacity Market
Day-ahead Energy Market First auction for providing/purchasing electricity takes place day ahead the Delivery Day. The clearing price is established for each hour of the following day in a uniform clearing price auction. There are over 900 price points over the region that establish the LMP taking into consideration congestion and loses. So the generator is paid individual nodal price but vast majority of load is under zonal pricing. All the bids of predicted generated electricity and predicted demand constitute a schedule of commitment for Delivery Day. The schedule is published at 4 p.m. (Burke, 2011) Real-Time Energy Market The schedule created with Day-Ahead Market auctions is a base for Real-Time auction. The clearing price is established for each 10 minutes of the day. Ancillary Services There is an array of AS in ISO New England:
- Reserve market: According to Operating Procedures, the ISO must be able to recover after an largest system contingency by activating reserve source within 10 min and half of the second-largest within 30 min. To meet those requirements ISO carries a Forward Reserve Market auction (one for summer period – June to September; one to winter period – October to May). This market is supposed to attract investments in fast-start reserve units. Real Time Reserve auction is carried to compensate units who had to provide unscheduled electricity. ISO defines which unit will be serving reserve capacity and which will be selling electricity in the electricity auction, to reduce electricity generation costs.
- Regulation market: an instrument introduced to be able to compensate real-time instability in the power system. Generators or loads who want to take part in this
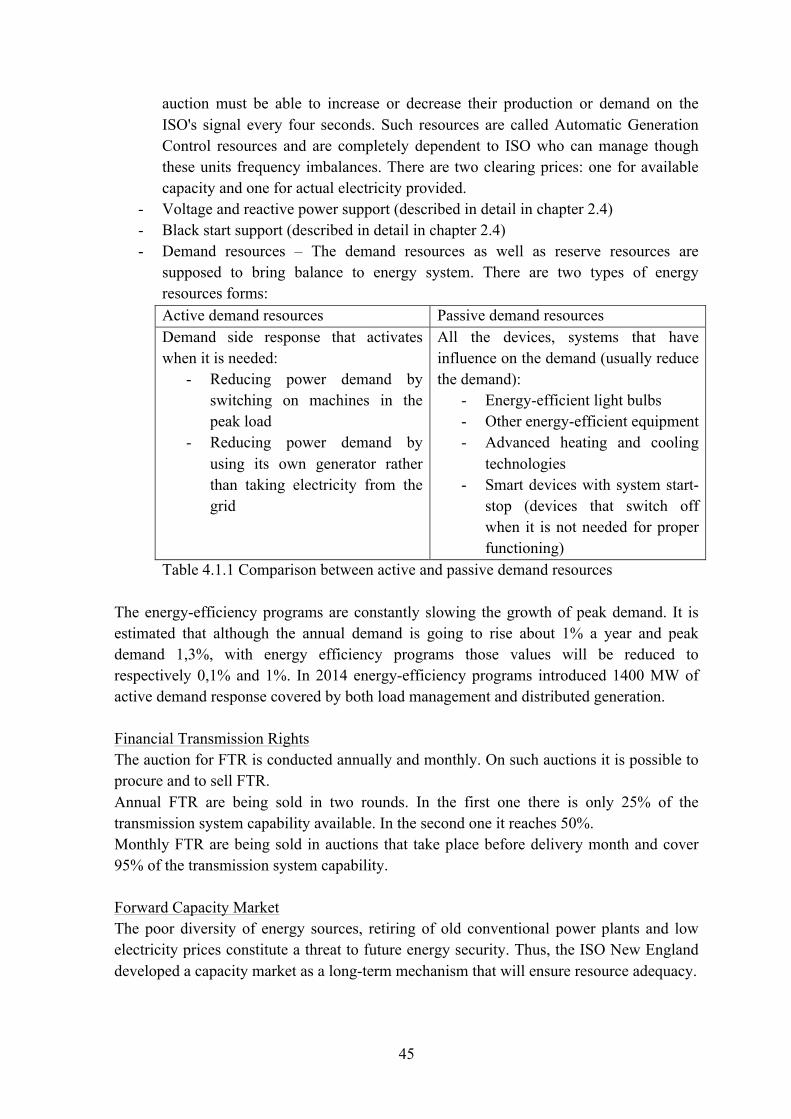
45
auction must be able to increase or decrease their production or demand on the ISO's signal every four seconds. Such resources are called Automatic Generation Control resources and are completely dependent to ISO who can manage though these units frequency imbalances. There are two clearing prices: one for available capacity and one for actual electricity provided.
- Voltage and reactive power support (described in detail in chapter 2.4) - Black start support (described in detail in chapter 2.4) - Demand resources – The demand resources as well as reserve resources are
supposed to bring balance to energy system. There are two types of energy resources forms: Active demand resources Passive demand resources Demand side response that activates when it is needed:
- Reducing power demand by switching on machines in the peak load
- Reducing power demand by using its own generator rather than taking electricity from the grid
All the devices, systems that have influence on the demand (usually reduce the demand):
- Energy-efficient light bulbs - Other energy-efficient equipment - Advanced heating and cooling
technologies - Smart devices with system start-
stop (devices that switch off when it is not needed for proper functioning)
Table 4.1.1 Comparison between active and passive demand resources The energy-efficiency programs are constantly slowing the growth of peak demand. It is estimated that although the annual demand is going to rise about 1% a year and peak demand 1,3%, with energy efficiency programs those values will be reduced to respectively 0,1% and 1%. In 2014 energy-efficiency programs introduced 1400 MW of active demand response covered by both load management and distributed generation. Financial Transmission Rights The auction for FTR is conducted annually and monthly. On such auctions it is possible to procure and to sell FTR. Annual FTR are being sold in two rounds. In the first one there is only 25% of the transmission system capability available. In the second one it reaches 50%. Monthly FTR are being sold in auctions that take place before delivery month and cover 95% of the transmission system capability. Forward Capacity Market The poor diversity of energy sources, retiring of old conventional power plants and low electricity prices constitute a threat to future energy security. Thus, the ISO New England developed a capacity market as a long-term mechanism that will ensure resource adequacy.
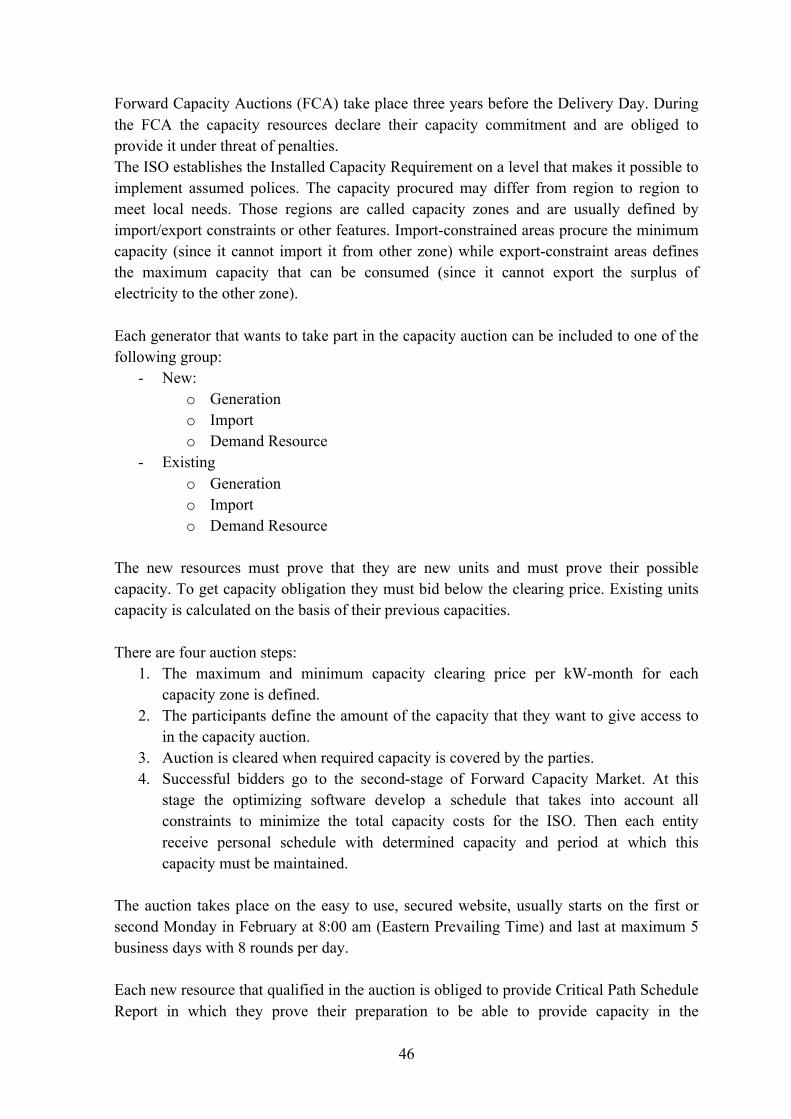
46
Forward Capacity Auctions (FCA) take place three years before the Delivery Day. During the FCA the capacity resources declare their capacity commitment and are obliged to provide it under threat of penalties. The ISO establishes the Installed Capacity Requirement on a level that makes it possible to implement assumed polices. The capacity procured may differ from region to region to meet local needs. Those regions are called capacity zones and are usually defined by import/export constraints or other features. Import-constrained areas procure the minimum capacity (since it cannot import it from other zone) while export-constraint areas defines the maximum capacity that can be consumed (since it cannot export the surplus of electricity to the other zone). Each generator that wants to take part in the capacity auction can be included to one of the following group:
- New: o Generation o Import o Demand Resource
- Existing o Generation o Import o Demand Resource
The new resources must prove that they are new units and must prove their possible capacity. To get capacity obligation they must bid below the clearing price. Existing units capacity is calculated on the basis of their previous capacities. There are four auction steps:
1. The maximum and minimum capacity clearing price per kW-month for each capacity zone is defined.
2. The participants define the amount of the capacity that they want to give access to in the capacity auction.
3. Auction is cleared when required capacity is covered by the parties. 4. Successful bidders go to the second-stage of Forward Capacity Market. At this
stage the optimizing software develop a schedule that takes into account all constraints to minimize the total capacity costs for the ISO. Then each entity receive personal schedule with determined capacity and period at which this capacity must be maintained.
The auction takes place on the easy to use, secured website, usually starts on the first or second Monday in February at 8:00 am (Eastern Prevailing Time) and last at maximum 5 business days with 8 rounds per day. Each new resource that qualified in the auction is obliged to provide Critical Path Schedule Report in which they prove their preparation to be able to provide capacity in the
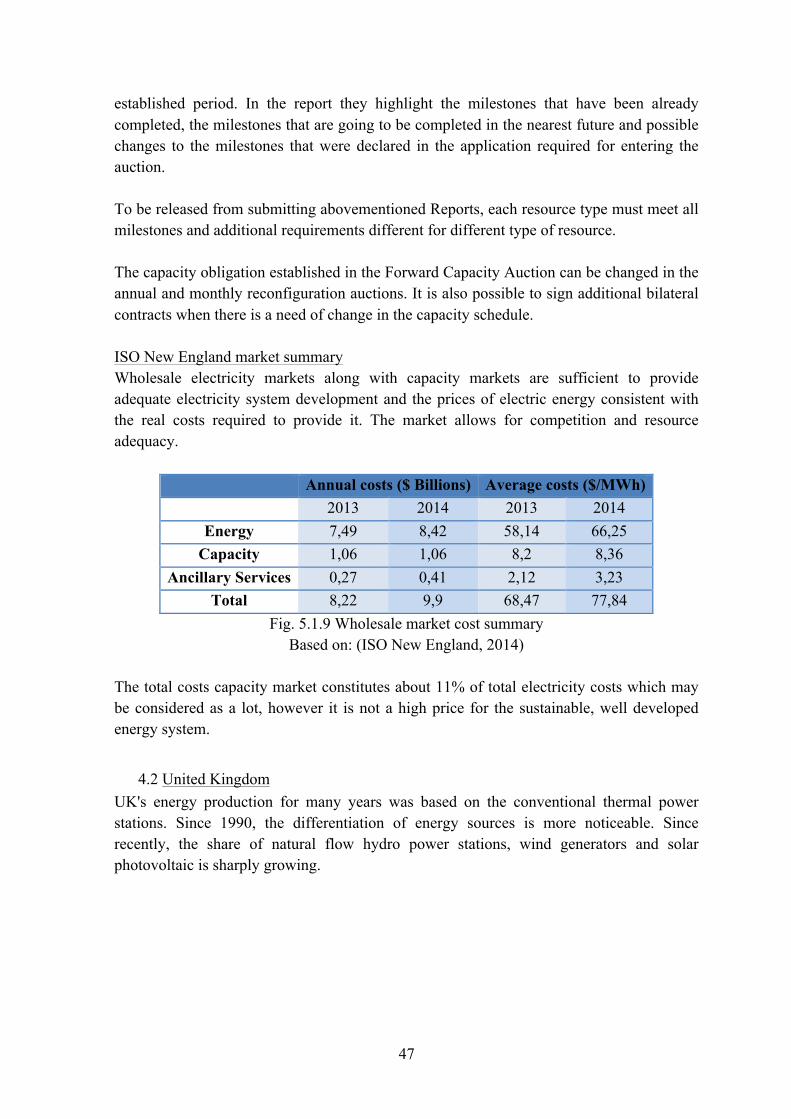
47
established period. In the report they highlight the milestones that have been already completed, the milestones that are going to be completed in the nearest future and possible changes to the milestones that were declared in the application required for entering the auction. To be released from submitting abovementioned Reports, each resource type must meet all milestones and additional requirements different for different type of resource. The capacity obligation established in the Forward Capacity Auction can be changed in the annual and monthly reconfiguration auctions. It is also possible to sign additional bilateral contracts when there is a need of change in the capacity schedule. ISO New England market summary Wholesale electricity markets along with capacity markets are sufficient to provide adequate electricity system development and the prices of electric energy consistent with the real costs required to provide it. The market allows for competition and resource adequacy.
Annual costs ($ Billions) Average costs ($/MWh) 2013 2014 2013 2014
Energy 7,49 8,42 58,14 66,25 Capacity 1,06 1,06 8,2 8,36
Ancillary Services 0,27 0,41 2,12 3,23 Total 8,22 9,9 68,47 77,84
Fig. 5.1.9 Wholesale market cost summary Based on: (ISO New England, 2014)
The total costs capacity market constitutes about 11% of total electricity costs which may be considered as a lot, however it is not a high price for the sustainable, well developed energy system.
4.2 United Kingdom UK's energy production for many years was based on the conventional thermal power stations. Since 1990, the differentiation of energy sources is more noticeable. Since recently, the share of natural flow hydro power stations, wind generators and solar photovoltaic is sharply growing.
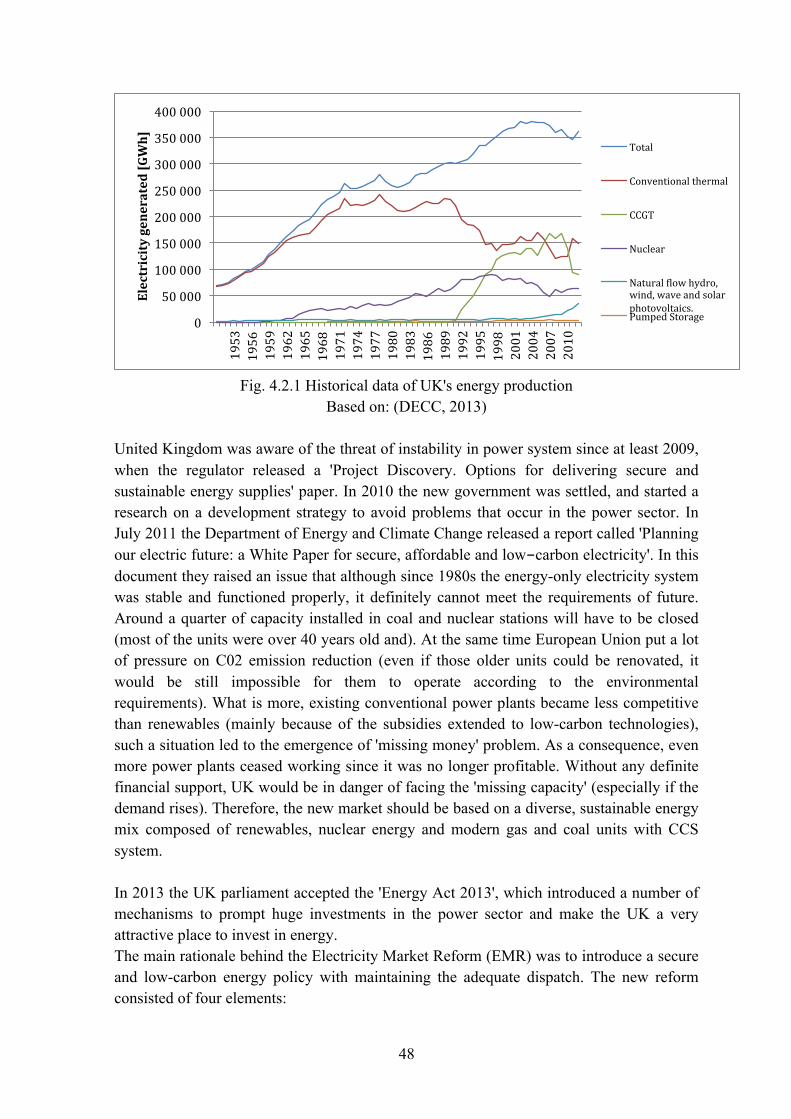
48
Fig. 4.2.1 Historical data of UK's energy production
Based on: (DECC, 2013) United Kingdom was aware of the threat of instability in power system since at least 2009, when the regulator released a 'Project Discovery. Options for delivering secure and sustainable energy supplies' paper. In 2010 the new government was settled, and started a research on a development strategy to avoid problems that occur in the power sector. In July 2011 the Department of Energy and Climate Change released a report called 'Planning our electric future: a White Paper for secure, affordable and low-carbon electricity'. In this document they raised an issue that although since 1980s the energy-only electricity system was stable and functioned properly, it definitely cannot meet the requirements of future. Around a quarter of capacity installed in coal and nuclear stations will have to be closed (most of the units were over 40 years old and). At the same time European Union put a lot of pressure on C02 emission reduction (even if those older units could be renovated, it would be still impossible for them to operate according to the environmental requirements). What is more, existing conventional power plants became less competitive than renewables (mainly because of the subsidies extended to low-carbon technologies), such a situation led to the emergence of 'missing money' problem. As a consequence, even more power plants ceased working since it was no longer profitable. Without any definite financial support, UK would be in danger of facing the 'missing capacity' (especially if the demand rises). Therefore, the new market should be based on a diverse, sustainable energy mix composed of renewables, nuclear energy and modern gas and coal units with CCS system. In 2013 the UK parliament accepted the 'Energy Act 2013', which introduced a number of mechanisms to prompt huge investments in the power sector and make the UK a very attractive place to invest in energy. The main rationale behind the Electricity Market Reform (EMR) was to introduce a secure and low-carbon energy policy with maintaining the adequate dispatch. The new reform consisted of four elements:
0
50 000
100 000
150 000
200 000
250 000
300 000
350 000
400 000
1953
1956
1959
1962
1965
1968
1971
1974
1977
1980
1983
1986
1989
1992
1995
1998
2001
2004
2007
2010
Electricity generated [GWh]
Total
Conventional thermal
CCGT
Nuclear
Natural Qlow hydro, wind, wave and solar photovoltaics. Pumped Storage
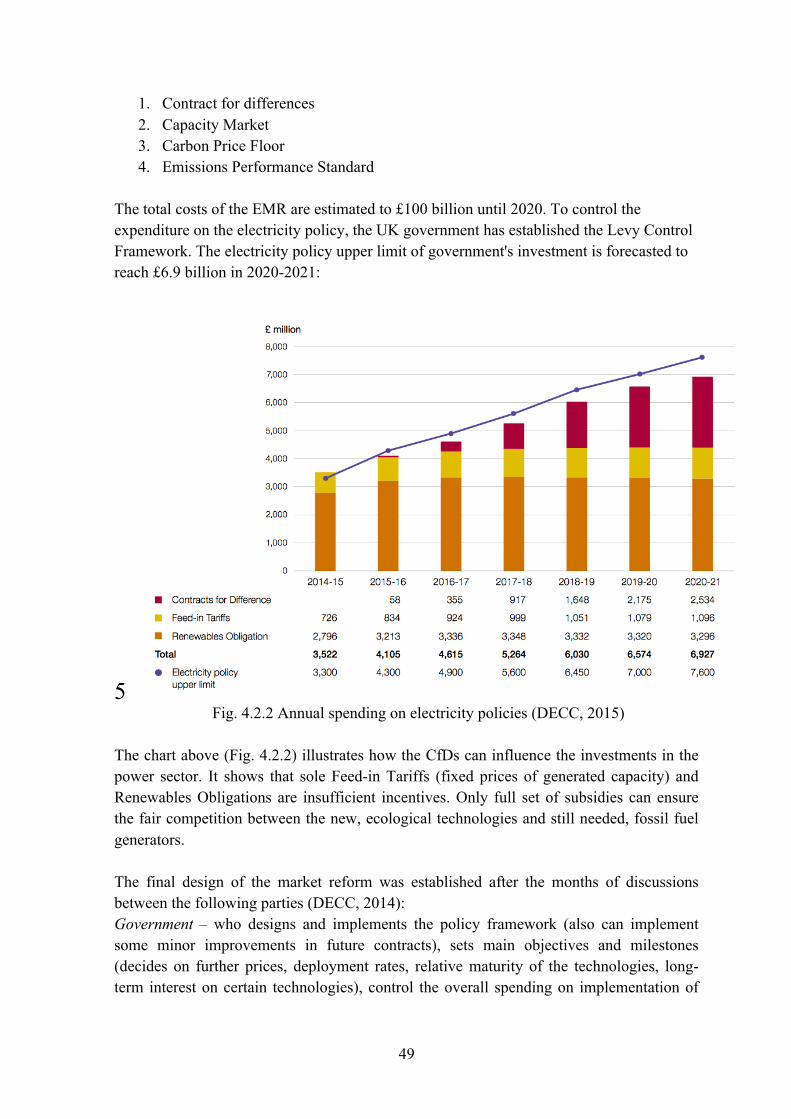
49
1. Contract for differences 2. Capacity Market 3. Carbon Price Floor 4. Emissions Performance Standard
The total costs of the EMR are estimated to £100 billion until 2020. To control the expenditure on the electricity policy, the UK government has established the Levy Control Framework. The electricity policy upper limit of government's investment is forecasted to reach £6.9 billion in 2020-2021:
5 Fig. 4.2.2 Annual spending on electricity policies (DECC, 2015)
The chart above (Fig. 4.2.2) illustrates how the CfDs can influence the investments in the power sector. It shows that sole Feed-in Tariffs (fixed prices of generated capacity) and Renewables Obligations are insufficient incentives. Only full set of subsidies can ensure the fair competition between the new, ecological technologies and still needed, fossil fuel generators.
The final design of the market reform was established after the months of discussions between the following parties (DECC, 2014): Government – who designs and implements the policy framework (also can implement some minor improvements in future contracts), sets main objectives and milestones (decides on further prices, deployment rates, relative maturity of the technologies, long-term interest on certain technologies), control the overall spending on implementation of
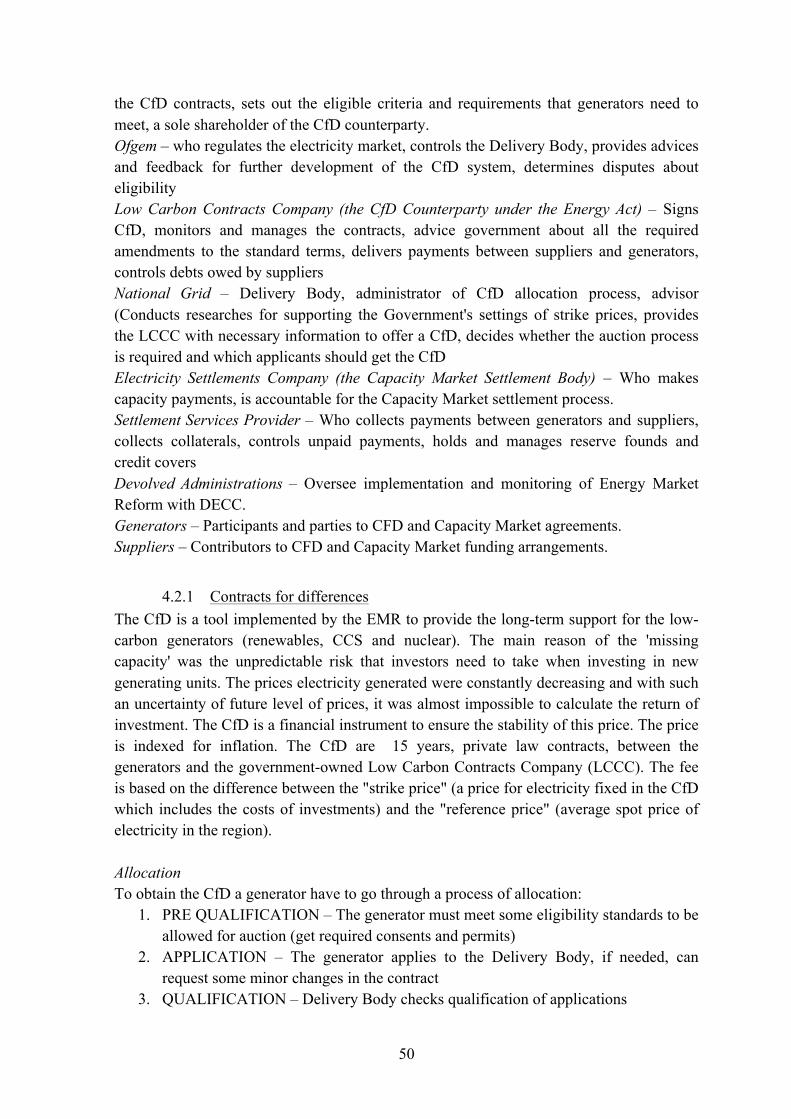
50
the CfD contracts, sets out the eligible criteria and requirements that generators need to meet, a sole shareholder of the CfD counterparty. Ofgem – who regulates the electricity market, controls the Delivery Body, provides advices and feedback for further development of the CfD system, determines disputes about eligibility Low Carbon Contracts Company (the CfD Counterparty under the Energy Act) – Signs CfD, monitors and manages the contracts, advice government about all the required amendments to the standard terms, delivers payments between suppliers and generators, controls debts owed by suppliers National Grid – Delivery Body, administrator of CfD allocation process, advisor (Conducts researches for supporting the Government's settings of strike prices, provides the LCCC with necessary information to offer a CfD, decides whether the auction process is required and which applicants should get the CfD Electricity Settlements Company (the Capacity Market Settlement Body) – Who makes capacity payments, is accountable for the Capacity Market settlement process. Settlement Services Provider – Who collects payments between generators and suppliers, collects collaterals, controls unpaid payments, holds and manages reserve founds and credit covers Devolved Administrations – Oversee implementation and monitoring of Energy Market Reform with DECC. Generators – Participants and parties to CFD and Capacity Market agreements. Suppliers – Contributors to CFD and Capacity Market funding arrangements.
4.2.1 Contracts for differences The CfD is a tool implemented by the EMR to provide the long-term support for the low-carbon generators (renewables, CCS and nuclear). The main reason of the 'missing capacity' was the unpredictable risk that investors need to take when investing in new generating units. The prices electricity generated were constantly decreasing and with such an uncertainty of future level of prices, it was almost impossible to calculate the return of investment. The CfD is a financial instrument to ensure the stability of this price. The price is indexed for inflation. The CfD are 15 years, private law contracts, between the generators and the government-owned Low Carbon Contracts Company (LCCC). The fee is based on the difference between the "strike price" (a price for electricity fixed in the CfD which includes the costs of investments) and the "reference price" (average spot price of electricity in the region). Allocation To obtain the CfD a generator have to go through a process of allocation:
1. PRE QUALIFICATION – The generator must meet some eligibility standards to be allowed for auction (get required consents and permits)
2. APPLICATION – The generator applies to the Delivery Body, if needed, can request some minor changes in the contract
3. QUALIFICATION – Delivery Body checks qualification of applications
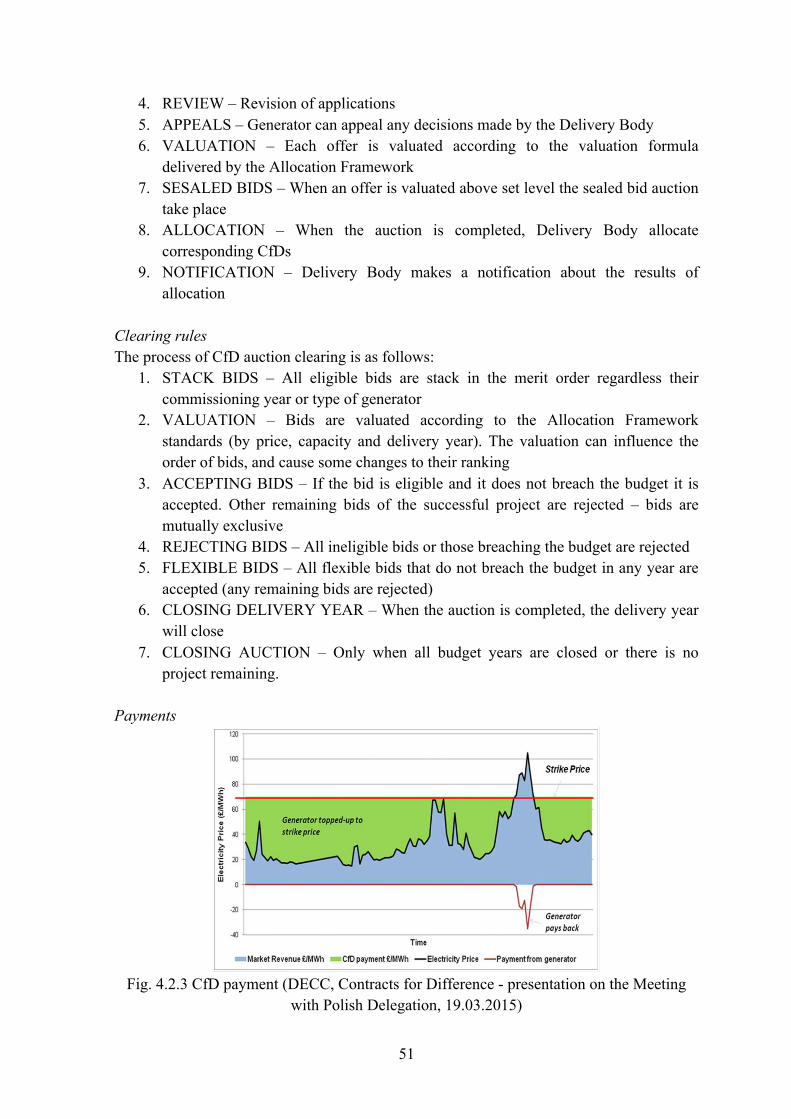
51
4. REVIEW – Revision of applications 5. APPEALS – Generator can appeal any decisions made by the Delivery Body 6. VALUATION – Each offer is valuated according to the valuation formula
delivered by the Allocation Framework 7. SESALED BIDS – When an offer is valuated above set level the sealed bid auction
take place 8. ALLOCATION – When the auction is completed, Delivery Body allocate
corresponding CfDs 9. NOTIFICATION – Delivery Body makes a notification about the results of
allocation Clearing rules The process of CfD auction clearing is as follows:
1. STACK BIDS – All eligible bids are stack in the merit order regardless their commissioning year or type of generator
2. VALUATION – Bids are valuated according to the Allocation Framework standards (by price, capacity and delivery year). The valuation can influence the order of bids, and cause some changes to their ranking
3. ACCEPTING BIDS – If the bid is eligible and it does not breach the budget it is accepted. Other remaining bids of the successful project are rejected – bids are mutually exclusive
4. REJECTING BIDS – All ineligible bids or those breaching the budget are rejected 5. FLEXIBLE BIDS – All flexible bids that do not breach the budget in any year are
accepted (any remaining bids are rejected) 6. CLOSING DELIVERY YEAR – When the auction is completed, the delivery year
will close 7. CLOSING AUCTION – Only when all budget years are closed or there is no
project remaining. Payments
Fig. 4.2.3 CfD payment (DECC, Contracts for Difference - presentation on the Meeting
with Polish Delegation, 19.03.2015)
PAYMENTSCfD regulates how payments are made • Contract sets out:
• The delivery conditions that the generator needs to meet to receive payments
• How payments are calculated and when they are paid
• Requires the generator to make certain representations, warranties and undertakings to enter into the contract and receive payments
• The measures to preserve the value of those payments
• How the contract can be terminated • How disputes are to be resolved • How the contract can be amended • Sustainability and fuel
measurement requirements
14
Contract sets out:
• The delivery conditions that the generator needs to meet to receive payments
• How payments are calculated and when they are paid
• Requires the generator to make certain representations, warranties and undertakings to enter into the contract and receive payments
• The measures to preserve the value of those payments
• How the contract can be terminated
• How disputes are to be resolved
• How the contract can be amended
• Sustainability and fuel measurement requirements
6
52
If the electricity price is below the Strike Price settled in the contract, the Generator receives a compensation of that difference. If the price rises and exceeds the Strike Price, the Generator has to pay back an adequate amount of money. Thus the Generator can predict its income accurately. Apart from the Striking price, the contract sets out many terms such as:
- The delivery conditions that should be maintained to receive payment - When the payments are to be made (Miguelez, Cortes, Rodriguez, & Camino,
2008) - How to calculate payments - What representation, warranties and undertakings the generator must take to satisfy
the required conditions of the contract - How to terminate or amend the contract (for both sides) - How to resolve disputes
Supplier obligation
Fig. 4.2.4 Cash flow between consumers and generators
Based on: (DECC, Contracts for Difference - presentation on the Meeting with Polish Delegation, 19.03.2015)
All CfD payments are levied on the Supplier, but these are consumers who will have to pay for it in the final settlement. To minimize the impact on the customers' electricity bill, the process must be very transparent. All licensed electricity suppliers in the UK (from 1 April 2015) must pay the CfD Supplier obligation. The payments are made quarterly. All money for the CfD that Supplier received has to be transferred to the Generators (Suppliers cannot charge for the CfD transfer). The payments consist of Interim Levy Rate (ILR) and Total Reserve Amount (TRA). The ILR is an interim unit cost fixed rate paid by Suppliers. The TRA is based on the market share – Suppliers must pay a proportionate TRA by the 7th day of the quarter. The LCC establish the ILR and the the TRA at least 3 months in advance.. It is also obliged to publish forecasts of the ILR and the TRA for the following three quarters. At the end of
Reconciliation Re
conciliation
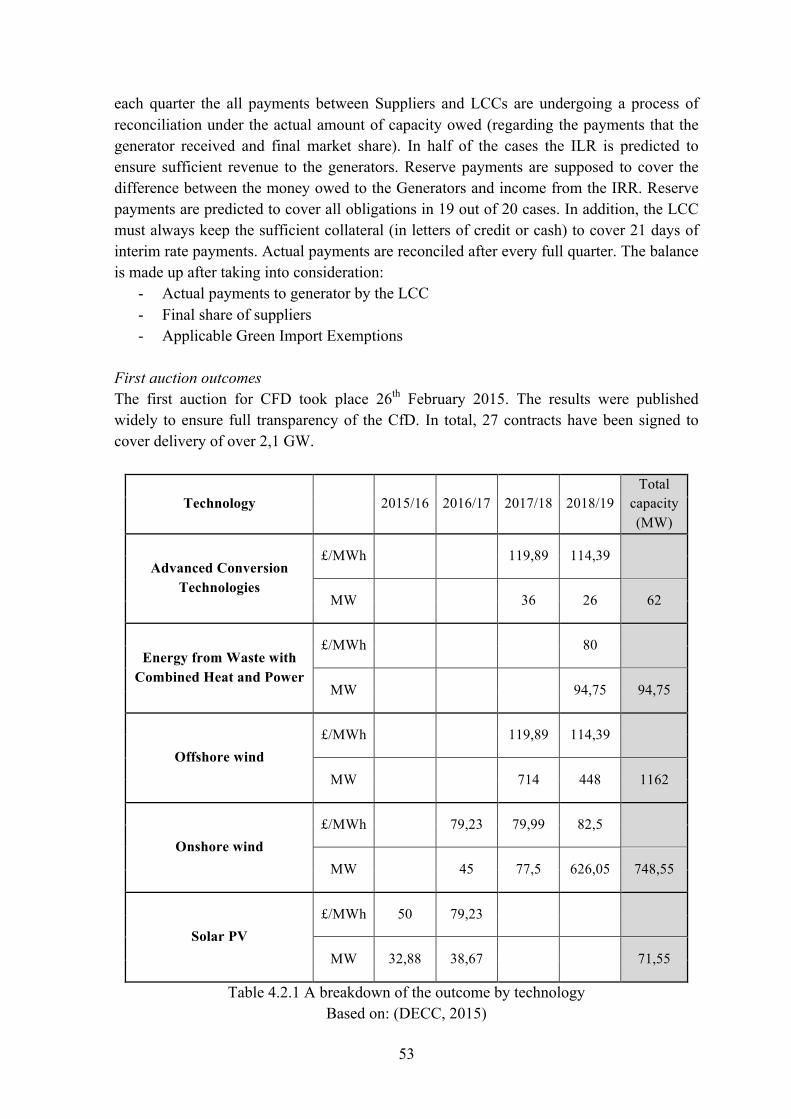
53
each quarter the all payments between Suppliers and LCCs are undergoing a process of reconciliation under the actual amount of capacity owed (regarding the payments that the generator received and final market share). In half of the cases the ILR is predicted to ensure sufficient revenue to the generators. Reserve payments are supposed to cover the difference between the money owed to the Generators and income from the IRR. Reserve payments are predicted to cover all obligations in 19 out of 20 cases. In addition, the LCC must always keep the sufficient collateral (in letters of credit or cash) to cover 21 days of interim rate payments. Actual payments are reconciled after every full quarter. The balance is made up after taking into consideration:
- Actual payments to generator by the LCC - Final share of suppliers - Applicable Green Import Exemptions
First auction outcomes The first auction for CFD took place 26th February 2015. The results were published widely to ensure full transparency of the CfD. In total, 27 contracts have been signed to cover delivery of over 2,1 GW.
Technology
2015/16 2016/17 2017/18 2018/19 Total
capacity (MW)
Advanced Conversion Technologies
£/MWh
119,89 114,39
MW
36 26 62
Energy from Waste with Combined Heat and Power
£/MWh
80
MW
94,75 94,75
Offshore wind £/MWh
119,89 114,39
MW
714 448 1162
Onshore wind £/MWh
79,23 79,99 82,5
MW
45 77,5 626,05 748,55
Solar PV £/MWh 50 79,23
MW 32,88 38,67
71,55
Table 4.2.1 A breakdown of the outcome by technology Based on: (DECC, 2015)
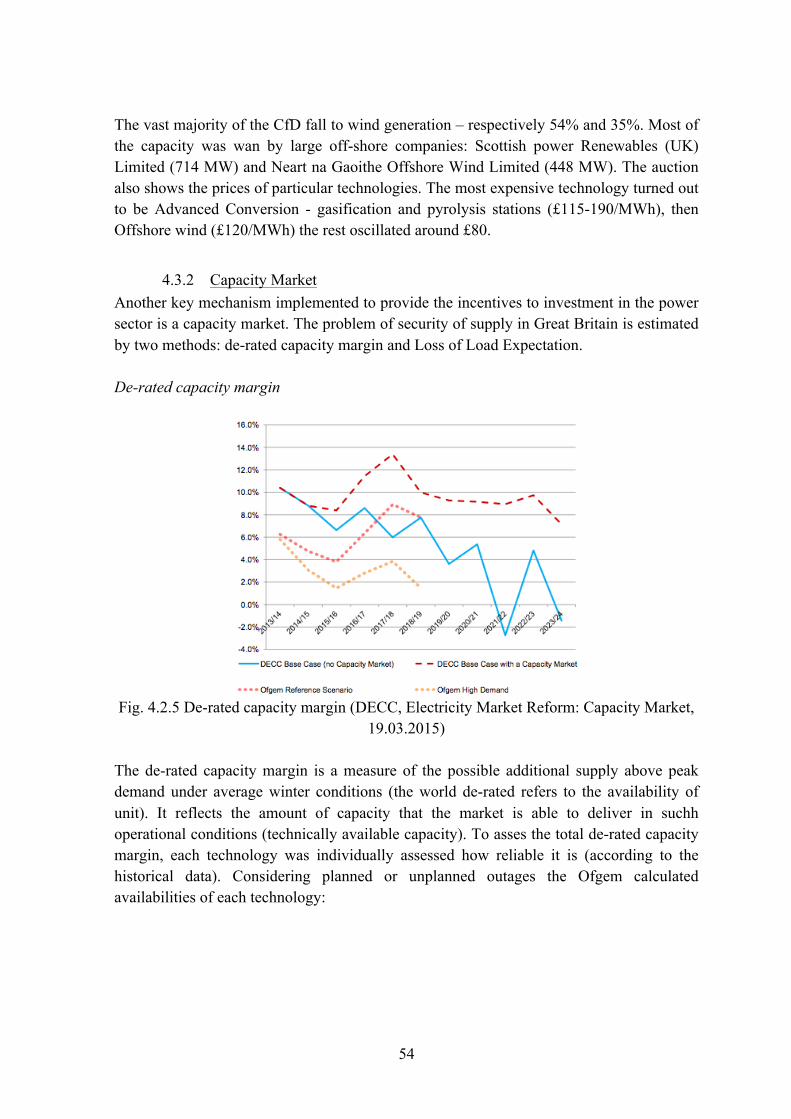
54
The vast majority of the CfD fall to wind generation – respectively 54% and 35%. Most of the capacity was wan by large off-shore companies: Scottish power Renewables (UK) Limited (714 MW) and Neart na Gaoithe Offshore Wind Limited (448 MW). The auction also shows the prices of particular technologies. The most expensive technology turned out to be Advanced Conversion - gasification and pyrolysis stations (£115-190/MWh), then Offshore wind (£120/MWh) the rest oscillated around £80.
4.3.2 Capacity Market Another key mechanism implemented to provide the incentives to investment in the power sector is a capacity market. The problem of security of supply in Great Britain is estimated by two methods: de-rated capacity margin and Loss of Load Expectation. De-rated capacity margin
Fig. 4.2.5 De-rated capacity margin (DECC, Electricity Market Reform: Capacity Market,
19.03.2015) The de-rated capacity margin is a measure of the possible additional supply above peak demand under average winter conditions (the world de-rated refers to the availability of unit). It reflects the amount of capacity that the market is able to deliver in suchh operational conditions (technically available capacity). To asses the total de-rated capacity margin, each technology was individually assessed how reliable it is (according to the historical data). Considering planned or unplanned outages the Ofgem calculated availabilities of each technology:
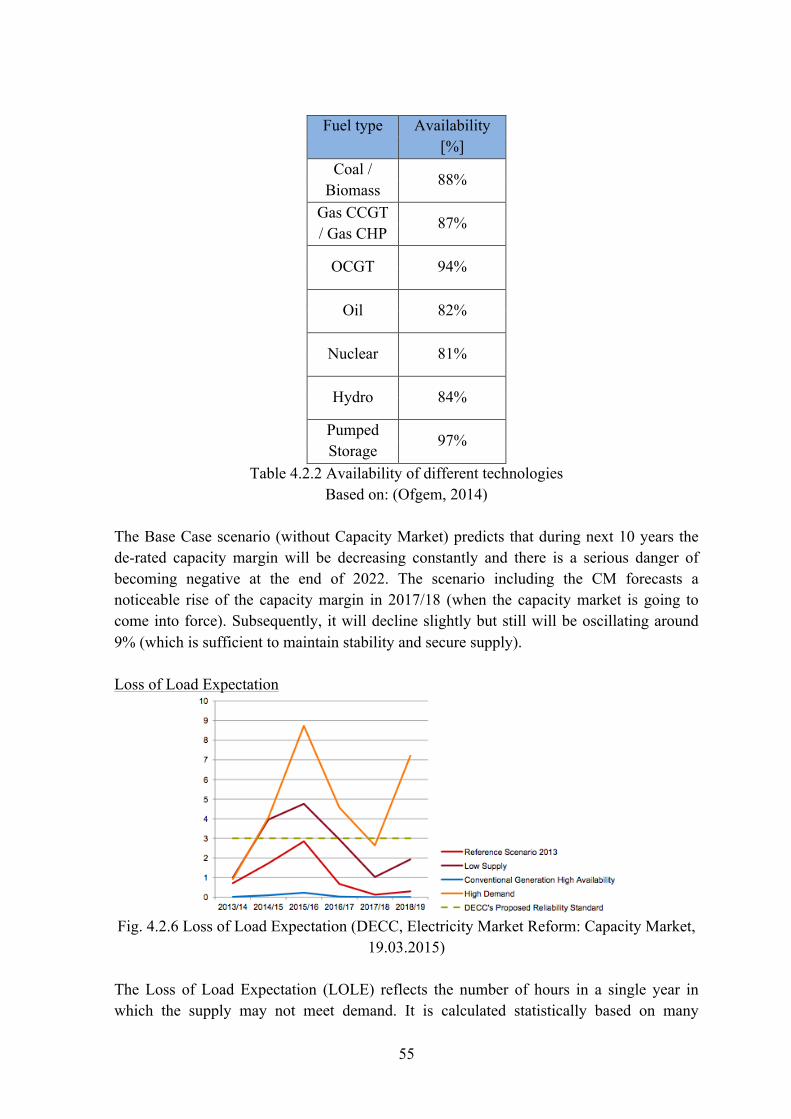
55
Fuel type Availability
[%] Coal /
Biomass 88%
Gas CCGT / Gas CHP
87%
OCGT 94%
Oil 82%
Nuclear 81%
Hydro 84%
Pumped Storage
97%
Table 4.2.2 Availability of different technologies Based on: (Ofgem, 2014)
The Base Case scenario (without Capacity Market) predicts that during next 10 years the de-rated capacity margin will be decreasing constantly and there is a serious danger of becoming negative at the end of 2022. The scenario including the CM forecasts a noticeable rise of the capacity margin in 2017/18 (when the capacity market is going to come into force). Subsequently, it will decline slightly but still will be oscillating around 9% (which is sufficient to maintain stability and secure supply). Loss of Load Expectation
Fig. 4.2.6 Loss of Load Expectation (DECC, Electricity Market Reform: Capacity Market,
19.03.2015)
The Loss of Load Expectation (LOLE) reflects the number of hours in a single year in which the supply may not meet demand. It is calculated statistically based on many
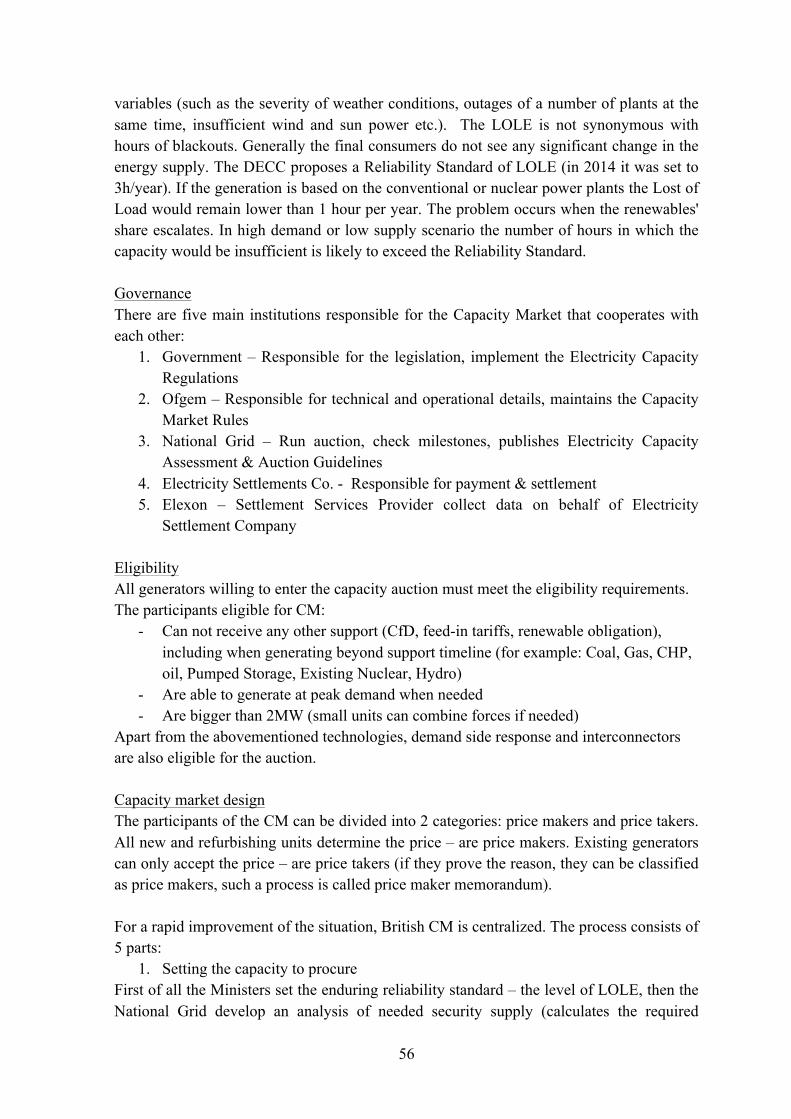
56
variables (such as the severity of weather conditions, outages of a number of plants at the same time, insufficient wind and sun power etc.). The LOLE is not synonymous with hours of blackouts. Generally the final consumers do not see any significant change in the energy supply. The DECC proposes a Reliability Standard of LOLE (in 2014 it was set to 3h/year). If the generation is based on the conventional or nuclear power plants the Lost of Load would remain lower than 1 hour per year. The problem occurs when the renewables' share escalates. In high demand or low supply scenario the number of hours in which the capacity would be insufficient is likely to exceed the Reliability Standard. Governance There are five main institutions responsible for the Capacity Market that cooperates with each other:
1. Government – Responsible for the legislation, implement the Electricity Capacity Regulations
2. Ofgem – Responsible for technical and operational details, maintains the Capacity Market Rules
3. National Grid – Run auction, check milestones, publishes Electricity Capacity Assessment & Auction Guidelines
4. Electricity Settlements Co. - Responsible for payment & settlement 5. Elexon – Settlement Services Provider collect data on behalf of Electricity
Settlement Company
Eligibility All generators willing to enter the capacity auction must meet the eligibility requirements. The participants eligible for CM:
- Can not receive any other support (CfD, feed-in tariffs, renewable obligation), including when generating beyond support timeline (for example: Coal, Gas, CHP, oil, Pumped Storage, Existing Nuclear, Hydro)
- Are able to generate at peak demand when needed - Are bigger than 2MW (small units can combine forces if needed)
Apart from the abovementioned technologies, demand side response and interconnectors are also eligible for the auction. Capacity market design The participants of the CM can be divided into 2 categories: price makers and price takers. All new and refurbishing units determine the price – are price makers. Existing generators can only accept the price – are price takers (if they prove the reason, they can be classified as price makers, such a process is called price maker memorandum). For a rapid improvement of the situation, British CM is centralized. The process consists of 5 parts:
1. Setting the capacity to procure First of all the Ministers set the enduring reliability standard – the level of LOLE, then the National Grid develop an analysis of needed security supply (calculates the required
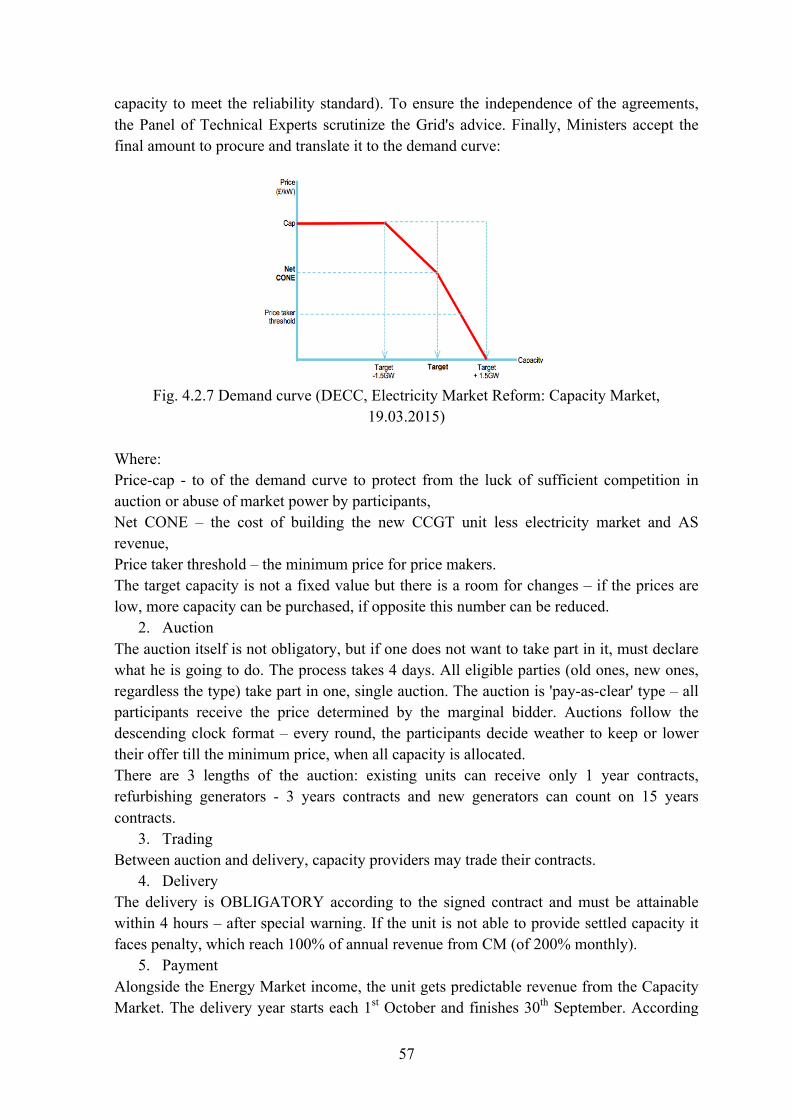
57
capacity to meet the reliability standard). To ensure the independence of the agreements, the Panel of Technical Experts scrutinize the Grid's advice. Finally, Ministers accept the final amount to procure and translate it to the demand curve:
Fig. 4.2.7 Demand curve (DECC, Electricity Market Reform: Capacity Market,
19.03.2015)
Where: Price-cap - to of the demand curve to protect from the luck of sufficient competition in auction or abuse of market power by participants, Net CONE – the cost of building the new CCGT unit less electricity market and AS revenue, Price taker threshold – the minimum price for price makers. The target capacity is not a fixed value but there is a room for changes – if the prices are low, more capacity can be purchased, if opposite this number can be reduced.
2. Auction The auction itself is not obligatory, but if one does not want to take part in it, must declare what he is going to do. The process takes 4 days. All eligible parties (old ones, new ones, regardless the type) take part in one, single auction. The auction is 'pay-as-clear' type – all participants receive the price determined by the marginal bidder. Auctions follow the descending clock format – every round, the participants decide weather to keep or lower their offer till the minimum price, when all capacity is allocated. There are 3 lengths of the auction: existing units can receive only 1 year contracts, refurbishing generators - 3 years contracts and new generators can count on 15 years contracts.
3. Trading Between auction and delivery, capacity providers may trade their contracts.
4. Delivery The delivery is OBLIGATORY according to the signed contract and must be attainable within 4 hours – after special warning. If the unit is not able to provide settled capacity it faces penalty, which reach 100% of annual revenue from CM (of 200% monthly).
5. Payment Alongside the Energy Market income, the unit gets predictable revenue from the Capacity Market. The delivery year starts each 1st October and finishes 30th September. According
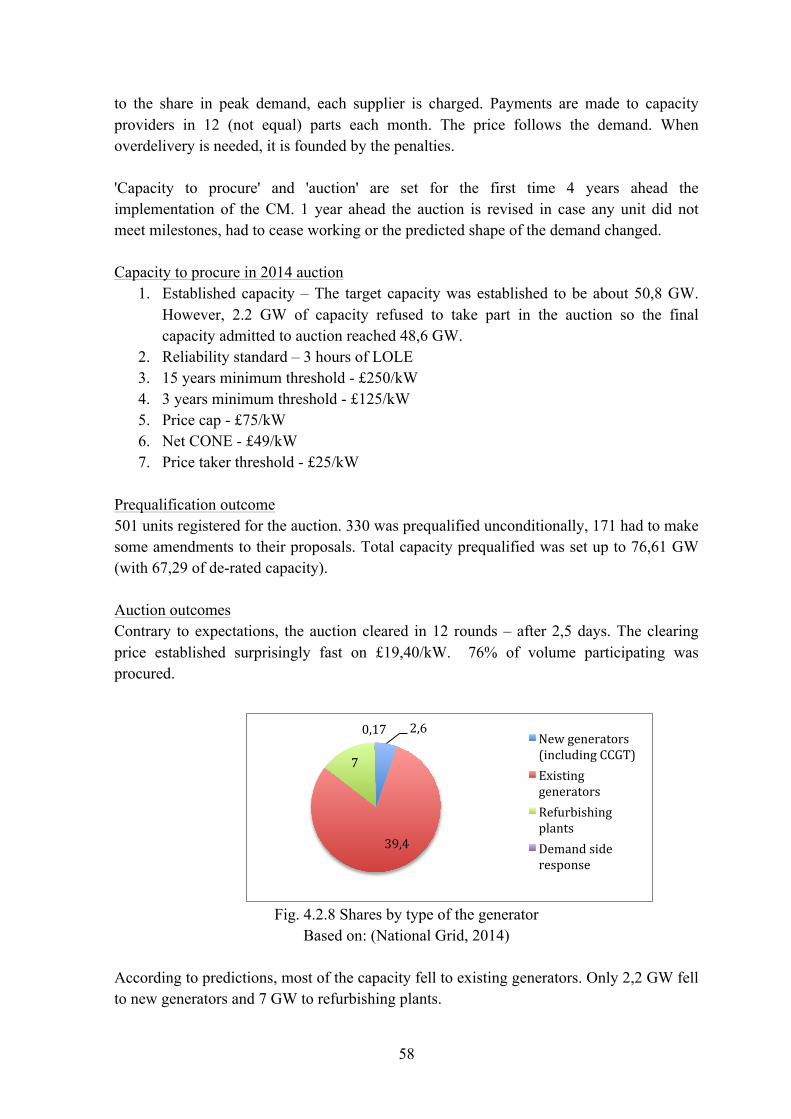
58
to the share in peak demand, each supplier is charged. Payments are made to capacity providers in 12 (not equal) parts each month. The price follows the demand. When overdelivery is needed, it is founded by the penalties. 'Capacity to procure' and 'auction' are set for the first time 4 years ahead the implementation of the CM. 1 year ahead the auction is revised in case any unit did not meet milestones, had to cease working or the predicted shape of the demand changed. Capacity to procure in 2014 auction
1. Established capacity – The target capacity was established to be about 50,8 GW. However, 2.2 GW of capacity refused to take part in the auction so the final capacity admitted to auction reached 48,6 GW.
2. Reliability standard – 3 hours of LOLE 3. 15 years minimum threshold - £250/kW 4. 3 years minimum threshold - £125/kW 5. Price cap - £75/kW 6. Net CONE - £49/kW 7. Price taker threshold - £25/kW
Prequalification outcome 501 units registered for the auction. 330 was prequalified unconditionally, 171 had to make some amendments to their proposals. Total capacity prequalified was set up to 76,61 GW (with 67,29 of de-rated capacity). Auction outcomes Contrary to expectations, the auction cleared in 12 rounds – after 2,5 days. The clearing price established surprisingly fast on £19,40/kW. 76% of volume participating was procured.
Fig. 4.2.8 Shares by type of the generator Based on: (National Grid, 2014)
According to predictions, most of the capacity fell to existing generators. Only 2,2 GW fell to new generators and 7 GW to refurbishing plants.
2,6
39,4
7
0,17 New generators (including CCGT) Existing generators Refurbishing plants Demand side response
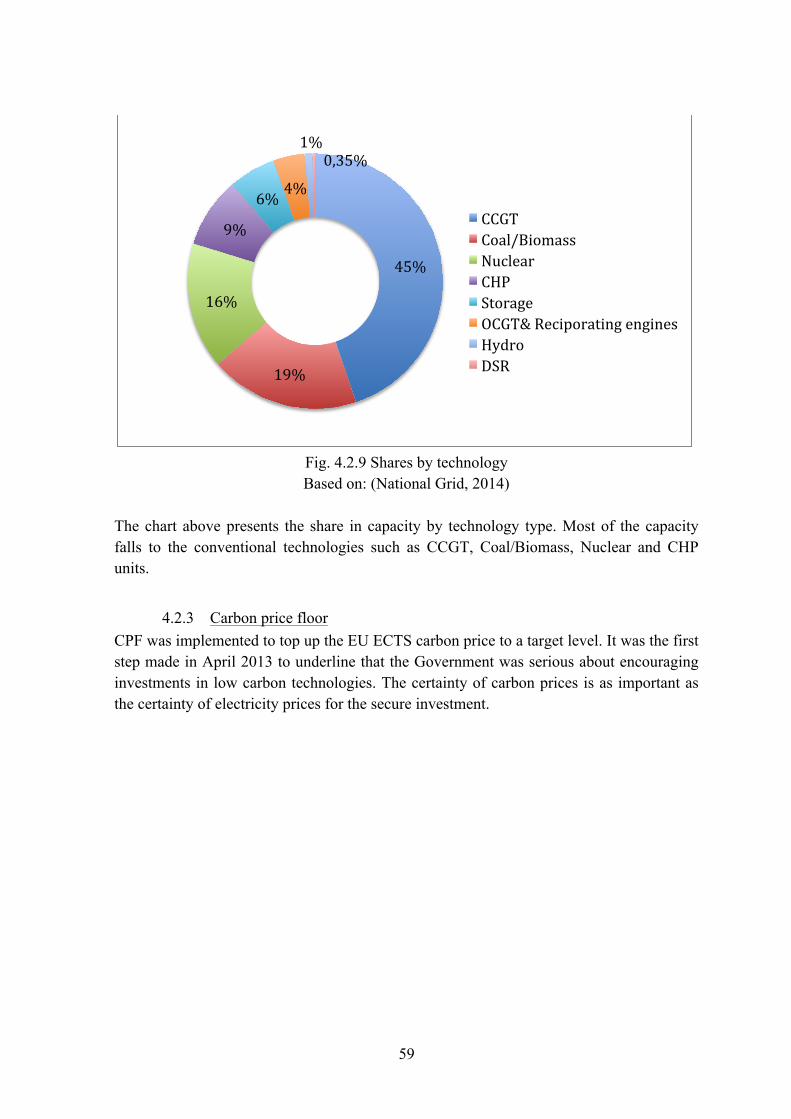
59
Fig. 4.2.9 Shares by technology Based on: (National Grid, 2014)
The chart above presents the share in capacity by technology type. Most of the capacity falls to the conventional technologies such as CCGT, Coal/Biomass, Nuclear and CHP units.
4.2.3 Carbon price floor CPF was implemented to top up the EU ECTS carbon price to a target level. It was the first step made in April 2013 to underline that the Government was serious about encouraging investments in low carbon technologies. The certainty of carbon prices is as important as the certainty of electricity prices for the secure investment.
45%
19%
16%
9%
6% 4%
1% 0,35%
CCGT Coal/Biomass Nuclear CHP Storage OCGT& Reciporating engines Hydro DSR
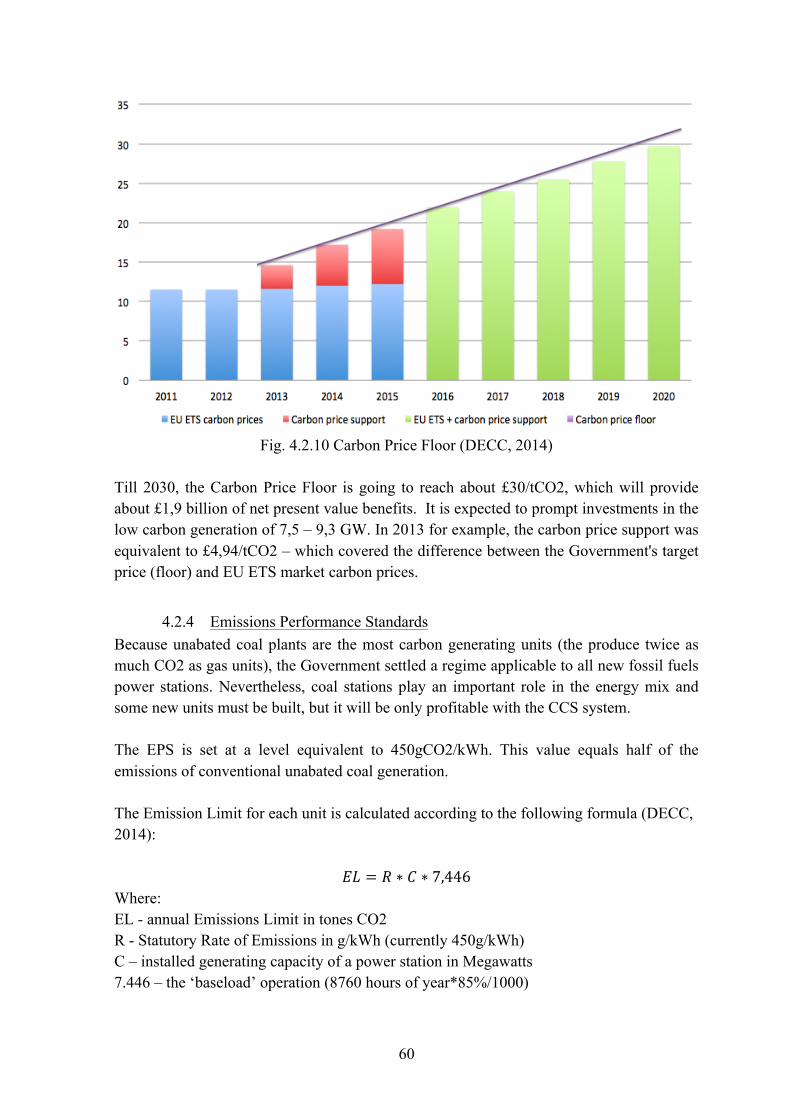
60
Fig. 4.2.10 Carbon Price Floor (DECC, 2014)
Till 2030, the Carbon Price Floor is going to reach about £30/tCO2, which will provide about £1,9 billion of net present value benefits. It is expected to prompt investments in the low carbon generation of 7,5 – 9,3 GW. In 2013 for example, the carbon price support was equivalent to £4,94/tCO2 – which covered the difference between the Government's target price (floor) and EU ETS market carbon prices.
4.2.4 Emissions Performance Standards Because unabated coal plants are the most carbon generating units (the produce twice as much CO2 as gas units), the Government settled a regime applicable to all new fossil fuels power stations. Nevertheless, coal stations play an important role in the energy mix and some new units must be built, but it will be only profitable with the CCS system. The EPS is set at a level equivalent to 450gCO2/kWh. This value equals half of the emissions of conventional unabated coal generation. The Emission Limit for each unit is calculated according to the following formula (DECC, 2014):
𝐸𝐿 = 𝑅 ∗ 𝐶 ∗ 7,446 Where: EL - annual Emissions Limit in tones CO2 R - Statutory Rate of Emissions in g/kWh (currently 450g/kWh) C – installed generating capacity of a power station in Megawatts 7.446 – the ‘baseload’ operation (8760 hours of year*85%/1000)
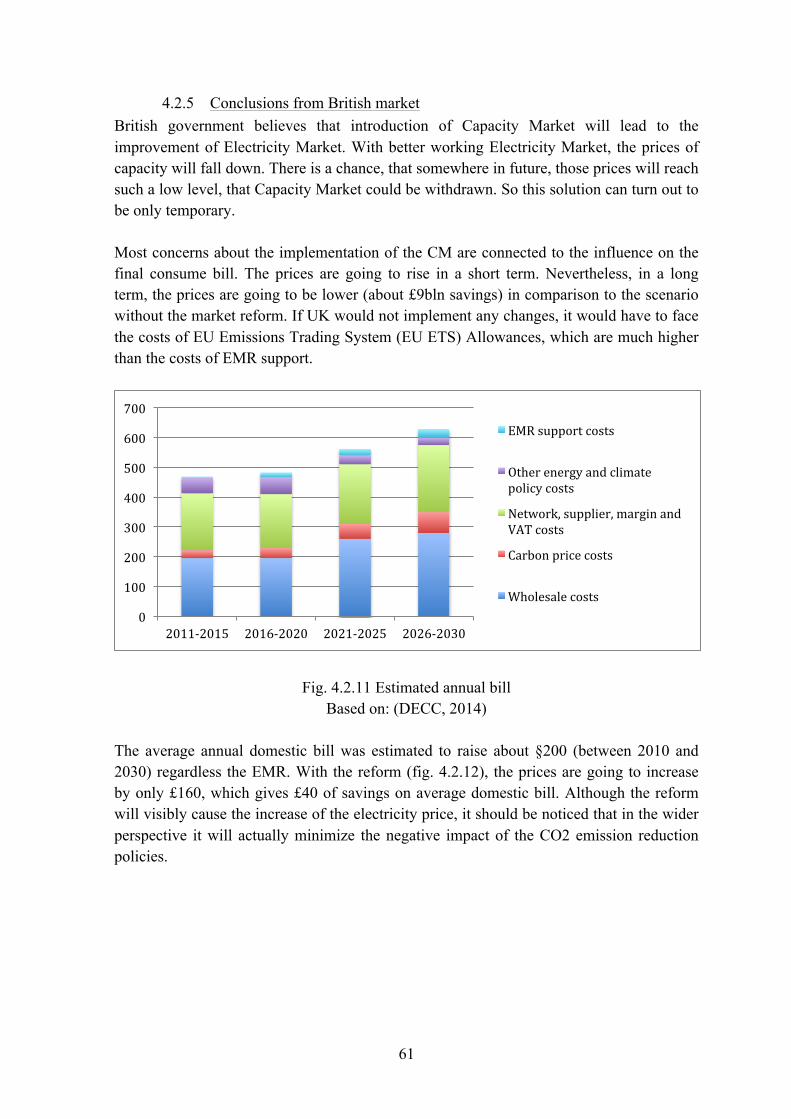
61
4.2.5 Conclusions from British market British government believes that introduction of Capacity Market will lead to the improvement of Electricity Market. With better working Electricity Market, the prices of capacity will fall down. There is a chance, that somewhere in future, those prices will reach such a low level, that Capacity Market could be withdrawn. So this solution can turn out to be only temporary. Most concerns about the implementation of the CM are connected to the influence on the final consume bill. The prices are going to rise in a short term. Nevertheless, in a long term, the prices are going to be lower (about £9bln savings) in comparison to the scenario without the market reform. If UK would not implement any changes, it would have to face the costs of EU Emissions Trading System (EU ETS) Allowances, which are much higher than the costs of EMR support.
Fig. 4.2.11 Estimated annual bill Based on: (DECC, 2014)
The average annual domestic bill was estimated to raise about §200 (between 2010 and 2030) regardless the EMR. With the reform (fig. 4.2.12), the prices are going to increase by only £160, which gives £40 of savings on average domestic bill. Although the reform will visibly cause the increase of the electricity price, it should be noticed that in the wider perspective it will actually minimize the negative impact of the CO2 emission reduction policies.
0
100
200
300
400
500
600
700
2011-‐2015 2016-‐2020 2021-‐2025 2026-‐2030
EMR support costs
Other energy and climate policy costs
Network, supplier, margin and VAT costs
Carbon price costs
Wholesale costs
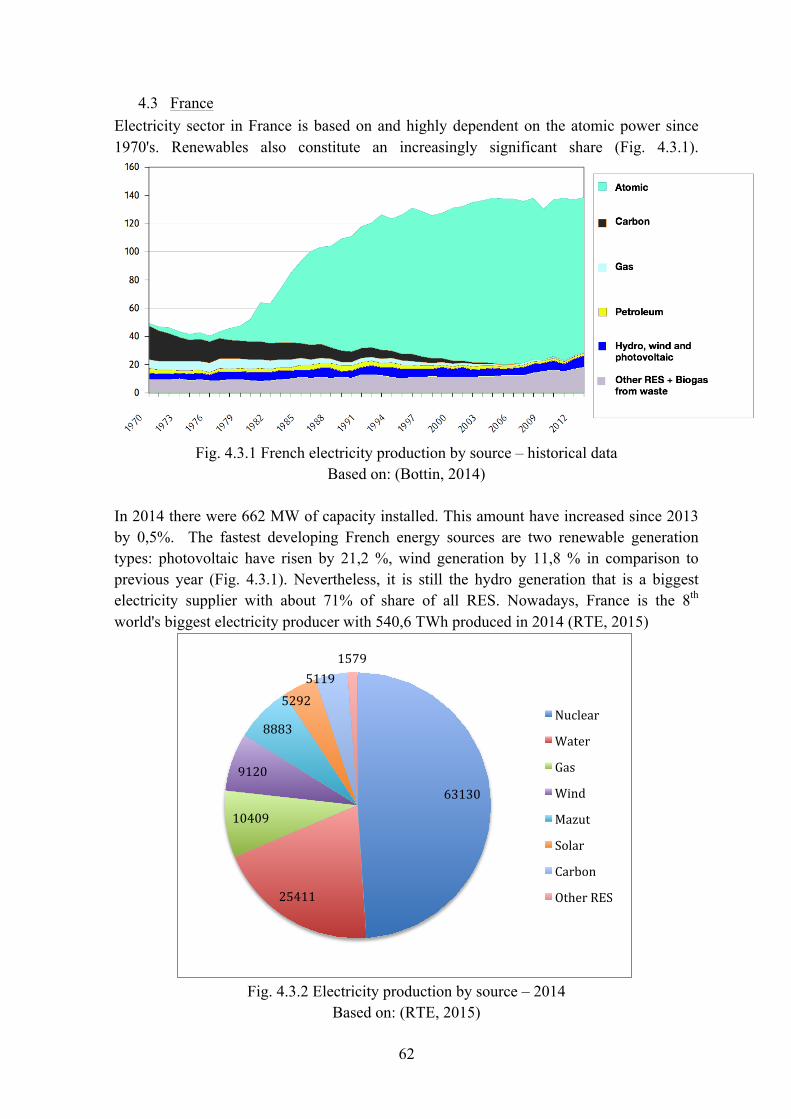
62
4.3 France Electricity sector in France is based on and highly dependent on the atomic power since 1970's. Renewables also constitute an increasingly significant share (Fig. 4.3.1).
Fig. 4.3.1 French electricity production by source – historical data
Based on: (Bottin, 2014) In 2014 there were 662 MW of capacity installed. This amount have increased since 2013 by 0,5%. The fastest developing French energy sources are two renewable generation types: photovoltaic have risen by 21,2 %, wind generation by 11,8 % in comparison to previous year (Fig. 4.3.1). Nevertheless, it is still the hydro generation that is a biggest electricity supplier with about 71% of share of all RES. Nowadays, France is the 8th world's biggest electricity producer with 540,6 TWh produced in 2014 (RTE, 2015)
Fig. 4.3.2 Electricity production by source – 2014
Based on: (RTE, 2015)
63130
25411
10409
9120
8883
5292 5119
1579
Nuclear
Water
Gas
Wind
Mazut
Solar
Carbon
Other RES
63
The electricity production from hydro power stations is more less constant since 1970s but other renewable sources are developing strongly for the last decade. Wind generation capacity installed is increasing strongly each year since 2004. Most of the wind parks are placed in Picardy and Champagne-Ardenne, yet most of the generation is installed in the northwest of France. Photovoltaic production augmented sharply since 2009. In 2014 it reached 5,9 TWh. Most of the photovoltaic is installed on the south of France. 1579 MW of total capacity fall into bio thermal power plants. 54,8% is obtained as a result of food waste combustion and additional 5,7% as a result of paper waste combustion. Biogas is a source of 20,7% and the last 18,8% fall into other solid biofuels. (RTE, 2015) After World War II French energy market was completely controlled by the state industry Electricite de France (EDF) in order to accelerate the reconstruction of destructed network and overall development of the electrical system. Along with the EDF another monopoly industry Gaz de France was created to manage the gas market. After the implementation of the UE's directives that were executing market liberalization in the European Union's countries, the market was undergoing a series of changes that resulted in the final opening of the market. The last directive called Law NOME (Nouvelle Organistation du Marché de l’Electricité) was implemented to prompt more competition to the French energy market and lead to the more efficient price liberalization. As a result of the Law NOME part of the EdF's existing nuclear capacity was sold at regulated prices to the new suppliers. Nevertheless the EDF is the biggest electric entity in the world that controls the majority of the French electricity production, transmission, distribution and supply. The French Energy Code states that at least 70% of EdF's shares must be hold by the state. (EDF, 2015) In 2000 the Regulatory Commission of Energy CRE was created as an independent administrative authority to regulate the energy sector in France and control the liberalization of the market. Transmission and distribution that are still managed by public service entities are coming under the supervisory of CRE. Additionally, the energy sector is under constant control of Competition Authority that is obliged to inform the CRE when any kind of unfair competition practices was noticed. The body that is responsible for the operation and maintenance of the high voltage transmission lines (over 100000 km across France) is called Electricity Transmission Network 'RTE' (Réseau Transport Electricité). Distribution network is managed in 95% by the Electricity Distribution Network in France "ERDF" (Electricité Réseau Distribution France). The most influential decisions however, are always taken by the Minister of Energy. (RTE, 2015) In 2004 the French energy sector underwent a change called unbundling, which is the separation of the distribution and transmission (which are regulated areas) from the unregulated production and supply. Thus, in France as in the majority of European countries each consumer can choose its electricity supplier. (EPEX SPOT, 2015)
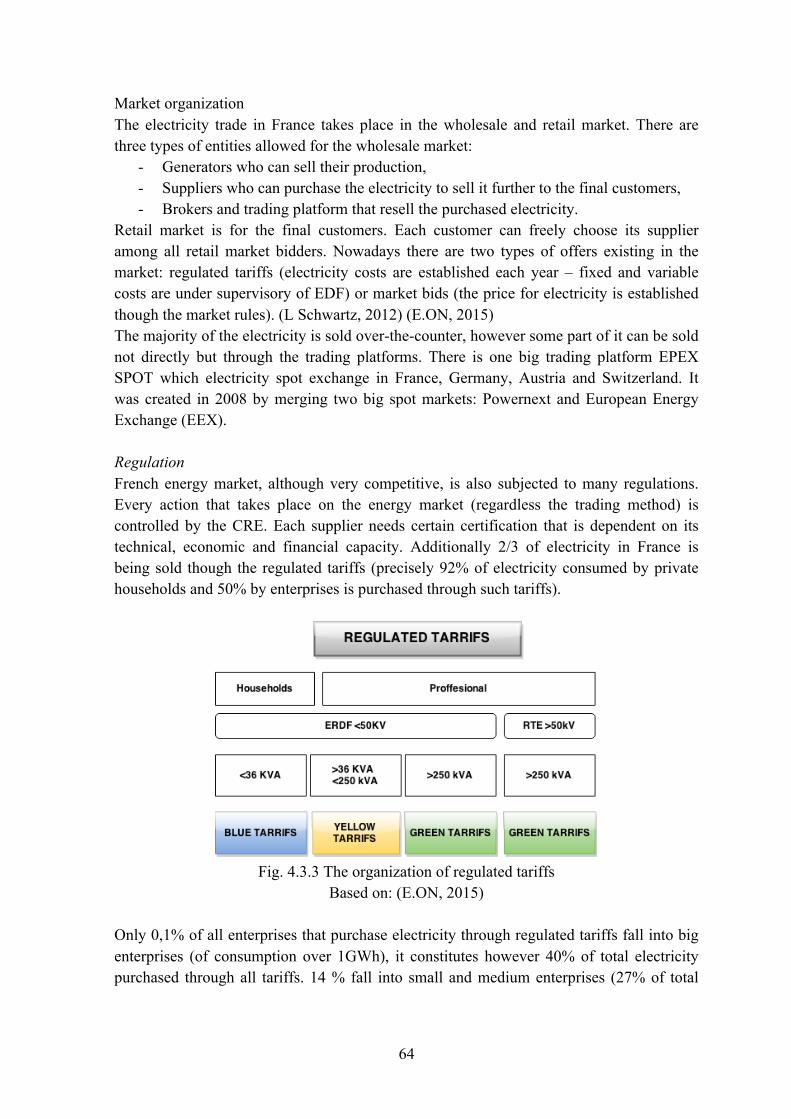
64
Market organization The electricity trade in France takes place in the wholesale and retail market. There are three types of entities allowed for the wholesale market:
- Generators who can sell their production, - Suppliers who can purchase the electricity to sell it further to the final customers, - Brokers and trading platform that resell the purchased electricity.
Retail market is for the final customers. Each customer can freely choose its supplier among all retail market bidders. Nowadays there are two types of offers existing in the market: regulated tariffs (electricity costs are established each year – fixed and variable costs are under supervisory of EDF) or market bids (the price for electricity is established though the market rules). (L Schwartz, 2012) (E.ON, 2015) The majority of the electricity is sold over-the-counter, however some part of it can be sold not directly but through the trading platforms. There is one big trading platform EPEX SPOT which electricity spot exchange in France, Germany, Austria and Switzerland. It was created in 2008 by merging two big spot markets: Powernext and European Energy Exchange (EEX). Regulation French energy market, although very competitive, is also subjected to many regulations. Every action that takes place on the energy market (regardless the trading method) is controlled by the CRE. Each supplier needs certain certification that is dependent on its technical, economic and financial capacity. Additionally 2/3 of electricity in France is being sold though the regulated tariffs (precisely 92% of electricity consumed by private households and 50% by enterprises is purchased through such tariffs).
Fig. 4.3.3 The organization of regulated tariffs
Based on: (E.ON, 2015)
Only 0,1% of all enterprises that purchase electricity through regulated tariffs fall into big enterprises (of consumption over 1GWh), it constitutes however 40% of total electricity purchased through all tariffs. 14 % fall into small and medium enterprises (27% of total
65
electricity) and the majority – 86% goes to the private households who purchase only 33% of total electricity sold through regulated tariffs. Green and yellow tariffs will be withdrawn 31 December 2015. As a result 25% of total French electricity consumption will have to by met through market bids. Such decision was taken in response to European Commission's concerns about unfair competition in the French market and the too much dominant position of the Electricité de France. Unbundling In order to prevent the confusion connected to the appearance of too many enterprises, which has to manage electricity generation, transmission, distribution and supply, the French Government introduced the Law dated December 2006 (complemented by the Law NOME) according to which each small customer must be able to purchase electricity by signing only one contract. This applies to customers and professionals that buy less than 36kVA. In the one, single contract the energy supplier merges two contracts: for the supply and the distribution of electricity without bothering the client with signing separate contract with distributor. (E.ON, 2015) Capacity Mechanisms Since the energy sector is based on very inflexible, often old nuclear power plants, France suffers from both missing money and missing capacity problem. Additionally, French heating relies heavily on the electricity production (many households have electric heaters instead of gas or district heating). Consequently, the drop of temperature of 1° results in the augmentation of total electricity consumption of 2400 MW. Thus, in cold winters, France needs to import electricity although through the rest of the year it is an exporter. The first problems with meeting the demand aroused in 2005 in winter. In response to this situation the Government introduced the Law NOME. (Motowidlak, 2015) The French 2012 Act defined that capacity mechanisms must be market-based, based on volumes, applied to all capacity possible (market-wide) and must consists of individual capacity obligations.
4.3.1 Capacity obligations All the existing generators, refurbishing generators and planned generators must apply for the capacity certificates. The demand-side capacity can be valued in two ways: implicitly (through the reduction of the obligation) of explicitly (through the certificates). The certificates are provided by the RTE to only those parties that are willing to provide electricity in the peak periods. Such obligation prevent from the situation in which some generators withdraw their units on the peak periods. Each electricity supplier is obliged to purchase certificates that prove its capacity to provide enough electricity to satisfy the needs of its clients plus security margin. The amount of capacity that needs to be held is defined on the basis of the peak consumption of the clients. Each generator that do not provide certificated capacity and each supplier who did not meet the obligation is subjected to penalties that can reach even the price of creating new generation unit that could provide such capacity. The capacity trading (over-the-counter type) takes place continuously
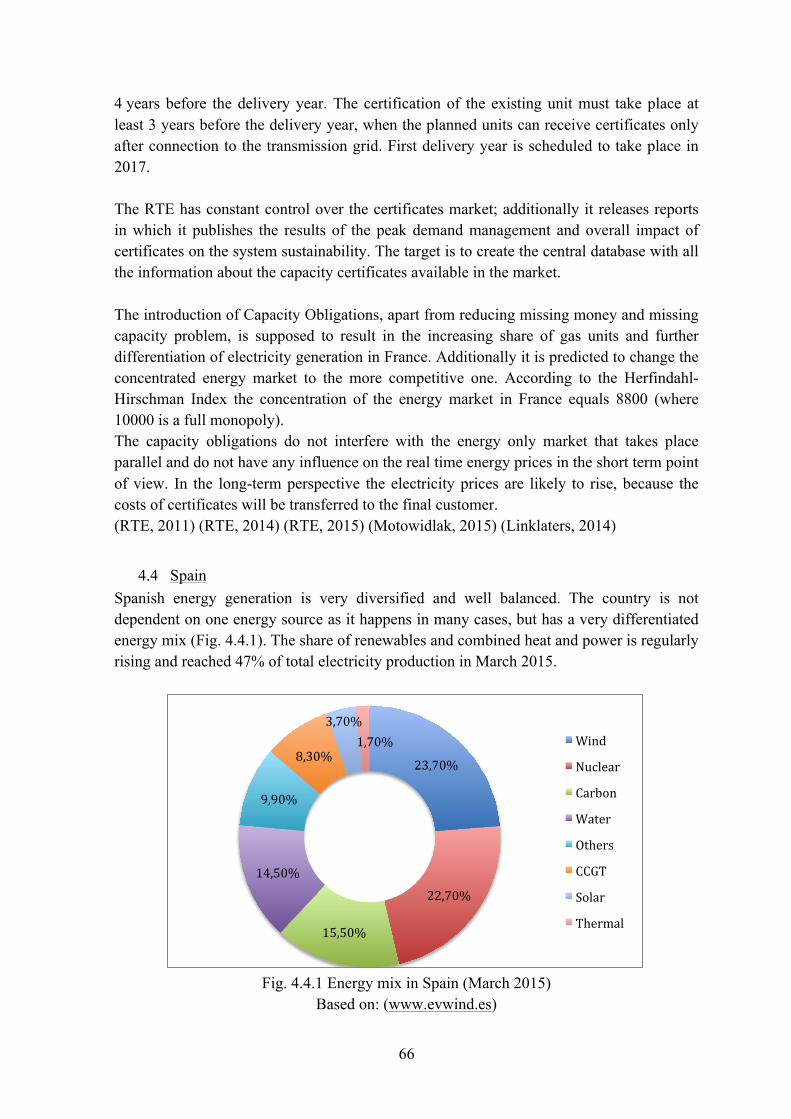
66
4 years before the delivery year. The certification of the existing unit must take place at least 3 years before the delivery year, when the planned units can receive certificates only after connection to the transmission grid. First delivery year is scheduled to take place in 2017. The RTE has constant control over the certificates market; additionally it releases reports in which it publishes the results of the peak demand management and overall impact of certificates on the system sustainability. The target is to create the central database with all the information about the capacity certificates available in the market. The introduction of Capacity Obligations, apart from reducing missing money and missing capacity problem, is supposed to result in the increasing share of gas units and further differentiation of electricity generation in France. Additionally it is predicted to change the concentrated energy market to the more competitive one. According to the Herfindahl-Hirschman Index the concentration of the energy market in France equals 8800 (where 10000 is a full monopoly). The capacity obligations do not interfere with the energy only market that takes place parallel and do not have any influence on the real time energy prices in the short term point of view. In the long-term perspective the electricity prices are likely to rise, because the costs of certificates will be transferred to the final customer. (RTE, 2011) (RTE, 2014) (RTE, 2015) (Motowidlak, 2015) (Linklaters, 2014)
4.4 Spain Spanish energy generation is very diversified and well balanced. The country is not dependent on one energy source as it happens in many cases, but has a very differentiated energy mix (Fig. 4.4.1). The share of renewables and combined heat and power is regularly rising and reached 47% of total electricity production in March 2015.
Fig. 4.4.1 Energy mix in Spain (March 2015)
Based on: (www.evwind.es)
23,70%
22,70%
15,50%
14,50%
9,90%
8,30%
3,70% 1,70% Wind
Nuclear
Carbon
Water
Others
CCGT
Solar
Thermal
67
As in the majority of EU's countries, energy transmission and distribution in Spain is separate from the generation and supply. The regulated industries must have additionally separate legal and accounting matters to avoid embezzlement. Generators in Spain can be divided into two groups according to the technology used for electricity generation. All conventional technologies such as gas, coal, oil, nuclear are called ordinary producers. Renewable generation is under a special regime that is supposed to bring new investment in this ecological sector. Before 2009 the distribution companies could offer regulated tariffs. Since then the system has changed and instead of regulated tariffs there are 'tariffs of last resort' which can be only managed by sellers appointed by the regulator. Such tariffs guarantee the fixed price of electricity established by the government, but can be purchased only by those customers whose demand does not exceed 10 kW. Each distribution entity is obliged to expand distribution or renovate its lines when the excessive demand appears regardless the profitability of such operation. Additionally each distributor must keep a confidential database of points of supply. All the gathered information are used to create reports that depicts the actual state of the grid management, congestion and provides with the possible investment plan. The electricity transportation costs are set centrally according to the calculation model provided every year by the regulator (the price depends on the investment, operation and conservation cost). Customers usually purchase electricity from the suppliers, but some big ones can be allowed to the market and purchase electricity directly in the auctions. Such customers are called 'direct customers to market'. The energy system in Spain is operated by the Red Electrica of Spain, which manages all the technical aspects of system operation such as providing continuity and security of supply, controlling production, transmission and distribution (entire transportation network is owned by Red Electrica of Spain). Energy market organization Energy market in Spain is a competitive market that consists of:
- Financial forward market - Day-ahead market - Intraday market - Ancillary Services market - Bilateral market
The day-ahead market auction takes place one day before the delivery time at 12 noon and creates the dispatch for the 24 hours of the following day. The prices of electricity for each hour traded in the daily market are set in the competitive auction by the crossing of supply and demand lines. The point of crossing determines the amount of classified capacity and the price of electricity (the marginal price method is used) for this period. The generators and purchasers can freely submit their bids, even though they are in Spain or Portugal, if only the interconnections can manage such flows of electricity. If the interconnection can transfer scheduled electricity, the price is equal in Spain and Portugal. If not, some
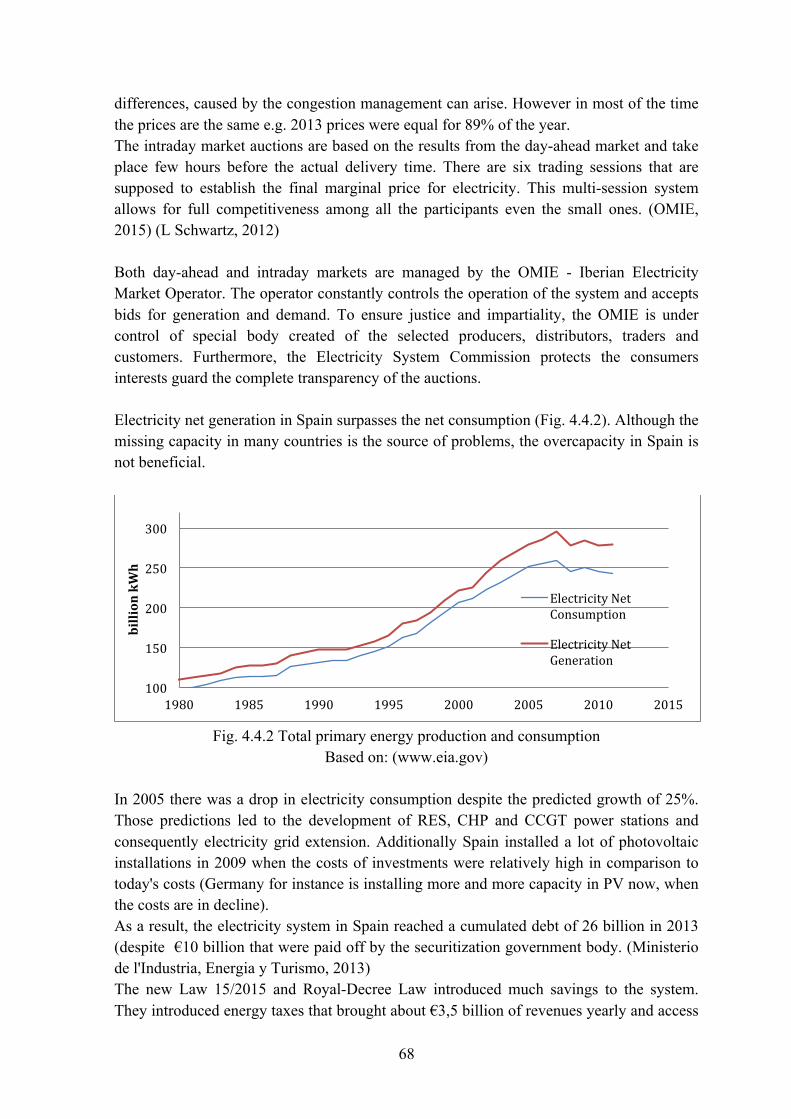
68
differences, caused by the congestion management can arise. However in most of the time the prices are the same e.g. 2013 prices were equal for 89% of the year. The intraday market auctions are based on the results from the day-ahead market and take place few hours before the actual delivery time. There are six trading sessions that are supposed to establish the final marginal price for electricity. This multi-session system allows for full competitiveness among all the participants even the small ones. (OMIE, 2015) (L Schwartz, 2012) Both day-ahead and intraday markets are managed by the OMIE - Iberian Electricity Market Operator. The operator constantly controls the operation of the system and accepts bids for generation and demand. To ensure justice and impartiality, the OMIE is under control of special body created of the selected producers, distributors, traders and customers. Furthermore, the Electricity System Commission protects the consumers interests guard the complete transparency of the auctions. Electricity net generation in Spain surpasses the net consumption (Fig. 4.4.2). Although the missing capacity in many countries is the source of problems, the overcapacity in Spain is not beneficial.
Fig. 4.4.2 Total primary energy production and consumption
Based on: (www.eia.gov) In 2005 there was a drop in electricity consumption despite the predicted growth of 25%. Those predictions led to the development of RES, CHP and CCGT power stations and consequently electricity grid extension. Additionally Spain installed a lot of photovoltaic installations in 2009 when the costs of investments were relatively high in comparison to today's costs (Germany for instance is installing more and more capacity in PV now, when the costs are in decline). As a result, the electricity system in Spain reached a cumulated debt of 26 billion in 2013 (despite €10 billion that were paid off by the securitization government body. (Ministerio de l'Industria, Energia y Turismo, 2013) The new Law 15/2015 and Royal-Decree Law introduced much savings to the system. They introduced energy taxes that brought about €3,5 billion of revenues yearly and access
100
150
200
250
300
1980 1985 1990 1995 2000 2005 2010 2015
billion kWh
Electricity Net Consumption
Electricity Net Generation
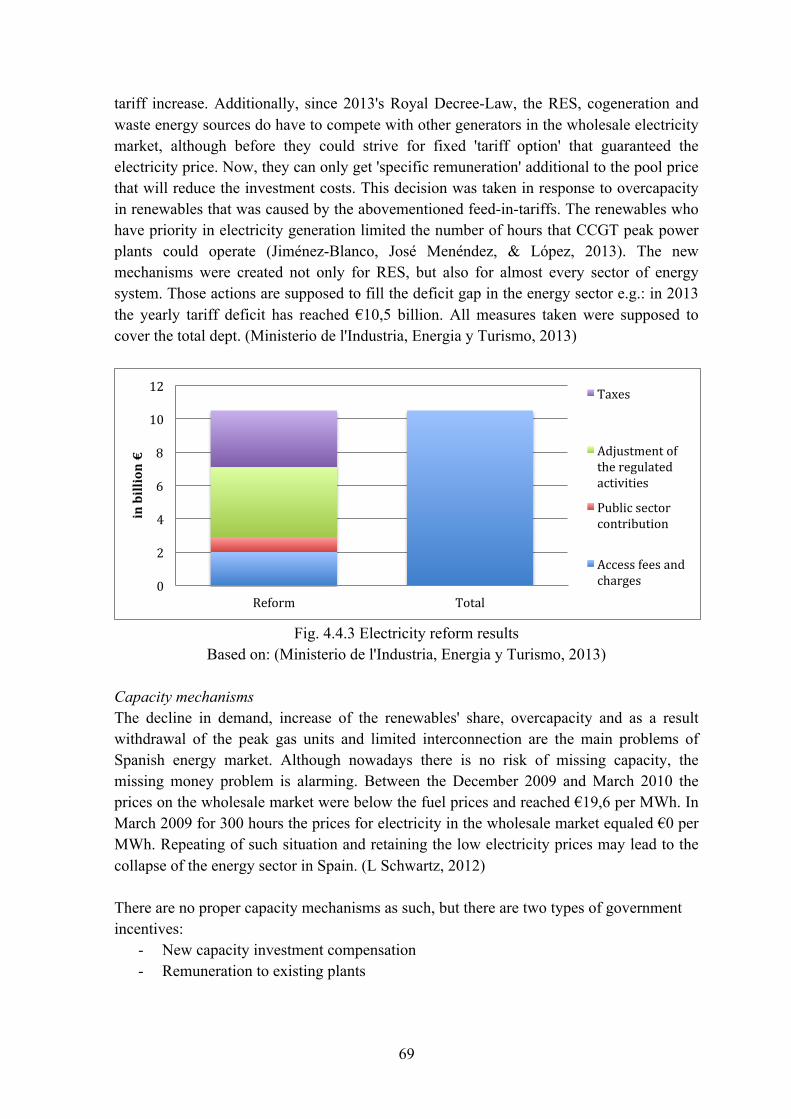
69
tariff increase. Additionally, since 2013's Royal Decree-Law, the RES, cogeneration and waste energy sources do have to compete with other generators in the wholesale electricity market, although before they could strive for fixed 'tariff option' that guaranteed the electricity price. Now, they can only get 'specific remuneration' additional to the pool price that will reduce the investment costs. This decision was taken in response to overcapacity in renewables that was caused by the abovementioned feed-in-tariffs. The renewables who have priority in electricity generation limited the number of hours that CCGT peak power plants could operate (Jiménez-Blanco, José Menéndez, & López, 2013). The new mechanisms were created not only for RES, but also for almost every sector of energy system. Those actions are supposed to fill the deficit gap in the energy sector e.g.: in 2013 the yearly tariff deficit has reached €10,5 billion. All measures taken were supposed to cover the total dept. (Ministerio de l'Industria, Energia y Turismo, 2013)
Fig. 4.4.3 Electricity reform results
Based on: (Ministerio de l'Industria, Energia y Turismo, 2013) Capacity mechanisms The decline in demand, increase of the renewables' share, overcapacity and as a result withdrawal of the peak gas units and limited interconnection are the main problems of Spanish energy market. Although nowadays there is no risk of missing capacity, the missing money problem is alarming. Between the December 2009 and March 2010 the prices on the wholesale market were below the fuel prices and reached €19,6 per MWh. In March 2009 for 300 hours the prices for electricity in the wholesale market equaled €0 per MWh. Repeating of such situation and retaining the low electricity prices may lead to the collapse of the energy sector in Spain. (L Schwartz, 2012) There are no proper capacity mechanisms as such, but there are two types of government incentives:
- New capacity investment compensation - Remuneration to existing plants
0
2
4
6
8
10
12
Reform Total
in billion €
Taxes
Adjustment of the regulated activities
Public sector contribution
Access fees and charges
70
4.4.1 New capacity investment compensation New conventional generators of capacity over 50 MW can apply for special remuneration that can reduce the investment costs for the first 10 years of operation. The only condition that has to be met is the availability of those units with at least 90% of installed net power in the peak periods. The amount of remuneration is calculated each quarter by the Transmission System Operator that takes into account 'coverage ratio' which is the ratio between total capacity available and peak consumption. If there is less than 10% (the ratio is lower than 1,1) of reserve in the peak hours, the investment compensation equals e.g. €23400 (in 2012). When the reserve is higher than 10% (the ratio is higher than 1,1), the remuneration is calculated according to the formula:
𝑟𝑒𝑚𝑢𝑛𝑒𝑟𝑎𝑡𝑖𝑜𝑛 = 193000− 15000 ∗ 𝑐𝑜𝑣𝑒𝑟𝑎𝑔𝑒 𝑟𝑎𝑡𝑖𝑜 [€
𝑀𝑊 ∗ 𝑦𝑒𝑎𝑟] 4.4.1
E.g. if the coverage ratio equals 1,29:
𝑟𝑒𝑚𝑢𝑛𝑒𝑟𝑎𝑡𝑖𝑜𝑛 = 193000− 15000 ∗ 1,29 = 0 [€
𝑀𝑊 ∗ 𝑦𝑒𝑎𝑟] 4.4.2
4.4.2 Remuneration to the existing plants All the existing coal, gas, fuel-oil and hydro power stations can apply for the remuneration for the capacity available to reduce the missing money problem. The only condition that has to be met is the availability of those units in the peak periods. Otherwise they are financially penalized. The remuneration is calculated according to the formula:
𝑟𝑒𝑚𝑢𝑛𝑒𝑟𝑎𝑡𝑖𝑜𝑛 = 𝑎𝑛𝑛𝑢𝑎𝑙 𝑝𝑎𝑦𝑚𝑒𝑛𝑡 ∗ 𝑖𝑛𝑑𝑒𝑥 ∗ 𝑛𝑒𝑡 𝑝𝑜𝑤𝑒𝑟 [€
𝑀𝑊 ∗ 𝑦𝑒𝑎𝑟] 4.4.3
Where: Annual payment – the annually relieved price for electricity e.g. €5150 per MW in 2012 Index – multiplying index depending on the technology type coal=0,912 combined cycle=0,913 fuel-oil=0,877 hydro=0,237 Net power – the net power of the available unit The maximum remuneration for the investment costs e.g. in 2012 equals €4640. This payment is supposed to cover costs of the peak unit's standby periods, when it has no income from the energy only market. (Regulatory Commission for Electricity and Gas , 2012)
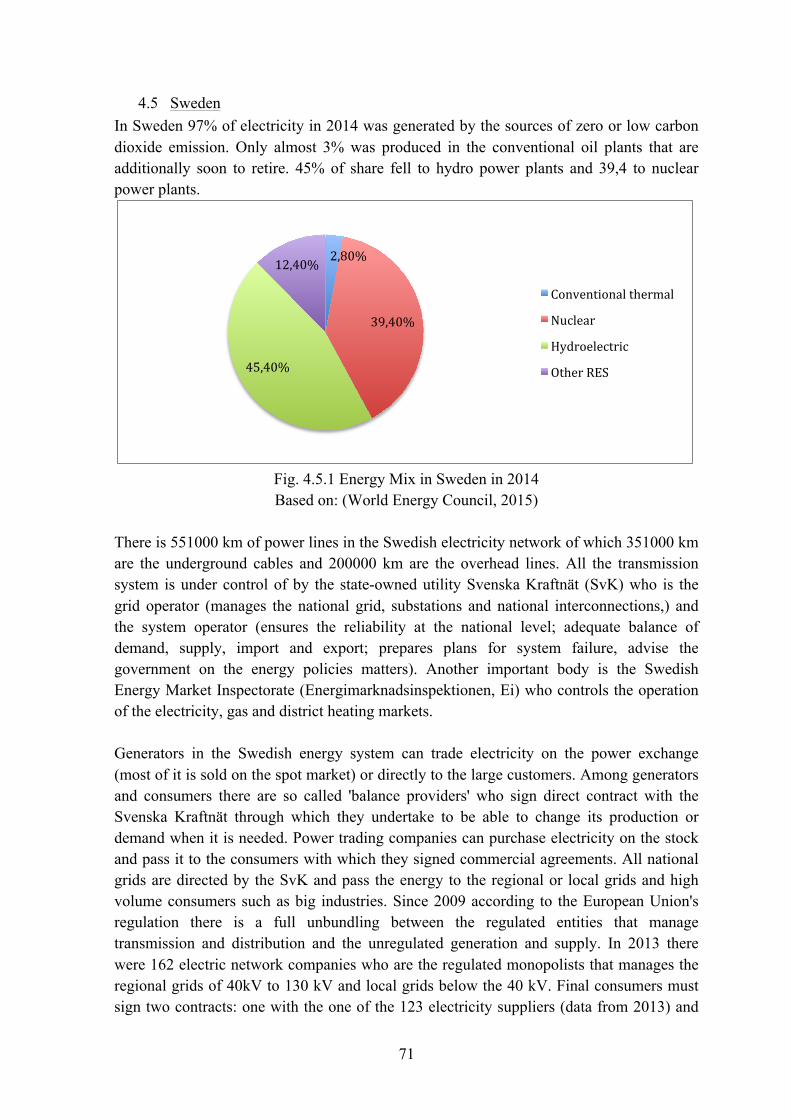
71
4.5 Sweden In Sweden 97% of electricity in 2014 was generated by the sources of zero or low carbon dioxide emission. Only almost 3% was produced in the conventional oil plants that are additionally soon to retire. 45% of share fell to hydro power plants and 39,4 to nuclear power plants.
Fig. 4.5.1 Energy Mix in Sweden in 2014 Based on: (World Energy Council, 2015)
There is 551000 km of power lines in the Swedish electricity network of which 351000 km are the underground cables and 200000 km are the overhead lines. All the transmission system is under control of by the state-owned utility Svenska Kraftnät (SvK) who is the grid operator (manages the national grid, substations and national interconnections,) and the system operator (ensures the reliability at the national level; adequate balance of demand, supply, import and export; prepares plans for system failure, advise the government on the energy policies matters). Another important body is the Swedish Energy Market Inspectorate (Energimarknadsinspektionen, Ei) who controls the operation of the electricity, gas and district heating markets. Generators in the Swedish energy system can trade electricity on the power exchange (most of it is sold on the spot market) or directly to the large customers. Among generators and consumers there are so called 'balance providers' who sign direct contract with the Svenska Kraftnät through which they undertake to be able to change its production or demand when it is needed. Power trading companies can purchase electricity on the stock and pass it to the consumers with which they signed commercial agreements. All national grids are directed by the SvK and pass the energy to the regional or local grids and high volume consumers such as big industries. Since 2009 according to the European Union's regulation there is a full unbundling between the regulated entities that manage transmission and distribution and the unregulated generation and supply. In 2013 there were 162 electric network companies who are the regulated monopolists that manages the regional grids of 40kV to 130 kV and local grids below the 40 kV. Final consumers must sign two contracts: one with the one of the 123 electricity suppliers (data from 2013) and
2,80%
39,40%
45,40%
12,40%
Conventional thermal
Nuclear
Hydroelectric
Other RES
72
one with the grid operator who issues the permission for the connection to the grid. The Ei runs a web page www.elpriskollen.se with the comparison of the all electricity suppliers' offers to make it easier to compare. (Svenska kraftnät, 2011) (Energimarknadsinspektionen, 2013)
4.5.1 Energy market The day-ahead spot market ELSPOT is organized by the Nordic Electricity Exchange Nord Pool Spot that unites the Nordic countries such as: Sweden, Norway, Finland, Denmark, Estonia, Lithuania and Latvia (in the order of shares held by the owner countries). The prices on this market are set day ahead the delivery time in the one hour periods but the offers can be submitted up to 12 days in advance. The bidders are rewarded according to the marginal price. The ELSPOT may be divided into different bidding areas if there is a need in managing congestion between those areas. The intra-day physical adjustment market is called ELBAS. It is also managed by the Nord Pool Spot and takes place an hour before the delivery time. The prices of generation offer are set in the merit order, bids of purchase are set in the descending order and first offers comes first until the balance is established. Aside to the day-ahead and balancing market there is also a future market of electricity run by the Nasdaq OMX Group. It is a financial trading instrument for all the market players who want to hedge the electricity price fluctuations. On this market, the entities can sign long-term contracts for electricity and carbon emission permits. The market participants can also sign bilateral short term and long term contracts between each other. (Energimarknadsinspektionen, 2013) Reliability In order to achieve high reliability of the system there is an obligation for each electricity network company to submit reports to the Ei in which they highlight their condition and cuts that happened in the previous year. Additionally, they need to prepare analysis of their vulnerability and create action plans that can are implemented to prove the improvement of their operation. One of the main problems in the Swedish energy system is the congestion management. It is mainly caused by the high production of hydro power plants in the north that cause congestion in the south direction and transmission from the Denmark and the rest of the European continent to the south Sweden, which cause the congestion in the north direction. There are two methods of dealing with this problem:
- Market splitting: creating submarkets in the energy market with different electricity prices in different zones. The prices are determined by the balance between the demand and supply and the congestion management costs
73
- Counter-trading: Extra payment (provided by the SvK) to the generators that generate additional electricity in the zones with the electricity deficit and electricity price reduction in the zones with excessive production
However, most of the time the price of electricity is equal in all the Nord Pool Spot. In 2013 92,5% of time there was no market splitting, 7,1% of time there were 2 different prices, and only 0,4% there were 3 different prices. (Energimarknadsinspektionen, 2013) Although the hydro energy seems to be a reliable one, the electricity production from this kind of source is highly dependent on the weather conditions. The level of water in reservoirs is changing dependent on the rainfalls. Additionally, many oil power plants in Sweden are retiring and the share of RES makes it uneconomical to build new units.
4.5.2 Capacity Mechanisms In order to avoid blackouts in winters when the demand increases drastically, the government introduced a peak demand strategic reserve in 2003. This system is going to last until 2020. According to this system the TSO is obliged to define the strategic reserve that needs to be maintained between 16 November and 15 March. In 2012 the required reserve capacity constituted 4,8% of net generated capacity, which equaled 1726 GW of which 362 fell to demand side response. Each generator that can launch its unit in less than 12 hours and all demand side response provider can submit its bid to the tender organized by the TSO. Since 2009 the capacity is sold on the day ahead market. To not influence the energy-only offers, the capacity offers are accepted only if the supply is not covered by the energy-only bids. In addition, the capacity providers are only the price takers and do not affect the price of electricity in the spot market. The capacity provider receives a fixed fee for maintaining the reserve and the variable fee for provided electricity. To summarize, the price of electricity provided through capacity bid is based on the marginal price (of the last accepted offer) plus €0,1/MWh. This capacity system is sufficient to provide additional income to prevent from closing existing peak units but does not provide adequate incentives to attract new investments. In future, when the nuclear power plants will retire, Sweden will have to implement other mechanism to avoid missing capacity problem. (Linklaters, 2014) (Regulatory Commission for Electricity and Gas , 2012)
4.6 Summary As a result of the increasing share of RES, and flat demand there is an overcapacity in a lot of countries that led to the decline of the wholesale electricity price. This phenomenon coincides with the retirement of old conventional gas, coal or nuclear power plants across the world. Such situation can lead to the missing capacity problem. The capacity mechanisms that introduce special subsidies to the existing, refurbishing and new generators are a way to sustain system reliability, resource adequacy and to avoid blackouts.
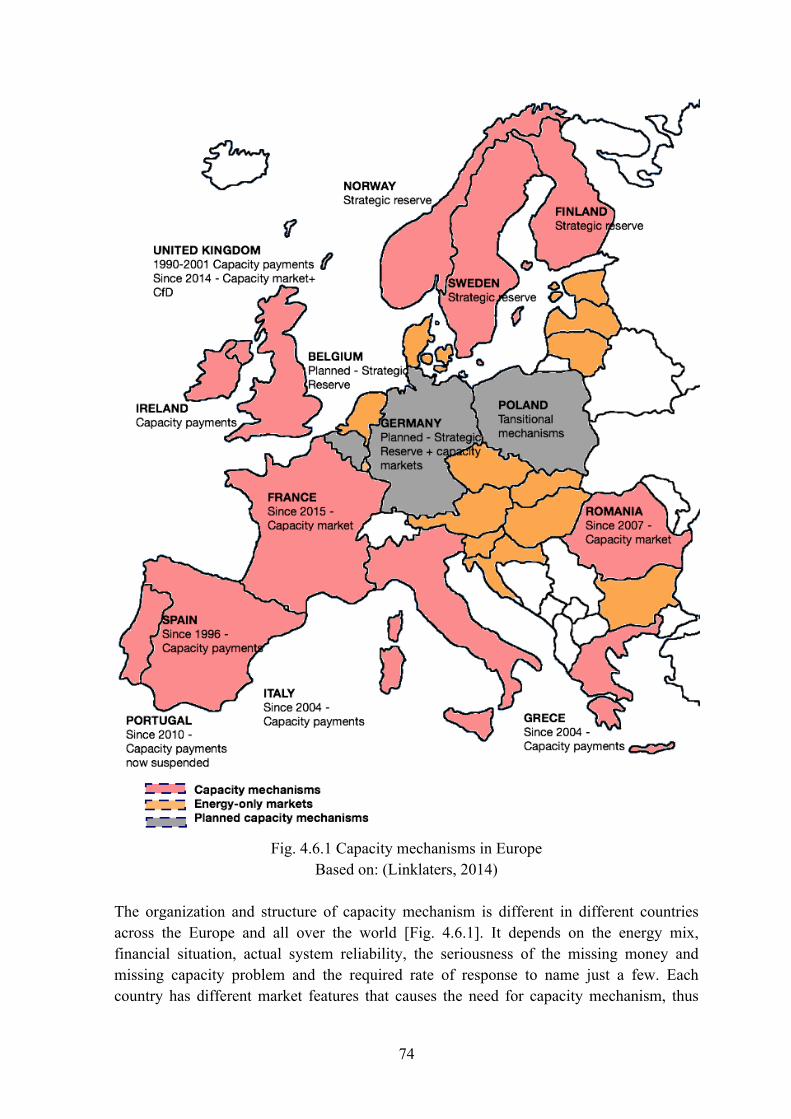
74
Fig. 4.6.1 Capacity mechanisms in Europe
Based on: (Linklaters, 2014) The organization and structure of capacity mechanism is different in different countries across the Europe and all over the world [Fig. 4.6.1]. It depends on the energy mix, financial situation, actual system reliability, the seriousness of the missing money and missing capacity problem and the required rate of response to name just a few. Each country has different market features that causes the need for capacity mechanism, thus
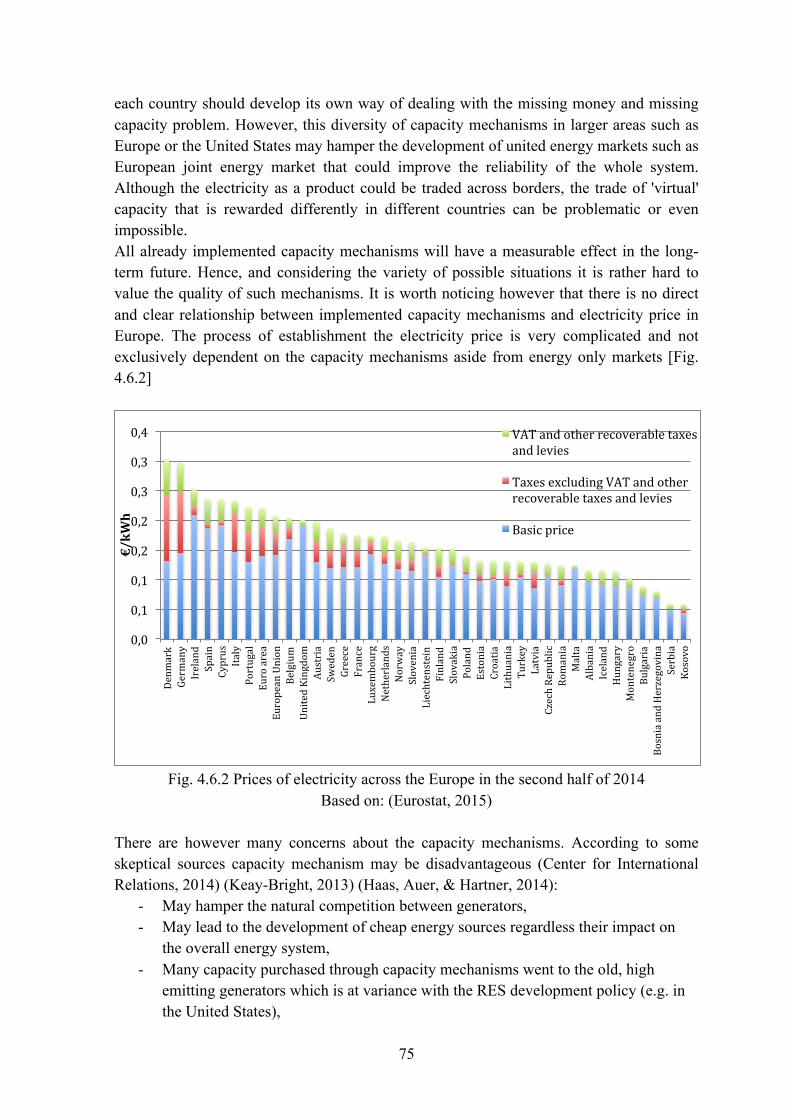
75
each country should develop its own way of dealing with the missing money and missing capacity problem. However, this diversity of capacity mechanisms in larger areas such as Europe or the United States may hamper the development of united energy markets such as European joint energy market that could improve the reliability of the whole system. Although the electricity as a product could be traded across borders, the trade of 'virtual' capacity that is rewarded differently in different countries can be problematic or even impossible. All already implemented capacity mechanisms will have a measurable effect in the long-term future. Hence, and considering the variety of possible situations it is rather hard to value the quality of such mechanisms. It is worth noticing however that there is no direct and clear relationship between implemented capacity mechanisms and electricity price in Europe. The process of establishment the electricity price is very complicated and not exclusively dependent on the capacity mechanisms aside from energy only markets [Fig. 4.6.2]
Fig. 4.6.2 Prices of electricity across the Europe in the second half of 2014
Based on: (Eurostat, 2015)
There are however many concerns about the capacity mechanisms. According to some skeptical sources capacity mechanism may be disadvantageous (Center for International Relations, 2014) (Keay-Bright, 2013) (Haas, Auer, & Hartner, 2014):
- May hamper the natural competition between generators, - May lead to the development of cheap energy sources regardless their impact on
the overall energy system, - Many capacity purchased through capacity mechanisms went to the old, high
emitting generators which is at variance with the RES development policy (e.g. in the United States),
0,0
0,1
0,1
0,2
0,2
0,3
0,3
0,4
Denm
ark
Germany
Ireland
Spain
Cyprus
Italy
Portugal
Euro area
European Union
Belgium
United Kingdom
Austria
Sweden
Greece
France
Luxembourg
Netherlands
Norway
Slovenia
Liechtenstein
Finland
Slovakia
Poland
Estonia
Croatia
Lithuania
Turkey
Latvia
Czech Republic
Romania
Malta
Albania
Iceland
Hungary
Montenegro
Bulgaria
Bosnia and Herzegovina
Serbia
Kosovo
€/kW
h
VAT and other recoverable taxes and levies
Taxes excluding VAT and other recoverable taxes and levies
Basic price
76
- May imply increased transaction costs, - May bring difficulties when it comes to termination, - My be troublesome for generators who are willing to direct the development of
energy market in particular, most beneficial direction, - May bring additional excess capacity of not desired generation.
Those sources propose that it would be more efficient to avoid the implementation of the capacity market and focus on the following tasks:
- Development of demand side response with application of smart metering, - Introduction of smart grid, - Transmission grid extension, - Focus on the development of electricity storage systems and ancillary services, - Integration of the balancing areas into larger areas, - Introduction of shorter schedule intervals, - Focus on the development of precise even short-term weather forecasts and taking
use of it in the scheduling. Although all abovementioned ideas could actually solve most of the electricity-connected problems all of them would require an enormous expenditures across the contemplated region and the introduction of technologies that are still not work out or even invented. The current situation however demands urgent actions such as implementing capacity mechanisms. In recent reports that examine the operation of capacity markets around the world it is pointed that the "traditional capacity mechanism" focus too much on keeping the required capacity without considering the resource adequacy. In many systems the capacity providers were rewarded equally (so called 'vanilla capacity market') regardless their operation characteristic, efficiency or position in the energy mix (the only determining factor is the price) - it is often called the 'merit order effect'. This problem arouse in the PJM and New England, where although the capacity investment was enhanced there is not enough resource adequacy. In response, the New England has developed a proposal according to which different capacity resources will receive different payments. (RAP, 2011; Center for International Relations, 2014)
5 POLISH POWER MARKET 5.1 History
The energy industry in Poland originated in the XX century. At the beginning, there were only private factories that were installing small generating units for their own purposes. The first public power plant in Poland was built in Radom in 1901 by Russian Company 'Union' from Petersburg. At this time, being the capital of the Radom Governorate and an important military and civilian center Radom was an important city (Chisholm, 1911). Afterwards, in 1904 companies AEG and Siemens, under the terms of concession given by the local authorities, opened the power plant of 1,5 MW. Primary, it was a supplier of the
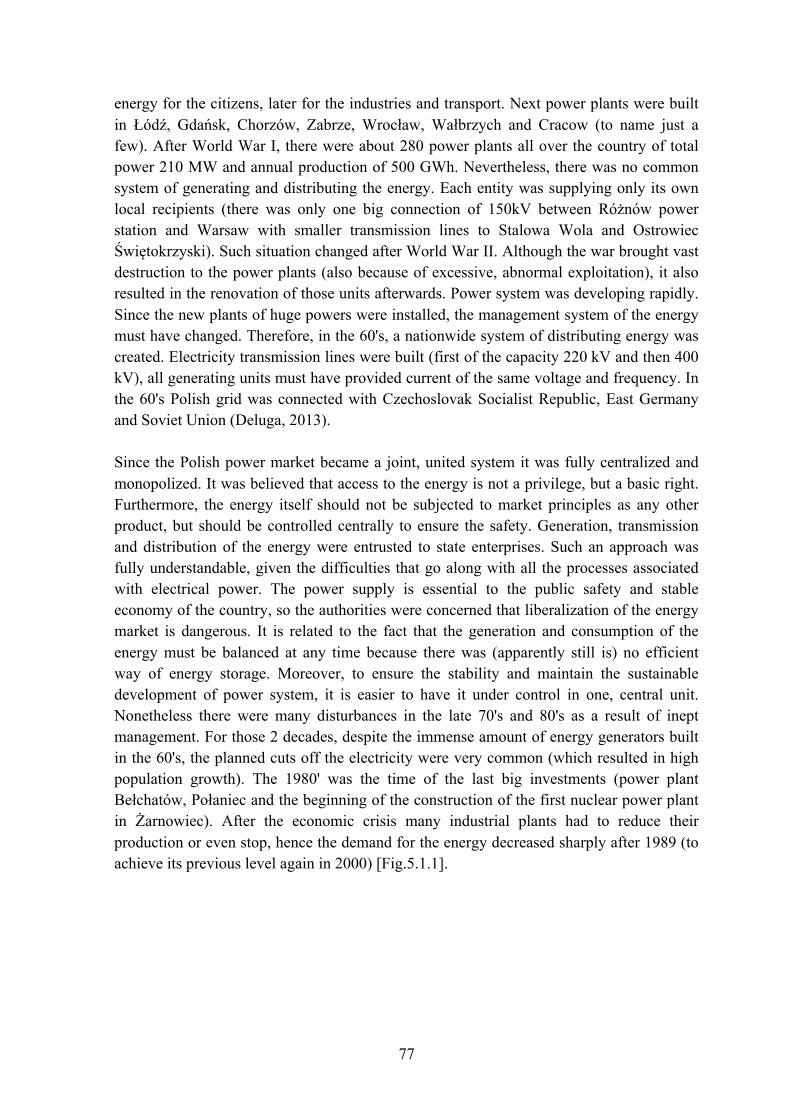
77
energy for the citizens, later for the industries and transport. Next power plants were built in Łódź, Gdańsk, Chorzów, Zabrze, Wrocław, Wałbrzych and Cracow (to name just a few). After World War I, there were about 280 power plants all over the country of total power 210 MW and annual production of 500 GWh. Nevertheless, there was no common system of generating and distributing the energy. Each entity was supplying only its own local recipients (there was only one big connection of 150kV between Różnów power station and Warsaw with smaller transmission lines to Stalowa Wola and Ostrowiec Świętokrzyski). Such situation changed after World War II. Although the war brought vast destruction to the power plants (also because of excessive, abnormal exploitation), it also resulted in the renovation of those units afterwards. Power system was developing rapidly. Since the new plants of huge powers were installed, the management system of the energy must have changed. Therefore, in the 60's, a nationwide system of distributing energy was created. Electricity transmission lines were built (first of the capacity 220 kV and then 400 kV), all generating units must have provided current of the same voltage and frequency. In the 60's Polish grid was connected with Czechoslovak Socialist Republic, East Germany and Soviet Union (Deluga, 2013). Since the Polish power market became a joint, united system it was fully centralized and monopolized. It was believed that access to the energy is not a privilege, but a basic right. Furthermore, the energy itself should not be subjected to market principles as any other product, but should be controlled centrally to ensure the safety. Generation, transmission and distribution of the energy were entrusted to state enterprises. Such an approach was fully understandable, given the difficulties that go along with all the processes associated with electrical power. The power supply is essential to the public safety and stable economy of the country, so the authorities were concerned that liberalization of the energy market is dangerous. It is related to the fact that the generation and consumption of the energy must be balanced at any time because there was (apparently still is) no efficient way of energy storage. Moreover, to ensure the stability and maintain the sustainable development of power system, it is easier to have it under control in one, central unit. Nonetheless there were many disturbances in the late 70's and 80's as a result of inept management. For those 2 decades, despite the immense amount of energy generators built in the 60's, the planned cuts off the electricity were very common (which resulted in high population growth). The 1980' was the time of the last big investments (power plant Bełchatów, Połaniec and the beginning of the construction of the first nuclear power plant in Żarnowiec). After the economic crisis many industrial plants had to reduce their production or even stop, hence the demand for the energy decreased sharply after 1989 (to achieve its previous level again in 2000) [Fig.5.1.1].
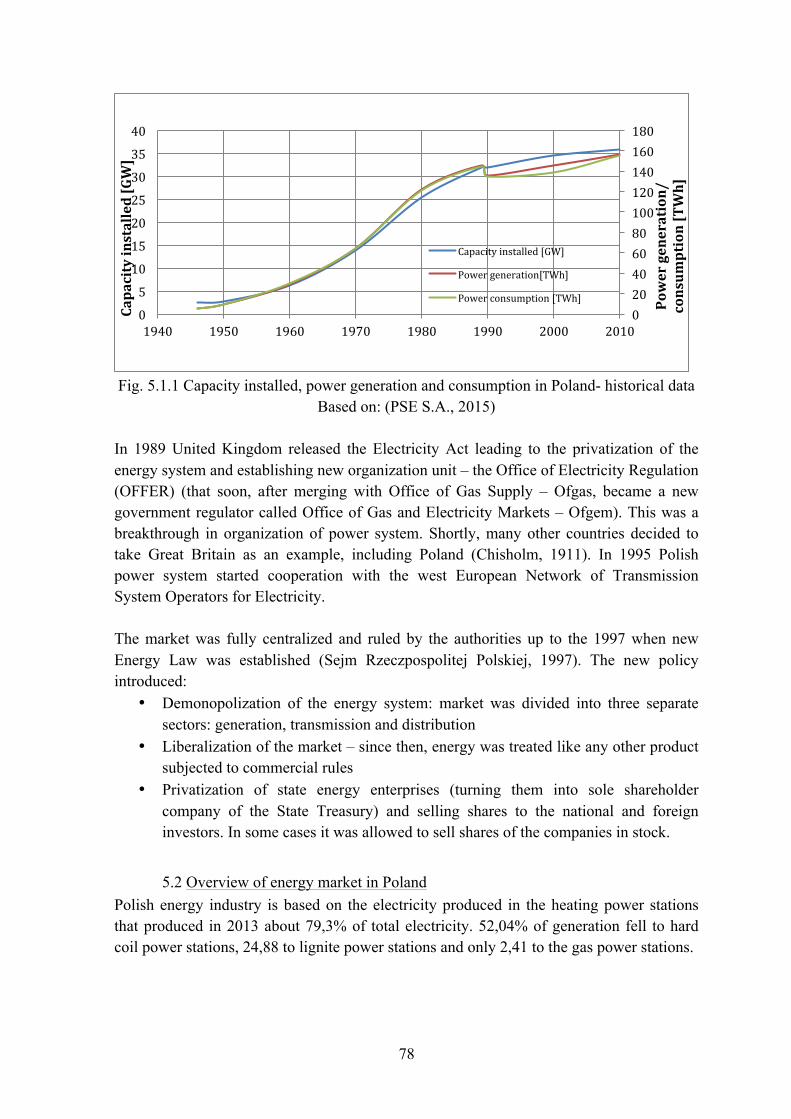
78
Fig. 5.1.1 Capacity installed, power generation and consumption in Poland- historical data
Based on: (PSE S.A., 2015) In 1989 United Kingdom released the Electricity Act leading to the privatization of the energy system and establishing new organization unit – the Office of Electricity Regulation (OFFER) (that soon, after merging with Office of Gas Supply – Ofgas, became a new government regulator called Office of Gas and Electricity Markets – Ofgem). This was a breakthrough in organization of power system. Shortly, many other countries decided to take Great Britain as an example, including Poland (Chisholm, 1911). In 1995 Polish power system started cooperation with the west European Network of Transmission System Operators for Electricity. The market was fully centralized and ruled by the authorities up to the 1997 when new Energy Law was established (Sejm Rzeczpospolitej Polskiej, 1997). The new policy introduced:
• Demonopolization of the energy system: market was divided into three separate sectors: generation, transmission and distribution
• Liberalization of the market – since then, energy was treated like any other product subjected to commercial rules
• Privatization of state energy enterprises (turning them into sole shareholder company of the State Treasury) and selling shares to the national and foreign investors. In some cases it was allowed to sell shares of the companies in stock.
5.2 Overview of energy market in Poland Polish energy industry is based on the electricity produced in the heating power stations that produced in 2013 about 79,3% of total electricity. 52,04% of generation fell to hard coil power stations, 24,88 to lignite power stations and only 2,41 to the gas power stations.
0 20 40 60 80 100 120 140 160 180
0
5
10
15
20
25
30
35
40
1940 1950 1960 1970 1980 1990 2000 2010
Power generation/
consum
ption [TWh]
Capacity installed [GW]
Capacity installed [GW]
Power generation[TWh]
Power consumption [TWh]
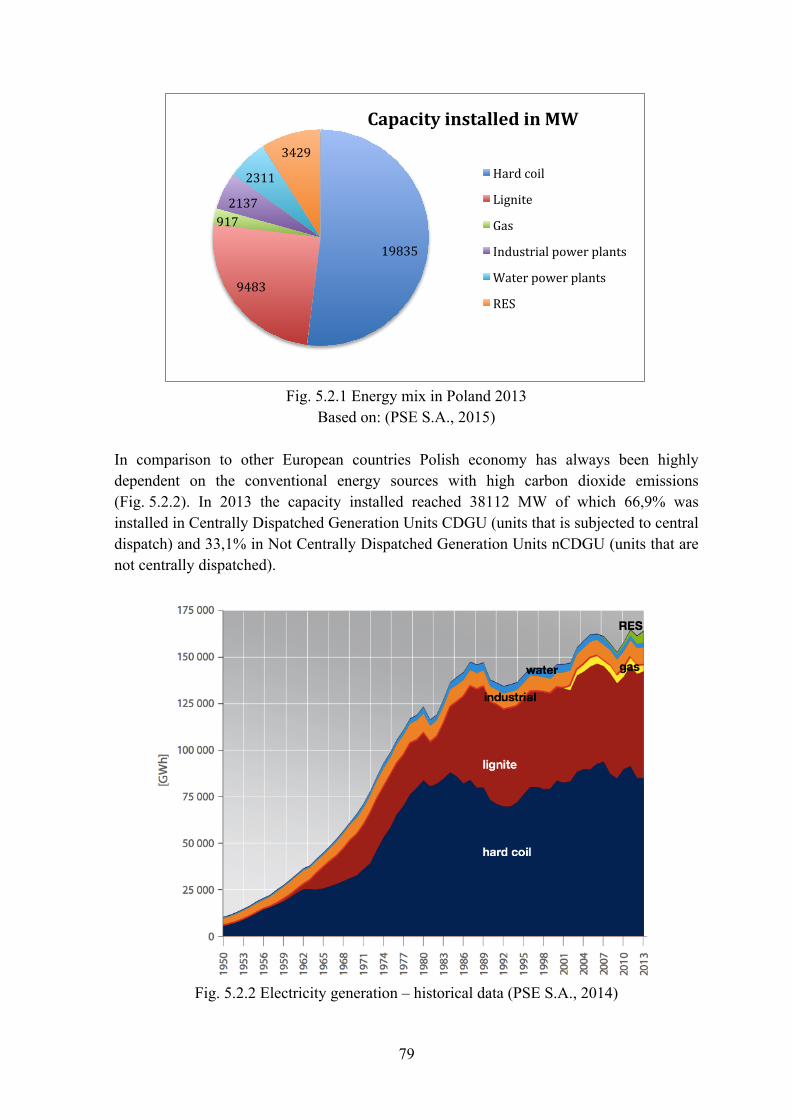
79
Fig. 5.2.1 Energy mix in Poland 2013
Based on: (PSE S.A., 2015) In comparison to other European countries Polish economy has always been highly dependent on the conventional energy sources with high carbon dioxide emissions (Fig. 5.2.2). In 2013 the capacity installed reached 38112 MW of which 66,9% was installed in Centrally Dispatched Generation Units CDGU (units that is subjected to central dispatch) and 33,1% in Not Centrally Dispatched Generation Units nCDGU (units that are not centrally dispatched).
Fig. 5.2.2 Electricity generation – historical data (PSE S.A., 2014)
19835
9483
917 2137
2311
3429
Capacity installed in MW
Hard coil
Lignite
Gas
Industrial power plants
Water power plants
RES
80
The biggest power plants in Poland are owned by PGE, Tauron, Enea, Polsat and EdF. Generators can sell their energy on the spot market or through the bilateral contracts with distribution companies or large customers. The company Polskie Sieci Elektroenergetyczne (PSE) manages the coordinated part of the 110kV network, 220kV and 400 kV lines; controls the overall transmission system and interconnection with neighborhood countries and is responsible for creating dispatch for all CDGU. Distribution network however, is managed by the four energy enterprises: PGE Dystrybucja, Taruon Dystrybucja, Enea Operator, Energa-Operator in the whole country and RWE Storen Operator in Warsaw. In Polish energy market there is a full unbundling between regulated and deregulated companies. So the owners of the generators and suppliers of the energy cannot own transmission and distribution lines in the same time. Additionally, since 2007 there is s Third Party Access law that allows each consumer to purchase energy from every energy supplier available in the market regardless its location. TSO and DSOs are obliged to pass the energy regardless the chosen supplier. There are six main groups of customers in Poland (URE, 2011):
- Group I: Customers whose installations needs to be connected to the over 110kV lines
- Group II: Customers whose installations needs to be connected to the 110kV lines, - Group III: Customers whose installations needs to be connected to the over 1kV but
less than 110kV lines, - Group IV: Customers whose installations need to be connected to the not over than
1kV lines, with installations of power lower than 40kW and required current lower than 63A,
- Group V: Customers whose installations need to be connected to the not over than 1kV lines, with installations of power not higher than 40kW and required current not higher than 63A,
- Group VI: Customers who needs only temporary connection. Each customer may have separate contracts (for purchasing electricity and for distribution and connection to the grid) or can authorize its supplier to conclude the distribution contract on his behalf. Despite the TPA law, according to which the consumer can sign contract with every electricity supplier, it is obliged to sign contract with this DSO to whose grid he is connected to. Among electricity suppliers there are so called Obliged Suppliers who are responsible for providing electricity to the customers over specified area, who did not sign any contract with other supplier, regardless the profitability of this service. (Mielczarski W. , 2014) (Cire, 2007)
5.3 Organization of the energy market The energy in Poland can be sold through energy market, balancing market and bilateral contracts. Since 1999 the energy market is run by the Polish Power Exchange POLPX, which is the only enterprise who has the license for operation of the commodity market. It is under
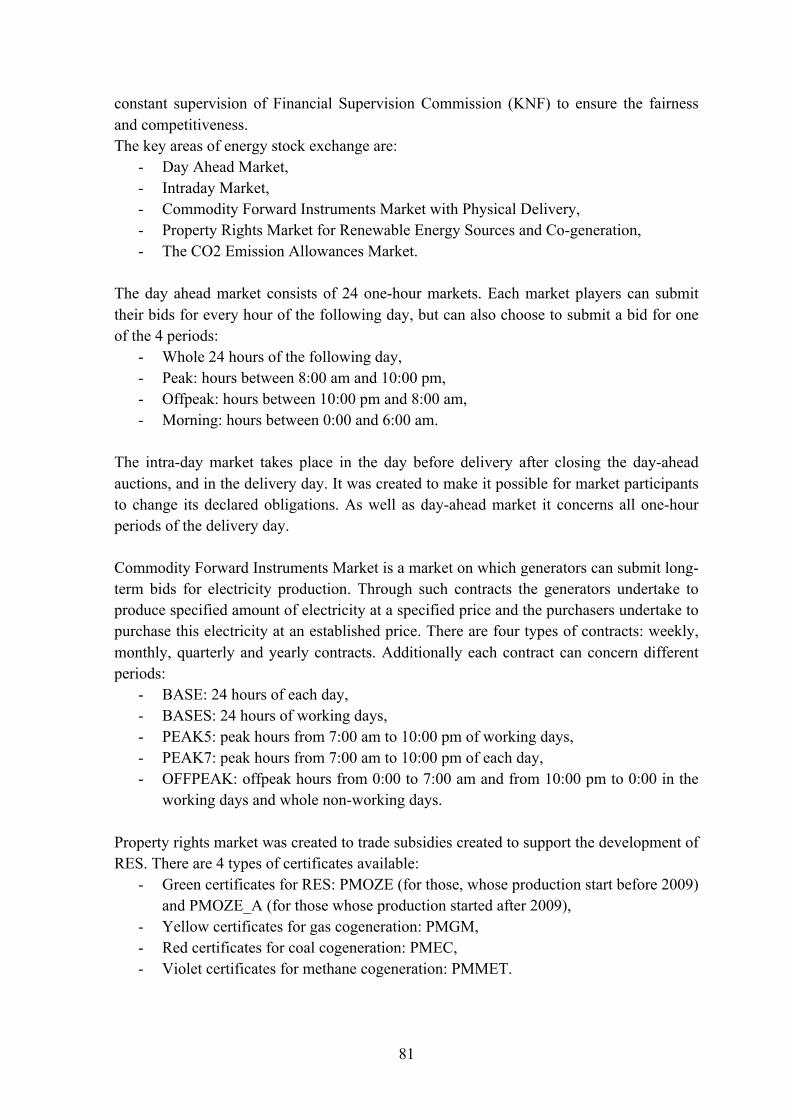
81
constant supervision of Financial Supervision Commission (KNF) to ensure the fairness and competitiveness. The key areas of energy stock exchange are:
- Day Ahead Market, - Intraday Market, - Commodity Forward Instruments Market with Physical Delivery, - Property Rights Market for Renewable Energy Sources and Co-generation, - The CO2 Emission Allowances Market.
The day ahead market consists of 24 one-hour markets. Each market players can submit their bids for every hour of the following day, but can also choose to submit a bid for one of the 4 periods:
- Whole 24 hours of the following day, - Peak: hours between 8:00 am and 10:00 pm, - Offpeak: hours between 10:00 pm and 8:00 am, - Morning: hours between 0:00 and 6:00 am.
The intra-day market takes place in the day before delivery after closing the day-ahead auctions, and in the delivery day. It was created to make it possible for market participants to change its declared obligations. As well as day-ahead market it concerns all one-hour periods of the delivery day. Commodity Forward Instruments Market is a market on which generators can submit long-term bids for electricity production. Through such contracts the generators undertake to produce specified amount of electricity at a specified price and the purchasers undertake to purchase this electricity at an established price. There are four types of contracts: weekly, monthly, quarterly and yearly contracts. Additionally each contract can concern different periods:
- BASE: 24 hours of each day, - BASES: 24 hours of working days, - PEAK5: peak hours from 7:00 am to 10:00 pm of working days, - PEAK7: peak hours from 7:00 am to 10:00 pm of each day, - OFFPEAK: offpeak hours from 0:00 to 7:00 am and from 10:00 pm to 0:00 in the
working days and whole non-working days. Property rights market was created to trade subsidies created to support the development of RES. There are 4 types of certificates available:
- Green certificates for RES: PMOZE (for those, whose production start before 2009) and PMOZE_A (for those whose production started after 2009),
- Yellow certificates for gas cogeneration: PMGM, - Red certificates for coal cogeneration: PMEC, - Violet certificates for methane cogeneration: PMMET.
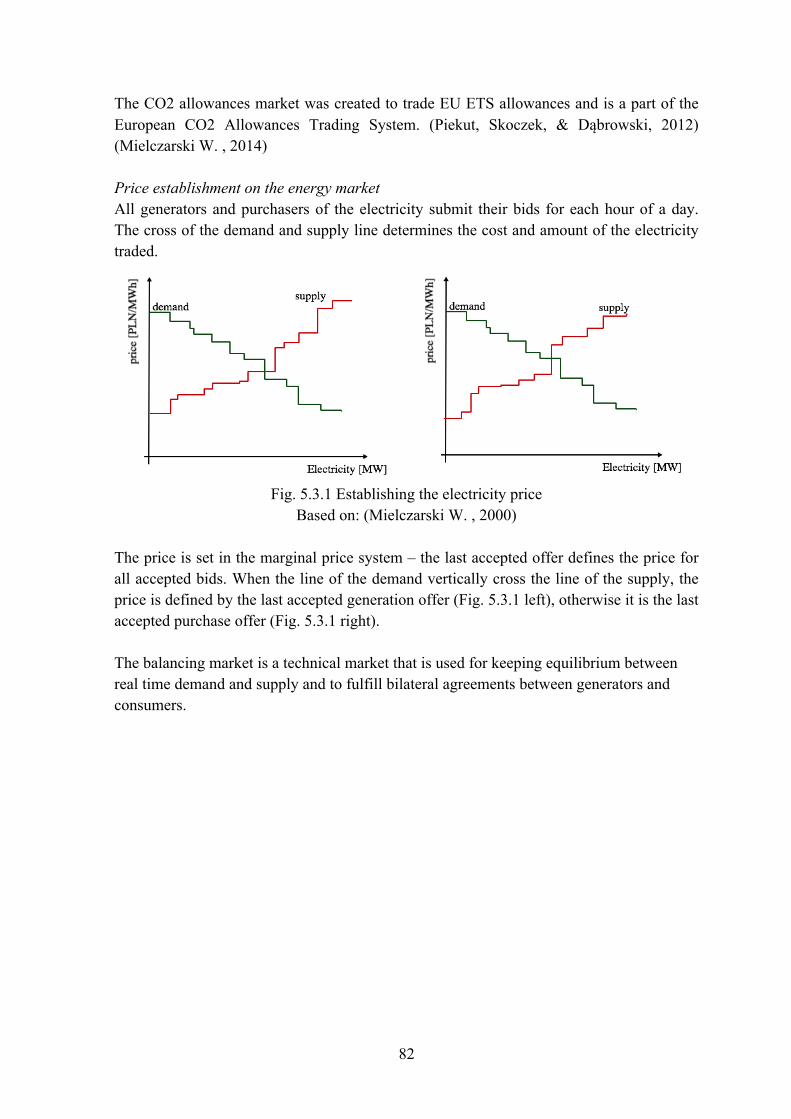
82
The CO2 allowances market was created to trade EU ETS allowances and is a part of the European CO2 Allowances Trading System. (Piekut, Skoczek, & Dąbrowski, 2012) (Mielczarski W. , 2014) Price establishment on the energy market All generators and purchasers of the electricity submit their bids for each hour of a day. The cross of the demand and supply line determines the cost and amount of the electricity traded.
Fig. 5.3.1 Establishing the electricity price
Based on: (Mielczarski W. , 2000) The price is set in the marginal price system – the last accepted offer defines the price for all accepted bids. When the line of the demand vertically cross the line of the supply, the price is defined by the last accepted generation offer (Fig. 5.3.1 left), otherwise it is the last accepted purchase offer (Fig. 5.3.1 right). The balancing market is a technical market that is used for keeping equilibrium between real time demand and supply and to fulfill bilateral agreements between generators and consumers.
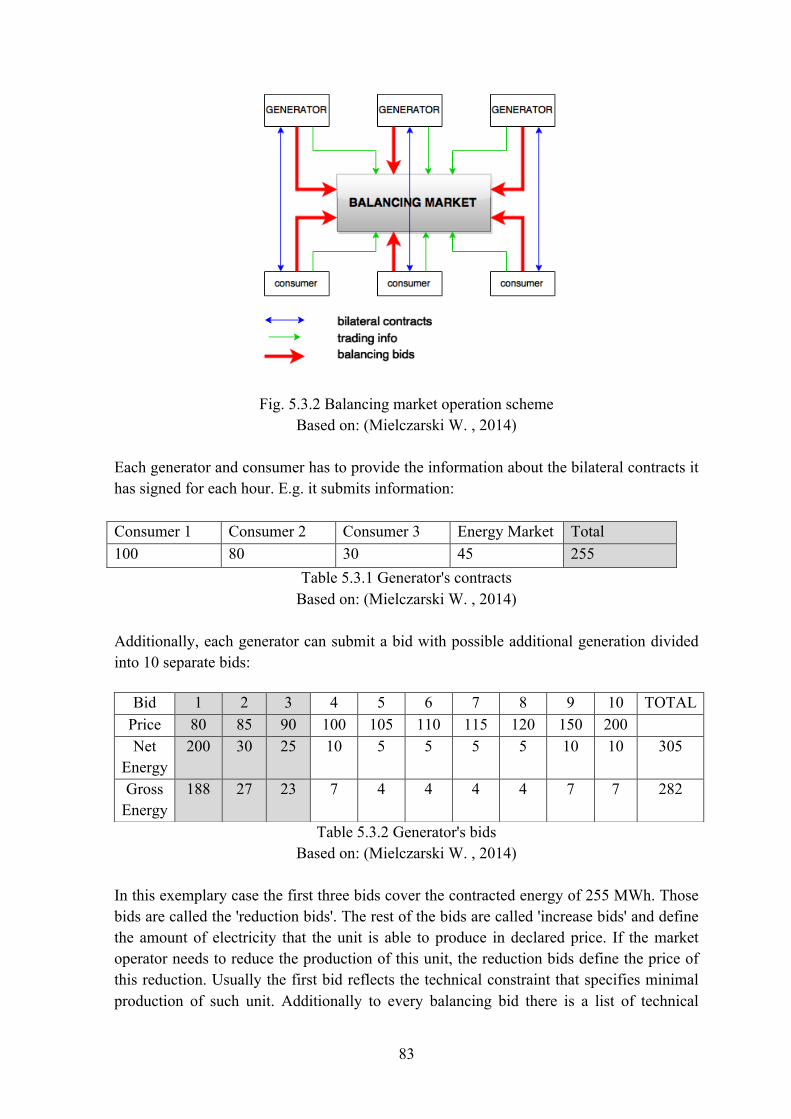
83
Fig. 5.3.2 Balancing market operation scheme Based on: (Mielczarski W. , 2014)
Each generator and consumer has to provide the information about the bilateral contracts it has signed for each hour. E.g. it submits information: Consumer 1 Consumer 2 Consumer 3 Energy Market Total 100 80 30 45 255
Table 5.3.1 Generator's contracts Based on: (Mielczarski W. , 2014)
Additionally, each generator can submit a bid with possible additional generation divided into 10 separate bids:
Table 5.3.2 Generator's bids Based on: (Mielczarski W. , 2014)
In this exemplary case the first three bids cover the contracted energy of 255 MWh. Those bids are called the 'reduction bids'. The rest of the bids are called 'increase bids' and define the amount of electricity that the unit is able to produce in declared price. If the market operator needs to reduce the production of this unit, the reduction bids define the price of this reduction. Usually the first bid reflects the technical constraint that specifies minimal production of such unit. Additionally to every balancing bid there is a list of technical
Bid 1 2 3 4 5 6 7 8 9 10 TOTAL Price 80 85 90 100 105 110 115 120 150 200 Net
Energy 200 30 25 10 5 5 5 5 10 10 305
Gross Energy
188 27 23 7 4 4 4 4 7 7 282
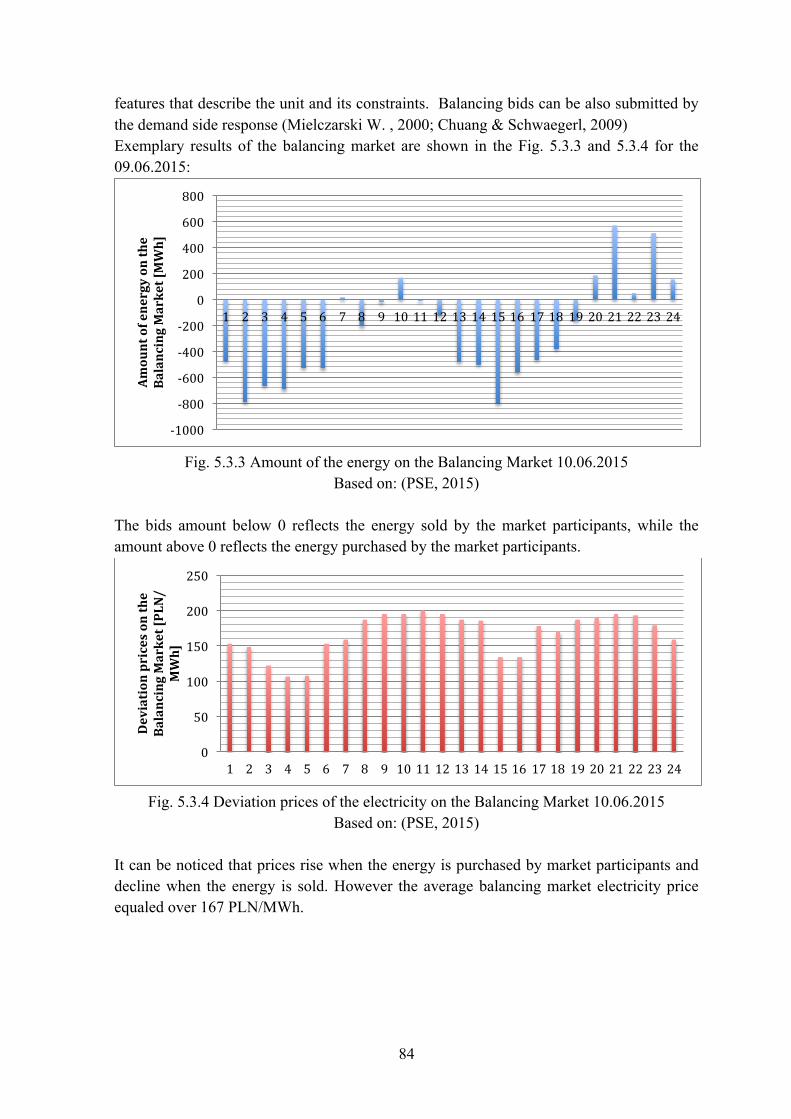
84
features that describe the unit and its constraints. Balancing bids can be also submitted by the demand side response (Mielczarski W. , 2000; Chuang & Schwaegerl, 2009) Exemplary results of the balancing market are shown in the Fig. 5.3.3 and 5.3.4 for the 09.06.2015:
Fig. 5.3.3 Amount of the energy on the Balancing Market 10.06.2015
Based on: (PSE, 2015)
The bids amount below 0 reflects the energy sold by the market participants, while the amount above 0 reflects the energy purchased by the market participants.
Fig. 5.3.4 Deviation prices of the electricity on the Balancing Market 10.06.2015
Based on: (PSE, 2015) It can be noticed that prices rise when the energy is purchased by market participants and decline when the energy is sold. However the average balancing market electricity price equaled over 167 PLN/MWh.
-‐1000
-‐800
-‐600
-‐400
-‐200
0
200
400
600
800
1 2 3 4 5 6 7 8 9 10 11 12 13 14 15 16 17 18 19 20 21 22 23 24
Amount of energy on the
Balancing Market [MWh]
0
50
100
150
200
250
1 2 3 4 5 6 7 8 9 10 11 12 13 14 15 16 17 18 19 20 21 22 23 24
Deviation prices on the
Balancing Market [PLN/
MWh]
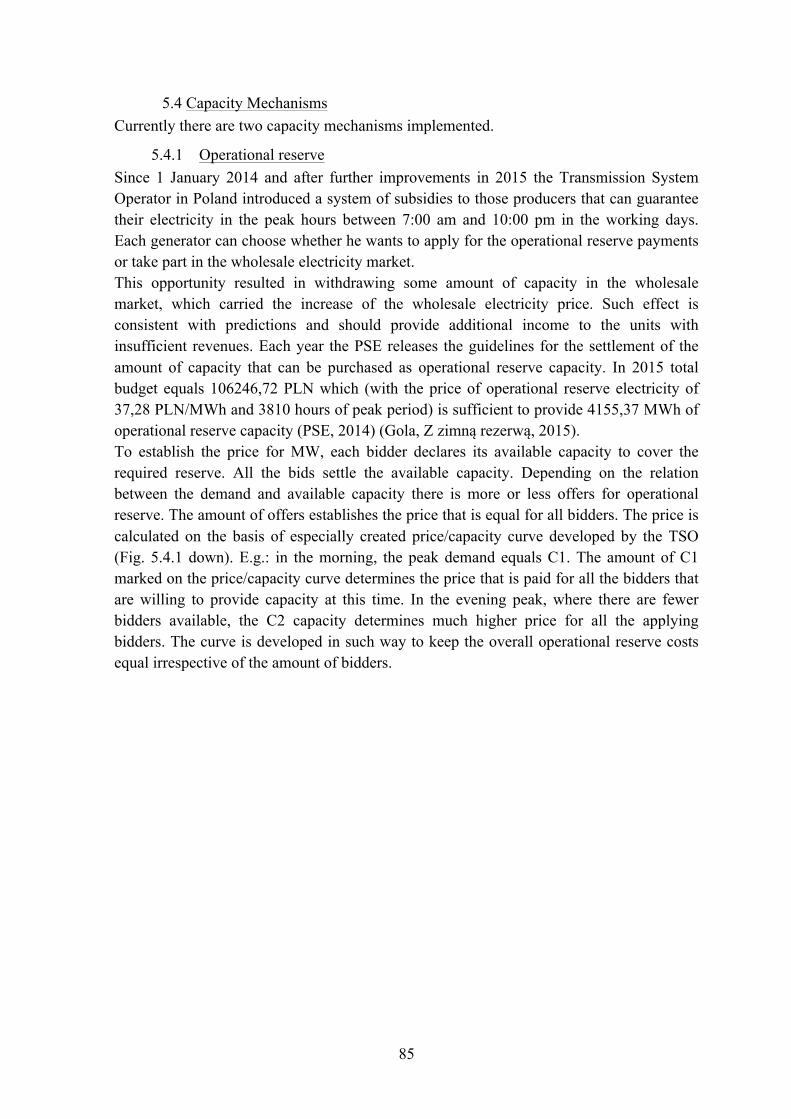
85
5.4 Capacity Mechanisms Currently there are two capacity mechanisms implemented.
5.4.1 Operational reserve Since 1 January 2014 and after further improvements in 2015 the Transmission System Operator in Poland introduced a system of subsidies to those producers that can guarantee their electricity in the peak hours between 7:00 am and 10:00 pm in the working days. Each generator can choose whether he wants to apply for the operational reserve payments or take part in the wholesale electricity market. This opportunity resulted in withdrawing some amount of capacity in the wholesale market, which carried the increase of the wholesale electricity price. Such effect is consistent with predictions and should provide additional income to the units with insufficient revenues. Each year the PSE releases the guidelines for the settlement of the amount of capacity that can be purchased as operational reserve capacity. In 2015 total budget equals 106246,72 PLN which (with the price of operational reserve electricity of 37,28 PLN/MWh and 3810 hours of peak period) is sufficient to provide 4155,37 MWh of operational reserve capacity (PSE, 2014) (Gola, Z zimną rezerwą, 2015). To establish the price for MW, each bidder declares its available capacity to cover the required reserve. All the bids settle the available capacity. Depending on the relation between the demand and available capacity there is more or less offers for operational reserve. The amount of offers establishes the price that is equal for all bidders. The price is calculated on the basis of especially created price/capacity curve developed by the TSO (Fig. 5.4.1 down). E.g.: in the morning, the peak demand equals C1. The amount of C1 marked on the price/capacity curve determines the price that is paid for all the bidders that are willing to provide capacity at this time. In the evening peak, where there are fewer bidders available, the C2 capacity determines much higher price for all the applying bidders. The curve is developed in such way to keep the overall operational reserve costs equal irrespective of the amount of bidders.
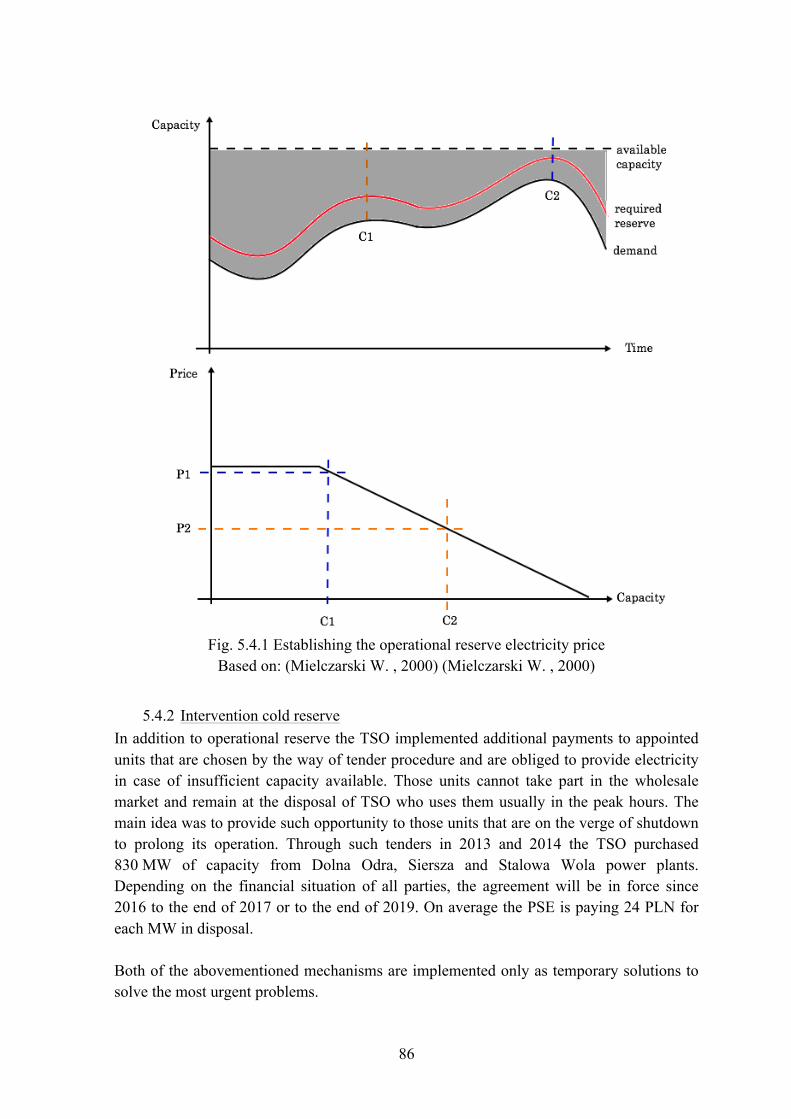
86
Fig. 5.4.1 Establishing the operational reserve electricity price
Based on: (Mielczarski W. , 2000) (Mielczarski W. , 2000)
5.4.2 Intervention cold reserve In addition to operational reserve the TSO implemented additional payments to appointed units that are chosen by the way of tender procedure and are obliged to provide electricity in case of insufficient capacity available. Those units cannot take part in the wholesale market and remain at the disposal of TSO who uses them usually in the peak hours. The main idea was to provide such opportunity to those units that are on the verge of shutdown to prolong its operation. Through such tenders in 2013 and 2014 the TSO purchased 830 MW of capacity from Dolna Odra, Siersza and Stalowa Wola power plants. Depending on the financial situation of all parties, the agreement will be in force since 2016 to the end of 2017 or to the end of 2019. On average the PSE is paying 24 PLN for each MW in disposal. Both of the abovementioned mechanisms are implemented only as temporary solutions to solve the most urgent problems.
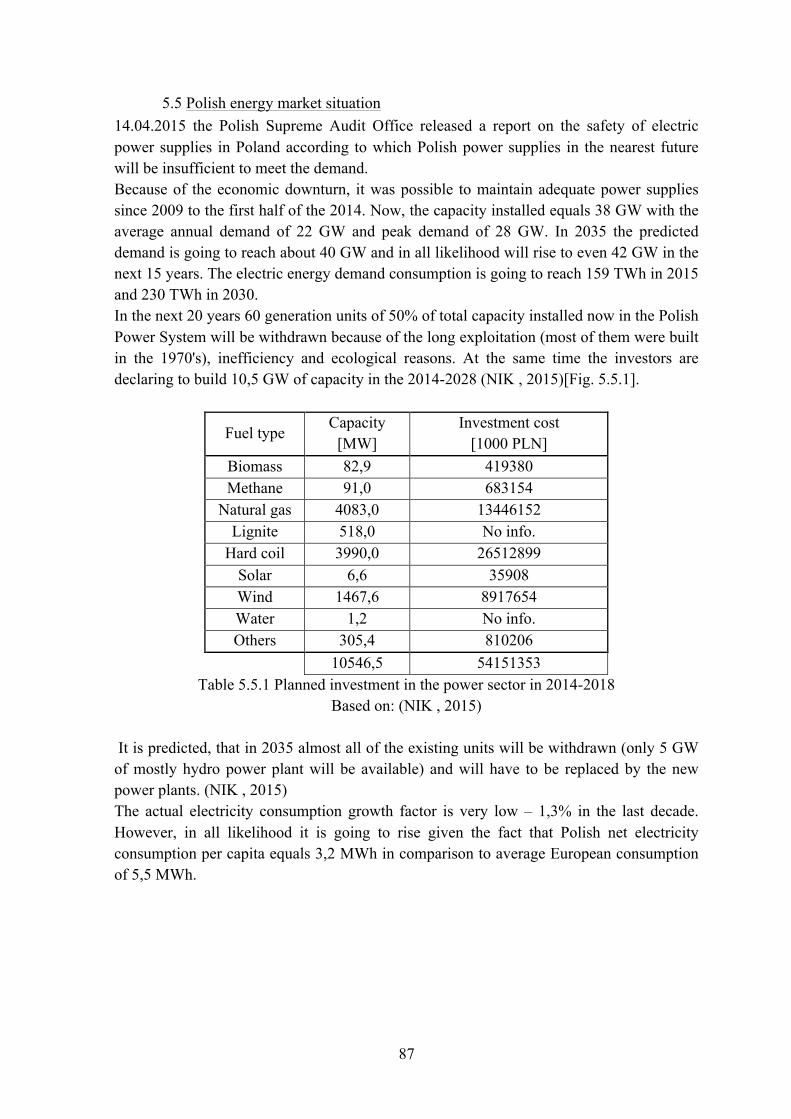
87
5.5 Polish energy market situation 14.04.2015 the Polish Supreme Audit Office released a report on the safety of electric power supplies in Poland according to which Polish power supplies in the nearest future will be insufficient to meet the demand. Because of the economic downturn, it was possible to maintain adequate power supplies since 2009 to the first half of the 2014. Now, the capacity installed equals 38 GW with the average annual demand of 22 GW and peak demand of 28 GW. In 2035 the predicted demand is going to reach about 40 GW and in all likelihood will rise to even 42 GW in the next 15 years. The electric energy demand consumption is going to reach 159 TWh in 2015 and 230 TWh in 2030. In the next 20 years 60 generation units of 50% of total capacity installed now in the Polish Power System will be withdrawn because of the long exploitation (most of them were built in the 1970's), inefficiency and ecological reasons. At the same time the investors are declaring to build 10,5 GW of capacity in the 2014-2028 (NIK , 2015)[Fig. 5.5.1].
Fuel type Capacity
[MW] Investment cost
[1000 PLN] Biomass 82,9 419380 Methane 91,0 683154
Natural gas 4083,0 13446152 Lignite 518,0 No info.
Hard coil 3990,0 26512899 Solar 6,6 35908 Wind 1467,6 8917654 Water 1,2 No info. Others 305,4 810206
10546,5 54151353
Table 5.5.1 Planned investment in the power sector in 2014-2018 Based on: (NIK , 2015)
It is predicted, that in 2035 almost all of the existing units will be withdrawn (only 5 GW of mostly hydro power plant will be available) and will have to be replaced by the new power plants. (NIK , 2015) The actual electricity consumption growth factor is very low – 1,3% in the last decade. However, in all likelihood it is going to rise given the fact that Polish net electricity consumption per capita equals 3,2 MWh in comparison to average European consumption of 5,5 MWh.
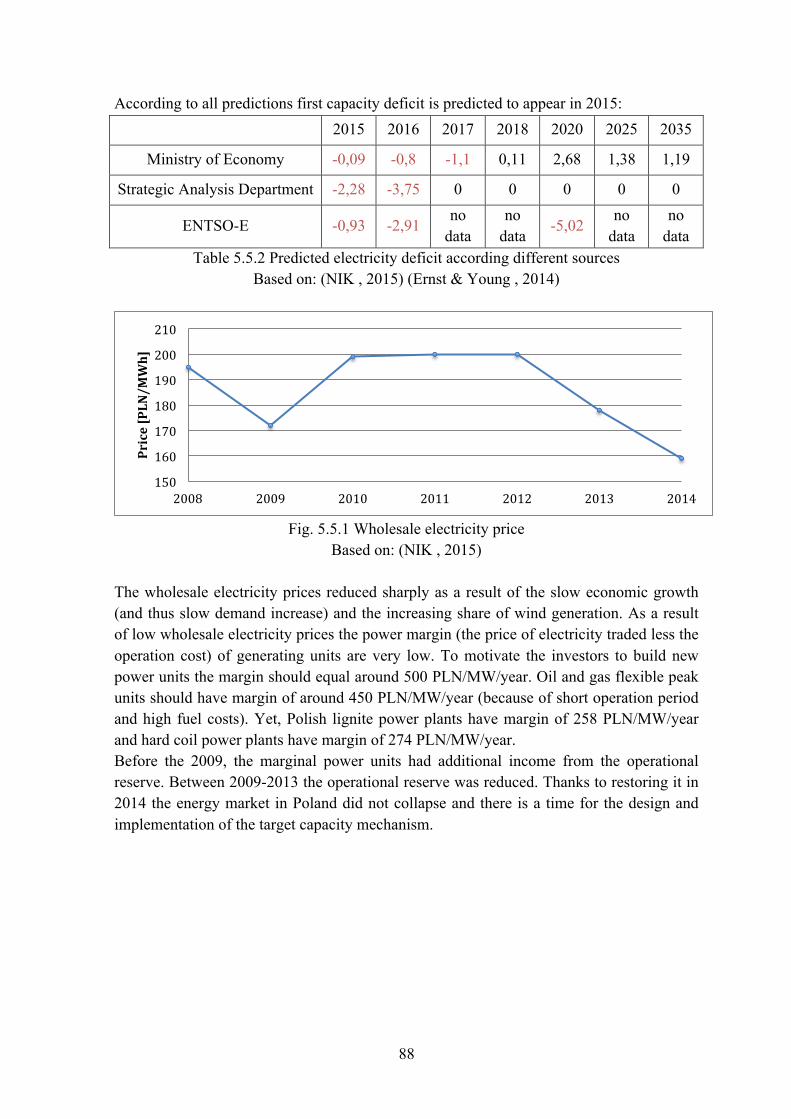
88
According to all predictions first capacity deficit is predicted to appear in 2015: 2015 2016 2017 2018 2020 2025 2035
Ministry of Economy -0,09 -0,8 -1,1 0,11 2,68 1,38 1,19
Strategic Analysis Department -2,28 -3,75 0 0 0 0 0
ENTSO-E -0,93 -2,91 no
data no
data -5,02
no data
no data
Table 5.5.2 Predicted electricity deficit according different sources Based on: (NIK , 2015) (Ernst & Young , 2014)
Fig. 5.5.1 Wholesale electricity price
Based on: (NIK , 2015)
The wholesale electricity prices reduced sharply as a result of the slow economic growth (and thus slow demand increase) and the increasing share of wind generation. As a result of low wholesale electricity prices the power margin (the price of electricity traded less the operation cost) of generating units are very low. To motivate the investors to build new power units the margin should equal around 500 PLN/MW/year. Oil and gas flexible peak units should have margin of around 450 PLN/MW/year (because of short operation period and high fuel costs). Yet, Polish lignite power plants have margin of 258 PLN/MW/year and hard coil power plants have margin of 274 PLN/MW/year. Before the 2009, the marginal power units had additional income from the operational reserve. Between 2009-2013 the operational reserve was reduced. Thanks to restoring it in 2014 the energy market in Poland did not collapse and there is a time for the design and implementation of the target capacity mechanism.
150
160
170
180
190
200
210
2008 2009 2010 2011 2012 2013 2014
Price [PLN/M
Wh]
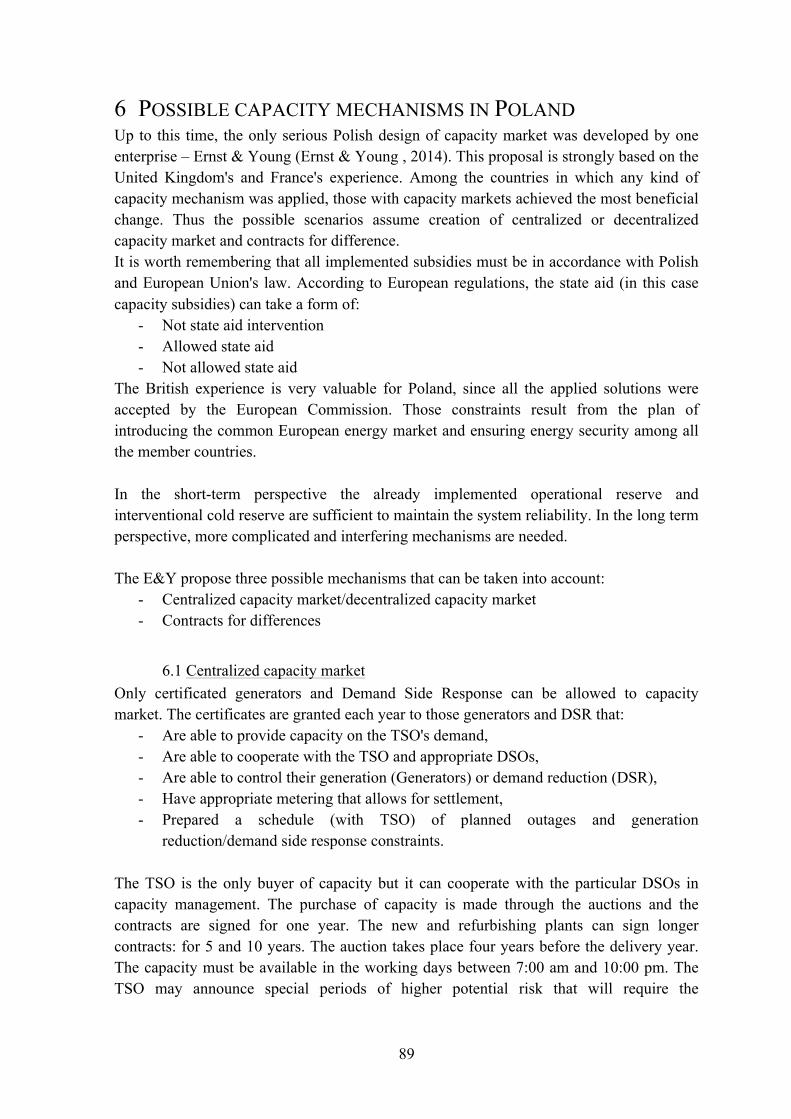
89
6 POSSIBLE CAPACITY MECHANISMS IN POLAND Up to this time, the only serious Polish design of capacity market was developed by one enterprise – Ernst & Young (Ernst & Young , 2014). This proposal is strongly based on the United Kingdom's and France's experience. Among the countries in which any kind of capacity mechanism was applied, those with capacity markets achieved the most beneficial change. Thus the possible scenarios assume creation of centralized or decentralized capacity market and contracts for difference. It is worth remembering that all implemented subsidies must be in accordance with Polish and European Union's law. According to European regulations, the state aid (in this case capacity subsidies) can take a form of:
- Not state aid intervention - Allowed state aid - Not allowed state aid
The British experience is very valuable for Poland, since all the applied solutions were accepted by the European Commission. Those constraints result from the plan of introducing the common European energy market and ensuring energy security among all the member countries. In the short-term perspective the already implemented operational reserve and interventional cold reserve are sufficient to maintain the system reliability. In the long term perspective, more complicated and interfering mechanisms are needed. The E&Y propose three possible mechanisms that can be taken into account:
- Centralized capacity market/decentralized capacity market - Contracts for differences
6.1 Centralized capacity market Only certificated generators and Demand Side Response can be allowed to capacity market. The certificates are granted each year to those generators and DSR that:
- Are able to provide capacity on the TSO's demand, - Are able to cooperate with the TSO and appropriate DSOs, - Are able to control their generation (Generators) or demand reduction (DSR), - Have appropriate metering that allows for settlement, - Prepared a schedule (with TSO) of planned outages and generation
reduction/demand side response constraints. The TSO is the only buyer of capacity but it can cooperate with the particular DSOs in capacity management. The purchase of capacity is made through the auctions and the contracts are signed for one year. The new and refurbishing plants can sign longer contracts: for 5 and 10 years. The auction takes place four years before the delivery year. The capacity must be available in the working days between 7:00 am and 10:00 pm. The TSO may announce special periods of higher potential risk that will require the
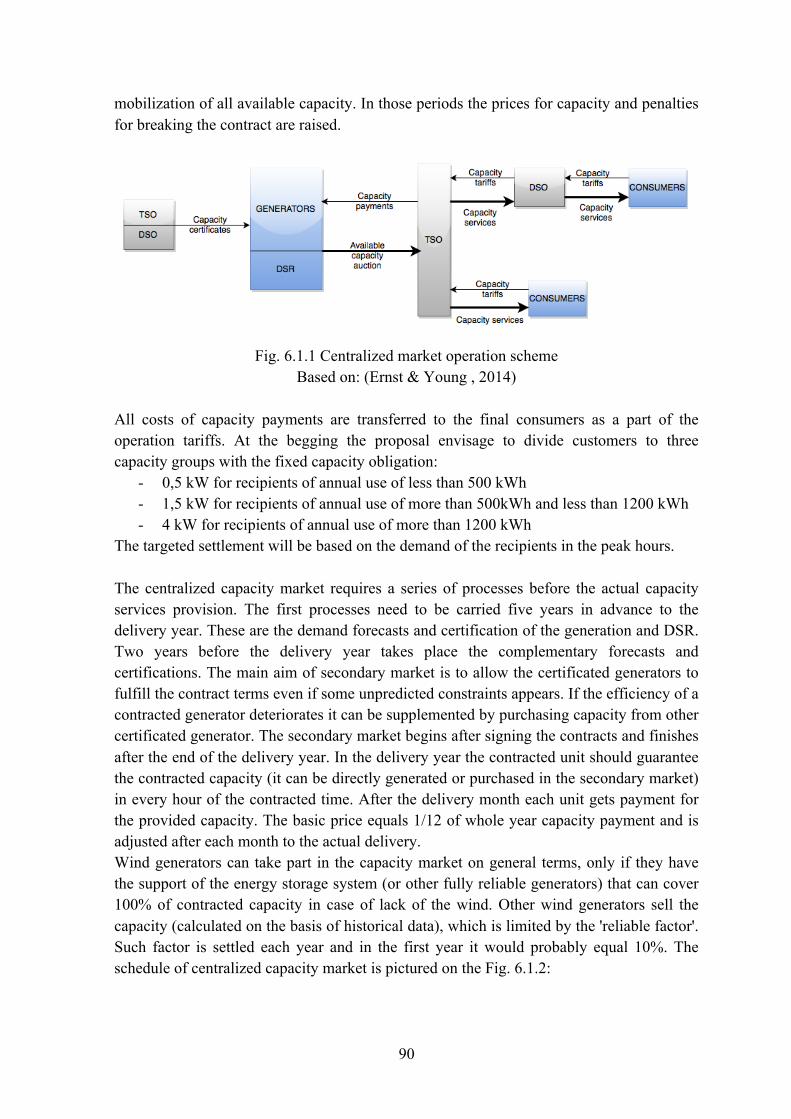
90
mobilization of all available capacity. In those periods the prices for capacity and penalties for breaking the contract are raised.
Fig. 6.1.1 Centralized market operation scheme
Based on: (Ernst & Young , 2014) All costs of capacity payments are transferred to the final consumers as a part of the operation tariffs. At the begging the proposal envisage to divide customers to three capacity groups with the fixed capacity obligation:
- 0,5 kW for recipients of annual use of less than 500 kWh - 1,5 kW for recipients of annual use of more than 500kWh and less than 1200 kWh - 4 kW for recipients of annual use of more than 1200 kWh
The targeted settlement will be based on the demand of the recipients in the peak hours. The centralized capacity market requires a series of processes before the actual capacity services provision. The first processes need to be carried five years in advance to the delivery year. These are the demand forecasts and certification of the generation and DSR. Two years before the delivery year takes place the complementary forecasts and certifications. The main aim of secondary market is to allow the certificated generators to fulfill the contract terms even if some unpredicted constraints appears. If the efficiency of a contracted generator deteriorates it can be supplemented by purchasing capacity from other certificated generator. The secondary market begins after signing the contracts and finishes after the end of the delivery year. In the delivery year the contracted unit should guarantee the contracted capacity (it can be directly generated or purchased in the secondary market) in every hour of the contracted time. After the delivery month each unit gets payment for the provided capacity. The basic price equals 1/12 of whole year capacity payment and is adjusted after each month to the actual delivery. Wind generators can take part in the capacity market on general terms, only if they have the support of the energy storage system (or other fully reliable generators) that can cover 100% of contracted capacity in case of lack of the wind. Other wind generators sell the capacity (calculated on the basis of historical data), which is limited by the 'reliable factor'. Such factor is settled each year and in the first year it would probably equal 10%. The schedule of centralized capacity market is pictured on the Fig. 6.1.2:
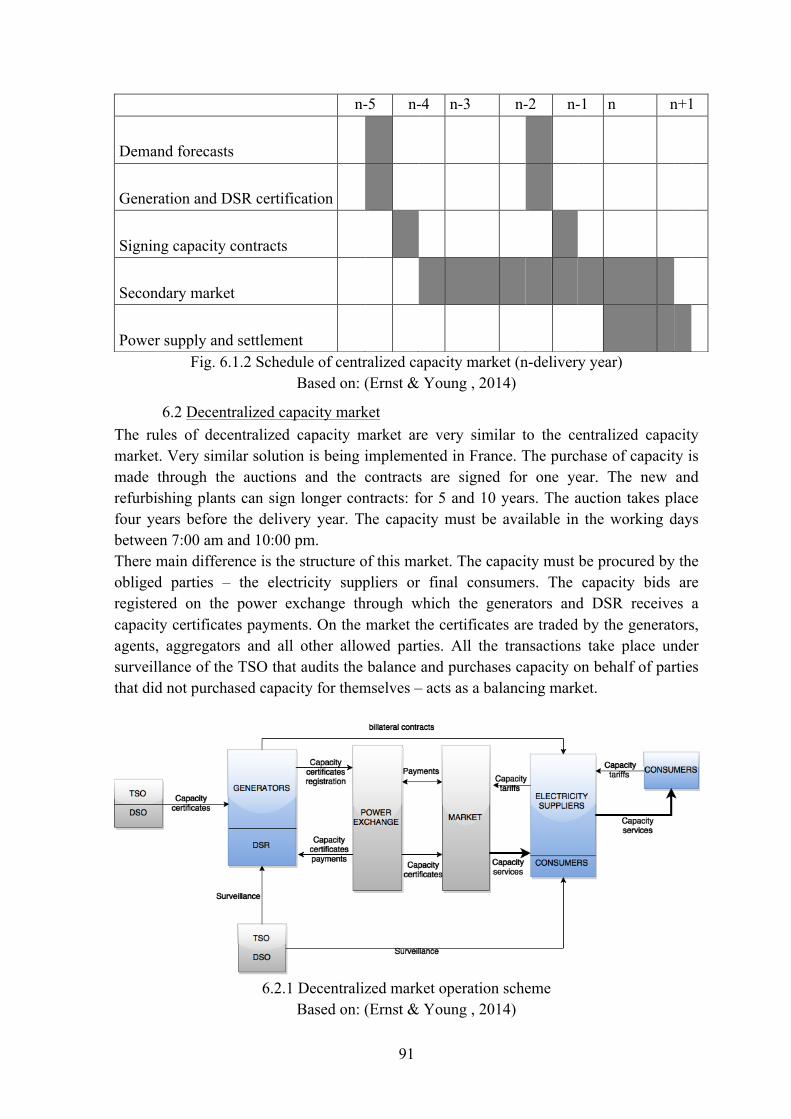
91
Fig. 6.1.2 Schedule of centralized capacity market (n-delivery year) Based on: (Ernst & Young , 2014)
6.2 Decentralized capacity market The rules of decentralized capacity market are very similar to the centralized capacity market. Very similar solution is being implemented in France. The purchase of capacity is made through the auctions and the contracts are signed for one year. The new and refurbishing plants can sign longer contracts: for 5 and 10 years. The auction takes place four years before the delivery year. The capacity must be available in the working days between 7:00 am and 10:00 pm. There main difference is the structure of this market. The capacity must be procured by the obliged parties – the electricity suppliers or final consumers. The capacity bids are registered on the power exchange through which the generators and DSR receives a capacity certificates payments. On the market the certificates are traded by the generators, agents, aggregators and all other allowed parties. All the transactions take place under surveillance of the TSO that audits the balance and purchases capacity on behalf of parties that did not purchased capacity for themselves – acts as a balancing market.
6.2.1 Decentralized market operation scheme
Based on: (Ernst & Young , 2014)
n-5 n-4 n-3 n-2 n-1 n n+1
Demand forecasts
Generation and DSR certification
Signing capacity contracts
Secondary market
Power supply and settlement
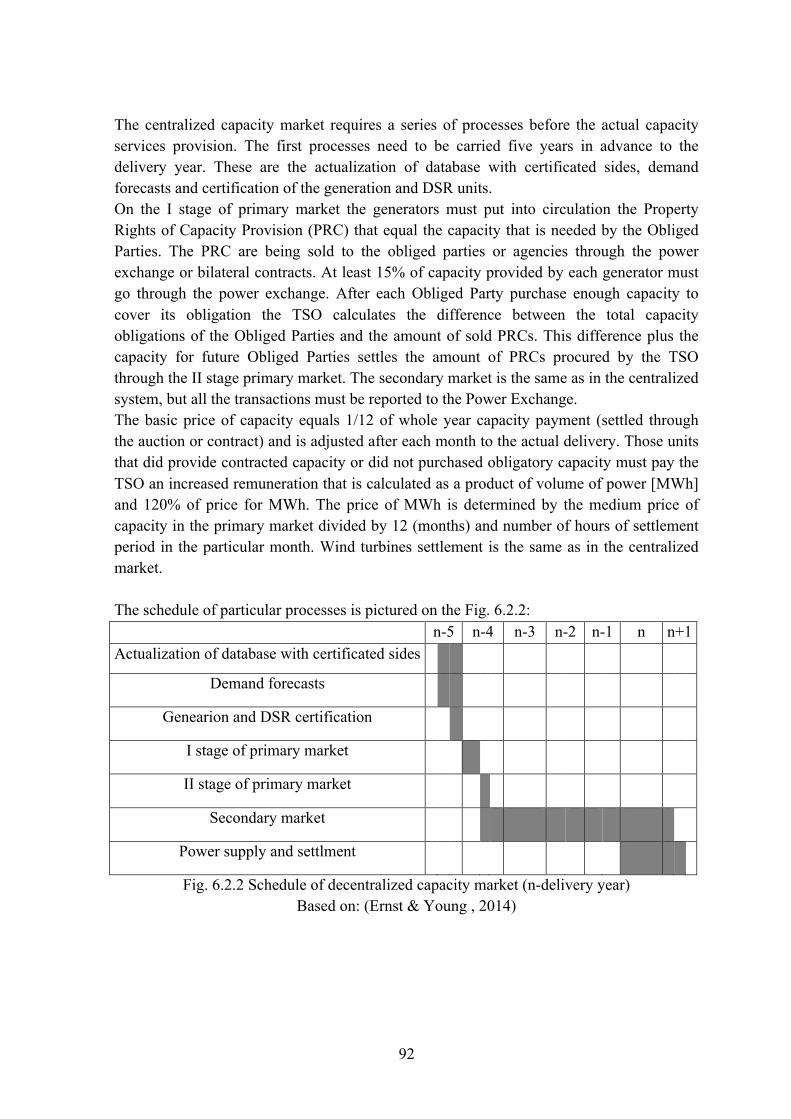
92
The centralized capacity market requires a series of processes before the actual capacity services provision. The first processes need to be carried five years in advance to the delivery year. These are the actualization of database with certificated sides, demand forecasts and certification of the generation and DSR units. On the I stage of primary market the generators must put into circulation the Property Rights of Capacity Provision (PRC) that equal the capacity that is needed by the Obliged Parties. The PRC are being sold to the obliged parties or agencies through the power exchange or bilateral contracts. At least 15% of capacity provided by each generator must go through the power exchange. After each Obliged Party purchase enough capacity to cover its obligation the TSO calculates the difference between the total capacity obligations of the Obliged Parties and the amount of sold PRCs. This difference plus the capacity for future Obliged Parties settles the amount of PRCs procured by the TSO through the II stage primary market. The secondary market is the same as in the centralized system, but all the transactions must be reported to the Power Exchange. The basic price of capacity equals 1/12 of whole year capacity payment (settled through the auction or contract) and is adjusted after each month to the actual delivery. Those units that did provide contracted capacity or did not purchased obligatory capacity must pay the TSO an increased remuneration that is calculated as a product of volume of power [MWh] and 120% of price for MWh. The price of MWh is determined by the medium price of capacity in the primary market divided by 12 (months) and number of hours of settlement period in the particular month. Wind turbines settlement is the same as in the centralized market. The schedule of particular processes is pictured on the Fig. 6.2.2:
n-5 n-4 n-3 n-2 n-1 n n+1 Actualization of database with certificated sides
Demand forecasts
Genearion and DSR certification
I stage of primary market
II stage of primary market
Secondary market
Power supply and settlment
Fig. 6.2.2 Schedule of decentralized capacity market (n-delivery year) Based on: (Ernst & Young , 2014)
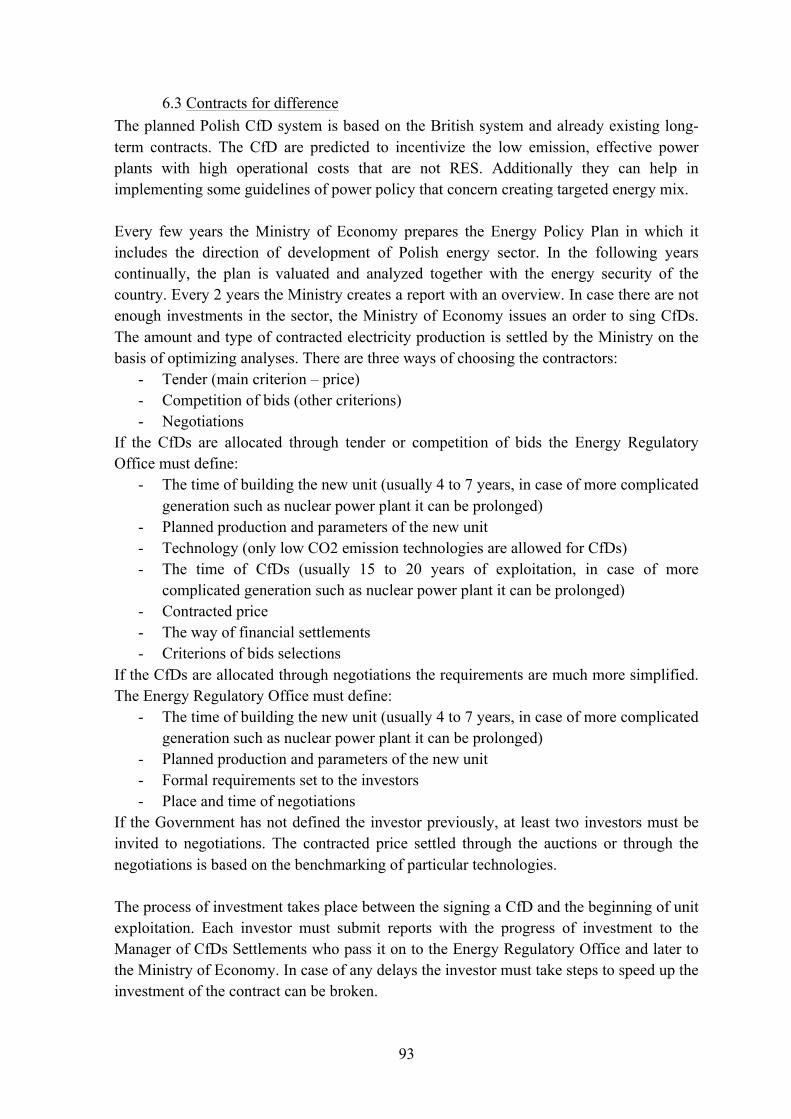
93
6.3 Contracts for difference The planned Polish CfD system is based on the British system and already existing long-term contracts. The CfD are predicted to incentivize the low emission, effective power plants with high operational costs that are not RES. Additionally they can help in implementing some guidelines of power policy that concern creating targeted energy mix. Every few years the Ministry of Economy prepares the Energy Policy Plan in which it includes the direction of development of Polish energy sector. In the following years continually, the plan is valuated and analyzed together with the energy security of the country. Every 2 years the Ministry creates a report with an overview. In case there are not enough investments in the sector, the Ministry of Economy issues an order to sing CfDs. The amount and type of contracted electricity production is settled by the Ministry on the basis of optimizing analyses. There are three ways of choosing the contractors:
- Tender (main criterion – price) - Competition of bids (other criterions) - Negotiations
If the CfDs are allocated through tender or competition of bids the Energy Regulatory Office must define:
- The time of building the new unit (usually 4 to 7 years, in case of more complicated generation such as nuclear power plant it can be prolonged)
- Planned production and parameters of the new unit - Technology (only low CO2 emission technologies are allowed for CfDs) - The time of CfDs (usually 15 to 20 years of exploitation, in case of more
complicated generation such as nuclear power plant it can be prolonged) - Contracted price - The way of financial settlements - Criterions of bids selections
If the CfDs are allocated through negotiations the requirements are much more simplified. The Energy Regulatory Office must define:
- The time of building the new unit (usually 4 to 7 years, in case of more complicated generation such as nuclear power plant it can be prolonged)
- Planned production and parameters of the new unit - Formal requirements set to the investors - Place and time of negotiations
If the Government has not defined the investor previously, at least two investors must be invited to negotiations. The contracted price settled through the auctions or through the negotiations is based on the benchmarking of particular technologies. The process of investment takes place between the signing a CfD and the beginning of unit exploitation. Each investor must submit reports with the progress of investment to the Manager of CfDs Settlements who pass it on to the Energy Regulatory Office and later to the Ministry of Economy. In case of any delays the investor must take steps to speed up the investment of the contract can be broken.
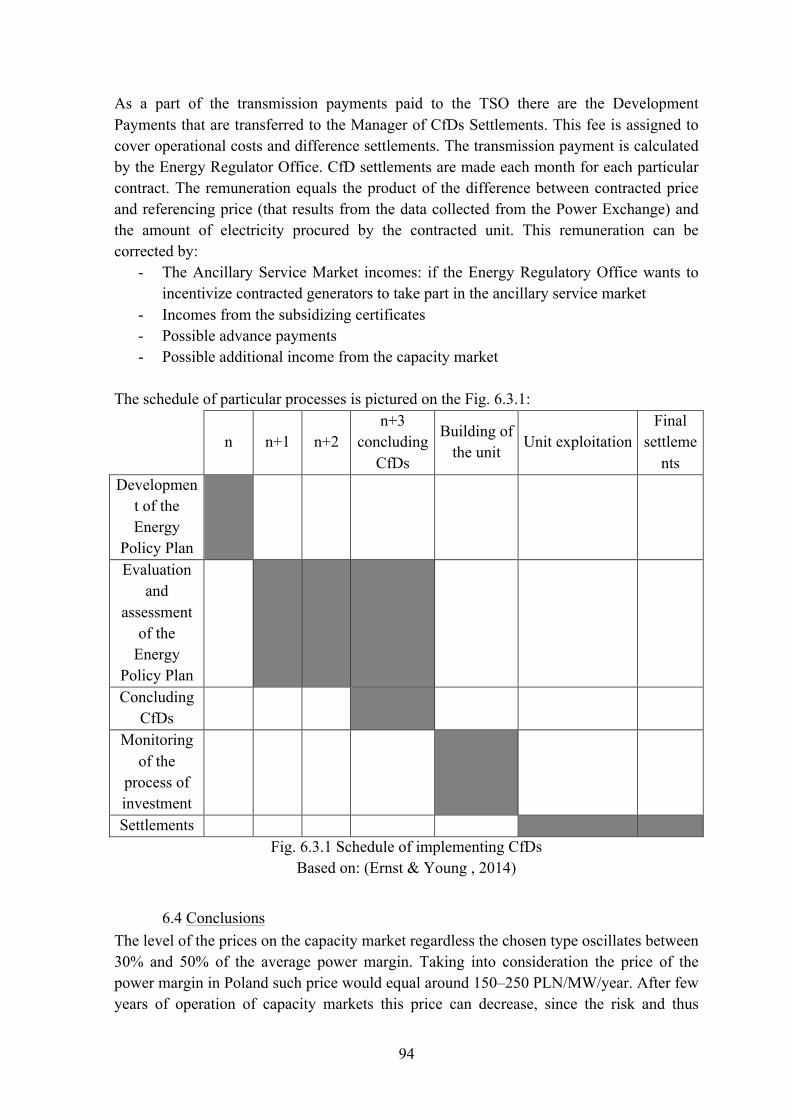
94
As a part of the transmission payments paid to the TSO there are the Development Payments that are transferred to the Manager of CfDs Settlements. This fee is assigned to cover operational costs and difference settlements. The transmission payment is calculated by the Energy Regulator Office. CfD settlements are made each month for each particular contract. The remuneration equals the product of the difference between contracted price and referencing price (that results from the data collected from the Power Exchange) and the amount of electricity procured by the contracted unit. This remuneration can be corrected by:
- The Ancillary Service Market incomes: if the Energy Regulatory Office wants to incentivize contracted generators to take part in the ancillary service market
- Incomes from the subsidizing certificates - Possible advance payments - Possible additional income from the capacity market
The schedule of particular processes is pictured on the Fig. 6.3.1:
n n+1 n+2
n+3 concluding
CfDs
Building of the unit
Unit exploitation Final
settlements
Development of the Energy
Policy Plan
Evaluation and
assessment of the
Energy Policy Plan
Concluding CfDs
Monitoring of the
process of investment
Settlements
Fig. 6.3.1 Schedule of implementing CfDs Based on: (Ernst & Young , 2014)
6.4 Conclusions The level of the prices on the capacity market regardless the chosen type oscillates between 30% and 50% of the average power margin. Taking into consideration the price of the power margin in Poland such price would equal around 150–250 PLN/MW/year. After few years of operation of capacity markets this price can decrease, since the risk and thus
95
investment cost decline. Because the Obliged Parties transfer the capacity obligation costs to the final consumers the latter can positively change their behavior when it comes to electricity consumption. The actual energy only market causes that the price of electricity is flat regardless the overall demand. Such situation causes that the peak demand is constantly growing since there is no stimulus for DSR. When capacity market is introduced, each consumer will have to pay additional fee for the capacity, and thus each consumer will try to reduce his demand in the peak hours because the capacity payments are dependent on the peak demand. (Ernst & Young , 2014) According to many sources (Center for International Relations, 2014) (Keay-Bright, 2013) the capacity market design in each country and particularly in Poland should avoid implementing so called 'vanilla market'. Vanilla market is a term describing those mechanisms in which there is an equal remuneration for all generation regardless their type. Such market can bring fast improvement to the system with missing capacity problem but do not provide resource adequacy. To be able to realize assumed energy policies that prompt the development of particular low carbon dioxide emission generation, the capacity mechanisms should have differentiated remuneration. Vanilla market can lead to overinvestment in cheap, conventional power plants that are not included in the desired energy mix. The opponents of capacity mechanisms claim that such incentives interfere with the competition and bring back the regulation. The supporters of united European market believe that it is possible to avoid all the problems related to the energy only markets by extending the transmission grids and interconnections over larger areas or even across whole Europe. Then, the Polish conventional power stations could operate as peak units and supply neighboring countries in the high demand periods. Such solution however would require the strong development of electricity network and the change of the settlement, subsidizing and EUETS system (if Poland would support the central Europe with cheap electricity from highly emissive sources the costs of emission allowances and subsidies for RES should be somehow divided equally among countries that would purchase Polish electricity). For now, since there is no technical possibility of united European balancing market there is no other way to prompt investments in the new generation than to implement the capacity mechanisms.
96
7 BIBLIOGRAPHY
1. Bandzul, W. (2005). ENERGETYKA WIATROWA W POLSCE - Wpływ
Elektrowni Wiatrowych na Niezawodność Pracy System Elektroenergetycznego.
Elektroenergetyka , 3.la
2. Barroso, L., Cavalcanti, T., Giesbertz, P., & Purchala, K. (2005). Classification of
electricity market models worldwide. New Orleans, LA: IEEE.
3. Bjorndal, E., Bjorndal, M., & Rud, L. (2013). Congestion Management by Dispatch
or Re-dispatch: Flexibility Costs and Market Power Effects. Stockholm: IEEE.
4. Bottin, A. (2014). Bilan énergétique de la France pour 2013. Commissariat général
au développement durable – Service de l'observation et des statistiques, Paris.
5. Britain, G. o. (1989). Electricity Act 1989.
6. Burke, R. (2011). Overview of New England's Wholesale Electricity Markets. ISO
New England. Holyoke: Transactive Energy Workshop.
7. Caramanis, M. (1982). Investment Decisions and Long-term Planning Under
Electricity Spot Pricing. IEEE Transactrions on Power Apaatus and Systems , PAS-
101, 4640-4648.
8. Center for International Relations. (2014). Market Mechanisms for Resource
Adequacy and System Security: Framing the Issues. Warsaw: Center for
International Relations.
9. Chisholm, H. (1911). Radom. W Encyclopædia Britannica (11th ed.). Cambridge
University Press.
10. Chuang, A., & Schwaegerl, C. (2009). Ancillary Services for Renewable
Integratuin. Cigre. Paryż: IEEE Power & Energy Society.
11. Cire. (2007, 04 03). www.cire.pl. Pobrano 06 10, 2015 z lokalizacji
http://www.rynek-energii-elektrycznej.cire.pl
12. Crampes, C., & Léautier, T.-O. (2014). Quis custodiet ipsos custodes? Imperfect
competition and regulation of the electric power industry.
13. de Vries, L. J. (2003). Research Symposium European electricity Markets. The
Instability of Competitive energy-only Electricity Markets. Hague: Delft University
of Technology.
97
14. DECC. (19.03.2015). Contracts for Difference - presentation on the Meeting with
Polish Delegation. London.
15. DECC. (19.03.2015). Electricity Market Reform: Capacity Market - presentation
on the Meeting with Polish Delegation. London.
16. DECC. (2013). Historical electricity data: 1920 to 2013. Part of Electricity
Statistics, London.
17. DECC. (2014). Implementing the Emissions Performance Standard: Further
Interpretation and Monitoring and Enforcement Arrangements in England and
Wales.
18. DECC. (2014). Planning our electric future: a White Paper for secure, affordable
and low-carbon electricity.
19. DECC. (2015). Report: CFD Auction Allocation Round One.
20. Deluga, W. (2013). Grupa Energetyczna Energa na krajowym rynku energii.
Rocznik Ochrona Środowiska , 15, strony 944-965.
21. Ding, F., & Fuller, J. (2013, 03 02). Nodal, Uniform, or Zonal Pricing: Distribution
of Economic Surplus. IEEE TRANSACTIONS ON POWER SYSTEMS , strony 874-
882.
22. E.ON. (2015). Comment aborder la fin des tarifs réglementés de vente ?
Commerciale & Marketing. Paris: E .ON France.
23. EDF. (2015). www.edf.com. Pobrano 06 02, 2015 z lokalizacji
http://presentation.edf.com/presentation.
24. EIA. (2014, 10 02). Pobrano z lokalizacji
http://www.eia.gov/energy_in_brief/article/wind_power.cfm
25. EIA. (2014, 2 18). Pobrano 5 25, 2015 z lokalizacji
http://www.eia.gov/todayinenergy/detail.cfm?id=15051#tabs_SpotPriceSlider-3
26. Energimarknadsinspektionen. (2013). The Swedish Electricity and Natural Gas
Markets 2013. Eskilstuna: Ei.
27. EPEX SPOT. (2015). www.epexspot.com. Pobrano 06 02, 2015 z lokalizacji
http://www.epexspot.com/en/company-info/about_epex_spot:
http://www.epexspot.com/fr
28. Ernst & Young . (2014). Raport z II Fazy Projektu: Możliwości zapewnienia
bezpieczeństwa dostaw energii elektrycznej w Polsce poprzez wprowadzenie
rynków mocy i mechanizmów mocowyc . Łódź.
98
29. Eurostat. (2015, 05). ec.europa.eu. Pobrano 06 14, 2015 z lokalizacji
http://ec.europa.eu/eurostat/statistics-explained/index.php/Energy_price_statistics
30. Glachant, J.-M., & Finon, D. (2003). Competition in European Electricity Markets
A Cross-country Comparison.
31. Gola, S. (2015, 03). Żądanie Mocy. Rynki Energii , strony 18-19.
32. Gola, S. (2015, 04). Z zimną rezerwą. Rynki Energii , 28-29.
33. Grid, N. (19.03.2015). Implementation of the CM and experience gained after the
first auction - presentation on the Meeting with Polish Delegation. London.
34. Gulczyński, D. (2009). Polityke liberalizacji rynku elektroenergetycznego w Polsce
w latach 1989 - 2006. Poznań.
35. Haas, R., Auer, H., & Hartner, M. (2014). On the Future of Electricity Supply.
Competitive Markets or Planned Economies? . International Association for
Energy Economics , 35-37.
36. Harvey, S., & Hogan, W. (2000). Nodal and Zonal Congestion Management and
the Exercise of Market Power. Harvard University, Cambridge.
37. Hunt, S. (2002). Making competition work in electricity. New York .
38. ISO New England. (2014). 2014 Annual Markets Report. ISO New England’s
Internal Market Monitor.
39. ISO New England. (brak daty). iso-ne.com. Pobrano 05 26, 2015 z lokalizacji
http://www.iso-ne.com/markets-operations
40. ISO New England. (2015). New England Power Grid 2014–2015 Profile.
41. Jiménez-Blanco, G., José Menéndez, M., & López, M. (2013). Insights on the
Spanish electricity reform.
42. Joskow, P. (2006). Competitive Electrocoty Markets and Investment in New
Generating Capacity .
43. Joskow, P. (2010). Market Imperfections Versus Regulatory Imperfections. CESifo
DICE .
44. Joskow, P., & Tirole, J. (2004). Retail Electricity Competition. Cambridge:
National Bureau of Economic Research.
45. Kashyap, K. R., & Dheeraj Reedy, B. (2013). Ancillary Serfvices snd Stability
ANanysis of Distributed Generation System. International Journal of Engeneering
Research and Applications , 3, 247-251.
46. Keay-Bright, S. (2013). Capacity Mechanisms For Power System Reliability . RAP.
99
47. Kuntz, F., & Zerrahn, A. (2014). Introduction to European Energy Markets -
presentation on the Infratrain 2014 Autumn School. Berlin.
48. L Schwartz, D. (2012). The Energy Regulation and Markets Review. The Energy
Regulation and Markets Review .
49. Leahy, E., & Tol , R. (2010). An Estimate of the Value of Lost Load for Ireland.
ESRI.
50. Linklaters. (2014). Capacity mechanisms. Reigniting Europe’s energy markets .
London: Linkaters.
51. London Economics. (2013). The Value of Lost Load (VoLL) for Electricity in Great
Britain. Final report for OFGEM and DECC, London.
52. Lovei, L. (2000). The Single-Buyer Model - A Dangerous Path toward Competitive
Electricity Markets. The World Bank, PRIVATE SECTOR AND
INFRASTRUCTURE NETWORK . Waschington: The World Bank.
53. Meulman, L., & Meray, N. (2012). Capacity Mechanisms in Northwest Europe.
Hague: Clingendael International Energy Programme .
54. Mielczarski, W. (2014). Rynki Energii. Łódź.
55. Mielczarski, W. (2000). Rynki Energii Elektrycznej. Wybrane Aspekty Techniczne i
Ekonomiczne. Łódź.
56. Miguelez, E., Cortes, I., Rodriguez, L., & Camino, G. (2008). An Overview of
Ancillary Services in Spain. Electric Power System Research 78 , 515-523.
57. Ministerio de l'Industria, Energia y Turismo. (2013). The Reform of the Spanish
Power System: Towards Financial Stability and Regulatory Certainty. Gobierno de
Espania.
58. Monitoring Analytics, LLC . (2015). State of the Market Report for PJM.
Independent Market Monitor for PJM.
59. Motowidlak, T. (2015, Kwiecień). Ilościowe Rynkowe Systemy Wynagradzania Za
Utrzymywanie Mocy Wytwórczych w Unii Europejskiej. Rynek Energii .
60. National Grid. (2014). Final Auction Results. T-4 Capacity Market Auction 2014 .
61. NIK . (2015). Zapewnienie Mocy Wytwórczych w Elektroenergetyce
Konwencjonalnej. Warszawa: NIK.
62. Ofgem. (2014). Electricity Capacity Assessment Report 2014.
63. Olek, B., & Wierzbowski, M. (2014). Local Energy Balancing and Ancillary
Services in Low Voltage Networks with Distributed Generation, Energy Storage
and Active Loads. IEEE Transactions on Industrial Electronics .
100
64. OMIE. (2015). omel.es. Pobrano 06 02, 2015 z lokalizacji Our electricity markets:
http://www.omel.es/en/home/markets-and-products/electricity-market/our-
electricity-markets
65. Onaiwu, E. (2009). How does bilateral trading differ from electricity pooling?
University of Dundee.
66. Parliament Office of Science and Technology. (brak daty). Electricity Demand-
Side Response . Post Note .
67. Patton, D. (2005). 2004 State of the Markets Report. New York: New York ISO .
68. Piekut, S., Skoczek, S., & Dąbrowski, Ł. (2012). Raport o Rynku Energii
Elektrycznej w Polsce. RWE.
69. PJM. (2015). PJM’s Role as an RTO . Audborn: PJM.
70. PJM. (2014). Reliability Pricing Model. Audubon: PJM.
71. PSE. (2014). Parametry modelu rozliczeń operacyjnej rezerwy mocy dla 2015 roku
. PSE.
72. PSE S.A. (2015). pse.pl. Pobrano 06 10, 2015 z lokalizacji
http://www.pse.pl/index.php?dzid=115&did=581
73. PSE S.A. (2014). Raport Roczny 2013. Konstancin-Jeziorna.
74. PSE. (2015). www.pse.pl. Pobrano 06 10, 2015 z lokalizacji
http://www.pse.pl/index.php?dzid=83
75. RAP. (2011). Electricity Regulation In the US: A Guide . Vermont.
76. Rebours, Y., Kirschen, D., Trotignon, M., & Rossignol, S. (2007). A Survey of
Frequency and Voltage Control Ancillary Services—Part I: Technical Features.
IEEE Transactions on Power Systems , 22, 350-357.
77. Regulatory Commission for Electricity and Gas . (2012). ‘capacity remuneration
mechanisms’ . Brussels: CREG.
78. RTE. (2015). Bilan électrique 2014. RTE Réseau de transport d’électricité. Paris:
Direction Économie Prospective et Transparence.
79. RTE. (2014). FRENCH CAPACITY MARKET Report accompanying the draft
rules. Paris: RTE Réseau de transport d’électricité.
80. RTE. (2011). Rapport ������au Ministre chargé de l'Industrie, de l'Energie et
de l'Economie numérique sur la mise en place du mechanisme d'obligation de
capacité prévu par la loi NOME. Paris: RTE Réseau de Transport d'Électricité.
81. Scherer, M., Zima, M., & Andersson, G. (2013). An integrated pan-European
ancillary services market for frequecy controll. Energy Policy , 62, 290-300.
101
82. Sejm Rzeczpospolitej Polskiej. (1997). Ustawa z dnia 10 kwietnia 1997 r. - Prawo
energetyczne.
83. Shahidehpour, M., Yamin, H., & Li, Z. (brak daty). MARKET OPERATIONS
IN ELECTRIC POWER SYSTEMS Forecasting, Scheduling, and Risk
Management. New York: A JOHN WILEY & SONS, INC.
84. Sherer, J. (2010). The US Electric Grid. Stanford: Stanford University.
85. Sustainable Ferc Project. (2013, 12). sustainableferc.com. Pobrano 06 21, 2015 z
lokalizacji http://sustainableferc.org/rethinking-electricity-capacity-markets/
86. Svenska kraftnät. (2011). The electricity market in Sweden and the role of Svenska
kraftnät. Svenska kraftnät.
87. Tennbakk et al. . (2013). Capacity Mechanisms in Individual Markets Within the
IEM. Thema Consulting Group, E3M-Lab. Brussels: COWI Belgium sprl.
88. The Regulatory Assistance Project . (2011). Electricity Regulations in the US: a
Guide. Vermont: RAP.
89. Thermal Working Group. (2004). Ancillary Services Unbundling Electricity
Products – an Emerging Market . Brussels: Union of the Electricity Industry -
EUELECTRIC.
90. Triggianese, M., Liccardo, F., & Marino, P. (2007). Ancillary Services performed
by Distributed Generation in grid integration. International Conference on Clean
Electrical Power , 164-170.
91. U.S. Energy Information Administration. (2015). Monthly Energy Review April
2015. Washington, DC: U.S. Energy Information Administration.
92. URE. (2011). ure.gov.pl. Pobrano 06 10, 2015 z lokalizacji
http://www.ure.gov.pl/pl/poradnik-odbiorcy/4766,Poradnik-dla-Odbiorcow-
Energii-i-Paliw-Gazowych.html
93. Wierzbowski, M. (2013). Optimization of distribution electrical networks in the
modern power systems . Lodz.
94. Wikipedia. (2015, 5 14). http://en.wikipedia.org/wiki/United_States. Pobrano 5 20,
2015 z lokalizacji http://en.wikipedia.org.
95. World Energy Council. (2015). worldenergy.org. Pobrano 06 09, 2015 z lokalizacji
https://www.worldenergy.org/data/trilemma-index/country/sweden/2014/
96. Zhenyu, F., Horger, T., & Bastian, J. (2010). Current and emerging challenges in
PJM energy market. Transmission and Distribution Conference and Exposition ,
1-7.
102
8 SUMMARY In this master's thesis there is an overview of possible energy market structures and possible capacity mechanisms that are being applied across the World. It is explained why the problem of 'missing money' and 'missing capacity' is so common in energy-only markets. In addition there is a description of particular energy systems (PJM, New England, France, United Kingdom, Spain and Sweden) that introduced capacity mechanisms and the overview of those mechanisms. The Polish energy sector and energy market is described comprehensively. At the end of this thesis there are proposals of possible capacity mechanisms that can be implemented in Poland to improve system reliability and resource adequacy (centralized capacity market, decentralized capacity market and contracts for differences).
8 STRESZCZENIE W tej pracy magisterskiej opisane zostały możliwe struktury rynków energii i mechanizmów zapewnienia zdolności wytwórczych które zostały wdrożone w rożnych krajach na całym świecie. Zostało wyjaśnione, dlaczego w rynkach tylko energii pojawia się̨ problem ,,brakujących przychodów" i ,,brakujących zdolności wytwórczych". Następnie przedstawione są wybrane systemy rynkowe (PJM, Nowa Anglia, Wielka Brytania, Hiszpania i Szwecja), które mają płatności za zapewnione zdolności wytwórcze oraz opis tych mechanizmów. Obszerniej jest opisany Polski system elektroenergetyczny. Na końcu wymienione są możliwe do wprowadzenia mechanizmy mocowe, które mogłyby poprawić niezawodność systemu oraz zapewnić elektryczność ze zróżnicowanych źródeł (zcentralizowany rynek mocy, zdecentralizowany rynek mocy i kontrakty różnicowe).