www.gaston.edu multiple measures of placement. objectives define multiple measures of placement...
TRANSCRIPT

www.gaston.edu
Multiple Measures of Placement

www.gaston.edu
Objectives
• Define Multiple Measures of Placement• Gaston College Implementation• Implementation Results• Intervention Strategies• Next Steps

www.gaston.edu
What is Multiple Measures of Placement?
• NCCCS state wide policy
• Implementation began as early as Fall 2013
• Full implementation within NCCCS by Fall 2015
• Within this new policy, there is a hierarchal approach to determine readiness for college-level courses
• Policy based on research completed by the Community College Research Center at Columbia University

www.gaston.edu
Multiple Measures of Placement Hierarchy
1. Unweighted high school GPA of 2.6 or higher and completion of four eligible math courses
2. ACT or SAT test scores
3. Placement testing

www.gaston.edu
What Does a High School GPA of 2.6 or Greater Mean?• Student is considered college ready for any
gateway math course, ENG 111, and any course with developmental prerequisites.
• Students with a GPA under 3.0 may be required by individual colleges to complete a supplemental lab as a co-requisite for ENG 111, MAT 143, MAT 152, MAT 161, or MAT 171.

www.gaston.edu
Gaston College’s Initial Concerns
• No prereq’s = overrides
• Advisors and faculty would have to be trained on reviewing high school transcripts
• Who should be eligible? Only new students? Or new and returning?
• What about students from private schools, home schools, or out of state schools?

www.gaston.edu
Gaston College’s Solution• Set up process for entry that gives Non-Course
(NC) credit in STAC• Created “Other Test” using the NONC screen in
Colleague so that GPA can be entered as a test.• A score range of 26 to 40 will populate all non-
course credit for developmental classes– For example, 2.6 unweighted GPA is keyed as a test score
of 26• After examining a high school transcript and
inputting GPA in TSUM, credit for all developmental courses is automatically assigned.

www.gaston.edu
NONC

www.gaston.edu
NONE

www.gaston.edu
Multiple Measures Implementation
• Admissions staff manually review high school transcript for unweighted GPA of 2.6 or higher (no rounding)– For students who apply and submit a high school transcript before they
graduate, will consider unweighted GPA at end of 1st semester of senior year.
• Review high school transcript for completed math courses– Must have FOUR COMPLETE math courses
1. Algebra I 2. Geometry 3. Algebra II 4. One additional math from the NCCCS approved list of eligible high school math courses (Technical Corrections to the Multiple Measures for Placement Policy NCCCS Memo – 4.14.14)

www.gaston.edu
And the Results Are
In….

www.gaston.edu
MAT 101: Applied Mathematics I(Fall 2013, Spring 2014, Summer 2014)
SAT/ACT Dev Ed Placement Test HS GPA
Fall 2013 1 0.8 0.875 0
Spring 2014 0 0.6667 0.8333 0
Summer 2014 0 1 0.8 1
10.00%
30.00%
50.00%
70.00%
90.00%
110.00%
MAT 101 Success Rates by Placement
Perc
ent S
ucce
ssfu
l

www.gaston.edu
MAT 101: Applied Mathematics I(Fall 2013, Spring 2014, Summer 2014)

www.gaston.edu
MAT 110: Math Measurement and Literacy
(Fall 2014)
SAT/ACT Dev Ed Placement Test HS GPA
Fall 2014 0 1 0.6 0.5
10.00%
30.00%
50.00%
70.00%
90.00%
110.00%
MAT 110 Success Rates by Placement
Perc
ent S
ucce
ssfu
l

www.gaston.edu
MAT 110: Math Measurement and Literacy
(Fall 2014)

www.gaston.edu
MAT 121: Algebra & Trigonometry I(Fall 2013, Spring 2014, Fall 2014)
SAT/ACT Dev Ed Placement Test HS GPA
Fall 2013 0.5556 0.5556 0.2857 0.625
Spring 2014 0.8 0.6429 0.4167 0.1667
Fall 2014 0.4 0.7059 0.375 0.4286
5.00%
15.00%
25.00%
35.00%
45.00%
55.00%
65.00%
75.00%
85.00%
MAT 121 Success Rates by Placement
Perc
ent S
ucce
ssul

www.gaston.edu
MAT 121: Algebra & Trigonometry I(Fall 2013, Spring 2014, Fall 2014)

www.gaston.edu
MAT 140: Survey of Mathematics(Fall 2013, Spring 2014, Summer 2014)
SAT/ACT Dev Ed Placement Test HS GPA
Fall 2013 1 0.6907 0.7917 0.6364
Spring 2014 0.8 0.5529 0.6818 0.65
Summer 2014 1 0.68 0.5 1
10.00%
30.00%
50.00%
70.00%
90.00%
110.00%
MAT 140 Success Rates by Placement
Perc
ent S
ucce
ss

www.gaston.edu
MAT 140: Survey of Mathematics(Fall 2013, Spring 2014, Summer 2014)

www.gaston.edu
MAT 143: Quantitative Literacy(Fall 2014)
SAT/ACT Dev Ed Placement Test HS GPA
Fall 2014 1 0.6774 0.7857 0.6098
10.00%
30.00%
50.00%
70.00%
90.00%
110.00%
MAT 143 Success Rates by Placement
Perc
ent S
ucce
ss

www.gaston.edu
MAT 143: Quantitative Literacy(Fall 2014)

www.gaston.edu
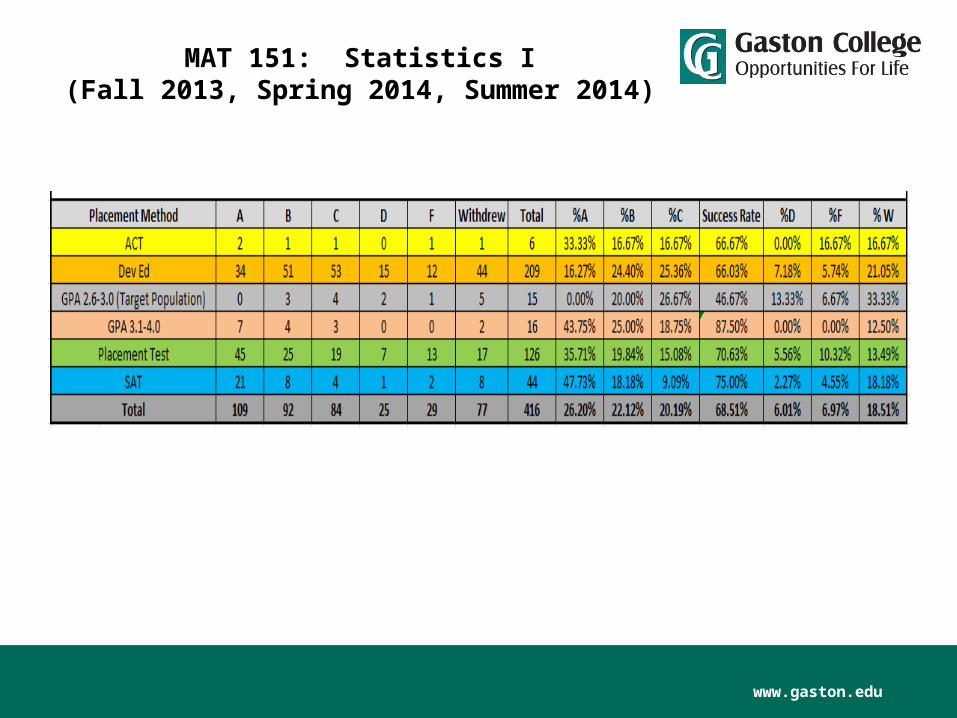
MAT 151: Statistics I(Fall 2013, Spring 2014, Summer 2014)
SAT/ACT Dev Ed Placement Test HS GPA
Fall 2013 0.7778 0.7 0.6757 0.6
Spring 2014 0.8182 0.6707 0.7407 0.7647
Summer 2014 0.5 0.5357 0.6857 0.625
5.00%
15.00%
25.00%
35.00%
45.00%
55.00%
65.00%
75.00%
85.00%
MAT 151 Success Rates by Placement
Perc
ent S
ucce
ss
www.gaston.edu
MAT 151: Statistics I(Fall 2013, Spring 2014, Summer 2014)

www.gaston.edu
MAT 152: Statistical Analysis I(Fall 2014)
SAT/ACT Dev Ed Placement Test HS GPA
Fall 2014 0.375 0.8382 0.5789 0.7857
5.00%
15.00%
25.00%
35.00%
45.00%
55.00%
65.00%
75.00%
85.00%
MAT 152 Success Rates by PlacementPe
rcen
t Suc
cess

www.gaston.edu
MAT 152: Statistical Analysis I(Fall 2014)

www.gaston.edu
MAT 171: Precalculus Algebra(Fall 2013, Spring 2014, Summer 2014, Fall 2014)
Fall 2013 Spring 2014 Summer 2014 Fall 2014
SAT/ACT 0.6585 0.619 0.8333 0.66
Dev Ed 0.5874 0.5294 0.5 0.5812
Placement Test 0.7143 0.5 0.5 0.5897
HS GPA 0.5512 0.4773 0.875 0.7333
5.00%
15.00%
25.00%
35.00%
45.00%
55.00%
65.00%
75.00%
85.00%
95.00%
MAT 171 Success Rates by Placement
Perc
ent S
ucce
ss

www.gaston.edu
MAT 171: Precalculus Algebra(Fall 2013, Spring 2014, Summer 2014, Fall 2014)
www.gaston.edu
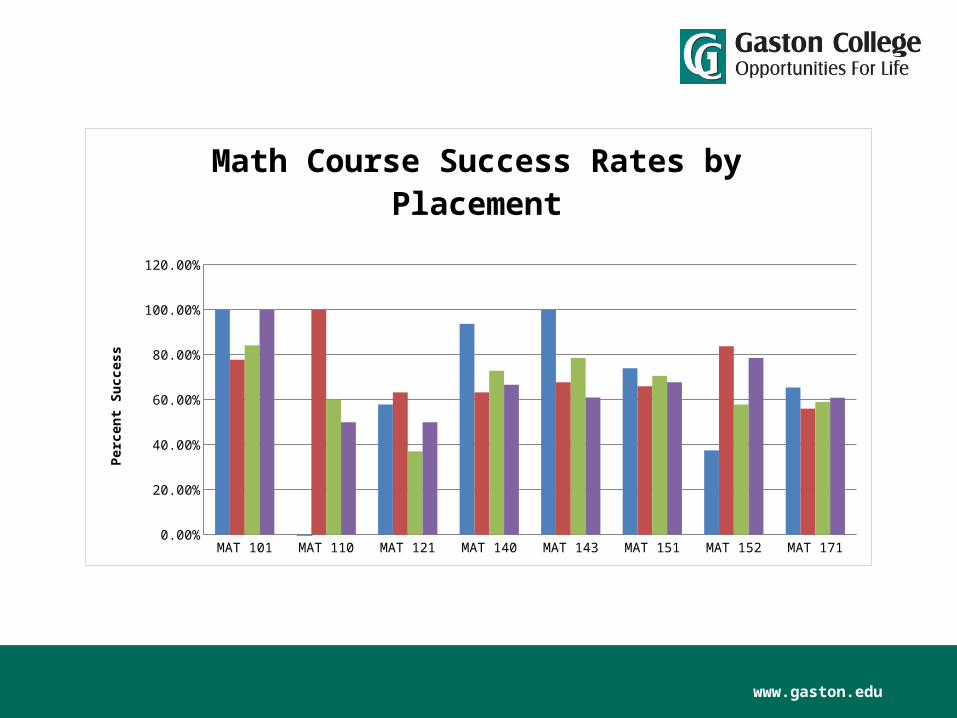
MAT 101 MAT 110 MAT 121 MAT 140 MAT 143 MAT 151 MAT 152 MAT 171
SAT/ACT 1 0 0.5789 0.9375 1 0.74 0.375 0.6547
Dev Ed 0.7778 1 0.6327 0.6329 0.6774 0.6603 0.8382 0.5607
Placement Test 0.8421 0.6 0.3704 0.7292 0.7857 0.7063 0.5789 0.5901
HS GPA 1 0.5 0.5 0.6667 0.6098 0.6774 0.7857 0.6089
10.00%
30.00%
50.00%
70.00%
90.00%
110.00%
Math Course Success Rates by PlacementPe
rcen
t Suc
cess

www.gaston.edu
Summary Comparing HS GPA 2.6-3.0 to HS GPA 3.1-4.0
MAT 101 MAT 110 MAT 121 MAT 140 MAT 143 MAT 151 MAT 152 MAT 171
GPA 2.6-3.0 0 0 0.375 0.5294 0.6 0.4667 0.6667 0.4626
GPA 3.1-4.0 1 0.5 0.65 0.8696 0.625 0.875 0.8333 0.7109
10.00%
30.00%
50.00%
70.00%
90.00%
110.00%
Math Course Success Rates by HS GPA
Perc
ent S
ucce
ss
www.gaston.edu
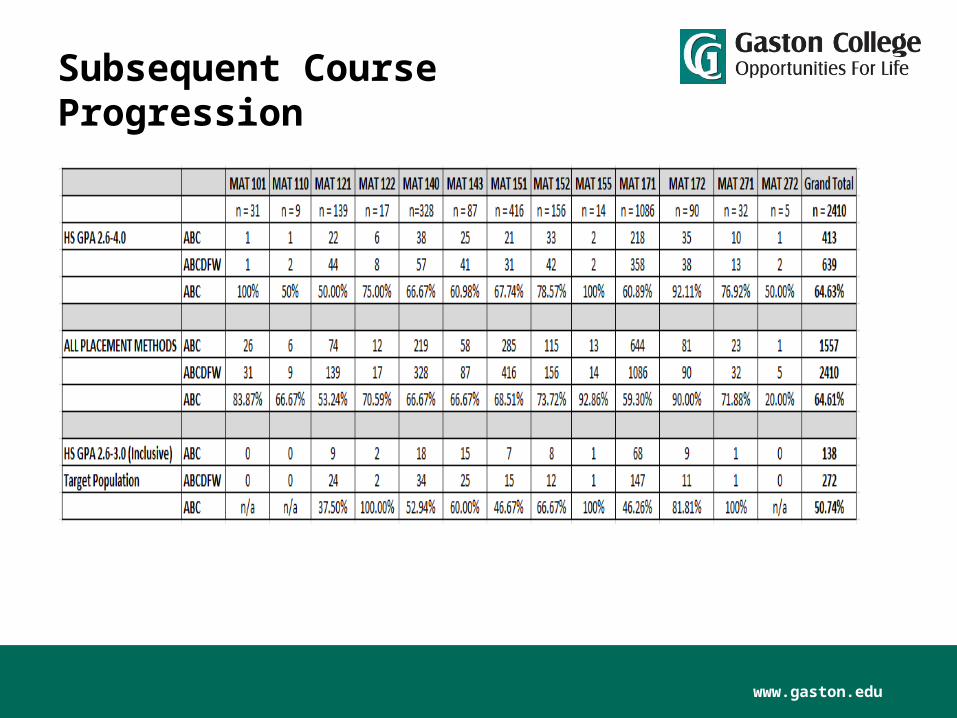
Subsequent Course Progression

www.gaston.edu
ENG 111: Writing and Inquiry(Fall 2013, Spring 2014,
Summer 2014, Fall 2014)
Fall 2013 Spring 2014 Summer 2014 Fall 2014
SAT/ACT 0.6 0.6304 0.6667 0.6842
Dev Ed 0.6603 0.5622 0.7297 0.6818
Placement Test 0.6979 0.6255 0.7949 0.7105
HS GPA 0.8287 0.7016 0.8571 0.7533
5.00%
15.00%
25.00%
35.00%
45.00%
55.00%
65.00%
75.00%
85.00%
ENG 111 Success Rates by Placement
Perc
ent S
ucce
ss

www.gaston.edu
ENG 111: Writing and Inquiry(Fall 2013, Spring 2014,
Summer 2014, Fall 2014)

www.gaston.edu
Summary Comparing HS GPA 2.6-3.0 to HS GPA 3.1-4.0
Fall 2013 Spring 2014 Summer 2014 Fall 2014
GPA 2.6-3.0 0.7532 0.5942 0.6667 0.6609
GPA 3.1-4.0 0.8873 0.8364 0.9091 0.8325
5.00%
15.00%
25.00%
35.00%
45.00%
55.00%
65.00%
75.00%
85.00%
95.00%
ENG 111 Success Rates by HS GPA
Perc
ent S
ucce
ss

www.gaston.edu
Subsequent Course Progression

www.gaston.edu
Summary Points
• Students with an unweighted HS GPA between 2.6-3.0 do not have as high of a success rate as students with an unweighted HS GPA between 3.1-4.0 in curriculum level math classes.
• Students with an unweighted HS GPA between 2.6-3.0 have similar success rates as students with an unweighted HS GPA between 3.1-4.0 in English 111.

www.gaston.edu
Multiple Measures of Placement Research
StudyAs a result of our early implementation of the Multiple Measures of Placement policy and our participation as a CBD school we were selected as one of six community colleges to participate in a MMP Research Study Grant provided by the Gates foundation to implement and evaluate success strategies for student with an unweighted HS GPA between 2.6-3.0, known as the target population.

www.gaston.edu
Intervention Strategies for Target Population• Require MAT 001P: Math Skills Support for all
student in the target population who register for MAT 171: Precalculus Algebra
• Require MAT 001S: Math Skills Support for all students in the target population who register for MAT 152: Statistical Analysis I
• Students in the target population are not allowed to take the MAT 171 or MAT 152 courses online

www.gaston.edu
Additional Support Strategies
• Professional Tutoring• Peer Tutoring• Group Tutoring• Targeted Workshops
All support strategies are open to all students regardless of placement method.

www.gaston.edu
QUESTIONS?