working while learning or learning while working ? aviad tur-sinai dmitri romanov noam zussman march...
TRANSCRIPT
Working While Learning or Learning
While Working ?
Aviad Tur-Sinai
Dmitri Romanov
Noam Zussman
March 11, 2008
SubjectSubject
• Paper investigates empirically whether employment during academic study effects the duration of study and the likelihood of dropping out.
• Takes advantage of a comperhensive individual-level dataset constructed from administrative files and records – of candidates, students, and recipients of bachelor’s degrees.
Main FindingsMain Findings
• The relationship between the extent of students’ employment and duration of their studies depends on their age:
– Among students aged 22-26 at the beginning of their studies, the extent of employment has no effect on the duration of studies.
– Among the older students there is a strong positive effect.
Motivation for Study Motivation for Study (1)(1)
• Employment is common among first-degree students who come from diverse socioeconomic backgrounds and pursue various academic diciplines. It has considerable implications for the students’ economic situation and on access to the higher-education system and their patterns of study.

Motivation for Study Motivation for Study (2)(2)
• Clashing conclusions via the literature:
– Brunello and Winter-Ember (2003):
Employment of students in Europe had no significant effect on the duration of study.
– Ehrenberg and Sherman (1987):
Employment of male students during the semester prolonged their degree studies and raised their dropout rates.
Motivation for Study Motivation for Study (3)(3)
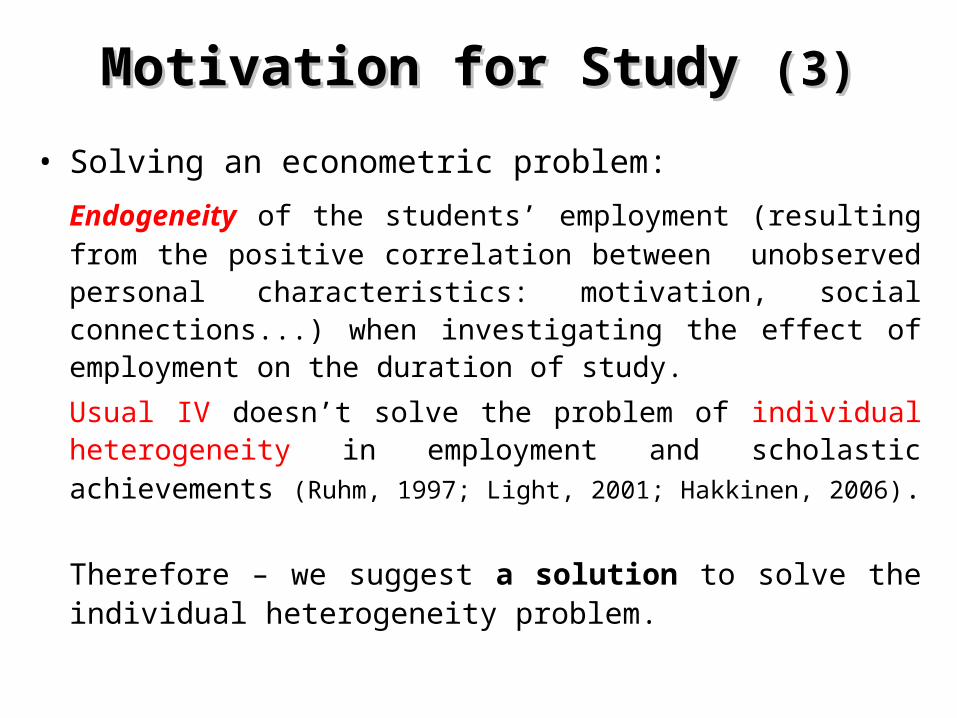
• Solving an econometric problem:
Endogeneity of the students’ employment (resulting from the positive correlation between unobserved personal characteristics: motivation, social connections...) when investigating the effect of employment on the duration of study.
Usual IV doesn’t solve the problem of individual heterogeneity in employment and scholastic achievements (Ruhm, 1997; Light,
2001; Hakkinen, 2006).
Therefore – we suggest a solution to solve the individual heterogeneity problem.
The DataThe Data::
Administrative records of first-degree students at higher education institutions in Israel - who began their studies in the 1999/2000 academic year.
The DataThe Data::
EducationFor each first-degree student (6 years follow-up):
– Preferences for institutions. – Fields of study at the time of enrollment.– The progression of studies: institution(s),
subjects completed.– Scholastic abilities.
The DataThe Data::
Employment and earning:
Matched employee-employer for the years
1999-2005 :– Number of months worked.– Annual gross earnings.– Tenure of employment with employer.
The DataThe Data::
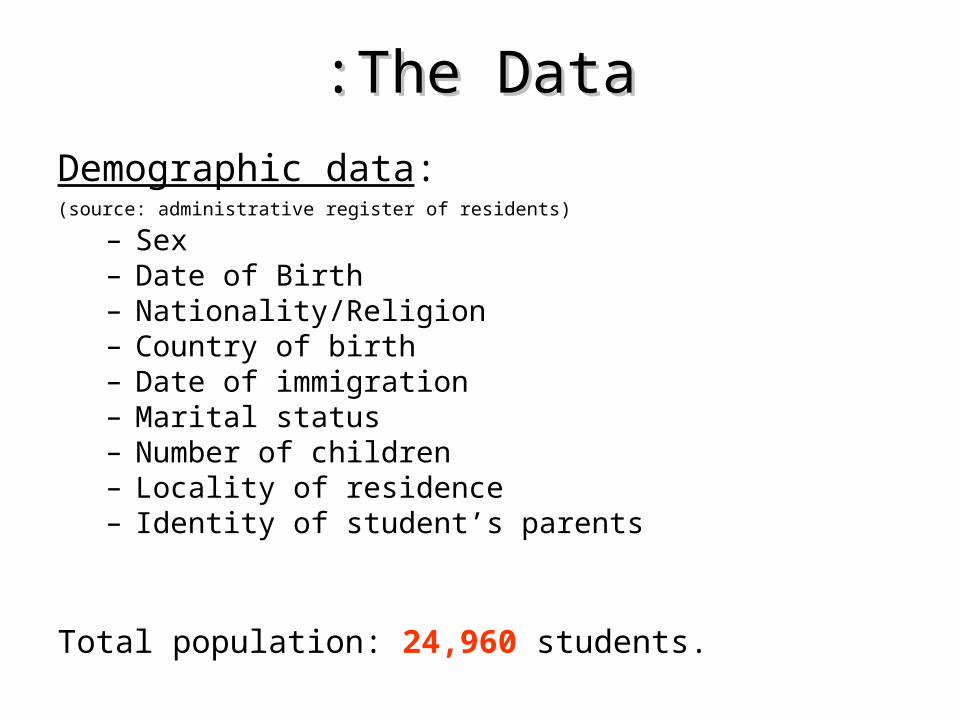
Demographic data: (source: administrative register of residents)
– Sex– Date of Birth– Nationality/Religion– Country of birth– Date of immigration– Marital status– Number of children– Locality of residence– Identity of student’s parents
Total population: 24,960 students.
Progression of Studies
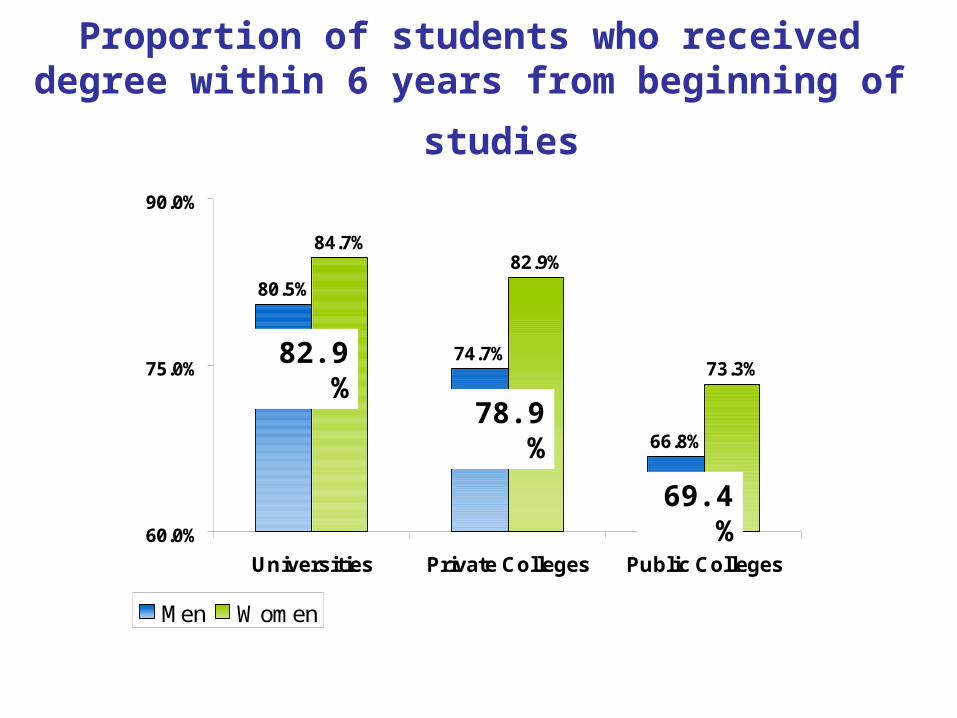
Proportion of students who received degree within
6 years from beginning of studies
80.5%
74.7%
66.8%
84.7%82.9%
73.3%
60.0%
75.0%
90.0%
Universities Private Colleges Public Colleges
Men Women
82.9%
78.9%
69.4%
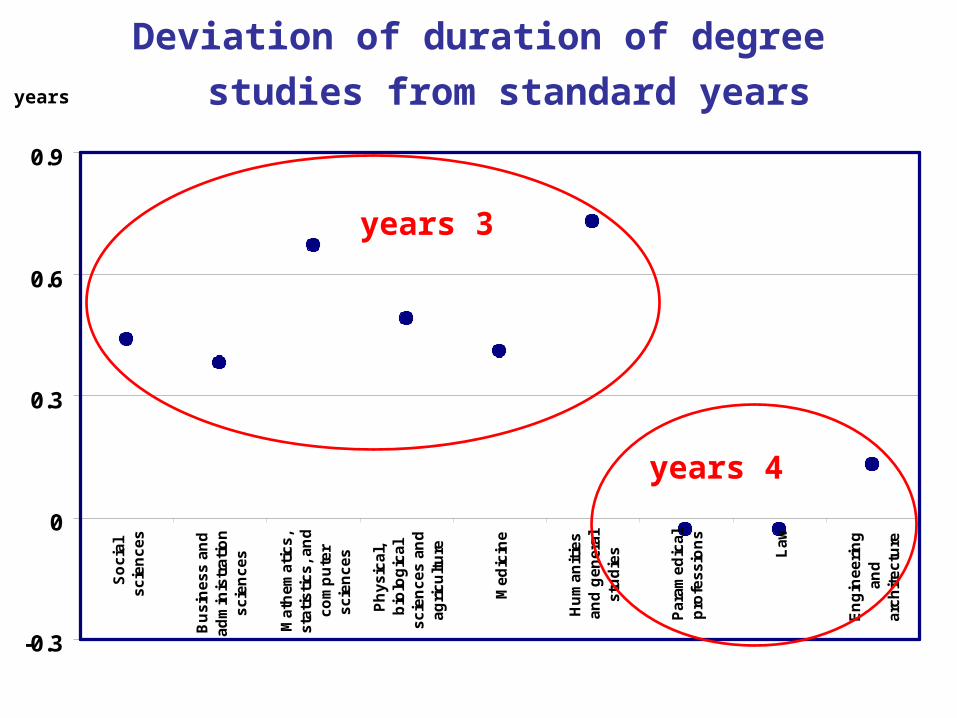
Deviation of duration of degree studies from
standard years
-0.3
0
0.3
0.6
0.9
So
cia
ls
cie
nc
es
Bu
sin
es
s a
nd
ad
min
istr
ati
on
sc
ien
ce
s
Ma
the
ma
tic
s,
sta
tis
tic
s,
an
dc
om
pu
ter
sc
ien
ce
s
Ph
ys
ica
l,b
iolo
gic
al
sc
ien
ce
s a
nd
ag
ric
ult
ure
Me
dic
ine
Hu
ma
nit
ies
an
d g
en
era
ls
tud
ies
Pa
ram
ed
ica
lp
rofe
ss
ion
s
La
w
En
gin
ee
rin
ga
nd
arc
hit
ec
ture
3 years
4 years
years
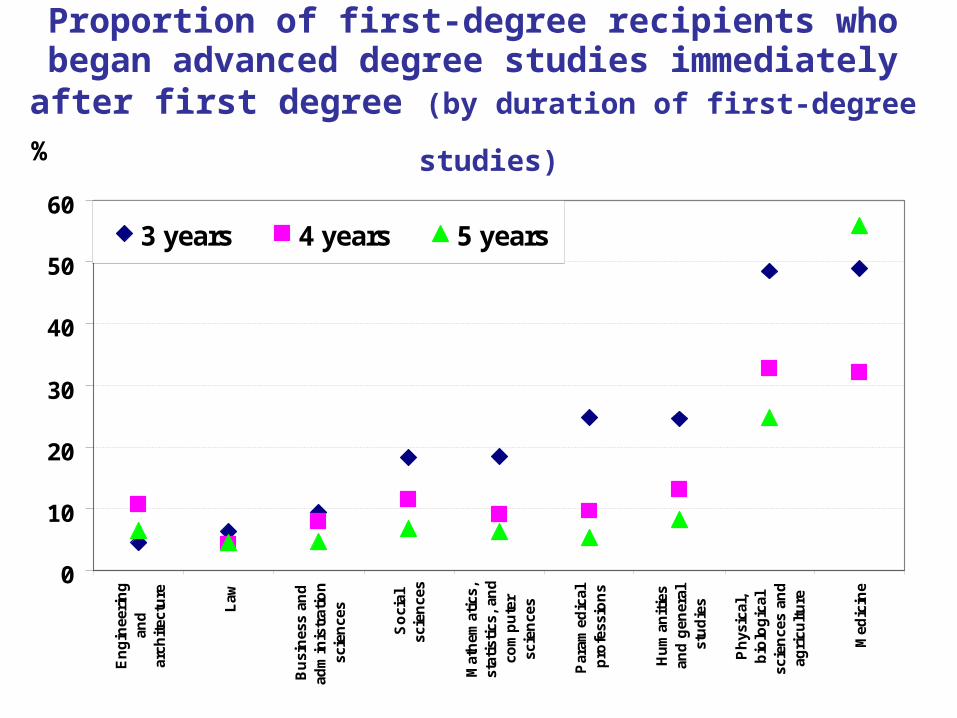
Proportion of first-degree recipients who began advanced degree studies immediately after first degree
(by duration of first-degree studies) %
0
10
20
30
40
50
60
En
gin
eeri
ng
and
arch
itec
ture
Law
Bu
sin
ess
and
adm
inis
trat
ion
scie
nce
s
So
cial
scie
nce
s
Mat
hem
atic
s,st
atis
tics
, an
dco
mp
ute
rsc
ien
ces
Par
amed
ical
pro
fess
ion
s
Hu
man
itie
san
d g
ener
alst
ud
ies
Ph
ysic
al,
bio
log
ical
scie
nce
s an
dag
ricu
ltu
re
Med
icin
e
3 years 4 years 5 years

Employment
Measuring Rate of employment & Earnings
Rate of employment– A work load index.– Represented by the proportion of employee-wage
months in the course of the year out of twelve months.
Earnings– Annual earnings from all working places.– No. of months worked during the year.
Therefore: we can derive the average monthly wage.
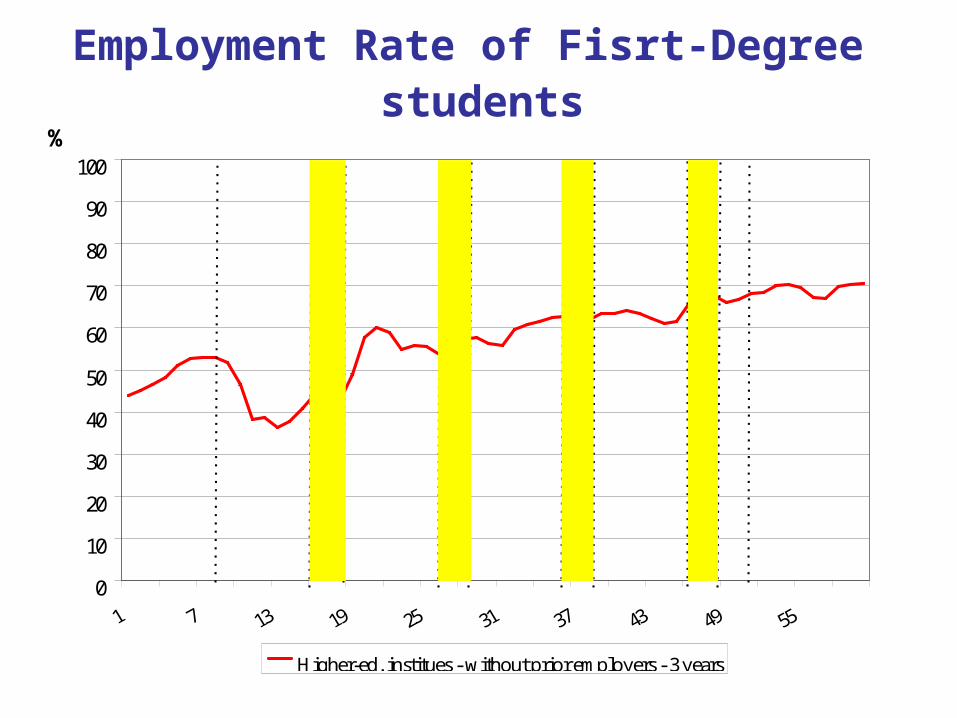
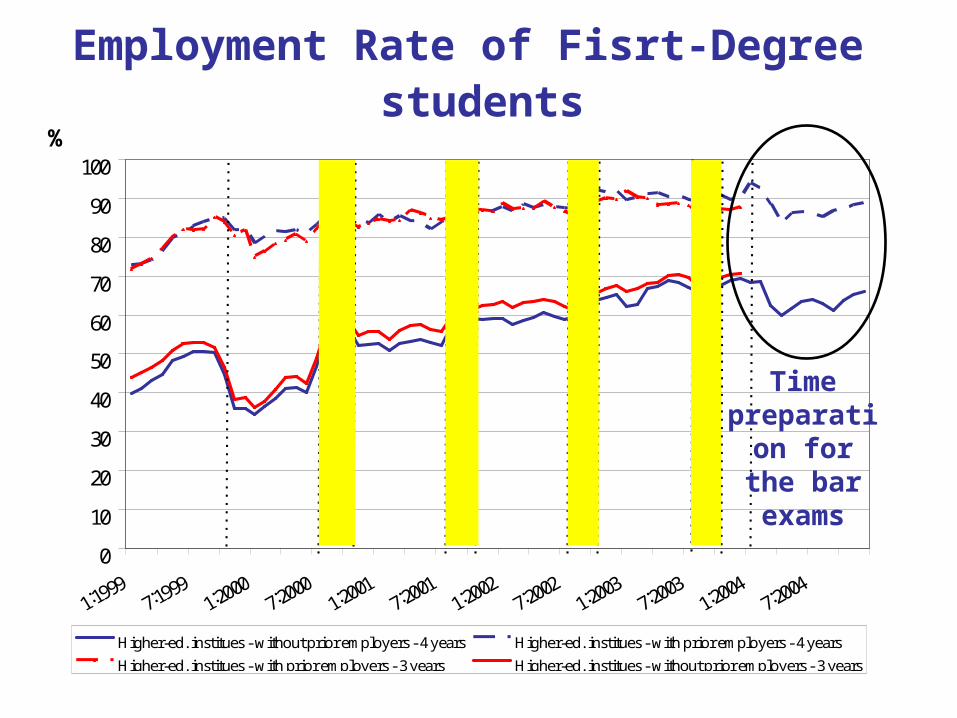
Employment Rate of Fisrt-Degree students %
0
10
20
30
40
50
60
70
80
90
100
Higher-ed. institues - without prior employers - 3 years
Year 1 Year 2 Year 3 Year 4
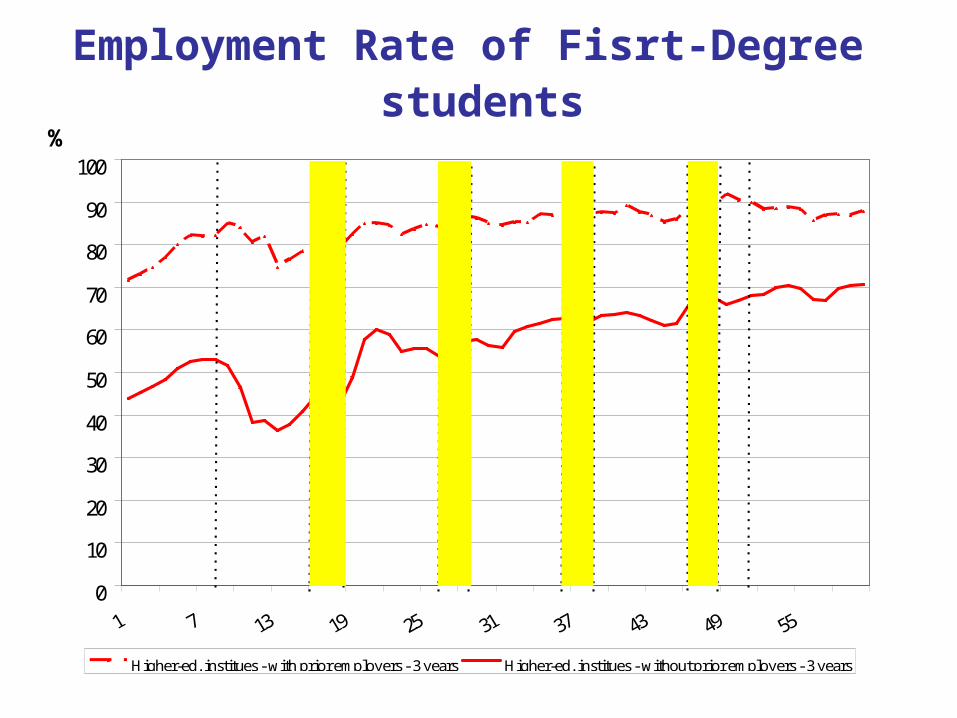
Employment Rate of Fisrt-Degree students %
0
10
20
30
40
50
60
70
80
90
100
Higher-ed. institues - with prior employers - 3 years Higher-ed. institues - without prior employers - 3 years
Year 1 Year 2 Year 3 Year 4
Employment Rate of Fisrt-Degree students %
0
10
20
30
40
50
60
70
80
90
100
Higher-ed. institues - without prior employers - 4 years Higher-ed. institues - with prior employers - 4 years
Higher-ed. institues - with prior employers - 3 years Higher-ed. institues - without prior employers - 3 years
Year 1 Year 2 Year 3 Year 4
Time preparation for the bar
exams

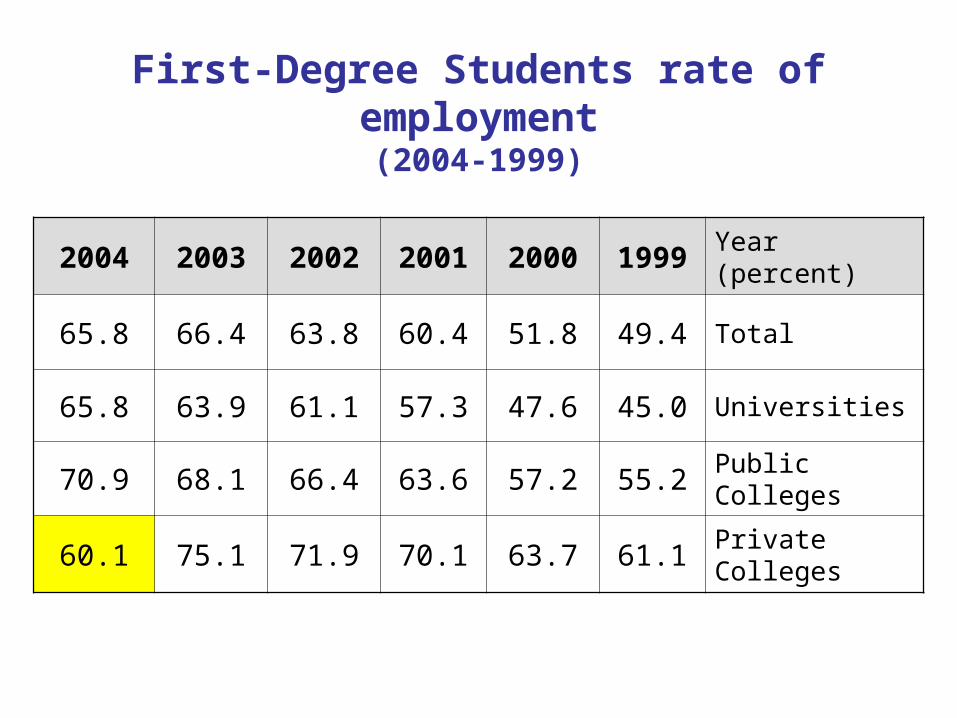
First-Degree Students rate of employment(2004-1999)
Year (percent)199920002001200220032004
Total49.451.860.463.866.465.8
Universities45.047.657.361.163.965.8
Public Colleges55.257.263.666.468.170.9
Private Colleges61.163.770.171.975.160.1
First-Degree Students rate of employment(2004-1999)
Year (percent)199920002001200220032004
Total49.451.860.463.866.465.8
Universities45.047.657.361.163.965.8
Public Colleges55.257.263.666.468.170.9
Private Colleges61.163.770.171.975.160.1
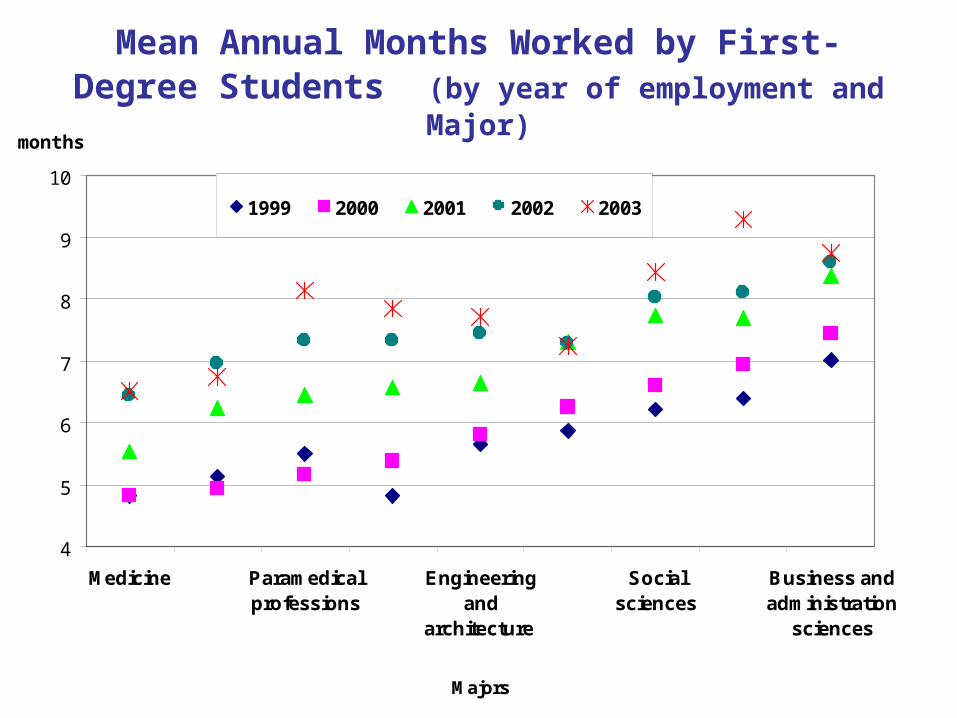
Mean Annual Months Worked by First-Degree Students (by year of employment and Major)
4
5
6
7
8
9
10
Medicine Paramedicalprofessions
Engineeringand
architecture
Socialsciences
Business andadministration
sciences
Majors
1999 2000 2001 2002 2003
months

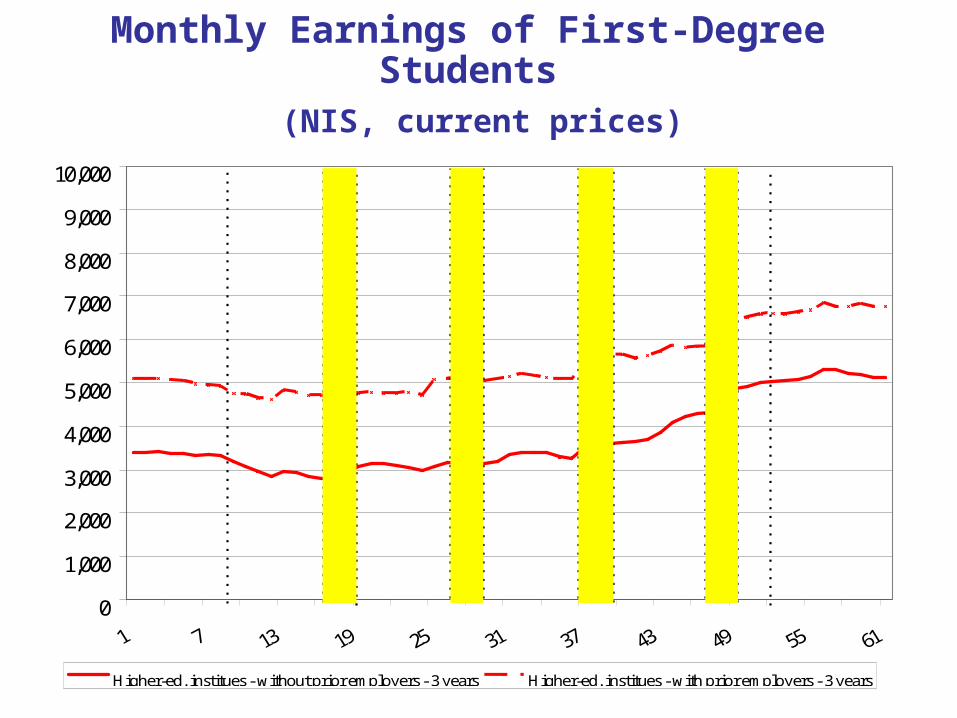
Earnings

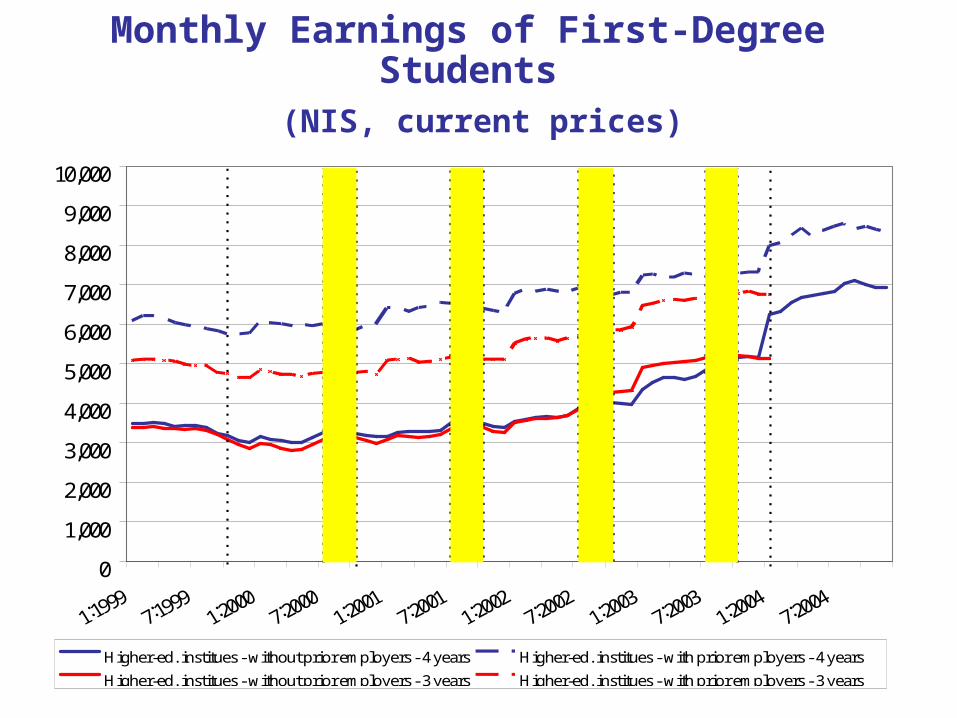
Monthly Earnings of First-Degree Students (NIS, current prices)
0
1,000
2,000
3,000
4,000
5,000
6,000
7,000
8,000
9,000
10,000
Higher-ed. institues - without prior employers - 3 years
Year 1 Year 2 Year 3 Year 4
Monthly Earnings of First-Degree Students (NIS, current prices)
0
1,000
2,000
3,000
4,000
5,000
6,000
7,000
8,000
9,000
10,000
Higher-ed. institues - without prior employers - 3 years Higher-ed. institues - with prior employers - 3 years
Year 1 Year 2 Year 3 Year 4
Monthly Earnings of First-Degree Students (NIS, current prices)
0
1,000
2,000
3,000
4,000
5,000
6,000
7,000
8,000
9,000
10,000
Higher-ed. institues - without prior employers - 4 years Higher-ed. institues - with prior employers - 4 years
Higher-ed. institues - without prior employers - 3 years Higher-ed. institues - with prior employers - 3 years
Year 1 Year 2 Year 3 Year 4
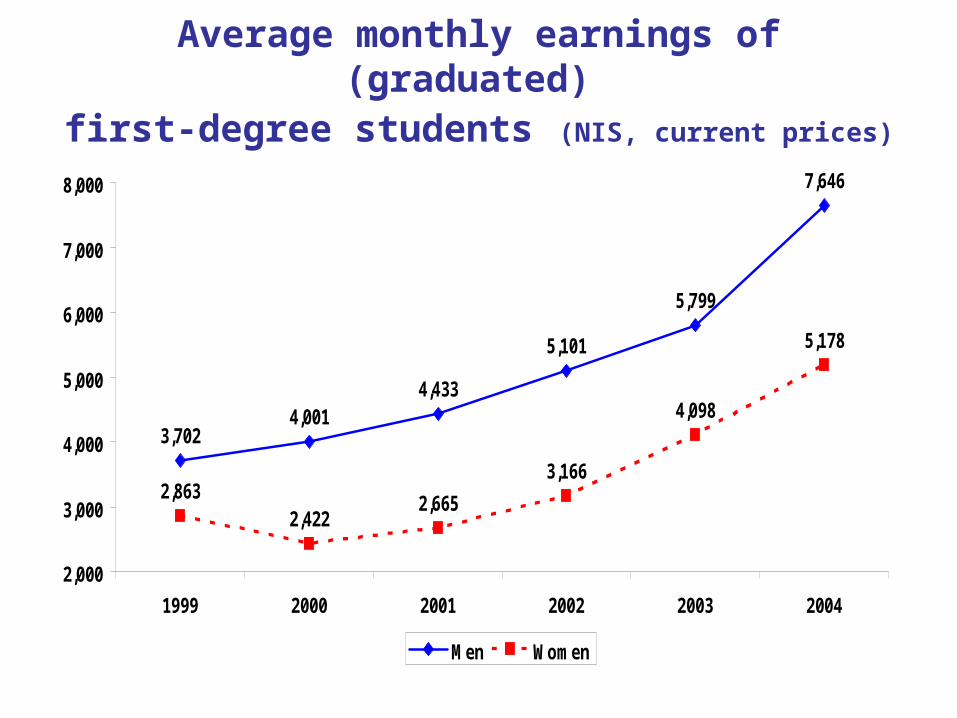
Average monthly earnings of (graduated) first-degree students (NIS, current prices)
3,7024,001
4,433
5,101
5,799
7,646
2,8632,422
2,665
3,166
4,098
5,178
2,000
3,000
4,000
5,000
6,000
7,000
8,000
1999 2000 2001 2002 2003 2004
Men Women
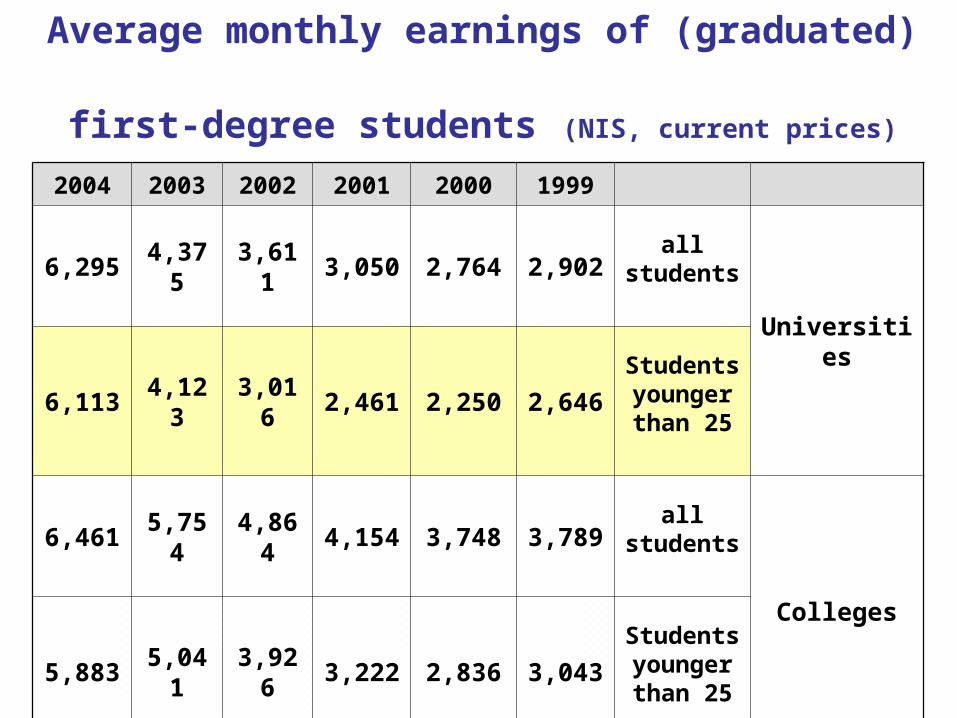
Average monthly earnings of (graduated) first-degree students (NIS, current prices)
199920002001200220032004
Universities
all students2,9022,7643,0503,6114,3756,295
Students younger than 25
2,6462,2502,4613,0164,1236,113
Colleges
all students3,7893,7484,1544,8645,7546,461
Students younger than 25
3,0432,8363,2223,9265,0415,883
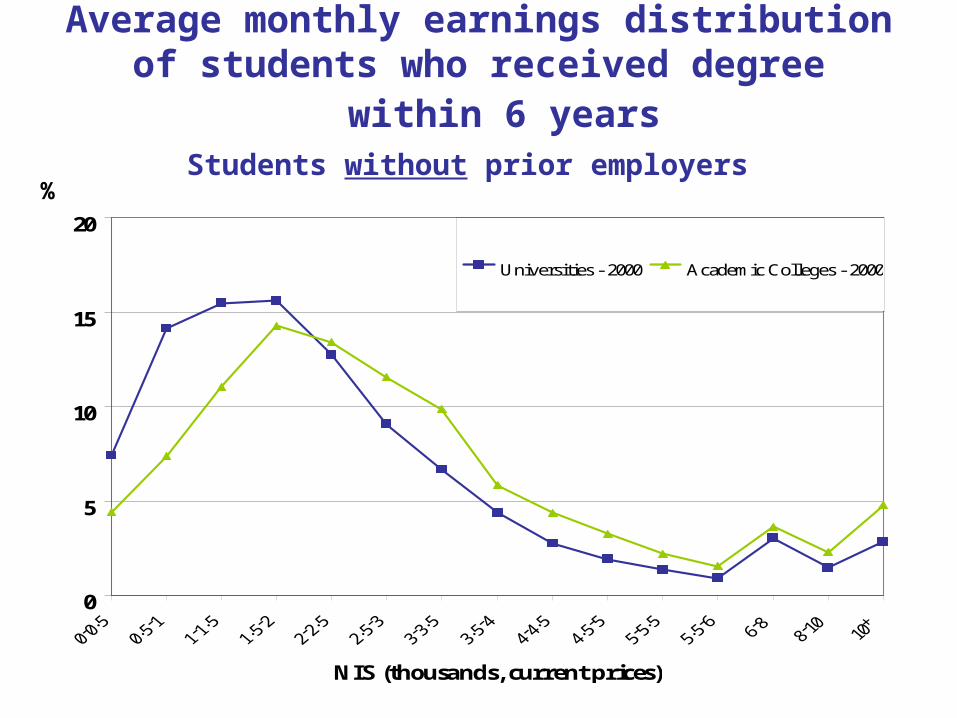
Average monthly earnings distribution of students who received degree within 6 years
0
5
10
15
20
NIS (thousands, current prices)
Universities - 2000 Academic Colleges - 2000
Students without prior employers%
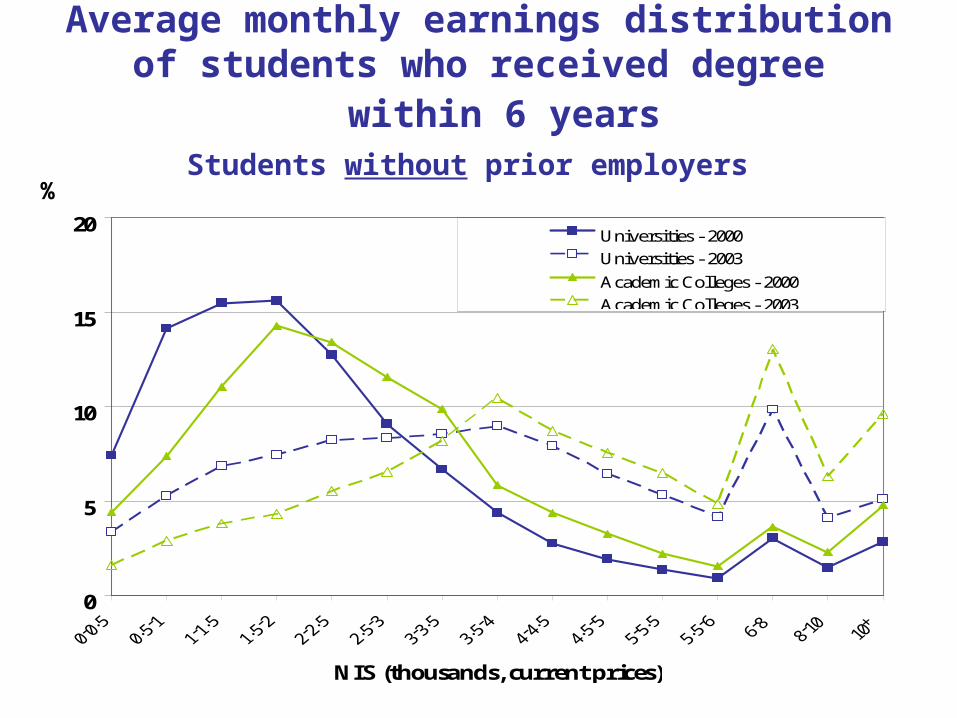
Average monthly earnings distribution of students who received degree within 6 years
0
5
10
15
20
NIS (thousands, current prices)
Universities - 2000Universities - 2003
Academic Colleges - 2000Academic Colleges - 2003
Students without prior employers%
Occupation
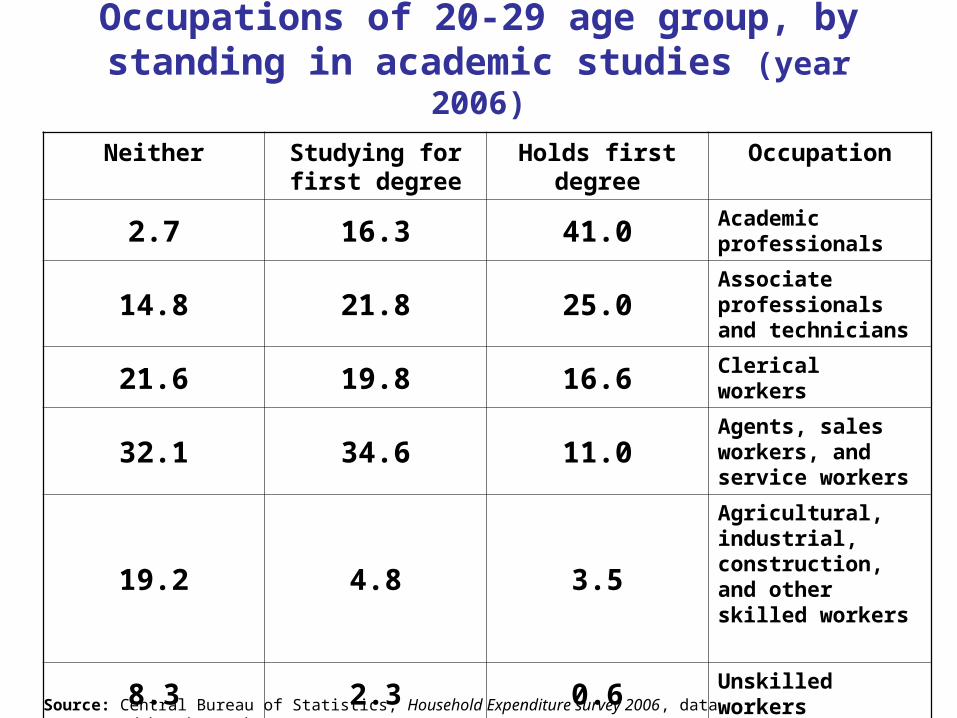
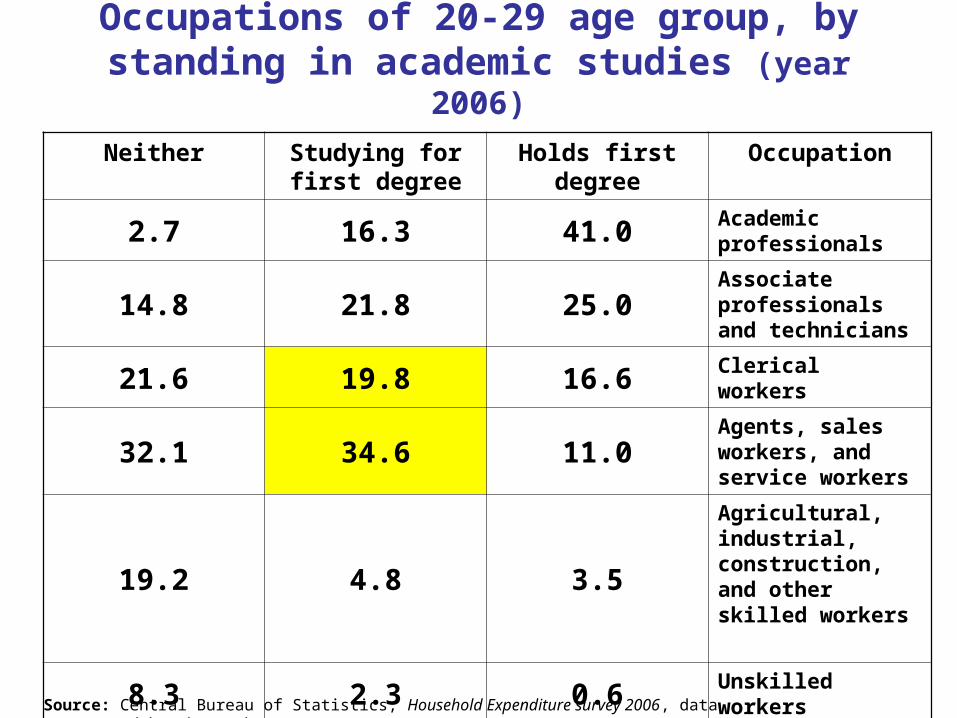
Occupations of 20-29 age group, by standing in academic studies (year 2006)
OccupationHolds first degree
Studying for first degree
Neither
Academic professionals41.016.32.7
Associate professionals and technicians
25.021.814.8
Clerical workers16.619.821.6Agents, sales workers, and service workers
11.034.632.1
Agricultural, industrial, construction, and other skilled workers
3.54.819.2
Unskilled workers0.62.38.3Source: Central Bureau of Statistics, Household Expenditure survey 2006, data processed by the authors.
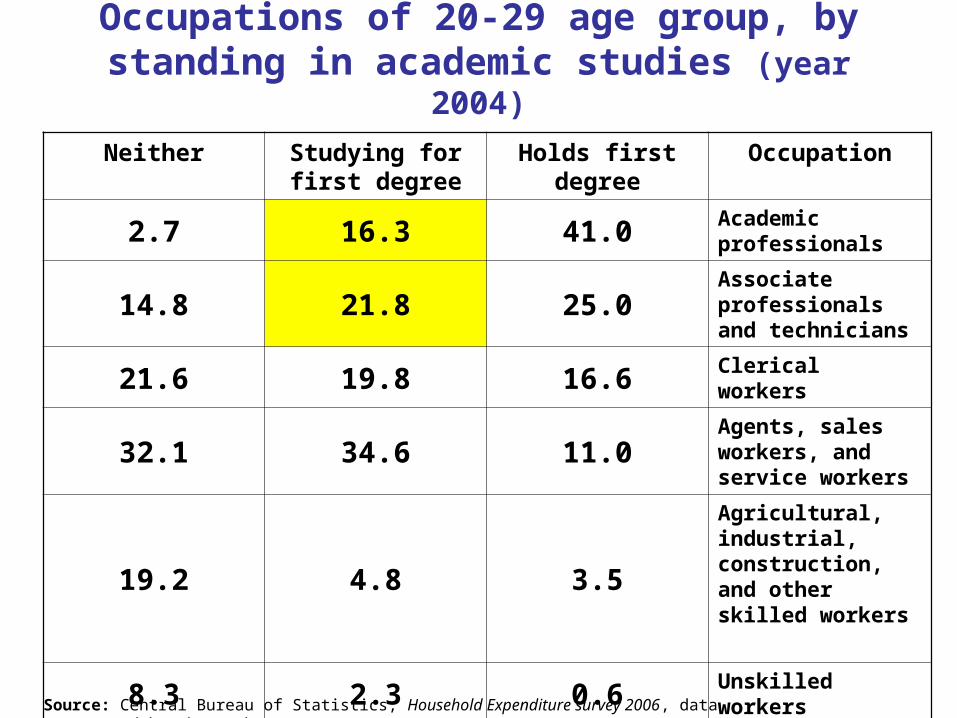
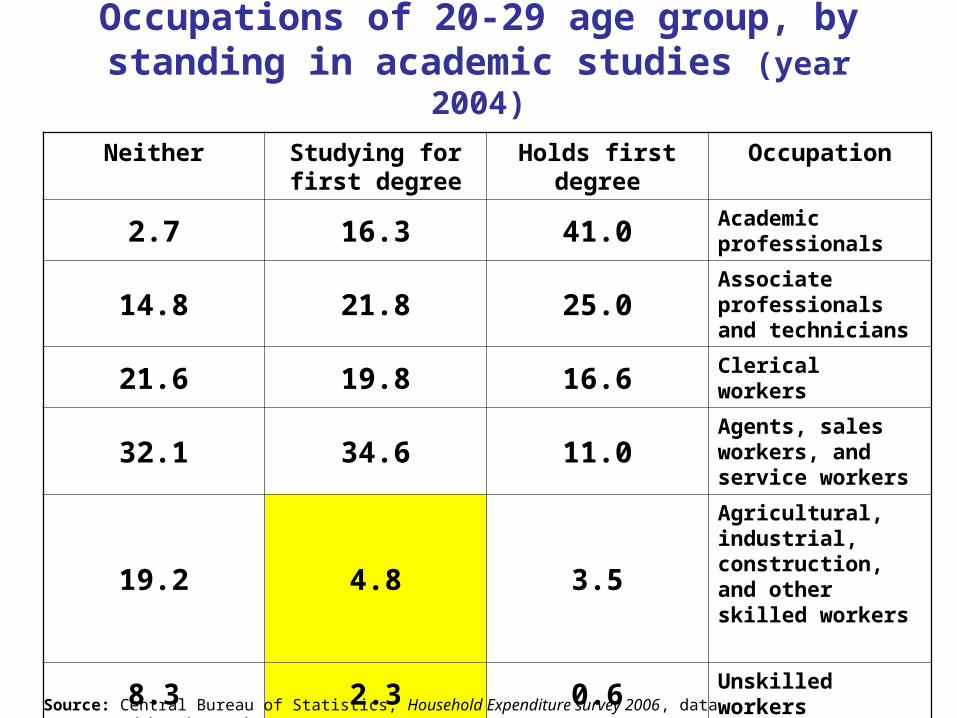
Occupations of 20-29 age group, by standing in academic studies (year 2004)
OccupationHolds first degree
Studying for first degree
Neither
Academic professionals41.016.32.7
Associate professionals and technicians
25.021.814.8
Clerical workers16.619.821.6Agents, sales workers, and service workers
11.034.632.1
Agricultural, industrial, construction, and other skilled workers
3.54.819.2
Unskilled workers0.62.38.3Source: Central Bureau of Statistics, Household Expenditure survey 2006, data processed by the authors.

Econometric Model&
Results
The aimThe aim::
Estimating the correlation of employment during
study and patterns of study (duration of study, likelihood of dropping out, likelihood of going on to advanced studies).
The econometric difficultyThe econometric difficulty
The need to contend with unobserved heterogeneity in the traits of those who choose to work and the others, traits that correspond both on the decision to work and the likelihood of scholastic success (scholastic abilities, diligence, motivation, etc.).
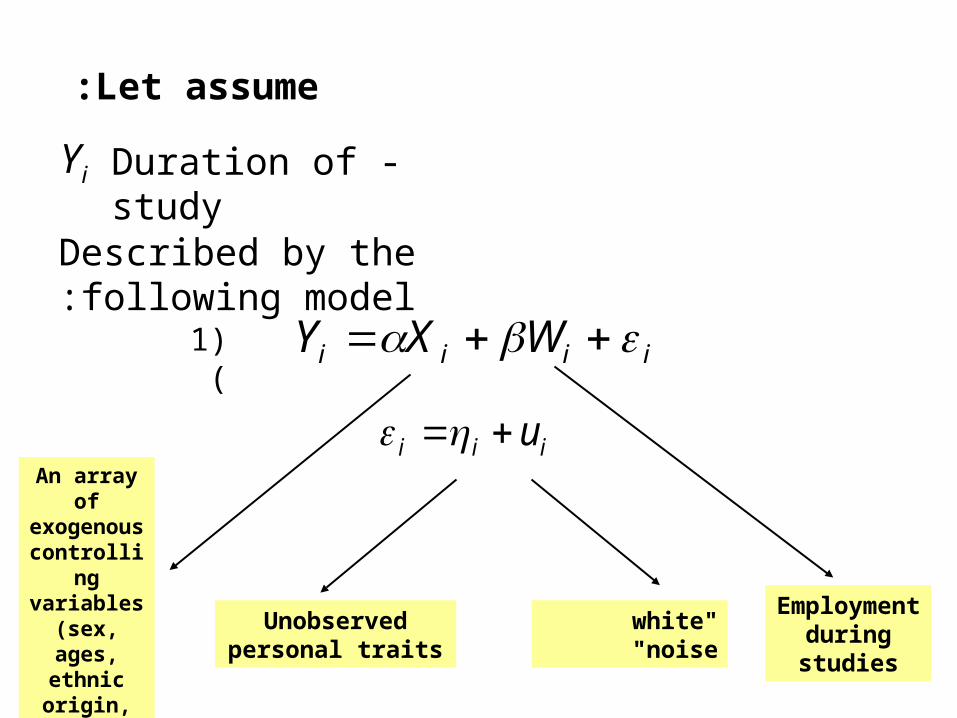
Let assume:
iY -Duration of study
Described by the following model:
iiii WXY
)1(
iii uAn array of exogenous controlling variables
(sex, ages, ethnic origin,
scholastic ability, …)
Employment during studies
Unobserved personal traits
"white noise"
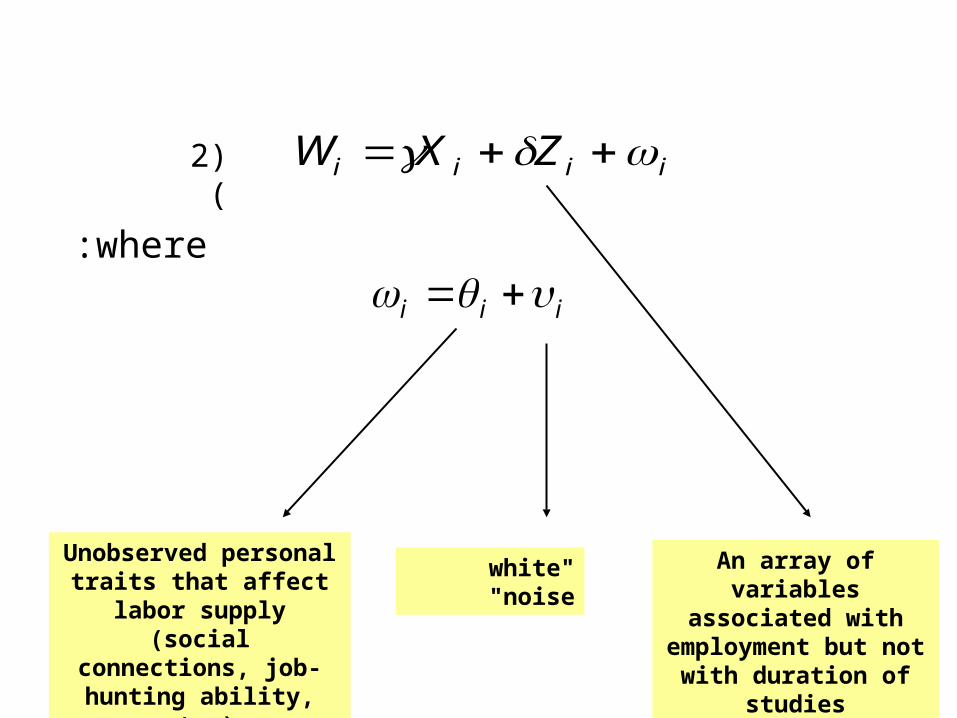
iiii ZXW )2(
where:
iii
An array of variables associated with
employment but not with duration of
studies
Unobserved personal traits that affect labor
supply (social connections, job-
hunting ability, etc.)
"white noise"

HoweverHowever……
A positive correlation between and causes the unobserved-heterogeneity problem – which makes the employment variable in eq.(1) endogenous.
i i
ThereforeTherefore……
Using the Instrumental Variable Method as correlated with employment during study and not correlated with the variables which influence the likelihood of scholastic success.
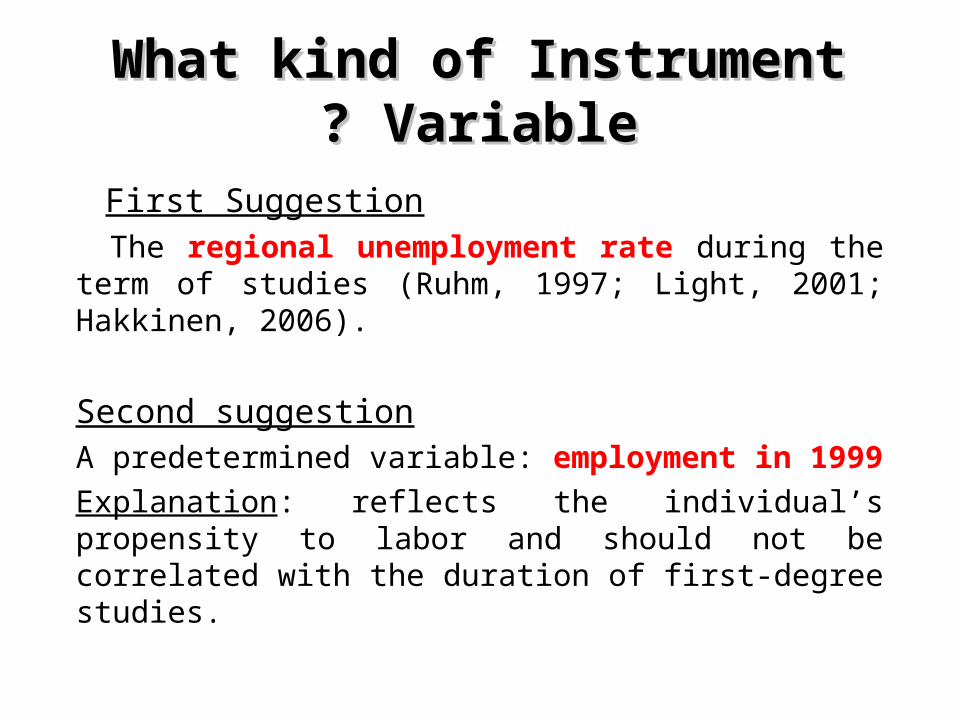
What kind of Instrument VariableWhat kind of Instrument Variable? ?
First Suggestion The regional unemployment rate during the term of
studies (Ruhm, 1997; Light, 2001; Hakkinen, 2006).
Second suggestionA predetermined variable: employment in 1999
Explanation: reflects the individual’s propensity to labor and should not be correlated with the duration of first-degree studies.
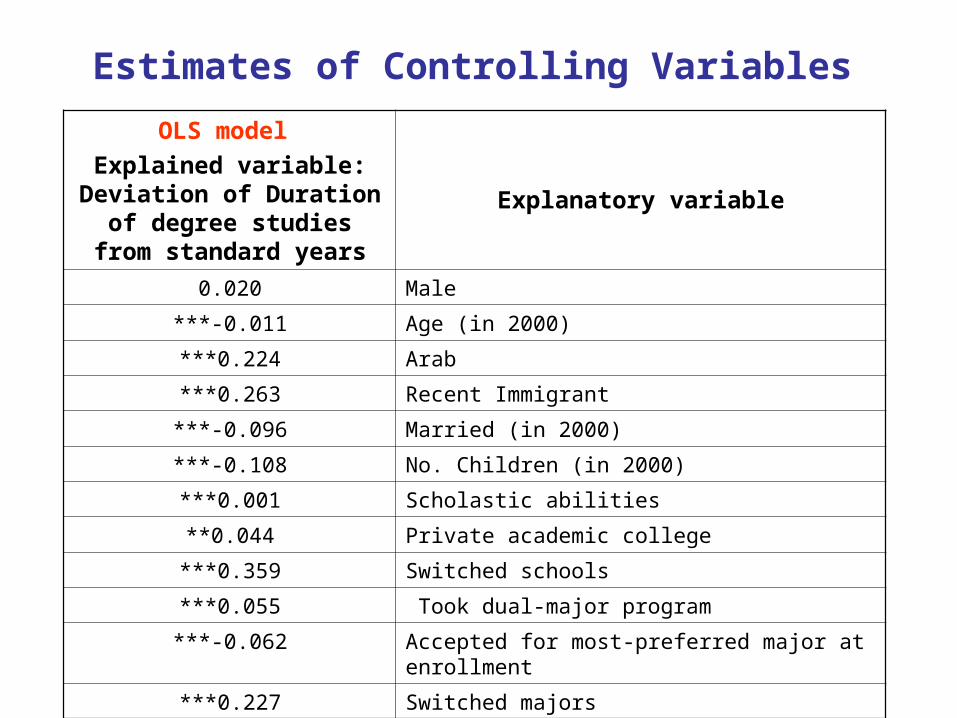
Estimates of Controlling Variables
Explanatory variable
OLS model
Explained variable: Deviation of Duration of
degree studies from standard years
Male0.020
Age (in 2000)0.011***-
Arab0.224***
Recent Immigrant0.263***
Married (in 2000)0.096***-
No. Children (in 2000)0.108***-
Scholastic abilities0.001***
Private academic college0.044**
Switched schools0.359***
Took dual-major program 0.055***
Accepted for most-preferred major at enrollment0.062***-
Switched majors0.227***
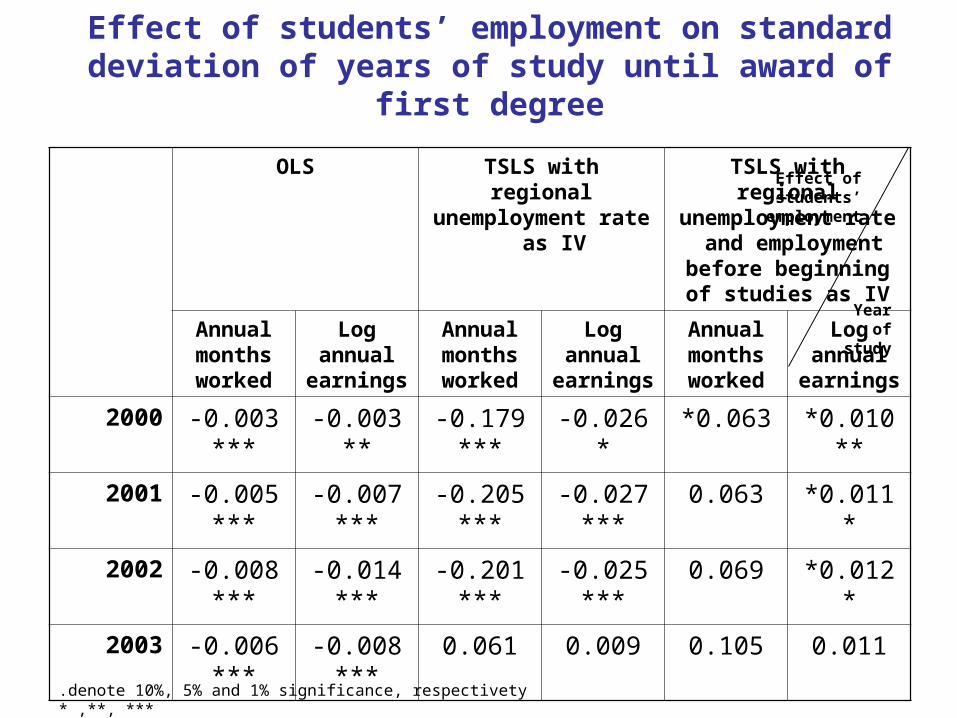
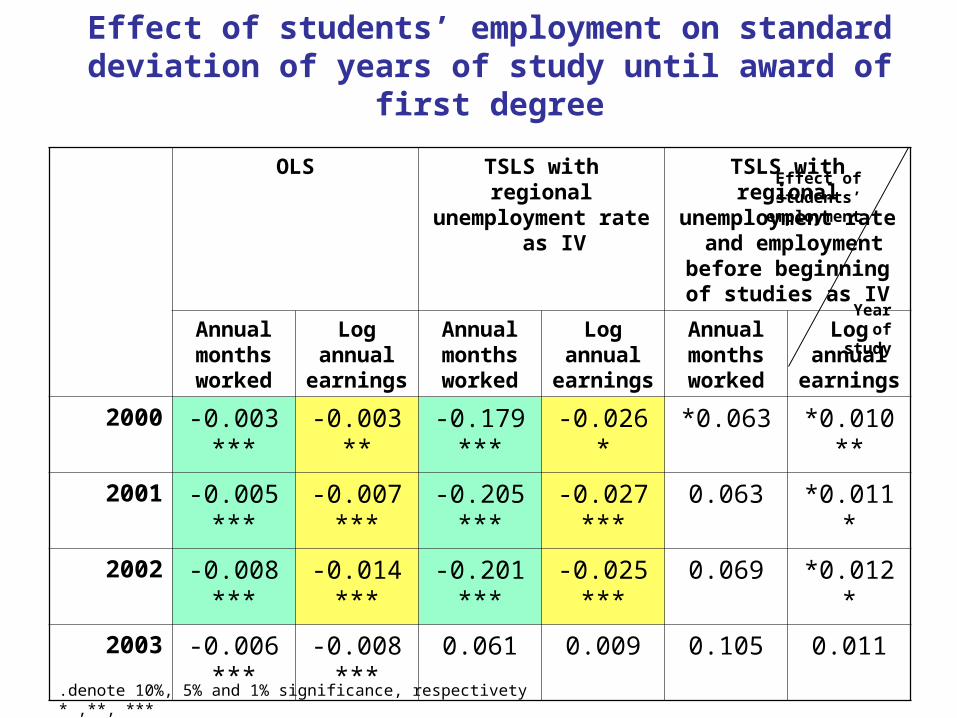
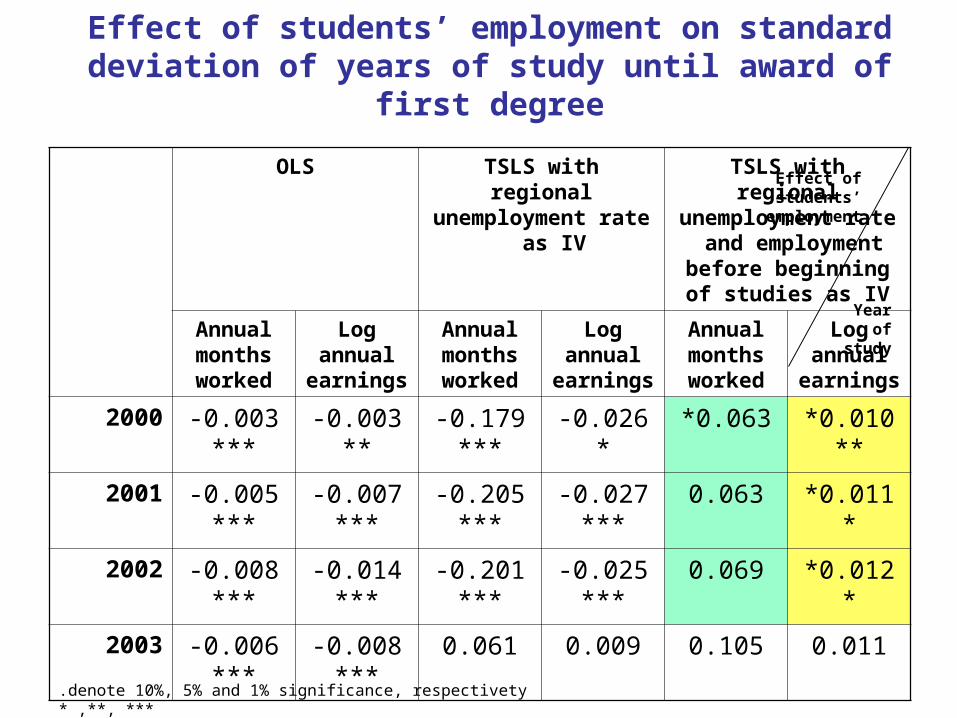
Effect of students’ employment on standard deviation of years of study until award of first degree
TSLS with regional unemployment rate
and employment before beginning of
studies as IV
TSLS with regional unemployment rate as
IV
OLS
Log annual
earnings
Annual months worked
Log annual
earnings
Annual months worked
Log annual
earnings
Annual months worked
0.010***0.063*0.026*-0.179***-0.003**-0.003***-2000
0.011**0.0630.027***-0.205***-0.007***-0.005***-2001
0.012**0.0690.025***-0.201***-0.014***-0.008***-2002
0.0110.1050.0090.0610.008***-0.006***-2003
Year of study
Effect of students’
employment
denote 10%, 5% and 1% significance, respectivety .*** * ,**,
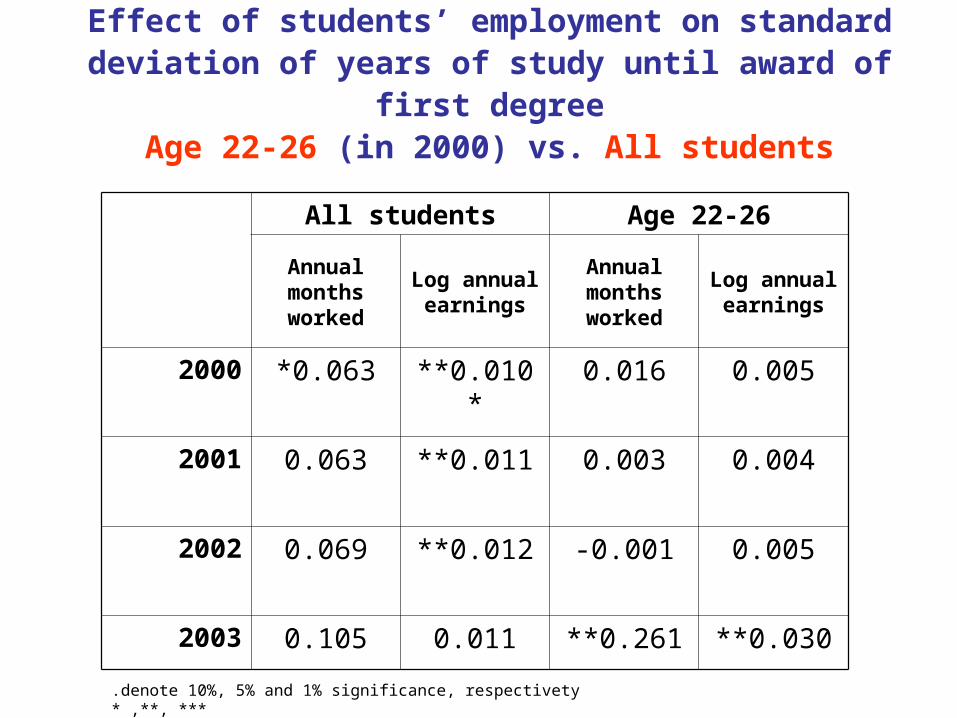
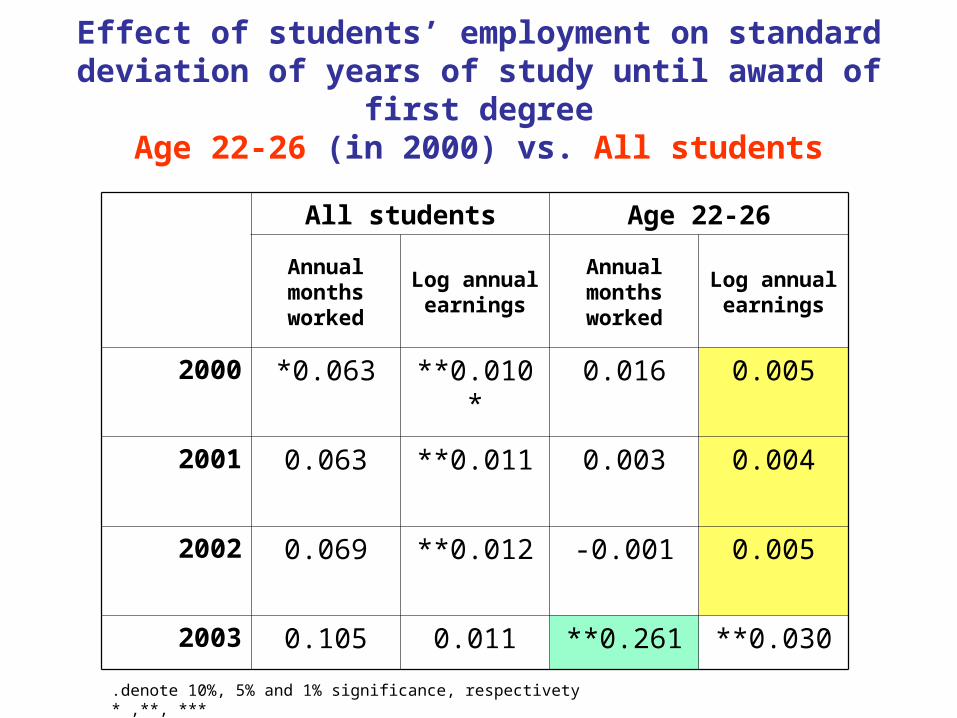
Effect of students’ employment on standard deviation of years of study until award of first degree
Age 22-26 (in 2000) vs. All students
Age 22-26All students
Log annual earnings
Annual months worked
Log annual earnings
Annual months worked
0.0050.0160.010***0.063*2000
0.0040.0030.011**0.0632001
0.0050.001-0.012**0.0692002
0.030**0.261**0.0110.1052003
denote 10%, 5% and 1% significance, respectivety .*** * ,**,
Age 22-26All students
Log annual earnings
Annual months worked
Log annual earnings
Annual months worked
0.0050.0160.010***0.063*2000
0.0040.0030.011**0.0632001
0.0050.001-0.012**0.0692002
0.030**0.261**0.0110.1052003
denote 10%, 5% and 1% significance, respectivety .*** * ,**,
Effect of students’ employment on standard deviation of years of study until award of first degree
Age 22-26 (in 2000) vs. All students
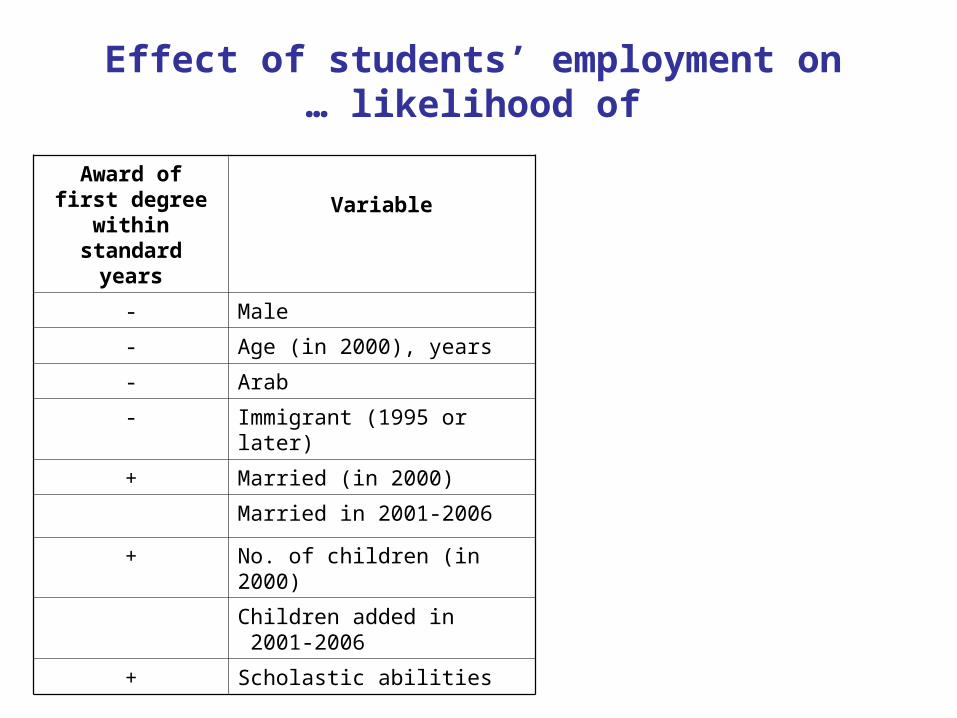
Effect of students’ employment on likelihood of…
Variable
Award of first degree within
standard years
Male-
Age (in 2000), years-
Arab-
Immigrant (1995 or later)-
Married (in 2000)+
Married in 2001-2006
No. of children (in 2000)+
Children added in 2001-2006
Scholastic abilities+
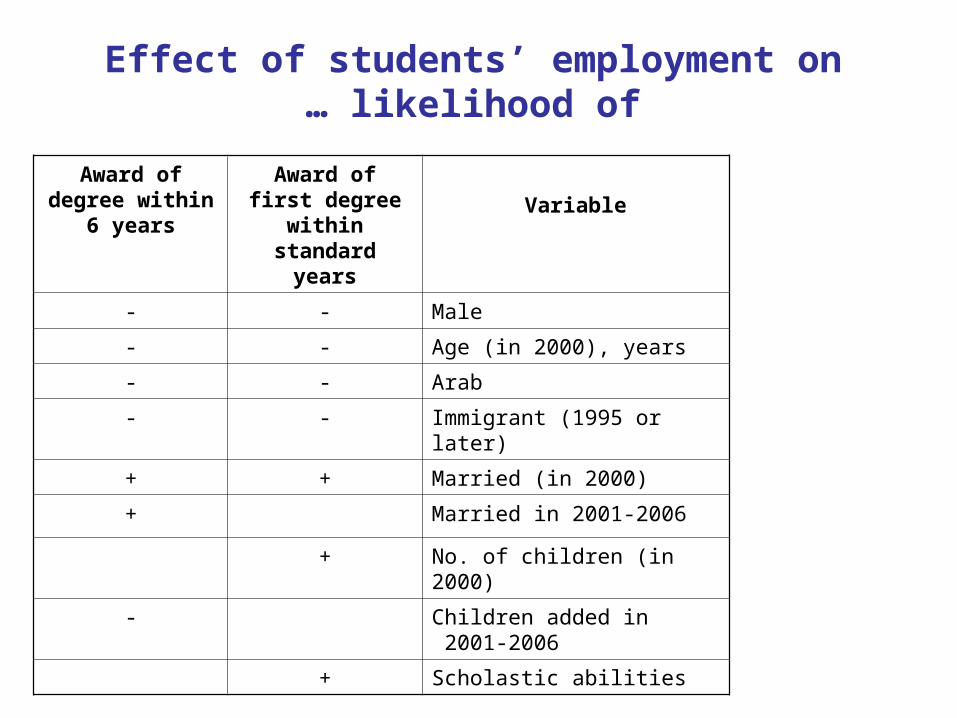
Effect of students’ employment on likelihood of…
Variable
Award of first degree within
standard years
Award of degree within 6 years
Male--
Age (in 2000), years--
Arab--
Immigrant (1995 or later)--
Married (in 2000)++
Married in 2001-2006+
No. of children (in 2000)+
Children added in 2001-2006 -
Scholastic abilities+
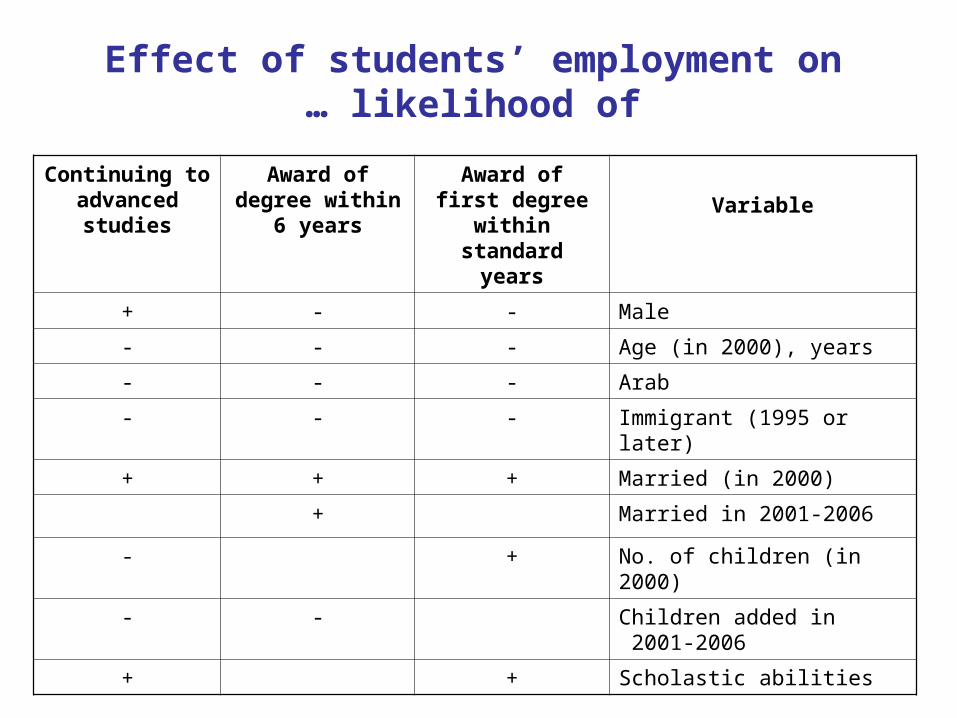
Effect of students’ employment on likelihood of…
Variable
Award of first degree within
standard years
Award of degree within 6 years
Continuing to advanced
studies
Male--+
Age (in 2000), years---
Arab---
Immigrant (1995 or later)---
Married (in 2000)+++
Married in 2001-2006+
No. of children (in 2000)+-
Children added in 2001-2006 --
Scholastic abilities++
Effect of students’ employment on likelihood of…
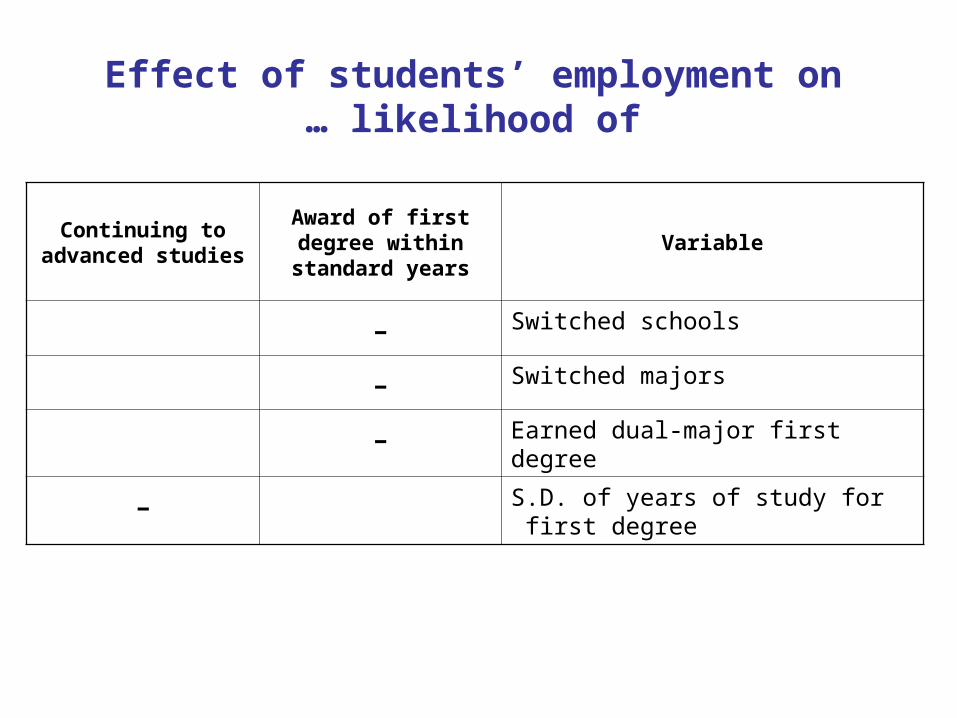
VariableAward of first degree within standard years
Continuing to advanced studies
Switched schools-Switched majors-Earned dual-major first degree-S.D. of years of study for first degree -
Effect of students’ employment on likelihood of…
Variable
Award of first degree within
standard years
Award of degree within
6 years
Continuing to advanced
studies
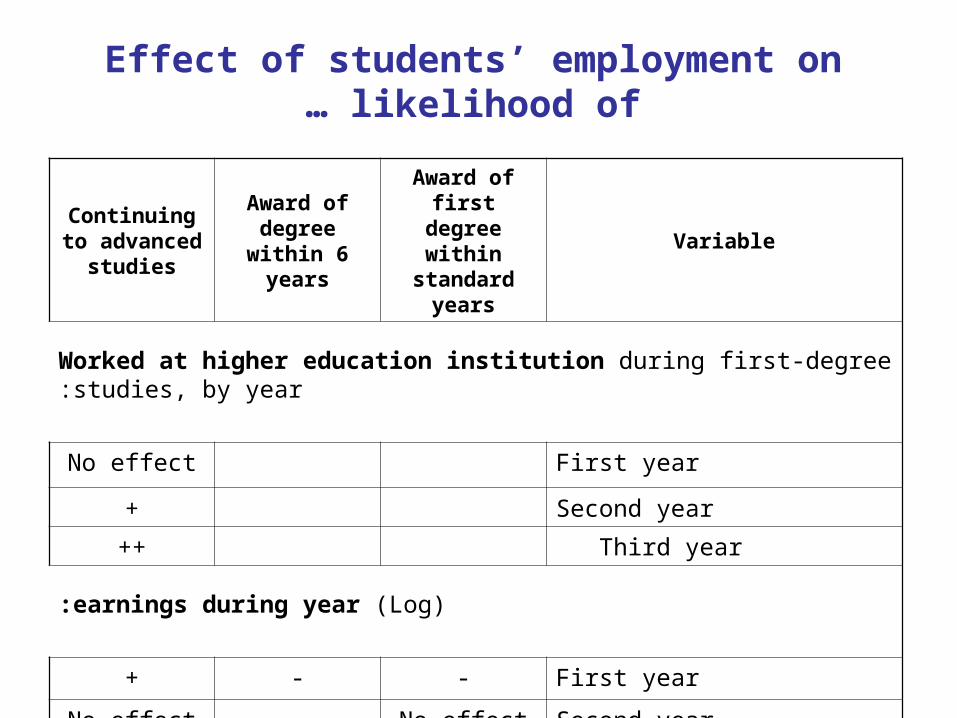
Worked at higher education institution during first-degree studies, by year:
First yearNo effect
Second year+
Third year ++
)Log (earnings during year:
First year--+
Second yearNo effect-No effect
Third year ++No effect
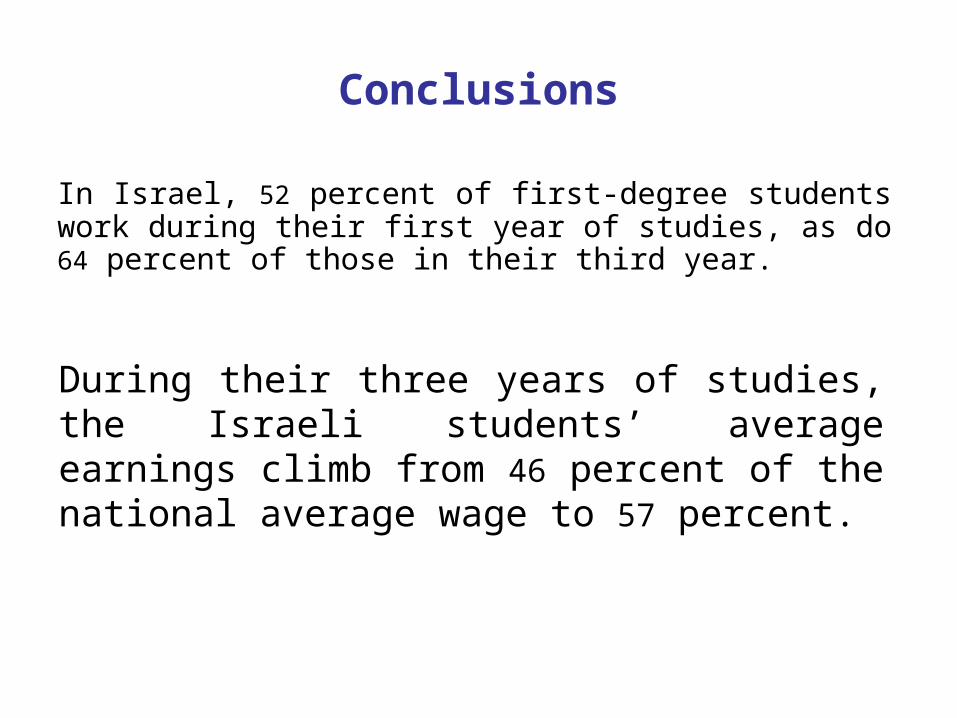
Conclusions
In Israel, 52 percent of first-degree students work during their first year of studies, as do 64 percent of those in their third year.
During their three years of studies, the Israeli students’ average earnings climb from 46 percent of the national average wage to 57 percent.
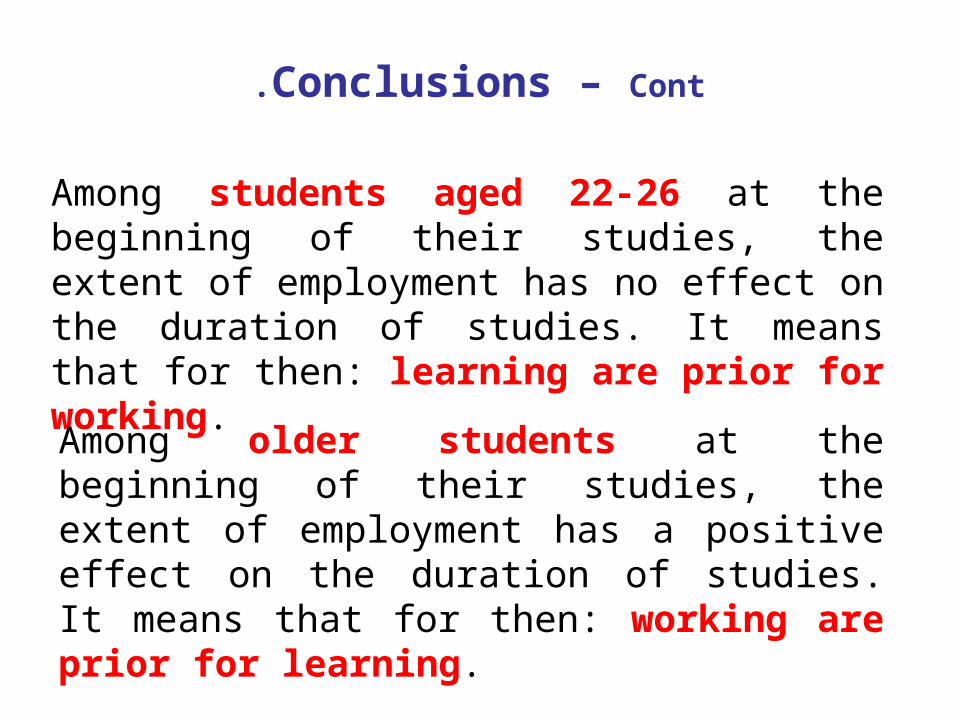
Conclusions – Cont.
Among students aged 22-26 at the beginning of their studies, the extent of employment has no effect on the duration of studies. It means that for then: learning are prior for working.
Among older students at the beginning of their studies, the extent of employment has a positive effect on the duration of studies. It means that for then: working are prior for learning.

Thank you