working around the clock - repub.eur.nl · working around the clock: adverse health effects of...
TRANSCRIPT


Working around the Clock:Adverse health effects of circadian rhythm disturbance
Werken rond de klok:Nadelige gezondheidseffecten door verstoring van het circadiane ritme
Kirsten Van Dycke
40036 Dycke, Kirsten.indd 1 11-04-16 11:02

ISBN 978-94-6332-012-2
Design Cover: Lysette Hartman
Design Inside: Ferdinand van Nispen tot Pannerden,
Citroenvlinder DTP&Vormgeving, my-thesis.nl
Printed by: GVO Drukkers en vormgevers, Ede, The Netherlands
Copyright © 2016 Kirsten Van Dycke
All rights reserved. No part of this thesis may be reproduced, stored in a retrieval system or
transmitted in any form or by any means without prior permission of the author.
40036 Dycke, Kirsten.indd 2 11-04-16 11:02

Working around the Clock:Adverse health effects of circadian rhythm disturbance
Werken rond de klok:Nadelige gezondheidseffecten door verstoring van het circadiane ritme
Proefschriftter verkrijging van de graad van doctor aan de
Erasmus Universiteit Rotterdam
op gezag van de rector magnificus
Prof.dr. H.A.P. Pols
en volgens besluit van het College van Promoties.
De openbare verdediging zal plaatsvinden op
dinsdag 7 juni 2016 om 15:30
door
Kirsten Catharina Gabriëlla Van Dycke
geboren te Arnhem
40036 Dycke, Kirsten.indd 3 11-04-16 11:02

Promotiecommissie
Promotoren: Prof.dr. G.T.J. van der Horst
Prof.dr. H. van Steeg
Overige leden: Prof.dr. T. Roenneberg
Dr. E.F.C. van Rossum
Dr.ing. R.W.F. de Bruin
Copromotor: Dr. W. Rodenburg
40036 Dycke, Kirsten.indd 4 11-04-16 11:02

40036 Dycke, Kirsten.indd 5 11-04-16 11:02

Contents
Contents 6
Chapter 1 General introduction 9
Chapter 2 Chronically alternating light cycles increase breast
cancer risk in mice
23
Chapter 3 Biomarker discovery using a comparative
omics approach in a mouse model developing
heterogeneous mammary cancer subtypes
39
Chapter 4 Biomarkers for circadian rhythm disturbance
independent of time of day
59
Chapter 5 Diurnal variation of hormonal and lipid biomarkers in
a molecular epidemiology-like setting
77
Chapter 6 Attenuation of circadian rhythmicity in hepatic gene
expression upon chronic alternating light cycle
exposure
97
40036 Dycke, Kirsten.indd 6 11-04-16 11:02

Summary and general discussion 113
Nederlandse Samenvatting 129
Curriculum Vitae 134
List of publications 136
PhD portfolio 137
Dankwoord 139
References 142
Appendix 1 A day and night difference in the response of
the hepatic transcriptome to cyclophosphamide
treatment
157
Appendix 2 Supplemental data 181
40036 Dycke, Kirsten.indd 7 11-04-16 11:02

40036 Dycke, Kirsten.indd 8 11-04-16 11:02

CHAPTER 1
General introduction
40036 Dycke, Kirsten.indd 9 11-04-16 11:02

Chapter 1
10
The circadian clockTo anticipate the recurring environmental changes resulting from the Earth’s
rotation, most organisms have developed a circadian clock with periodicity of
approximately (circa) one day (diem). Circadian rhythms can be found in behavior,
physiology and metabolism. Well known examples are the sleep-wake cycle or
rhythm in locomotor activity (Hurd et al., 1998, Cahill et al., 1998), daily variations
in body temperature (Refinetti and Menaker, 1992) and blood pressure (Pickering,
1990) and melatonin levels that rise at sunset and decrease at sunrise (Hardeland
et al., 2006). In mammals, this internal timekeeping system is composed of a master
or central clock, the suprachiasmatic nucleus (SCN) located in the brain, and
peripheral clock in all other tissues in the body. The SCN consists of two bilateral
nuclei in the ventral hypothalamus, just above the optic chiasm and is required to
synchronize the peripheral clocks (Moore and Eichler, 1972, Moore, 1983, Van den
Pol, 1980).
To keep these approximately 24 hour rhythms synchronized with the environment,
circadian rhythms need to be entrained by Zeitgebers. The most important and
potent Zeitgeber for the central SCN clock in mammals is light (Bell-Pedersen et al.,
2005). The light-input is perceived by specialized retinal ganglion cells in the eye
using a photo pigment called melanopsin (Berson et al., 2002). This photo pigment
differs from the rhodopsin in the rods and cones, used mainly for vision. The photic
signal is transmitted by the retinohypothalamic tract to the hypothalamus, which
projects to the SCN. Depending on the timing of the light exposure, the circadian
rhythm will delay or advance, resulting in e.g. waking up later or earlier, respectively
(Warman et al., 2003, Duffy et al., 1996). Whereas light can affect timing of the
clock in the SCN, timed food intake has been shown to entrain circadian rhythms
of peripheral clocks, independent of the SCN (Carneiro and Araujo, 2012). Social
cues are also sufficient to entrain human circadian rhythms (Aschoff et al., 1971).
Furthermore, melatonin is best known as output of the biological clock, but in turn
can also entrain or phase shift the clock in several species (Redman, 1997).
These circadian rhythms are endogenous, meaning that the rhythm persist under
constant conditions with a period of approximately 24 hours. The circadian rhythm
is self-sustaining and regulated on a molecular level by a molecular oscillator
composed of clock genes (described in Box 1). The circadian rhythm in the absence
of Zeitgebers such as light is called free running rhythm. In humans, the average
40036 Dycke, Kirsten.indd 10 11-04-16 11:02
General introduction
11
1free running period has been shown to be slightly longer than 24 hours (Czeisler
et al., 1999). In contrast, most mouse strains have an internal rhythm that is slightly
shorter than 24 hours, with variation between the strains (Pfeffer et al., 2015,
Schwartz and Zimmerman, 1990). As described previously, this internal rhythm is
synchronized with the environment by Zeitgebers. The relationship between the
timing of the biological clock and the timing of an external time cue is called the
phase angle of entrainment and determines chronotype; whether an individual is
an early type or a late type (Emens et al., 2009).
Box 1. Molecular clockAt the molecular level, the circadian rhythms are generated by an auto-regulatory
transcriptional-translation feedback loop (TTFL) (Lee et al., 2001). In short, the positive
limb of the TTFL consists of CLOCK and BMAL1 proteins, driving the transcription
of Period (Per1, Per2) and Cryptochrome (Cry1, Cry2) genes. In the negative limb,
PER and CRY proteins form a heterodimeric complex that translocates back into
the nucleus, repressing the CLOCK/BMAL1 driven transcription, thereby inhibiting
their own gene expression (Ko and Takahashi, 2006, Lee et al., 2001, Reppert and
Weaver, 2002). This molecular oscillator is coupled to output processes via clock-
controlled genes, including transcription factors (Reppert and Weaver, 2002).
Micro-array studies have revealed that approximately 10 % of the transcriptome is
under circadian control (Hughes et al., 2010, Miller et al., 2007, Panda et al., 2002).
Shift work-associated breast cancer riskWorking around the clock strains and disturbs this tightly regulated biological
clock, which eventually might result in adverse health events. Our 24/7 economy
demands people to work at irregular times and as a consequence, more and
more people are involved in atypical working schedules. Recent surveys in
Europe indicate that approximately 19% of the workers in the European Union
(EU) work at night and 17% are involved in shift work with permanent or rotating
shifts (Eurofound, 2012). In the Netherlands, approximately 1.2 million people
work sometimes or regularly during the night (CBS, 2010). Recent epidemiology
studies show that long-term shift work increases acute and chronic health risks,
like fatigue (Akerstedt and Wright, 2009), gastrointestinal complaints (Knutsson
and Boggild, 2010), and developing diabetes (Suwazono et al., 2006, Pan et al.,
2011) and cardiovascular disease (Gu et al., 2015, Fujino et al., 2006). Importantly,
work in shifts for many years was associated with an increased breast cancer risk
40036 Dycke, Kirsten.indd 11 11-04-16 11:02

Chapter 1
12
in women (Akerstedt et al., 2015, Schernhammer et al., 2006). Epidemiological
studies concerning the relation between shift work or night work and breast
cancer risk have been summarized in several meta-analyses with contradicting
results (He et al., 2014, Ijaz et al., 2013, Jia et al., 2013, Kamdar et al., 2013, Megdal et
al., 2005, Wang et al., 2013). In the first meta-analysis Megdal et al. found a pooled
relative risk (RR) of 1.51 (95% CI, 1.36–1.68) for the association between shift work
and breast cancer, based on six studies (Megdal et al., 2005). Subsequent meta-
analyses reported lower RRs of approximately 1.2 (He et al., 2014, Jia et al., 2013,
Kamdar et al., 2013, Wang et al., 2013) or limited to no evidence for a shift work
breast cancer relationship (Ijaz et al., 2013).
Shift work is a complex combination of exposures, involving multiple aspects that
have been suggested to underlie the relationship between shift work and cancer
(Fritschi et al., 2011). These aspects include internal desynchronization, suppression
of melatonin or vitamin D levels, sleep disruption and lifestyle disturbances, all
shown in Figure 1. All suggested hypotheses are extensively discussed by Fritschi
et al. (Fritschi et al., 2011). In summary, the alternating shifts during shift work may
cause rhythms in peripheral function to become out of phase with the central
clock or sleep wake cycle, internal desynchronization. Additionally, both timing and
the degree of light exposure in shift workers is changed affecting both melatonin
and vitamin D levels. Light exposure during the night can result in melatonin
suppression (Davis and Mirick, 2006), which is suggested to increase breast cancer
development in experimental studies by various mechanisms (e.g. anti-oxidant
function) (Blask et al., 2005). Individuals working in night shift are suggested to
have less sunlight exposure, resulting in lowered vitamin D levels (Kimlin and
Tenkate, 2007), whereas sun exposure has been suggested to be protective of
several types of cancer (van der Rhee et al., 2013). Vitamin D has been suggested to
be one of the mediating factors in the preventive effect of sunlight on cancer (van
der Rhee et al., 2013), for example by inhibition of cell proliferation through various
mechanisms (Garland and Garland, 2006). Sleep disruption can cause a decrease in
melatonin levels, decreased immune activity and metabolic disturbance, which all
have been linked separately with increased cancer risk (Bovbjerg, 2003, Bianchini
et al., 2002, Blask et al., 2005). Lastly, lifestyle factors such as smoking, unhealthy
eating, age at first birth and duration of breast-feeding are possibly different for
shift-workers compared to day-workers and are all factors which increase cancer
risk.
40036 Dycke, Kirsten.indd 12 11-04-16 11:02

General introduction
13
1
Figure 1. Suggested scenarios underlying the relationship between chronic CRD and breast cancer (adapted from Fritschi et al. (Fritschi et al., 2011)).
Due to the observational nature of epidemiological studies, it is unknown which
aspect or combination of aspects is responsible for the observed increased health
risk in shift workers. Moreover, several factors can be either defined as part of the
exposure, intermediate factor or be a result of shift work exposure. For example,
significant differences in socio-economic status, smoking behavior, nulliparity,
hormone replacement therapy use, and obesity between women that had and
had not worked at night have been reported (Wang et al., 2012). An important
drawback of the epidemiological studies is that these studies require several years
to study effects on chronic diseases prospectively, and the ability to control the
aspects related to shift work is limited.
Additionally, exposure assessment of shift work is often lacking or incomplete due
to the retrospective nature of many studies and the diversity of shift work schedules
used. The first line of epidemiological studies, such as the Nurses’ Health Study
(Schernhammer et al., 2006), have been able to identify associations between shift
work and breast cancer using relatively crude exposure assessment metrics such
as ‘ever/never conducted shift work’ or ‘duration of working on a rotating schedule’.
Molecular epidemiology studies, as performed by Papantoniou et al. assessed the
exposure to shift work in more detail, reporting diurnal preference, light exposure,
circadian variation in melatonin, and sex hormone production (Papantoniou et al.,
2014). The findings of this cross-sectional study among day and night workers show
that night shift workers have decreased melatonin levels and differences herein
result from diurnal preference and intensity of light-at-night exposure. However,
40036 Dycke, Kirsten.indd 13 11-04-16 11:02

Chapter 1
14
it will take many years before specific exposures during shift work are proven
to be causal for cancer risk in human studies. To study the causal relationship between circadian disturbance resulting from shift work and increased breast cancer risk, confounding factors should be excluded or taken into account and circadian disturbance exposure should be clearly defined or controlled.
Animal studies on the shift work-cancer relationshipAnimal studies allow detailed analysis of individual aspects of shift work, by
allowing the exclusion (melatonin, lifestyle factors) or measurement (internal
desynchronization, sleep disruption, vitamin D) of these individual factors.
Additionally, such studies can identify underlying changes in biological processes
that could provide targets for the development preventive measures. Animal
studies have a number of advantages compared to epidemiological studies. Firstly,
inter individual variation can be minimized in animal studies. Exposure models can
be developed to mimic human shift work allowing controlled uniform exposure,
in a genetically homogenous study population. Animal studies are therefore not
hampered by the environmental or lifestyle confounding factors, or exposure
assessment difficulties and therefore are better suited to study causality. Secondly,
in comparison to prospective cohort studies, the effects of shift work on long-
term health effect can be determined in a relatively short (1 year) time window.
Moreover, in shift work many environmental factors have changed, such as altered
light exposure, changed sleep-wake cycle (Grundy et al., 2009) and differently
timed food intake (Lennernas et al., 1995). In animal studies, these aspects can be
studied separately or in combination, providing insight into which disturbance(s)
of the circadian system is (are) (mostly) responsible for the observed health effects.
When using animals to study the relation between circadian rhythm disturbance
(CRD) and breast cancer risk, one can manipulate both sides of the equation:
circadian rhythm and breast cancer development. Disruption or disturbance of
circadian rhythms can be accomplished by alternating or shifting light schedules,
constant (dim) light exposure or disruption of the endogenous circadian rhythm.
The endogenous circadian rhythms can be disrupted through genetic modification
of the molecular clock, by mutating one of the core clock genes. Removing the
pineal gland will also result in the loss of circadian rhythmicity. In literature circadian
(rhythm) disruption is often used to describe manipulation of the circadian system.
In this thesis we differentiate between disruption and disturbance. The models
40036 Dycke, Kirsten.indd 14 11-04-16 11:02

General introduction
15
1in which the endogenous circadian system is modified either genetically or
anatomically, resulting in a completely or partially non-functional circadian system
are referred to as circadian disruption models. Whereas, circadian disturbance
refers to strain or stress imposed on the functional circadian system by exogenous
exposure, including but not limited to jet lag, altered timing of food intake and
day-time sleep.
Most studies make use of circadian disruption models or constant light exposure,
of which the majority shows an increase in breast tumor growth. The increased
tumorigenesis after disruption of the endogenous circadian rhythm or by the
“unnatural” constant light exposure model, which is known to desynchronize
mammalian clock neurons, resulting in behavioral and physiological arrhythmicity
(Ohta et al., 2005), emphasizes the relation between the circadian clock and tumor
development. However, altered light schedules provide a more realistic tool to
mimic constant disturbance of the circadian system resulting from shift work. Such
an approach has previously been employed by exposure to a nightly light pulse
(Travlos et al., 2001) or infusion with blood of women exposed to a nightly light
pulse (Blask et al., 2005). Whereas the first study found no effect on chemically
induced tumor growth, the latter showed a significant increase in MCF-7 xenograft
growth. Additionally, other circadian rhythm disturbance (CRD) models have been
described that mimic human shift work, including altered timing of 1) food intake,
2) activity and 3) sleep. A large variety of these models, as well as altered light
exposure, have been used to study the metabolic effects of human shift work with
a substantial number of indecisive results (Opperhuizen et al., 2015). Previously,
altered light schedules have shown to increase chemically induced liver tumor
growth (Filipski et al., 2009), but have not yet been employed in combination with
breast cancer induction models.
Since breast tumors are relatively rare in animals, studying breast cancer risk in wild
type animals requires a large number of animals. Therefore, breast cancer animal
models are used to reduce the number of animals needed. Breast cancer models
can be divided into chemically induced tumor development and xenografted
mammary gland tumors or tumor cell lines. Importantly, carcinogenesis comprises
three different stages, namely initiation, promotion and progression (Box 2 and
Fig. 2). The majority of the previous studies used chemically induced or xenografted
tumors provide evidence that CRD causes enhanced tumor growth and thus
40036 Dycke, Kirsten.indd 15 11-04-16 11:02

Chapter 1
16
affect promotion and/or progression, but the studies could not give insight into
the effect of CRD on tumor initiation.
Box 2. CarcinogenesisThe multistage carcinogenesis theory is generally accepted and describes
three different stages between the initial carcinogenic stimulus and the final
manifestation of cancer (Berenblum, 1975). Following this theory, carcinogenesis
can be divided into initiation, promotion and progression. During the initiation
stage, a carcinogenic stimulus causes irreversible damage to the DNA, resulting in
potential for neoplastic development. The mutations causes either the activation
of a proto-oncogene or the inactivation of a tumor-suppressor gene. However,
without stimulation to proliferate the initiated cell will not develop into a
malignant tumor. The promotion stage is characterized by prolonged exposure to
promoting stimuli (Upton et al., 1986), causing the selective clonal expansion of the
initiated cell, resulting in a pre-neoplastic lesion. These cells become increasingly
unresponsive to cellular signals that regulate cell growth and proliferation. Further
genetic changes will result in more heterogeneity and aggressive characteristics
during the progression stage. The proliferation rate increases and tumor growth
becomes invasive, eventually resulting in distant metastasis. In this stage,
angiogenesis is required for tumor growth beyond 2 mm size (Folkman, 1985).
The circadian clock is involved in several aspects of carcinogenesis. DNA repair
pathways are in place to prevent irreversible damage to the DNA, resulting in
tumor initiation. It has been suggested that all aspects of the cellular response
to DNA damage are controlled or influenced by the circadian clock (Sancar et al.,
2010). Furthermore, it has been shown that the rate of tumor growth is highly
rhythmic during the day (You et al., 2005).
Overall, many animal experiments have been performed to elucidate the causal
relationship between circadian rhythm disturbance and mammary gland tumor
development (for references see Table 2). Table 1 summarizes all breast cancer
specific animal experiments published up to June 2015. The majority of the studies
used an exposure model resulting in disruption of the endogenous circadian
rhythm (n=13) or complete suppression of the circadian rhythm by continuous
light (n=11). Breast cancer induction in the majority of the studies involved
mouse models with rapidly growing tumors, either induced chemically (n=16) or
xenografted (n=5).
40036 Dycke, Kirsten.indd 16 11-04-16 11:02

General introduction
17
1
Figure 2. Carcinogenesis (Adapted from Weston & Harris Cancer Medicine 6th edition). Carcinogenesis comprises three stages: initiation, promotion and progression. In the initiation stage, a mutation occurs in a gene of one of the key regulatory pathways of the cell. Subsequently, the initiated cell selectively proliferates during promotion. Due to the genetic instability, additional mutations occur resulting in malignant cell growth: progression and ultimately to metastasis.
Overall, many animal experiments have been performed to elucidate the causal
relationship between circadian rhythm disturbance and mammary gland tumor
development (for references see Table 1). Table 1 summarizes all breast cancer
specific animal experiments published up to June 2015. The majority of the studies
used an exposure model resulting in disruption of the endogenous circadian
rhythm (n=13) or complete suppression of the circadian rhythm by continuous
light (n=11). Breast cancer induction in the majority of the studies involved
mouse models with rapidly growing tumors, either induced chemically (n=16) or
xenografted (n=5).
Table 1. Studies investigating the relationship between CRD and breast cancer development, shown as studies with positive outcome/all studies.
Circadian disruption / disturbance model
Breast cancer Induction
Altered light schedules
Continuous light exposure
Endogenous circadian rhythm disruption
Total
Spontaneous cancer development - 1/3 2/2 3/5
Chemically induced cancer 0/1 4/6 4/9 8/16
Xenografted tumors 1/1 2/2 2/2 5/5
Total 1/2 7/11 8/13 16/26
Although various animal models show increased tumor development or growth
upon circadian disruption, none of these studies fully recapitulate the human shift
work and carcinogenesis situation. For the circadian disruption models holds that
40036 Dycke, Kirsten.indd 17 11-04-16 11:02

Chapter 1
18
the lack of a functional clock is different from the shift work situation where a
functional circadian clock is continuously strained or disturbed. Obviously, models
using xenografted tumors or tumor cell lines can only study tumor growth and
chemical induction of tumors is extremely potent, leaving limited space for tumor
initiation by CRD. Moreover, the window of exposure in these models is limited
to weeks due to the rapid tumor development, which does not allow mimicking
long-term exposure scenarios as experienced by shift workers. Interestingly, no
studies were performed combining spontaneous breast tumor development with
an exposure protocol focused on disturbing rather than disrupting the circadian
rhythm. Consequently, there is a need for studies that combine relevant models for CRD exposure and breast tumor development to provide experimental evidence for the shift work-cancer connection.
Li-Fraumeni mouse modelA mouse model with a predisposition for human relevant breast cancer provides
a unique tool to experimentally study the shift work breast cancer relationship.
Mutations in the tumor suppressor gene p53 are associated with increased tumor
development (Coles et al., 1992), progression (Borresen-Dale, 2003), recurrence
(Norberg et al., 2001) and decreased response to therapy. Additionally, Li-
Fraumeni syndrome patients, carrying germ line p53 mutations, are predisposed
to developing breast cancer at a relatively early age (Varley et al., 1997). Given
the apparent important role of p53 in preventing breast tumor development in
humans, a mouse model with a similar defect in p53 is a valuable tool to study
breast tumor development. Therefore, a transgenic mouse model was developed
with mammary gland specific expression of the p53.R270H mutation, resulting in
spontaneous mammary gland tumorigenesis mimicking human breast cancer
development (Wijnhoven et al., 2005). Expression of the mutation in mammary
tissue was achieved by crossing p53.R270H mutant mice with mammary-specific
Cre transgenic mice having Cre recombinase under the control of the hormone-
inducible Whey Acidic Protein (WAPCre mice; (Wagner et al., 1997)). This mouse
model has been shown to develop human relevant mammary gland tumors,
including hormonal receptor status, with a latency time of approximately one
year. This combination provides a human relevant endpoint and sufficient time for exposure to study the relationship between chronic CRD and breast cancer development experimentally.
40036 Dycke, Kirsten.indd 18 11-04-16 11:02

General introduction
19
1Ta
ble
2. D
etai
led
info
rmat
ion
of a
ll st
udie
s in
clud
ed in
Tab
le 1
.
Stud
y/au
thor
Stud
y po
pula
tion
Endp
oint
Brea
st c
ance
r in
duct
ion
Expo
sure
mod
elFi
ndin
gs
(Ani
simov
et a
l., 20
04)
Mic
eTu
mor
spe
ctru
mSp
onta
neou
sCo
nsta
nt (d
im) l
ight
Incr
ease
d tu
mor
inci
denc
e (K
haet
ski,
1965
)Ra
tsM
amm
ary
glan
d tu
mor
DM
BACo
nsta
nt (d
im) l
ight
Incr
ease
d tu
mor
inci
denc
e
(Ham
ilton
, 196
9)Ra
tsM
amm
ary
glan
d tu
mor
DM
BACo
nsta
nt (d
im) l
ight
Incr
ease
d tu
mor
inci
denc
e (K
otha
ri et
al.,
1984
, Mha
tre
et a
l., 19
84, S
hah
et a
l., 19
84)
Rats
Mam
mar
y gl
and
tum
orD
MBA
1)
Cons
tant
(dim
) lig
ht
2)
Pine
alec
tom
y1)
In
crea
sed
tum
or in
cide
nce
2)
No
effec
t(C
os e
t al.,
2006
)Ra
tsM
amm
ary
glan
d tu
mor
gr
owth
DM
BACo
nsta
nt (d
im) l
ight
Incr
ease
d tu
mor
gro
wth
(And
erso
n et
al.,
2000
)Ra
tsM
amm
ary
glan
d tu
mor
DM
BACo
nsta
nt (d
im) l
ight
Dec
reas
ed tu
mor
inci
denc
e(B
lask
et a
l., 20
03)
Rats
MC
F7 tu
mor
gra
ftTu
mor
cel
l lin
e gr
aft
Cons
tant
(dim
) lig
htIn
crea
sed
tum
or g
row
th(B
lask
et a
l., 20
05)
Rats
MC
F7 tu
mor
gra
ftTu
mor
cel
l lin
e gr
aft
Infu
sion
with
blo
od o
f wom
en
expo
sed
to a
nig
htly
ligh
t pul
seIn
crea
sed
tum
or g
row
th
(Sub
ram
ania
n an
d Ko
thar
i, 19
91)
Rats
Mam
mar
y gl
and
tum
orD
MBA
Pine
alec
tom
yIn
crea
sed
tum
or in
cide
nce
and
grow
th
(Bla
sk e
t al.,
1991
)Ra
tsM
amm
ary
glan
d tu
mor
NM
UPi
neal
ecto
my
No
effec
t(S
hah
et a
l., 19
84)
Rats
Mam
mar
y gl
and
tum
orD
MBA
Pine
alec
tom
yN
o eff
ect
(Lap
in, 1
978)
Rats
M
amm
ary
glan
d tu
mor
DM
BAPi
neal
ecto
my
Incr
ease
d tu
mor
inci
denc
e(A
uber
t et a
l., 19
80)
Rats
Mam
mar
y gl
and
tum
orD
MBA
Pine
alec
tom
yN
o eff
ect
(Tam
arki
n et
al.,
1981
)Ra
tsM
amm
ary
glan
d tu
mor
DM
BAPi
neal
ecto
my
Incr
ease
d tu
mor
inci
denc
e(T
ravl
os e
t al.,
2001
)Ra
tsM
amm
ary
glan
d tu
mor
NM
U1)
Pi
neal
ecto
my
2)
Nig
htly
ligh
t pul
se1)
N
o eff
ect
2)
No
effec
t(C
limen
t et a
l., 20
10)
Mic
eM
amm
ary
glan
d tu
mor
1)
DM
BA2)
M
MTV
-Neu
3)
Spon
tane
ous
Per3
kno
ck-o
ut1)
, 2),
3) In
crea
sed
tum
or in
cide
nce
(Yan
g et
al.,
2009
b)M
ice
MTC
L tu
mor
gra
ftTu
mor
cel
l lin
e gr
aft
Per2
kno
ck-d
own
Incr
ease
d tu
mor
gro
wth
(Yan
g et
al.,
2009
a)M
ice
MTC
L tu
mor
gra
ftTu
mor
cel
l lin
e gr
aft
Per1
kno
ck-d
own
Incr
ease
d tu
mor
gro
wth
(Vin
ogra
dova
et a
l., 20
09)
Rats
Tum
or s
pect
rum
Spon
tane
ous
Cons
tant
(dim
) lig
ht
Incr
ease
d tu
mor
gro
wth
, no
effe
ct o
n m
amm
ary
glan
d tu
mor
(Vin
ogra
dova
et a
l., 20
10)
Rats
Tum
or s
pect
rum
Spon
tane
ous
Cons
tant
(dim
) lig
htIn
crea
sed
tum
or g
row
th,
no e
ffect
on
mam
mar
y gl
and
tum
or(W
u et
al.,
2011
)Ra
tsM
CF7
tum
or g
raft
Tum
or c
ell l
ine
graf
tCo
nsta
nt (d
im) l
ight
Incr
ease
d tu
mor
gro
wth
(Bla
sk e
t al.,
2014
)Ra
tsM
CF7
tum
or g
raft
Tum
or c
ell l
ine
graf
tCo
nsta
nt (d
im) l
ight
Incr
ease
d tu
mor
gro
wth
40036 Dycke, Kirsten.indd 19 11-04-16 11:02

Chapter 1
20
Monitoring CRD for interventionsGiven the wide variety of observed health effects, biomarkers are needed that
detect chronic CRD (long) before adverse health effects occur. Biomarkers are a
valuable source of information, enabling early or non-invasive detection of disease
or disease risk factors. Currently available or gold standard biomarkers for circadian
rhythm studies are melatonin, corticosterone and body temperature. These
markers are often used in studies to assess the effect of shift work (Niu et al., 2015,
Papantoniou et al., 2014, Sack et al., 1992), but have several limitations for the use in
large populations. An overall drawback of these classical markers of the circadian
rhythm is the need for around the clock measurement. In relation to this circadian
rhythmicity, for melatonin and body temperature the peak of the rhythm depends
on chronotype (Lack et al., 2009), which in turn alters with age, complicating the
use of these markers in longitudinal studies. Additionally, melatonin peak serum
levels can be suppressed by light exposure during the night (Davis and Mirick,
2006) making routine assessment more difficult. Moreover, classical markers are
acutely altered after impingement on the circadian system and are not related
to the (chronic) adverse health outcomes. Therefore, universal biomarkers for circadian rhythm disturbance are needed to compare CRD models, to evaluate the effect of preventive measures and to measure the personal risk of a shift worker.
Aim and outline of this thesisThe aim of this thesis is to study the causal relationship between chronic circadian
disturbance and adverse health effects. Additionally, identifying underlying
mechanisms and potential biomarkers for CRD to aid the development and study
of preventive measures are objectives as well. Finally, a new model to study health
effects of shift work in animal studies is presented.
In chapter 2 we used a unique breast cancer-prone mouse model to study the
causal relation between chronic CRD and breast cancer development. Besides
breast cancer risk, the effects of CRD on body weight gain, sleep probability and
classical circadian markers were investigated. As described previously, several
scenarios have been suggested to underlie the relationship between shift work and
cancer, in this chapter we show the relevance or irrelevance of these mechanisms.
40036 Dycke, Kirsten.indd 20 11-04-16 11:02

General introduction
21
1The presence of a causal relationship between shift work and adverse effects,
warrants the detection of biomarkers for early detection of disturbance in order
to develop preventive measures. Transcriptomic studies provide a valuable tool
to obtain a complete overview of gene activity in tissues of interest. In chapter 3,
a proof of principle is given using a comparative transcriptomics approach to
identify potentially blood detectable biomarkers for breast cancer. A similar
approach was used to identify biomarkers for CRD, independent of time of day,
in chapter 4. Besides using biomarkers for CRD, in large cohort studies one could
opt for the use of biomarkers related to disease outcome. The measurement of
these biomarkers in a molecular epidemiology-like setting requires knowledge
of their daily blood level patterns. Chapter 5 provides a descriptive study of the
daily variation of hormonal and lipid biomarkers, often used in large scale studies.
Development of evidence-based preventive measures further require insight into
underlying biological mechanisms.
In chapter 6, hepatic gene expression was analyzed to identify genes and
processes affected by chronic CRD. Both the effects on genes that show circadian
rhythmicity under normal conditions and on overall gene expression are described.
Subsequently, the role of these genes in biological processes relevant for the
observed phenotype was investigated.
40036 Dycke, Kirsten.indd 21 11-04-16 11:02

40036 Dycke, Kirsten.indd 22 11-04-16 11:02

CHAPTER 2
Chronically alternating light cycles increase breast cancer risk in
mice
Kirsten C.G. Van Dycke, Wendy Rodenburg, Conny T.M. van Oostrom,
Linda W.M. van Kerkhof, Jeroen L.A. Pennings, Till Roenneberg, Harry van Steeg
and Gijsbertus T.J. van der Horst
Current Biology, 2015, 25(14): 1932-7
40036 Dycke, Kirsten.indd 23 11-04-16 11:02

Chapter 2
24
2
Summary
Although epidemiological studies in shift workers and flight attendants have
associated chronic circadian rhythm disturbance (CRD) with increased breast
cancer risk, causal evidence for this association is lacking (Pukkala et al., 1995,
Schernhammer et al., 2006). Several scenarios have been proposed to contribute
to the shift work-cancer connection: (i) internal desynchronization, (ii) light at
night (resulting in melatonin suppression), (iii) sleep disruption, (iv) lifestyle
disturbances and (v) decreased vitamin D levels due to lack of sun light (Fritschi
et al., 2011). The confounders inherent in human field studies are less problematic
in animal studies, which are therefore a good approach to assess the causal
relation between circadian disturbance and cancer. However, the experimental
conditions of many of these animal studies were far from the reality of human
shift workers. For example, some involved xenografts (addressing tumor growth
rather than cancer initiation and/or progression) (Blask et al., 2003, Filipski et
al., 2004), chemically induced tumor models (Hamilton, 1969, Shah et al., 1984)
or continuous bright light exposure, which can lead to suppression of circadian
rhythmicity (Anisimov et al., 2004, Wu et al., 2011). Here, we have exposed the
breast cancer-prone p53R270H©/+ WAPCre conditional mutant mice (in a FVB genetic
background) to chronic CRD by exposing them to a weekly alternating light-dark
(LD) cycle throughout their life. Animals exposed to the weekly LD-inversions
showed a decrease in tumor suppression. In addition, these animals showed an
increase in body weight. Importantly, this study provides the first experimental
proof that CRD increases breast cancer development. Finally, our data suggest
internal desynchronization and sleep disturbance as mechanisms linking shift
work with cancer development and obesity.
40036 Dycke, Kirsten.indd 24 11-04-16 11:02

CRD increases breast cancer risk
25
2
Experimental Procedures
Experimental set-upTo study the effect of chronic circadian disturbance (CRD) on the development of
breast tumors, breast cancer-prone female p53R270H©/+WAPCre conditional mutant
mice in an FVB genetic background were chronically exposed to a LD-inversion
protocol. The p53 R270H mutation in human Li-Fraumeni patients occurs in
their germline and patients consequently develop tumors in a variety of tissues,
including breast cancer. Since we are specifically interested in breast tumor
development in the current study, we used the conditional p53R270H©/+ model, in
which the mutation was specifically activated in mammary gland tissue through
WAP-driven cre-recombinase. The generation of these mice has been previously
described (Wijnhoven et al., 2005). Cre recombinase expressing mammary gland
cells have been shown without pregnancy (Derksen et al., 2011), therefore virgin
mice were used in this study. At 8 weeks of age, mice were randomly assigned to
remain under a normal 12:12 hour light-dark (LD) cycle or to undergo a weekly
alternating 12:12 hour light-dark cycle. After approximately 18 shifts, on day 7 of
the last shift, a cross-sectional sample of animals was sacrificed around the clock,
with 4 hour intervals (cross-sectional study, n=4 per time point). Blood and tissues
were collected for further analysis. The remainder of the animals (longitudinal
study, n=25 per group) stayed under LD or weekly LD-inversion (CRD) conditions
and were sacrificed after when tumors reached approximately 1 cm3 or when
animals were found moribund. Due to premature animal loss, 21 animals per
condition were available for further analysis in the cross-sectional experiment.
In the longitudinal study, 20 and 21 animals were available for body weight and
tumor-free survival analyses for the control and CRD groups, respectively. In an
additional group of mice (n=5 per group), a radio transmitter (Physio Tel, TA11 TA-
F10; Data Sciences, St. Paul, MN) was implanted in the peritoneal cavity to record
locomotor activity and core body temperature every ten minutes.
The animal handling in this study was performed in compliance with national
legislation, including the 1997 Dutch Act on Animal Experimentation, and the
experiments were approved by the institute’s Animal Experimentation Ethical
Committee.
40036 Dycke, Kirsten.indd 25 11-04-16 11:02

Chapter 2
26
2
Breast tumor developmentMice were palpated once a week to check for tumor development. The time of first
mammary tumor detection was registered and used to determine latency times. To
confirm the presence of a tumor and determine tumor type, paraffin-embedded,
formalin-fixed tumor sections were stained with H&E for histopathological
evaluation.
Body weight and food intakeMice and food were weighed weekly to determine body weight gain and food
intake. Body weight gain was expressed as percentages of body weight at the start
of the experiment and was statistically analyzed at 28 weeks of exposure, the last
time point without tumor-bearing animals. Animals were group-housed with three
to four animals per cage; therefore, food intake was expressed as average weekly
food intake. Food intake was measured between 8 and 15 weeks of exposure in
the cross-sectional study.
Gene expression, corticosterone and vitamin D levelsCircadian expression levels of clock genes Bmal1, Per1, Per2, Dbp and cell cycle
control gene c-Myc were determined in livers of control and weekly alternated
LD cycle exposed cross-sectional animals, using quantitative reverse transcription
polymerase chain reaction (RT-PCR). All oligonucleotide primers were obtained
from Life Technologies (Bleiswijk, The Netherlands). Total RNA was extracted from
RNAlater (Invitrogen, Grand Island, NY, USA) protected liver tissues using the
miRNeasy Mini Kit (Qiagen Benelux, Venlo, The Netherlands). Clock gene expression
was given as relative expression compared to a reference pool containing all
samples. Corticosterone and vitamin D serum levels were determined using ELISA
assays (Yanaihara Institute Inc. Shizuaka, Japan and Immunodiagnostics Systems,
Frankfurt am Main, Germany, respectively).
Body temperature and activityBody temperature and behavioral activity were recorded for 2 weeks at baseline,
after 1 shift and after 18 shifts. Cosine curves were fitted using the R statistical
software environment (http://www.r-project.org) to determine the acrophase of
activity and body temperature rhythms (i.e., peak time). Acrophase was expressed
in External Time (ExT) (Daan et al., 2002), with ExT 0 indicating mid-dark. Sleep
patterns were determined using mice telemetry data as described previously for
40036 Dycke, Kirsten.indd 26 11-04-16 11:02
CRD increases breast cancer risk
27
2
human wrist actimetry data (Juda et al., 2013b). In short, telemetric activity data
were collected in 10-min bins, and sleep episodes were automatically detected by
the method described earlier. Based on a non-rhythmic trend (calculated by using
centered moving 24-h averages), sleep (=1) and wake (=0) t were dichotomized
according to being below or above a selected threshold (15% of the trend). Onsets
and offsets of sleep episodes were then assessed by a correlation method as earlier
described in detail (Juda et al., 2013a, Roenneberg et al., 2015).
StatisticsAll data are expressed as means ± standard error of the mean (SEM) and were
visualized and statistically analyzed using GraphPad Prism software version 6.04
for Windows (GraphPad Software, San Diego California USA, www.graphpad.com).
Differences in body weight gain at 28 weeks, tumor latency time and vitamin D
serum levels were statistically tested using Kolmogorov-Smirnov test. Differences
between LD-inversion and LD animals in food-intake, gene expression and
corticosterone serum levels were analyzed using a two-way analysis of variance
(ANOVA) followed by Sidak’s posttest. Linear regression was performed to analyze
changes in total sleep, sleep in light and sleep in dark over time. Subsequently,
differences between the slopes for the LD and CRD group were analyzed. CircWave
Batch v5.0 software (Roelof Hut, www.euclock.org) was used to analyze circadian
rhythmicity of gene expression and serum levels. The ChronoSapiens software was
used to analyze behavioral data (Roenneberg et al., 2015).
Results
Classical circadian rhythmsTo investigate the potential causal links between chronic CRD and enhanced cancer
risk in more detail, we placed breast cancer prone p53R270H©/+ WAPCre conditional
mutant mice (further referred to as p53R270H©/+ WAPCre mice (Wijnhoven et al.,
2005) in a 12 hour light, 12 hour dark cycle (LD 12:12). At the end of every week,
the light or dark phase was extended to 24 hours to invert the LD cycle. Mice were
sacrificed after tumor development (longitudinal study) or around the clock after
approximately 18 LD-inversions (cross-sectional study). To monitor the extent to
which this protocol affected the circadian steady state, we recorded locomotor
activity and core body temperature (CBT) in an additional group of animals. Under
40036 Dycke, Kirsten.indd 27 11-04-16 11:02

Chapter 2
28
2
baseline LD schedules, all p53R270H/+ WAPCre animals showed regular daily activity and
CBT rhythms (Fig. 1a for CBT; activity data not shown). The temperature maximum
is reached approximately at External Time (ExT) 20. After the LD-inversions, the CBT
rhythm re-established a stable phase of entrainment after 3-4 days of transients,
which appeared to be more gradual after the first inversion (Fig. 1b) compared
to inversion-week 18 (Fig. 1c). On day 7 after the 18th LD-inversion, representing
steady state, CBT showed a circadian rhythm, but its peak was significantly delayed
by 2 hours compared with age-matched control animals (p = 0.010).
Long-term health effectsIn the longitudinal experiment, as shown in Figure 2a, mice exposed to weekly
LD-inversions showed a larger increase in relative body weight compared to the
animals kept in a stable LD cycle (RM-ANOVA, group: p = 0.0319; time: p < 0.0001;
interaction: p < 0.0001). Although already apparent at week 6, group differences
only became significant after week 24 (Sidak’s posttest p < 0.05). The difference
in body weight gain between the groups did not reach significance in the cross-
sectional experiment (RM-ANOVA, group: p = 0.1410; time: p < 0.0001, interaction,
p = 0.4049), probably due to a shorter experiment time and fewer LD-inversions
(Fig. S1a). Differences in the amount of food-intake cannot explain the general
weight-gain in the LD-inversion groups, since we even found a small, significant
decrease in food intake in these animals compared to the stable LD controls (Fig.
S1b).
The latency to mammary gland tumor development was reduced by 17% in the
CRD-exposed mice compared to the LD control mice (Fig. 2b, median latency time:
42.6 versus 50.3 weeks, respectively; Kolmogorov-Smirnov p = 0.0127). Chronic
LD-inversion affected neither the number of tumor-bearing mice nor tumor
type (mammary gland tumors or other tumors). In both groups, approximately
80% of the animals developed mammary tumors, including carcinomas and
carcinosarcomas (Table S1).
40036 Dycke, Kirsten.indd 28 11-04-16 11:02

CRD increases breast cancer risk
29
2
Figure 1. Peak temperature phases under LD and CRD conditions. (A-C) of p53R270H/+WAPCre animals maintained under stable LD 12:12 conditions (closed symbols) or weekly alternating light cycles (open symbols) (n=5 animals per group) (a) before start of the light inversions, (b) at the first LD-inversion and (c) after 18 LD-inversions. Per graph, subsequent days are plotted from top to bottom. Time of day on the x-axis is expressed as External Time (ExT), with ExT 0 corresponding with mid-dark. The upper axis indicates the ExT before the LD-inversion. Values represent the mean ± SEM. Diamonds indicate the average temperature peak times of animals maintained under normal LD conditions. Data are presented as double plots to help visualizing phase shifts (day 0+1, day 1+2, day 2+3 etc. on consecutive lines). Grey areas indicate darkness.
40036 Dycke, Kirsten.indd 29 11-04-16 11:02

Chapter 2
30
2
Figure 2. Long-term health effects resulting from CRD exposure. (a) Relative body weight gain of p53R270H/+WAPCre animals exposed to a regular LD cycle (closed symbols, n=20) or weekly alternating LD cycles (open symbols, n=21) in the longitudinal study. Note the significantly stronger weight gain of animals exposed to chronically alternating light cycles compared with animals maintained under a regular LD cycle in the longitudinal study (RM-ANOVA, group: F(1, 39) = 4.950, p=0.0319; time: F(27, 1053) = 42.48, p<0.0001; interaction: F(27, 1053) = 3.738, p<0.0001). Values represent the mean ± SEM. (b) Percentage of mice with palpable tumor in normal LD cycles (n=20; closed symbols) or chronic CRD conditions (n=21; open symbols). Black color indicates mammary gland tumor, whereas red color indicates other tumor types. See Table S1 for pathology data.
Investigating proposed mechanisms of shift work-related carcinogenesisTo gain more insight into these increased health risks resulting from chronically
alternating light cycles, we focused on the proposed mechanisms linking shift
work to cancer (Fritschi et al., 2011). We analyzed clock (Per1, Per2, Bmal1) and
clock-controlled (Dbp, c-Myc) gene expression in liver and corticosterone serum
concentrations (Fig. 3) to identify alterations and desynchronization among organ-
specific clocks and/or between central and peripheral clocks. In line with behavior
and CBT, Per1, Per2 and Dbp hepatic gene expression re-entrained within 7 days in
the new LD regime (tested after 18 LD-inversions; CircWave all p-values smaller than
40036 Dycke, Kirsten.indd 30 11-04-16 11:02

CRD increases breast cancer risk
31
2
0.05; Two-way ANOVA all p-values larger than 0.05). Only Bmal1 showed significant
interaction between group and time, clearly resulting from increased expression in
the CRD group at ExT10. In contrast to the unimodal 24-hr corticosterone rhythm
in control animals, we found a significant bimodal (12-hr) rhythm in the CRD mice
with a major peak at ExT 14 and a minor peak at ExT 2. We also analyzed the cell
cycle control gene c-Myc, which was previously suggested to be clock-controlled
and to play a role in accelerated tumor growth after chronic jet-lag (Filipski et al.,
2005, Fu et al., 2002). Although a slight phase advance appears to be induced by
CRD exposure, no significant differences in expression kinetics were observed
between the two groups.
We did not find an effect of CRD on 25-hydroxy-vitamin D levels (data not shown).
This might be well explained by the fact that laboratory animals are not exposed
to sun light, and accordingly are not stimulated to synthesize vitamin D.
To study whether chronically alternating light cycles caused sleep disruption, we
used the activity recordings to determine the total amount of predicted sleep.
As we estimated sleep based on periods of inactivity, in our study, sleep refers to
sleep probability rather than actual sleep. As shown in Figure 4 (left panels), the
total amount of sleep showed a significant increase both in CRD mice (p < 0.0001;
slope = 0.01543) and controls (p < 0.05; slope 0.003814) with increasing time in the
experiment. However, the increase over time was significantly different (p < 0.001)
between the two groups. While the controls increased their total sleep over the
course of the experiment by 10%, CRD mice slept 50% more. Under LD conditions,
the slight increase in sleep results mostly from sleep consolidation during the light
phase (upper middle panel). In contrast, CRD-exposed animals increased their
sleep in both light and darkness (lower left panels).
As to be expected from the frequent need to re-entrain after LD-inversions (see
also Fig. 1), sleep in light was reduced to half of baseline levels after the inversion
(day 0; Fig. S2, lower panels) and consequently increased to 150% in the dark
phase. However, while sleep in dark returned to approximately baseline after 4
days in the new regime, sleep in light almost increased to 175% of baseline. This
imbalance shows that the increase of total sleep shown in Figure 4 is mainly due
to overcompensation during the normal sleep times of this nocturnal rodent. LD
controls showed normal variations in sleep timing across the week (for separate
analyses of the recorded weeks, see Fig. S3a and Fig. S3b).
40036 Dycke, Kirsten.indd 31 11-04-16 11:02

Chapter 2
32
2
Figure 3. Circadian expression of clock genes and c-Myc and corticosterone serum levels. Closed symbols = LD, open symbols = chronic LD-inversions. Circadian expression of clock genes Bmal1, Per1, Per2, Dbp and cell-cycle control gene c-Myc in liver and serum corticosterone levels (n= 3 or 4 mice per time point). Chronic LD-inversions did not significantly affect circadian expression of clock genes. Only minor differences were found at an individual time point for Bmal1 (*Sidak’s posttest p<0.05). The expression of c-Myc appears to show a phase advance in CRD-exposed animals, however no statistical differences were found. Corticosterone levels, however, were affected by the alternating light cycles. In contrast to the circadian rhythmicity in LD animals, corticosterone exhibits a significant 12-hr rhythm after 18 LD-inversions
40036 Dycke, Kirsten.indd 32 11-04-16 11:02

CRD increases breast cancer risk
33
2
with a major peak at ExT 14 and a minor peak around ExT 2 (p<0.05). Values at “lights on” were double plotted to help visualize circadian patterns. Values represent the mean ± SEM. Time of day on the x-axis is expressed as External Time (ExT), with ExT 0 corresponding with mid-dark.
Figure 4. Amount of predicted asleep per day (total sleep), in the light and dark phase, relative to baseline. Data represent means of animals per day, whereas linear regression analysis was performed on individual data points. Over time, total sleep and sleep in light significantly increased compared to baseline in both the LD (closed symbols) and LD-inversion (open symbols) group (Linear regression analysis: LD, total: p = 0.0492, light: p = 0.0002; LD-inversions, total: p < 0.0001, light: p < 0.0001). The amount of sleep in dark only increased after exposure to chronically alternating LD cycles (Linear regression analysis: LD: p = 0.5474 and LD-inversions: p = 0.0005). This gain of sleep was significantly larger for animals exposed to weekly LD-inversions compared to LD controls (comparison of slopes: total: F(1, 583) = 15.197, p = 0.0001; light: F(1, 583), p = 0.0391; dark: F(1, 583) = 8.744, p = 0.0032).
40036 Dycke, Kirsten.indd 33 11-04-16 11:02
Chapter 2
34
2
Discussion
Human field studies only offer limited insights into potential causalities between
shift work and cancer due to the complex network of influencing variables,
such as different shift work schedules, genetic heterogeneity, or individual shift
work history (including the healthy workers phenomenon) – to name only a few
(IARC, 2010). The p53R270H©/+ WAPCre mouse model for spontaneous breast cancer
development allowed us to study the effects of chronically alternating light cycles
on breast cancer initiation and/or progression; thus, this model differs from previous
xenograft and chemically induced tumor models that do not reliably recapitulate
the human situation (Blask et al., 2003, Cos et al., 2006). To our knowledge, this
is the first study that unequivocally shows a link between chronic LD-inversions
and breast cancer development. It thereby provides experimental evidence for
previous epidemiological data associating shift work and jet-lag with increased
breast cancer risk. Epidemiological studies have also indicated an association
between social jet-lag, shift work and body weight, although conflicting data exist
(Kubo et al., 2011, Nabe-Nielsen et al., 2011, Roenneberg et al., 2012, Parsons et
al., 2014). Various mouse studies have shown that circadian disturbance induced
by continuous light, forced activity or a disrupted LD cycle causes an increase in
body weight (Coomans et al., 2013, Oishi, 2009, Salgado-Delgado et al., 2008). Our
study, enforcing circadian strain by using changes in the environmental LD cycle
supports the relationship between CRD and weight-gain. The finding that CRD-
exposed animals sleep more than controls, logically correlates with less activity
and could thus contribute to a stronger weight gain. But to what extent are the
results presented here for a causal link between CRD and increased breast cancer
risk in a nocturnal rodent also relevant to human shift work?
Shift work involves many aspects that could be involved in the causal mechanisms
that lead to increased health risks: internal desynchronization, melatonin
suppression due to light at night, sleep disruption, lifestyle disturbances (such as
smoking, [lack of ] breastfeeding, unhealthy diet, altered timing of food, etc.), and
decreased vitamin D levels due to lack of sunlight exposure (Fritschi et al., 2011).
The current study provides further insight into the relevance of these separate
aspects (for an overview: see Fig. S4). Melatonin suppression, decreased vitamin D
levels nor lifestyle disturbances (absent in mice) cannot account for the enhanced
cancer risk in animals kept under LD-inversion conditions: (i) p53R270H©/+ WAPCre
mice (FVB background) are melatonin-deficient; (ii) neither CRD mice nor controls
40036 Dycke, Kirsten.indd 34 11-04-16 11:02
CRD increases breast cancer risk
35
2
were exposed to sunlight, and we found no difference in 25-hydroxy-vitamin D
between groups. This is consistent with a study in night shift workers which found
no difference in vitamin D levels between fixed daytime workers, rotating shift
workers without night shift and rotating shift workers with night shift (Itoh et al.,
2011). (iii) Lifestyle factors did not differ (amount of food intake) in the LD-inversion
mice and the controls or were absent (e.g. breast feeding, smoking). Given the
combination of decreased breast tumor latency time and increased body weight
after chronic LD-inversions, it is tempting to speculate on the role of timing of food
intake. Potentially, changed timing of food intake disrupts metabolic processes,
resulting in adverse health effects. Previous studies have shown that timed feeding
can indeed (partially) rescue tumor and obese phenotypes (Filipski et al., 2005,
Fonken et al., 2010).
Desynchrony between the sleep-wake cycle and endogenous circadian
rhythmicity was recently shown to disrupt the circadian regulation of the
human transcriptome (Archer et al., 2014a) and suggested to be an important
factor underlying shift work-mediated breast cancer risk (Fritschi et al., 2013). In
the present study, 7 days after the last LD-inversion, we found a disturbance of
the circadian rhythmicity of corticosterone levels. It should be noted that blood
samples were taken under ketamine/xylazine anesthesia, known to slightly increase
corticosterone levels (Arnold and Langhans, 2010). However, as mice in the control
and LD-inversion group were treated in similar manner, anesthesia is unlikely to
explain the disturbed corticosterone rhythm in LD-inversed mice. In contrast to
the disturbed corticosterone rhythm, on day 7 after the last inversion, we did
not observe alterations in the daily patterns of hepatic clock gene expression,
indicating that the liver clock reentrained within one week. However, disturbance
of circadian rhythms at earlier time points is inherent of the re-entrainment to the
new LD cycle. Minor differences in c-myc expression could be indicative of larger
differences at earlier time points. This would be in line with other studies in which
phase advances induce c-myc expression directly and three days after exposure
(Filipski et al., 2005, Iwamoto et al., 2014). Previous studies have shown effects on
both corticosterone rhythm and liver clock gene expression by other circadian
disturbance protocols (Filipski et al., 2004, Barclay et al., 2012). Corticosterone
has been shown to be involved in the entrainment and resynchronization of
locomotor activity and peripheral clocks (Kiessling et al., 2010, Sage et al., 2004,
Sujino et al., 2012). Liver clock gene expression is more sensitive to input of feeding
40036 Dycke, Kirsten.indd 35 11-04-16 11:02

Chapter 2
36
2
for entrainment (Sujino et al., 2012), which might explain the discrepancy and thus
desynchrony between the disrupted corticosterone rhythm and reentrained clock
gene expression in liver.
Sleep duration, sleep timing and sleep quality are central elements of human shift
work studies, both as outcome variables (in the form of descriptives of shift work-
related strain (Akerstedt, 2003) or post-intervention measures, (Neil et al., 2014,
Vetter et al., 2015)) and as a proposed countermeasure (e.g., schedule-specific sleep
strategies (Petrov et al., 2014)). As long-term sleep analysis in mice is challenging,
sleep was estimated based on inactivity, and accordingly refers to sleep probability
rather than actual sleep. However, there is a good consensus in the literature that
extended bouts of inactivity highly correlate with actual electroencephalogram
(EEG) and/or polysomnogram (PSG) detected sleep. In the Drosophila literature,
5-minute bouts of inactivity are considered sleep (Shaw et al., 2000) and
experiments in mice have shown that inactivity periods of 40 sec highly correlate
with EEG-scored sleep (Pack et al., 2007). Similarly high correlations are reported
for video-recorded immobility and EEG-scored sleep (Fisher et al., 2012). Since the
sleep analysis conducted here is based on relative immobility within 10-min bins,
we likely underestimate rather than overestimate the duration and frequency of
sleep episodes. Despite the potential risk of mistaking immobility in a wake mouse
for sleep, we consider our sleep-assessments as a good correlate for actual sleep
duration.
In human shift workers, sleep timing constantly changes, which results in shorter
sleep (and reduced sleep quality). In contrast, we observed that mice exposed
to chronic LD-inversions – not accompanied by forced sleep deprivation due to
work – sleep more. The finding that CRD-mice appear to sleep more than control
animals seems to contradict findings in shift-workers, who usually sleep less than
day-workers (Juda et al., 2013a). However, unlike real shift workers, the CRD protocol
in our animal study only involved changes in the LD cycle without the additional
sleep restrictions enforced by work-shifts impinging on usual rest times. Assuming
that the correlation between inactivity and sleep in mice is not influenced by the
exposure to chronically alternating light cycles, we propose that the increase in
amount of sleep observed upon CRD represents compensation for the constant
perturbations of circadian timing and sleep. Future studies, addressing sleep and
wakefulness by EEG rather than sleep probability, should provide a definite answer
40036 Dycke, Kirsten.indd 36 11-04-16 11:02

CRD increases breast cancer risk
37
2
to what extend sleep time and quality are affected upon chronically alternating
light cycles.
The search for the underlying mechanisms that link shift work and health detriments
(including increased cancer prevalence) is difficult in human shift work studies due
to the network of potentially mediating factors. Controlled laboratory experiments,
though performed in a nocturnal mouse model, allow the identification, isolation
and quantification of individual contributors. The present study provides additional
evidence for the role of internal desynchronization and sleep disruption in the
etiology of CRD-associated health risks and pathologies (e.g., obesity and cancer;
see Fig. S4). Female p53R270H©/+ WAPCre conditional mutant mice are ideal for
investigating this etiology for breast cancer risk in depth. Furthermore, the highly
controlled experimental conditions allow us to identify molecular biomarkers for
CRD or other (shift work-related) exposures. Despite being based on a nocturnal
mouse model, our results strongly suggest that individuals with hereditary (breast)
cancer predispositions should not be exposed to frequently changing Zeitgebers
as they exist for example in shift work or trans-meridian aviation. Due to the
growing 24/7 economy, shift work will become increasingly part of our society and
will, therefore, increasingly affect public health outcomes. Our experimental setup
provides a unique tool for exploring underlying mechanism as well as devising
countermeasures.
40036 Dycke, Kirsten.indd 37 11-04-16 11:02

40036 Dycke, Kirsten.indd 38 11-04-16 11:02

CHAPTER 3
Biomarker discovery using a comparative omics approach in a
mouse model developing heterogeneous mammary
cancer subtypes
Jeroen L.A. Pennings*, Kirsten C.G. Van Dycke*, Conny T.M. van Oostrom,
Raoul V. Kuiper, Wendy Rodenburg, and Annemieke de Vries
*joint first authors
Proteomics, 2012, 13: p2149-57
40036 Dycke, Kirsten.indd 39 11-04-16 11:02

Chapter 3
40
3
Abstract
Identification of biomarkers for early breast cancer detection in blood is a
challenging task, since breast cancer is a heterogeneous disease with a wide
range of tumor subtypes. This is envisioned to result in differences in serum
protein levels. The p53R270H/+WAPCre mouse model is unique in that these mice
spontaneously develop both ER− and ER+ tumors, in proportions comparable
to humans. Therefore, these mice provide a well-suited model system to identify
human relevant biomarkers for early breast cancer detection that are additionally
specific for different tumor subtypes. Mammary gland tumors were obtained
from p53R270H/+WAPCre mice and cellular origin, ER, and HER2 status were
characterized. We compared gene expression profiles for tumors with different
characteristics versus control tissue, and determined genes differentially expressed
across tumor subtypes. By using literature data (Gene Ontology, UniProt, and
Human Plasma Proteome), we further identified protein candidate biomarkers for
blood-based detection of breast cancer. Functional overrepresentation analysis
(using Gene Ontology, MSigDB, BioGPS, Cancer GeneSigDB and proteomics
literature data) showed enrichment for several processes relevant for human
breast cancer. Finally, Human Protein Atlas data were used to obtain a prioritized
list of 16 potential biomarkers that should facilitate further studies on blood-based
breast cancer detection in humans.
40036 Dycke, Kirsten.indd 40 11-04-16 11:02

Biomarkers for breast cancer
41
3
Introduction
Breast cancer is the most frequently diagnosed cancer and leading cause of cancer
death among women worldwide (Ferlay et al., 2010). The most efficient way to
reduce cancer mortality and morbidity is detection at an early stage, allowing
effective therapeutic intervention. One way to improve cancer detection could
be by means of a non-invasive test based on blood biomarkers. Preferably, these
serum markers detect breast cancer across multiple tumor types regarding
histopathology or diagnostic marker status, in an early stage of the disease.
Currently, CA15-3, CA27-29 and CEA are clinically used breast cancer serum
biomarkers for postoperative surveillance in patients with no evidence of disease
and monitoring therapy in patients with advanced breast cancer rather than early
detection (Sturgeon et al., 2008, Ludwig and Weinstein, 2005). Additionally, the
use of HER2/neu/ERBB2 (in shed form) in serum for disease monitoring in patients
without elevation of other tumor markers and for monitoring of Trastuzumab
treatment is under evaluation (Sturgeon et al., 2008), and CA125 has also been
suggested as tumor marker for advanced breast cancer (Norum et al., 2001).
However, these clinical serum biomarkers are only used for disease monitoring and
prognosis, and there are currently no FDA approved biomarkers for early detection
of breast cancer. Therefore, much international effort is put into identification and
validation of novel serum biomarkers for early breast cancer diagnosis (EDRN,
Kretschmer et al., 2011, Böhm et al., 2011, Opstal-van Winden et al., 2011).
Breast cancer is a heterogeneous disease, with a large variety of tumor subtypes
(Sorlie et al., 2001). Due to this heterogeneity, the identification and use of a
single biomarker for breast cancer detection is challenging. Here, we focus on
the identification of a panel of biomarkers which allows for detection with high
specificity and sensitivity across various kinds of breast cancer tumor types to
maximize screening applicability. In addition to a biomarker panel for all tumor
types, it would be beneficial to be able to distinguish between tumor subtypes,
as the prognosis and therapeutic approach is different for each subtype. Such
additional information on prognosis and therapy could lead to better follow-up and
referral of newly diagnosed patients. Relevant information in this respect would be
e.g. estrogen receptor alpha (ER) and HER2/neu status as well as histopathological
classification.
40036 Dycke, Kirsten.indd 41 11-04-16 11:02

Chapter 3
42
3
A growing body of evidence demonstrate that mouse models for cancer
(summarized in (Kelly-Spratt et al., 2008)) show common molecular, biological
and clinical features compared to human cancers and as such these models are
considered a promising tool for identification of cancer biomarkers (Kelly-Spratt et
al., 2008). The human relevance of this approach is shown in a mouse model for
breast cancer where the overlap of the plasma proteome is compared to proteomics
studies of human breast cancer cell lines (Pitteri et al., 2008). However, mouse
models used thus far for breast cancer biomarker identification (Whiteaker et al.,
2007, Pitteri et al., 2008, Schoenherr et al., 2011, Whiteaker et al., 2011) exclusively
develop ER negative mammary gland tumors, while estrogen is thought to play
an important role in breast tumors development (Nandi et al., 1995). Moreover,
the majority of human breast tumors are ER positive. In our study, we use an
innovative mouse model developed previously in our laboratory (Wijnhoven et al.,
2005) which spontaneously develops ER positive and negative tumors, resembling
the human situation. This p53R270H/+WAPCre mouse model develops tumors of two
different histopathological types: carcinomas and carcinasarcomas. Carcinoma is
the most common tumor type found in women and therefore most relevant in
this study. Although carcinosarcomas are rare in humans, this subclass shows a
poor prognosis and early detection is highly necessary, since 5-year overall survival
reaches zero if detected at later stages (Gutman et al., 1995). In addition to the
estrogen receptor status, and the two histological subtypes, we were also able
to determine different HER2/neu status based on gene expression data. HER2/
neu amplification in human breast cancers is associated with lower 5-year survival
(Sotiriou and Pusztai, 2009). However, a positive HER2/neu status makes women
eligible for trastuzumab treatment which improves survival significantly (Gianni et
al., 2011). As such, HER2/neu based differentiation is highly important.
In this study, we use a genomics approach on this mouse model mimicking
heterogeneous breast tumor development in humans, to identify candidate
protein biomarkers relevant for early blood-based detection of human breast
cancer. First, we compare different types of tumor and control tissue from the
p53R270H/+WAPCre mouse model to determine genes which are informative across
multiple tumor subtypes versus control, or which are able to distinguish between
tumor subtypes. In the next step, we determine which of these mouse genes have
a human equivalent that encodes for a protein potentially detectable in human
serum. Finally, we compare the obtained lists with relevant information in other
40036 Dycke, Kirsten.indd 42 11-04-16 11:02

Biomarkers for breast cancer
43
3
databases to functionally characterize and prioritize the proteins for follow-up
studies.
Materials and Methods
Animal experimentThis study was approved by the Animal Experimentation Ethical Committee of
our institute. Animal handling in this study was carried out in accordance with
relevant Dutch national legislation, including the 1997 Dutch Act on Animal
Experimentation.
Generation of p53R270H/+WAPCre mice and the phenotypic characteristics have
been described previously (Wijnhoven et al., 2005). Heterozygous p53R270H
and WAPCre mice, originally in a hybrid background (Wijnhoven et al., 2005),
were crossed to FVB mice to generation F6. Female p53R270H/+WAPCre mice
were generated by crossing female heterozygous p53R270H mice with male
heterozygous WAPCre mice. All mice were weighed weekly and checked for the
development of tumors by palpation. Mice were sacrificed immediately after
detection of a palpable tumor (62±12 weeks of age), since our analysis was aimed
at the identification of biomarkers for early detection of breast cancer. All tumors
were dissected and weighed, the tumor size ranged from 52 to 988 mg with a
median tumor weight of 328 mg. Control mammary glands were isolated from
the same animals at the opposite site of the tumor. Tumors were processed for
histopathology following standard procedures. For comparison with control tissue
from a wild type strain, female FVB/N mice were sacrificed at 55 weeks of age and
mammary tissue was collected.
Histology and immunohistochemistryParaffin-embedded, formalin fixed tumor sections were stained with H&E for
histopathological evaluation. ER expression was analyzed using the rabbit
polyclonal antibody MC-20 (1:200; Santa Cruz Biotechnology, Santa Cruz, CA). In
this study we found that 74 percent of the mammary tumors showed ER positivity,
which is comparable to earlier studies with this mouse model and the human
situation (Wijnhoven et al., 2005).
40036 Dycke, Kirsten.indd 43 11-04-16 11:02

Chapter 3
44
3
Erbb2/HER2/neu statusIn clinical diagnosis, mRNA expression levels have been shown to be a reliable
method for the determination of HER2/neu status of breast tumors (Capizzi et al.,
2008). Therefore, we used our microarray expression data for Erbb2 (the murine
form of HER2) to determine the HER2/neu status of the mammary gland tumors
in our study. We used a cutoff value of mean log transformed expression of normal
mammary gland tissue plus 3 standard deviations (Capizzi et al., 2008) to define
which tumors were HER2/neu positive. In our data, this corresponded to a three-fold
up-regulation of Erbb2 compared to control tissue. Using this cutoff, we found that
21 percent of the mammary tumors were HER2/neu positive, which is close to the
average reported value of 26% in human breast cancer (Revillion et al., 1998). Please
note that we will use the phrase HER2 positive/negative throughput the paper to
relate murine Erbb2 gene expression to the terms used in human clinical diagnostics.
Microarray analysisRNA was extracted from control mammary glands and mammary tumors using the
miRNeasy Mini Kit (Qiagen Benelux, Venlo, The Netherlands). RNA concentrations
were measured using a NanoDrop spectrophotometer (NanoDrop Technologies,
Wilmington, DE, USA). The integrity of the RNA samples was determined with the
BioAnalyzer (Agilent Technologies, Amstelveen, The Netherlands) using the RNA
nano 6000 kit (Agilent Technologies). RNA was further processed for hybridization
to Affymetrix HT Mouse Genome 430 PM Array Plates at the Microarray Department
of the University of Amsterdam, the Netherlands. RNA amplification, labeling and
genechip hybridization, washing and scanning were carried out according to
Affymetrix protocols.
Altogether, 30 samples were used for further analysis: 6 control FVB, 5 control
p53R270H/+WAPCre (Control TG), 9 carcinomas (Car) ER+, 2 carcinomas ER−, 5
carcinosarcomas (Csc) ER+, and 3 carcinosarcomas ER−. Of the 9 ER+ carcinoma
samples, 4 were HER2/Neu positive; all other samples were HER2/neu negative.
Data analysisAffymetrix CEL files were normalized using the Robust Multichip Average
(RMA) algorithm and the MBNI custom CDF (http://brainarray.mbni.med.umich.
edu/ Brainarray/ Database/ CustomCDF/) for this chip. RMA output consisted
of 16492 probe sets corresponding to unique Entrez GeneIDs. Quality control
40036 Dycke, Kirsten.indd 44 11-04-16 11:02

Biomarkers for breast cancer
45
3
consisted of visual inspection of residual plots and other RMA QC parameters.
Further data analysis such as ANOVA and Principal Component Analysis (PCA) was
carried out using R software unless indicated otherwise. Gene expression data
between (two or more) experimental groups were compared using ANOVA, where
p values < 0.001 and False Discovery Rate (FDR) < 5% were considered significant.
Additionally, for tumor vs. control comparisons, only genes up-regulated in the
tumor group(s) were considered in further analyses, as the aim of this study was
to detect tumor-originating markers for early cancer detection in serum-based
diagnostics. By making further Boolean combinations of regulated gene lists, we
obtained genes informative across or between tumor subtypes.
To determine which genes code for proteins potentially detectable in human
serum, we determined which proteins have a human equivalent that is annotated
in Gene Ontology as extracellular, in UniProt as secreted, or has been experimentally
detected in plasma or serum as part of the Human Plasma Proteome project
(Anderson et al., 2004).
Functional annotation and overrepresentation analysis was carried out using
DAVID (http://david.abcc.ncifcrf.gov) (Huang et al., 2009) for generally known
databases such as Gene Ontology and UniProt. Further gene set overrepresentation
analyses were performed using an in-house developed tool (based on the DAVID
methodology) for other custom functional gene set libraries based on BioGPS tissue
expression data (www.biogps.org, (Wu et al., 2009)), MSigDB-C2 gene sets curated
from genomics literature (www.broadinstitute.org/gsea/msigdb/, (Liberzon et al.,
2011)), MSigDB-C4 cancer gene expression modules (Segal et al., 2004) the cancer
signatures GeneSigDB (http://compbio.dfci.harvard.edu/genesigdb/, (Culhane et
al., 2010)), and an in-house made collection of protein lists from mouse blood-
based proteomics literature (Pitteri et al., 2008, Whiteaker et al., 2011, Whiteaker et
al., 2007, Schoenherr et al., 2011).
Protein expression in human breast cancer and normal mammary tissue was
compared using the Human Protein Atlas (www.proteinatlas.org) (Ponten et al.,
2008). This site contains semi-quantitative (absent – weak – moderate – strong)
data. We considered a protein up-regulated in human tissue if at least 50% of the
tumor samples in the database displayed an expression level at least one level
higher than that of normal mammary gland.
40036 Dycke, Kirsten.indd 45 11-04-16 11:02
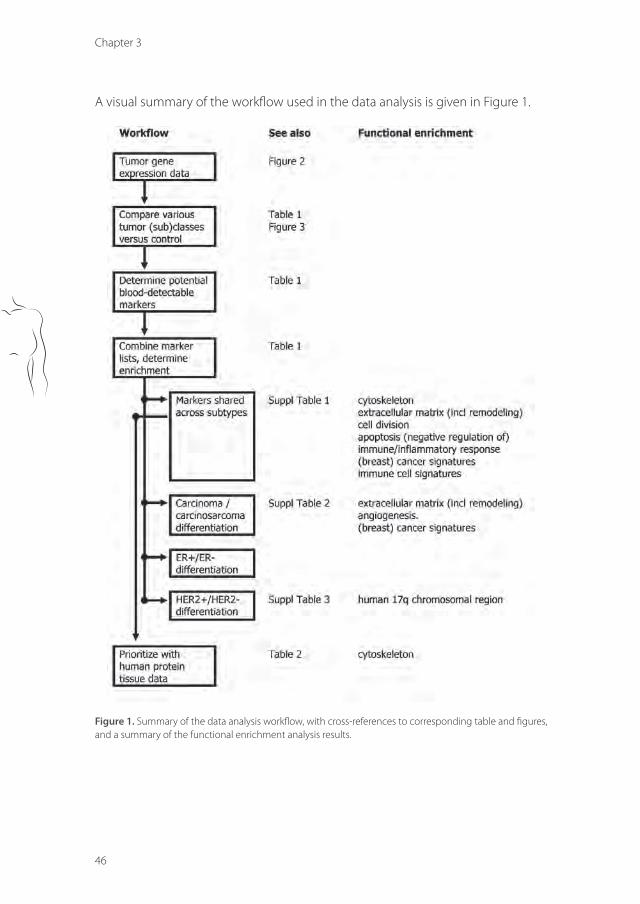
Chapter 3
46
3
A visual summary of the workflow used in the data analysis is given in Figure 1.
Figure 1. Summary of the data analysis workflow, with cross-references to corresponding table and figures, and a summary of the functional enrichment analysis results.
40036 Dycke, Kirsten.indd 46 11-04-16 11:02

Biomarkers for breast cancer
47
3
Results
Principal Component AnalysisPrior to statistical analysis, whole genome transcription profiles were visualized in a
PCA (Figure 2). This revealed that, on the whole, tumor samples are clearly distinct
from control samples. Additionally, the PCA indicated that several tumor subclasses
with regards to histology and receptor status could already be distinguished (e.g.
carcinoma HER+, carcinoma ER−, carcinosarcoma ER+ versus ER−), whereas the
two control groups appeared highly similar. This latter finding was confirmed by
statistical analysis: there are no genes with significant expression changes between
the two mammary tissue controls groups (Table 1) and therefore these groups
were combined in further analyses.
Figure 2. Principal Component Analysis on tumor and control tissue gene expression data.
Similarities in genes expression changes across tumor subtypesWe compared gene expression changes between controls and tumor samples
for either all tumors or by subset based on histopathology, ER, or HER2 status
(Table 1, Figure 3). Since this study was set up to specifically identify tumor-
originating markers for cancer detection by means of a blood-based test, we not
40036 Dycke, Kirsten.indd 47 11-04-16 11:02

Chapter 3
48
3
only considered statistical significance (p < 0.001 and FDR 5%), but also set the
demand that genes are up-regulated in tumor vs. control. After calculating the
number of significantly up-regulated genes in tumor groups, we also determined
how many of these have a human equivalent that is potentially blood-detectable,
again with eventual screening implementation in mind. Numbers of genes
meeting these criteria are given in Table 1. For tumor (subtype) versus control
comparisons, we found between 2185 and 3471 up-regulated genes, of which
238 to 458 (on average 11%) were potentially detectable in human blood. The fold
ratio for these up-regulated genes ranged from 1.21 to 39.71 (median 1.85), for the
potentially blood-detectable markers the fold up-regulation ranged from 1.28 to
39.71 (median 2.21).
Table 1. Statistical comparisonsa and further combinations
Query Comparison Regulated genes Of which human blood detectable
A Control FVB <> Control TG 0 0
B all tumor > all control 2850 313
C carcinoma > all control 2330 238
D carcinosarcoma > all control 3471 458
E ER+ > all control 2768 309
F ER− > all control 2185 247
G HER2+ > all control 2768 307
H HER2− > all control 2749 313
J carcinoma <> carcinosarcoma 350 76
K ER+ <> ER− 0 0
L HER2+ <> HER2− 178 24
Combination Description Regulated genes Of which human blood detectable
C AND D carcinoma and carcinosarcoma vs control 1942 200
(C OR D) AND J carcinoma/carcinosarcoma differentiation 197 51b
C AND J specific for carcinoma 53 11
D AND J specific for carcinosarcoma 171 48
(C AND D) AND J applicable for both 27 8
E AND F ER+ and ER− vs control 1815 202
(E OR F) AND K ER+/ER− differentiation 0 0
G AND H HER2+ and HER2− vs control 1887 203
(G OR H) AND L HER2+/HER2− differentiation 117 15c
G AND L specific for HER2+ 109 14
H AND L specific for HER2− 25 2
(G AND H) AND L applicable for both 17 1
ALL (B,C,D,E,F,G,H) Shared across all subtypes 1395 149d
a based on p < 0.001 and FDR < 5%b Supplementary Table 2c Supplementary Table 3d Supplementary Table 1
40036 Dycke, Kirsten.indd 48 11-04-16 11:02

Biomarkers for breast cancer
49
3
Next, we determined the overlap between the various gene lists. We noticed that
for each of these lists, roughly half (37% - 74%) was present in an overlap with
other sets (Table 1, Figure 3). This indicated that there is a common set of genes
that discriminates the various tumor groups from control tissue, but not the sub-
tumor types by themselves. The most comprehensive overlap across all of the
comparisons resulted in 1395 regulated genes of which 149 met the criteria for
protein blood detectability. These 149 genes are listed in Supplementary Table
1. Fold up-regulations ranged from 1.30 to 16.80 (median 2.13) for the set of
1395 genes, and from 1.39 to 16.34 (median 2.36) for the 149 potentially blood-
detectable genes. As for the single tumor (subtype) versus control comparisons,
there is a trend in that the potentially blood-detectable subset shows larger fold
up-regulations.
Figure 3. Venn diagram for the various comparisons made. Overlap of discriminative genes based on histological classification (red), ER status (green), HER2 status (blue), and across all tumor subtypes (bold).
GO functional annotation analysis on this list revealed enrichment for terms related
to the cytoskeleton, extracellular matrix (including remodeling), cell division,
(negative regulation of ) apoptosis, and immune/inflammatory response (Figure 1).
40036 Dycke, Kirsten.indd 49 11-04-16 11:02

Chapter 3
50
3
Enrichment analysis on the MSigDB-C2 database showed mainly significance (FDR
5%) for gene sets related to cancer, including several breast cancer sets (Poola
et al., 2005, Schuetz et al., 2006, Sotiriou et al., 2006), with other significant gene
sets being mainly involved in stress and immune responses. Enriched MSigDB-C4
cancer modules were related to cytoskeleton, extracellular matrix, cell division, and
inflammatory response. The BioGPS-derived tissue-associated gene set library did
not reveal a match between normal mammary tissue and the shared 149 marker
set, but instead showed enrichment for predominantly immune set-related
signatures, perhaps reflecting the endogenous response to the tumor (Figure 1).
Comparison to literature mouse plasma breast cancer proteomics sets revealed
one significant enrichment, namely to Table S6g of Whiteaker et al (Whiteaker et
al., 2011) which describes their verification of plasma biomarkers on individual
mice. This overlap comprised six genes (Hsp90b1, Hspa5, P4hb, Pfn1, Tnc, Ywhaz).
Finally, the cancer GeneSigDB was used to determine if there was significant
overlap to cancer literature gene sets. The analysis showed significant enrichment
for 171 of the 2142 cancer signatures. These signatures were derived from several
tissues, although the fraction of significant breast cancer signatures (63 enriched
out of 476 breast cancer sets) was relatively highest, being 1.7 times that for the
overall (171 / 2142) significant fraction. The most significant breast cancer gene
set was that by Lauss et al (Lauss et al., 2008) containing consensus genes from
literature studies to predict breast cancer recurrence. Next, we determined which
genes are most characteristic for the 63 enriched breast cancer signatures versus
the rest of the database. We found that this enrichment could mainly be ascribed
to genes involved in cell division. Overall, the high match to literature gene sets
suggests our marker set has considerable resemblance to marker sets found in
(predominantly) human breast cancer.
Differences between tumor subclassesBesides biomarkers common to all tumor subclasses, we also set out to find
biomarkers that might help to discriminate between various tumor subclasses.
Indeed, the PCA in Figure 2 indicated this would be possible. For the carcinoma
vs. carcinosarcoma comparison we found 350 differentially expressed genes, 76
of which are potentially human blood-detectable (Table 1, Figure 3). Since latter
implementation would only be practical if a biomarker was increased in either of
the two subclasses when compared to a control, we determined the overlap of
the carcinoma vs. carcinosarcoma genes with the sets of genes up-regulated in
40036 Dycke, Kirsten.indd 50 11-04-16 11:02
Biomarkers for breast cancer
51
3
carcinoma and/or carcinosarcoma to control. This led to 51 genes, which are listed
in Supplementary Table 2. As can be seen from this table, 48 of these genes show
higher expression in carcinosarcoma than in carcinoma. Additionally, GO functional
enrichment analysis showed enrichment for extracellular matrix, extracellular
matrix remodeling, and angiogenesis. These findings are in line with the more
aggressive clinical phenotype of this subtype. Of the 51 genes in Supplementary
Table 2, 8 overlap with the set of 149 shared genes (Supplementary Table 1),
namely Actn1, Inhba, Msr1, Ncam1, Plau, Pls3, Tpm4, and Wisp1. Enrichment analysis
on C2, C4 and BioGPS datasets found significance for (breast) cancer, extracellular
matrix (remodeling), angiogenesis, and immune response gene sets (Figure 1).
No significant overlap with literature mouse plasma cancer proteomics sets was
found. In the GeneSigDB sets there was enrichment for 79 sets, 26 of which were
breast cancer related. Here the breast cancer-specific enrichment was mainly due
to extracellular matrix (remodeling) associated genes.
When the analogous comparison was made for ER+ and ER− tumors vs. each
other and the control, no differentially expressed genes were found. Apparently,
following the genomics strategy described here, no potential biomarkers are
identified to discriminate between ER+ and ER− breast cancers in human blood.
For the HER2 status, 178 genes were differentially expressed between HER2+
and HER2− tumors, 117 of which were up-regulated in either subtype to control
(Table 1, Figure 3). Of these, 15 were potentially blood-detectable (Supplementary
Table 3). Of these, 14 were higher expressed in HER2+ tumors, including, as could
be expected, the Erbb2 gene itself. Mutual comparisons showed no overlap
between this list and the list of 149 markers shared across tumor subtypes versus
control, nor the 51 genes discriminating carcinoma from carcinosarcoma. No GO
enrichment was found for these 15 genes. Additional enrichment analyses only
showed enrichment for one gene set across all five databases, namely the C2 entry
for an amplification hot spot in the human chromosome 17q11.1-q21; 17q25
region described by Myllykangas et al (Myllykangas et al., 2006), which indeed
contains the (human homolog of the) Erbb2 gene (Figure 1).
Further prioritization of potential biomarkers
To translate our results obtained using a mouse model to the human situation
and prioritize the markers for further human follow-up studies, we used the data
40036 Dycke, Kirsten.indd 51 11-04-16 11:02

Chapter 3
52
3
available on the Human Protein Atlas to compare protein expression in human
breast cancer tissue and normal mammary gland for the 149 shared genes in
Supplementary Table 1. For the 116 proteins where such human information was
available, 16 showed an increased expression in human cancer tissue compared
to normal mammary gland. These 16 proteins are given in Table 2. Their gene
expression fold up-regulations ranged from 1.81 to 7.28 (median 2.13) with
standard deviation values (see also Supplementary Table 1) being approximately a
third of the fold up-regulation (median relative SD 36%). A relatively high standard
deviation (5.62, 77% relative SD) was found for VCAN. Functionally, the majority of
these 16 proteins are associated with the cytoskeleton.
40036 Dycke, Kirsten.indd 52 11-04-16 11:02

Biomarkers for breast cancer
53
3
Tab
le 2
. Prio
ritiz
ed s
hare
d se
rum
mar
kers
, bas
ed o
n hu
man
tiss
ue e
xpre
ssio
n da
ta
Hum
an G
eneI
DH
uman
sym
bol
Des
crip
tion
Ave
rage
ratio
Tu
mor
/Con
trol
aH
uman
pro
tein
sta
inin
g: m
edia
n br
east
can
cer v
ersu
s no
rmal
bre
ast t
issu
eb
60A
CTB
actin
, bet
a2.
00m
oder
ate
vs w
eak
7987
9CC
DC
134
coile
d-co
il do
mai
n co
ntai
ning
134
1.81
mod
erat
e vs
wea
k
1072
CFL
1co
filin
1 (n
on-m
uscl
e)2.
45m
oder
ate
vs w
eak
2146
EZH
2en
hanc
er o
f zes
te h
omol
og 2
(Dro
soph
ila)
2.92
mod
erat
e vs
neg
ativ
e
2316
FLN
Afil
amin
A, a
lpha
2.10
wea
k vs
neg
ativ
e
1090
5M
AN
1A2
man
nosi
dase
, alp
ha, c
lass
1A
, mem
ber 2
2.33
stro
ng v
s m
oder
ate
4627
MYH
9m
yosi
n, h
eavy
cha
in 9
, non
-mus
cle
2.09
mod
erat
e vs
wea
k
4830
NM
E1no
n-m
etas
tatic
cel
ls 1
, pro
tein
(NM
23A
) exp
ress
ed in
2.27
stro
ng v
s m
oder
ate
1133
3PD
AP1
PDG
FA a
ssoc
iate
d pr
otei
n 1
2.72
mod
erat
e vs
neg
ativ
e
2910
8PY
CA
RDPY
D a
nd C
ARD
dom
ain
cont
aini
ng2.
17st
rong
vs
mod
erat
e
2606
4RA
I14
retin
oic
acid
indu
ced
143.
77w
eak
vs n
egat
ive
5491
0SE
MA
4Cse
map
horin
4C
2.40
wea
k vs
neg
ativ
e
7168
TPM
1tr
opom
yosi
n 1
(alp
ha)
2.59
wea
k vs
neg
ativ
e
5159
2TR
IM33
trip
artit
e m
otif
cont
aini
ng 3
32.
12m
oder
ate
vs w
eak
1462
VCA
Nve
rsic
an7.
28w
eak
vs n
egat
ive
7511
XPN
PEP1
X-pr
olyl
am
inop
eptid
ase
(am
inop
eptid
ase
P) 1
, sol
uble
2.01
wea
k vs
neg
ativ
e
a add
ition
al v
alue
s fo
r tum
or s
ubcl
ass
ratio
ave
rage
s an
d st
anda
rd d
evia
tions
can
be
foun
d in
Sup
plem
enta
ry T
able
1b re
trie
ved
from
Hum
an P
rote
in A
tlas
(ww
w.p
rote
inat
las.o
rg)
40036 Dycke, Kirsten.indd 53 11-04-16 11:02

Chapter 3
54
3
Discussion
Breast cancer is the leading cause of cancer death worldwide (Ferlay et al., 2010).
Early diagnosis of cancer is necessary for improvement of survival and reduction
of morbidity. Therefore, there is a need for sensitive testing strategies specifically
for early detection. For improvement of current early detection rates, blood-
based diagnostics could be a valuable addition to (or next to) existing screening
programs, because of their low costs and flexible logistics. The first step towards
implementing such blood-based detection is the identification of biomarkers that
detect across multiple tumor types, to increase overall sensitivity. A secondary step
would be the identification of biomarkers that are able to differentiate between
tumor subtypes to improve follow-up and referral of newly diagnosed patients,
i.e. a more personalized approach. In the study described here, we use a genomics
approach on tumor tissue compared to normal mammary gland to identify
protein candidate biomarkers relevant for blood-based early detection of human
breast cancer. Interestingly, we hereby differentiated the mammary tumors with
regards to histological subtype and receptor status, to reflect human variation in
these tumor characteristics. Moreover, we used an experimental set up specifically
aimed at the early detection of cancer, rather than a set up with more progressed
cancers.
Mouse models are frequently applied in biomarker discovery research (Kelly-
Spratt et al., 2008). Earlier studies have shown that although both human and
mouse breast tumors have a heterogeneous profile, similarities can be found and
therefore, mouse models are useful in human breast cancer biomarker discovery
studies (Klein et al., 2007, Pitteri et al., 2008). In recent years, some studies have
focused on early detection, such as a plasma proteomics study between PyMT
transgenic tumor-bearing mice and matched controls by Pitteri et al. (Pitteri et al.,
2008), and several between tumor and normal mammary tissue from a conditional
HER2-driven mouse (Schoenherr et al., 2011, Whiteaker et al., 2011, Whiteaker et
al., 2007). However, these literature studies are limited in number, and none have
taken into account the differentiation between tumor subtypes within a single
mouse model. Here, we first report the use of a humanized mouse model for breast
cancer that represents the heterogeneity of breast cancer, within an identical
genetic background. Two different histological subtypes, and ER as well as HER2
positive and negative tumors are represented in this model. We did not determine
40036 Dycke, Kirsten.indd 54 11-04-16 11:02

Biomarkers for breast cancer
55
3
progesterone receptor (PR) status, as clinically PR expression has little prognostic
value and is merely used as an additional factor next to ER for the response to
hormonal therapy (Sotiriou and Pusztai, 2009).
In this study we identified 149 potentially blood-detectable biomarkers
(Supplementary Table 1). The identified genes were significantly up regulated in all
tumor types compared to normal mammary gland tissue and potentially blood-
detectable according to GeneOntology, Uniprot or the Human Plasma Proteome
Project. Moreover, we compared protein expression in human breast tumors and
normal breast tissue using the Human Protein Atlas. With these steps we translated
mouse mammary gland tumor gene expression to 16 prioritized candidate blood-
detectable human breast cancer markers (Table 2).
Our biomarker panel is enriched for several biological functions, such as
cytoskeleton, extracellular matrix (including remodeling), cell division, (negative
regulation of ) apoptosis, and immune/inflammatory response (Figure 1). These
terms are related to cancer processes in general, although not specifically to breast
cancer. This is corroborated by the enrichment for MSigDB-C2 and GeneSigDB
signatures for breast- but also other types of cancers. If the intended use of the
biomarker panel would be specifically breast cancer, biomarkers specific for breast
cancer (or other tumors) should also be included. Additionally, it can be noted that
several immune/inflammatory response markers can also be triggered by other
diseases and such markers would need to be combined with non-immunological
markers to provide sufficient specificity for (breast) cancer.
We did not detect any significant differential expression for the clinically used
markers CA15-3, CA125, CEA, and CA27-29. This can probably be attributed to
the fact that – in line with our aim of finding early detection biomarkers – we
dissected mice as soon as a palpable tumor was detected. These clinical markers
are more often found at more advanced tumor stages and are considered more
useful for tumor monitoring and prognosis rather than early detection (Ludwig
and Weinstein, 2005, Zeiwar et al., 2007, Molina et al., 2010, Tampellini et al., 2006).
We identified more potential biomarkers across tumor types than we did for
discrimination between tumor types. As mentioned before, breast cancer is a
heterogeneous disease and in this study several tumor types were represented. It
40036 Dycke, Kirsten.indd 55 11-04-16 11:02

Chapter 3
56
3
seems that despite this heterogeneity there are still substantial similarities across
tumors types, which involve known cancer deregulated processes such as cell
division and tissue invasion. This would be advantageous to finding biomarkers to
improve current breast cancer screening. In the future, additional differentiation
between tumor subtypes based on tumor type specific biomarkers or genetic
make-up may be beneficial.
Although our mouse model represents the heterogeneity found among human
breast tumors and the regulated genes found in this study are involved in
mechanisms relevant for human breast cancer, the use of any mouse model for
human breast cancer has inherent limitations and application of our biomarker
panel in a large-scale screening setting would require several validations steps.
Therefore, naturally, our potential biomarker panel needs to be tested in human
blood samples, to determine the usefulness, and subsequently sensitivity and
specificity of this panel for early detection of breast cancer. The main potential
limitation in human samples is that the variation between individuals is much
larger and statistical power for early tumor detection would decrease considerably.
In fact, studies have shown that it is even difficult to find reproducible markers
within a clinically homogenous group of patients due to the individual variations
and heterogeneities (Ein-Dor et al., 2005). Further studies in small human cohorts
or humanized mouse models, using multi-marker assay methods such as Luminex
or antibody arrays are therefore needed to determine which markers in our panel
are sufficiently robust for eventual testing on a larger human cohort.
40036 Dycke, Kirsten.indd 56 11-04-16 11:02

3
40036 Dycke, Kirsten.indd 57 11-04-16 11:02

40036 Dycke, Kirsten.indd 58 11-04-16 11:02

CHAPTER 4
Biomarkers for circadian rhythm disturbance independent of time
of dayAdapted from:
Biomarkers for circadian rhythm disruption independent of time of day
Kirsten C.G. Van Dycke, Jeroen L.A. Pennings, Conny T.M. van Oostrom,
Linda W.M. van Kerkhof, Harry van Steeg, Gijsbertus T.J. Van der Horst,
Wendy Rodenburg
PLoS One, 2015, 18;10(5)
40036 Dycke, Kirsten.indd 59 11-04-16 11:02
Chapter 4
60
4
Abstract
Frequent shift work causes disturbance of the circadian rhythm and might on
the long-term result in increased health risk. Current biomarkers evaluating the
presence of circadian rhythm disturbance (CRD), including melatonin, cortisol
and body temperature, require 24-hr (“around the clock”) measurements, which is
tedious. Therefore, these markers are not eligible to be used in large-scale (human)
studies. The aim of the present study was to identify universal biomarkers for CRD
independent of time of day using a transcriptomics approach. Female FVB mice
were exposed to six shifts in a clockwise (CW) and counterclockwise (CCW) CRD
protocol and sacrificed at baseline and after 1 shift, 6 shifts, 5 days recovery and 14
days recovery, respectively. At six time-points during the day, livers were collected
for mRNA microarray analysis. Using a classification approach, we identified a set of
biomarkers able to classify samples into either CRD or non-disrupted based on the
hepatic gene expression. Furthermore, we identified differentially expressed genes
14 days after the last shift compared to baseline for both CRD protocols. Non-
circadian genes differentially expressed upon both CW and CCW protocol were
considered useful, universal markers for CRD. One candidate marker i.e. CD36 was
evaluated in serum samples of the CRD animals versus controls. These biomarkers
might be useful to measure CRD and can be used later on for monitoring the
effectiveness of intervention strategies aiming to prevent or minimize chronic
adverse health effects.
40036 Dycke, Kirsten.indd 60 11-04-16 11:02

Biomarkers for CRD
61
4
Introduction
Human behavior, physiology and metabolism are subject to daily rhythms,
which are controlled by the circadian clock. This endogenous time keeping
system provides a temporal organization of our body functions in relation to
environmental time and allows us to anticipate to daily recurring events (Mohawk
et al., 2012). Chronic circadian rhythm disturbance (CRD), as encountered by
frequent night shift work or multi time zone travelling might result in an increased
risk for long-term health effects. Indeed, epidemiological studies among shift
workers and flight personnel have associated frequent shift work and jet lag
with an increased incidence of breast cancer, obesity and metabolic syndrome
(Reynolds et al., 2002, Schernhammer et al., 2006, Kubo et al., 2011). These adverse
health effects occur after many years of shift work, and at present it is unclear what
mechanism is causing adverse health effects and how these effects of shift work
can be minimized. The ability to measure chronic CRD associated with shift work
would allow measuring effects of interventions on chronic CRD and monitoring
adversity in shift workers and ultimately will help to design intervention strategies.
Studies on the beneficial effects of interventions to prevent shift work-driven
adverse health outcomes assess effects on CRD using classical circadian markers,
including melatonin, cortisol and body temperature (Mirick and Davis, 2008).
These markers allow monitoring circadian rhythm and acute CRD using multiple
measurements around the clock before health effects occur. In addition to classical
circadian markers, recent research on circadian clock controlled output genes
has shown that up to 10% of the transcribed genes is under circadian control,
providing additional rhythmic markers to estimate body time in blood and tissues
(Panda et al., 2002, Ueda et al., 2004). However, both the classical circadian markers
and cycling clock and clock-controlled gene markers are non-eligible as CRD
markers in large-scale human cohort studies due to two important pitfalls. Firstly,
circadian markers require around the clock measurements, resulting in higher costs
and larger impact on participating subjects compared to single measurements.
Secondly, classical biomarkers are useful for demonstrating acute CRD, but provide
no or only limited information on long-term CRD and accumulation of adversity
over time. To acquire information on biological adversity of CRD and to explore the
effectiveness of CRD preventive measures, new biomarkers are needed to evaluate
the presence of chronic CRD in a time of day independent manner.
40036 Dycke, Kirsten.indd 61 11-04-16 11:02

Chapter 4
62
4
Shift work involves a multitude of aspects, including phase desynchronization,
light at night, sleep disruption and lifestyle disturbances, all of which potentially
play a role in causing CRD and associated adverse health effects (Fritschi et al.,
2011). Many different shift work schedules are in use, varying in rotation speed
and direction, including forward (counterclockwise) or backward (clockwise)
rotating shift schedules. Experimental studies in which mice were subjected to
(chronic) shifts in the light-dark cycle (as such resembling jet lag), have shown
that both counterclockwise (CCW) and clockwise (CW) schedules cause CRD
(McGowan and Coogan, 2013). Additionally, several human studies have shown
disturbed circadian rhythms by both CCW and CW work schedules, without major
differences between the schedules (Barton et al., 1994, Boquet et al., 2004, Tucker
et al., 2000). However, in aged mice CCW shifts appeared more disruptive than CW
shifts, as evident from the increased mortality (Davidson et al., 2006).
The aim of the present study was to identify universal biomarkers for CRD
independent of rotation direction and time of day. Two different rotations of chronic
jet lag were used to induce CRD. Since blood biomarker discovery is technically
challenging, we selected the liver to identify biomarkers, as the target tissue of
metabolic effects of CRD and as previously used for circadian transcriptomics
studies (Ueda et al., 2004). By comparing the liver transcriptome of animals under
normal, CW rotating and CCW rotating light schedules, we identified a set of
hepatic gene expression markers that report on the presence of CRD. Additionally,
we identified non-circadian, age-independent genes differentially expressed after
CRD compared to baseline that are potentially blood detectable. One candidate
biomarker i.e. CD36 was validated in blood, allowing future use in large-scale
human studies.
Methods
Study designAnimal studies were performed in compliance with national legislation, including
the 1997 Dutch Act on Animal Experimentation, and experiments were approved
by the Animal Experimentation Ethical Committee of the National Institute for
Public Health and the Environment in Bilthoven. All surgery was performed under
isoflurane anesthesia and appropriate analgesics were used to minimize suffering.
40036 Dycke, Kirsten.indd 62 11-04-16 11:02

Biomarkers for CRD
63
4
Female FVB mice, 8 to 12 weeks of age, were kept under a normal 12:12 hour
light-dark (LD) cycle for approximately three weeks, with Zeitgeber Time 0 (ZT0)
corresponding to lights on. Animals were group-housed and food and water
were provided ad libitum. Prior to the first shift, animals (n=24) were sacrificed
around the clock at four hour intervals (n=4 at each time point). Subsequently,
the remaining group of animals underwent six shifts in either a clockwise (CW) or
counterclockwise (CCW) rotating light schedule. Specifically, mice were exposed
to a phase delay or phase advance of eight hours every five days, respectively (S1
Figure). Hereafter, mice were again kept under LD, referred to as recovery. After
one shift, six shifts, five days recovery and fourteen days recovery n=30 animals
per group were sacrificed around the clock with four hour intervals (n=5 per time
point) by orbital bleeding under Ketamine/Xylazine anesthesia. Liver and blood
were collected for transcriptomics and serum analyses, respectively. A detailed
overview of the experimental design is depicted in S1 Figure.
Four additional mice per group received a radio transmitter (Physio Tel, TA11
TA-F10; Data Sciences, St. Paul, MN) in the peritoneal cavity to record core body
temperature every ten minutes. Body temperature was recorded throughout the
experiment. Cosine curves were fitted using the R statistical software environment
(www.r-project.org) to determine the phase (i.e., peak time) of activity and body
temperature rhythms.
Microarray analysisRNA was extracted from livers (n=4 per time point at baseline and n= 2 per time
point for the CCW and CW groups) using the miRNeasy Mini Kit (Qiagen Benelux,
Venlo, The Netherlands). RNA concentrations were measured using a NanoDrop
ND-1000 Spectrophotometer (Nanodrop Technologies, Wilmington, DE, USA), and
RNA quality was assessed with an Agilent 2100 Bioanalyzer (Agilent Technologies,
Amstelveen, the Netherlands).
RNA was processed for gene expression analysis at the Microarray Department
of the University of Amsterdam, the Netherlands, using methods described in
Pennings et al (Pennings et al., 2011). Experimental samples (each corresponding
to RNA from one individual mouse) were labelled with Cy3 and the common
reference sample (made by pooling equimolar amounts of RNA from experimental
samples) was labelled with Cy5. Samples were hybridized to Nimblegen Mus
40036 Dycke, Kirsten.indd 63 11-04-16 11:02

Chapter 4
64
4
musculus 12 x 135 k microarrays (Roche NimbleGen, Germany). This type of
microarray contains 44,170 gene probes with three spots per probe. Slides were
scanned with an Agilent G2565CA DNA microarray scanner. Feature extraction
was performed with NimbleScan v2.5 (Roche NimbleGen), resulting in a table
containing individual probe signal intensities for both dyes.
The raw data were subjected to a set of quality control checks to ensure comparable
signal average and distribution. Raw microarray data for gene-coding probes
were normalized in R (www.r-project.org) using a four step approach (Pennings
et al., 2011): (1) natural log-transformation, (2) quantile normalization of all scans,
(3) correcting the sample spot signal for the corresponding reference spot signal
and (4) averaging data from replicate probe spots. The normalized data of 44,170
probes were further analyzed in R and Excel (Microsoft Corporation, USA). Probe
to gene annotation data was downloaded from NCBI. Classification and statistical
analysis was performed on the probe level. Significantly predictive or regulated
probe sets were annotated to the corresponding genes for further biological
interpretation. To this end, when multiple probes corresponding to the same
gene were significant, they were counted as one gene in further analysis; probes
that did not correspond to genes according to the current NCBI database were
excluded from further analysis.
Complete raw and normalized microarray data and their MIAME compliant
metadata have been deposited at GEO (www.ncbi.nlm.nih.gov/geo) under
accession number GSE65346.
Classification approachAfter normalization, a classification approach was applied to identify a set of genes
able to classify samples into either circadian rhythm disrupted (CRD) or non-
disrupted (ND) 14 days after the last shift. Three different algorithms were used:
Random forests (RF) (Breiman, 2001), Support vector machine (SVM) (Rifkin et al.,
2003) and Prediction analysis for Microarrays in R (PAM-R) (Tibshirani et al., 2002) (R
statistical software). To ensure time-of-day independence of the classifier, for each
classification algorithm, a ‘leave-one-time point-out’ cross-validation approach
was used for the classification. Here, time point refers to ZT time point. To this end,
the data were repeatedly split into a training set and a test set, in which the training
set comprised the data for all-but-one time point, and the test set the data for the
40036 Dycke, Kirsten.indd 64 11-04-16 11:02
Biomarkers for CRD
65
4
remaining time point. The prediction model obtained for the training set was used
to predict the test set data. This approach keeps replicate (time point) samples
together and therefore gives a more reliable estimation of the prediction accuracy
than cross-validation with random sample selection. The prediction accuracy was
calculated as the average over all the test set predictions. As each classifier builds
a different prediction model (potentially using different genes) for each training
set, genes included in the majority of the models for each classifier were taken as
consensus gene set for each type of classifier.
As we aim to find biomarkers which applicability does not depend on a specific
choice of algorithm, only genes present in all three classifiers consensus sets were
considered potentially valuable biomarkers to classify CRD versus non-disrupted
(van der Veen et al., 2013, Vandebriel et al., 2010). To validate prediction accuracy of
the consensus gene set after one shift, six shifts and after 5 days recovery, the 14
days recovery dataset was used as the training set to build the prediction model.
Sequential approachTo identify differentially expressed genes (as compared to baseline) after 14 days
recovery for the CCW and CW protocol separately, we performed a one-way
ANOVA with Qlucore Omics Explorer (Qlucore AB, Lund, Sweden) in which p<0.001
was considered statistically significant. CircWave Batch v5.0 software (Hut, R., www.
euclock.org/results/item/circ-wave-batch.html) was used to analyze circadian
rhythmicity of gene expression. P-Values were false discovery rate (FDR) corrected
(Benjamini and Hochberg, 1995); genes with an FDR <0.05 were considered
rhythmically expressed. Genes that were rhythmically expressed at any time
point during the experiment (baseline, 1 shift, 6 shifts 5 or 14 days recovery) were
excluded as potential biomarker. The GenAge Database of ageing-related genes
(www.genomics.senescence.info) was used to identify (human) age-dependent
genes, which were excluded also.
To determine which candidate biomarker genes are potentially detectable
in human serum or plasma, we determined which genes code for proteins
that are annotated in Gene Ontology as extracellular or in UniProt as secreted.
Additionally, we determined which genes have human equivalents that have
been experimentally detected with high confidence in plasma or serum (Farrah et
al., 2011) or as part of the Human Plasma Proteome Project (Nanjappa et al., 2014).
40036 Dycke, Kirsten.indd 65 11-04-16 11:02

Chapter 4
66
4
Biomarker serum levelsCorticosterone serum levels were determined using ELISA assays (Yanaihara
Institute Inc. Shizuaka, Japan) and subsequently visualized and analyzed using
GraphPad Prism software version 6.04 for Windows (GraphPad Software, San Diego
California USA). Five outliers (out of 251 samples) were excluded based on Grubbs
analysis (alpha 0.1). Phase and circadian rhythm were analyzed using CircWave
Batch v5.0 software. CD36 was determined in serum with a dedicated ELISA assay
(Abcam, Cambridge, United Kingdom). Differences between CRD exposed groups
and baseline were statistically tested using a two-sided student’s t test. P-values
<0.05 were considered statistically significant.
Results
Classical circadian markersFirst, we evaluated whether the two different schedules, counterclockwise (CCW)
and clockwise (CW), affected circadian rhythm by analyzing classical circadian
markers: core body temperature and corticosterone rhythms. At baseline, animals
showed regular daily body temperature rhythms, with peaks at approximately
ZT12. Core body temperature rhythms re-entrain to the new light-dark cycle after
the first shift and following shifts, for both CCW and CW groups (Fig. 1, panels
A & B, respectively).
As expected, corticosterone serum levels at baseline showed a major peak at ZT12.
Additionally, a minor peak at ZT0 was also observed, corresponding with a small
increase in activity at this time point specific for FVB mice (CircWave tau = 12,
p = 0.0003). Differential effects between the two schedules could be observed
after peak phase analysis of corticosterone rhythms (Fig. 2). After the first shift, the
corticosterone rhythm shows peak levels at ZT16 for the CW group, representing
an incomplete shift (p = 0.005). In the CCW group peak time was at ZT20, indicative
of a lack of phase shift at this time point (p = 0.052). Although there is a tendency
toward circadian rhythm, no significant circadian corticosterone rhythm could be
detected in either group upon six shifts (CCW: p = 0.369, CW: p = 0.700). At 5 days
and 14 days after the last shift, rhythms were detected in both groups. After 14
days recovery these rhythms were less robust for CCW and CW (p = 0.093 and p =
0.105, respectively) compared to 5 days after the last shift (CCW: p = 0.007, CW: p =
40036 Dycke, Kirsten.indd 66 11-04-16 11:02

Biomarkers for CRD
67
4
0.003). Overall, these results show that circadian rhythms of corticosterone levels
heavily disturbed upon prolonged exposure to CRD, but reappear when animals
are back under normal LD conditions.
Figure 1. Double plots of peak phase of core body temperature rhythms. A. the counterclockwise schedule and B. the clockwise schedule. A cosine function was fitted to determine peak phase (n=4 mice per group). Data are presented as mean peak phase ± sd. Grey areas indicate periods of darkness.
A B
40036 Dycke, Kirsten.indd 67 11-04-16 11:02

Chapter 4
68
4
Figure 2. Corticosterone serum levels for the counterclockwise (CCW) and clockwise (CW) jet lag protocols. Serum levels were determined at baseline, after 1 shift, 6 shifts, 5 days recovery and 14 days recovery. Data are presented as mean ± SD. For the first shift, the light dark schedule before the shift is depicted in grey. At baseline a significant 12-hr rhythm was detected, due to the major peak at ZT12 and another peak at ZT0. CircWave peak phases were indicated with (ê). Note: as circadian rhythmicity of serum corticosterone levels was lost after 6 shifts, peak phases at the 6th shift are just indicative of the best cosine fit.
40036 Dycke, Kirsten.indd 68 11-04-16 11:02

Biomarkers for CRD
69
4
In summary, both experimental jet lag schedules, CCW and CW rotation affected
the classical circadian markers, indicating CRD. Minor differences in classical
circadian markers were found between the two schedules directly after a shift.
However, for both schedules the effects were transient, largely recovering within
14 days after the last shift.
Predictive set op hepatic transcriptome markersSince liver is the target tissue of metabolic effects and can be used for future studies,
we performed an around the clock analysis of the liver transcriptome at baseline
and after 14 days recovery. To identify a predictive set of hepatic transcriptome
markers for chronic CRD with time of day-independent expression levels, we
applied a classification approach. Three different classification algorithms were
used: RF, SVM and PAM-R (complete overview in Fig. 3a). Using a ‘leave-one-time
point-out’ cross-validation approach, we identified one consensus set of genes per
algorithm optimally classifying samples as CRD versus non-disrupted, after 14 days
recovery independent of time of day. The SVM approach resulted in a consensus
set of 226 probes, RF in 42 and PAM-R in 46. Only the 18 probes, corresponding
to 15 individual genes, present in all three classifiers were considered potentially
robust biomarkers to classify CRD versus non-disrupted (van der Veen et al., 2013,
Vandebriel et al., 2010) (Table 1, S2 Figure). Based on this consensus gene set
prediction accuracy was achieved ranging from 90 % to 98% (S1 Table) showing
that the set of 15 genes could distinguish CRD-exposed animals from non-
disrupted controls with high accuracy independent of sampling time.
40036 Dycke, Kirsten.indd 69 11-04-16 11:02
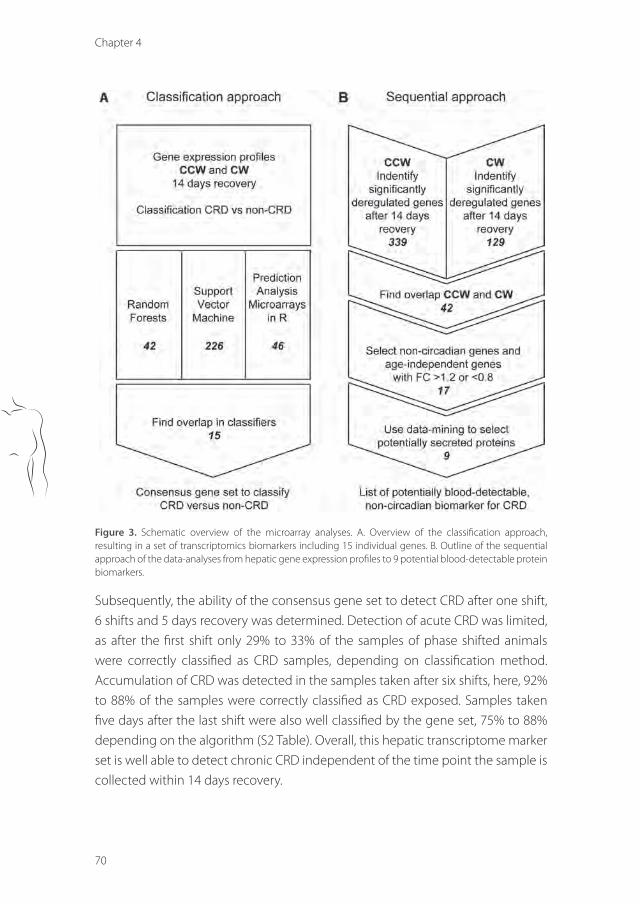
Chapter 4
70
4
Figure 3. Schematic overview of the microarray analyses. A. Overview of the classification approach, resulting in a set of transcriptomics biomarkers including 15 individual genes. B. Outline of the sequential approach of the data-analyses from hepatic gene expression profiles to 9 potential blood-detectable protein biomarkers.
Subsequently, the ability of the consensus gene set to detect CRD after one shift,
6 shifts and 5 days recovery was determined. Detection of acute CRD was limited,
as after the first shift only 29% to 33% of the samples of phase shifted animals
were correctly classified as CRD samples, depending on classification method.
Accumulation of CRD was detected in the samples taken after six shifts, here, 92%
to 88% of the samples were correctly classified as CRD exposed. Samples taken
five days after the last shift were also well classified by the gene set, 75% to 88%
depending on the algorithm (S2 Table). Overall, this hepatic transcriptome marker
set is well able to detect chronic CRD independent of the time point the sample is
collected within 14 days recovery.
40036 Dycke, Kirsten.indd 70 11-04-16 11:02
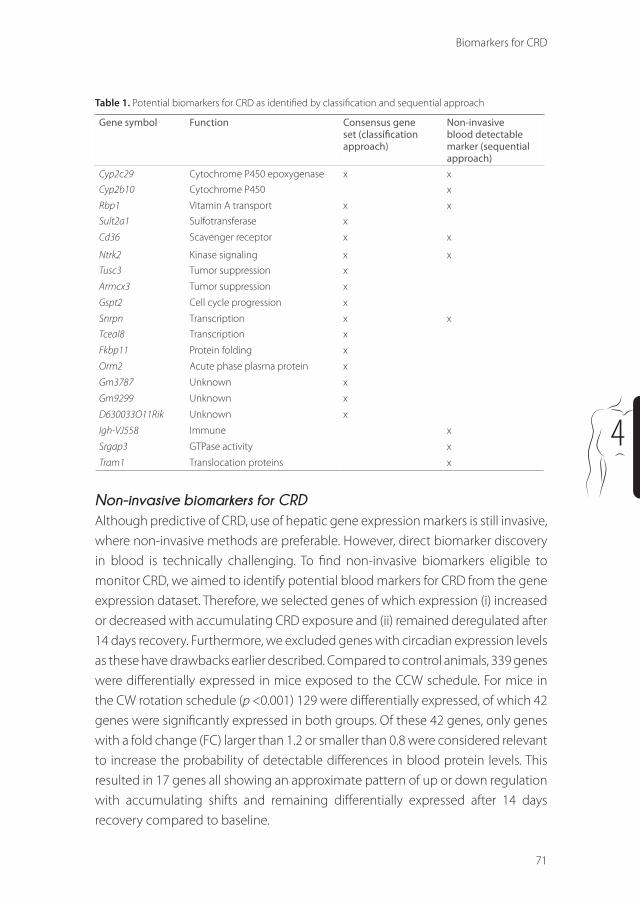
Biomarkers for CRD
71
4
Table 1. Potential biomarkers for CRD as identified by classification and sequential approach
Gene symbol Function Consensus gene set (classification approach)
Non-invasive blood detectable marker (sequential approach)
Cyp2c29 Cytochrome P450 epoxygenase x x
Cyp2b10 Cytochrome P450 x
Rbp1 Vitamin A transport x x
Sult2a1 Sulfotransferase x
Cd36 Scavenger receptor x x
Ntrk2 Kinase signaling x x
Tusc3 Tumor suppression x
Armcx3 Tumor suppression x
Gspt2 Cell cycle progression x
Snrpn Transcription x x
Tceal8 Transcription x
Fkbp11 Protein folding x
Orm2 Acute phase plasma protein x
Gm3787 Unknown x
Gm9299 Unknown x
D630033O11Rik Unknown x
Igh-VJ558 Immune x
Srgap3 GTPase activity x
Tram1 Translocation proteins x
Non-invasive biomarkers for CRDAlthough predictive of CRD, use of hepatic gene expression markers is still invasive,
where non-invasive methods are preferable. However, direct biomarker discovery
in blood is technically challenging. To find non-invasive biomarkers eligible to
monitor CRD, we aimed to identify potential blood markers for CRD from the gene
expression dataset. Therefore, we selected genes of which expression (i) increased
or decreased with accumulating CRD exposure and (ii) remained deregulated after
14 days recovery. Furthermore, we excluded genes with circadian expression levels
as these have drawbacks earlier described. Compared to control animals, 339 genes
were differentially expressed in mice exposed to the CCW schedule. For mice in
the CW rotation schedule (p <0.001) 129 were differentially expressed, of which 42
genes were significantly expressed in both groups. Of these 42 genes, only genes
with a fold change (FC) larger than 1.2 or smaller than 0.8 were considered relevant
to increase the probability of detectable differences in blood protein levels. This
resulted in 17 genes all showing an approximate pattern of up or down regulation
with accumulating shifts and remaining differentially expressed after 14 days
recovery compared to baseline.
40036 Dycke, Kirsten.indd 71 11-04-16 11:02

Chapter 4
72
4
Of these 17 genes, 9 genes were found to encode potentially blood-detectable
biomarkers according to (i) annotation as “secreted” or “extracellular”, and/or (ii)
previous proteome-based experimental detection in human plasma or serum:
Cd36, Ntrk2, Igh-VJ558, Srgap3, Tram1, Snrpn, Rbp1, Cyp2b10 and Cyp2c29 (see Fig. 3b
and S3 Table for the sequential flow of gene selection). A substantial overlap with
the classification consensus gene set was found, 5 genes were identified by both
approaches (Table 1). Four out of the 9 genes showed increasing up regulation
with number of shifts and remained up-regulated during recovery and five genes
showed a similar pattern in the opposite direction (Fig. 4).
Figure 4. Potentially blood-detectable marker for CRD. Fold ratio of selected differentially expressed genes encoding potentially blood-detectable protein biomarkers for CRD. Expression of these genes is up-regulated or down-regulated by both the CCW and the CW schedule and remains up or down regulated during recovery.
Based on expression patterns and the availability of a serum ELISA assay, CD36
was selected for validation in blood. At 14 days after the last shift, CD36 serum
levels showed a significant increase of 18% in animals exposed to CCW shifted
light schedules independent of time of day, compared to animals at baseline (Fig.
5). For the animals exposed to the CW light schedule, an 11% increase was found.
For both shifting schedules, the increase in blood levels was less pronounced than
the increase observed in the gene expression data.
40036 Dycke, Kirsten.indd 72 11-04-16 11:02

Biomarkers for CRD
73
4
Figure 5. Serum levels of the CD36 protein. Serum levels were determined at baseline and 14 days after the last shift for animals subjected to CCW and CW shifted light schedules. Error bars indicate mean ± sd.
Discussion
Frequent shift work results in a disturbance of the circadian rhythm (CRD) and might
on the long-term result in increased health risk. Epidemiologic studies among shift
workers and flight personnel have shown increased risk of breast cancer, obesity
and metabolic syndrome (Kubo et al., 2011, Reynolds et al., 2002, Schernhammer
et al., 2006). The growing 24/7 economy will only lead to increase in shift work and
consequently will adversely affect health. Ideally, the level of chronic CRD should
be detected before the negative health effects occur. To limit potential health
effects, preventive measures to minimize CRD are an attractive option. For these
purposes, measuring the presence of chronic CRD is of importance, however, tools
to measure chronic CRD are currently lacking. The present study aimed to identify
universal biomarkers for chronic CRD using a transcriptomics approach.
To date, CRD and the beneficial effects of preventive measures on CRD are mainly
determined using classical circadian markers such as melatonin, cortisol or body
temperature (Neil et al., 2014). There is a need of markers that show the cumulative
effects of CRD, since the effects on available markers are transient showing only
acute effects of CRD. Corticosterone rhythms were heavily disturbed after six
subsequent shifts of the light dark schedule and reappear after 5 days recovery,
whereas body temperature remains rhythmic and was found to re-entrain to the
new light dark schedule within 4-5 days, even after multiple shifts. The present
40036 Dycke, Kirsten.indd 73 11-04-16 11:02

Chapter 4
74
4
study identified chronic, non-transient biomarkers for chronic CRD 14 days after
the last shift, based on hepatic gene expression. The potentially blood detectable
biomarkers report on the presence of chronic CRD, showing an increase or
decrease after multiple shifts and non-reversible deregulation upon recovery. The
classification markers (consensus gene set) could be used directly after multiple
shifts and 5 or 14 days after the last shift, which makes good candidates to
determine acute shift work related CRD.
Ideally, for large-scale molecular epidemiology and experimental studies
biomarkers of CRD are time-independent. The current available circadian markers
require 24-hr measurements, which is challenging in both experimental and
field studies. Recent attempts have been made to identify transcriptomics- and
metabolomics-based time of day independent biomarkers. In these studies, jet
lag and clock mutant mice were used (Minami et al., 2009, Ueda et al., 2004),
allowing detection of acute and transient effects of jet lag but not chronic
effects. It is challenging to model human shift work since it involves a multitude
of aspects, including phase desynchronization, changed social patterns, activity,
sleep, nutrition light exposure and sun exposure. Using a chronic jet lag model in
mice, and as such mainly mimicking phase desynchronization, we were able to
identify biomarkers detecting chronic CRD that can be studied in a single sample,
collection of which is independent of time of day. Further studies should point out
whether other aspects of shift work (e.g. changes in activity, light-at-night, altered
nutritional timing) will affect the same genes.
The set of liver-transcriptome based biomarkers includes genes with a variety of
functions. The current study suggests that CD36 could potentially be a blood-
detectable biomarker for CRD. CD36 is a scavenger receptor present on many
mammalian cell types with a broad range of cellular functions (Febbraio et al.,
2001). It has been suggested that CD36 in plasma might represent a marker of the
metabolic syndrome (Handberg et al., 2006), a condition that was found associated
with frequent shift work (Wang et al., 2014). Furthermore, CD36 was shown to play
an important role in breast tumorigenesis (DeFilippis et al., 2012, Uray et al., 2004)
potentially associated with the observed increase in breast cancer risk found in
shift workers (Wang et al., 2013). Although CD36 is interesting as CRD biomarker,
other potentially blood-detectable biomarkers should not be neglected.
Especially, the genes that were found upregulated upon CRD are of interest for
40036 Dycke, Kirsten.indd 74 11-04-16 11:02
Biomarkers for CRD
75
4
further investigation. For example, Ntrk2 shows a similar induction pattern as CD36
and has also been shown to play a role in breast cancer cell survival and obesity
(Xu et al., 2003, Vanhecke et al., 2011). In depth analysis of biological relevant data
in this study is limited due to our aim to select non-circadian biomarkers, for which
circadian genes were excluded. Full analysis of biological processes affected by
CRD requires inclusion of these circadian genes and is subject for further studies.
Our study represents two approaches to identify the most valuable CRD markers
based on hepatic gene expression; firstly, an optimal CRD classification set and
secondly, a selection of potentially blood detectable biomarkers. An important
step that needs to be taken before the identified biomarkers can be applied in
experimental and large-scale cohort studies is validation for CRD in humans. For
blood-detectable markers, the challenge of the transcriptomics approach is the
translation of hepatic gene expression to protein levels in blood. We found that in
our homogenous mouse model, CD36 serum levels were also increased in animals
exposed to CCW and CW shifted light schedules; however, the increase was
smaller compared to gene expression. Potentially, serum CD36 originates from
other sources than liver alone, since CD36 is present in many mammalian cell types
(Febbraio et al., 2001). Another part of the validation process is the exclusion of post-
translational rhythmicity, which is not precluded by the lack of a transcriptional
rhythm. In human samples, heterogeneity and variation between samples is much
larger and small increases in biomarker blood levels may remain undetected in
cross-sectional studies. Preferably, to obtain less inter-individual variation one
would opt for longitudinal measurements including baseline measurements per
individual before commencing shift work rotations. Furthermore, anchoring with
phenotypic endpoint is required to use the selected biomarkers for intervention
studies without the need for long-term end-point studies. For this, it should be
noted that previous studies have shown that comparable chronic CRD protocols
increased negative health effects in mice (Davidson et al., 2006, Filipski et al., 2004).
In conclusion, our study identified a chronic CRD gene-set, comprising 15 genes,
potentially useful to study CRD induction by different aspects of shift work and
reduction by interventions. Furthermore, we identified 9 candidate genes for
blood-detectable biomarkers of CRD, including CD36. Upon validation, these
biomarkers provide valuable tools for evaluating CRD in both experimental animal
and human studies set up to identify preventive measures for adverse health
effects.
40036 Dycke, Kirsten.indd 75 11-04-16 11:02

40036 Dycke, Kirsten.indd 76 11-04-16 11:02

CHAPTER 5
Diurnal variation of hormonal and
lipid biomarkers in a molecular epidemiology-
like setting
Adapted from:
Diurnal variation of hormonal and lipid biomarkers in a molecular
epidemiology-like setting
Linda W.M. van Kerkhof*, Kirsten C.G. Van Dycke*, Eugene H.J.M. Jansen,
Piet K. Beekhof, Conny T.M. van Oostrom, Tatjana Ruskovska, Nevenka Velickova,
Nikola Kamcev, Jeroen L.A. Pennings, Harry van Steeg, Wendy Rodenburg
*joint first authors
PLoS One, 2015, 18;10(8)
40036 Dycke, Kirsten.indd 77 11-04-16 11:02

Chapter 5
78
5
Abstract
IntroductionMany molecular epidemiology studies focusing on high prevalent diseases, such
as metabolic disorders and cancer, investigate metabolic and hormonal markers.
In general, sampling for these markers can occur at any time-point during the day
or after an overnight fast. However, environmental factors, such as light exposure
and food intake might affect the levels of these markers, since they provide input
for the internal time-keeping system. When diurnal variation is larger than the
inter-individual variation, time of day should be taken into account. Importantly,
heterogeneity in diurnal variation and disturbance of circadian rhythms among
a study population might increasingly occur as a result of our increasing 24/7
economy and related variation in exposure to environmental factors (such as light
and food).
AimThe aim of the present study was to determine whether a set of often used
biomarkers shows diurnal variation in a setting resembling large molecular
epidemiology studies, i.e. non-fasted and limited control possibilities for other
environmental influences.
Results
We show that markers for which diurnal variation is not an issue are
adrenocorticotropic hormone, follicle stimulating hormone, estradiol and high-
density lipoprotein. For all other tested markers diurnal variation was observed
in at least one gender (cholesterol, cortisol, dehydroepiandrosterone sulfate, free
fatty acids, low-density lipoprotein, luteinizing hormone, prolactin, progesterone,
testosterone, triglycerides, total triiodothyronine and thyroid-stimulating
hormone) or could not reliably be detected (human growth hormone).
Discussion: Thus, studies investigating these markers should take diurnal variation
into account, for which we provide some options. Furthermore, our study indicates
the need for investigating diurnal variation (in literature or experimentally)
before setting up studies measuring markers in routine and controlled settings,
especially since time – of- day likely matters for many more markers than the ones
investigated in the present study.
40036 Dycke, Kirsten.indd 78 11-04-16 11:02
Diurnal variation in hormonal and lipid biomarkers
79
5
Introduction
Many molecular epidemiology studies focusing on high prevalent diseases, such
as metabolic disorders and cancer (Danaei et al., 2011, WHO, 2013), make use of
metabolic and hormonal markers (for examples see references (Hadji et al., 2014,
Jiang et al., 2014). Metabolic markers might serve as important (early) indicators
for metabolic disorders, including cardiovascular diseases and type 2 diabetes, and
hormonal disbalance is often studied in large epidemiological settings since these
are associated with high incidence cancers, such as breast cancer (Mester et al., 2010,
Stevens, 2005, Ferlay et al., 2015). In general, for these markers sampling can occur
at any time-point during the day or after an overnight fast. However, environmental
factors, such as light exposure and food intake might affect the levels of these
markers, since they provide input for the internal time-keeping system (Carneiro
and Araujo, 2012, Dibner et al., 2010, Hastings et al., 1998, Mohawk et al., 2012).
Several markers are well known for their diurnal variation, for example cortisol and
melatonin (Gamble et al., 2014). Importantly, heterogeneity in diurnal variation and
disturbance of circadian rhythms among a study population might increasingly
occur as a result of our increasing 24/7 economy and related variation in exposure
to environmental factors (such as light and food). For example, previous studies
have indicated that there are substantial changes in the blood transcriptome after
experiencing insufficient or mistimed sleep (Archer et al., 2014b, Moller-Levet
et al., 2013). This might render accurate determination of markers in molecular
epidemiology studies challenging. When the diurnal variation is larger than the
inter-individual variation, time of day should be taken into account in molecular
epidemiology studies. In this study, we determine whether a set of biomarkers
relevant for metabolic disorders and hormone-associated cancers, consisting of
endocrine and sex hormones and lipids, shows diurnal variation.
The diurnal variation of various blood markers has previously been studied in
different settings, ranging from a relatively uncontrolled routine setting to very
tightly controlled laboratory settings. Most information on diurnal variation is
derived from these controlled laboratory studies in which factors influencing
diurnal variation (such as food intake and/or sleep/wake cycle) are controlled
(for example see references (Klingman et al., 2011, Li et al., 2013, Jung et al., 2010,
James et al., 2007, Davies et al., 2014, Ang et al., 2012, Dallmann et al., 2012)). Due
to the large-scale set up of some molecular epidemiology studies, the possibility
40036 Dycke, Kirsten.indd 79 11-04-16 11:02

Chapter 5
80
5
for standardization of sample collection to time of day and food consumption is
limited. Therefore, most molecular epidemiology studies collect blood samples to
study biomarkers for adverse health outcomes without standardization for time-
point, food intake or sleep.
The aim of the present study was to investigate diurnal variation of a set of
markers (relevant for metabolic disorders and hormone-associated cancers) in a
routine setting in males and females, resembling molecular epidemiology studies:
namely, non-fasted and limited control for other environmental influences. In
addition, classical markers to study circadian rhythms in chronobiology research
are measured: cortisol and components of the molecular biological clock i.e. ‘clock
genes’. We determined cortisol levels and clock gene expression levels in blood
throughout the day to study diurnal variation of these classical markers in a routine
setting.
Methods
Study design and ethics statementApproval for all procedures was obtained from the ethical committee of the Goce
Delchev University in Stip, Republic of Macedonia. All participants signed an
informed written consent. This was provided in Macedonian and the translation
would be as follows: “I confirm that I am informed about the goals of the Circadian
study and voluntary participate in it. I also confirm that all information that I provided
with regards to my general health condition and lifestyle is correct”. Samples of 17
healthy volunteers, 10 women and 7 men were analyzed in this study. Inclusion
criteria were: -age over 21 years old, - apparently healthy without any acute or
chronic disease (general medical examination without laboratory analyses), - not
taking any drugs, multivitamins and/or supplements, -non-smoking, - not more
than 1 (for women) or 2 (for men) alcoholic beverages per day, - no shiftwork and
have a normal circadian rhythm (sleeping at nighttime).
The mean age of the males was 24.9 ± 7.2 years and 21.7 ± 0.5 years for the female
volunteers. The mean weight was 84.1 ±13.9 kg for the males and 58.5 ±13.6 kg
for the females. For more participants characteristics and individual data, see S1
Table. The samples were collected around the clock at four-hour intervals. The first
40036 Dycke, Kirsten.indd 80 11-04-16 11:02

Diurnal variation in hormonal and lipid biomarkers
81
5
sample was collected at 08:00 AM after overnight fasting. Participants were asked
when they slept between the first and last sampling times (8:00 - 4:00 AM). Total
sleep duration between these time-points was 3.4 ± 0.9 hr for males and 3.2 ±1.9
for females. For individual sleeping duration and timing of sleep episodes, see
S1 Table. Volunteers were asked to consume their meals one hour after sample
collection and otherwise continue their normal daily routines. Meal timing and
composition was not further restricted or standardized and meals were consumed
at home. EDTA plasma and buffy coat samples (2.7 mL) and serum samples (7.5
mL) were collected in a routine clinical chemistry laboratory by venipuncture
of the antecubital vein, using the commercial blood sampling method Sarstedt
(Sarstedt AG & Co., Nümbrecht, Germany). Individuals were allowed to leave the
laboratory after sample collection and thus were required to wake up and come
to the laboratory for sample collection at night.
Plasma and serum analysesTwo methods were used to determine hormonal and lipid biomarkers, an
overview can be found in S2 Table. Free fatty acids (FFA), high-density lipoprotein
(HDL), low-density lipoprotein (LDL), triglycerides (TG) and cholesterol (CHOL)
were determined with an auto-analyzer (Unicel DxC 800, Beckman-Coulter,
Woerden, the Netherlands), using kits from Beckman-Coulter. Cortisol (CORT),
dehydroepiandrosterone sulfate (DHEAS), estradiol (E2), human growth
hormone (hGH), prolactin (PRL), progesterone (PRG), testosterone (TEST), total
triiodothyronine (TotT3), thyroid-stimulating hormone (TSH) were determined
with an immune-analyzer (Access-2, Beckman-Coulter) using dedicated kits
from Beckman-Coulter. Levels of adrenocorticotropic hormone (ACTH), follicle
stimulating hormone (FSH), and luteinizing hormone (LH) were determined using
commercially available Milliplex Kits (Millipore Corporation, Billerica, MA, USA). All
measurements were performed on the same day. The intra-assay variation was
determined with three quality control samples (8 tests) for markers measured
on the auto-analyzer and with two quality control samples (5 tests) for markers
measured on the immune-analyzer. The CVs of markers measured with the
Luminex technique were obtained from the manufacturer. See S2 Table for all CVs.
Blood RNA analysisExpression levels of clock genes BMAL1 and PER1 were determined in buffy coats
of a subset of volunteers (n=6, female), using quantitative reverse transcription
40036 Dycke, Kirsten.indd 81 11-04-16 11:02

Chapter 5
82
5
polymerase chain reaction (RT-PCR). All oligonucleotide primers were obtained
from Life Technologies (Bleiswijk, The Netherlands). Total RNA was extracted from
buffy coats stabilized with Qiazol, using the miRNeasy Mini Kit (both Qiagen
Benelux, Venlo, The Netherlands). cDNA was made using the high capacity cDNA
reverse transcription kit (Applied Biosystems by Life Technologies, Bleiswijk,
The Netherlands). qPCR was performed on the 7500 Fast Real-Time PCR System
(Applied Biosystems by Life Technologies, Bleiswijk, The Netherlands) using
Taqman Fast Universal PCR Master Mix and Taqman Gene Expression assays for
BMAL1 (Hs00154147_m1) and PER1 (Hs01092603_m1) all according to protocol of
manufacturer (Applied Biosystems by Life Technologies, Bleiswijk, The Netherlands).
StatisticsTo detect all types of diurnal variation, parameters were tested using two types
of analyses: cosine fitting analysis and Repeated Measures ANOVA (RM-ANOVA).
Depending on the shape of the day curves, these analyses can be overlapping
and/or complementary. The RM-ANOVA detects effects of time, i.e. are the levels
of the marker different among time-points. The cosine analysis enables detection
of rhythms that follow a cosine curve, in manner that is occasionally more sensitive
than the RM-ANOVA. For the cosine analysis, CircWave Batch v5.0 software (Roelof
Hut, www.euclock.org) was used. A closer fit to cosine gives lower p-value, p <
0.05 is assumed a significant cosine curve fit. . Repeated Measures ANOVA (RM-
ANOVA) was performed using GraphPad Prism software version 6.04 for Windows
(GraphPad Software, San Diego California USA, www.graphpad.com). The
Greenhouse-Geisser epsilon indicated that sphericity could not be assumed in
most analyses, therefore, Greenhouse- Geisser correction was applied. For the RM-
ANOVA, p < 0.05 was considered statistically significant. If CircWave analysis, RM-
ANOVA, or both indicated that signification variation was present, we identified
the markers as having diurnal variation in our experiment. Gene expression of PER1
and BMAL1 was given as relative expression compared to the mean.
Considering the known difference in levels of several makers between genders,
all statistical analyses were performed separately for males and females. The aim
of this study was to identify markers with diurnal variation, therefore, differences
between males and females were not statistically tested. For all raw data, see S1
File.
40036 Dycke, Kirsten.indd 82 11-04-16 11:02

Diurnal variation in hormonal and lipid biomarkers
83
5
Results
We investigated diurnal variation of a set of markers (relevant for metabolic
disorders and hormonal cancers) in a routine setting in males and females. To
determine the diurnal variation we performed two analyses: 1) Cosine fitting
analysis: using CircWave software we determined whether the level of the marker
follows a cosine rhythm; 2) RM-ANOVA analysis: determine effects of time of day
on parameter levels. If analysis 1, analysis 2 or both indicated that significant
variation was present we identified the markers as having diurnal variation in our
experiment.
HormonesCosine analysis showed that for two of the eleven investigated hormonal markers,
a significant cosine curve fit was present in both genders: thyroid-stimulating
hormone (TSH) and total triiodothyronine (totT3) (Fig.1). The levels of TSH are
highest during the middle of the night, where in males (m) the peak is observed
slightly earlier (Clock Time (CT) = 01:54, p = 0.001, amplitude as percentage of the
median = 75.89%) compared to females (f ) (CT = 03:32, p = 0.006, amplitude =
74.26%). Levels of totT3 are highest at the beginning of the day (m: CT = 06:18, p
0.025, amplitude = 10.14%; f: CT = 07:04, p = 0.041, amplitude = 8.08%). Progesterone
(PRG) had a significant cosine curve fit in males, but not in females (m: CT = 07:52,
p = 0.003, amplitude = 117.78%; f: p = 0.870) (Fig. 1). For testosterone (TEST), a
trend towards a cosine curve fit was present in males, but not females (m: CT =
07:33, p = 0.055, amplitude = 38.38%; f: p = 0.282) (Fig. 1). For a complete overview
of CircWave analyses for all 11 hormonal markers, see Fig 1-3 and S3 Table.
For the two markers with a significant cosine fit in both genders, TSH and TotT3,
an effect of time was observed with RM-ANOVA as well (for statistics see S3 Table),
although for TotT3 in females only a trend is observed (p = 0.078). In addition, for
four markers where a cosine curve could not significantly be fitted, a significant
effect of time was observed, for TEST, DHEAS, PRG and prolactin (PRL) (Fig. 1 + 2).
RM-ANOVA shows that TEST and DHEAS are present at different levels during the 6
time-points in both genders (TEST: m: p 0.021, f: p = 0.023; DHEAS: m: p = 0.045, f: p
= 0.002). Furthermore, PRL and PRG are significantly different over the time-points
in one gender: PRL (m: p = 0.014, f: p = 0.118) and PRG (m: p = 0.020, f: p = 0.272).
For complete overview of the results of the RM-ANOVA on all time-points, see
Fig 1-3 and S3 Table.
40036 Dycke, Kirsten.indd 83 11-04-16 11:02

Chapter 5
84
5
Figure 1. Levels of TSH, TotT3, PROG, and TEST during the day, measured at four-hour intervals for male (left panels) and female (right panels) volunteers. Time indicates clock time. Values at 8-hr were double plotted to help visualize daily patterns. Data represent mean ±sd.
40036 Dycke, Kirsten.indd 84 11-04-16 11:02
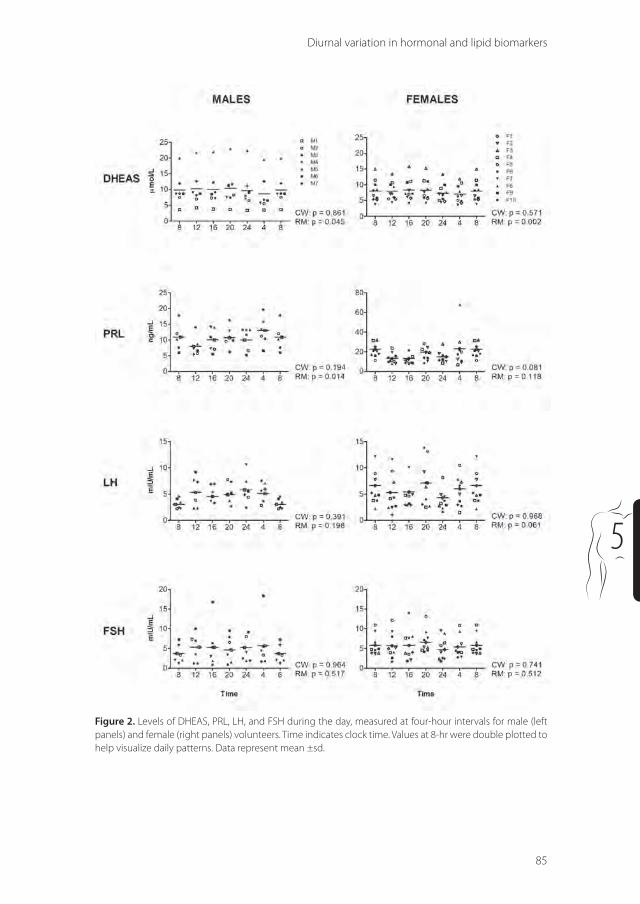
Diurnal variation in hormonal and lipid biomarkers
85
5
Figure 2. Levels of DHEAS, PRL, LH, and FSH during the day, measured at four-hour intervals for male (left panels) and female (right panels) volunteers. Time indicates clock time. Values at 8-hr were double plotted to help visualize daily patterns. Data represent mean ±sd.
40036 Dycke, Kirsten.indd 85 11-04-16 11:02

Chapter 5
86
5Figure 3. Levels of ACTH, hGH, and E2 during the day, measured at four-hour intervals for male (left panels) and female (right panels) volunteers. Time indicates clock time. Values at 8-hr were double plotted to help visualize daily patterns. Data represent mean ± sd.
40036 Dycke, Kirsten.indd 86 11-04-16 11:02
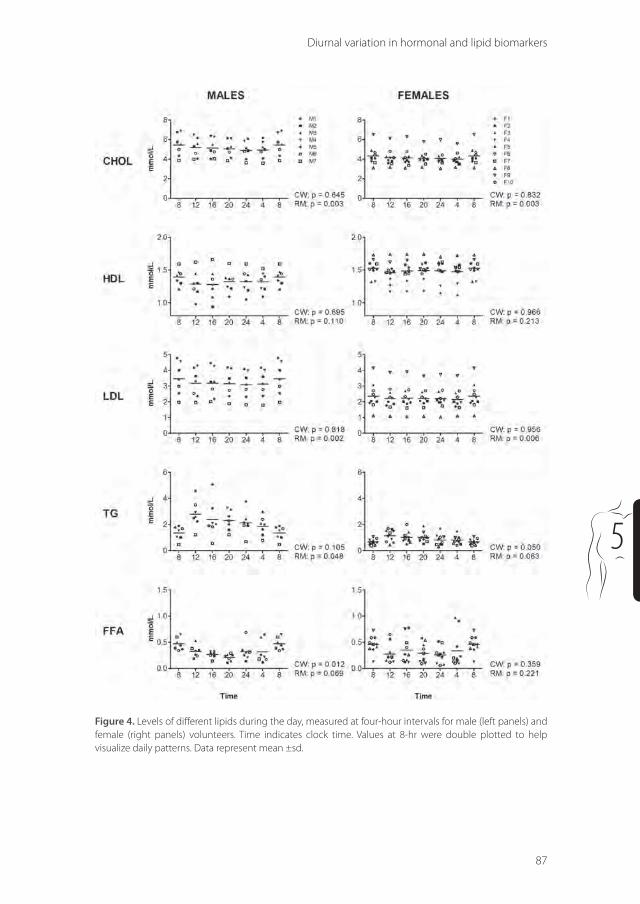
Diurnal variation in hormonal and lipid biomarkers
87
5
Figure 4. Levels of different lipids during the day, measured at four-hour intervals for male (left panels) and female (right panels) volunteers. Time indicates clock time. Values at 8-hr were double plotted to help visualize daily patterns. Data represent mean ±sd.
40036 Dycke, Kirsten.indd 87 11-04-16 11:02

Chapter 5
88
5
LipidsFive types of lipids were examined; free fatty acids (FFA), triglycerides (TG), total
cholesterol (CHOL), low-density lipoprotein (LDL), and high-density lipoprotein
(HDL) (Fig. 4). CircWave analysis indicated that FFA levels follow a cosine curve in
males (p = 0.012, amplitude 74.91%), but not significantly in females (p = 0.359,
amplitude = 80.70%). The levels of FFA were highest at the beginning of the active
period in males (CT = 08:31). A trend towards a cosine curve fit was observed
for TG in females (p = 0.050, amplitude = 50.33%), but not in males (p = 0.105,
amplitude = 70.36%) (Fig. 4). Visual inspection of the levels of FFA and TG in Fig. 4
implies that the differences between males and females for these markers is likely
related to the variation observed within the groups, since the highest levels are
observed at similar time-points for both genders. For complete overview of all
markers, see Fig. 4 and S4 Table.
Despite the limited presence of significant cosine curve fits observed among the
different lipid markers, for several markers RM-ANOVA shows significant effects of
time: for CHOL and LDL in both genders (CHOL: m: p = 0.003, f: p = 0.003; LDL: m:
p = 0.002, f: p = 0.006), for TG in males and a trend was present in females (m: p
= 0.048, f: p = 0.063) (S4 Table). The levels of FFA show a trend towards an effect
of time in males (m: p = 0.069, f: p = 0.221). For HDL, no significant effect was
observed in any gender (m: p = 0.110, f: p = 0.213). The highest level of most lipids
including FFA, LDL, and CHOL was observed at the beginning of the active phase,
the highest level of TG in males was observed during the middle of the day (Fig. 4).
In summary, for all lipid markers, except HDL significant or trends towards diurnal
variation are observed.
Classical circadian markers
The levels of cortisol were investigated in all participants (n=17), clock genes
PER1 and BMAL1 were investigated in a subset (n=6, females) to gain insight in
classical circadian markers in uncontrolled conditions (Fig. 5). Cortisol levels show
a significant cosine curve fit, are highest at the beginning of the day (m: CT =
07:47; f: CT = 07:29), and the rhythm has a relative large amplitude (m: p < 0.0005,
amplitude = 129.11%; f: p < 0.0005, amplitude = 161.63%) (Fig. 5, upper panels).
The levels of PER1 and BMAL1 mRNA show a significant cosine curve fit as well
(PER1 p = 0.002, amplitude = 80.15%; BMAL1 p = 0.035, amplitude = 35.55%). Levels
40036 Dycke, Kirsten.indd 88 11-04-16 11:02

Diurnal variation in hormonal and lipid biomarkers
89
5
of PER1 were highest during the morning (CT = 8:07), while levels of BMAL1 were
highest during the afternoon (CT = 14:12). For complete overview of statistics see
S5 Table.
Figure 5. Around the clock levels for classical circadian markers cortisol, PER1 and BMAL1. Upper panels show cortisol levels in male (left panels) and female (right panels) volunteers, determined in serum. mRNA expression of BMAL1 and PER1 in buffy coats are depicted in the lower panels (females subset n=6). All were measured at 4 hour intervals, where time indicates clock time. Values at 8-hr were double plotted to help visualize daily patterns. Data represent mean ±sd.
Discussion
The aim of the present study was to investigate diurnal variation in a set of
hormones, metabolic markers, and classical circadian markers in serum, plasma
and peripheral blood mononuclear cells (PBMCs), in a routine non-fasted molecular
epidemiology-like setting, with no restrictions on sleep or diet.
HormonesMarkers without diurnal variation
For markers without diurnal variation, taking the time-point of sampling into
account is not required. This study observed no diurnal variation or trends towards
40036 Dycke, Kirsten.indd 89 11-04-16 11:02

Chapter 5
90
5
diurnal variation in any gender in four of the eleven hormonal markers investigated,
ACTH, hGH, E2, and FSH. Previous published studies performed in a different type
of setting than the present study, namely a controlled (laboratory) settings do show
diurnal variation in ACTH levels in males , with the highest level being observed at
CT 4.00 h (Li et al., 2013) or CT 7.00 h (Nicolau and Haus, 1989), whereas no diurnal
was observed in females (Nicolau and Haus, 1989). Interestingly, in the present
study, levels were also highest at CT 4.00, indicating similar patterns. However,
in our study larger amount of variation is expected than a controlled laboratory
setting potentially causing the diurnal variation of ACTH undetectable within the
inter-individual variations. Since during day time-points, when sampling is usually
performed in a cohort study, variation in ACTH levels is minimal. Thus, diurnal
variation seems not to be a major issue for ACTH in a molecular epidemiology
setting. However, considering the previous studies on ACTH and that in a large
cohort setting power will be increased, diurnal variation might become larger than
the inter-individual variation and caution is required. In addition, if subjects are
investigated which possibly have a circadian disturbance (e.g. night shift workers),
variation in levels of the markers during night time-points should be taken into
account as well (see recommendations section for suggestions).
For hGH, former reports in controlled settings have shown diurnal variation in
males (Mazzoccoli et al., 2011, Nicolau and Haus, 1989). However, it is important
to note that it is known that hGH is released in pulses with levels varying up to 4
times (Riedel et al., 1995). Hence, in the present study with sampling intervals of 4
hours these pulse releases might interfere with the detection of diurnal variation.
Indeed, in the present study at several time-points large variations in the levels of
hGH are observed, particularly in males. This indicates that hGH is a difficult marker
to measure in a non-time-controlled cohort setting, since possible differences are
easily masked by the large amount of variation present for this marker.
For estradiol, the absence of diurnal variation in the present study is in line
with previous studies that reported the absence of diurnal variation in females
(Brambilla et al., 2009, Mortola et al., 1992), although diurnal variation is observed
in estradiol levels in elderly females (mean age 77 years) (Nicolau and Haus, 1989).
Together, these data indicate that in a cohort study with non-elderly adults, diurnal
variation of estradiol is not an issue.
40036 Dycke, Kirsten.indd 90 11-04-16 11:02

Diurnal variation in hormonal and lipid biomarkers
91
5
For FSH, conflicting data have been published previously. In females, the absence
of a diurnal variation was reported in studies using (mildly) controlled settings
(Klingman et al., 2011, Nicolau and Haus, 1989), while a third study reported
diurnal variation in females during different phases of the menstrual cycle, with
the highest levels of FSH being observed during the afternoon (Mortola et al.,
1992). For males, conflicting results have been reported as well: a study by Spratt
et al. showing the absence of diurnal variation in males (Spratt et al., 1988), while
Nicolau et al., reported the presence of a diurnal variation in elderly males (Nicolau
and Haus, 1989). Possibly, age has a role in the diurnal variation of FSH. However,
the present study indicates that in a routine setting, time of day is not a major
source of variation for FSH levels.
Markers with diurnal variation
For eight of the twelve investigated hormonal markers, diurnal variation was
observed in at least one gender. Markers with the most robust diurnal variation in
both genders were TSH and T3. This is in line with previous findings for these markers
(Hirschfeld et al., 1996, Klingman et al., 2011, Mazzoccoli et al., 2011, Nicolau and
Haus, 1989). For DHEAS, a previous study reported circadian rhythmicity in males
and females (Nicolau and Haus, 1989), however, in the present study the rhythm of
DHEAS could not be fitted to a cosine curve. The levels of DHEAS differed among
the time-points and the pattern of expression (e.g. highest levels in the afternoon)
is comparable to the previously published results, confirming diurnal variation of
DHEAS.
For testosterone, diurnal variation was not robust, but significant changes were
observed when the time-points were compared in both genders. Diurnal variation
in testosterone is in line with previous findings (Diver et al., 2003, Nicolau and Haus,
1989, Ostrowska et al., 1998, Plymate et al., 1989, Spratt et al., 1988, Brambilla et al.,
2009). The study by Spratt et al. showed that the robustness of the diurnal variation
of testosterone was largely dependent on the frequency of sampling.
For several of the other markers, the robustness of diurnal variation varied among
genders. Diurnal variation was often more pronounced in males. Since in the
present study menstrual period was not assessed, nor was the use of contraceptives,
this might explain the less robust results in females. For example, progesterone
showed diurnal variation in males, but not females. For females, it has been shown
40036 Dycke, Kirsten.indd 91 11-04-16 11:02

Chapter 5
92
5
that the rhythmicity of progesterone varies with the menstrual period, including
the timing of the highest levels (Fujimoto et al., 1990, Nicolau and Haus, 1989,
Veldhuis et al., 1988). Interestingly, 5 females show high progesterone levels,
which are indicative of the luteal phase. Of these females, two show a significant
or trend (p-value between 0.05 and 0.1) towards an individual cosine curve fit
(#6: p=0.0059 and #7: p=0.05222). These results suggest that indeed variation in
menstrual period, and possibly contraceptives use, interfere with measurements
of progesterone in a cohort setting.
For the final two markers, LH and PRL, only mild amounts of diurnal variation
were observed. For LH previous studies in females have shown that rhythmicity
is dependent on the menstrual cycle and that peak timing differs among women
(Klingman et al., 2011, Mortola et al., 1992, Veldhuis et al., 1988), which likely
explains the results of the present study. For prolactin, in the present study only
a trend towards a cosine curve fit was observed in females and effects of time
(by RM-ANOVA) in males. This is in line with previous studies that have shown
diurnal variation of prolactin in females in controlled settings (Birketvedt et al.,
2012, Fujimoto et al., 1990), and higher levels of prolactin during the night in males
(Miyatake et al., 1980). Together, these results indicate that for prolactin time of
day should be taken into account (see recommendations section for suggestions).
LipidsOf the 5 lipid markers, only HDL showed no diurnal variation (no cosine curve fit
and no effect of time by RM-ANOVA). Previously, it has been shown that a large
subset of lipids shows diurnal variation (for examples see references: Miida et al.,
2002, Chua et al., 2013, for review see reference: Gooley and Chua, 2014), however,
the rhythmicity of these markers is highly variable among individuals (Chua et
al., 2013). Furthermore, it is known that many lipids are directly regulated by the
endogenous circadian clock (Dallmann et al., 2012, Ang et al., 2012, Gooley and
Chua, 2014), lipid metabolism is related to sleep (Davies et al., 2014, Ollila et al.,
2012), and that levels of FFA, TG and LDL are dependent on meal-timing (Yoshino
et al., 2014, Niklowitz et al., 2006) The results of the present study, diurnal variation
in LDL, TG, FFA and total cholesterol are thus in line with previous findings. These
results show that for these markers time of day needs to be taken into account (see
recommendations section below for suggestions). Previously, diurnal variation has
been observed for HDL in a controlled setting (Miida et al., 2002), however, our
40036 Dycke, Kirsten.indd 92 11-04-16 11:02

Diurnal variation in hormonal and lipid biomarkers
93
5
study indicates that this variation does not exceed the inter-individual variation in
a routine setting.
Classical circadian markersIn chronobiology research, several markers are often used to study circadian
rhythm. Hence, these can be named as ‘classical circadian markers’. One of these
markers is cortisol, which is often used to study circadian rhythm in humans. In
addition, components of the molecular biological clock can be used to study
circadian rhythm, i.e. ‘clock genes’. Since these genes are part of the core clock
mechanism in cells, their rhythm reflects the circadian rhythm in these cells. We
show that the ‘classical circadian markers’ investigated in this study (cortisol and
the clock genes PER1 and BMAL1) have a robust cosine curve fit in our study
population, which resembles a routine non-fasted molecular epidemiology
setting. Our findings for cortisol (rhythmic expression with high levels during the
early morning), are in line with previous literature. Multiple studies, in a range of
different settings, have reported similar findings (for review see reference (Gamble
et al., 2014), for examples see references (Kusanagi et al., 2008, Takimoto et al., 2005,
Teboul et al., 2005)).
In our study PER1 expression fits to a cosine curve with the highest levels in the
morning, which is also consistent with previous studies. For example, James et
al. observed rhythmic PER1 expression with peak levels on average 2:36 h after
waking (±1:47 h) in PBMCs (James et al., 2007), Kusanagi et al. observed rhythmic
PER1expression with peak expression on average at 7:42 h in PMBCs (Kusanagi et
al., 2008), and Takimoto et al. reported peak levels at 06:00 h in whole blood cells
(Takimoto et al., 2005). For BMAL1, previous studies have indicated that rhythmicity
of BMAL1 gene expression in PBMCs is highly variable amongst individuals (Teboul
et al., 2005, James et al., 2007). For example, BMAL1 expression has been reported
to be high during the middle of the day (comparable to our study) (James et
al., 2007, Teboul et al., 2005), during the night (Takimoto et al., 2005), during the
evening (Teboul et al., 2005), or not being rhythmic (Kusanagi et al., 2008). Teboul
et al. suggested that this variation might be related to chronotype, since in their
study two groups of individuals could be distinguished: peak expression of BMAL1
during the middle of the day (12:30 hr) or during the evening (21:45 hr).
Together, our results shows that thediurnal variation, including the acrophase of
the fitted cosine curves, of several classical markers in our study is comparable to
40036 Dycke, Kirsten.indd 93 11-04-16 11:02

Chapter 5
94
previous studies using (mildly) controlled settings (James et al., 2007, Kusanagi et
al., 2008, Takimoto et al., 2005, Teboul et al., 2005).
Concluding remarks and reccomendationsThe present study showed that markers for which diurnal variation (circadian
rhythms and/or time-of-day-effects) is not an issue in a routine setting are ACTH,
FSH, E2 and HDL. For all other tested markers diurnal variation was observed, which
exceeded the inter-individual variation in a routine setting. It is important to note
that we tested this in a small test group (n=17). In a large cohort with numerous
subjects, levels of inter-individual variation might decrease due to larger sample
sizes, making the contribution of diurnal variation relatively larger. Hence, for some
of the markers without detectable diurnal variation in the present study, diurnal
variation might play a role in larger studies. Nevertheless, our study provides an
indication for which markers diurnal variation needs to be taken into account in a
routine setting.
Taking diurnal variation into account can be done in several ways depending on
the study design and marker characteristics (such as dependent on food intake,
sleep/wake cycle etc.). For example, measurements can be taken at a single time-
point or if sampling at a single time-points is not possible, registration of sampling
time and their relevant time-points (e.g. timing of food intake) is an alternative
method to take into account diurnal variation. Apart from a research setting,
several of the markers in our study are measured in a clinical setting as well. In
general, a substantial amount of variance is incorporated in reference levels for
diagnostic purposes. However, for biomarkers with large diurnal variation it might
be beneficial to take multiple samples during the day or define reference levels
that take into account time-of-day.
Our finding that most markers tested show diurnal variation is in line with recent
studies showing that many genes are regulated by the circadian clock. For example,
a recent study has shown that 43% of the protein coding genes shows diurnal
variation in at least one organ in mice (Zhang et al., 2014a), as a consequence
one could expect diurnal variation in many serum or plasma protein levels as well.
This large set of markers with diurnal variation indicates the need for investigating
diurnal variation before setting up studies measuring markers in routine and
controlled settings, since time- of- day likely matters for many more markers than
the ones investigated in the present study.
40036 Dycke, Kirsten.indd 94 11-04-16 11:02

40036 Dycke, Kirsten.indd 95 11-04-16 11:02

40036 Dycke, Kirsten.indd 96 11-04-16 11:02
CHAPTER 6
Attenuation of circadian rhythmicity in hepatic gene expression upon
chronic alternating light cycle exposure
Kirsten C.G. Van Dycke, Jeroen L.A. Pennings, Conny T.M. van Oostrom,
Linda W.M. van Kerkhof, Gijsbertus T.J. van der Horst, Harry van Steeg,
Wendy Rodenburg
In preparation
40036 Dycke, Kirsten.indd 97 11-04-16 11:02

Chapter 6
98
Abstract
Disturbance of circadian rhythms in shift workers results in increased health
risks, including obesity and cancer. Previously, we have shown that mice gain
more weight when chronically exposed to conditions that cause circadian
rhythm disturbance (CRD). The aim of the present study was to understand the
mechanism(s) underlying the observed overweight phenotype in mice. As the liver
is a key metabolic organ and regulator of energy metabolism, liver transcriptome
analysis enables the identification of disturbed processes involved in the obese
phenotype. Mice were exposed to a weekly alternating light-dark schedule for
18 weeks and 7 days after the last shift gene expression was analyzed over a 24-
hour period to allow identification of more permanent affected processes upon
long-term CRD. Overall, the effects on gene expression were minor compared to
previous studies where the transcriptome was studied directly after impingement
on the circadian system. However, an overall attenuation of circadian rhythmicity
was found in hepatic gene expression, associated with a wide variety of processes,
including cell cycle control and DNA damage processes. The largest decrease in
amplitude was found in genes involved in the balance between lipid and glucose
metabolism: Ppard, Pdk4, Slc16a5 and Igfbp-1. In conclusion, metabolic flexibility
might be compromised by long-term exposure to CRD, resulting in increased
weight gain in mice. Further research should elucidate the relevance of acute
versus more permanent disturbed processes for adverse health outcomes to
develop evidence based preventive measures.
40036 Dycke, Kirsten.indd 98 11-04-16 11:02

Attenuation of circadian gene expression upon CRD
99
6
Introduction
The circadian system imposes 24 hour rhythmicity on behavior, physiology and
metabolism and allows us to anticipate daily recurring changes in our environment.
This internal timekeeping system is composed of a light-entrainable central clock
in the suprachiasmatic nucleus (SCN) located in the brain, and peripheral clocks in
all other tissues in the body. On a molecular level, circadian rhythms are generated
by a set of clock genes that act in an auto-regulatory transcriptional-translation
feedback loop (TTFL) and confer rhythmicity to biological output processes via
clock-controlled genes (Lee et al., 2001). Various expression profiling studies have
shown that, depending on the tissue, up to 10% of the transcriptome is under
circadian control (Akhtar et al., 2002, Bozek et al., 2009, Panda et al., 2002, Storch
et al., 2002). Accordingly, it is not surprising that long lasting circadian rhythm
disturbance (CRD), e.g. by chronically alternating light cycles, result in a loss of
homeostasis in addition to the acute disturbances as shown in several studies
(Archer et al., 2014a, Barclay et al., 2012, Moller-Levet et al., 2013).
As a consequence of chronic circadian rhythm disturbance (CRD), long-term shift
workers are at risk for various adverse health effects. Various studies indicated an
association between social jet-lag, shift work and increased body weight, although
conflicting data exist (Kubo et al., 2011, Nabe-Nielsen et al., 2011, Roenneberg et
al., 2012, Parsons et al., 2014). These human studies, however, are hampered by
difficulties with exposure assessment and confounding factors, such as unhealthy
food intake. Animal studies can limit the influence of these factors, as specifically
designed CRD exposure protocols allow exclusion of or strict control over
confounding factors. Previously, we have shown that chronically alternating light
cycles cause an increased breast cancer risk and body weight gain in breast cancer
predisposed mice (Van Dycke et al., 2015). This model provides a unique tool to
further analyze mechanisms that underlie the relationship between shift work and
cancer and increased body weight.
Shift work involves a multitude of aspects, including internal desynchronization,
melatonin suppression, sleep disruption, lifestyle disturbance and decreased
vitamin D levels (Fritschi et al., 2011). A number of these aspects, including circadian
desynchrony, lifestyle disturbance and timing of food intake, have been proposed
to underlie the relationship between shift work and increased body weight (Fonken
40036 Dycke, Kirsten.indd 99 11-04-16 11:02

Chapter 6
100
et al., 2010, Salgado-Delgado et al., 2010). Unravelling the mechanisms that link
shift work with adverse health effects is a requisite for developing evidence-based
interventions that minimize health risks. Especially, understanding the underlying
metabolic changes could provide targets for preventive measures, since food
intake can be adjusted.
Transcriptomics studies provide a useful tool to investigate a wide variety of
processes and several studies show that CRD affects animal and human gene
expression profiles (Archer et al., 2014a, Barclay et al., 2012, Moller-Levet et al.,
2013). In human laboratory studies, mistimed sleep and insufficient sleep cause
the majority of the rhythmically expressed mRNAs in the blood transcriptome to
become arrhythmic (Archer et al., 2014a, Moller-Levet et al., 2013). Timed sleep
restriction in mice was shown to disrupt global liver gene expression, with many
genes associated with lipid and glucose metabolism processes (Barclay et al., 2012).
Furthermore, in these studies the exposure period was limited to weeks, whereas
shift workers are involved in irregular working hours for many years. Although
these human and animal studies show (semi)acute effects on both circadian and
non-circadian biological processes, directly or shortly after impingement on the
circadian system, they fail to provide insight into the constitutively disturbed
processes underlying long-term health effects such as obesity and cancer.
Therefore, to gain more knowledge on processes involved in chronic CRD we
performed a mouse study in which we chronically altered light cycles and focused
on changes in longer term expression patterns, which may explain the observed
weight gain phenotype.
Methods
Experimental set-upAnimal experiments were performed in compliance with national legislation,
including the 1997 Dutch Act on Animal Experimentation, and were approved by
the institute’s Animal Experimentation Ethical Committee. Food and water were
available ad libitum throughout the whole experiment.
The experimental set-up of the study has been described previously (Chapter 2)
(Van Dycke et al., 2015). In short, breast cancer-prone female p53R270H/+WAPCre mice
40036 Dycke, Kirsten.indd 100 11-04-16 11:02

Attenuation of circadian gene expression upon CRD
101
6
(Wijnhoven et al., 2005) in an FVB genetic background were kept under normal
LD conditions or chronically exposed to a weekly alternating 12:12 hour light-
dark cycle. After 18 inversions, on day 7 of the last shift, animals were sacrificed at
4 hour time intervals over a 24-hour period (n=4 animals per time point). Blood
and tissues were collected for further analysis. Due to premature animal loss, 21
animals per condition were available for further analysis. In an additional group of
mice (n=5 per group), a radio transmitter (Physio Tel, TA11 TA-F10; Data Sciences,
St. Paul, MN) was implanted in the peritoneal cavity to record locomotor activity
and core body temperature every ten minutes (Van Dycke et al., 2015).
Micro-array analysisTotal RNA was extracted from RNAlater (Invitrogen, Grand Island, NY, USA)
protected liver tissues using the miRNeasy Mini Kit (Qiagen Benelux, Venlo, The
Netherlands). RNA concentrations were measured using a NanoDrop ND-1000
Spectrophotometer (Nanodrop Technologies, Wilmington, DE, USA), and RNA
quality was assessed with an Agilent 2100 Bioanalyzer (Agilent Technologies,
Amstelveen, the Netherlands).
RNA was processed for gene expression analysis at the Microarray Department
of the University of Amsterdam, the Netherlands, using Agilent SurePrint G3
Mouse GE 8x60K arrays (Amstelveen, the Netherlands). This type of microarray
contains 55,681 probes for biological features such as mRNAs and ncRNAs. RNA
amplification and labeling were carried out according to the manufacturer’s
protocol. Experimental samples (each corresponding to RNA isolated from one
individual mouse) were labelled with Cy3 and the common reference sample
(made by pooling equimolar amounts of RNA from experimental samples) was
labelled with Cy5. Slides were scanned with an Agilent G2565CA DNA microarray
scanner, followed by automated feature extraction, resulting in a table containing
individual probe signal intensities for both dyes.
Data analysis
The raw data were subjected to a set of quality control checks to ensure comparable
signal average and distribution. Raw microarray data for gene-coding probes were
normalized in R (www.r-project.org) using a four step approach (Pennings et al.,
2011): (1) natural log-transformation, (2) quantile normalization of all scans, (3)
correcting the sample spot signal for the corresponding reference spot signal and
40036 Dycke, Kirsten.indd 101 11-04-16 11:02

Chapter 6
102
(4) averaging data from replicate probe spots. The normalized data of 55,681 probes
were further analyzed in R and Excel (Microsoft Corporation, USA). Probe to gene
annotation data was downloaded from NCBI. Significantly regulated probes were
annotated to the corresponding genes for further biological interpretation. To this
end, when multiple probes corresponding to the same gene were significant, they
were counted as one gene in further analysis; probes that did not correspond to
genes according to the current NCBI database were excluded from further analysis.
To identify differentially expressed genes for chronic CRD exposed animals
compared to controls, we performed a one-way ANOVA with Qlucore Omics
Explorer (Qlucore AB, Lund, Sweden) in which p<0.001 was considered statistically
significant. CircWave Batch v5.0 software (Hut, R., www.euclock.org/results/
item/circ-wave-batch.html) was used to analyze circadian rhythmicity of gene
expression under regular LD conditions and after prolonged exposure to weekly
LD-inversions. Enrichment of selected gene lists was analyzed with MetaCore GO
Processes from GeneGo, Inc. (http://www.genego.com/). Gene expression data
were imported into Metacore using their NCBI Entrez GeneID as identifier; therefore
only genes annotated with a GeneID in the current NCBI database were used
for pathway enrichment analysis. To ensure biological relevance, only processes
including between 10 and 1000 genes were taken into account. GO Processes
were considered significantly enriched with a p<0.001. Gene Set Enrichment
Analysis allowed us to identify significant up- or downregulation of enriched gene
sets (P<0.05 and FDR<0.25) (Mootha et al., 2003, Subramanian et al., 2005).
Results
Attenuation of circadian rhythmicity in gene expressionThe alternating light cycle protocol to chronically disturb the circadian rhythm
(CRD protocol) used in this study has previously been shown to shorten tumor
latency times, increase body weight and affect sleep timing (Van Dycke et al.,
2015). Although the weight gain phenotype is already apparent at week 6,
group differences only became significant after week 24. Given the overweight
phenotype, we analyzed possible transcriptional changes in the liver. Since we were
interested in processes that are involved in the observed overweight phenotype
early on, we analyzed gene expression 18 weeks after start of the exposure, before
the differences in body weight gain were significant. Clock and clock-controlled
40036 Dycke, Kirsten.indd 102 11-04-16 11:02

Attenuation of circadian gene expression upon CRD
103
6
genes, as well as temperature rhythms, were re-entrained 7 days after the final
light-dark shift whereas corticosterone serum levels showed a bimodal rhythm
upon chronic CRD (Van Dycke et al., 2015). This re-entrainment of the majority
of these classical parameters allowed investigation of more permanent disturbed
genes and processes.
The observed re-entrainment of temperature and clock gene expression, in
contrast to altered serum corticosterone rhythms suggest that chronic CRD results
in internal desynchronization. Therefore, we determined circadian rhythmicity of
all genes using CircWave, for the control light-dark (LD group) and chronic CRD
groups separately. Significant circadian gene expression (p<0.001) was observed
for 594 genes in LD controls and only in 133 genes in chronic CRD exposed animals.
The overlap between the two groups was limited to 33 genes, including several
clock or clock controlled genes (for a complete overview, see Supplemental Table
S1). Interestingly, 561 genes lost significant circadian expression after chronic CRD
based on p-value. However, closer examination of the expression profiles revealed
that oscillation was not completely abolished for these genes (Fig. 1). Rather, the
majority of these genes showed a lower amplitude oscillations, as compared to
LD controls (Fig. 1) and the average amplitude of all 561 genes was significantly
decreased in chronic CRD exposed animals (Fig. 2a, Mann Whitney test, p < 0.001).
This lower amplitude explains the lack of significant circadian rhythmicity in gene
expression. Furthermore, a limited effect on phase was found (Fig. 2b). These
findings are indicative of a re-entrained, yet attenuated circadian rhythmicity in
gene expression upon prolonged exposure to weekly LD-inversions.
40036 Dycke, Kirsten.indd 103 11-04-16 11:02

Chapter 6
104
Figure 1. Heatmap of 561 genes that lost significant circadian rhythmicity in gene expression after prolonged exposure to CRD, according to CircWave analysis. It is clearly shown that the circadian rhythm of these genes is not abolished, however the amplitude is decreased in the majority of these genes.
40036 Dycke, Kirsten.indd 104 11-04-16 11:02

Attenuation of circadian gene expression upon CRD
105
6
Figure 2. Overview of circadian parameters of genes with significant circadian gene expression under regular LD conditions, lost upon chronic CRD. A. The amplitude of these genes was significantly reduced in chronic CRD animals compared to controls B. Acrophase was comparable between no large phase shifts were found. All indicative of an attenuated circadian gene expression resulting from chronic exposure to CRD.
Mice exposed to weekly LD-inversions showed a larger increase in relative body
weight compared to the animals kept in a stable LD cycle (Van Dycke et al., 2015).
To gain insight in mechanisms underlying the observed increased weight gain,
we determined enrichment of the 561 genes that lost significant circadian gene
expression upon chronic CRD exposure compared to LD conditions in biological
processes. Chronic CRD caused attenuation of circadian rhythmicity in genes
involved in 237 processes (p <0.001, >10 and <1000 genes in process). The
largest groups of processes involve hormonal regulation, response to exogenous
compounds and metabolism, comprising both lipid and glucose metabolism (Fig.
3). In addition, the affected genes were associated with circadian rhythm, cell cycle,
and signaling processes (Fig. 3). A complete list of significantly enriched processes
is given in Supplemental Table S2.
40036 Dycke, Kirsten.indd 105 11-04-16 11:02

Chapter 6
106
Figure 3. Significantly enriched processes for genes with attenuated circadian rhythmicity in gene expression upon chronic CRD exposure, arranged in themes. In relation to the observed overweight phenotype it is interesting to see decreased amplitude in genes involved in glucose and lipid metabolism processes, especially in glucose transport and storage and also lipid storage.
In addition to chronic CRD affected biological processes, we investigated the top
20 rhythmically expressed genes with the largest relative decrease in amplitude
(Supplemental Table S3) in more detail. Since we study gene expression changes
7 days after the last light-dark shift, only minor differences might be expected due
to re-entrainment. Within this group of most affected genes regarding amplitude,
several metabolic related genes still showed an altered rhythm, including Ppard,
Pdk4, Slc16a5 and Igfbp-1 (Fig. 4). Under LD conditions, both the nuclear hormone
receptor Ppard and isoenzyme Pdk4 peak at the dark to light transition. Chronic
CRD exposure appears to lower peak mRNA expression of these genes, and delay
acrophase to early light phase. Igfbp-1, which binds IGF and thereby regulates
IGF action, shows both alteration of phase and attenuation of the rhythm. Under
normal LD conditions, Igfbp-1 gene expression peaks at the dark to light transition,
whereas chronic CRD caused a slightly advanced and lower peak expression.
Moreover, the circadian rhythmicity of monocarboxylate transporter Slc16a5 gene
expression is completely abolished in chronic CRD exposed animals.
Disturbance of non-circadian genes and processesIn addition to disturbance of circadian rhythmicity of gene expression, chronic
disturbance of the circadian system might also affect non-circadian processes.
Using one-way ANOVA, we compared the overall expression of each gene of CRD
mice to that of the LD controls, not taking into account time-of-day. The latter was
accomplished by combining all time-points per group, comparing the average
expression of all CRD exposed mice to the average expression of all LD controls.
Surprisingly, we found only 18 genes to be differentially expressed (p <0.001) in
CRD exposed animals, as compared to controls (Supplemental Table S4), with
40036 Dycke, Kirsten.indd 106 11-04-16 11:02

Attenuation of circadian gene expression upon CRD
107
6
Figure 4. Altered circadian gene expression of Ppard, Pdk4, Igfbp-1 and Slc16a5, involved in the balance between glucose and lipid metabolism. Ppard and Pdk4 both show a phase delay and decreased amplitude upon chronic CRD (open symbols) compared to LD controls (closed symbols). CRD caused a slight advance and decrease of peak Igfbp-1 gene expression, with a distinct trough at the light to dark transition. For Slc16a5 the rhythm is completely abolished in CRD exposed animals.
minor diff erences in average gene expression. This number is limited, and does
not allow pathway analysis. Therefore, Gene Set Enrichment Analysis (GSEA) was
used, to identify subtle diff erences in GO processes or canonical pathways, again
using all time-points per group combined. In the GSEA analysis, the complete
gene expression dataset is used to study signifi cant overrepresentation of up
or down regulated genes between CRD exposed animals and LD controls in
gene sets representing GO Processes and other online databases (C2 gene sets).
GSEA identifi ed 36 upregulated processes or pathways, mainly involved in DNA
replication, transcription, translation and metabolism (Supplemental Table S5).
The majority of the 75 downregulated processes identifi ed represented immune,
cell cycle and proliferation processes (Supplemental Table S5). Interestingly,
also downregulation of several catabolic processes was observed. This analysis
indicates that although no major diff erences in average gene expression between
CRD animals and LD controls were found, genes involved in a wide variety of
processes are aff ected by CRD.
40036 Dycke, Kirsten.indd 107 11-04-16 11:02

Chapter 6
108
Figure 5. Using Gene Set Enrichment Analysis significant overrepresentation of regulated genes between CRD exposed animals and LD controls in GO processes or the C2 gene sets is studied. The majority gene sets with significant overrepresentation of down regulated genes is involved in immune processes, whereas the up regulated genes are mainly involved in DNA replication.
Discussion
Due to the growing 24/7 economy, shift work will become increasingly part of our
society and will, therefore, have an incremental effect on public health outcomes.
Understanding mechanisms underlying the adverse health effects originating
from chronic circadian rhythm disturbance (CRD) is of prime importance to
develop preventive measures for shift work. An experimental set-up inducing
CRD, along with a mouse model at risk for the development of breast cancer
risk, weight gain and other morbidities, provides a unique tool to identify such
underlying disturbed processes (Kubo et al., 2011). The major advantage of this
model is the ability to control the exposure and to exclude confounding factors,
which both hamper human observational studies. Importantly, we aimed to find
constitutively disturbed processes upon long-term exposure to CRD. As such, we
studied the hepatic transcriptome of mice exposed to 18 weeks of CRD compared
to LD controls, 7 days after the last shift. We focused on identifying disturbances in
both circadian and non-circadian genes and processes.
Studying rhythmically expressed genes, we observed weaker rhythmicity in hepatic
gene expression upon chronic CRD exposure, affecting a wide variety of molecular
processes. This could be indicative for an overall loss of homeostasis, resulting from
constant re-entrainment to the chronically alternating light cycle. Although this
40036 Dycke, Kirsten.indd 108 11-04-16 11:02

Attenuation of circadian gene expression upon CRD
109
6
finding is generally in line with previous studies that have shown a loss of circadian
rhythmicity in the human blood transcriptome resulting from insufficient sleep
(Moller-Levet et al., 2013) and mistimed sleep (Archer et al., 2014a), our findings are
less pronounced. This can be explained by the fact that we monitored effects only
7 days of recovery after the last shift. This resulted in re-entrainment of classical
circadian parameters such as clock gene expression and core body temperature.
The loss of significant circadian gene expression is mainly due to a decrease in
amplitude, indicating that overall circadian gene expression is also re-entrained,
but rhythmicity is attenuated. In short-term experiments as performed by others
(Barclay et al., 2012), melatonin, clock genes and clock controlled genes were
found to be disturbed, directly after impingement on the circadian system.
In relation to the weight gain phenotype observed in mice under CRD conditions,
we found that genes with attenuated circadian expression upon CRD were
enriched for processes involved in mainly glucose but also lipid metabolism.
Under normal conditions both carbohydrate and lipid metabolism show distinct
time-of-day dependent rhythms (Bailey et al., 2014). The attenuation in glucose
metabolism processes is in line with recent findings that the circadian system
is largely responsible for daily rhythms in glucose tolerance and that separately
circadian misalignment reduces glucose tolerance (Morris et al., 2015). Furthermore,
GSEA analysis revealed down regulation of catabolic processes, which shows that
energy metabolism is also affected in non-circadian genes.
The largest decrease in amplitude was found in genes involved in the balance
between lipid and glucose metabolism: Ppard, Pdk4, Slc16a5 and Igfbp-1. The
nuclear receptor Ppard has been shown to be a key regulator of Pdk4 (Degenhardt
et al., 2007). This direct regulation could explain the similar changes in circadian
expression of both genes. A similar decrease in amplitude of Pdk4 expression was
observed in animals kept on a high fat diet (Eckel-Mahan et al., 2013), and animals
that underwent timed sleep restriction (Barclay et al., 2012), both indicative of an
interaction between circadian clock and metabolism. Furthermore, Pdk4 plays an
important role in the metabolic flexibility under various nutritional conditions
(Zhang et al., 2014b). In response to starvation Pdk4 mRNA and protein levels in liver
increase (Wu et al., 2000). The conversion of pyruvate into Acetyl-CoA is inhibited
by Pdk4 as it inactivates the pyruvate dehydrogenase complex, maintaining blood
glucose levels under fasting conditions (Jeoung and Harris, 2010). The observed
40036 Dycke, Kirsten.indd 109 11-04-16 11:02

Chapter 6
110
circadian rhythm in Pdk4 expression under LD conditions correspond with daily
rhythms in feeding and fasting. Attenuated rhythms in Pdk4 resulting from chronic
CRD exposure might result in limited ability to regulate blood glucose levels.
Little is known about the function of Slc16a5, and mainly described as a
transporter for diuretics (Murakami et al., 2005). However, other monocarboxylate
transporters are involved in energy balance processes (Lengacher et al., 2013).
The Insulin-like Growth Factor-1 (IGF-1) axis, including Igpbp-1, is likely involved
in glucose metabolism, as it can acutely regulate glucose levels (Katz et al., 2002).
The combination of decreased amplitudes in Pdk4, Ppard, Igfbp-1 and Slc16a5
and increased body weight gain upon long-term exposure to CRD suggests an
imbalance between nutritional status and lipid and glucose metabolism, resulting
in obesity. Future studies should specify this imbalance and investigate which
interventions could help balance nutritional intake and metabolism to prevent
obesity. For example studying the metabolome could indicate which metabolic
processes have increased or decreased activity based on the metabolites found to
be linked to these processes.
In conclusion, chronic CRD results in weaker circadian rhythmicity of a wide variety
of circadian and non-circadian processes, including processes that could be related
to the body weight gain phenotype observed in shift workers. Attenuation in
circadian rhythmicity of both glucose and lipid metabolism processes and genes
involved in their balance provide a preliminary target for intervention. However,
the chronic effects are minor compared to the acute effects shown by previous
transcriptome analyses (Barclay et al., 2012, Moller-Levet et al., 2013). Taken
together, based on these observations one could speculate that the weakened
circadian rhythmicity 7 days after the last shift is only a remainder of more severe
disturbance at earlier time points e.g. 1 or 2 days after the shift. The relevance of
acute and more permanent disturbance of biological processes for adverse health
outcomes remains to be determined. Insights herein would provide important
input for the discussion whether slow or fast rotating shift schedules should be
employed. Additionally, in depth analysis of affected genes and processes and
metabolome data should provide further insights in the role of the constitutively
disturbed processes in the relation between CRD and increased weight gain.
40036 Dycke, Kirsten.indd 110 11-04-16 11:02

40036 Dycke, Kirsten.indd 111 11-04-16 11:02

40036 Dycke, Kirsten.indd 112 11-04-16 11:02

CHAPTER 7
Summary and general discussion
40036 Dycke, Kirsten.indd 113 11-04-16 11:02

Chapter 7
114
Summary
Working around the clock as a consequence of our growing 24/7 economy strains
and disturbs the tightly regulated circadian system. In epidemiological studies,
shift work was associated with many adverse health effects, such as cancer, obesity
and cardiovascular disease. These observational human studies are hampered by
confounding factors, difficulties with exposure assessment and take many years to
complete. Yet, due to the similarities in carcinogenesis (Balmain and Harris, 2000)
and the circadian system (Lowrey and Takahashi, 2011) between mice and human,
mice provide a unique tool to study the relationship between shift work and
cancer. Animal studies are less influenced by confounding factors and therefore
provide the ability to study the causal relationship between chronic circadian
disturbance and adverse health effects. Additionally, animal studies provide the
ability to study the different aspects of shift work and to identify underlying
mechanisms and potential biomarkers for circadian rhythm disturbance (CRD) to
aid the development and study of preventive measures.
In chapter 2 the effect of chronically alternating light cycles on breast cancer
development and body weight was studied using a unique breast cancer-prone
mouse model. We observed alterations in the classical circadian markers body
temperature and serum corticosterone, preceding health effects. Whereas age-
matched breast cancer prone Li-Fraumeni female mice, housed under normal light
dark conditions, displayed a tumor latency time of 50.3 weeks, animals exposed
to weekly light-dark (LD) inversions showed a markedly shortened tumor latency
time of 42.6 weeks. In addition, CRD animals showed an increase in body weight. To
our knowledge this is the first study providing experimental evidence for a causal
relationship between circadian rhythm disturbance and breast tumorigenesis.
These findings warrant the identification of biomarkers that evaluate the presence
of circadian rhythm disturbance (CRD) and health risk before adverse health effects
occur. The use of whole genome gene expression analysis is a valuable approach
to identify differentially expressed genes upon CRD in the tissue of interest and
select genes that qualify as useful biomarkers. In chapter 3, we provided a proof
of principle for a comparative transcriptomics approach to identify potentially
blood detectable biomarkers for breast cancer using the Li-Fraumeni mouse
model. By comparing gene expression profiles of tumor samples with different
characteristics to control mammary gland tissue, we determined differentially
40036 Dycke, Kirsten.indd 114 11-04-16 11:02

115
Summary and general discussion
expressed gene across tumor subtypes. Subsequently, candidates were prioritized
based on possible blood-detectability as determined by cross-referencing with
literature databases. Finally, a set of 16 candidate markers for breast cancer was
selected based on the expression in tumor compared to normal mammary gland.
As the transcriptomics approach proved to be able to select potentially blood-
detectable biomarkers for breast cancer, we employed a similar approach to identify
biomarkers for CRD. Although blood-detectable biomarkers for CRD, independent
of time of day, can facilitate studies regarding preventive interventions, these
biomarkers have not yet been identified. In chapter 4, we exposed female mice
to 6 shifts in a clockwise (CW) and counterclockwise (CCW) rotating CRD protocol.
Hepatic gene expression analysis using a classification approach resulted in a
consensus set of 15 genes, able to predict CRD with an accuracy ranging from 90%
to 98%. Additionally, to find candidate markers that allow non-invasive detection
of CRD, we applied a sequential approach selecting 9 potentially blood-detectable
markers. One of these candidates, CD36 was found to be significantly increased
in serum, although less pronounced than expected from the gene expression
upregulation.
Future research into the adverse health effects of CRD will also require the
measurement of disease related biomarker in large-scale cohort studies.
Chapter 5 provides a descriptive study of the daily variation of hormonal and
lipid biomarkers in males and females, in a molecular epidemiology-like setting.
Using two analysis methods: 1) Cosine fitting analysis and 2) RM-ANOVA, we found
diurnal variation in many markers for at least one gender, which exceeded the
inter-individual variation. Consequently, when investigating these markers one
should take into account diurnal variation. Furthermore, since time-of-day likely
matters for additional markers, these findings warrant the need for investigating
diurnal variation before setting up studies measuring markers in routine and
controlled settings.
In chapter 6 we describe experiments where mice were exposed to weekly
alternating light-dark cycles and the liver transcriptome was analyzed to identify
disturbed processes involved in the body weight gain phenotype as observed in
chapter 2. We found an overall attenuation of circadian rhythmicity in hepatic
gene expression, which was less pronounced than previous studies investigating
40036 Dycke, Kirsten.indd 115 11-04-16 11:02

Chapter 7
116
the effect of insufficient or mistimed sleep on the blood transcriptome. Amplitude
was particularly decreased in genes involved in the balance between lipid and
glucose metabolism: Ppard, Pdk4, Slc16a5 and Igfbp-1. Thus, compromised
metabolic flexibility might underlie the body weight gain phenotype observed in
chapter 2 and the overweight phenotype in shift workers and therefore provide a
preliminary target for intervention.
40036 Dycke, Kirsten.indd 116 11-04-16 11:02

117
Summary and general discussion
Discussion
The existence of our 24-hour economy is irreversible and will require an increasing
number of individuals to work at irregular hours. This might put them at risk
for adverse health effects by constantly straining and disturbing the tightly
regulated biological clock. The relationship between the circadian system and
cancer has been studied extensively, both in epidemiological studies and animal
experiments. Most epidemiological studies point towards an association between
shift work and breast cancer, as well as other adverse health effects (IARC, 2010).
Unfortunately, the complex mixture of exposures we call shift work hampers the
accurate assessment of causality. Furthermore, large scale prospective studies are
costly and labor intensive due to the use of classical circadian markers such as
melatonin, requiring around the clock measurement. To date, animal studies have
emphasized the relationship between the circadian system and cancer. Overall,
they have shown that a partially or completely non-functional circadian system
result in increased tumor growth. However, studies are lacking that combine
relevant models for CRD exposure and adverse health effects such as breast cancer
to provide experimental proof for the shift work cancer connection. Notably, there
is a gap between epidemiological and animal studies concerning the experimental
proof that shift work causes an increased cancer risk. In this thesis we aimed to
elucidate the causal relationship between circadian rhythm disturbance and
breast cancer development and to provide candidate biomarkers and targets for
interventions for future studies.
Causality between CRD and breast cancer and obesity The findings described in chapter 2 show that chronic circadian rhythm
disturbance (CRD) induced by chronically alternating light schedules decreased
latency times of tumor development and increased body weight gain in a
breast cancer-prone mouse model. Previous animal experiments, studying the
relationship between CRD and cancer differed from this study in the combination
of CRD induction methods and the breast cancer models used. For example, some
studies addressed tumor growth rather than cancer initiation and progression
by using xenograft models (Blask et al., 2003, Filipski et al., 2004) and chemically-
induced tumor models (Hamilton, 1969, Shah et al., 1984). Additionally, ‘unnatural’
continuous bright light exposure and endogenous circadian rhythm disruption
models were employed, which result in arrhythmicity (Anisimov et al., 2004, Wu
40036 Dycke, Kirsten.indd 117 11-04-16 11:02

Chapter 7
118
et al., 2011). To our knowledge, the study as described in chapter 2 unequivocally
shows a link between chronic CRD and breast cancer development, relevant for
the human situation.
Shift work is a complex mixture of exposure and different aspects of these exposures
have been suggested to underlie the observed cancer risk in individuals involved
in shift work. Fritschi et al. proposed five mechanisms that should be considered
for comprehensive investigation: (i) internal desynchronization, (ii) light at night
(resulting in melatonin suppression), (iii) sleep disruption, (iv) lifestyle disturbances
and (v) decreased vitamin D levels due to lack of sun light (Fritschi et al., 2011). In
chapter 2 the relevance of these hypotheses was tested and the findings suggest
that internal desynchronization and sleep disruption are important in the etiology
of CRD-associated health risks and pathologies. The other factors (melatonin
suppression, lowered vitamin D levels and life style factors) could be excluded
in our study and therefore appear to be less relevant in the shift work cancer
relationship. Consequently, sleep disruption and internal desynchronization are
targets for preventive measures.
Apparently, the process of carcinogenesis is induced by circadian rhythm
disturbance and additional experiments could further elucidate which specific
aspects of carcinogenesis is affected. It has been suggested that all aspects of the
cellular response to DNA damage are controlled or influenced by the circadian
clock (Sancar et al., 2010). Consequently, chronic disturbance of the circadian
system is likely to affect these DNA damage control systems in place to prevent the
accumulation of mutations, which eventually result in uncontrolled or neoplastic
cell growth (Berenblum, 1975). Alternatively, the accumulation of mutations could
be the result of increased exposure to endogenous DNA damaging agents. For
example, the disturbance of metabolic processes by CRD could increase the
amount of reactive oxygen species and consequently increase mutations. Based
on the decreased latency time to tumor development observed in chapter 2
one could hypothesize that the number of mutations increased faster under
CRD conditions compared to LD conditions. This hypothesis can be addressed by
evaluating the mutation frequency in vivo using a plasmid based transgenic mouse
model (Dolle et al., 1996). Besides DNA repair processes, the immune system also
plays an important role in breast tumorigenesis (Standish et al., 2008), and circadian
disturbance has been shown to affect the immune response (Phillips et al., 2015),
40036 Dycke, Kirsten.indd 118 11-04-16 11:02
119
Summary and general discussion
increasing vulnerability for environmental stressors. Furthermore, epigenetic
changes resulting from prolonged exposure to CRD could lead to increased tumor
development, for example by silencing of tumor suppressor genes.
Besides the increased risk of cancer, epidemiological studies have also indicated
an association between social jet-lag, shift work and body weight gain, although
again conflicting data exist (Kubo et al., 2011, Nabe-Nielsen et al., 2011, Roenneberg
et al., 2012, Parsons et al., 2014). Various mouse studies and the findings described
in chapter 2 have shown that circadian disturbance induced by continuous
light, forced activity or a disrupted LD cycle causes an increase in body weight
(Coomans et al., 2013, Oishi, 2009, Salgado-Delgado et al., 2008). In the liver, a key
organ in glucose and lipid metabolism, approximately 10% of the transcriptome is
rhythmically expressed, including metabolic processes (Akhtar et al., 2002, Panda
et al., 2002). Furthermore, under normal conditions both carbohydrate and lipid
metabolism show distinct time-of-day dependent rhythms (Bailey et al., 2014).
We hypothesized that long-term CRD results in more permanent alterations in
biological processes relevant for the observed phenotype.
In chapter 6, using the transcriptomics technique, we found an overall attenuation
of circadian rhythmicity in gene expression 7 days after the last shift. The overall
attenuation of circadian gene expression is similar, although less pronounced,
in comparison with other studies using an omics approach to find the effects of
disrupted sleep (Archer et al., 2014a, Barclay et al., 2012, Moller-Levet et al., 2013).
The main difference between our study and others is the timing when the effects
are observed. Where others studied circadian rhythmicity of gene expression
directly after impingement on the circadian system, we studied the transcriptome
7 days after the last shift of long-term CRD exposure. One could speculate that the
weakened circadian rhythmicity 7 days after the last shift is only a remainder of
more severe disturbance at earlier time points e.g. 1 or 2 days after the shift. Follow-
up studies should further investigate whether the number of genes that show an
attenuation in circadian rhythmicity in gene expression and the magnitude of the
amplitude decrease correlate with the magnitude of CRD and subsequent health
effects.
The largest decrease in amplitude was observed in genes involved in the balance
between glucose and lipid metabolism. Further research to find the exact
40036 Dycke, Kirsten.indd 119 11-04-16 11:02

Chapter 7
120
imbalance in metabolism could provide an interesting target for intervention,
with timed nutritional intake. Previous animal studies have shown that timed
feeding can indeed (partially) rescue tumor and obese phenotypes (Filipski et al.,
2005, Fonken et al., 2010, Oike et al., 2015). In all cases food was restricted to the
active phase and was shown to prevent dim light or jet lag induced body weight
gain and accelerated xenograft tumor growth by chronic jet lag. The finding that
advances and delays in meal-timing affect both circadian rhythms as well as
metabolic parameters underlines the importance and potential of meal-timing
(Yoon et al., 2012).
Evidence based preventive measuresDue to the high incidence of breast cancer and obesity an increased risk resulting
from long-term shift work can have major public health implications. However, shift
work is irreversibly linked to our 24/7 society and consequently evidence based
interventions to prevent CRD and consequent health effects are needed. Currently
advised preventive measures are versatile, including controlled light exposure,
schedule adaptations, and behavioral and pharmaceutical interventions (Neil et
al., 2014) and underlying philosophies and results are contradictive. Interventions
using controlled light exposure are aimed at phase shifting the circadian rhythm
and promoting adaptation to work at night. For example, by exposure to bright
light during the night shift and wearing dark goggles on the commute home in
the morning. This was shown to effectively increase day-time sleep (Boivin et al.,
2012, Sasseville and Hebert, 2010) but also without effects on sleep (Budnick et
al., 1995). In contrast, changing schedules from slow backwards rotating to fast
forward rotation, are based on the principle of limited circadian rhythm adjustment
(Knauth, 1996). Implementation of this fast forward rotation schedule has shown
contradicting effects on sleep and metabolic markers (Boggild and Jeppesen,
2001, Harma et al., 2006, Viitasalo et al., 2008). A major limitation of these studies
is the relatively short follow-up and lack of association with adverse health effects.
It is important to acknowledge that the positive effects of interventions on the
acute shift work related health complaints, such as sleepiness and gastrointestinal
symptoms, do not necessarily represent preventive effects on long-term health
effects, such as cancer and obesity.
The importance of preventive measures is also acknowledged by the Dutch
government, which requested the Dutch Health council to advice on the availability
40036 Dycke, Kirsten.indd 120 11-04-16 11:02

121
Summary and general discussion
of preventive measures (Health Council of the Netherlands, 2015). Based on the
afore mentioned review (Neil et al., 2014) and two additional reviews (Ruggiero
and Redeker, 2014, Liira et al., 2014), it was concluded that there are no evidence
based preventive measures to be recommended for shift workers to suppress
long-term health effects. The council expresses the need for both experimental
and observational studies that link suggested preventive measures with long-term
health effects.
The CRD model in combination with the breast cancer-prone mouse model as
used in chapter 2, are an ideal starting point to identify evidence based preventive
measures that decrease long-term health risk. Firstly, because of the relative short
period needed to evaluate the effect of these interventions on long-term health
effects compared to human studies. And secondly, the ability to continuously
measure activity and core body temperature using a telemetry system, enables
the monitoring of circadian system adaptation. Cross-sectional studies or use of
reporter mice for clock genes can evaluate whether peripheral clock also adapt,
similar to locomotor activity and core body temperature rhythms. (Chaves et al.,
2011). Hereby, providing experimental evidence whether interventions promoting
adaptation or limiting adjustment of the circadian system are best suited to
prevent disease. Furthermore, sleep patterns can be determined using mouse
telemetry data as described previously for human wrist actimetry data (Juda et al.,
2013b). This is important since sleep duration, timing and quality are often used
to describe shift work-related strain (Akerstedt, 2003) or used as post-intervention
measures (Neil et al., 2014, Vetter et al., 2015). Overall, specialized animals can be
used to screen the variety of preventive measures proposed (Neil et al., 2014) and
experimentally proven interventions can be studied in shift workers.
BiomarkersAs described above, many recommendations have been made to alleviate shift
work related health effects. Although animal models can be used to identify
interventions that are likely preventing adverse health effects, there is a need for
scientific evaluation of these preventive measures in shift workers (Richter et al.,
2010). Tools that measure the presence of CRD or evaluate the health risk could aid
the evaluation of new interventions and provide individual, longitudinal exposure
assessment in shift workers. In the context of shift work, two types of biomarkers
can be differentiated: 1) biomarkers that report on the presence and magnitude of
40036 Dycke, Kirsten.indd 121 11-04-16 11:02

Chapter 7
122
circadian disturbance and 2) biomarkers that are associated with disease. The latter
do not report on CRD, but can identify health risk which allows early intervention
before adverse health effects occur.
Mouse models are frequently applied in biomarker discovery research (Kelly-
Spratt et al., 2008). Similarities exist between breast cancer mouse models and
human breast cancer, and these mouse models are therefore useful in biomarker
discovery studies (Klein et al., 2007, Pitteri et al., 2008). In chapter 3 the Li-Fraumeni
mouse model mimicking human breast cancer development was used to provide
proof of principle for the use of transcriptomics in the identification of new blood-
based biomarkers for breast cancer. In this study, we used a genomics approach
on mammary gland tumor tissue compared to find genes overexpressed in tumor
tissue compared to control. Blood detectability was determined based on Gene
Ontology ‘extracellular’ or UniProt ‘secreted’ annotation, or cross-reference with the
Human Plasma Proteome project (Anderson et al., 2004). Additional selection based
on actual expression in human breast tumor compared to normal mammary gland
tissue yielded a set of 16 promising biomarkers for further validation. Importantly,
circadian rhythmicity and food intake responsiveness should be excluded.
After validation, a panel of blood-based biomarkers for breast cancer as identified
by this approach appeared a valuable add-on to currently available early detection
methods for breast cancer screening. Using sensitive detection techniques, blood-
based biomarkers can be detected in small aliquots of blood obtained by a finger
prick (Pennings et al., 2014), which certainly is less invasive than undergoing
mammography. Furthermore, blood-based biomarkers are not hampered by high
density breast tissue, as is the case with mammography. This way, measurement
of biomarkers is minimally invasive with relatively low costs, which makes them
applicable for use in a large scale population screening programs. People at high
risk of breast cancer, including shift workers, could be eligible for a blood test
using such a panel of early detection biomarkers. Besides prevention, the most
efficient way to reduce cancer mortality and morbidity is detection at an early
stage, allowing effective therapeutic treatment. In the future, the breast cancer
biomarker panel can even be combined with early detection markers for other
tumor types in a multiplex assay.
40036 Dycke, Kirsten.indd 122 11-04-16 11:02

123
Summary and general discussion
Upon the proof of principle for a transcriptomics approach in the identification of
blood-detectable biomarkers for breast cancer, as provided in chapter 3, a similar
approach was taken to identify biomarkers for circadian rhythm disturbance in
chapter 4. In the future, these markers are intended for the use in large cohort
studies, such as the Nightingale Study (Pijpe et al., 2014) or the Doetinchem
Cohort Study (Verschuren et al., 2008). To be eligible for use in such settings,
these universal biomarkers should fulfill the following criteria: 1) independent
of rotation schedule; 2) independent of time of day; 3) age-independent and
4) blood-detectable. Recently, transcriptomics- and metabolomics-based time
of day independent biomarkers have been identified using jet lag exposed and
clock mutant mice (Minami et al., 2009, Ueda et al., 2004), allowing detection
of acute and transient effects of CRD, but not chronic effects. In chapter 4 we
identified an optimal CRD classification set based on hepatic gene expression and
a selection of potentially blood detectable biomarkers, both focused on time-of-
day independent detection of chronic CRD.
Although these selected blood-based biomarkers fulfill the criteria for use in large
scale cohort studies, they should be further validated. Importantly, researchers
currently using classical circadian markers need to be convinced of the relevance
of these markers for CRD and their usefulness in relation to adverse health effects.
Longitudinal measurements in both animal and human studies are required
to evaluate the association of these biomarkers with CRD exposure duration.
In addition to the relationship with exposure, the identified markers should be
predictive for CRD associated health risk. Previous studies have shown that
comparable chronic CRD protocols increased negative health effects in mice
(Davidson et al., 2006, Filipski et al., 2004). Validation of the biomarkers in human
studies are required to show whether this association with disease also applies to
humans.
As described above, one could also opt for the measurement of disease associated
biomarkers in a molecular epidemiology-like setting. Especially the combination
of biomarkers for CRD and biomarkers for the adverse health effects could identify
individuals at risk for disease development. Hormonal imbalance is often studied
in large epidemiological settings since these are associated with high incidence
cancer (such as breast cancer), and it is well known that metabolic markers might
serve as important (early) indicators for metabolic disorders (Mester et al., 2010,
40036 Dycke, Kirsten.indd 123 11-04-16 11:02

Chapter 7
124
Stevens, 2005, Ferlay et al., 2015). In relation to shift work, metabolic markers such
as cholesterol and triglycerides have been used to evaluate the advantageous
effect of altered shift schedules (Orth-Gomer, 1982, Viitasalo et al., 2008). It is
known that several disease related biomarkers show a diurnal rhythm in serum
or plasma levels. However, most information on diurnal variation is derived from
these controlled laboratory studies in which factors influencing diurnal variation
(such as food intake and/or sleep/wake cycle) are controlled (for example see
references (Klingman et al., 2011, Li et al., 2013, Jung et al., 2010, James et al., 2007,
Davies et al., 2014, Ang et al., 2012, Dallmann et al., 2012)). With limited control
over environmental factors in large scale cohort studies, it is important to have
insight into the daily variation of these markers in a routine non-fasted molecular
epidemiology-like setting, with no restrictions on sleep or diet.
In chapter 5 we have shown that the majority of the hormonal and metabolic
markers studied showed a daily variation (circadian rhythms and/or time-of-day-
effects that does not fit a cosine curve) in at least one gender. A recent study also
showed that 43% of the protein coding genes show diurnal variation in at least
one organ in mice (Zhang et al., 2014a), this indicates that daily variation in serum
or plasma proteins is likely. In large molecular epidemiological studies, it should
be advised to study diurnal variation of markers of interest and take into account
when present. Preferably, samples should be taken at one time point. Furthermore,
time of sampling and relevant environmental factors, such as food intake, can be
registered.
In shift workers, the measurement of markers with circadian rhythmicity is further
complicated by variation caused by circadian disturbance, altered sleep timing
and food intake and other shift work related factors. Consequently, when variation
within groups is increased due to random sampling or disturbance by work
schedule, larger group sized are required to increase power do detect differences
between groups. To limit the additional variation, samples of biomarkers with
diurnal variation in shift workers should best be taken on the last day shift. This
way, individuals are least disturbed by work schedule and mostly recovered from
previous shifts. Although this depends on chronotype, impingement on sleep
wake rhythms by work hours and social responsibilities is limited. And it take
several days for disturbed circadian rhythms to reentrain. Preferably, finger prick
blood samples, urine samples and saliva samples, when applicable for the marker
40036 Dycke, Kirsten.indd 124 11-04-16 11:02

125
Summary and general discussion
of interest, could be taken at home on free days without the interference of work
schedule.
Modelling shift work in animal studiesIn this thesis, light schedules were altered to cause circadian rhythm disturbance.
We have shown that altered light schedules in a mouse model for human breast
cancer can provide important insights about health effects observed in human
studies. Another important aspect of shiftwork is the activity at times of the day
when we would normally be asleep. In humans, this consequently leads to altered
meal timing and sleep disruption (Grundy et al., 2009, Lennernas et al., 1995). This
can be mimicked by gently handling the animals and exposing them to new
objects in their environment during normal sleeping hours, referred to as Timed
Sleep Restriction (TSR) (Barclay et al., 2012). However, this labor intensive method
is not compatible with long-term studies in large cohorts of animals. Currently,
experiments are ongoing with specially developed ‘shift work cages’ in which
the animals are gently, but continuously forced to be active at predefined time
windows of the day (mimicking day, evening and night shifts). This set-up has been
validated with similar sleep analyses as described in chapter 2. In combination
with the Li-Fraumeni mouse model, the effect of altered sleep-wake cycle resulting
from rotating shift work on breast cancer risk can be addressed.
Although the increased breast cancer risk is probably the most extensively studied
cancer type associated with shift work, other types of cancer, such as colorectal
and prostate cancer have been prospectively been associated with long-term shift
work (Kubo et al., 2006, Schernhammer et al., 2003). Accurate exposure assessment
and control for confounding factors is also limited for these types of cancer. Using
mouse models for colorectal cancer (Karim and Huso, 2013) or prostate cancer
(Ittmann et al., 2013), the effect of chronic CRD, either induced by chronically
alternating light cycles or forced activity, on these cancer types can be studied. In
addition to the cancer phenotype, other disease pathologies such as diabetes type
2 and obesity can be studies in animal models. Similarly to cancer, epidemiological
research for these diseases is confounded by unhealthy habits of shift workers,
which can be controlled for in experimental studies.
40036 Dycke, Kirsten.indd 125 11-04-16 11:02

Chapter 7
126
Future perspectivesThe fact that shift work has become an irreversible part of our 24/7 society
underlines the importance of unravelling which aspects of shift work are relevant
for the observed health effects and how to develop interventions to prevent
adverse effects. To further study the relationship between shift work and adverse
health effects, it is of utmost importance to inventory what shift work entails and
to study the relevance of these individual aspects. This requires the collaboration
of researchers with expertise of the circadian system and animal models and
researchers with the ability to provide detailed information on human shift work
characteristics, to close the gap between animal studies and epidemiological shift
work studies in humans. Detailed knowledge on light exposure, food intake, sleep
timing, duration and quality and other life style or biological characteristics from
shift workers can be used as input for laboratory animal studies. Cross-sectional
studies in shift workers and day workers can identify the aspects that are specific
for individuals working in shifts. Animal experiments allow the comparison of
these individual aspects of shift work or combinations in relation to health effects
in a relatively short time frame.
Alternatively, the findings from these animal studies can provide valuable input
for the set-up of prospective human research. Upon validation, the candidate
biomarkers identified in chapter 4 are interesting alternatives for the classical
markers previously used in human studies. Based on the findings in chapter 6
and those of others (Filipski et al., 2005, Fonken et al., 2010, Oike et al., 2015)
we hypothesized that the timing of food intake is important for both increased
body weight and cancer risk. Therefore, prospective human studies would ideally
register meal-timing in shift workers to associate this with obesity and cancer risk.
Additionally, animal studies are in progress to identify the ideal timing of food
intake in a simulated shift work setting in relation to long term health outcome.
The most promising findings of such experiments can provide valuable input for
food intake interventions to be validated and evaluated in cohort studies with shift
workers.
40036 Dycke, Kirsten.indd 126 11-04-16 11:02

40036 Dycke, Kirsten.indd 127 11-04-16 11:02

40036 Dycke, Kirsten.indd 128 11-04-16 11:02

CHAPTER 8
Nederlandse Samenvatting Curriculum Vitae
List of publications PhD Portfolio
Dankwoord
40036 Dycke, Kirsten.indd 129 11-04-16 11:02

130
Chapter 8
Nederlandse Samenvatting
In vrijwel alle organismen is een biologische klok aanwezig, van fruitvliegjes tot
mensen. De biologische klok wordt gedreven door de master klok in de hersenen,
de supra chiasmatische nucleus. Deze master klok houdt een ritme aan van
ongeveer 24 uur, ook wel circadiaan ritme genoemd, en wordt op tijd gezet door
licht. Lichaamstemperatuur en activiteit zijn voorbeelden van processen die door
deze master klok geregisseerd worden en dus over de dag variëren. Daarnaast zijn
er ook hormonen zoals melatonine en cortisocosteron die een ritme hebben van
ongeveer 24 uur. Moleculair gezien bestaat de klok uit verschillende genen die via
feedback mechanismen over de dag verschillend tot expressie komen.
Het werken in ploegendienst, als consequentie van onze groeiende 24/7 economie,
belast en verstoort het strak gereguleerde biologisch ritme. In epidemiologische
studies is het werken in ploegendienst geassocieerd met vele gezondheidsrisico’s,
zoals kanker, obesitas en cardiovasculaire aandoeningen. Deze observationele
humane studies worden gehinderd door verstorende factoren, moeilijkheden
met het vaststellen van de blootstelling en nemen daarnaast vele jaren in beslag.
Door de sterke overeenkomsten in het carcinogenese en circadiane proces tussen
muis en mens bieden muizen een unieke mogelijkheid om de relatie tussen het
werken in ploegendienst en kanker beter te onderzoeken. Dierstudies worden
niet beïnvloed door verstorende factoren en bieden daardoor de mogelijkheid
om de causale relatie tussen chronische circadiane verstoring en lange termijn
negatieve gezondheidseffecten te bestuderen. Bovendien kunnen de afzonderlijke
aspecten van ploegendienst arbeid onderzocht worden. Door de toepassing van
moleculair biologische technieken kunnen ook de onderliggende mechanismen
en potentiele biomarkers geïdentificeerd worden, welke worden gebruikt voor de
ontwikkeling en studie van preventieve maatregelen.
In hoofdstuk 2 wordt beschreven wat het effect is van chronische jetlag op
borsttumorontwikkeling en lichaamsgewicht, gebruikmakend van een unieke
muizen met aanleg voor borstkanker. Dit muismodel heeft een mutatie in de
borstklier die ook bij vrouwen met borstkanker voorkomt, hierdoor ontwikkelen
deze muizen borsttumoren die vergelijkbaar zijn met humane borsttumoren. Onder
normale licht-donkercondities ontwikkelden deze vrouwelijke, kankergevoelige
muizen een borsttumor na gemiddeld 50.3 weken. Wanneer dit type muis werd
40036 Dycke, Kirsten.indd 130 11-04-16 11:02

131
8
Nederlandse samenvatting
blootgesteld aan een wekelijkse omkering van het licht-donkerritme ontwikkelden
borsttumoren significant eerder, al na gemiddeld 42.6 weken. Bovendien lieten ze
een toename in lichaamsgewicht zien. Voor zover bekend is dit de eerste studie
die experimenteel bewijs levert voor de causale relatie tussen verstoring van het
circadiane ritme en borsttumor ontwikkeling.
Deze bevindingen maken het noodzakelijk om biomarkers te identificeren
die de aanwezigheid van circadiane verstoring evalueren voordat negatieve
gezondheidseffecten zich openbaren. Hiervoor is het waardevol om de
expressie van alle genen te vergelijken tussen een controlegroep en een groep
die is blootgesteld aan circadiane verstoring (CRD). De genen die verschillend
tot expressie komen, kunnen als basis dienen voor de selectie van bruikbare
biomarkers. Het tegelijkertijd in kaart brengen van de expressie van alle genen
noemen we transcriptoomanalyse. In hoofdstuk 3 hebben we een proof-
of-principle gegeven voor het gebruik van transcriptoomanalyse om bij de
muis biomarkers te identificeren die potentieel in bloed te detecteren zijn.
Door de genexpressieprofielen van borsttumoren te vergelijken met controle
borstklierweefsel vonden we genen die differentieel tot expressie kwamen in
borsttumoren. Vervolgens werden kandidaat biomarkers gerangschikt op basis
van potentiële detecteerbaarheid in bloed door vergelijking met literatuur
databases. Uiteindelijk werden de 16 meest humaan relevante kandidaat markers
geselecteerd.
Tot op heden waren er geen in bloed detecteerbare biomarkers voor CRD
beschikbaar die onafhankelijk van het tijdstip van de dag gemeten kunnen
worden. Deze biomarkers zijn nodig om studies naar preventieve maatregelen
te faciliteren. Omdat transcriptoomanalyse bruikbaar bleek om biomarkers te
identificeren die potentieel in bloed detecteerbaar zijn, werd een vergelijkbare
aanpak gebruikt voor het vinden van biomarkers voor CRD. In hoofdstuk 4
onderwierpen we vrouwelijke muizen aan 6 lichtverschuivingen met de klok mee
(CW) of tegen de klok in (CCW). Genexpressie analyse van de lever resulteerde
in een set van 15 genen, waarmee we in staat waren om de aanwezigheid van
circadiane verstoring te voorspellen met een nauwkeurigheid van 90% tot 98%.
Daarnaast hebben we een stapsgewijze aanpak gebruikt om kandidaat markers te
vinden voor niet-invasieve detectie van CRD. Met deze aanpak selecteerden we 9
potentiële, in bloed detecteerbare markers. Eén van deze markers, CD36 was ook
in muizen serum significant verhoogd na CRD.
40036 Dycke, Kirsten.indd 131 11-04-16 11:02
132
Chapter 8
Toekomstig onderzoek naar de negatieve gezondheidseffecten van CRD vereist
ook het meten van ziektegerelateerde biomarkers in grote cohort studies. Het is
voor een aantal van deze markers bekend dat ze een circadiaan ritme vertonen.
Echter is dit vaak onderzocht onder streng gecontroleerde condities, die niet
representatief zijn voor cohort studies. Hoofdstuk 5 geeft een beschrijving van
de dagvariatie van humane hormonale en lipide biomarkers in een setting met
beperkte controle over de condities die de variaties beïnvloeden. We vonden een
dagvariatie in veel markers die groter was dan de interindividuele variatie. Daarom
zou men bij het bestuderen van deze markers de dagvariatie in ogenschouw
moeten nemen. Bovendien is het aannemelijk dat het moment van de dag ook van
belang is voor additionele markers. Dit vereist dat voor het opzetten van nieuwe
studies met een beperkte controle over de meetcondities, vooraf de dagvariatie
van de te meten biomarkers bepaald wordt.
In de studie beschreven in hoofdstuk 6 zijn muizen blootgesteld aan wekelijks
alternerende licht donker cycli. Van deze dieren is het transcriptoom van de lever
geanalyseerd om verstoorde processen te identificeren die ten grondslag liggen
aan het toegenomen lichaamsgewicht, zoals geobserveerd in de dierstudie
beschreven in hoofdstuk 2. Een algehele afname van de circadiane ritmiek in
lever genexpressie werd gevonden, die minder uitgesproken was dan gevonden
in eerdere studies. De voornaamste afname in amplitude werd gezien in genen
betrokken bij de balans tussen vet en glucose metabolisme: Ppard, Pdk4, Slc16a5
and Igfbp-1. Het is dus mogelijk dat verstoorde metabole flexibiliteit ten grondslag
ligt aan het lichaamsgewichttoename fenotype gezien in hoofdstuk 2 en het
overgewicht in ploegendienst medewerkers en daarom dus een preliminair
aanknopingspunt voor interventie is.
De bevindingen beschreven in dit proefschrift tonen aan dat ploegendienstarbeid
negatieve invloed heeft op de gezondheid. Omdat ploegendienstarbeid door de
24/7 economie onlosmakelijk verbonden is aan onze maatschappij, vereist dit
preventieve maatregelen om de gezondheid van ploegendienstmedewerkers te
waarborgen. Op dit moment zijn er geen wetenschappelijk bewezen interventies
beschikbaar, mede doordat langdurig onderzoek nodig is om de effectiviteit
op lange termijn gezondheidseffecten te besturen. De ontwikkeling van deze
interventies kan gefaciliteerd worden door biomarkers die in een vroegtijdig
stadium ziekte of circadiane verstoring kunnen meten. Met behulp van
40036 Dycke, Kirsten.indd 132 11-04-16 11:02

133
8
Nederlandse samenvatting
transcriptoomanalyse is in dit proefschrift de basis gelegd voor de identificatie van
deze biomarkers die onafhankelijk van het tijdstip van de dag gemeten kunnen
worden. Bovendien kunnen diermodellen op korte termijn waardevolle informatie
opleveren over de werkzaamheid van interventies bij mensen. Daarnaast hebben
we laten zien dat het voor ziektegerelateerde biomarkers belangrijk is om rekening
te houden met de dagvariatie bij het opzetten van humane studies. Ten slotte
hebben we metabole flexibiliteit geïdentificeerd als eerste aanknopingspunt voor
de benodigde interventies.
40036 Dycke, Kirsten.indd 133 11-04-16 11:02

134
Chapter 8
Curriculum Vitae
Personal informationName Kirsten Catharina Gabriëlla Van Dycke
Date of birth 14 November 1986
Place of birth Arnhem
Education2007 – 2010 MSc. Biomedical Sciences, Radboud University Nijmegen
2004 – 2007 BSc. Biomedical Sciences, Radboud University Nijmegen
1998 – 2004 VWO, Nature & Health, Roelof van Echten College Hoogeveen
Research Experience2010-2015 PhD project
Department of Genetics, Erasmus MC, in collaboration with
the National Institute for Public Health and the Environment,
Prof. G.T.J. van der Horst and Prof. H. van Steeg
Working around the clock: Adverse effects of circadian
rhythm disturbance
2010 Thesis Consultancy profile
Dutch Health Council, Dr. H. van Dijk
The role of consensus in policy advising by the Health
Council of the Netherlands
2009 Master thesis Health Technology Assessment
McGill University Health Center, Canada, Prof. J. Brophy
Cost-effectiveness of high-sensitivity C-reactive protein
screening followed by targeted statin therapy in
asymptomatic individuals
2008 Master thesis Toxicology
National Institute for Public Health and the Environment, Dr. M.
Luijten
Effects of exposure route on gene expression profiles in the
mouse
40036 Dycke, Kirsten.indd 134 11-04-16 11:02

135
8
Curriculum Vitae
2007 Bachelor thesis Health Technology Assessment
Comprehensive Cancer Centre East (IKO), Dr. M. de Boer
Cost-effectiveness of adjuvant systemic therapy in patients
with early stage breast cancer and micrometastases in the
sentinel lymph node
40036 Dycke, Kirsten.indd 135 11-04-16 11:02

136
Chapter 8
List of publications
van Kerkhof LW*, Van Dycke KC*, Jansen EH, Beekhof PK, Ruskovska T, Velickova
N, Kamcev N, Pennings JL, van Steeg H, Rodenburg W. (2015) Diurnal variation of
hormonal and lipid biomarkers in humans. PLoS One 18;10(8)
*joint first authors
Van Dycke KC, Rodenburg W, van Oostrom CT, van Kerkhof LW, Pennings JL,
Roenneberg T, van Steeg H, van der Horst GT. (2015) Chronically alternating light
cycles increase breast cancer risk in mice. Curr Biol 25(14):1932-7
Van Dycke KC, Pennings JL, van Oostrom CT, van Kerkhof LW, van Steeg H, van
der Horst GT,
Rodenburg W. (2015) Biomarkers for circadian rhythm disruption independent of
time of day. PLoS One 18;10(5)
Van Dycke KC*, Nijman RM*, Wackers PF, Jonker MJ, Rodenburg W, van Oostrom
CT, Salvatori DC, Breit TM, van Steeg H, Luijten M, van der Horst GT. (2014) A day and
night difference in the response of the hepatic transcriptome to cyclophosphamide
treatment. ArchToxicol 89(2):221-31
*joint first authors
Pennings JL*, Van Dycke KC*, van Oostrom CT, Kuiper RV, Rodenburg W, de Vries
A. (2012) Biomarker discovery using a comparative omics approach in a mouse
model developing heterogeneous mammary cancer subtypes. Proteomics
13:2149-57
*joint first authors
de Boer M, Adang EM, Van Dycke KC, van Dijck JA, Borm GF, Seferina SC, van
Deurzen CH, van Diest PJ, Bult P, Donders AR, Tjan-Heijnen VC. (2012) Cost-
effectiveness of adjuvant systemic therapy in low-risk breast cancer patients with
nodal isolated tumor cells or micrometastases. AnnOncol 10: 2585-91
40036 Dycke, Kirsten.indd 136 11-04-16 11:02

137
8
PhD portfolio
PhD portfolio
Name PhD student: Kirsten Van DyckeErasmus MC Department: GeneticsResearch School: MGC graduate school
PhD period: 2010-2014Promotor(s): G.T.J. van der Horst & H. van SteegSupervisor: W. Rodenburg
1. PhD trainingYear Workload
(Hours)
General courses - Laboratory animal science- Literature discussion- Writing in English for Publication
201120112013
1202060
Specific courses (e.g. Research school, Medical Training)- CBS Chronobiology Summerschool 2012- Begin R-cursus- Transgenesis, Gene Targeting and in vivo
Imaging- Analysis of Microarray Gene Expression data
201220112011
2011
404
40
40
40036 Dycke, Kirsten.indd 137 11-04-16 11:02

138
Chapter 8
1. PhD trainingYear Workload
(Hours)
Seminars and workshops- GZB meetings + work discussions- Center for Timing Research meeting 2011- Leopoldina Symposium (poster
presentation)- Center for Timing Research meeting 2012
spring (1-minute presentation)- Center for Timing Research meeting 2012
autumn (oral presentation)- MGC PhD student Workshop Düsseldorf
(poster presentation)- MGC PhD student Workshop Luxembourg
(oral presentation)- PhD days Nederlandse Vereniging voor
Toxicologie (NVT) (poster presentation)- MGC Symposium Rotterdam (oral
presentation)- Center for Timing Research meeting 2014
(oral presentation)
2010-201420112012
2012
2012
2012
2013
2013
2014
2014
2508
20
10
12
40
50
20
16
12
(Inter)national conferences- 12th European Biological Rhythms Society
(ERBS) meeting Oxford- Society for Research on Biological Rhythms
(SRBR) meeting Big Sky, Montana (oral presentation)
2011
2014
40
50
2. TeachingYear Workload
(Hours)Other- Supervising Junior Science Program- Supervising Bachelor thesis Hogeschool
Utrecht
20122012-2013
80100
40036 Dycke, Kirsten.indd 138 11-04-16 11:02

139
8
Dankwoord
Dankwoord
Na bijna zes jaar lang hard werken is mijn proefschrift af! En nu is het tijd om
iedereen die daaraan heeft bijgedragen te bedanken.
Allereerst mijn promotoren. Bert, je introduceerde me in de wereld van de
chronobiologie en op een beperkte afstand was je altijd betrokken bij mijn
project. Dankjewel voor je vertrouwen en geduld dat hiermee gepaard ging. Harry,
dankjewel voor je kritische vragen en soms pittige discussies, die ervoor zorgden
dat ik uiteindelijk in de juiste richting weer verder kon met mijn onderzoek.
Wendy, jouw deur stond altijd open. In eerste instantie om samen tijdschema’s te
tekenen en een weg te vinden in de terminologie van de chronobiologie. Later
hielp je om de focus en planning van alle verschillende studies in het oog te
houden.
Mijn praktische steun en toeverlaat, Conny. Zonder jouw hulp bij het uitvoeren
van alle experimenten, en het draaien van vele qPCRs en ELISAs was dit boekje
niet mogelijk geweest. Zelfs in de nachtelijke uurtjes hielp je mee samples te
verzamelen. Vaak was dit naast nuttig ook erg gezellig!
Linda, ongeveer halverwege mijn promotietraject werd jij toegevoegd aan onze
dag-nachtclub. Naast je kritische vragen over de inhoud van mijn onderzoek,
kletsten we tijdens onze lunchwandelingen over nog veel meer. Naast een fijne
wetenschappelijke sparringspartner, was en ben je altijd een luisterend oor,
dankjewel hiervoor!
Professor Roenneberg, dear Till, thank you for the inspiring and fruitful discussions
we had via skype and during our visit in Priel. Your input is valued a lot.
Lidewij, bedankt voor jouw bijdrage aan mijn onderzoek als stagiaire op het dag-
nachtproject.
Edwin, Liset en Paul, mede met jullie inzet heb ik nog een mooie appendix aan
mijn proefschrift kunnen toevoegen. Mirjam, dankjewel dat je me niet kopje onder
hebt laten gaan in deze transcriptomics zee van data.
40036 Dycke, Kirsten.indd 139 11-04-16 11:02

140
Chapter 8
Mijn kamergenootjes, Sjors, Ilse, Myrtho, Josh, Linda en Charlotte, bedankt voor
jullie gezelligheid. Maar ook voor het meedenken, advies geven en luisterend
oor. En ook alle andere mede-aio’s, Anne, Peter, Sanne, Marja, Mirjam, Joantine en
Sander, samen in hetzelfde schuitje maakt het wel zo gezellig.
Dan zijn er nog vele collega’s om te bedanken. GBO en later GZB, bedankt voor de
ontspanningsmomentjes tijdens de koffie, lunch of een borrel. En ook de collega’s
in Rotterdam, bedankt voor jullie gastvrijheid op de momenten dat ik daar was voor
mijn studies. Speciaal bedankt, Stefanie en Sylvia, jullie hebben ervoor gezorgd dat
het mogelijk was om op twee plekken tegelijk studies uit te voeren.
Naast werk en wetenschap was er ook tijd voor andere zaken. Jochem,
Hedwig, Thijs en Sanne, ontspanning en ontsnapping zijn de code-woorden.
Met zoveel doctors in de club moet het lukken om nog meer snelste
tijden op de klok te zetten. En Hedwig, fijn dat je mijn paranimf wil zijn.
Anne, wat leuk dat we nu wederom collega’s zijn. Jij brengt altijd gezelligheid mee
en ik ben blij dat je mijn paranimf wil zijn.
Nicky, Marja, Marike en Karin, Nijmegen vrienden van het eerste uur. Inmiddels niet
meer wekelijks sporten en samen eten, maar we blijven momentjes zoeken om
gezellig bij te kletsen.
En alle andere vrienden, bedankt voor jullie interesse in mijn onderzoek en
gezelligheid tijdens borrels, etentjes en feestjes.
Arjan, Ria, Alwin en Lysette, jullie kennen me ondertussen al een lange tijd. Wat fijn
dat jullie nu ook deze mijlpaal mee mogen beleven. Lysette, heel erg bedankt voor
de mooie omslag van dit proefschrift, zo is het helemaal af.
Karin, Arnoud, Jeroen, Cora en Arjan, wat fijn dat jullie altijd interesse hadden in
mijn onderzoek.
Karin, zusje, wat fijn dat we zoveel leuke dingen samen kunnen doen. Ook samen
met Alfred. Deze momenten vind ik ontzettend waardevol.
40036 Dycke, Kirsten.indd 140 11-04-16 11:02

141
8
Dankwoord
Lieve Mam en Arie, jullie hebben altijd mijn nieuwsgierigheid en wil om te
ontdekken gestimuleerd. Jullie vertrouwen in mijn kunnen heeft me gesteund en
zeker geholpen om mijn onderzoek tot een goed eind te brengen. Dankjulliewel!
Lieve Stefan, dankjewel voor geduld en vertrouwen de afgelopen jaren. Jij zorgt
ervoor dat ik elke dag het beste uit mezelf kan halen. Bij jou kan ik mezelf zijn en
samen is het leven leuker en gezelliger. Ik hou van jou!
40036 Dycke, Kirsten.indd 141 11-04-16 11:02

142
Chapter 8
ReferencesAKERSTEDT, T. 2003. Shift work and disturbed sleep/wakefulness. Occup Med (Lond), 53, 89-94.
AKERSTEDT, T., KNUTSSON, A., NARUSYTE, J., SVEDBERG, P., KECKLUND, G. & ALEXANDERSON, K. 2015. Night work and breast cancer in women: a Swedish cohort study. BMJ Open, 5, e008127.
AKERSTEDT, T. & WRIGHT, K. P., JR. 2009. Sleep Loss and Fatigue in Shift Work and Shift Work Disorder. Sleep Med Clin, 4, 257-271.
AKHTAR, R. A., REDDY, A. B., MAYWOOD, E. S., CLAYTON, J. D., KING, V. M., SMITH, A. G., GANT, T. W., HASTINGS, M. H. & KYRIACOU, C. P. 2002. Circadian cycling of the mouse liver transcriptome, as revealed by cDNA microarray, is driven by the suprachiasmatic nucleus. Curr Biol, 12, 540-50.
ANDERSON, L. E., MORRIS, J. E., SASSER, L. B. & STEVENS, R. G. 2000. Effect of constant light on DMBA mammary tumorigenesis in rats. Cancer Lett, 148, 121-6.
ANDERSON, N. L., POLANSKI, M., PIEPER, R., GATLIN, T., TIRUMALAI, R. S., CONRADS, T. P., VEENSTRA, T. D., ADKINS, J. N., POUNDS, J. G., FAGAN, R. & LOBLEY, A. 2004. The human plasma proteome: a nonredundant list developed by combination of four separate sources. Mol.Cell Proteomics., 3, 311-326.
ANG, J. E., REVELL, V., MANN, A., MANTELE, S., OTWAY, D. T., JOHNSTON, J. D., THUMSER, A. E., SKENE, D. J. & RAYNAUD, F. 2012. Identification of human plasma metabolites exhibiting time-of-day variation using an untargeted liquid chromatography-mass spectrometry metabolomic approach. Chronobiol Int, 29, 868-81.
ANISIMOV, V. N., BATURIN, D. A., POPOVICH, I. G., ZABEZHINSKI, M. A., MANTON, K. G., SEMENCHENKO, A. V. & YASHIN, A. I. 2004. Effect of exposure to light-at-night on life span and spontaneous carcinogenesis in female CBA mice. Int J Cancer, 111, 475-9.
ARCHER, S. N., LAING, E. E., MOLLER-LEVET, C. S., VAN DER VEEN, D. R., BUCCA, G., LAZAR, A. S., SANTHI, N., SLAK, A., KABILJO, R., VON SCHANTZ, M., SMITH, C. P. & DIJK, D. J. 2014a. Mistimed sleep disrupts circadian regulation of the human transcriptome. Proc Natl Acad Sci U S A.
ARCHER, S. N., LAING, E. E., MOLLER-LEVET, C. S., VAN DER VEEN, D. R., BUCCA, G., LAZAR, A. S., SANTHI, N., SLAK, A., KABILJO, R., VON SCHANTZ, M., SMITH, C. P. & DIJK, D. J. 2014b. Mistimed sleep disrupts circadian regulation of the human transcriptome. Proc Natl Acad Sci U S A, 111, E682-91.
ARNOLD, M. & LANGHANS, W. 2010. Effects of anesthesia and blood sampling techniques on plasma metabolites and corticosterone in the rat. Physiol Behav, 99, 592-8.
ASCHOFF, J., FATRANSKA, M., GIEDKE, H., DOERR, P., STAMM, D. & WISSER, H. 1971. Human circadian rhythms in continuous darkness: entrainment by social cues. Science, 171, 213-5.
AUBERT, C., JANIAUD, P. & LECALVEZ, J. 1980. Effect of pinealectomy and melatonin on mammary tumor growth in Sprague-Dawley rats under different conditions of lighting. J Neural Transm, 47, 121-30.
BAILEY, S. M., UDOH, U. S. & YOUNG, M. E. 2014. Circadian regulation of metabolism. J Endocrinol, 222, R75-96.
BALMAIN, A. & HARRIS, C. C. 2000. Carcinogenesis in mouse and human cells: parallels and paradoxes. Carcinogenesis, 21, 371-7.
BARCLAY, J. L., HUSSE, J., BODE, B., NAUJOKAT, N., MEYER-KOVAC, J., SCHMID, S. M., LEHNERT, H. & OSTER, H. 2012. Circadian desynchrony promotes metabolic disruption in a mouse model of shiftwork. PLoS One, 7, e37150.
BARTON, J., FOLKARD, S., SMITH, L. & POOLE, C. J. 1994. Effects on health of a change from a delaying to an advancing shift system. Occup Environ Med, 51, 749-55.
BELL-PEDERSEN, D., CASSONE, V. M., EARNEST, D. J., GOLDEN, S. S., HARDIN, P. E., THOMAS, T. L. & ZORAN, M. J. 2005. Circadian rhythms from multiple oscillators: lessons from diverse organisms. Nat Rev Genet, 6, 544-56.
BENJAMINI, Y. & HOCHBERG, Y. 1995. Controlling the False Discovery Rate: A Practical and Powerful Approach to Multiple Testing. Journal of the Royal Statistical Society. Series B (Methodological), 57, 289-300.
BERENBLUM, I. (ed.) 1975. Sequential Aspect of Chemical Carcinogenesis: Skin, New York: Plenum Press.
BERSON, D. M., DUNN, F. A. & TAKAO, M. 2002. Phototransduction by retinal ganglion cells that set the circadian clock. Science, 295, 1070-3.
BIANCHINI, F., KAAKS, R. & VAINIO, H. 2002. Overweight, obesity, and cancer risk. Lancet Oncol, 3, 565-74.
BIRKETVEDT, G. S., GELIEBTER, A., KRISTIANSEN, I., FIRGENSCHAU, Y., GOLL, R. & FLORHOLMEN, J. R. 2012. Diurnal secretion of ghrelin, growth hormone, insulin binding proteins, and prolactin in normal weight and overweight subjects with and without the night eating syndrome. Appetite, 59, 688-92.
40036 Dycke, Kirsten.indd 142 11-04-16 11:02

143
8
References
BLASK, D. E., BRAINARD, G. C., DAUCHY, R. T., HANIFIN, J. P., DAVIDSON, L. K., KRAUSE, J. A., SAUER, L. A., RIVERA-BERMUDEZ, M. A., DUBOCOVICH, M. L., JASSER, S. A., LYNCH, D. T., ROLLAG, M. D. & ZALATAN, F. 2005. Melatonin-depleted blood from premenopausal women exposed to light at night stimulates growth of human breast cancer xenografts in nude rats. Cancer Res, 65, 11174-84.
BLASK, D. E., DAUCHY, R. T., DAUCHY, E. M., MAO, L., HILL, S. M., GREENE, M. W., BELANCIO, V. P., SAUER, L. A. & DAVIDSON, L. 2014. Light exposure at night disrupts host/cancer circadian regulatory dynamics: impact on the Warburg effect, lipid signaling and tumor growth prevention. PLoS One, 9, e102776.
BLASK, D. E., DAUCHY, R. T., SAUER, L. A., KRAUSE, J. A. & BRAINARD, G. C. 2003. Growth and fatty acid metabolism of human breast cancer (MCF-7) xenografts in nude rats: impact of constant light-induced nocturnal melatonin suppression. Breast Cancer Res Treat, 79, 313-20.
BLASK, D. E., PELLETIER, D. B., HILL, S. M., LEMUS-WILSON, A., GROSSO, D. S., WILSON, S. T. & WISE, M. E. 1991. Pineal melatonin inhibition of tumor promotion in the N-nitroso-N-methylurea model of mammary carcinogenesis: potential involvement of antiestrogenic mechanisms in vivo. J Cancer Res Clin Oncol, 117, 526-32.
BOGGILD, H. & JEPPESEN, H. J. 2001. Intervention in shift scheduling and changes in biomarkers of heart disease in hospital wards. Scand J Work Environ Health, 27, 87-96.
BÖHM, D., KELLER, K., WEHRWEIN, N., LEBRECHT, A., SCHMIDT, M., KOLBL, H. & GRUS, F. H. 2011. Serum proteome profiling of primary breast cancer indicates a specific biomarker profile. Oncol Rep, 26, 1051-6.
BOIVIN, D. B., BOUDREAU, P., JAMES, F. O. & KIN, N. M. 2012. Photic resetting in night-shift work: impact on nurses’ sleep. Chronobiol Int, 29, 619-28.
BOQUET, A., CRUZ, C., NESTHUS, T., DETWILER, C., KNECHT, W. & HOLCOMB, K. 2004. Clockwise and counterclockwise rotating shifts: effects on temperature and neuroendocrine measures. Aviat Space Environ Med, 75, 898-904.
BORRESEN-DALE, A. L. 2003. TP53 and breast cancer. Hum Mutat, 21, 292-300.
BOVBJERG, D. H. 2003. Circadian disruption and cancer: sleep and immune regulation. Brain Behav Immun, 17 Suppl 1, S48-50.
BOZEK, K., RELOGIO, A., KIELBASA, S. M., HEINE, M., DAME, C., KRAMER, A. & HERZEL, H. 2009. Regulation of clock-controlled genes in mammals. PLoS One, 4, e4882.
BRAMBILLA, D. J., MATSUMOTO, A. M., ARAUJO, A. B. & MCKINLAY, J. B. 2009. The effect of diurnal variation on clinical measurement of serum testosterone and other sex hormone levels in men. J Clin Endocrinol Metab, 94, 907-13.
BREIMAN, L. 2001. Random Forests. Machine Learning, 45, 5-32.
BUDNICK, L. D., LERMAN, S. E. & NICOLICH, M. J. 1995. An evaluation of scheduled bright light and darkness on rotating shiftworkers: trial and limitations. Am J Ind Med, 27, 771-82.
CAHILL, G. M., HURD, M. W. & BATCHELOR, M. M. 1998. Circadian rhythmicity in the locomotor activity of larval zebrafish. Neuroreport, 9, 3445-9.
CAPIZZI, E., GRUPPIONI, E., GRIGIONI, A. D., GABUSI, E., GRASSIGLI, A., GRIGIONI, W. F. & FIORENTINO, M. 2008. Real time RT-PCR approach for the evaluation of ERBB2 overexpression in breast cancer archival samples: a comparative study with FISH, SISH, and immunohistochemistry. Diagn Mol Pathol, 17, 220-6.
CARNEIRO, B. T. & ARAUJO, J. F. 2012. Food entrainment: major and recent findings. Front Behav Neurosci, 6, 83.
CBS. 2010. CBS Statline Beroepsbevolking; regeling werktijden [Online]. Available: http://statline.cbs.nl/StatWeb/publication/?DM=SLNL&PA=71959ned&D1=2-6&D2=0&D3=a&D4=a&HDR=T&STB=G1,G2,G3&VW=T.
CHAVES, I., NIJMAN, R. M., BIERNAT, M. A., BAJEK, M. I., BRAND, K., DA SILVA, A. C., SAITO, S., YAGITA, K., EKER, A. P. & VAN DER HORST, G. T. 2011. The Potorous CPD photolyase rescues a cryptochrome-deficient mammalian circadian clock. PLoS One, 6, e23447.
CHUA, E. C., SHUI, G., LEE, I. T., LAU, P., TAN, L. C., YEO, S. C., LAM, B. D., BULCHAND, S., SUMMERS, S. A., PUVANENDRAN, K., ROZEN, S. G., WENK, M. R. & GOOLEY, J. J. 2013. Extensive diversity in circadian regulation of plasma lipids and evidence for different circadian metabolic phenotypes in humans. Proc Natl Acad Sci U S A, 110, 14468-73.
CLIMENT, J., PEREZ-LOSADA, J., QUIGLEY, D. A., KIM, I. J., DELROSARIO, R., JEN, K. Y., BOSCH, A., LLUCH, A., MAO, J. H. & BALMAIN, A. 2010. Deletion of the PER3 gene on chromosome 1p36 in recurrent ER-positive breast cancer. J Clin Oncol, 28, 3770-8.
COLES, C., CONDIE, A., CHETTY, U., STEEL, C. M., EVANS, H. J. & PROSSER, J. 1992. p53 mutations in breast cancer. Cancer Res, 52, 5291-8.
40036 Dycke, Kirsten.indd 143 11-04-16 11:02

144
Chapter 8
COOMANS, C. P., VAN DEN BERG, S. A., HOUBEN, T., VAN KLINKEN, J. B., VAN DEN BERG, R., PRONK, A. C., HAVEKES, L. M., ROMIJN, J. A., VAN DIJK, K. W., BIERMASZ, N. R. & MEIJER, J. H. 2013. Detrimental effects of constant light exposure and high-fat diet on circadian energy metabolism and insulin sensitivity. FASEB J, 27, 1721-32.
COS, S., MEDIAVILLA, D., MARTINEZ-CAMPA, C., GONZALEZ, A., ALONSO-GONZALEZ, C. & SANCHEZ-BARCELO, E. J. 2006. Exposure to light-at-night increases the growth of DMBA-induced mammary adenocarcinomas in rats. Cancer Lett, 235, 266-71.
CULHANE, A. C., SCHWARZL, T., SULTANA, R., PICARD, K. C., PICARD, S. C., LU, T. H., FRANKLIN, K. R., FRENCH, S. J., PAPENHAUSEN, G., CORRELL, M. & QUACKENBUSH, J. 2010. GeneSigDB--a curated database of gene expression signatures. Nucleic Acids Res, 38, D716-25.
CZEISLER, C. A., DUFFY, J. F., SHANAHAN, T. L., BROWN, E. N., MITCHELL, J. F., RIMMER, D. W., RONDA, J. M., SILVA, E. J., ALLAN, J. S., EMENS, J. S., DIJK, D. J. & KRONAUER, R. E. 1999. Stability, precision, and near-24-hour period of the human circadian pacemaker. Science, 284, 2177-81.
DAAN, S., MERROW, M. & ROENNEBERG, T. 2002. External time--internal time. J Biol Rhythms, 17, 107-9.
DALLMANN, R., VIOLA, A. U., TAROKH, L., CAJOCHEN, C. & BROWN, S. A. 2012. The human circadian metabolome. Proc Natl Acad Sci U S A, 109, 2625-9.
DANAEI, G., FINUCANE, M. M., LU, Y., SINGH, G. M., COWAN, M. J., PACIOREK, C. J., LIN, J. K., FARZADFAR, F., KHANG, Y. H., STEVENS, G. A., RAO, M., ALI, M. K., RILEY, L. M., ROBINSON, C. A. & EZZATI, M. 2011. National, regional, and global trends in fasting plasma glucose and diabetes prevalence since 1980: systematic analysis of health examination surveys and epidemiological studies with 370 country-years and 2.7 million participants. Lancet, 378, 31-40.
DAVIDSON, A. J., SELLIX, M. T., DANIEL, J., YAMAZAKI, S., MENAKER, M. & BLOCK, G. D. 2006. Chronic jet-lag increases mortality in aged mice. Curr Biol, 16, R914-6.
DAVIES, S. K., ANG, J. E., REVELL, V. L., HOLMES, B., MANN, A., ROBERTSON, F. P., CUI, N., MIDDLETON, B., ACKERMANN, K., KAYSER, M., THUMSER, A. E., RAYNAUD, F. I. & SKENE, D. J. 2014. Effect of sleep deprivation on the human metabolome. Proc Natl Acad Sci U S A, 111, 10761-6.
DAVIS, S. & MIRICK, D. K. 2006. Circadian disruption, shift work and the risk of cancer: a summary of the evidence and studies in Seattle. Cancer Causes Control, 17, 539-45.
DEFILIPPIS, R. A., CHANG, H., DUMONT, N., RABBAN, J. T., CHEN, Y. Y., FONTENAY, G. V., BERMAN, H. K., GAUTHIER, M. L., ZHAO, J., HU, D., MARX, J. J., TJOE, J. A., ZIV, E., FEBBRAIO, M., KERLIKOWSKE, K., PARVIN, B. & TLSTY, T. D. 2012. CD36 repression activates a multicellular stromal program shared by high mammographic density and tumor tissues. Cancer Discov, 2, 826-39.
DEGENHARDT, T., SARAMAKI, A., MALINEN, M., RIECK, M., VAISANEN, S., HUOTARI, A., HERZIG, K. H., MULLER, R. & CARLBERG, C. 2007. Three members of the human pyruvate dehydrogenase kinase gene family are direct targets of the peroxisome proliferator-activated receptor beta/delta. J Mol Biol, 372, 341-55.
DERKSEN, P. W., BRAUMULLER, T. M., VAN DER BURG, E., HORNSVELD, M., MESMAN, E., WESSELING, J., KRIMPENFORT, P. & JONKERS, J. 2011. Mammary-specific inactivation of E-cadherin and p53 impairs functional gland development and leads to pleomorphic invasive lobular carcinoma in mice. Dis Model Mech, 4, 347-58.
DIBNER, C., SCHIBLER, U. & ALBRECHT, U. 2010. The mammalian circadian timing system: organization and coordination of central and peripheral clocks. Annu Rev Physiol, 72, 517-49.
DIVER, M. J., IMTIAZ, K. E., AHMAD, A. M., VORA, J. P. & FRASER, W. D. 2003. Diurnal rhythms of serum total, free and bioavailable testosterone and of SHBG in middle-aged men compared with those in young men. Clin Endocrinol (Oxf ), 58, 710-7.
DOLLE, M. E., MARTUS, H. J., GOSSEN, J. A., BOERRIGTER, M. E. & VIJG, J. 1996. Evaluation of a plasmid-based transgenic mouse model for detecting in vivo mutations. Mutagenesis, 11, 111-8.
DUFFY, J. F., KRONAUER, R. E. & CZEISLER, C. A. 1996. Phase-shifting human circadian rhythms: influence of sleep timing, social contact and light exposure. J Physiol, 495 ( Pt 1), 289-97.
ECKEL-MAHAN, K. L., PATEL, V. R., DE MATEO, S., OROZCO-SOLIS, R., CEGLIA, N. J., SAHAR, S., DILAG-PENILLA, S. A., DYAR, K. A., BALDI, P. & SASSONE-CORSI, P. 2013. Reprogramming of the circadian clock by nutritional challenge. Cell, 155, 1464-78.
EDRN. Available: http://edrn.nci.nih.gov/.
EIN-DOR, L., KELA, I., GETZ, G., GIVOL, D. & DOMANY, E. 2005. Outcome signature genes in breast cancer: is there a unique set? Bioinformatics, 21, 171-8.
40036 Dycke, Kirsten.indd 144 11-04-16 11:02
145
8
References
EMENS, J. S., YUHAS, K., ROUGH, J., KOCHAR, N., PETERS, D. & LEWY, A. J. 2009. Phase angle of entrainment in morning- and evening-types under naturalistic conditions. Chronobiol Int, 26, 474-93.
EUROFOUND 2012. Fifth European Working Conditions Survey.
FARRAH, T., DEUTSCH, E. W., OMENN, G. S., CAMPBELL, D. S., SUN, Z., BLETZ, J. A., MALLICK, P., KATZ, J. E., MALMSTROM, J., OSSOLA, R., WATTS, J. D., LIN, B., ZHANG, H., MORITZ, R. L. & AEBERSOLD, R. 2011. A high-confidence human plasma proteome reference set with estimated concentrations in PeptideAtlas. Mol Cell Proteomics, 10, M110 006353.
FEBBRAIO, M., HAJJAR, D. P. & SILVERSTEIN, R. L. 2001. CD36: a class B scavenger receptor involved in angiogenesis, atherosclerosis, inflammation, and lipid metabolism. J Clin Invest, 108, 785-91.
FERLAY, J., SHIN, H. R., BRAY, F., FORMAN, D., MATHERS, C. & PARKIN, D. M. 2010. Estimates of worldwide burden of cancer in 2008: GLOBOCAN 2008. Int J Cancer, 127, 2893-917.
FERLAY, J., SOERJOMATARAM, I., DIKSHIT, R., ESER, S., MATHERS, C., REBELO, M., PARKIN, D. M., FORMAN, D. & BRAY, F. 2015. Cancer incidence and mortality worldwide: sources, methods and major patterns in GLOBOCAN 2012. Int J Cancer, 136, E359-86.
FILIPSKI, E., DELAUNAY, F., KING, V. M., WU, M. W., CLAUSTRAT, B., GRECHEZ-CASSIAU, A., GUETTIER, C., HASTINGS, M. H. & FRANCIS, L. 2004. Effects of chronic jet lag on tumor progression in mice. Cancer Res, 64, 7879-85.
FILIPSKI, E., INNOMINATO, P. F., WU, M., LI, X. M., IACOBELLI, S., XIAN, L. J. & LEVI, F. 2005. Effects of light and food schedules on liver and tumor molecular clocks in mice. J Natl Cancer Inst, 97, 507-17.
FILIPSKI, E., SUBRAMANIAN, P., CARRIERE, J., GUETTIER, C., BARBASON, H. & LEVI, F. 2009. Circadian disruption accelerates liver carcinogenesis in mice. Mutat Res, 680, 95-105.
FISHER, S. P., GODINHO, S. I., POTHECARY, C. A., HANKINS, M. W., FOSTER, R. G. & PEIRSON, S. N. 2012. Rapid assessment of sleep-wake behavior in mice. J Biol Rhythms, 27, 48-58.
FOLKMAN, J. 1985. Tumor angiogenesis. Adv Cancer Res, 43, 175-203.
FONKEN, L. K., WORKMAN, J. L., WALTON, J. C., WEIL, Z. M., MORRIS, J. S., HAIM, A. & NELSON, R. J. 2010. Light at night increases body mass by shifting the time of food intake. Proc Natl Acad Sci U S A, 107, 18664-9.
FRITSCHI, L., ERREN, T. C., GLASS, D. C., GIRSCHIK, J., THOMSON, A. K., SAUNDERS, C., BOYLE, T., EL-ZAEMEY, S., ROGERS, P., PETERS, S., SLEVIN, T., D’ORSOGNA, A., DE VOCHT, F., VERMEULEN, R. & HEYWORTH, J. S. 2013. The association between different night shiftwork factors and breast cancer: a case-control study. Br J Cancer, 109, 2472-80.
FRITSCHI, L., GLASS, D. C., HEYWORTH, J. S., ARONSON, K., GIRSCHIK, J., BOYLE, T., GRUNDY, A. & ERREN, T. C. 2011. Hypotheses for mechanisms linking shiftwork and cancer. Med Hypotheses, 77, 430-6.
FU, L., PELICANO, H., LIU, J., HUANG, P. & LEE, C. 2002. The circadian gene Period2 plays an important role in tumor suppression and DNA damage response in vivo. Cell, 111, 41-50.
FUJIMOTO, V. Y., CLIFTON, D. K., COHEN, N. L. & SOULES, M. R. 1990. Variability of serum prolactin and progesterone levels in normal women: the relevance of single hormone measurements in the clinical setting. Obstet Gynecol, 76, 71-8.
FUJINO, Y., ISO, H., TAMAKOSHI, A., INABA, Y., KOIZUMI, A., KUBO, T., YOSHIMURA, T. & JAPANESE COLLABORATIVE COHORT STUDY, G. 2006. A prospective cohort study of shift work and risk of ischemic heart disease in Japanese male workers. Am J Epidemiol, 164, 128-35.
GAMBLE, K. L., BERRY, R., FRANK, S. J. & YOUNG, M. E. 2014. Circadian clock control of endocrine factors. Nat Rev Endocrinol, 10, 466-75.
GARLAND, C. F. & GARLAND, F. C. 2006. Do sunlight and vitamin D reduce the likelihood of colon cancer? Int J Epidemiol, 35, 217-20.
GIANNI, L., DAFNI, U., GELBER, R. D., AZAMBUJA, E., MUEHLBAUER, S., GOLDHIRSCH, A., UNTCH, M., SMITH, I., BASELGA, J., JACKISCH, C., CAMERON, D., MANO, M., PEDRINI, J. L., VERONESI, A., MENDIOLA, C., PLUZANSKA, A., SEMIGLAZOV, V., VRDOLJAK, E., ECKART, M. J., SHEN, Z., SKIADOPOULOS, G., PROCTER, M., PRITCHARD, K. I., PICCART-GEBHART, M. J. & BELL, R. 2011. Treatment with trastuzumab for 1 year after adjuvant chemotherapy in patients with HER2-positive early breast cancer: a 4-year follow-up of a randomised controlled trial. Lancet Oncol, 12, 236-44.
GOOLEY, J. J. & CHUA, E. C. 2014. Diurnal regulation of lipid metabolism and applications of circadian lipidomics. J Genet Genomics, 41, 231-50.
GRUNDY, A., SANCHEZ, M., RICHARDSON, H., TRANMER, J., BORUGIAN, M., GRAHAM, C. H. & ARONSON, K. J. 2009. Light intensity exposure, sleep duration, physical activity, and biomarkers of melatonin among rotating shift nurses. Chronobiol Int, 26, 1443-61.
40036 Dycke, Kirsten.indd 145 11-04-16 11:02

146
Chapter 8
GU, F., HAN, J., LADEN, F., PAN, A., CAPORASO, N. E., STAMPFER, M. J., KAWACHI, I., REXRODE, K. M., WILLETT, W. C., HANKINSON, S. E., SPEIZER, F. E. & SCHERNHAMMER, E. S. 2015. Total and cause-specific mortality of U.S. nurses working rotating night shifts. Am J Prev Med, 48, 241-52.
GUTMAN, H., POLLOCK, R. E., JANJAN, N. A. & JOHNSTON, D. A. 1995. Biologic distinctions and therapeutic implications of sarcomatoid metaplasia of epithelial carcinoma of the breast. J Am Coll Surg, 180, 193-9.
HADJI, P., KAUKA, A., ZILLER, M., BIRKHOLZ, K., BAIER, M., MUTH, M. & KANN, P. 2014. Effect of adjuvant endocrine therapy on hormonal levels in premenopausal women with breast cancer: the ProBONE II study. Breast Cancer Res Treat, 144, 343-51.
HAMILTON, T. 1969. Influence of environmental light and melatonin upon mammary tumour induction. Br J Surg, 56, 764-6.
HANDBERG, A., LEVIN, K., HOJLUND, K. & BECK-NIELSEN, H. 2006. Identification of the oxidized low-density lipoprotein scavenger receptor CD36 in plasma: a novel marker of insulin resistance. Circulation, 114, 1169-76.
HARDELAND, R., PANDI-PERUMAL, S. R. & CARDINALI, D. P. 2006. Melatonin. Int J Biochem Cell Biol, 38, 313-6.
HARMA, M., TARJA, H., IRJA, K., MIKAEL, S., JUSSI, V., ANNE, B. & PERTTI, M. 2006. A controlled intervention study on the effects of a very rapidly forward rotating shift system on sleep-wakefulness and well-being among young and elderly shift workers. Int J Psychophysiol, 59, 70-9.
HASTINGS, M. H., DUFFIELD, G. E., SMITH, E. J., MAYWOOD, E. S. & EBLING, F. J. 1998. Entrainment of the circadian system of mammals by nonphotic cues. Chronobiol Int, 15, 425-45.
HE, C., ANAND, S. T., EBELL, M. H., VENA, J. E. & ROBB, S. W. 2014. Circadian disrupting exposures and breast cancer risk: a meta-analysis. Int Arch Occup Environ Health.
HEALTH COUNCIL OF THE NETHERLANDS. Shift work and health risks: possibilities for prevention. The Hague: Health Council of the Netherlands, 2015, publication no. 2015/25
HIRSCHFELD, U., MORENO-REYES, R., AKSEKI, E., L’HERMITE-BALERIAUX, M., LEPROULT, R., COPINSCHI, G. & VAN CAUTER, E. 1996. Progressive elevation of plasma thyrotropin during adaptation to simulated jet lag: effects of treatment with bright light or zolpidem. J Clin Endocrinol Metab, 81, 3270-7.
HUANG, D. W., SHERMAN, B. T. & LEMPICKI, R. A. 2009. Systematic and integrative analysis of large gene lists using DAVID bioinformatics resources. Nat. Protoc., 4, 44-57.
HUGHES, M. E., HOGENESCH, J. B. & KORNACKER, K. 2010. JTK_CYCLE: an efficient nonparametric algorithm for detecting rhythmic components in genome-scale data sets. J Biol Rhythms, 25, 372-80.
HURD, M. W., DEBRUYNE, J., STRAUME, M. & CAHILL, G. M. 1998. Circadian rhythms of locomotor activity in zebrafish. Physiol Behav, 65, 465-72.
IARC 2010. Monograph Volume 98: Painting, firefighting, and shift work / IARC Working Group on the Evaluation of Carcinogenic Risks to Humans.
IJAZ, S., VERBEEK, J., SEIDLER, A., LINDBOHM, M. L., OJAJARVI, A., ORSINI, N., COSTA, G. & NEUVONEN, K. 2013. Night-shift work and breast cancer--a systematic review and meta-analysis. Scand J Work Environ Health, 39, 431-47.
ITOH, H., WENG, Z., SAITO, H., OGAWA, Y., NAKAYAMA, K., HASEGAWA-OHIRA, M., MORIMOTO, K., MAKI, S. & TAKAHASHI, M. 2011. Association between night-shift work and serum 25-hydroxyvitamin D levels in Japanese male indoor workers: a cross-sectional study. Ind Health, 49, 658-62.
ITTMANN, M., HUANG, J., RADAELLI, E., MARTIN, P., SIGNORETTI, S., SULLIVAN, R., SIMONS, B. W., WARD, J. M., ROBINSON, B. D., CHU, G. C., LODA, M., THOMAS, G., BOROWSKY, A. & CARDIFF, R. D. 2013. Animal models of human prostate cancer: the consensus report of the New York meeting of the Mouse Models of Human Cancers Consortium Prostate Pathology Committee. Cancer Res, 73, 2718-36.
IWAMOTO, A., KAWAI, M., FURUSE, M. & YASUO, S. 2014. Effects of chronic jet lag on the central and peripheral circadian clocks in CBA/N mice. Chronobiol Int, 31, 189-98.
JAMES, F. O., BOIVIN, D. B., CHARBONNEAU, S., BELANGER, V. & CERMAKIAN, N. 2007. Expression of clock genes in human peripheral blood mononuclear cells throughout the sleep/wake and circadian cycles. Chronobiol Int, 24, 1009-34.
JEOUNG, N. H. & HARRIS, R. A. 2010. Role of pyruvate dehydrogenase kinase 4 in regulation of blood glucose levels. Korean Diabetes J, 34, 274-83.
JIA, Y., LU, Y., WU, K., LIN, Q., SHEN, W., ZHU, M., HUANG, S. & CHEN, J. 2013. Does night work increase the risk of breast cancer? A systematic review and meta-analysis of epidemiological studies. Cancer Epidemiol, 37, 197-206.
40036 Dycke, Kirsten.indd 146 11-04-16 11:02

147
8
References
JIANG, J., BOYLE, L. J., MIKUS, C. R., OBERLIN, D. J., FLETCHER, J. A., THYFAULT, J. P. & HINTON, P. S. 2014. The effects of improved metabolic risk factors on bone turnover markers after 12 weeks of simvastatin treatment with or without exercise. Metabolism, 63, 1398-408.
JUDA, M., VETTER, C. & ROENNEBERG, T. 2013a. Chronotype modulates sleep duration, sleep quality, and social jet lag in shift-workers. J Biol Rhythms, 28, 141-51.
JUDA, M., VETTER, C. & ROENNEBERG, T. 2013b. The Munich ChronoType Questionnaire for Shift-Workers (MCTQShift). J Biol Rhythms, 28, 130-40.
JUNG, C. M., KHALSA, S. B., SCHEER, F. A., CAJOCHEN, C., LOCKLEY, S. W., CZEISLER, C. A. & WRIGHT, K. P., JR. 2010. Acute effects of bright light exposure on cortisol levels. J Biol Rhythms, 25, 208-16.
KAMDAR, B. B., TERGAS, A. I., MATEEN, F. J., BHAYANI, N. H. & OH, J. 2013. Night-shift work and risk of breast cancer: a systematic review and meta-analysis. Breast Cancer Res Treat, 138, 291-301.
KARIM, B. O. & HUSO, D. L. 2013. Mouse models for colorectal cancer. Am J Cancer Res, 3, 240-50.
KATZ, L. E., DELEON, D. D., ZHAO, H. & JAWAD, A. F. 2002. Free and total insulin-like growth factor (IGF)-I levels decline during fasting: relationships with insulin and IGF-binding protein-1. J Clin Endocrinol Metab, 87, 2978-83.
KELLY-SPRATT, K. S., KASARDA, A. E., IGRA, M. & KEMP, C. J. 2008. A mouse model repository for cancer biomarker discovery. J Proteome Res, 7, 3613-8.
KHAETSKI, I. K. 1965. Effect of hypothalamo-pituitary lesions induced by constant illumination on development of induced mammary tumors in rats. Vopr Exp Oncol, 1, 87–93.
KIESSLING, S., EICHELE, G. & OSTER, H. 2010. Adrenal glucocorticoids have a key role in circadian resynchronization in a mouse model of jet lag. J Clin Invest, 120, 2600-9.
KIMLIN, M. G. & TENKATE, T. D. 2007. Occupational exposure to ultraviolet radiation: the duality dilemma. Rev Environ Health, 22, 1-37.
KLEIN, A., WESSEL, R., GRAESSMANN, M., JURGENS, M., PETERSEN, I., SCHMUTZLER, R., NIEDERACHER, D., ARNOLD, N., MEINDL, A., SCHERNECK, S., SEITZ, S. & GRAESSMANN, A. 2007. Comparison of gene expression data from human and mouse breast cancers: identification of a conserved breast tumor gene set. Int J Cancer, 121, 683-8.
KLINGMAN, K. M., MARSH, E. E., KLERMAN, E. B., ANDERSON, E. J. & HALL, J. E. 2011. Absence of circadian rhythms of gonadotropin secretion in women. J Clin Endocrinol Metab, 96, 1456-61.
KNAUTH, P. 1996. Designing better shift systems. Appl Ergon, 27, 39-44.
KNUTSSON, A. & BOGGILD, H. 2010. Gastrointestinal disorders among shift workers. Scand J Work Environ Health, 36, 85-95.
KO, C. H. & TAKAHASHI, J. S. 2006. Molecular components of the mammalian circadian clock. Hum Mol Genet, 15 Spec No 2, R271-7.
KOTHARI, L. S., SHAH, P. N. & MHATRE, M. C. 1984. Pineal ablation in varying photoperiods and the incidence of 9,10-dimethyl-1,2-benzanthracene induced mammary cancer in rats. Cancer Lett, 22, 99-102.
KRETSCHMER, C., STERNER-KOCK, A., SIEDENTOPF, F., SCHOENEGG, W., SCHLAG, P. M. & KEMMNER, W. 2011. Identification of early molecular markers for breast cancer. Mol Cancer, 10, 15.
KUBO, T., OYAMA, I., NAKAMURA, T., SHIRANE, K., OTSUKA, H., KUNIMOTO, M., KADOWAKI, K., MARUYAMA, T., OTOMO, H., FUJINO, Y., MATSUMOTO, T. & MATSUDA, S. 2011. Retrospective cohort study of the risk of obesity among shift workers: findings from the Industry-based Shift Workers’ Health study, Japan. Occup Environ Med, 68, 327-31.
KUBO, T., OZASA, K., MIKAMI, K., WAKAI, K., FUJINO, Y., WATANABE, Y., MIKI, T., NAKAO, M., HAYASHI, K., SUZUKI, K., MORI, M., WASHIO, M., SAKAUCHI, F., ITO, Y., YOSHIMURA, T. & TAMAKOSHI, A. 2006. Prospective cohort study of the risk of prostate cancer among rotating-shift workers: findings from the Japan collaborative cohort study. Am J Epidemiol, 164, 549-55.
KUSANAGI, H., HIDA, A., SATOH, K., ECHIZENYA, M., SHIMIZU, T., PENDERGAST, J. S., YAMAZAKI, S. & MISHIMA, K. 2008. Expression profiles of 10 circadian clock genes in human peripheral blood mononuclear cells. Neurosci Res, 61, 136-42.
LACK, L., BAILEY, M., LOVATO, N. & WRIGHT, H. 2009. Chronotype differences in circadian rhythms of temperature, melatonin, and sleepiness as measured in a modified constant routine protocol. Nat Sci Sleep, 1, 1-8.
LAPIN, V. 1978. Effects of reserpine on the incidence of 9,10-dimethyl-1,2-benzanthracene-induced tumors in pinealectomised and thymectomised rats. Oncology, 35, 132-5.
40036 Dycke, Kirsten.indd 147 11-04-16 11:02

148
Chapter 8
LAUSS, M., KRIEGNER, A., VIERLINGER, K., VISNE, I., YILDIZ, A., DILAVEROGLU, E. & NOEHAMMER, C. 2008. Consensus genes of the literature to predict breast cancer recurrence. Breast Cancer Res Treat, 110, 235-44.
LEE, C., ETCHEGARAY, J. P., CAGAMPANG, F. R., LOUDON, A. S. & REPPERT, S. M. 2001. Posttranslational mechanisms regulate the mammalian circadian clock. Cell, 107, 855-67.
LENGACHER, S., NEHIRI-SITAYEB, T., STEINER, N., CARNEIRO, L., FAVROD, C., PREITNER, F., THORENS, B., STEHLE, J. C., DIX, L., PRALONG, F., MAGISTRETTI, P. J. & PELLERIN, L. 2013. Resistance to diet-induced obesity and associated metabolic perturbations in haploinsufficient monocarboxylate transporter 1 mice. PLoS One, 8, e82505.
LENNERNAS, M., HAMBRAEUS, L. & AKERSTEDT, T. 1995. Shift related dietary intake in day and shift workers. Appetite, 25, 253-65.
LI, S. X., LIU, L. J., XU, L. Z., GAO, L., WANG, X. F., ZHANG, J. T. & LU, L. 2013. Diurnal alterations in circadian genes and peptides in major depressive disorder before and after escitalopram treatment. Psychoneuroendocrinology, 38, 2789-99.
LIBERZON, A., SUBRAMANIAN, A., PINCHBACK, R., THORVALDSDOTTIR, H., TAMAYO, P. & MESIROV, J. P. 2011. Molecular signatures database (MSigDB) 3.0. Bioinformatics, 27, 1739-40.
LIIRA, J., VERBEEK, J. H., COSTA, G., DRISCOLL, T. R., SALLINEN, M., ISOTALO, L. K. & RUOTSALAINEN, J. H. 2014. Pharmacological interventions for sleepiness and sleep disturbances caused by shift work. Cochrane Database Syst Rev, 8, CD009776.
LOWREY, P. L. & TAKAHASHI, J. S. 2011. Genetics of circadian rhythms in Mammalian model organisms. Adv Genet, 74, 175-230.
LUDWIG, J. A. & WEINSTEIN, J. N. 2005. Biomarkers in cancer staging, prognosis and treatment selection. Nat Rev Cancer, 5, 845-56.
MAZZOCCOLI, G., MUSCARELLA, L. A., FAZIO, V. M., PIEPOLI, A., PAZIENZA, V., DAGOSTINO, M. P., GIULIANI, F., POLYAKOVA, V. O. & KVETNOY, I. 2011. Antiphase signalling in the neuroendocrine-immune system in healthy humans. Biomed Pharmacother, 65, 275-9.
MCGOWAN, N. M. & COOGAN, A. N. 2013. Circadian and behavioural responses to shift work-like schedules of light/dark in the mouse. J Mol Psychiatry, 1.
MEGDAL, S. P., KROENKE, C. H., LADEN, F., PUKKALA, E. & SCHERNHAMMER, E. S. 2005. Night work and breast cancer risk: a systematic review and meta-analysis. Eur J Cancer, 41, 2023-32.
MESTER, B., BEHRENS, T., DREGER, S., HENSE, S. & FRITSCHI, L. 2010. Occupational causes of testicular cancer in adults. Int J Occup Environ Med, 1, 160-70.
MHATRE, M. C., SHAH, P. N. & JUNEJA, H. S. 1984. Effect of varying photoperiods on mammary morphology, DNA synthesis, and hormone profile in female rats. J Natl Cancer Inst, 72, 1411-6.
MIIDA, T., NAKAMURA, Y., MEZAKI, T., HANYU, O., MARUYAMA, S., HORIKAWA, Y., IZAWA, S., YAMADA, Y., MATSUI, H. & OKADA, M. 2002. LDL-cholesterol and HDL-cholesterol concentrations decrease during the day. Ann Clin Biochem, 39, 241-9.
MILLER, B. H., MCDEARMON, E. L., PANDA, S., HAYES, K. R., ZHANG, J., ANDREWS, J. L., ANTOCH, M. P., WALKER, J. R., ESSER, K. A., HOGENESCH, J. B. & TAKAHASHI, J. S. 2007. Circadian and CLOCK-controlled regulation of the mouse transcriptome and cell proliferation. Proc Natl Acad Sci U S A, 104, 3342-7.
MINAMI, Y., KASUKAWA, T., KAKAZU, Y., IIGO, M., SUGIMOTO, M., IKEDA, S., YASUI, A., VAN DER HORST, G. T., SOGA, T. & UEDA, H. R. 2009. Measurement of internal body time by blood metabolomics. Proc Natl Acad Sci U S A, 106, 9890-5.
MIRICK, D. K. & DAVIS, S. 2008. Melatonin as a biomarker of circadian dysregulation. Cancer Epidemiol Biomarkers Prev, 17, 3306-13.
MIYATAKE, A., MORIMOTO, Y., OISHI, T., HANASAKI, N., SUGITA, Y., IIJIMA, S., TESHIMA, Y., HISHIKAWA, Y. & YAMAMURA, Y. 1980. Circadian rhythm of serum testosterone and its relation to sleep: comparison with the variation in serum luteinizing hormone, prolactin, and cortisol in normal men. J Clin Endocrinol Metab, 51, 1365-71.
MOHAWK, J. A., GREEN, C. B. & TAKAHASHI, J. S. 2012. Central and peripheral circadian clocks in mammals. Annu Rev Neurosci, 35, 445-62.
MOLINA, R., AUGE, J. M., ESCUDERO, J. M., FILELLA, X., ZANON, G., PAHISA, J., FARRUS, B., MUNOZ, M. & VELASCO, M. 2010. Evaluation of tumor markers (HER-2/neu oncoprotein, CEA, and CA 15.3) in patients with locoregional breast cancer: prognostic value. Tumour Biol, 31, 171-80.
40036 Dycke, Kirsten.indd 148 11-04-16 11:02

149
8
References
MOLLER-LEVET, C. S., ARCHER, S. N., BUCCA, G., LAING, E. E., SLAK, A., KABILJO, R., LO, J. C., SANTHI, N., VON SCHANTZ, M., SMITH, C. P. & DIJK, D. J. 2013. Effects of insufficient sleep on circadian rhythmicity and expression amplitude of the human blood transcriptome. Proc Natl Acad Sci U S A, 110, E1132-41.
MOORE, R. Y. 1983. Organization and function of a central nervous system circadian oscillator: the suprachiasmatic hypothalamic nucleus. Fed Proc, 42, 2783-9.
MOORE, R. Y. & EICHLER, V. B. 1972. Loss of a circadian adrenal corticosterone rhythm following suprachiasmatic lesions in the rat. Brain Res, 42, 201-6.
MOOTHA, V. K., LINDGREN, C. M., ERIKSSON, K. F., SUBRAMANIAN, A., SIHAG, S., LEHAR, J., PUIGSERVER, P., CARLSSON, E., RIDDERSTRALE, M., LAURILA, E., HOUSTIS, N., DALY, M. J., PATTERSON, N., MESIROV, J. P., GOLUB, T. R., TAMAYO, P., SPIEGELMAN, B., LANDER, E. S., HIRSCHHORN, J. N., ALTSHULER, D. & GROOP, L. C. 2003. PGC-1alpha-responsive genes involved in oxidative phosphorylation are coordinately downregulated in human diabetes. Nat Genet, 34, 267-73.
MORRIS, C. J., YANG, J. N., GARCIA, J. I., MYERS, S., BOZZI, I., WANG, W., BUXTON, O. M., SHEA, S. A. & SCHEER, F. A. 2015. Endogenous circadian system and circadian misalignment impact glucose tolerance via separate mechanisms in humans. Proc Natl Acad Sci U S A, 112, E2225-34.
MORTOLA, J. F., LAUGHLIN, G. A. & YEN, S. S. 1992. A circadian rhythm of serum follicle-stimulating hormone in women. J Clin Endocrinol Metab, 75, 861-4.
MURAKAMI, Y., KOHYAMA, N., KOBAYASHI, Y., OHBAYASHI, M., OHTANI, H., SAWADA, Y. & YAMAMOTO, T. 2005. Functional characterization of human monocarboxylate transporter 6 (SLC16A5). Drug Metab Dispos, 33, 1845-51.
MYLLYKANGAS, S., HIMBERG, J., BOHLING, T., NAGY, B., HOLLMEN, J. & KNUUTILA, S. 2006. DNA copy number amplification profiling of human neoplasms. Oncogene, 25, 7324-32.
NABE-NIELSEN, K., QUIST, H. G., GARDE, A. H. & AUST, B. 2011. Shiftwork and changes in health behaviors. J Occup Environ Med, 53, 1413-7.
NANDI, S., GUZMAN, R. C. & YANG, J. 1995. Hormones and mammary carcinogenesis in mice, rats, and humans: a unifying hypothesis. Proc Natl Acad Sci U S A, 92, 3650-7.
NANJAPPA, V., THOMAS, J. K., MARIMUTHU, A., MUTHUSAMY, B., RADHAKRISHNAN, A., SHARMA, R., AHMAD KHAN, A., BALAKRISHNAN, L., SAHASRABUDDHE, N. A., KUMAR, S., JHAVERI, B. N., SHETH, K. V., KUMAR KHATANA, R., SHAW, P. G., SRIKANTH, S. M., MATHUR, P. P., SHANKAR, S., NAGARAJA, D., CHRISTOPHER, R., MATHIVANAN, S., RAJU, R., SIRDESHMUKH, R., CHATTERJEE, A., SIMPSON, R. J., HARSHA, H. C., PANDEY, A. & PRASAD, T. S. 2014. Plasma Proteome Database as a resource for proteomics research: 2014 update. Nucleic Acids Res, 42, D959-65.
NEIL, S. E., PAHWA, M., DEMERS, P. A. & GOTAY, C. C. 2014. Health-related interventions among night shift workers: a critical review of the literature. Scand J Work Environ Health.
NICOLAU, G. Y. & HAUS, E. 1989. Chronobiology of the endocrine system. Endocrinologie, 27, 153-83.
NIKLOWITZ, P., ANDLER, W. & MENKE, T. 2006. Coenzyme Q10 concentration in plasma and blood cells: what about diurnal changes? Biofactors, 28, 47-54.
NIU, S. F., CHUNG, M. H., CHU, H., TSAI, J. C., LIN, C. C., LIAO, Y. M., OU, K. L., O’BRIEN, A. P. & CHOU, K. R. 2015. Differences in cortisol profiles and circadian adjustment time between nurses working night shifts and regular day shifts: A prospective longitudinal study. Int J Nurs Stud, 52, 1193-201.
NORBERG, T., KLAAR, S., KARF, G., NORDGREN, H., HOLMBERG, L. & BERGH, J. 2001. Increased p53 mutation frequency during tumor progression--results from a breast cancer cohort. Cancer Res, 61, 8317-21.
NORUM, L. F., ERIKSTEIN, B. & NUSTAD, K. 2001. Elevated CA125 in breast cancer--A sign of advanced disease. Tumour Biol, 22, 223-8.
OHTA, H., YAMAZAKI, S. & MCMAHON, D. G. 2005. Constant light desynchronizes mammalian clock neurons. Nat Neurosci, 8, 267-9.
OIKE, H., SAKURAI, M., IPPOUSHI, K. & KOBORI, M. 2015. Time-fixed feeding prevents obesity induced by chronic advances of light/dark cycles in mouse models of jet-lag/shift work. Biochem Biophys Res Commun, 465, 556-61.
OISHI, K. 2009. Disrupted light-dark cycle induces obesity with hyperglycemia in genetically intact animals. Neuro Endocrinol Lett, 30, 458-61.
OLLILA, H. M., UTGE, S., KRONHOLM, E., AHO, V., VAN LEEUWEN, W., SILANDER, K., PARTONEN, T., PEROLA, M., KAPRIO, J., SALOMAA, V., SALLINEN, M., HARMA, M., PORKKA-HEISKANEN, T. & PAUNIO, T. 2012. TRIB1 constitutes a molecular link between regulation of sleep and lipid metabolism in humans. Transl Psychiatry, 2, e97.
40036 Dycke, Kirsten.indd 149 11-04-16 11:02

150
Chapter 8
OPPERHUIZEN, A. L., VAN KERKHOF, L. W., PROPER, K. I., RODENBURG, W. & KALSBEEK, A. 2015. Rodent models to study the metabolic effects of shiftwork in humans. Front Pharmacol, 6, 50.
OPSTAL-VAN WINDEN, A. W., KROP, E. J., KAREDAL, M. H., GAST, M. C., LINDH, C. H., JEPPSSON, M. C., JONSSON, B. A., GROBBEE, D. E., PEETERS, P. H., BEIJNEN, J. H., VAN GILS, C. H. & VERMEULEN, R. C. 2011. Searching for early breast cancer biomarkers by serum protein profiling of pre-diagnostic serum; a nested case-control study. BMC Cancer, 11, 381.
ORTH-GOMER, K. 1982. Intervention on coronary risk factors by changing working conditions of Swedish policemen. Act Nerv Super (Praha), Suppl 3, 223-9.
OSTROWSKA, Z., ZWIRSKA-KORCZALA, K., PARDELA, M., DROZDZ, M., KOS-KUDLA, B. & BUNTNER, B. 1998. Circadian variations of androstenedione, dehydroepiandrosterone sulfate and free testosterone in obese women with menstrual disturbances. Endocr Regul, 32, 169-176.
PACK, A. I., GALANTE, R. J., MAISLIN, G., CATER, J., METAXAS, D., LU, S., ZHANG, L., VON SMITH, R., KAY, T., LIAN, J., SVENSON, K. & PETERS, L. L. 2007. Novel method for high-throughput phenotyping of sleep in mice. Physiol Genomics, 28, 232-8.
PAN, A., SCHERNHAMMER, E. S., SUN, Q. & HU, F. B. 2011. Rotating night shift work and risk of type 2 diabetes: two prospective cohort studies in women. PLoS Med, 8, e1001141.
PANDA, S., ANTOCH, M. P., MILLER, B. H., SU, A. I., SCHOOK, A. B., STRAUME, M., SCHULTZ, P. G., KAY, S. A., TAKAHASHI, J. S. & HOGENESCH, J. B. 2002. Coordinated transcription of key pathways in the mouse by the circadian clock. Cell, 109, 307-20.
PAPANTONIOU, K., POZO, O. J., ESPINOSA, A., MARCOS, J., CASTANO-VINYALS, G., BASAGANA, X., RIBAS, F. C., MIRABENT, J., MARTIN, J., CARENYS, G., MARTIN, C. R., MIDDLETON, B., SKENE, D. J. & KOGEVINAS, M. 2014. Circadian variation of melatonin, light exposure, and diurnal preference in day and night shift workers of both sexes. Cancer Epidemiol Biomarkers Prev, 23, 1176-86.
PARSONS, M. J., MOFFITT, T. E., GREGORY, A. M., GOLDMAN-MELLOR, S., NOLAN, P. M., POULTON, R. & CASPI, A. 2014. Social jetlag, obesity and metabolic disorder: investigation in a cohort study. Int J Obes (Lond).
PENNINGS, J. L., RODENBURG, W., IMHOLZ, S., KOSTER, M. P., VAN OOSTROM, C. T., BREIT, T. M., SCHIELEN, P. C. & DE VRIES, A. 2011. Gene expression profiling in a mouse model identifies fetal liver- and placenta-derived potential biomarkers for Down Syndrome screening. PLoS One, 6, e18866.
PENNINGS, J. L., SILJEE, J. E., IMHOLZ, S., KUC, S., DE VRIES, A., SCHIELEN, P. C. & RODENBURG, W. 2014. Comparison of different blood collection, sample matrix, and immunoassay methods in a prenatal screening setting. Dis Markers, 2014, 509821.
PETROV, M. E., CLARK, C. B., MOLZOF, H. E., JOHNSON, R. L., JR., CROPSEY, K. L. & GAMBLE, K. L. 2014. Sleep Strategies of Night-Shift Nurses on Days Off: Which Ones are Most Adaptive? Front Neurol, 5, 277.
PFEFFER, M., WICHT, H., VON GALL, C. & KORF, H. W. 2015. Owls and larks in mice. Front Neurol, 6, 101.
PHILLIPS, D. J., SAVENKOVA, M. I. & KARATSOREOS, I. N. 2015. Environmental disruption of the circadian clock leads to altered sleep and immune responses in mouse. Brain Behav Immun, 47, 14-23.
PICKERING, T. G. 1990. The clinical significance of diurnal blood pressure variations. Dippers and nondippers. Circulation, 81, 700-2.
PIJPE, A., SLOTTJE, P., VAN PELT, C., STEHMANN, F., KROMHOUT, H., VAN LEEUWEN, F. E., VERMEULEN, R. C. & ROOKUS, M. A. 2014. The Nightingale study: rationale, study design and baseline characteristics of a prospective cohort study on shift work and breast cancer risk among nurses. BMC Cancer, 14, 47.
PITTERI, S. J., FACA, V. M., KELLY-SPRATT, K. S., KASARDA, A. E., WANG, H., ZHANG, Q., NEWCOMB, L., KRASNOSELSKY, A., PACZESNY, S., CHOI, G., FITZGIBBON, M., MCINTOSH, M. W., KEMP, C. J. & HANASH, S. M. 2008. Plasma proteome profiling of a mouse model of breast cancer identifies a set of up-regulated proteins in common with human breast cancer cells. J Proteome Res, 7, 1481-9.
PLYMATE, S. R., TENOVER, J. S. & BREMNER, W. J. 1989. Circadian variation in testosterone, sex hormone-binding globulin, and calculated non-sex hormone-binding globulin bound testosterone in healthy young and elderly men. J Androl, 10, 366-71.
PONTEN, F., JIRSTROM, K. & UHLEN, M. 2008. The Human Protein Atlas--a tool for pathology. J Pathol, 216, 387-93.
POOLA, I., DEWITTY, R. L., MARSHALLECK, J. J., BHATNAGAR, R., ABRAHAM, J. & LEFFALL, L. D. 2005. Identification of MMP-1 as a putative breast cancer predictive marker by global gene expression analysis. Nat Med, 11, 481-3.
PUKKALA, E., AUVINEN, A. & WAHLBERG, G. 1995. Incidence of cancer among Finnish airline cabin attendants, 1967-92. BMJ, 311, 649-52.
40036 Dycke, Kirsten.indd 150 11-04-16 11:02

151
8
References
REDMAN, J. R. 1997. Circadian entrainment and phase shifting in mammals with melatonin. J Biol Rhythms, 12, 581-7.
REFINETTI, R. & MENAKER, M. 1992. The circadian rhythm of body temperature. Physiol Behav, 51, 613-37.
REPPERT, S. M. & WEAVER, D. R. 2002. Coordination of circadian timing in mammals. Nature, 418, 935-41.
REVILLION, F., BONNETERRE, J. & PEYRAT, J. P. 1998. ERBB2 oncogene in human breast cancer and its clinical significance. Eur J Cancer, 34, 791-808.
REYNOLDS, P., CONE, J., LAYEFSKY, M., GOLDBERG, D. E. & HURLEY, S. 2002. Cancer incidence in California flight attendants (United States). Cancer Causes Control, 13, 317-24.
RICHTER, K. D., ACKER, J., SCHOLZ, F. & NIKLEWSKI, G. 2010. Health promotion and work: prevention of shift work disorders in companies. EPMA J, 1, 611-8.
RIEDEL, M., HOEFT, B., BLUM, W. F., VON ZUR MUHLEN, A. & BRABANT, G. 1995. Pulsatile growth hormone secretion in normal-weight and obese men: differential metabolic regulation during energy restriction. Metabolism, 44, 605-10.
RIFKIN, R., MUKHERJEE, S., TAMAYO, P., RAMASWAMY, S., YEANG, S., ANGELO, M., REICH, M., POGGIO, T., LANDER, E. S., GOLUB, T. R. & MESIROV, J. P. 2003. An analytical method for multi-class molecular cancer classification. Siam Review, 45, 706-723.
ROENNEBERG, T., ALLEBRANDT, K. V., MERROW, M. & VETTER, C. 2012. Social jetlag and obesity. Curr Biol, 22, 939-43.
ROENNEBERG, T., KELLER, L. K., FISCHER, D., MATERA, J. L., VETTER, C. & WINNEBECK, E. C. 2015. Human activity and rest in situ. Methods Enzymol, 552, 257-83.
RUGGIERO, J. S. & REDEKER, N. S. 2014. Effects of napping on sleepiness and sleep-related performance deficits in night-shift workers: a systematic review. Biol Res Nurs, 16, 134-42.
SACK, R. L., BLOOD, M. L. & LEWY, A. J. 1992. Melatonin rhythms in night shift workers. Sleep, 15, 434-41.
SAGE, D., GANEM, J., GUILLAUMOND, F., LAFORGE-ANGLADE, G., FRANCOIS-BELLAN, A. M., BOSLER, O. & BECQUET, D. 2004. Influence of the corticosterone rhythm on photic entrainment of locomotor activity in rats. J Biol Rhythms, 19, 144-56.
SALGADO-DELGADO, R., ANGELES-CASTELLANOS, M., BUIJS, M. R. & ESCOBAR, C. 2008. Internal desynchronization in a model of night-work by forced activity in rats. Neuroscience, 154, 922-31.
SALGADO-DELGADO, R., ANGELES-CASTELLANOS, M., SADERI, N., BUIJS, R. M. & ESCOBAR, C. 2010. Food intake during the normal activity phase prevents obesity and circadian desynchrony in a rat model of night work. Endocrinology, 151, 1019-29.
SANCAR, A., LINDSEY-BOLTZ, L. A., KANG, T. H., REARDON, J. T., LEE, J. H. & OZTURK, N. 2010. Circadian clock control of the cellular response to DNA damage. FEBS Lett, 584, 2618-25.
SASSEVILLE, A. & HEBERT, M. 2010. Using blue-green light at night and blue-blockers during the day to improves adaptation to night work: a pilot study. Prog Neuropsychopharmacol Biol Psychiatry, 34, 1236-42.
SCHERNHAMMER, E. S., KROENKE, C. H., LADEN, F. & HANKINSON, S. E. 2006. Night work and risk of breast cancer. Epidemiology, 17, 108-11.
SCHERNHAMMER, E. S., LADEN, F., SPEIZER, F. E., WILLETT, W. C., HUNTER, D. J., KAWACHI, I., FUCHS, C. S. & COLDITZ, G. A. 2003. Night-shift work and risk of colorectal cancer in the nurses’ health study. J Natl Cancer Inst, 95, 825-8.
SCHOENHERR, R. M., KELLY-SPRATT, K. S., LIN, C., WHITEAKER, J. R., LIU, T., HOLZMAN, T., COLEMAN, I., FENG, L. C., LORENTZEN, T. D., KRASNOSELSKY, A. L., WANG, P., LIU, Y., GURLEY, K. E., AMON, L. M., SCHEPMOES, A. A., MOORE, R. J., CAMP, D. G., 2ND, CHODOSH, L. A., SMITH, R. D., NELSON, P. S., MCINTOSH, M. W., KEMP, C. J. & PAULOVICH, A. G. 2011. Proteome and transcriptome profiles of a Her2/Neu-driven mouse model of breast cancer. Proteomics Clin Appl, 5, 179-88.
SCHUETZ, C. S., BONIN, M., CLARE, S. E., NIESELT, K., SOTLAR, K., WALTER, M., FEHM, T., SOLOMAYER, E., RIESS, O., WALLWIENER, D., KUREK, R. & NEUBAUER, H. J. 2006. Progression-specific genes identified by expression profiling of matched ductal carcinomas in situ and invasive breast tumors, combining laser capture microdissection and oligonucleotide microarray analysis. Cancer Res, 66, 5278-86.
SCHWARTZ, W. J. & ZIMMERMAN, P. 1990. Circadian timekeeping in BALB/c and C57BL/6 inbred mouse strains. J Neurosci, 10, 3685-94.
SEGAL, E., FRIEDMAN, N., KOLLER, D. & REGEV, A. 2004. A module map showing conditional activity of expression modules in cancer. Nat.Genet., 36, 1090-1098.
40036 Dycke, Kirsten.indd 151 11-04-16 11:02

152
Chapter 8
SHAH, P. N., MHATRE, M. C. & KOTHARI, L. S. 1984. Effect of melatonin on mammary carcinogenesis in intact and pinealectomized rats in varying photoperiods. Cancer Res, 44, 3403-7.
SHAW, P. J., CIRELLI, C., GREENSPAN, R. J. & TONONI, G. 2000. Correlates of sleep and waking in Drosophila melanogaster. Science, 287, 1834-7.
SORLIE, T., PEROU, C. M., TIBSHIRANI, R., AAS, T., GEISLER, S., JOHNSEN, H., HASTIE, T., EISEN, M. B., VAN DE RIJN, M., JEFFREY, S. S., THORSEN, T., QUIST, H., MATESE, J. C., BROWN, P. O., BOTSTEIN, D., EYSTEIN LONNING, P. & BORRESEN-DALE, A. L. 2001. Gene expression patterns of breast carcinomas distinguish tumor subclasses with clinical implications. Proc Natl Acad Sci U S A, 98, 10869-74.
SOTIRIOU, C. & PUSZTAI, L. 2009. Gene-expression signatures in breast cancer. N Engl J Med, 360, 790-800.
SOTIRIOU, C., WIRAPATI, P., LOI, S., HARRIS, A., FOX, S., SMEDS, J., NORDGREN, H., FARMER, P., PRAZ, V., HAIBE-KAINS, B., DESMEDT, C., LARSIMONT, D., CARDOSO, F., PETERSE, H., NUYTEN, D., BUYSE, M., VAN DE VIJVER, M. J., BERGH, J., PICCART, M. & DELORENZI, M. 2006. Gene expression profiling in breast cancer: understanding the molecular basis of histologic grade to improve prognosis. J Natl Cancer Inst, 98, 262-72.
SPRATT, D. I., O’DEA, L. S., SCHOENFELD, D., BUTLER, J., RAO, P. N. & CROWLEY, W. F., JR. 1988. Neuroendocrine-gonadal axis in men: frequent sampling of LH, FSH, and testosterone. Am J Physiol, 254, E658-66.
STANDISH, L. J., SWEET, E. S., NOVACK, J., WENNER, C. A., BRIDGE, C., NELSON, A., MARTZEN, M. & TORKELSON, C. 2008. Breast cancer and the immune system. J Soc Integr Oncol, 6, 158-68.
STEVENS, R. G. 2005. Circadian disruption and breast cancer: from melatonin to clock genes. Epidemiology, 16, 254-8.
STORCH, K. F., LIPAN, O., LEYKIN, I., VISWANATHAN, N., DAVIS, F. C., WONG, W. H. & WEITZ, C. J. 2002. Extensive and divergent circadian gene expression in liver and heart. Nature, 417, 78-83.
STURGEON, C. M., DUFFY, M. J., STENMAN, U. H., LILJA, H., BRUNNER, N., CHAN, D. W., BABAIAN, R., BAST, R. C., JR., DOWELL, B., ESTEVA, F. J., HAGLUND, C., HARBECK, N., HAYES, D. F., HOLTEN-ANDERSEN, M., KLEE, G. G., LAMERZ, R., LOOIJENGA, L. H., MOLINA, R., NIELSEN, H. J., RITTENHOUSE, H., SEMJONOW, A., SHIH IE, M., SIBLEY, P., SOLETORMOS, G., STEPHAN, C., SOKOLL, L., HOFFMAN, B. R. & DIAMANDIS, E. P. 2008. National Academy of Clinical Biochemistry laboratory medicine practice guidelines for use of tumor markers in testicular, prostate, colorectal, breast, and ovarian cancers. Clin Chem, 54, e11-79.
SUBRAMANIAN, A. & KOTHARI, L. 1991. Suppressive effect by melatonin on different phases of 9,10-dimethyl-1,2-benzanthracene (DMBA)-induced rat mammary gland carcinogenesis. Anticancer Drugs, 2, 297-303.
SUBRAMANIAN, A., TAMAYO, P., MOOTHA, V. K., MUKHERJEE, S., EBERT, B. L., GILLETTE, M. A., PAULOVICH, A., POMEROY, S. L., GOLUB, T. R., LANDER, E. S. & MESIROV, J. P. 2005. Gene set enrichment analysis: a knowledge-based approach for interpreting genome-wide expression profiles. Proc Natl Acad Sci U S A, 102, 15545-50.
SUJINO, M., FURUKAWA, K., KOINUMA, S., FUJIOKA, A., NAGANO, M., IIGO, M. & SHIGEYOSHI, Y. 2012. Differential entrainment of peripheral clocks in the rat by glucocorticoid and feeding. Endocrinology, 153, 2277-86.
SUWAZONO, Y., SAKATA, K., OKUBO, Y., HARADA, H., OISHI, M., KOBAYASHI, E., UETANI, M., KIDO, T. & NOGAWA, K. 2006. Long-term longitudinal study on the relationship between alternating shift work and the onset of diabetes mellitus in male Japanese workers. J Occup Environ Med, 48, 455-61.
TAKIMOTO, M., HAMADA, A., TOMODA, A., OHDO, S., OHMURA, T., SAKATO, H., KAWATANI, J., JODOI, T., NAKAGAWA, H., TERAZONO, H., KOYANAGI, S., HIGUCHI, S., KIMURA, M., TUKIKAWA, H., IRIE, S., SAITO, H. & MIIKE, T. 2005. Daily expression of clock genes in whole blood cells in healthy subjects and a patient with circadian rhythm sleep disorder. Am J Physiol Regul Integr Comp Physiol, 289, R1273-9.
TAMARKIN, L., COHEN, M., ROSELLE, D., REICHERT, C., LIPPMAN, M. & CHABNER, B. 1981. Melatonin inhibition and pinealectomy enhancement of 7,12-dimethylbenz(a)anthracene-induced mammary tumors in the rat. Cancer Res, 41, 4432-6.
TAMPELLINI, M., BERRUTI, A., BITOSSI, R., GORZEGNO, G., ALABISO, I., BOTTINI, A., FARRIS, A., DONADIO, M., SAROBBA, M. G., MANZIN, E., DURANDO, A., DEFABIANI, E., DE MATTEIS, A., ARDINE, M., CASTIGLIONE, F., DANESE, S., BERTONE, E., ALABISO, O., MASSOBRIO, M. & DOGLIOTTI, L. 2006. Prognostic significance of changes in CA 15-3 serum levels during chemotherapy in metastatic breast cancer patients. Breast Cancer Res Treat, 98, 241-8.
TEBOUL, M., BARRAT-PETIT, M. A., LI, X. M., CLAUSTRAT, B., FORMENTO, J. L., DELAUNAY, F., LEVI, F. & MILANO, G. 2005. Atypical patterns of circadian clock gene expression in human peripheral blood mononuclear cells. J Mol Med (Berl), 83, 693-9.
TIBSHIRANI, R., HASTIE, T., NARASIMHAN, B. & CHU, G. 2002. Diagnosis of multiple cancer types by shrunken centroids of gene expression. Proc Natl Acad Sci U S A, 99, 6567-72.
40036 Dycke, Kirsten.indd 152 11-04-16 11:02

153
8
References
TRAVLOS, G. S., WILSON, R. E., MURRELL, J. A., CHIGNELL, C. F. & BOORMAN, G. A. 2001. The effect of short intermittent light exposures on the melatonin circadian rhythm and NMU-induced breast cancer in female F344/N rats. Toxicol Pathol, 29, 126-36.
TUCKER, P., SMITH, L., MACDONALD, I. & FOLKARD, S. 2000. Effects of direction of rotation in continuous and discontinuous 8 hour shift systems. Occup Environ Med, 57, 678-84.
UEDA, H. R., CHEN, W., MINAMI, Y., HONMA, S., HONMA, K., IINO, M. & HASHIMOTO, S. 2004. Molecular-timetable methods for detection of body time and rhythm disorders from single-time-point genome-wide expression profiles. Proc Natl Acad Sci U S A, 101, 11227-32.
UPTON, A. C., ALBERT, R. E. & BURNS, F. J. 1986. Radiation Carcinogenesis, New York, Elsevier.
URAY, I. P., LIANG, Y. & HYDER, S. M. 2004. Estradiol down-regulates CD36 expression in human breast cancer cells. Cancer Lett, 207, 101-7.
VAN DEN POL, A. N. 1980. The hypothalamic suprachiasmatic nucleus of rat: intrinsic anatomy. J Comp Neurol, 191, 661-702.
VAN DER RHEE, H., COEBERGH, J. W. & DE VRIES, E. 2013. Is prevention of cancer by sun exposure more than just the effect of vitamin D? A systematic review of epidemiological studies. Eur J Cancer, 49, 1422-36.
VAN DER VEEN, J. W., PRONK, T. E., VAN LOVEREN, H. & EZENDAM, J. 2013. Applicability of a keratinocyte gene signature to predict skin sensitizing potential. Toxicol In Vitro, 27, 314-22.
VAN DYCKE, K. C., RODENBURG, W., VAN OOSTROM, C. T., VAN KERKHOF, L. W., PENNINGS, J. L., ROENNEBERG, T., VAN STEEG, H. & VAN DER HORST, G. T. 2015. Chronically Alternating Light Cycles Increase Breast Cancer Risk in Mice. Curr Biol, 25, 1932-7.
VANDEBRIEL, R. J., PENNINGS, J. L., BAKEN, K. A., PRONK, T. E., BOORSMA, A., GOTTSCHALK, R. & VAN LOVEREN, H. 2010. Keratinocyte gene expression profiles discriminate sensitizing and irritating compounds. Toxicol Sci, 117, 81-9.
VANHECKE, E., ADRIAENSSENS, E., VERBEKE, S., MEIGNAN, S., GERMAIN, E., BERTEAUX, N., NURCOMBE, V., LE BOURHIS, X. & HONDERMARCK, H. 2011. Brain-derived neurotrophic factor and neurotrophin-4/5 are expressed in breast cancer and can be targeted to inhibit tumor cell survival. Clin Cancer Res, 17, 1741-52.
VARLEY, J. M., EVANS, D. G. & BIRCH, J. M. 1997. Li-Fraumeni syndrome--a molecular and clinical review. Br J Cancer, 76, 1-14.
VELDHUIS, J. D., CHRISTIANSEN, E., EVANS, W. S., KOLP, L. A., ROGOL, A. D. & JOHNSON, M. L. 1988. Physiological profiles of episodic progesterone release during the midluteal phase of the human menstrual cycle: analysis of circadian and ultradian rhythms, discrete pulse properties, and correlations with simultaneous luteinizing hormone release. J Clin Endocrinol Metab, 66, 414-21.
VERSCHUREN, W. M., BLOKSTRA, A., PICAVET, H. S. & SMIT, H. A. 2008. Cohort profile: the Doetinchem Cohort Study. Int J Epidemiol, 37, 1236-41.
VETTER, C., FISCHER, D., MATERA, J. L. & ROENNEBERG, T. 2015. Aligning work and circadian time in shift workers improves sleep and reduces circadian disruption. Curr Biol, 25, 1-5.
VIITASALO, K., KUOSMA, E., LAITINEN, J. & HARMA, M. 2008. Effects of shift rotation and the flexibility of a shift system on daytime alertness and cardiovascular risk factors. Scand J Work Environ Health, 34, 198-205.
VINOGRADOVA, I. A., ANISIMOV, V. N., BUKALEV, A. V., ILYUKHA, V. A., KHIZHKIN, E. A., LOTOSH, T. A., SEMENCHENKO, A. V. & ZABEZHINSKI, M. A. 2010. Circadian disruption induced by light-at-night accelerates aging and promotes tumorigenesis in young but not in old rats. Aging (Albany NY), 2, 82-92.
VINOGRADOVA, I. A., ANISIMOV, V. N., BUKALEV, A. V., SEMENCHENKO, A. V. & ZABEZHINSKI, M. A. 2009. Circadian disruption induced by light-at-night accelerates aging and promotes tumorigenesis in rats. Aging (Albany NY), 1, 855-65.
WAGNER, K. U., WALL, R. J., ST-ONGE, L., GRUSS, P., WYNSHAW-BORIS, A., GARRETT, L., LI, M., FURTH, P. A. & HENNIGHAUSEN, L. 1997. Cre-mediated gene deletion in the mammary gland. Nucleic Acids Res, 25, 4323-30.
WANG, F., YEUNG, K. L., CHAN, W. C., KWOK, C. C., LEUNG, S. L., WU, C., CHAN, E. Y., YU, I. T., YANG, X. R. & TSE, L. A. 2013. A meta-analysis on dose-response relationship between night shift work and the risk of breast cancer. Ann Oncol.
WANG, F., ZHANG, L., ZHANG, Y., ZHANG, B., HE, Y., XIE, S., LI, M., MIAO, X., CHAN, E. Y., TANG, J. L., WONG, M. C., LI, Z., YU, I. T. & TSE, L. A. 2014. Meta-analysis on night shift work and risk of metabolic syndrome. Obes Rev, 15, 709-20.
40036 Dycke, Kirsten.indd 153 11-04-16 11:02

154
Chapter 8
WANG, X. S., TRAVIS, R. C., REEVES, G., GREEN, J., ALLEN, N. E., KEY, T. J., RODDAM, A. W. & BERAL, V. 2012. Characteristics of the Million Women Study participants who have and have not worked at night. Scand J Work Environ Health, 38, 590-9.
WARMAN, V. L., DIJK, D. J., WARMAN, G. R., ARENDT, J. & SKENE, D. J. 2003. Phase advancing human circadian rhythms with short wavelength light. Neurosci Lett, 342, 37-40.
WHITEAKER, J. R., LIN, C., KENNEDY, J., HOU, L., TRUTE, M., SOKAL, I., YAN, P., SCHOENHERR, R. M., ZHAO, L., VOYTOVICH, U. J., KELLY-SPRATT, K. S., KRASNOSELSKY, A., GAFKEN, P. R., HOGAN, J. M., JONES, L. A., WANG, P., AMON, L., CHODOSH, L. A., NELSON, P. S., MCINTOSH, M. W., KEMP, C. J. & PAULOVICH, A. G. 2011. A targeted proteomics-based pipeline for verification of biomarkers in plasma. Nat Biotechnol, 29, 625-34.
WHITEAKER, J. R., ZHANG, H., ZHAO, L., WANG, P., KELLY-SPRATT, K. S., IVEY, R. G., PIENING, B. D., FENG, L. C., KASARDA, E., GURLEY, K. E., ENG, J. K., CHODOSH, L. A., KEMP, C. J., MCINTOSH, M. W. & PAULOVICH, A. G. 2007. Integrated pipeline for mass spectrometry-based discovery and confirmation of biomarkers demonstrated in a mouse model of breast cancer. J Proteome Res, 6, 3962-75.
WHO. 2013. Fact sheet Diabetes [Online]. Available: http://www.who.int/mediacentre/factsheets/fs312/en/.
WIJNHOVEN, S. W., ZWART, E., SPEKSNIJDER, E. N., BEEMS, R. B., OLIVE, K. P., TUVESON, D. A., JONKERS, J., SCHAAP, M. M., VAN DEN BERG, J., JACKS, T., VAN STEEG, H. & DE VRIES, A. 2005. Mice expressing a mammary gland-specific R270H mutation in the p53 tumor suppressor gene mimic human breast cancer development. Cancer Res, 65, 8166-73.
WU, C., OROZCO, C., BOYER, J., LEGLISE, M., GOODALE, J., BATALOV, S., HODGE, C. L., HAASE, J., JANES, J., HUSS, J. W., III & SU, A. I. 2009. BioGPS: an extensible and customizable portal for querying and organizing gene annotation resources. Genome Biol., 10, R130.
WU, J., DAUCHY, R. T., TIRRELL, P. C., WU, S. S., LYNCH, D. T., JITAWATANARAT, P., BURRINGTON, C. M., DAUCHY, E. M., BLASK, D. E. & GREENE, M. W. 2011. Light at night activates IGF-1R/PDK1 signaling and accelerates tumor growth in human breast cancer xenografts. Cancer Res, 71, 2622-31.
WU, P., BLAIR, P. V., SATO, J., JASKIEWICZ, J., POPOV, K. M. & HARRIS, R. A. 2000. Starvation increases the amount of pyruvate dehydrogenase kinase in several mammalian tissues. Arch Biochem Biophys, 381, 1-7.
XU, B., GOULDING, E. H., ZANG, K., CEPOI, D., CONE, R. D., JONES, K. R., TECOTT, L. H. & REICHARDT, L. F. 2003. Brain-derived neurotrophic factor regulates energy balance downstream of melanocortin-4 receptor. Nat Neurosci, 6, 736-42.
YANG, X., WOOD, P. A., ANSELL, C. M., QUITON, D. F., OH, E. Y., DU-QUITON, J. & HRUSHESKY, W. J. 2009a. The circadian clock gene Per1 suppresses cancer cell proliferation and tumor growth at specific times of day. Chronobiol Int, 26, 1323-39.
YANG, X., WOOD, P. A., OH, E. Y., DU-QUITON, J., ANSELL, C. M. & HRUSHESKY, W. J. 2009b. Down regulation of circadian clock gene Period 2 accelerates breast cancer growth by altering its daily growth rhythm. Breast Cancer Res Treat, 117, 423-31.
YOON, J. A., HAN, D. H., NOH, J. Y., KIM, M. H., SON, G. H., KIM, K., KIM, C. J., PAK, Y. K. & CHO, S. 2012. Meal time shift disturbs circadian rhythmicity along with metabolic and behavioral alterations in mice. PLoS One, 7, e44053.
YOSHINO, J., ALMEDA-VALDES, P., PATTERSON, B. W., OKUNADE, A. L., IMAI, S., MITTENDORFER, B. & KLEIN, S. 2014. Diurnal variation in insulin sensitivity of glucose metabolism is associated with diurnal variations in whole-body and cellular fatty acid metabolism in metabolically normal women. J Clin Endocrinol Metab, 99, E1666-70.
YOU, S., WOOD, P. A., XIONG, Y., KOBAYASHI, M., DU-QUITON, J. & HRUSHESKY, W. J. 2005. Daily coordination of cancer growth and circadian clock gene expression. Breast Cancer Res Treat, 91, 47-60.
ZEIWAR, M. M., ZAKI, S. M., MOHAMMAD, L. A., ZIDAN, A. A. & EL NAGAR, M. R. 2007. HER-2 gene amplification, serum nucleosomes, CEA and CA15.3 tumor markers in breast cancer patients. Egypt J Immunol, 14, 29-41.
ZHANG, R., LAHENS, N. F., BALLANCE, H. I., HUGHES, M. E. & HOGENESCH, J. B. 2014a. A circadian gene expression atlas in mammals: Implications for biology and medicine. Proc Natl Acad Sci U S A.
ZHANG, S., HULVER, M. W., MCMILLAN, R. P., CLINE, M. A. & GILBERT, E. R. 2014b. The pivotal role of pyruvate dehydrogenase kinases in metabolic flexibility. Nutr Metab (Lond), 11, 10.
40036 Dycke, Kirsten.indd 154 11-04-16 11:02

40036 Dycke, Kirsten.indd 155 11-04-16 11:02

40036 Dycke, Kirsten.indd 156 11-04-16 11:02

APPENDIX 1
A day and night difference in the response of the
hepatic transcriptome to cyclophosphamide
treatment
Kirsten C.G. van Dycke*, Romana M. Nijman*, Paul F.K. Wackers, Martijs J. Jonker,
Wendy Rodenburg, Conny T.M. van Oostrom, Daniela C.F. Salvatori, Timo M. Breit,
Harry van Steeg, Mirjam Luijten, and Gijsbertus T.J. van der Horst
*joint first authors
Archives of Toxicology, 2014, 89(2):221-31
40036 Dycke, Kirsten.indd 157 11-04-16 11:02

Appendix 1
158
Abstract
Application of omics-based technologies is a widely used approach in research
aiming to improve testing strategies for human health risk assessment. In most
of these studies, however, temporal variations in gene expression caused by the
circadian clock are a commonly neglected pitfall. In the present study, we investigated
the impact of the circadian clock on the response of the hepatic transcriptome
after exposure of mice to the chemotherapeutic agent cyclophosphamide (CP).
Analysis of the data without considering clock progression revealed common
responses in terms of regulated pathways between light and dark phase exposure,
including DNA damage, oxidative stress, and a general immune response. The
overall response however was stronger in mice exposed during the day. Use of
time-matched controls, thereby eliminating non-CP responsive circadian clock
controlled genes, showed that this difference in response was actually even more
pronounced: CP-related responses were only identified in mice exposed during
the day. Only minor differences were found in acute toxicity pathways, namely
lymphocyte counts and kidney weights, indicating that gene expression is subject
to time of day effects. This study is the first to highlight the impact of the circadian
clock on the identification of toxic responses by omics approaches.
40036 Dycke, Kirsten.indd 158 11-04-16 11:02
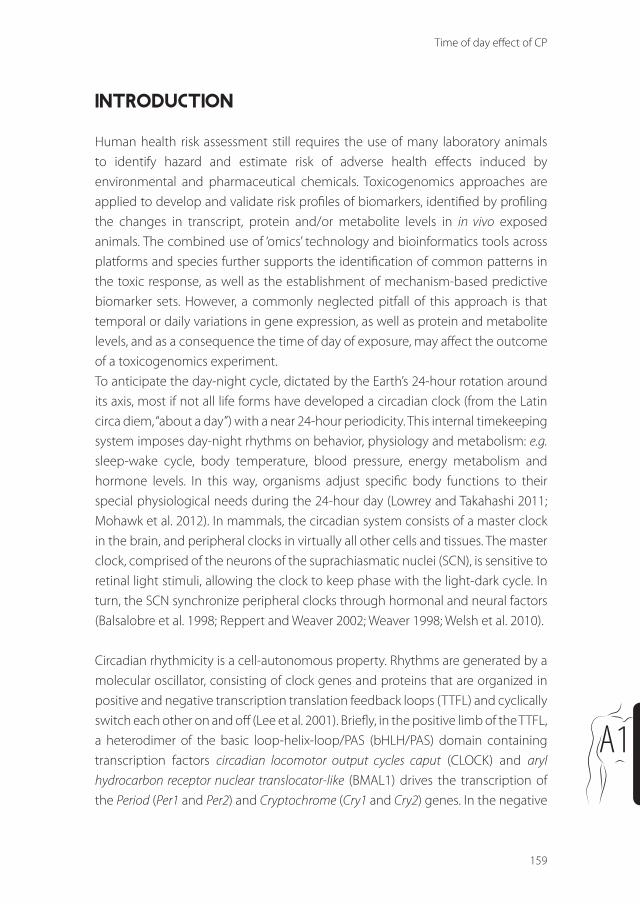
Time of day effect of CP
159
A1
Introduction
Human health risk assessment still requires the use of many laboratory animals
to identify hazard and estimate risk of adverse health effects induced by
environmental and pharmaceutical chemicals. Toxicogenomics approaches are
applied to develop and validate risk profiles of biomarkers, identified by profiling
the changes in transcript, protein and/or metabolite levels in in vivo exposed
animals. The combined use of ‘omics’ technology and bioinformatics tools across
platforms and species further supports the identification of common patterns in
the toxic response, as well as the establishment of mechanism-based predictive
biomarker sets. However, a commonly neglected pitfall of this approach is that
temporal or daily variations in gene expression, as well as protein and metabolite
levels, and as a consequence the time of day of exposure, may affect the outcome
of a toxicogenomics experiment.
To anticipate the day-night cycle, dictated by the Earth’s 24-hour rotation around
its axis, most if not all life forms have developed a circadian clock (from the Latin
circa diem, “about a day”) with a near 24-hour periodicity. This internal timekeeping
system imposes day-night rhythms on behavior, physiology and metabolism: e.g.
sleep-wake cycle, body temperature, blood pressure, energy metabolism and
hormone levels. In this way, organisms adjust specific body functions to their
special physiological needs during the 24-hour day (Lowrey and Takahashi 2011;
Mohawk et al. 2012). In mammals, the circadian system consists of a master clock
in the brain, and peripheral clocks in virtually all other cells and tissues. The master
clock, comprised of the neurons of the suprachiasmatic nuclei (SCN), is sensitive to
retinal light stimuli, allowing the clock to keep phase with the light-dark cycle. In
turn, the SCN synchronize peripheral clocks through hormonal and neural factors
(Balsalobre et al. 1998; Reppert and Weaver 2002; Weaver 1998; Welsh et al. 2010).
Circadian rhythmicity is a cell-autonomous property. Rhythms are generated by a
molecular oscillator, consisting of clock genes and proteins that are organized in
positive and negative transcription translation feedback loops (TTFL) and cyclically
switch each other on and off (Lee et al. 2001). Briefly, in the positive limb of the TTFL,
a heterodimer of the basic loop-helix-loop/PAS (bHLH/PAS) domain containing
transcription factors circadian locomotor output cycles caput (CLOCK) and aryl
hydrocarbon receptor nuclear translocator-like (BMAL1) drives the transcription of
the Period (Per1 and Per2) and Cryptochrome (Cry1 and Cry2) genes. In the negative
40036 Dycke, Kirsten.indd 159 11-04-16 11:02

Appendix 1
160
limb, the PER and CRY proteins shut down transcription of their own genes by
forming a heterodimeric complex that translocates to the nucleus and represses
CLOCK/BMAL1 driven transcription (Ko and Takahashi 2006; Lee et al. 2001; Reppert
and Weaver 2001). This molecular clock is coupled to output processes via a series
of clock-controlled genes, including transcription factors, cyclic expression of
which further relays rhythmicity to a wider set of genes (Kumaki et al. 2008; Miller
et al. 2007; Ueda et al. 2002; Yan et al. 2008). Indeed, various expression profiling
studies have shown that, depending on the tissue, up to 10% of the transcriptome
is under circadian control, with mRNA expression peaks distributed throughout
the circadian cycle (Akhtar et al. 2002; Bozek et al. 2009; Panda et al. 2002; Storch
et al. 2002).
The liver plays a key role in most metabolic processes, especially in detoxification
of xenobiotics. In this tissue, clock controlled transcription factors cause rhythmic
expression of members of the cytochrome P450 (CYP) family and other phase I
and phase II enzymes involved in this detoxification (Gachon et al. 2006). Adding
to circadian control over xenobiotic metabolism (both activation and inactivation)
is the diurnal variation in uptake and renal clearance of toxic substances (Levi and
Schibler 2007). Circadian variation in the absorption, metabolism and excretion
of toxic substances will ultimately determine the actual concentration to which
the cells and tissues are exposed (Paschos et al. 2010). As such, the time of day
of exposure to substances such as drugs, environmental chemicals and other
xenobiotics may affect the severity of the toxic response, a phenomenon referred
to as chronotoxicity.
To obtain insight into how the circadian clock affects the outcome of a
transcriptomics experiment, we have performed an in vivo study in which mice
were exposed to cyclophosphamide (CP) during the day or during the night. CP
is a chemotherapeutic and immune suppressive agent that is widely used for
treatment of several types of cancer, blood and bone marrow and tissue transplant
rejections, and autoimmune disorders (Colvin 1999). As a prodrug, CP requires
metabolic activation by cytochrome P450 enzymes (Hales 1982; Hill et al. 1972;
Ludeman 1999). The human cytochrome P450 enzymes CYP2B6, CYP2C9, and
CYP3A4/5 convert CP into the active metabolite 4-hydroxycyclophosphamide,
which is in tautomeric equilibrium with aldophosphamide. A small proportion of
aldophosphamide spontaneously decomposes to the genotoxic and carcinogenic
40036 Dycke, Kirsten.indd 160 11-04-16 11:02

Time of day effect of CP
161
A1
metabolite phosphoramide mustard and the toxic byproduct acrolein (Hales 1982;
Kern and Kehrer 2002; King and Perry 2001). As shown here, analysis of the hepatic
gene expression profiles of mice exposed to CP during the day or during the
night revealed a remarkable time of day of exposure difference in the magnitude
of the response. These results highlight the involvement of the circadian clock in
genotoxic stress responses and indicate the importance to consider the circadian
system when performing toxicological risk analyses studies.
Methods
Animal experimentsThree-week-old male C57BL/6 mice were purchased from Harlan Laboratories
(Horst, The Netherlands) and housed at the animal facilities of the National
Institute for Public Health and the Environment (RIVM). Animals were kept under a
regular 12-hr light: 12-hr dark cycle and food and water were provided ad libitum.
All animal experiments were conducted in in accordance with national legislation
and were approved by a local ethical committee on experimental animals.
For the microarray study, 8-week-old mice received a single i.p. injection of either
300 mg/kg cyclophosphamide (CP, CAS 6055-19-2, Sigma-Aldrich) or the vehicle
(PBS) at two different Zeitgeber times, ZT8 and ZT20 (ZT0 = lights on). Animals
(n=4 per time point) were sacrificed by cervical dislocation at 0.5, 1, 2 and 4 hours
after CP injection (T0.5, T1, T2 and T4), and at 0 and 4 hours after vehicle injection
(C0 and C4). The left lobe of the liver was isolated and stored using RNAlater
(Invitrogen, Grand Island, NY, USA) according to the manufacturer’s protocol.
For the acute toxicity experiment, three dose groups were used: 30, 100 and 300
mg/kg CP. Eight-week-old mice (n=5 per group) received a single i.p. injection of
CP or the vehicle (PBS) at ZT8 or ZT20 and were sacrificed by orbital bleeding under
Ketamine/Xylazine anesthesia at 24 hours and 72 hours after exposure. Blood was
collected in both EDTA and gel collection tubes. Bone marrow was aspirated from
femur bones. The left lobe of the liver and the kidneys were removed and collected
in formalin.
40036 Dycke, Kirsten.indd 161 11-04-16 11:02

Appendix 1
162
Microarray analysisRNA was extracted from all liver samples using the miRNeasy Mini Kit (Qiagen
Benelux, Venlo, The Netherlands). RNA concentrations were measured using a
NanoDrop ND-1000 Spectrophotometer (Nanodrop Technologies, Wilmington,
DE, USA), and RNA quality was assessed with an Agilent 2100 Bioanalyzer (Agilent
Technologies, Amstelveen, the Netherlands).
RNA was hybridized to Affymetrix HT Mouse Genome 430 PM Array plates
(Affymetrix Inc., Santa Clara, CA, USA) at the Microarray Department of the University
of Amsterdam, the Netherlands. In short, labeled cRNA samples were prepared
with the GeneChip 3” IVT express kit (Affymetrix) as described in the Affymetrix
GeneChip HT 3” IVT Express Technical Manual (Affymetrix), using 200 ng of purified
total RNA as template for the reaction. The array images were acquired using a
GeneChip HT Array Plate Scanner (Affymetrix) and analyzed with Affymetrix HT
software suite including expression console software (Affymetrix).
Data analysisThe raw data were subjected to a set of quality control checks. This quality check
excluded the presence of significant hybridization and experimental blocking
effects. All arrays passed quality control and were annotated according to de
Leeuw et al. (de Leeuw et al. 2008) and expression values were calculated using the
robust multi-array average (RMA) algorithm (Affy package, version 1.22.0; (Irizarry
et al. 2003)), available from the Bioconductor project (http://www.bioconductor.
org) for the R statistical language (http://cran.r-project.org). After normalization,
35,225 transcripts were used for Principal Component Analysis (PCA; produced in
R, version 2.13.1), including non-annotated transcripts and without cut-off for fold
change. All 35,225 transcripts were statistically analyzed for differential expression
using a mixed linear model with coefficients for each experimental group (Smyth
2004; Wolfinger et al. 2001). For each regime, a contrast analysis was applied to
compare each exposure time point with the vehicle control time point C0, and
to compare exposure time point T4 with the time-matched vehicle control C4.
For hypothesis testing, a permutation-based Fs test was used (Cui et al. 2005).
False discovery rate (FDR) correction per contrast was performed according to
Storey and Tibshirani (Storey and Tibshirani 2003), with an FDR<0.05 considered
as statistically significant. The gene expression results have been deposited in
the National Center for Biotechnology Information Gene Expression Omnibus
(Accession No. GSE46035).
40036 Dycke, Kirsten.indd 162 11-04-16 11:02

Time of day effect of CP
163
A1
Enrichment of selected gene lists was analyzed with MetaCore Pathway Maps from
GeneGo, Inc. (http://www.genego.com/). Gene expression data were imported
into Metacore using their NCBI Entrez GeneID as identifier; therefore, only genes
annotated with a GeneID in the current NCBI database were used for pathway
enrichment analysis. Pathways were considered significantly enriched with an
FDR<0.01. Gene Set Enrichment Analysis allowed us to identify significant up- or
downregulation of enriched gene sets (P<0.05 and FDR<0.25) (Mootha et al. 2003;
Subramanian et al. 2005).
Histology, blood and bone marrow analysisParaffin-embedded, formalin fixed liver and kidney sections were stained
with Hematoxylin and Eosin (H&E) for histopathological evaluation. Aspartate
aminotransferase (AST) and alanine aminotransferase (ALT) levels were determined
with an auto-analyzer (Cobas Fara, Roche Diagnostics, Woerden, the Netherlands),
using dedicated kits from Roche Diagnostics. EDTA blood and bone marrow cells,
aspirated from femur bones with impulse cytophotometer solution (composed
as described previously in (Tonk et al. 2010)), were analyzed automatically using
the ADVIA 2120 (Siemens, Deerfield, USA). Bone marrow cytospin slides (Shandon
Cytospin 2, Thermo Fisher Scientific, Waltham, USA) were fixed with methanol,
stained according to May Grunwald and Giemsa and analyzed according to OECD
Test Guideline 474, Mammalian Erythrocyte Micronucleus Test (OECD). In short,
2000 polychromatic erythrocytes (PCEs) were scored per animal for the incidence
of micronucleated PCEs (MNPCEs). To determine myelotoxicity, 500 polychromatic
and normochromatic cells (NCE) were scored (PCE/NCE ratio).
All parameter values are represented as means ± SD, where appropriate. Statistical
analyses were performed using GraphPad Prism version 6.02 for Windows,
(GraphPad Software, La Jolla, California, USA). Comparisons between groups were
performed with one-way ANOVA or two-way ANOVA followed Dunnet’s test for
dose groups and Sidak’s test for differences between ZTs. P-values smaller than
0.05 were considered statistically significant.
40036 Dycke, Kirsten.indd 163 11-04-16 11:02

Appendix 1
164
Results
Gene expression analysis - general impressionMale C57BL/6 mice, kept under a 12-hr light/12-hr dark cycle, were exposed to
cyclophosphamide (CP, 300 mg/kg body weight i.p.) at two different times during
the day, i.e. ZT8 and ZT20. Zeitgeber Time (ZT) is a standard experimental time
based on the period of the Zeitgeber, which under aforementioned light regime
equals a normal 24-hr day, and in which ZT0 represents “lights on” and ZT12 “lights
off”. At 0.5, 1, 2 and 4 hours after CP treatment (T0.5, T1, T2 and T4), and 0 and
4 hours after vehicle treatment (C0 and C4), animals were sacrificed and livers
were collected for gene expression analysis. To obtain a general impression of the
changes in transcription upon exposure to CP at different times of day, we first
visualized the overall response using Principal Component Analysis (PCA) (Figure
1). This analysis revealed two distinct clusters, reflecting exposure at the light (ZT8,
left half panel) and dark (ZT20, right half panel) phase, with the response becoming
stronger over time after exposure (C0, T0.5, T1, T2 and T4 top down). In addition,
differences in gene expression between the various time points appeared to be
more pronounced after exposure during the light phase (see Figure 1, left panel).
From these results, especially those for C4-T4, we conclude that time of day of
exposure has a significant impact on the overall response to CP exposure.
Analysis of differentially expressed genes and pathway enrichmentWe subsequently analyzed the gene expression data following a commonly used
toxicological approach, with ZT8-C0 and ZT20-C0 (time-zero) as the control time
points. Differences in hepatic gene expression between CP-treated animals and
the vehicle controls were calculated using a one-way ANOVA with an FDR<0.05.
This analysis resulted in an increasing number of differentially expressed genes
(DEGs) over time, with the highest number of DEGs observed 4 hours after
exposure: 5,837 and 2,942 DEGs (including non-annotated genes) at ZT8-T4 and
ZT20-T4, respectively (Figure 2).
40036 Dycke, Kirsten.indd 164 11-04-16 11:02

Time of day effect of CP
165
A1
Figure 1. Principal Component Analysis using data of all genes. This analysis revealed two distinct clusters, representing the differential response of the genome to cyclophosphamide exposure at different times of day, ZT8 (circles) and ZT20 (triangles). The response was stronger over time after exposure (C0 to T4, top down); gene expression differences between various time points were more pronounced upon light phase exposure (left half panel). Open and closed symbols represent vehicle control and exposed samples, respectively.
Figure 2. Differentially expressed genes time-zero analysis. The number of differentially expressed genes, including non-annotated genes (DEGs; FDR<0.05) in the liver of CP-treated animals compared to those of vehicle controls obtained at C0. The number of DEGs increases over time, both for animals exposed during the light (ZT8, open bars) and the dark phase (ZT20, dashed bars). However, the number of significantly regulated genes is two- to four-fold lower upon exposure at ZT20 compared to animals exposed at ZT8.
40036 Dycke, Kirsten.indd 165 11-04-16 11:02

Appendix 1
166
Despite identical exposure, two to four times as many DEGs were found when
animals were exposed at ZT8, as compared to exposure at ZT20. To investigate
whether the observed differences in the number of significantly regulated genes
also resulted in a different biological response, enrichment analyses of MetaCore
Pathways was performed. Gene Set Enrichment Analysis (GSEA) was used to obtain
an impression of up or down regulation of pathway groups. Since we observed
the highest number of significantly expressed genes 4 hours after exposure, we
focused on this time point. For these analyses, 4,089 and 2,084 DEGs (excluding
non-annotated genes) were used as input for ZT8 and ZT20, respectively. CP
exposure at ZT8 caused differential regulation of 125 pathways (Supplementary
Table S1a), most of which are consistent with the known effects of CP: genotoxicity,
oxidative stress, and immune modulation (Hussain et al. 2013; Rehman et al.
2012; Tripathi and Jena 2008). We found induction of the ATM/ATR pathway and
downregulation of pathways involved in cell cycle regulation, which are typically
associated with a DNA damage response invoked by the alkylating properties
of CP. Besides DNA damage, CP clearly induced oxidative stress as identified by
the overrepresentation and upregulation of intracellular signaling cascades such
as NF-ƙB, JAK/STAT, AKT/PI3K and MAPK pathways, all known to be activated
by oxidative stress. In addition, cell adhesion and cytoskeleton pathways were
enriched, probably in response to oxidative stress induced protein degradation.
The liver is predominantly an organ of innate immunity, favoring a general defense
response to stressors. Induction of several cytokine pathways, such as IL-1 and IL-6,
is indicative of this general immune or stress response. This response is most likely
coming from liver sinusoidal endothelial cells (LSEC) and Kupffer cells, which are
known to be more sensitive to CP than hepatocytes (DeLeve 1996).
Exposure at ZT20 resulted in a far lower number of significantly responding
pathways (i.e. 52 versus 125, see Supplementary Table S1b), which nonetheless
share a strong overall similarity to those observed upon exposure at ZT8.
Apparently, the response of the hepatic transcriptome is markedly weaker after
CP treatment at ZT20. Interestingly, a DNA damage response, clearly visible at ZT8,
was not significantly activated at ZT20 when using significantly regulated genes as
input (Supplementary Table S1b). The observed differences in pathway regulation
between the two time points may be due to the difference in number of genes
used as input for the enrichment analyses. We therefore matched the number of
input genes for ZT20 with ZT8, and used the top 4,089 genes (ranked according
40036 Dycke, Kirsten.indd 166 11-04-16 11:02

Time of day effect of CP
167
A1
to FDR). This more balanced approach not only yielded an increased number of
pathways (from 52 up to 188), but, more importantly, also revealed a pattern of
responsive pathways that is similar to the one observed for ZT8 (Supplementary
Table S1c and S1a, respectively). Overall, for both time points, the DNA damage,
oxidative stress and immune response as described above could be identified
using this approach. Taken together, these pathway analyses suggest that the
response to CP exposure at ZT20 is comparable to the response observed at ZT8,
but that the effects in terms of gene expression changes are much stronger at ZT8.
Time-matched analysis of differentially expressed genes and pathway enrichmentAs evident from the PCA plot (Figure 1), the factor time of day of exposure resulted
in a distinct expression profile, since the profiles of the control group at time point
t=0 hours (C0) were markedly different from those at time point t=4 hours (C4),
both for ZT8 and ZT20. This indicates that also in non-exposed animals gene
expression patterns change over time, which is likely attributed to circadian clock
progression. Accordingly, the commonly time-zero analysis (as presented in the
previous section) identifies a mixture of (i) circadian clock controlled genes, (ii)
CP responsive genes, and (iii) expression of circadian genes influenced by CP
exposure. To take into account the circadian regulation of gene expression, we
repeated the aforementioned analyses with time-matched controls, 4 hours after
exposure (C4). As expected, this time-matched analysis resulted in a lower number
of DEGs for both ZT8 and ZT20, due to exclusion of genes that are under control
of the circadian clock and do not respond to CP. We cross-referenced DEGs for
time-zero analysis and time-matched analysis with clock controlled genes from 5
different literature data sets (Akhtar et al. 2002; Hughes et al. 2010; Miller et al. 2007;
Panda et al. 2002; Ueda et al. 2002). A loss of circadian regulated genes using the
time-matched analysis was observed. Remaining differentially expressed genes
are a mixture of CP responsive genes and circadian genes affected by CP exposure
The number of DEGS, however, remained higher at ZT8 than at ZT20, i.e. 2,015
versus 179 DEGs (including non-annotated genes) (Supplementary Figure S1).
To illustrate the effect of time-matched analysis in comparison to the time-
zero analysis, we examined the cytochrome P450 genes involved in the
biotransformation of CP (Cyp2b10, Cyp2c29, and Cyp3a13; the mouse homologues
of human CYP2B6, CYP2C9 and CYP3A4/5, respectively). Although, these genes
40036 Dycke, Kirsten.indd 167 11-04-16 11:02

Appendix 1
168
Figure 3. Cytochrome P450 gene expression upon CP exposure. Expression of cytochrome P450 genes encoding enzymes involved in the metabolism of CP (Cyp2b10, Cyp2c29, and Cyp3a13; the mouse homologues of CYP2B6, CYP2C9 and CYP3A4/5, respectively) A. Fold Ratio (FR) of liver gene expression in CP-treated animals compared to that of vehicle control animals obtained at C0. All genes showed a time-dependent response to CP treatment from 0.5 until 4 hours after exposure. However, the magnitude of the response differed between light phase (ZT8) and dark phase exposure (ZT20). B. FR of liver gene expression
40036 Dycke, Kirsten.indd 168 11-04-16 11:02

Time of day effect of CP
169
A1
of CP-treated animals 4 hours after exposure compared to time-matched vehicle controls obtained at C4. Only a marginal difference in Cyp2c29 gene expression induction seemed to be caused by time of day of exposure. Cyp2b10 and Cyp3a13 show no difference in gene expression between circadian phases upon CP exposure.
were significantly induced at both ZT8 and ZT20 when using time-zero controls,
fold ratios (induction) clearly differed between ZT8 and ZT20 exposure (Figure 3A).
However, time-matched analysis of the expression levels of these CP metabolizing
cytochrome P450 genes revealed that induction levels were comparable at both
circadian phases (Figure 3B). Other examples of genes for which a time-matched
analysis affects fold ratio differences between ZT8 and ZT20 exposed animals, in
comparison to time-zero analyses are shown in Supplementary Figure S2.
Analyses directed towards functional enrichment showed 79 significantly
responsive pathways for treatment at ZT8 (1,353 annotated genes, FDR<0.01 for
significant pathways; Supplementary Table S2a), of which 51 overlapped with
those found at this treatment time in the previous C0 control based pathway
analysis. The observed 79 pathways included pathways involved in DNA damage
response, as well as oxidative stress related pathways such as NF-ƙB and MAPK
signaling. However, cell adhesion and cytoskeleton remodeling pathways
associated with oxidative stress induced protein damage were not as pronounced
as compared to the analysis using C0 as a control. On the other hand, immune
related pathways showed a comparable induction as previously found. We did not
find any functional enrichment at ZT20, owing to the low number of input genes,
i.e. 112 annotated genes. Use of an equal number (top 1,353; ranked according
to FDR) of input genes resulted in only eight significantly enriched pathways
that, not surprisingly, only marginally reflect a response typical for CP exposure
(Supplementary Table S2c).
Thus, the use of time-matched controls uncovered marked differences in the
transcriptomic response of the liver when exposed at ZT20 and ZT8. Exposure at
ZT8 induced an unambiguous CP response, whereas the known CP effects could
hardly be detected after exposure at ZT20.
Time-zero versus time-matched analysis of pathway enrichmentThe pathway analyses described in the previous sections, using either time-zero
(C0) or time-matched (C4) controls, were performed with a different number of
input genes, which hampers a direct comparison of their effect. We therefore re-
40036 Dycke, Kirsten.indd 169 11-04-16 11:02

Appendix 1
170
analyzed enrichment of responsive biological pathways for the time-zero data set,
using the same number of input genes as used for the time-matched analysis.
Using the top 1,353 annotated genes, we still noticed a strong CP mediated toxic
response after treatment at ZT8, as evident from the enrichment in DNA damage,
oxidative stress and immune responsive pathways, while such response now
appeared virtually absent when mice were treated at ZT20 (Supplementary Table
S3a and S3b, respectively). A comparison of the number of significantly enriched
MetaCore Pathways Maps, grouped per biological theme (Table 1) reveals that a
reduced number of input genes for the time zero analysis results in a differential
response at ZT8 and ZT20 that matches well with that observed when time-
matched controls are used. Taken together, our study, especially our time-matched
analysis, has shown that although CP exposure induces cytochrome P450 gene
expression equally at ZT8 and ZT20, a robust transcriptional response of the liver
is only visible at ZT8.
Table 1. Summary of MetaCore Pathway Maps enrichment
C0 controls C4 controls
ZT8 ZT20 ZT8 ZT20
Oxidative stress response 36 6 35 2
Immune response 17 1 20 0
DNA damage response 14 0 14 4
Other 2 0 0 2
Number of significantly enriched MetaCore Pathways Maps, grouped per biological
theme. Top 1,353 genes (ranked based on FDR) were used as input for this analysis.
Unless stated otherwise, pathways were grouped based on the main MetaCore
Pathway biological function groups (Supplementary Tables S1b and S1c).
Acute toxicity effectsTo correlate the observed changes in gene expression to more traditional
toxicological endpoints, we conducted an acute toxicity experiment with a similar
study design as used for the transcriptomics study. Animals were exposed to a
single dose of 0, 30, 100 or 300 mg/kg CP at ZT8 or ZT20 and sacrificed 24 and 72
hours after treatment. Body and organ weights were collected, and white blood
cell (WBC) counts and micronuclei formation were determined. In addition, we
performed a histopathological analysis of the liver and kidneys. Adverse effects of
CP became apparent by body weight loss at the highest doses of CP, irrespective
40036 Dycke, Kirsten.indd 170 11-04-16 11:02

Time of day effect of CP
171
A1
of whether animals were treated at ZT8 or ZT20 (Supplementary Figure S3). We
also observed a slight, dose dependent decrease in kidney weight at 72 hours
after exposure in the ZT8 group, whereas no such effect was seen in the ZT20
group (Supplementary Figure S4). Histopathology of the kidney, however, did not
reveal any abnormalities in both groups. Likewise, we did not find any effect of
CP exposure on the liver for all parameters examined. Liver weight loss was not
observed (Supplementary Figure S5), and analysis of histopathology and serum
levels of the toxicity serum marker enzymes ALT and AST did not reveal any
abnormalities (data not shown).
However, CP exposure at ZT8 and at ZT20 resulted in a dose dependent decrease
in the overall number of white blood cells (Supplementary Table S4). This is largely
accounted for by a loss of lymphocytes, which showed a very similar response
(Figure 4). Exposure to a low dose of CP at ZT8 caused a significantly stronger
reduction in the number of lymphocytes after 24 hours than exposure at ZT20.
This effect however was no longer observed 72 hours after exposure. In bone
marrow, CP exposure resulted in a dose dependent induction of micronucleated
polychromatic erythrocytes (MNPCEs), a well-accepted parameter for genotoxicity,
except for the highest dose group (Supplementary Figure S6). Lack of micronuclei
formation at this dose is most likely due to myelotoxicity as indicated by the
decreased PCE/NCE ratio (Supplementary Figure S6). Despite the clear effect of
CP exposure on micronuclei formation, we did not find a difference in micronuclei
induction between the two ZT groups.
40036 Dycke, Kirsten.indd 171 11-04-16 11:02

Appendix 1
172
Figure 4. Lymphocyte counts in peripheral blood of CP exposed mice. Lymphocyte counts were measured 24 and 72 hours after exposure. Counts are depicted relative to vehicle controls per circadian phase, values represent mean ± sd. Exposure to 30 mg/kg CP at ZT8 significantly more reduced the number of lymphocytes at 24 hours than in the ZT20 exposed animal (Sidak's multiple comparisons test, P<0.05).
Discussion
In toxicogenomic studies time of day of exposure of an animal to a (geno)toxic
chemical is usually not taken into account. However, it has become evidently clear
that the time of day of exposure can markedly influence the magnitude of the
biological response, which is referred to as chronotoxicity (Levi et al. 2010; Levi
and Schibler 2007), and which can be expected to translate into pronounced
differences in the outcome of transcriptomics experiments (Destici et al. 2009).
Likewise, with 10% of the active genes in a tissue being controlled by the clock,
40036 Dycke, Kirsten.indd 172 11-04-16 11:02

Time of day effect of CP
173
A1
one can envisage that the choice of the control time point (i.e. a time-zero control,
taken at the start of exposure, or a time-matched control, taken when the animal
is sacrificed) can be of influence. In the current study, we addressed the impact of
the circadian clock on toxicogenomics experiments by exposing mice to a single
dose of cyclophosphamide (CP) at defined time-points during the day (ZT8) and
night (ZT20) and analyzing the response of the liver transcriptome.
Initially, following a commonly used toxicological approach that uses the zero
time points as a control, we observed a more than two-fold stronger response of
the liver transcriptome at ZT8 compared to ZT20, as evident from the number of
significantly differentially expressed genes (5,837 versus 2,942 DEGs). Subsequent
pathway analysis with the top 4,098 annotated genes revealed common CP
toxicity associated responses (i.e. DNA damage response, oxidative stress and
immune related pathways (Hussain et al. 2013; Rehman et al. 2012; Tripathi and
Jena 2008)), independent of the time of exposure. As expected, when repeating
the analysis using time-matched controls, we observed an overall reduction of the
number of differentially expressed genes at both ZT8 (from 5,837 to 2,015 DEGs)
and ZT20 (from 2,942 to 179 DEGs), partially because we filtered out the clock-
controlled, CP non-responsive DEGs. Strikingly, this approach uncovered a massive
impact of time of day effect of CP exposure on the hepatic transcriptome, being
10-fold more responsive at ZT8 than at ZT20 (2,015 versus 179 DEGs). Moreover,
after subjecting the top 1,353 annotated genes to pathway enrichment analysis,
the DNA damage, immune and oxidative stress responses, remained clearly
visible at ZT8, but were markedly less intense (DNA damage response), or virtually
absent (immune and oxidative stress response) at ZT20. Apparently, when time-
matched controls are omitted, circadian clock progression during the experiment
can partially blur the outcome of these experiments when DEGs are applied for
functional analysis. However, the identified responsive pathways using an equal
number of input genes as shown in Table 1 clearly show that the difference in liver
responsiveness to CP can be identified using C0 and C4 controls.
Our transcriptomics data point towards an increased responsiveness of the liver
to CP exclusively during the light phase. Upon exposure at ZT8, we observed a
marked induction of CP toxicity related pathways, whereas virtually no such
pathways were found for animals exposed at ZT20. Thus, the challenging question
arises which (clock-controlled) mechanisms are underlying this day and night
40036 Dycke, Kirsten.indd 173 11-04-16 11:02

Appendix 1
174
difference in CP sensitivity. We have shown that CP exposure at ZT8 or ZT20 results
in a comparable upregulation of Cyp2b10, Cyp3a13 and Cyp2c29 expression, which
implies that the rate of CP metabolization does not depend on the time of drug
administration. Indeed, a pharmacokinetics study of Gorbacheva and coworkers
has shown that the formation and clearance of CP metabolites does not show
time of day dependency [38]. Accordingly, the presence and absence of a CP-
mediated toxic response at ZT8 and ZT20, respectively, is unlikely to originate from
differences in the induction of DNA damage and rather relates to a differential
magnitude of downstream events such as DNA damage signaling, DNA repair and
apoptosis.
It has been suggested that all aspects of the cellular response to DNA damage are
controlled or influenced by the circadian clock (Sancar et al. 2010). The CLOCK/
BMAL1 complex positively regulates the expression of the p21 gene, which plays
a critical role in the G1/S checkpoint (Grechez-Cassiau et al. 2008) as well as the
p53 gene, involved in DNA damage initiated or intrinsic apoptosis pathways
(Mullenders et al. 2009). Both p21 and p53 show low expression at the light dark
transition in the Mouse1.OST dataset of the CircaDB database (http://circadb.org)
(Pizarro et al. 2013). As Bmal1 gene expression is also at its lowest around ZT12, it
is tempting to speculate that this implies low expression of CLOCK/BMAL1 target
genes at ZT8, which in turn results in a greater dynamic range for the CP response.
This would fit with the observation that circadian clock deficient Cry1/Cry2 double
knockout mice (constitutive high expression of E-box genes) are more tolerant to
CP, while Clock mutant and Bmal1 knockout mice (constitutive low expression of
E-box genes) appear to be more sensitive (Gorbacheva et al. 2005).
Various animal studies have demonstrated that the time of administration can
cause changes in the biological outcome upon exposure to CP and some other
chemotherapeutic agents (Blumenthal et al. 2001; Gorbacheva et al. 2005; Granda
et al. 2001; Ohdo 2010). Compounds like celocoxib, doxorubicin and docetaxel were
best tolerated during the light phase, around ZT7 (Blumenthal et al. 2001; Granda
et al. 2001). Also for CP, wild type mice seemed to be more tolerant when exposed
at the end of the light phase (i.e. ZT10-ZT14) than when exposed at the end of the
dark phase (i.e. ZT18-ZT2), as demonstrated by a higher mortality rate (Gorbacheva
et al. 2005). Remarkably, our transcriptomics data contrast these survival data in
that the liver appears more sensitive to CP during the light phase. Upon exposure
at ZT8, we observed activation of CP toxicity related pathways, whereas virtually no
40036 Dycke, Kirsten.indd 174 11-04-16 11:02

Time of day effect of CP
175
A1
such pathways were induced in the liver of animals exposed during the dark phase
(ZT20). This increase in sensitivity is supported by the slightly lower lymphocyte
counts in ZT8 exposed animals as compared to ZT20 exposed animals. In contrast,
the increased responsiveness of hepatic gene expression could be an enhanced
adaptive response to CP induced toxicity. As a result, ZT8 exposed animals are
better primed to CP exposure. Using gene-expression, we cannot differentiate
between increased sensitivity or enhanced adaptive response. Although we used
the same mouse strain, a major difference between our study and the study by
Gorbacheva and co-workers is the number of doses used. We employed a single
dose, whereas studies by Gorbacheva et al. were done using multiple doses of CP.
In addition, the time points used for the resting and the active phase were slightly
different: we used ZT8/ZT20 instead of ZT10-14/ZT22-2 as used by Gorbacheva,
respectively.
Despite the substantial changes in hepatic gene expression, we did not observe
pathological changes in the liver of CP exposed mice. CP exposure has been
reported to change the ultrastructural organization of the hepatocytes and SECs
(Lushnikova et al. 2011). Probably, a single dose is not able to induce pathological
changes or, alternatively, these changes only may become apparent at later
time points. C57Bl6 mice have been reported to be less sensitive to CP-induced
hepatoxicity than other mouse strains (Anton 1993). Other parameters, however,
such as body weight, kidneys weights, white blood cell counts (WBC) and
micronuclei induction were affected by CP exposure. CP is well-known for its toxic
effects, including immunosuppression and DNA damage induction (Emadi et al.
2009), as also uncovered by our transcriptomics study. For example, CP has been
reported to induce toxicity to B lymphocytes (Colvin 1999). Although in our study
lymphocytes were not differentiated, the decrease in WBC could be contributed
to the decrease in all lymphocytes. Overall, ZT8 exposed mice appeared to be
somewhat more sensitive than ZT20 animals. These findings indicate that gene
expression, in comparison to more traditional toxicity parameters, is more sensitive
to time of day effects. Possibly, the observed differences in transcription do become
apparent in apical end points at later time points.
In conclusion, this study highlights the importance of time of day in toxicity
testing, especially in toxicogenomics studies. To our knowledge, exposures in in
vivo rodent studies occur mainly during the day, which is comparable with ZT8
40036 Dycke, Kirsten.indd 175 11-04-16 11:02

Appendix 1
176
exposure in our study. For risk-assessment purposes, it is of the utmost importance
to evaluate the worst-case scenario when estimating the risk of adverse health
effects induced by environmental chemicals. For assessment of CP toxicity in mice,
this seems to be exposure during the day. Whether ZT8 is the most sensitive time
point, and whether this sensitivity to toxic effects of chemicals is higher in mice
during the light phase in general, warrants further investigation. From a regulatory
point of view, it would also be worthwhile to examine possible effects of the
circadian clock on the outcome of in vitro toxicity tests. Furthermore, circadian
sensitivity to pharmaceuticals might also be beneficial when used in a clinical
setting, to minimize adverse effects and maximize efficacy, as has been shown for
certain anti-cancer drugs (Levi et al. 2011). Thus, considering the circadian clock in
toxicity testing might eventually lead to improved risk assessment and a more safe
use of chemical substances, as well as to improved medicine use.
40036 Dycke, Kirsten.indd 176 11-04-16 11:02

Time of day effect of CP
177
A1
ReferencesAkhtar RA, Reddy AB, Maywood ES, et al. (2002) Circadian cycling of the mouse liver transcriptome, as
revealed by cDNA microarray, is driven by the suprachiasmatic nucleus. Current biology : CB 12(7):540-50 doi:S0960982202007595 [pii]
Anton E (1993) Differential sensitivity of DBA/2 and C57BL/6 mice to cyclophosphamide. Journal of applied toxicology : JAT 13(6):423-7
Balsalobre A, Damiola F, Schibler U (1998) A serum shock induces circadian gene expression in mammalian tissue culture cells. Cell 93(6):929-37 doi:S0092-8674(00)81199-X [pii]
Blumenthal RD, Waskewich C, Goldenberg DM, Lew W, Flefleh C, Burton J (2001) Chronotherapy and chronotoxicity of the cyclooxygenase-2 inhibitor, celecoxib, in athymic mice bearing human breast cancer xenografts. Clinical cancer research : an official journal of the American Association for Cancer Research 7(10):3178-85
Bozek K, Relogio A, Kielbasa SM, et al. (2009) Regulation of clock-controlled genes in mammals. PloS one 4(3):e4882 doi:10.1371/journal.pone.0004882
Colvin OM (1999) An overview of cyclophosphamide development and clinical applications. Current pharmaceutical design 5(8):555-60
Cui X, Hwang JT, Qiu J, Blades NJ, Churchill GA (2005) Improved statistical tests for differential gene expression by shrinking variance components estimates. Biostatistics 6(1):59-75 doi:6/1/59 [pii] 10.1093/biostatistics/kxh018
de Leeuw WC, Rauwerda H, Jonker MJ, Breit TM (2008) Salvaging Affymetrix probes after probe-level re-annotation. BMC Res Notes 1:66 doi:10.1186/1756-0500-1-66 1756-0500-1-66 [pii]
DeLeve LD (1996) Cellular target of cyclophosphamide toxicity in the murine liver: role of glutathione and site of metabolic activation. Hepatology 24(4):830-7 doi:10.1002/hep.510240414
Destici E, Oklejewicz M, Nijman R, Tamanini F, van der Horst GT (2009) Impact of the circadian clock on in vitro genotoxic risk assessment assays. Mutat Res 680(1-2):87-94 doi:10.1016/j.mrgentox.2009.09.001
Emadi A, Jones RJ, Brodsky RA (2009) Cyclophosphamide and cancer: golden anniversary. Nature reviews Clinical oncology 6(11):638-47 doi:10.1038/nrclinonc.2009.146
Gachon F, Olela FF, Schaad O, Descombes P, Schibler U (2006) The circadian PAR-domain basic leucine zipper transcription factors DBP, TEF, and HLF modulate basal and inducible xenobiotic detoxification. Cell metabolism 4(1):25-36 doi:10.1016/j.cmet.2006.04.015
Gorbacheva VY, Kondratov RV, Zhang R, et al. (2005) Circadian sensitivity to the chemotherapeutic agent cyclophosphamide depends on the functional status of the CLOCK/BMAL1 transactivation complex. Proc Natl Acad Sci U S A 102(9):3407-12 doi:0409897102 [pii] 10.1073/pnas.0409897102
Granda TG, Filipski E, D’Attino RM, et al. (2001) Experimental chronotherapy of mouse mammary adenocarcinoma MA13/C with docetaxel and doxorubicin as single agents and in combination. Cancer research 61(5):1996-2001
Grechez-Cassiau A, Rayet B, Guillaumond F, Teboul M, Delaunay F (2008) The circadian clock component BMAL1 is a critical regulator of p21WAF1/CIP1 expression and hepatocyte proliferation. J Biol Chem 283(8):4535-42 doi:10.1074/jbc.M705576200
Hales BF (1982) Comparison of the mutagenicity and teratogenicity of cyclophosphamide and its active metabolites, 4-hydroxycyclophosphamide, phosphoramide mustard, and acrolein. Cancer research 42(8):3016-21
Hill DL, Laster WR, Jr., Struck RF (1972) Enzymatic metabolism of cyclophosphamide and nicotine and production of a toxic cyclophosphamide metabolite. Cancer research 32(4):658-65
Hughes ME, Hogenesch JB, Kornacker K (2010) JTK_CYCLE: an efficient nonparametric algorithm for detecting rhythmic components in genome-scale data sets. Journal of biological rhythms 25(5):372-80 doi:10.1177/0748730410379711
Hussain A, Shadma W, Maksood A, Ansari SH (2013) Protective effects of Picrorhiza kurroa on cyclophosphamide-induced immunosuppression in mice. Pharmacognosy research 5(1):30-5 doi:10.4103/0974-8490.105646
Irizarry RA, Hobbs B, Collin F, et al. (2003) Exploration, normalization, and summaries of high density oligonucleotide array probe level data. Biostatistics 4(2):249-64 doi:10.1093/biostatistics/4.2.249 4/2/249 [pii]
40036 Dycke, Kirsten.indd 177 11-04-16 11:02

Appendix 1
178
Kern JC, Kehrer JP (2002) Acrolein-induced cell death: a caspase-influenced decision between apoptosis and oncosis/necrosis. Chem Biol Interact 139(1):79-95 doi:S0009279701002952 [pii]
King PD, Perry MC (2001) Hepatotoxicity of chemotherapy. Oncologist 6(2):162-76
Ko CH, Takahashi JS (2006) Molecular components of the mammalian circadian clock. Hum Mol Genet 15 Spec No 2:R271-7 doi:15/suppl_2/R271 [pii] 10.1093/hmg/ddl207
Kumaki Y, Ukai-Tadenuma M, Uno KD, et al. (2008) Analysis and synthesis of high-amplitude Cis-elements in the mammalian circadian clock. Proc Natl Acad Sci U S A 105(39):14946-51 doi:10.1073/pnas.0802636105
Lee C, Etchegaray JP, Cagampang FR, Loudon AS, Reppert SM (2001) Posttranslational mechanisms regulate the mammalian circadian clock. Cell 107(7):855-67 doi:S0092-8674(01)00610-9 [pii]
Levi F, Karaboue A, Gorden L, et al. (2011) Cetuximab and circadian chronomodulated chemotherapy as salvage treatment for metastatic colorectal cancer (mCRC): safety, efficacy and improved secondary surgical resectability. Cancer chemotherapy and pharmacology 67(2):339-48 doi:10.1007/s00280-010-1327-8
Levi F, Okyar A, Dulong S, Innominato PF, Clairambault J (2010) Circadian timing in cancer treatments. Annual review of pharmacology and toxicology 50:377-421 doi:10.1146/annurev.pharmtox.48.113006.094626
Levi F, Schibler U (2007) Circadian rhythms: mechanisms and therapeutic implications. Annual review of pharmacology and toxicology 47:593-628 doi:10.1146/annurev.pharmtox.47.120505.105208
Lowrey PL, Takahashi JS (2011) Genetics of circadian rhythms in Mammalian model organisms. Advances in genetics 74:175-230 doi:10.1016/B978-0-12-387690-4.00006-4
Ludeman SM (1999) The chemistry of the metabolites of cyclophosphamide. Current pharmaceutical design 5(8):627-43
Lushnikova EL, Molodykh OP, Nepomnyashchikh LM, Bakulina AA, Sorokina YA (2011) Ultrastructurural picture of cyclophosphamide-induced damage to the liver. Bulletin of experimental biology and medicine 151(6):751-6
Miller BH, McDearmon EL, Panda S, et al. (2007) Circadian and CLOCK-controlled regulation of the mouse transcriptome and cell proliferation. Proc Natl Acad Sci U S A 104(9):3342-7 doi:0611724104 [pii]
10.1073/pnas.0611724104
Mohawk JA, Green CB, Takahashi JS (2012) Central and peripheral circadian clocks in mammals. Annual review of neuroscience 35:445-62 doi:10.1146/annurev-neuro-060909-153128
Mootha VK, Lindgren CM, Eriksson KF, et al. (2003) PGC-1alpha-responsive genes involved in oxidative phosphorylation are coordinately downregulated in human diabetes. Nat Genet 34(3):267-73 doi:10.1038/ng1180
Mullenders J, Fabius AW, Madiredjo M, Bernards R, Beijersbergen RL (2009) A large scale shRNA barcode screen identifies the circadian clock component ARNTL as putative regulator of the p53 tumor suppressor pathway. PloS one 4(3):e4798 doi:10.1371/journal.pone.0004798
OECD Test No. 474: Mammalian Erythrocyte Micronucleus Test. OECD Publishing
Ohdo S (2010) Chronopharmaceutics: pharmaceutics focused on biological rhythm. Biological & pharmaceutical bulletin 33(2):159-67
Panda S, Antoch MP, Miller BH, et al. (2002) Coordinated transcription of key pathways in the mouse by the circadian clock. Cell 109(3):307-20 doi:S0092867402007225 [pii]
Paschos GK, Baggs JE, Hogenesch JB, FitzGerald GA (2010) The role of clock genes in pharmacology. Annual review of pharmacology and toxicology 50:187-214 doi:10.1146/annurev.pharmtox.010909.105621
Pizarro A, Hayer K, Lahens NF, Hogenesch JB (2013) CircaDB: a database of mammalian circadian gene expression profiles. Nucleic Acids Res 41(Database issue):D1009-13 doi:10.1093/nar/gks1161
Rehman MU, Tahir M, Ali F, et al. (2012) Cyclophosphamide-induced nephrotoxicity, genotoxicity, and damage in kidney genomic DNA of Swiss albino mice: the protective effect of Ellagic acid. Mol Cell Biochem 365(1-2):119-27 doi:10.1007/s11010-012-1250-x
Reppert SM, Weaver DR (2001) Molecular analysis of mammalian circadian rhythms. Annu Rev Physiol 63:647-76 doi:10.1146/annurev.physiol.63.1.647 63/1/647 [pii]
Reppert SM, Weaver DR (2002) Coordination of circadian timing in mammals. Nature 418(6901):935-41 doi:10.1038/nature00965 nature00965 [pii]
Sancar A, Lindsey-Boltz LA, Kang TH, Reardon JT, Lee JH, Ozturk N (2010) Circadian clock control of the cellular response to DNA damage. FEBS letters 584(12):2618-25 doi:10.1016/j.febslet.2010.03.017
40036 Dycke, Kirsten.indd 178 11-04-16 11:02

Time of day effect of CP
179
A1
Smyth GK (2004) Linear models and empirical bayes methods for assessing differential expression in microarray experiments. Stat Appl Genet Mol Biol 3:Article3 doi:10.2202/1544-6115.1027
Storch KF, Lipan O, Leykin I, et al. (2002) Extensive and divergent circadian gene expression in liver and heart. Nature 417(6884):78-83 doi:10.1038/nature744 nature744 [pii]
Storey JD, Tibshirani R (2003) Statistical significance for genomewide studies. Proc Natl Acad Sci U S A 100(16):9440-5 doi:10.1073/pnas.1530509100
Subramanian A, Tamayo P, Mootha VK, et al. (2005) Gene set enrichment analysis: a knowledge-based approach for interpreting genome-wide expression profiles. Proc Natl Acad Sci U S A 102(43):15545-50 doi:10.1073/pnas.0506580102
Tonk EC, de Groot DM, Penninks AH, et al. (2010) Developmental immunotoxicity of methylmercury: the relative sensitivity of developmental and immune parameters. Toxicological sciences : an official journal of the Society of Toxicology 117(2):325-35 doi:10.1093/toxsci/kfq223
Tripathi DN, Jena GB (2008) Ebselen attenuates cyclophosphamide-induced oxidative stress and DNA damage in mice. Free radical research 42(11-12):966-77 doi:10.1080/10715760802566558
Ueda HR, Chen W, Adachi A, et al. (2002) A transcription factor response element for gene expression during circadian night. Nature 418(6897):534-9 doi:10.1038/nature00906
Weaver DR (1998) The suprachiasmatic nucleus: a 25-year retrospective. J Biol Rhythms 13(2):100-12
Welsh DK, Takahashi JS, Kay SA (2010) Suprachiasmatic nucleus: cell autonomy and network properties. Annu Rev Physiol 72:551-77 doi:10.1146/annurev-physiol-021909-135919
Wolfinger RD, Gibson G, Wolfinger ED, et al. (2001) Assessing gene significance from cDNA microarray expression data via mixed models. J Comput Biol 8(6):625-37 doi:10.1089/106652701753307520
Yan J, Wang H, Liu Y, Shao C (2008) Analysis of gene regulatory networks in the mammalian circadian rhythm. PLoS Comput Biol 4(10):e1000193 doi:10.1371/journal.pcbi.1000193
40036 Dycke, Kirsten.indd 179 11-04-16 11:02

40036 Dycke, Kirsten.indd 180 11-04-16 11:02

APPENDIX 2
Supplemental data
40036 Dycke, Kirsten.indd 181 11-04-16 11:02

Appendix 2
182
Supplemental data Chapter 2
Figure S1. For the cross-sectional study (a) the differences in body weight increase between the groups was not significant (RM-ANOVA, group: F(1, 40) = 2.255, p=0.1410; time: F(17, 680) = 53.74, p<0.0001; interaction: F(17, 680) = 1.046, p=0.4049). The body weight gain is expressed relative to the body weights of animals at the start of the experiment (mean + SEM). (b) Food intake was slightly, but significantly (Two-way ANOVA, group: F(7, 108) = 0.4663, p<0.0001), lower in the animals kept under LD-inversion conditions (open bars) compared to the LD controls (closed bars) (*Sidak’s posttest p<0.05).
40036 Dycke, Kirsten.indd 182 11-04-16 11:02

Supplemental data
183
A2
Figure S2. Left and right panels show sleep timing for LD controls at different days of the week and animals exposed to LD-inversions at different days after an LD-inversion, for light and dark phase, respectively. Day 0 corresponds to the day the light schedule inverses and day 1-6 indicate the number of days after the inversion. The timing of sleep continuously changes due to the alternating light schedule. Sleep in light instantly decreases at the day of the shift and subsequently increases the following days. Sleep in dark shows an inverse pattern. For separate analyses of the recorded weeks, see Figure S3a and Figure S3b.
40036 Dycke, Kirsten.indd 183 11-04-16 11:02

Appendix 2
184
40036 Dycke, Kirsten.indd 184 11-04-16 11:02

Supplemental data
185
A2Fig
ure
S3a.
Tot
al s
leep
and
sle
ep ti
min
g fo
r LD
con
trol
s at
diff
eren
t day
s of
the
wee
k.
40036 Dycke, Kirsten.indd 185 11-04-16 11:02

Appendix 2
186
40036 Dycke, Kirsten.indd 186 11-04-16 11:02

Supplemental data
187
A2
Fig
ure
S3b.
Tot
al s
leep
and
sle
ep ti
min
g fo
r ani
mal
s ex
pose
d to
wee
kly
LD-in
vers
ions
at s
ubse
quen
t day
s af
ter a
n LD
-inve
rsio
n.
40036 Dycke, Kirsten.indd 187 11-04-16 11:02

Appendix 2
188
Figure S4. Hypotheses linking shift work with cancer (adapted from Fritschi et al., 2011). The present study underlines the importance of internal desynchronisation, sleep disruption and timing of food intake in the relationship between shift work and adverse health effects, especially breast cancer and obesity. Melatonin suppression and decreased vitamin D by less sunshine exposure were excluded in our model.
Table S1. Pathology data
Tumor spectra
LD LD-inversions
Total number of mice analyzed 20 21
Tumor-bearing mice 20 21
Mammary gland tumor-bearing mice 16 16
Mammary gland tumor# 18 17
Carcinoma 5 1
Fibrosarcoma/Carcinosarcoma 12 15
Intraepithelial neoplasia 1 1
Mammary gland hyperplasia - 2
Lymphosarcoma 3 5
Other tumors 5 7#Total number of mammary gland tumors per group, multiple tumors were found in some animals.
Supplemental data Chapter 3
The supplemental data of chapter 3 comprise three tables that are too extensive
to be added in print. These tables are publically available via: http://onlinelibrary.
wiley.com/doi/10.1002/pmic.201100497/abstract
40036 Dycke, Kirsten.indd 188 11-04-16 11:02

Supplemental data
189
A2
Supplemental data Chapter 4
Supporting Information Figure S1. Schematic overview of the experimental set up and time of sample collection. White areas indicate lights on, grey areas indicate lights off.
40036 Dycke, Kirsten.indd 189 11-04-16 11:02

Appendix 2
190
Supporting Information Figure S2. Venn-diagram of selected hepatic gene expression biomarkers using the three classifier algorithms. The consensus gene set consists of the 15 genes overlapping between the three algorithms.
40036 Dycke, Kirsten.indd 190 11-04-16 11:02
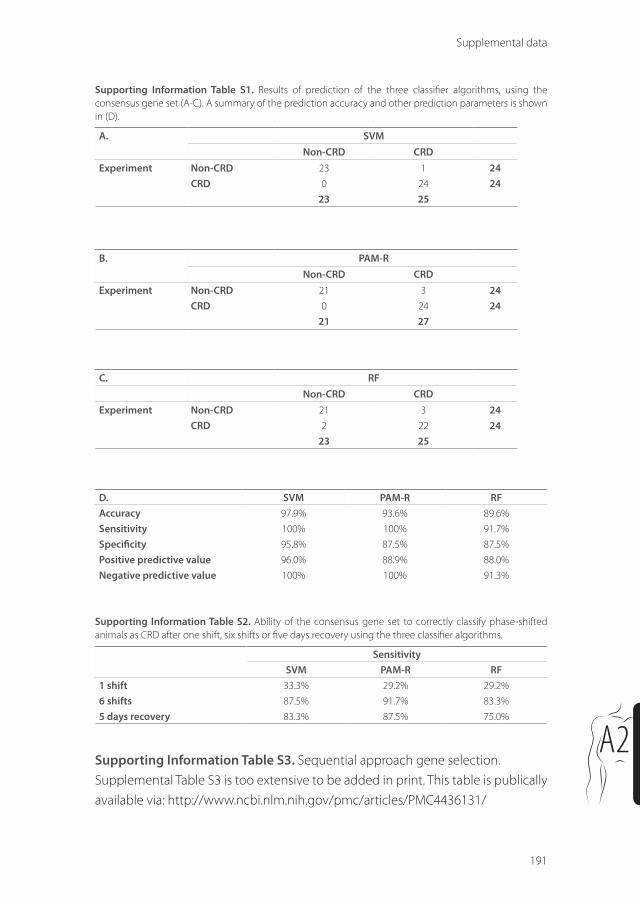
Supplemental data
191
A2
Supporting Information Table S1. Results of prediction of the three classifier algorithms, using the consensus gene set (A-C). A summary of the prediction accuracy and other prediction parameters is shown in (D).
A. SVM
Non-CRD CRD
Experiment Non-CRD 23 1 24
CRD 0 24 24
23 25
B. PAM-R
Non-CRD CRD
Experiment Non-CRD 21 3 24
CRD 0 24 24
21 27
C. RF
Non-CRD CRD
Experiment Non-CRD 21 3 24
CRD 2 22 24
23 25
D. SVM PAM-R RF
Accuracy 97.9% 93.6% 89.6%
Sensitivity 100% 100% 91.7%
Specificity 95.8% 87.5% 87.5%
Positive predictive value 96.0% 88.9% 88.0%
Negative predictive value 100% 100% 91.3%
Supporting Information Table S2. Ability of the consensus gene set to correctly classify phase-shifted animals as CRD after one shift, six shifts or five days recovery using the three classifier algorithms.
Sensitivity
SVM PAM-R RF
1 shift 33.3% 29.2% 29.2%
6 shifts 87.5% 91.7% 83.3%
5 days recovery 83.3% 87.5% 75.0%
Supporting Information Table S3. Sequential approach gene selection.
Supplemental Table S3 is too extensive to be added in print. This table is publically
available via: http://www.ncbi.nlm.nih.gov/pmc/articles/PMC4436131/
40036 Dycke, Kirsten.indd 191 11-04-16 11:02

Appendix 2
192
Supplemental data Chapter 5
Supplementary Table S1. Participant characteristics. Age is provided in years (y), weight in kilograms (kg), waist circumference in centimeters (cm), total sleep duration between the first sampling time at 08:00 AM and the last sampling time at 04:00 AM in hours (hr), sleep timing of sleep episodes between the first sampling time at 08:00 AM and the last sampling time at 04:00 AM provided in clock time (CT).
Participant Gender Age (y) Weight (kg)
Waist circumference (cm)
Total sleep duration (hr) between 08:00 and 04:00
Sleep timing (CT) between 08:00 and 04:00
F1 f 22 85 80 1.25 02:00-03:15
F2 f 22 52 68 5.42 13:30-14:30, 22:00-23:30, 00:45-3:40
F3 f 22 50 83 3.00 00:15-03:15
F4 f 22 49 69 3.00 00:15-03:15
F5 f 22 48 67 3.00 00:15-03:15
F6 f 22 50 69 3.00 00:15-03:15
F7 f 21 59 75 6.50 09:00-10:00, 17:00-19:00, 00:15-03:45
F8 f 21 55 77 4.75 16:15-18:00, 00:15-03:15
F9 f 21 82 93 0.00 none
F10 f 22 55 74 2.50 00:30-03:00
M1 m 41 105 123 4.00 14:00:15:30, 00:30-03:00
M2 m 24 100 110 3.00 00:30-03:30
M3 m 23 72 86 2.00 01:00-03:00
M4 m 21 70 83 5.00 20:30-23:30, 01:00-03:00
M5 m 21 88 85 3.00 00:15-03:15
M6 m 23 79 79 3.33 00:30-03:50
M7 m 21 75 90 3.67 00:10-03:50
Females
Mean 21.70 58.50 75.50 3.24
SD 0.48 13.61 8.17 1.91
Males
Mean 24.86 84.14 93.71 3.43
SD 7.22 13.90 16.35 0.94
40036 Dycke, Kirsten.indd 192 11-04-16 11:02

Supplemental data
193
A2
Supplementary Table S2. Overview of methods used to determine parameters in plasma and serum. The intra assay variation (CV) was determined with three quality control samples (N=8) for the markers as determined on the auto-analyzer and with two quality control samples (N=5) for markers as measured on the immune-analyzer. The CVs of markers measured with the Luminex technique were obtained from the manufacturer.
Technique CV Source
ACTH Luminex (Millipore) 10.8 Plasma
CORT Immune-analyzer (Access-2, Beckman-Coulter) 6.2 Serum
DHEAS Immune-analyzer (Access-2, Beckman-Coulter) 3.9 Serum
E2 Immune-analyzer (Access-2, Beckman-Coulter) 6.3 Serum
FSH Luminex (Millipore) 7.2 Plasma
hGH Immune-analyzer (Access-2, Beckman-Coulter) 2.3 Serum
LH Luminex (Millipore) 6.3 Plasma
PRL Immune-analyzer (Access-2, Beckman-Coulter) 1.8 Serum
PRG Immune-analyzer (Access-2, Beckman-Coulter) 10.8 Serum
TEST Immune-analyzer (Access-2, Beckman-Coulter) 1.4 Serum
TotT3 Immune-analyzer (Access-2, Beckman-Coulter) 4.2 Serum
TSH Immune-analyzer (Access-2, Beckman-Coulter) 1.4 Serum
FFA Auto-analyzer (Unicel DxC 800, Beckman-Coulter) 4.4 Plasma
HDL Auto-analyzer (Unicel DxC 800, Beckman-Coulter) 4.0 Plasma
LDL Auto-analyzer (Unicel DxC 800, Beckman-Coulter) 7.2 Plasma
TG Auto-analyzer (Unicel DxC 800, Beckman-Coulter) 4.3 Plasma
CHOL Auto-analyzer (Unicel DxC 800, Beckman-Coulter) 4.5 Plasma
40036 Dycke, Kirsten.indd 193 11-04-16 11:02

Appendix 2
194
Supplementary Table S3. Overview of hormonal parameters in serum or plasma for A. CircWave analysis of circadian rhythms; B. Repeated-Measures ANOVA to determine daily variation. Amplitude is presented as the % of the median. Ct = Clock time.
A. Circwave analysis
males females
Markers p-value peak (CT) amplitude p-value peak (CT) amplitude
ACTH 0.219 17:54 6.12% 0.714 17:22 3.71%
CORT 0.000 07:47 129.11% 0.000 07:29 161.63%
DHEAS 0.861 20:13 21.89% 0.571 18:23 21.36%
E2 0.306 06:51 24.66% 0.685 05:52 25.11%
FSH 0.964 02:03 40.47% 0.741 18:41 31.20%
hGH 0.895 04:13 581.23% 0.953 11:31 397.11%
LH 0.391 00:36 59.22% 0.968 07:15 45.25%
PRL 0.194 04:55 49.11% 0.081 06:20 97.09%
PRG 0.003 07:52 117.78% 0.870 06:17 44.70%
TEST 0.055 07:33 38.38% 0.282 07:38 22.75%
TotT3 0.025 06:18 10.14% 0.041 07:04 8.08%
TSH 0.001 01:54 75.89% 0.006 03:22 74.26%
B. RM-ANOVA all time points
males females
Markers p-value F-value p-value F-value
ACTH 0.288 F (2.277, 13.66) = 1.375 0.215 F (3.037, 27.33) = 1.775
CORT 0.003 F (2.611, 15.67) = 7.614 0.000 F (3.466, 31.19) = 20.56
DHEAS 0.045 F (2.389, 14.33) = 3.694 0.002 F (2.943, 26.49) = 6.530
E2 0.438 F (2.760, 16.56) = 0.938 0.154 F (3.873, 34.85) = 1.792
FSH 0.517 F (1.990, 11.94) = 0.695 0.512 F (2.079, 18.71) = 0.687
hGH 0.184 F (1.465, 8.792) = 2.091 0.459 F (2.243, 20.18) = 0.838
LH 0.198 F (2.794, 16.76) = 1.746 0.061 F (3.491, 31.42) = 2.617
PRL 0.014 F (2.715, 16.29) = 4.984 0.118 F (1.865, 16.79) = 2.461
PRG 0.020 F (2.310, 13.86) = 4.974 0.272 F (2.204, 19.84) = 1.395
TEST 0.021 F (2.945, 17.67) = 4.221 0.023 F (2.760, 24.84) = 3.922
TotT3 0.032 F (2.461, 14.77) = 4.078 0.078 F (2.896, 26.06) = 2.570
TSH 0.037 F (1.266, 7.596) = 5.991 0.008 F (1.700, 15.30) = 7.305
40036 Dycke, Kirsten.indd 194 11-04-16 11:02

Supplemental data
195
A2
Supplementary Table S4. Overview of lipid parameters in serum or plasma for A. CircWave analysis of circadian rhythms; B. Repeated-Measures ANOVA to determine daily variation. Amplitude is presented as the % of the median. Ct = Clock time.
A. Circwave analysis
males females
Markers p-value peak (CT) amplitude p-value peak (CT) amplitude
FFA 0.012 08:31 74.91% 0.36 06:56 80.70%
HDL 0.695 07:38 9.20% 0.97 07:30 3.86%
LDL 0.818 08:07 12.02% 0.96 08:46 8.35%
TG 0.105 13:46 70.36% 0.05 14:13 50.33%
CHOL 0.645 08:47 11.44% 0.83 08:57 8.17%
B. RM-ANOVA all time points
males females
Markers p-value F-value p-value F-value
FFA 0.069 F (2.442, 14.65) = 3.078 0.221 F (2.638, 23.75) = 1.589
HDL 0.110 F (2.708, 16.25) = 2.399 0.213 F (2.475, 22.28) = 1.641
LDL 0.002 F (2.875, 17.25) = 7.746 0.006 F (2.660, 23.94) = 5.670
TG 0.048 F (1.943, 11.66) = 4.012 0.063 F (2.846, 25.62) = 2.798
CHOL 0.003 F (2.381, 14.29) = 8.618 0.003 F (2.938, 26.44) = 6.020
Supplementary Table S5. CircWave analysis of circadian rhythms classical circadian markers in serum (CORT) or PBMCs (PER1, BMAL1). Amplitude is presented as the % of the median. Ct = Clock time.
Circwave analysis
males females
Markers p-value peak (CT) amplitude p-value peak (CT) amplitude
CORT 0.000 07:47 129.11% 0.000 07:29 161.63%
PER1 0.002 08:07 80.15 %
BMAL1 0.035 14:12 35.55 %
Supporting information S6. Raw data files of data presented in this study.
Supporting information S6 is too extensive to be added in print. This table is
publically available via: http://www.ncbi.nlm.nih.gov/pmc/articles/PMC4540433/
40036 Dycke, Kirsten.indd 195 11-04-16 11:02

Appendix 2
196
Supplemental data Chapter 6
Supplemental Table S1. Genes oscillating under both LD and CRD conditions
Symbol
Gm13889
Ypel2
Chka
Nedd4l
Asap2
Dbp
Dnmt3b
Mif4gd
1110067D22Rik
Arntl
Clpx
Rorc
Per3
St5
A530001N23Rik
Fgfr4
Wdr91
Larp1
Dnajb11
Gramd4
Slc45a3
Tenc1
Hsd17b7
Nr1d2
D7Wsu130e
Prkd3
Gm129
9830001H06Rik
Pdcd2l
Stx2
Lingo4
Dynll2
Hist1h4i
40036 Dycke, Kirsten.indd 196 11-04-16 11:02
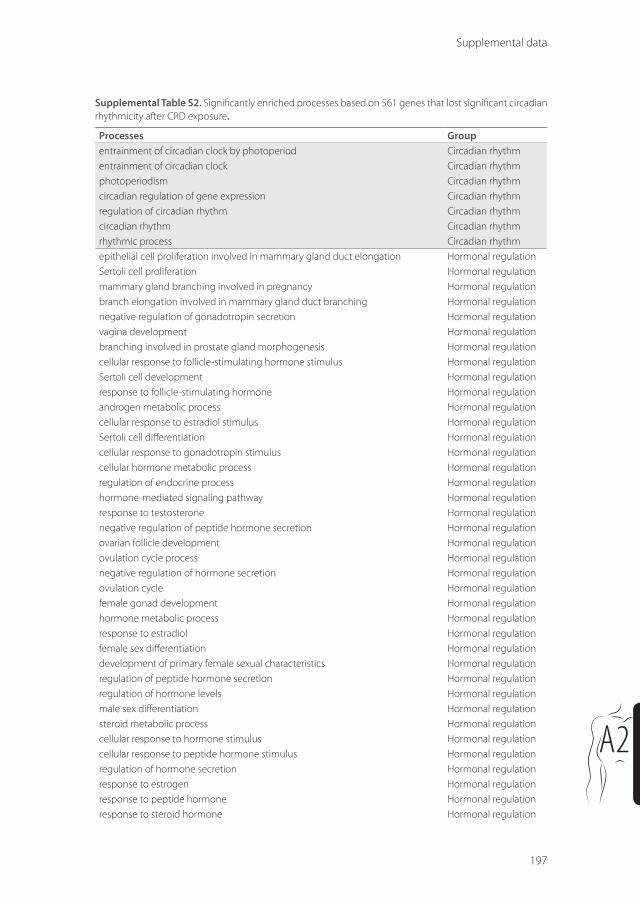
Supplemental data
197
A2
Supplemental Table S2. Significantly enriched processes based on 561 genes that lost significant circadian rhythmicity after CRD exposure.
Processes Groupentrainment of circadian clock by photoperiod Circadian rhythm
entrainment of circadian clock Circadian rhythm
photoperiodism Circadian rhythm
circadian regulation of gene expression Circadian rhythm
regulation of circadian rhythm Circadian rhythm
circadian rhythm Circadian rhythm
rhythmic process Circadian rhythm
epithelial cell proliferation involved in mammary gland duct elongation Hormonal regulation
Sertoli cell proliferation Hormonal regulation
mammary gland branching involved in pregnancy Hormonal regulation
branch elongation involved in mammary gland duct branching Hormonal regulation
negative regulation of gonadotropin secretion Hormonal regulation
vagina development Hormonal regulation
branching involved in prostate gland morphogenesis Hormonal regulation
cellular response to follicle-stimulating hormone stimulus Hormonal regulation
Sertoli cell development Hormonal regulation
response to follicle-stimulating hormone Hormonal regulation
androgen metabolic process Hormonal regulation
cellular response to estradiol stimulus Hormonal regulation
Sertoli cell differentiation Hormonal regulation
cellular response to gonadotropin stimulus Hormonal regulation
cellular hormone metabolic process Hormonal regulation
regulation of endocrine process Hormonal regulation
hormone-mediated signaling pathway Hormonal regulation
response to testosterone Hormonal regulation
negative regulation of peptide hormone secretion Hormonal regulation
ovarian follicle development Hormonal regulation
ovulation cycle process Hormonal regulation
negative regulation of hormone secretion Hormonal regulation
ovulation cycle Hormonal regulation
female gonad development Hormonal regulation
hormone metabolic process Hormonal regulation
response to estradiol Hormonal regulation
female sex differentiation Hormonal regulation
development of primary female sexual characteristics Hormonal regulation
regulation of peptide hormone secretion Hormonal regulation
regulation of hormone levels Hormonal regulation
male sex differentiation Hormonal regulation
steroid metabolic process Hormonal regulation
cellular response to hormone stimulus Hormonal regulation
cellular response to peptide hormone stimulus Hormonal regulation
regulation of hormone secretion Hormonal regulation
response to estrogen Hormonal regulation
response to peptide hormone Hormonal regulation
response to steroid hormone Hormonal regulation
40036 Dycke, Kirsten.indd 197 11-04-16 11:02

Appendix 2
198
Processes Group
negative regulation of mitosis Cell cycle
negative regulation of nuclear division Cell cycle
DNA damage response, signal transduction by p53 class mediator Cell cycle
transforming growth factor beta receptor signaling pathway Cell cycle
signal transduction in response to DNA damage Cell cycle
regulation of mitosis Cell cycle
cellular response to transforming growth factor beta stimulus Cell cycle
regulation of nuclear division Cell cycle
response to transforming growth factor beta Cell cycle
negative regulation of cell cycle process Cell cycle
regulation of cell division Cell cycle
negative regulation of cell cycle Cell cycle
regulation of mitotic cell cycle Cell cycle
regulation of cell cycle process Cell cycle
mitotic cell cycle process Cell cycle
mitotic cell cycle Cell cycle
negative regulation of cell proliferation Cell cycle
lipid storage Glucose and lipid metabolism
positive regulation of phospholipase activity Glucose and lipid metabolism
regulation of glucose import Glucose and lipid metabolism
positive regulation of glucose import Glucose and lipid metabolism
regulation of glycogen metabolic process Glucose and lipid metabolism
positive regulation of lipase activity Glucose and lipid metabolism
regulation of phospholipase activity Glucose and lipid metabolism
positive regulation of glucose transport Glucose and lipid metabolism
negative regulation of insulin secretion Glucose and lipid metabolism
regulation of glucose transport Glucose and lipid metabolism
regulation of lipase activity Glucose and lipid metabolism
monosaccharide metabolic process Glucose and lipid metabolism
regulation of insulin secretion Glucose and lipid metabolism
glucose metabolic process Glucose and lipid metabolism
hexose metabolic process Glucose and lipid metabolism
regulation of lipid metabolic process Glucose and lipid metabolism
lipid biosynthetic process Glucose and lipid metabolism
coumarin metabolic process Resp. to exogenous compound
phenylpropanoid metabolic process Resp. to exogenous compound
flavonoid glucuronidation Resp. to exogenous compound
flavonoid biosynthetic process Resp. to exogenous compound
flavonoid metabolic process Resp. to exogenous compound
cellular glucuronidation Resp. to exogenous compound
glucuronate metabolic process Resp. to exogenous compound
uronic acid metabolic process Resp. to exogenous compound
40036 Dycke, Kirsten.indd 198 11-04-16 11:02

Supplemental data
199
A2
Processes Group
quinone metabolic process Resp. to exogenous compound
catechol-containing compound biosynthetic process Resp. to exogenous compound
catecholamine biosynthetic process Resp. to exogenous compound
secondary metabolic process Resp. to exogenous compound
response to dexamethasone Resp. to exogenous compound
water-soluble vitamin metabolic process Resp. to exogenous compound
xenobiotic metabolic process Resp. to exogenous compound
cellular response to xenobiotic stimulus Resp. to exogenous compound
vitamin metabolic process Resp. to exogenous compound
response to xenobiotic stimulus Resp. to exogenous compound
isoprenoid metabolic process Resp. to exogenous compound
response to purine-containing compound Resp. to exogenous compound
organic hydroxy compound biosynthetic process Resp. to exogenous compound
response to ethanol Resp. to exogenous compound
monocarboxylic acid metabolic process Resp. to exogenous compound
response to alcohol Resp. to exogenous compound
response to nutrient Resp. to exogenous compound
response to drug Resp. to exogenous compound
cellular response to nitrogen compound Resp. to exogenous compound
ephrin receptor signaling pathway Various signaling pathways
positive regulation of epidermal growth factor receptor signaling pathway
Various signaling pathways
positive regulation of ERBB signaling pathway Various signaling pathways
ERK1 and ERK2 cascade Various signaling pathways
cellular response to growth hormone stimulus Various signaling pathways
cellular response to cAMP Various signaling pathways
response to cAMP Various signaling pathways
response to organophosphorus Various signaling pathways
transmembrane receptor protein serine/threonine kinase signaling pathway
Various signaling pathways
regulation of stress-activated MAPK cascade Various signaling pathways
regulation of stress-activated protein kinase signaling cascade Various signaling pathways
activation of MAPK activity Various signaling pathways
regulation of ERK1 and ERK2 cascade Various signaling pathways
regulation of JNK cascade Various signaling pathways
cellular response to fibroblast growth factor stimulus Various signaling pathways
neurotrophin TRK receptor signaling pathway Various signaling pathways
response to glucocorticoid Various signaling pathways
response to fibroblast growth factor Various signaling pathways
MAPK cascade Various signaling pathways
neurotrophin signaling pathway Various signaling pathways
response to corticosteroid Various signaling pathways
40036 Dycke, Kirsten.indd 199 11-04-16 11:02

Appendix 2
200
Processes Group
cellular response to peptide Various signaling pathways
response to hypoxia Various signaling pathways
response to decreased oxygen levels Various signaling pathways
transmembrane receptor protein tyrosine kinase signaling pathway Various signaling pathways
response to oxygen levels Various signaling pathways
response to metal ion Various signaling pathways
positive regulation of MAPK cascade Various signaling pathways
cellular response to organonitrogen compound Various signaling pathways
cellular response to growth factor stimulus Various signaling pathways
response to peptide Various signaling pathways
regulation of MAPK cascade Various signaling pathways
response to growth factor Various signaling pathways
response to extracellular stimulus Various signaling pathways
positive regulation of intracellular signal transduction Various signaling pathways
iron ion transmembrane transport Other
positive regulation of myelination Other
CDP-diacylglycerol biosynthetic process Other
regulation of oligodendrocyte progenitor proliferation Other
CDP-diacylglycerol metabolic process Other
positive regulation of neurological system process Other
regulation of transmission of nerve impulse Other
negative regulation of heart rate Other
positive regulation of bone remodeling Other
positive regulation of bone resorption Other
regulation of smooth muscle cell apoptotic process Other
response to lead ion Other
regulation of calcium ion import Other
negative regulation of smooth muscle cell proliferation Other
positive regulation of phospholipase C activity Other
regulation of phospholipase C activity Other
negative regulation of muscle cell apoptotic process Other
negative regulation of heart contraction Other
positive regulation of heart contraction Other
regulation of muscle cell apoptotic process Other
osteoclast differentiation Other
transferrin transport Other
positive regulation of multicellular organism growth Other
positive regulation of fibroblast proliferation Other
regulation of bone resorption Other
ferric iron transport Other
trivalent inorganic cation transport Other
40036 Dycke, Kirsten.indd 200 11-04-16 11:02
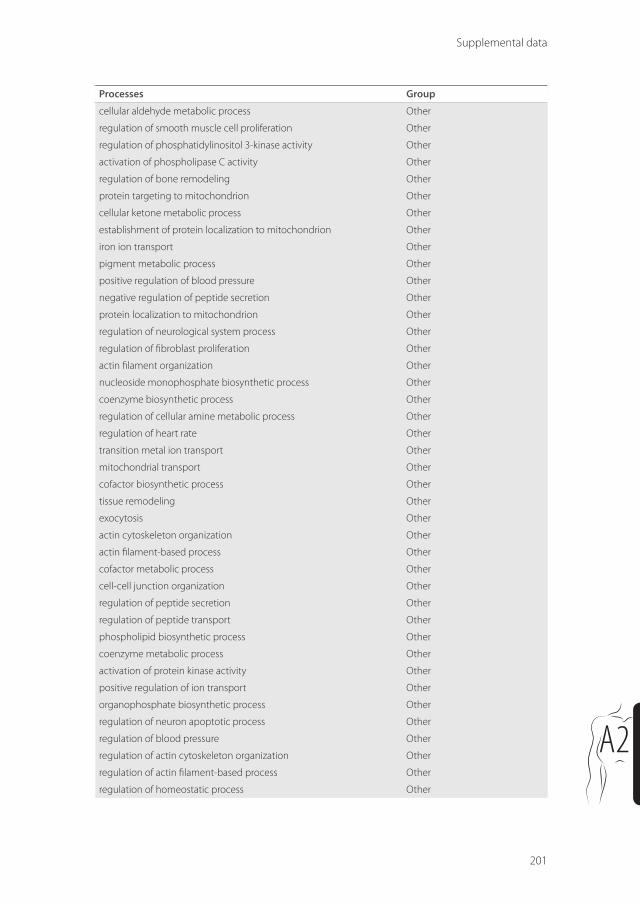
Supplemental data
201
A2
Processes Group
cellular aldehyde metabolic process Other
regulation of smooth muscle cell proliferation Other
regulation of phosphatidylinositol 3-kinase activity Other
activation of phospholipase C activity Other
regulation of bone remodeling Other
protein targeting to mitochondrion Other
cellular ketone metabolic process Other
establishment of protein localization to mitochondrion Other
iron ion transport Other
pigment metabolic process Other
positive regulation of blood pressure Other
negative regulation of peptide secretion Other
protein localization to mitochondrion Other
regulation of neurological system process Other
regulation of fibroblast proliferation Other
actin filament organization Other
nucleoside monophosphate biosynthetic process Other
coenzyme biosynthetic process Other
regulation of cellular amine metabolic process Other
regulation of heart rate Other
transition metal ion transport Other
mitochondrial transport Other
cofactor biosynthetic process Other
tissue remodeling Other
exocytosis Other
actin cytoskeleton organization Other
actin filament-based process Other
cofactor metabolic process Other
cell-cell junction organization Other
regulation of peptide secretion Other
regulation of peptide transport Other
phospholipid biosynthetic process Other
coenzyme metabolic process Other
activation of protein kinase activity Other
positive regulation of ion transport Other
organophosphate biosynthetic process Other
regulation of neuron apoptotic process Other
regulation of blood pressure Other
regulation of actin cytoskeleton organization Other
regulation of actin filament-based process Other
regulation of homeostatic process Other
40036 Dycke, Kirsten.indd 201 11-04-16 11:02

Appendix 2
202
Processes Group
regulation of neuron death Other
phospholipid metabolic process Other
positive regulation of kinase activity Other
positive regulation of transferase activity Other
positive regulation of protein kinase activity Other
secretion by cell Other
regulation of cytoskeleton organization Other
small molecule biosynthetic process Other
organonitrogen compound biosynthetic process Other
cellular metal ion homeostasis Other
secretion Other
metal ion homeostasis Other
cellular cation homeostasis Other
positive regulation of protein phosphorylation Other
cation homeostasis Other
cellular ion homeostasis Other
regulation of protein serine/threonine kinase activity Other
regulation of organelle organization Other
negative regulation of cellular component organization Other
regulation of kinase activity Other
ion homeostasis Other
regulation of protein kinase activity Other
positive regulation of multicellular organismal process Other
positive regulation of monocyte chemotaxis Other
response to interleukin-15 Other
acute-phase response Other
acute inflammatory response Other
platelet degranulation Other
40036 Dycke, Kirsten.indd 202 11-04-16 11:02

Supplemental data
203
A2
Supplementary Table S3. Top 20 genes with largest decrease in amplitude.
Symbol Diff. amplitude
Upp2 -0.5235
Sybu -0.4985
Atxn7l1 -0.4623
Pdk4 -0.4521
Slc16a5 -0.4486
Ccrn4l -0.4224
Nr1d1 -0.4044
Etnk2 -0.3957
Igfbp1 -0.388
Stbd1 -0.3809
Wfdc2 -0.3807
Serpina6 -0.3761
Aqp4 -0.3759
B130006D01Rik -0.3631
Olfr1134 -0.362
Ppard -0.3608
Cyp2s1 -0.3605
Wdr81 -0.3541
Mcm10 -0.3462
Itsn1 -0.3454
Supplementary Table S4. Genes differentially expressed in the CRD group compared to LD controls.
Symbol p-value FC
Nespas 2.96E-06 -0.1539
Gm128 6.37E-05 -0.3601
Rfx7 9.32E-05 0.1652
Defa-rs1 0.000136 0.1718
Adamts5 0.000168 -0.1777
Rhox4e 0.000192 -0.1678
Sprr1a 0.000235 -0.2050
Gm1123 0.000316 -0.1293
Mpped2 0.00036 0.1585
9630013A20Rik 0.00043 0.1606
Gm10295 0.00052 -0.1364
LOC100503435 0.000674 0.1059
1190028D05Rik 0.000778 0.1334
Olfr1248 0.000815 0.1640
Mixl1 0.000868 -0.1246
Glt25d2 0.000912 -0.2461
Gm10773 0.000912 0.1299
40036 Dycke, Kirsten.indd 203 11-04-16 11:02

Appendix 2
204
Supplemental Table S5. Overrepresentation of up or down regulated genes in GO processes or the C2 gene sets.
Upregulated
REACTOME_MEIOSIS Cell cycle
REACTOME_ACTIVATION_OF_ATR_IN_RESPONSE_TO_REPLICATION_STRESS DNA damage
KEGG_MISMATCH_REPAIR DNA damage
REACTOME_G2_M_CHECKPOINTS DNA damage
PID_FANCONI_PATHWAY DNA damage
REACTOME_DNA_STRAND_ELONGATION DNA replication
KEGG_DNA_REPLICATION DNA replication
REACTOME_EXTENSION_OF_TELOMERES DNA replication
REACTOME_LAGGING_STRAND_SYNTHESIS DNA replication
DNA_DEPENDENT_ATPASE_ACTIVITY DNA replication
REACTOME_MEIOTIC_RECOMBINATION DNA replication
REACTOME_TELOMERE_MAINTENANCE DNA replication
REACTOME_ACTIVATION_OF_THE_PRE_REPLICATIVE_COMPLEX DNA replication
REACTOME_CHROMOSOME_MAINTENANCE DNA replication
REACTOME_INFLUENZA_VIRAL_RNA_TRANSCRIPTION_AND_REPLICATION Immune
REACTOME_INFLUENZA_LIFE_CYCLE Immune
GLUTATHIONE_TRANSFERASE_ACTIVITY Metabolism
REACTOME_PHASE_II_CONJUGATION Metabolism
REACTOME_GLUTATHIONE_CONJUGATION Metabolism
KEGG_GLUTATHIONE_METABOLISM Metabolism
REACTOME_CHOLESTEROL_BIOSYNTHESIS Metabolism
REACTOME_METABOLISM_OF_PROTEINS Metabolism
REACTOME_NONSENSE_MEDIATED_DECAY_ENHANCED_BY_THE_EXON_JUNCTION_COMPLEX
Transcription
REACTOME_METABOLISM_OF_RNA Transcription
REACTOME_METABOLISM_OF_MRNA Transcription
REACTOME_CLEAVAGE_OF_GROWING_TRANSCRIPT_IN_THE_TERMINATION_REGION_
Transcription
KEGG_RIBOSOME Translation
REACTOME_SRP_DEPENDENT_COTRANSLATIONAL_PROTEIN_TARGETING_TO_MEMBRANE
Translation
REACTOME_PEPTIDE_CHAIN_ELONGATION Translation
STRUCTURAL_CONSTITUENT_OF_RIBOSOME Translation
REACTOME_TRANSLATION Translation
REACTOME_3_UTR_MEDIATED_TRANSLATIONAL_REGULATION Translation
TRANSFERASE_ACTIVITY_TRANSFERRING_ALKYL_OR_ARYLOTHER_THAN_METHYLGROUPS
Various
KEGG_ALZHEIMERS_DISEASE Various
STRUCTURAL_MOLECULE_ACTIVITY Various
REGULATION_OF_MUSCLE_CONTRACTION Various
40036 Dycke, Kirsten.indd 204 11-04-16 11:02

Supplemental data
205
A2
Downregulated
REACTOME_APOPTOSIS Cell cycle
REACTOME_REGULATION_OF_MITOTIC_CELL_CYCLE Cell cycle
REACTOME_SCF_BETA_TRCP_MEDIATED_DEGRADATION_OF_EMI1 Cell cycle
REACTOME_AUTODEGRADATION_OF_THE_E3_UBIQUITIN_LIGASE_COP1 Cell cycle
REACTOME_APC_C_CDC20_MEDIATED_DEGRADATION_OF_MITOTIC_PROTEINS Cell cycle
REACTOME_ADAPTIVE_IMMUNE_SYSTEM Immune
REACTOME_INTERFERON_GAMMA_SIGNALING Immune
REACTOME_CYTOKINE_SIGNALING_IN_IMMUNE_SYSTEM Immune
REACTOME_INTERFERON_SIGNALING Immune
REACTOME_INTERFERON_ALPHA_BETA_SIGNALING Immune
REACTOME_SIGNALING_BY_THE_B_CELL_RECEPTOR_BCR Immune
KEGG_ACUTE_MYELOID_LEUKEMIA Immune
REACTOME_ACTIVATION_OF_NF_KAPPAB_IN_B_CELLS Immune
KEGG_CHEMOKINE_SIGNALING_PATHWAY Immune
KEGG_PRIMARY_IMMUNODEFICIENCY Immune
REACTOME_ANTIGEN_ACTIVATES_B_CELL_RECEPTOR_LEADING_TO_GENERATION_OF_SECOND_MESSENGERS
Immune
REACTOME_CROSS_PRESENTATION_OF_SOLUBLE_EXOGENOUS_ANTIGENS_ENDOSOMES
Immune
BIOCARTA_IL2_PATHWAY Immune
REACTOME_IMMUNOREGULATORY_INTERACTIONS_BETWEEN_A_LYMPHOID_AND_A_NON_LYMPHOID_CELL
Immune
KEGG_B_CELL_RECEPTOR_SIGNALING_PATHWAY Immune
REACTOME_CLASS_I_MHC_MEDIATED_ANTIGEN_PROCESSING_PRESENTATION Immune
REACTOME_IL_2_SIGNALING Immune
PID_TCR_PATHWAY Immune
DEFENSE_RESPONSE Immune
KEGG_T_CELL_RECEPTOR_SIGNALING_PATHWAY Immune
BIOCARTA_NFAT_PATHWAY Immune
REACTOME_DOWNSTREAM_SIGNALING_EVENTS_OF_B_CELL_RECEPTOR_BCR Immune
REACTOME_ER_PHAGOSOME_PATHWAY Immune
REACTOME_INTEGRIN_ALPHAIIB_BETA3_SIGNALING Immune
PID_IL4_2PATHWAY Immune
REACTOME_ANTIGEN_PROCESSING_UBIQUITINATION_PROTEASOME_DEGRADATION
Immune
PID_INTEGRIN_A4B1_PATHWAY Immune
REACTOME_CYTOCHROME_P450_ARRANGED_BY_SUBSTRATE_TYPE Metabolism
PROTEIN_CATABOLIC_PROCESS Metabolism
CELLULAR_PROTEIN_CATABOLIC_PROCESS Metabolism
MONOOXYGENASE_ACTIVITY Metabolism
BIOPOLYMER_CATABOLIC_PROCESS Metabolism
REACTOME_SYNTHESIS_OF_BILE_ACIDS_AND_BILE_SALTS Metabolism
PID_ERBB1_INTERNALIZATION_PATHWAY Proliferation
PID_MET_PATHWAY Proliferation
PID_PDGFRBPATHWAY Proliferation
40036 Dycke, Kirsten.indd 205 11-04-16 11:02

Appendix 2
206
Downregulated Continued
TRANSMEMBRANE_RECEPTOR_PROTEIN_SERINE_THREONINE_KINASE_SIGNALING_PATHWAY
Proliferation
REACTOME_SIGNALING_BY_WNT Proliferation
REACTOME_SIGNALING_BY_SCF_KIT Proliferation
PID_AURORA_A_PATHWAY Proliferation
KEGG_ERBB_SIGNALING_PATHWAY Proliferation
PID_ECADHERIN_KERATINOCYTE_PATHWAY Proliferation
KEGG_PROTEASOME Proteasome
PID_PI3KCIPATHWAY Proteasome
REACTOME_REGULATION_OF_ORNITHINE_DECARBOXYLASE_ODC Proteasome
AMINE_TRANSPORT Transport
AMINO_ACID_TRANSPORT Transport
INTRACELLULAR_TRANSPORT Transport
CYTOPLASMIC_VESICLE_PART Transport
CYTOPLASMIC_VESICLE_MEMBRANE Transport
AMINE_TRANSMEMBRANE_TRANSPORTER_ACTIVITY Transport
RNA_BINDING Various
PID_TCPTP_PATHWAY Various
MITOCHONDRION Various
MEMBRANE_FRACTION Various
CYTOSKELETON Various
ENZYME_LINKED_RECEPTOR_PROTEIN_SIGNALING_PATHWAY Various
PROTEIN_TRANSPORT Transport
BIOCARTA_TPO_PATHWAY Various
POST_TRANSLATIONAL_PROTEIN_MODIFICATION Various
REACTOME_METABOLISM_OF_AMINO_ACIDS_AND_DERIVATIVES Various
REACTOME_SIGNAL_TRANSDUCTION_BY_L1 Various
PHOSPHORYLATION Various
KEGG_FOCAL_ADHESION Various
MITOCHONDRIAL_PART Various
ACTIN_POLYMERIZATION_AND_OR_DEPOLYMERIZATION Various
REGULATION_OF_PROTEIN_METABOLIC_PROCESS Various
CELL_FRACTION Various
MICROTUBULE Various
PROTEIN_TARGETING Various
40036 Dycke, Kirsten.indd 206 11-04-16 11:02

40036 Dycke, Kirsten.indd 207 11-04-16 11:02

40036 Dycke, Kirsten.indd 208 11-04-16 11:02

