workforce analytics in the board room: how … · workforce analytics in the board ... sr. hr...
TRANSCRIPT

6/11/2012
1
WORKFORCE
ANALYTICS IN THE
BOARD ROOM: HOW
GAP INC GETS
RESULTS JAIME DYER
SR. HR MANAGER
WORKFORCE ANALYTICS
REGAN KLEIN
PRINCIPAL CONSULTANT
WORKFORCE ANALYTICS&
PLANNING

6/11/2012
2
GOALS FOR THE SESSION
• Goals:
– Identify workforce metrics that are top of mind for Board executives
– Identify challenges in effectively utilizing workforce data
– Discuss how to package and present Board level data
– Learn how Gap Inc. made Board reporting a regular process
– Detail two Gap Inc. case studies that utilize workforce data in a non-traditional
manner for the Board
WORKFORCE
ANALYTICS IN
THE BOARD
ROOM

6/11/2012
3
Workforce analytics is a methodology
for creating insights on how
investments in human capital impact business outcomes.
This is done by applying statistical methods to integrated
HR, talent management, financial, and operational data.
DATA EMPOWERS…
NEW HR LEADERS
win executive authority with credible data, business
cases, and ROI forecasts.
CFOS, CIOS AND SALES EXECS
have credibility with CEOs because their views and
decisions are based on data.
“If you and your head of HR haven’t recently discussed
ideas for using data to generate a talent strategy that’s
more closely linked to business results, it’s time to start.”
6
6/11/2012
4
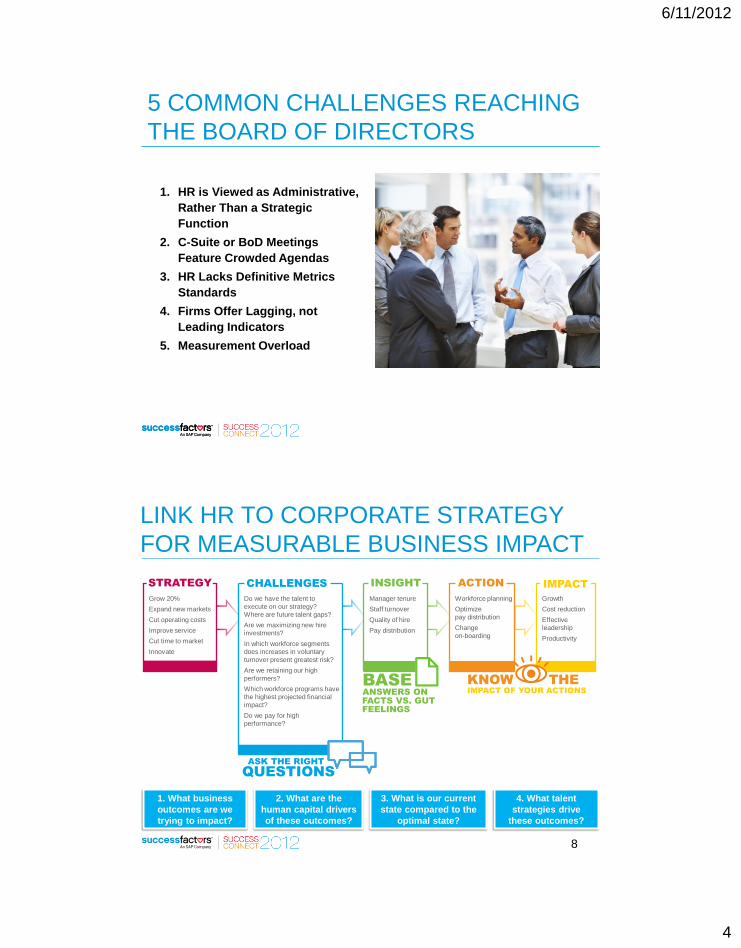
5 COMMON CHALLENGES REACHING
THE BOARD OF DIRECTORS
1. HR is Viewed as Administrative,
Rather Than a Strategic
Function
2. C-Suite or BoD Meetings
Feature Crowded Agendas
3. HR Lacks Definitive Metrics
Standards
4. Firms Offer Lagging, not
Leading Indicators
5. Measurement Overload
LINK HR TO CORPORATE STRATEGY
FOR MEASURABLE BUSINESS IMPACT
8
ACTION IMPACT
Grow 20%
Expand new markets
Cut operating costs
Improve service
Cut time to market
Innovate
Do we have the talent to
execute on our strategy?
Where are future talent gaps?
Are we maximizing new hire
investments?
In which workforce segments
does increases in voluntary
turnover present greatest risk?
Are we retaining our high
performers?
Which workforce programs have
the highest projected financial
impact?
Do we pay for high
performance?
Manager tenure
Staff turnover
Quality of hire
Pay distribution
Workforce planning
Optimize
pay distribution
Change
on-boarding
Growth
Cost reduction
Effective
leadership
Productivity
ASK THE RIGHT
QUESTIONS
INSIGHT STRATEGY
BASE ANSWERS ON
FACTS VS. GUT
FEELINGS
KNOW THE
IMPACT OF YOUR ACTIONS
CHALLENGES
1. What business
outcomes are we
trying to impact?
2. What are the
human capital drivers
of these outcomes?
3. What is our current
state compared to the
optimal state?
4. What talent
strategies drive
these outcomes?

6/11/2012
5
METRICS FOR THE BOARD OF
DIRECTORS
9
7%
13%
20%
27%
33%
Performance metrics
Risk metrics
Core workforce metrics
Succession metrics
Financial workforce metrics
Which category of workforce metrics are of highest priority for your Board of Directors (or should be)?
Source: SuccessFactors, “Human Capital Management: What Really Matters, What Should You Measure, and How
Should You Measure It?” survey, September 2011, N=16.
THE “RIGHT” SET OF METRICS
Group #1: Core Workforce Facts:
– Headcount/FTE
– Terminations
– Diversity, by Gender and Ethnic Background
– Workforce Age Profile
Group #2: Financial Workforce Metrics:
– Operating Revenue per FTE
– Operating Profit per FTE
– Return on Human Capital Investment Ratio
– Cost of Turnover
Group #3: Productivity and Performance:
– Workforce Productivity (Measured in outputs relevant to the specific firm)
– Workforce Availability/Absenteeism
– Executive Compensation/Pay Comparison
Group #4: Talent Development and Succession:
– Leadership Quality (Current and Bench)
– Staffing Rate – High Performers
– Staffing Rate – High Potentials
Group #5: Human Capital Risk: –
– Succession Risk (Absence of Ready-Now Successors)
– Staffing Shortages in Critical Roles
– Current vs. Future Competency Gaps
– Churn (hires vs. terminations) Rates
– Knowledge & Transition Risk (of an aging workforce)

6/11/2012
6
KEY LEARNINGS FOR PRESENTING AND
PACKAGING EXECUTIVE LEVEL DATA
1. Regular Reporting is a Must
• Data credibility
• Rhythm
• Standardization (Formulas, Definitions,
etc.)
2. Balancing Breadth and Depth
• Scorecards
• KPIs
• Clear linkage to business issue
3. Combining Data and Analysis
• Effective story-telling
• Target-setting
• Benchmarking
• Recommended action
HOW GAP
INC GETS
RESULTS

6/11/2012
7
GAP INC.
Founded in 1969 with a single store in San Francisco, California
Global Specialty Apparel Retailer with five distinct Brands
Gap, Old Navy, Banana Republic, Piperlime and Athleta
Employ 130,000 employees across the globe
Operate approximately 3,200 company-owned and Franchise stores
globally
Average employee is 28,
60% Generation Y(born
after 1979)
50,000 employees
volunteered 428,000 hours
to local communities in 2010
BUSINESS NEED
QUESTIONS PROPOSED BY OUR BOARDS
CASE 1: Gap Inc. Board of Directors
Turnover of employees in some of our most critical roles appears to be
increasing. Is retention down? Is it likely this trend will continue? What’s our
level of risk as we enter 2012?
CASE 2: Gap Foundation Board of Directors
What is the business impact of our highly visible “This Way Ahead” Internship
Program? Are we realizing ROI above and beyond its impact on youth and
communities?

6/11/2012
8
CASE 1:
CRITICAL
ROLES
TURNOVER
REPORT
LEGACY BOARD REPORT
Critical Roles Turnover
Report Details
Report Challenges
(Pre-SuccessFactors)
5 Division summaries created and delivered
for review by HR Business Leaders
Over 100 job codes to track and build into
PeopleSoft queries
Executive Summary delivered quarterly to
BOD since 2007 Complex review and feedback process
Year-to-date turnover for critical roles
(Execs, Design, Merchants, etc)
BOD Meetings occur within 2 weeks of
quarter close
This Year versus Last Year trend Limited trending (this year vs. last year)
BOD expects quantitative and qualitative
results BOD asking for risk assessment –
predictions based on historical trends
North America focused until 2011 No global talent assessment

6/11/2012
9
METHOD USED
BUSINESS RESULTS
Before SuccessFactors After SuccessFactors
Access to results quarterly Access to results monthly
Manual calculations and report design using:
PeopleSoft, Excel, Access, PowerPoint
Automatic calculations and report creation
using: Report Designer, WFA
2 weeks lead time required to produce final
report 4 days lead time required to produce final
report
This Year vs. Last Year view only 4 year trend for all roles
North America talent only Global talent assessment
Packaging: Simplistic view Packaging: Expanded view

6/11/2012
10
TAKING IT TO THE NEXT LEVEL
Predicted future turnover using
historical links between Turnover
and Engagement
Provided BOD with data driven risk
assessment
Model in place to monitor, track and
report on future trends
CASE 2:
TWA INTERN
SCORECARD

6/11/2012
11
THE GAP FOUNDATION - THIS WAY AHEAD
Gap Inc. Head of Foundation sits on White House Council for Community Solutions
In partnership with 2 non-profit organizations, Gap Inc. created comprehensive “This Way Ahead” Program
Primary objective to positively impact underserved youth for the betterment of our communities
Program launched in 2006 in New York; In 2010, launched in San Francisco, CA
About half of the participants become interns and about 70% of the interns are hired into permanent positions following their internship

6/11/2012
12
MEASURING IMPACT
After five years . . .
Proven impact on youth (main objective)
Multitude of data and measurement performed by third-party
Unanswered questions from the Board on impact to the business
Foundation employees hypothesize that TWA Interns will have lower
rates of turnover and higher performance over time than comparable
non-TWA interns
Field leaders involved in training facilitation indicate professional and
personal gain from involvement in the program, but is this actually
translating to improved performance and business results
THE CHALLENGE
HOW DO YOU TRACK INDIVIDUAL TWA
INTERNS THROUGH THEIR CAREERS AT
GAP INC?
6/11/2012
13
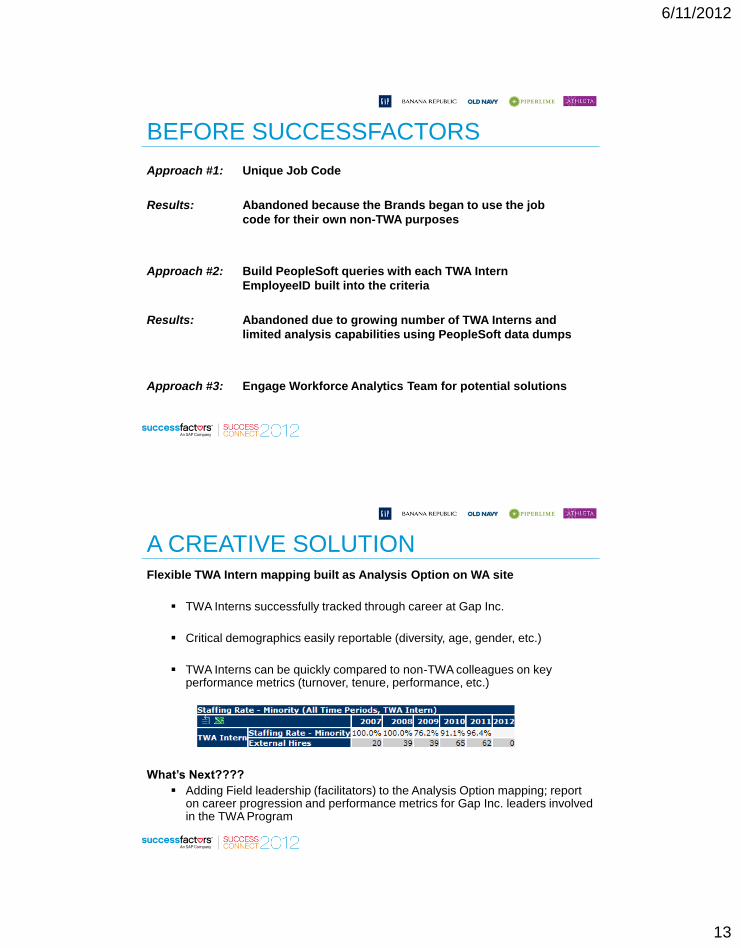
BEFORE SUCCESSFACTORS
Approach #1: Unique Job Code
Results: Abandoned because the Brands began to use the job
code for their own non-TWA purposes
Approach #2: Build PeopleSoft queries with each TWA Intern
EmployeeID built into the criteria
Results: Abandoned due to growing number of TWA Interns and
limited analysis capabilities using PeopleSoft data dumps
Approach #3: Engage Workforce Analytics Team for potential solutions
A CREATIVE SOLUTION Flexible TWA Intern mapping built as Analysis Option on WA site
TWA Interns successfully tracked through career at Gap Inc.
Critical demographics easily reportable (diversity, age, gender, etc.)
TWA Interns can be quickly compared to non-TWA colleagues on key performance metrics (turnover, tenure, performance, etc.)
What’s Next????
Adding Field leadership (facilitators) to the Analysis Option mapping; report on career progression and performance metrics for Gap Inc. leaders involved in the TWA Program

6/11/2012
14
BUSINESS RESULTS Quarterly Program Scorecard with performance metrics on BOTH
Youth and Business Impact developed and delivered for two quarters; Board feedback on the addition of Business Impact metrics very positive . . . Hungry for more data
One hypothesis proven: TWA Interns have significantly lower <1 year turnover rates than their non-TWA colleagues of similar age
Foundation in place to quickly track and report on TWA Intern progress – Gap Foundation staff enabled to retrieve data and perform analysis as needed (Workforce Analytics Team resources not required)
Best Practices for Measuring Impact noted in public Toolkit produced by Gap Foundation to help other businesses design and implement their own programs (technology solution for tracking progress recommended up front, before implementation)
KEY TAKEAWAYS
TO GET THE BOARD’S ATTENTION:
Link to Business Issues: Critical Roles – retention of employees in critical roles
TWA Intern Scorecard – ROI and Business Impact
Story Telling: Critical Roles – 4 year global trends used to assess risk
TWA Intern Scorecard – Full picture on impact
Keep it Simple: Critical Roles – Thresholds established and reflected
TWA Intern Scorecard – One page with key metrics
Think creatively, be innovative in your search for solutions . . .

6/11/2012
15
QUESTIONS?
CONTACT INFORMATION
Jaime Dyer
GAP INC
Sr. Manager HR, Workforce Analytics
Physical Location: Albuquerque, New Mexico
Email: [email protected]