workers’ compensation network report card results€¦ · workers’ compensation network report...
TRANSCRIPT
2013
Workers’ Compensation Network Report Card Results
Health care costs
Utilization
Satisfaction with care
Access to care
Return to work
Health outcomes
Texas Department of Insurance Workers’ Compensation Research and Evaluation Group

Acknowledgements
The Research and Evaluation Group (REG) would like to thank the Division of Workers’ Compensation, especially Tammy Campion, for the timely availability of medical data, and Dr. Paul Ruggiere and his staff at the University of North Texas Survey Research Center for administering the injured-workers’ telephone survey. Botao Shi managed the project, conducted the analyses, converted statistical results into tabular and graphical output and interpreted the results. REG Director DC Campbell provided methodological support, conducted the data management, and authored the final report. Dr. Soon-Yong Choi and Ward Adams provided valuable editorial comments.
2013 Workers’ Compensation Network Report Card Results
Contents
About this report ……………….………. 1 Data sources …….......………….………. 2 How were medical costs and utilization
measures calculated? ………………… 3 How was the injured employee survey
conducted? ………………………… 4 Summary of findings …………………… 5 Network performance summary ……........ 8 Health care costs …………………….….. 12 Utilization of care ………………….…… 16 Satisfaction with care …………………… 18 Access to care ………………………...… 20 Return to work …………………………. 23 Health outcomes …………………….….. 25 Appendix ……………………………….. 26

This page intentionally left blank.

2013 Workers’ Compensation Network Report Card Results 1
About This Report In 2005, the 79th Texas Legislature passed House Bill (HB) 7, which authorized the use of workers’ compensation health care networks certified by the Texas Department of Insurance (Department). This legislation also directed the Workers’ Compensation Research and Evaluation Group (REG), to publish an annual report card comparing the performance of certified networks with each other as well as non-network claims on a variety of measures including:
• Health care costs; • Utilization; • Satisfaction with care; • Access to care; • Return to work; and • Health outcomes.
In March 2006, the Department began certifying workers’ compensation networks. As of August 31, 2013, 28 networks covering 254 Texas counties are certified to provide workers’ compensation health care services to insurance carriers. Among the certified networks, 21 were treating injured employees as of February 1, 2013. Since the formation of the first network, a total of 416,551 injured employees have been treated in networks. Texas Star accounts for 33 percent of all claims that were treated in networks, with the smaller networks treating an increasing share of injured employees.
Public Entities and Political Subdivisions Certain public entities and political subdivisions (such as counties, municipalities, school districts, junior college districts, housing authorities, and community centers for mental health and mental retardation services) have the option to: 1) use a workers’ compensation health care network certified by TDI under Chapter 1305, Texas Insurance Code; 2) continue to allow their injured employees to seek heath care as non-network claims; or 3) contract directly with health care providers if the use of a certified network is not “available or practical,” essentially forming their own health care network. This report includes Alliance, a joint contracting partnership of five political subdivisions (authorized under Chapter 504, Texas Labor Code) that chose to directly contract with health care providers. While not required to be certified by the Department under Chapter 1305, Texas Insurance Code, the Alliance network must still meet TDI’s workers’ compensation reporting requirements. The Alliance intergovernmental pools are:
• Texas Association of Counties Risk Management Pool • Texas Association of School Boards Risk Management Fund • Texas Municipal League Intergovernmental Risk Pool • Texas Council Risk Management Fund • Texas Water Conservation Association Risk Management Fund
In addition to the Alliance, this report covers a separate group of networks authorized under Chapter 504, Texas Labor Code. This group is referred to in the report as 504-Others, and is comprised of Dallas County schools and the Trinity Occupational Program (Fort Worth Independent School District).
How Network Results Are Reported The results presented in this annual report card show a comparison of fifteen groups, fourteen of which are network entities with a total of 89,178 injured employees (39 percent of all claims) for the study period: Texas Star (29,399), 504-Alliance (19,237), Coventry (9,173), Travelers (7,669), Liberty (5,906), Sedgwick (2,598), Chartis (1,924), First Health (1,838), Corvel (1,784), 504-Others (1,624), Zurich (1,616), Zenith (1,095), Bunch (1,065) and all other networks (4,250), relative to the non-network injured employees (139,136) treated as the thirteenth group, outside of the workers’ compensation health care network context.
2013 Workers’ Compensation Network Report Card Results 2
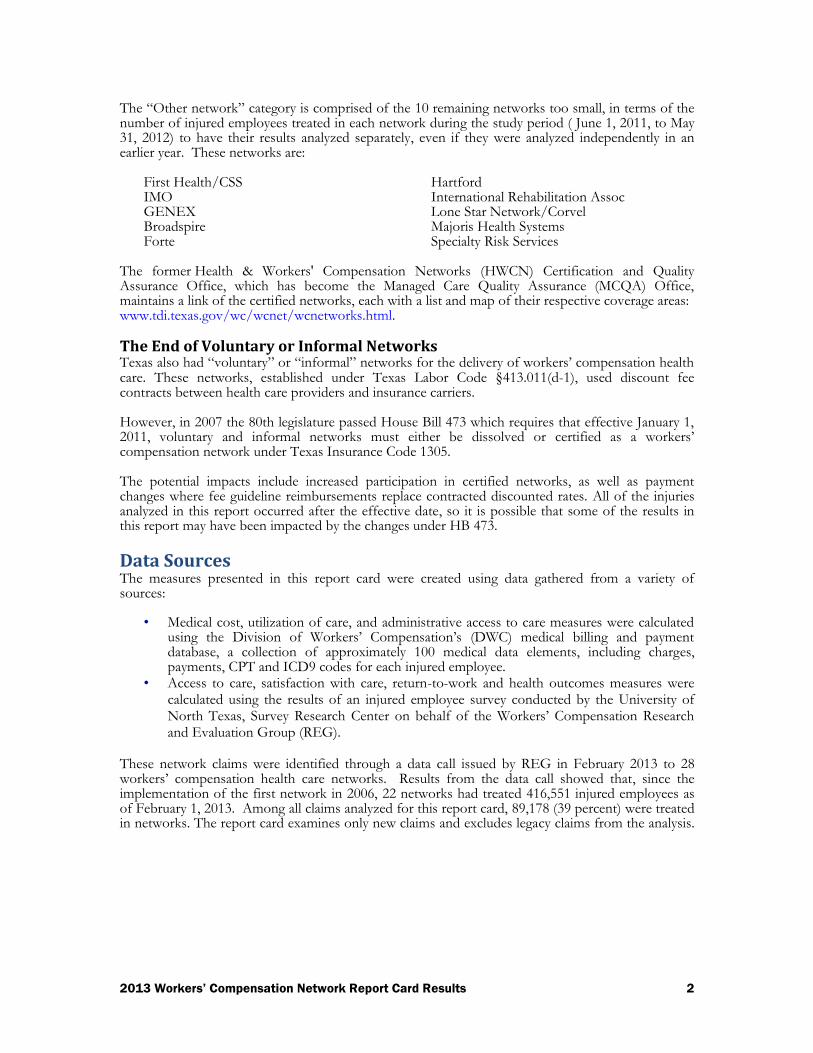
The “Other network” category is comprised of the 10 remaining networks too small, in terms of the number of injured employees treated in each network during the study period ( June 1, 2011, to May 31, 2012) to have their results analyzed separately, even if they were analyzed independently in an earlier year. These networks are:
First Health/CSS IMO GENEX Broadspire Forte
Hartford International Rehabilitation Assoc Lone Star Network/Corvel Majoris Health Systems Specialty Risk Services
The former Health & Workers' Compensation Networks (HWCN) Certification and Quality Assurance Office, which has become the Managed Care Quality Assurance (MCQA) Office, maintains a link of the certified networks, each with a list and map of their respective coverage areas: www.tdi.texas.gov/wc/wcnet/wcnetworks.html.
The End of Voluntary or Informal Networks Texas also had “voluntary” or “informal” networks for the delivery of workers’ compensation health care. These networks, established under Texas Labor Code §413.011(d-1), used discount fee contracts between health care providers and insurance carriers. However, in 2007 the 80th legislature passed House Bill 473 which requires that effective January 1, 2011, voluntary and informal networks must either be dissolved or certified as a workers’ compensation network under Texas Insurance Code 1305. The potential impacts include increased participation in certified networks, as well as payment changes where fee guideline reimbursements replace contracted discounted rates. All of the injuries analyzed in this report occurred after the effective date, so it is possible that some of the results in this report may have been impacted by the changes under HB 473.
Data Sources The measures presented in this report card were created using data gathered from a variety of sources:
• Medical cost, utilization of care, and administrative access to care measures were calculated using the Division of Workers’ Compensation’s (DWC) medical billing and payment database, a collection of approximately 100 medical data elements, including charges, payments, CPT and ICD9 codes for each injured employee.
• Access to care, satisfaction with care, return-to-work and health outcomes measures were calculated using the results of an injured employee survey conducted by the University of North Texas, Survey Research Center on behalf of the Workers’ Compensation Research and Evaluation Group (REG).
These network claims were identified through a data call issued by REG in February 2013 to 28 workers’ compensation health care networks. Results from the data call showed that, since the implementation of the first network in 2006, 22 networks had treated 416,551 injured employees as of February 1, 2013. Among all claims analyzed for this report card, 89,178 (39 percent) were treated in networks. The report card examines only new claims and excludes legacy claims from the analysis.
2013 Workers’ Compensation Network Report Card Results 3
How Were Medical Costs and Utilization Measures Calculated? Medical cost and utilization measures were calculated for all 15 groups at 6 months post-injury for injuries occurring between June 1, 2011 and May 31, 2012.
Medical Costs Medical Cost measures are based on payments by insurance carriers to health care providers. Typically, actual payments are less than charges (billed amount).
Medical Utilization Medical Utilization measures represent the services that were billed for by health care providers, regardless of whether those services were ultimately paid by insurance carriers. The goal of this measure is to calculate actual services delivered by health care providers, not just paid-for services. Other utilization measures that account for the difference between services billed for and services paid for are more appropriate for quantifying the effectiveness of utilization review, and are therefore not addressed in this report.
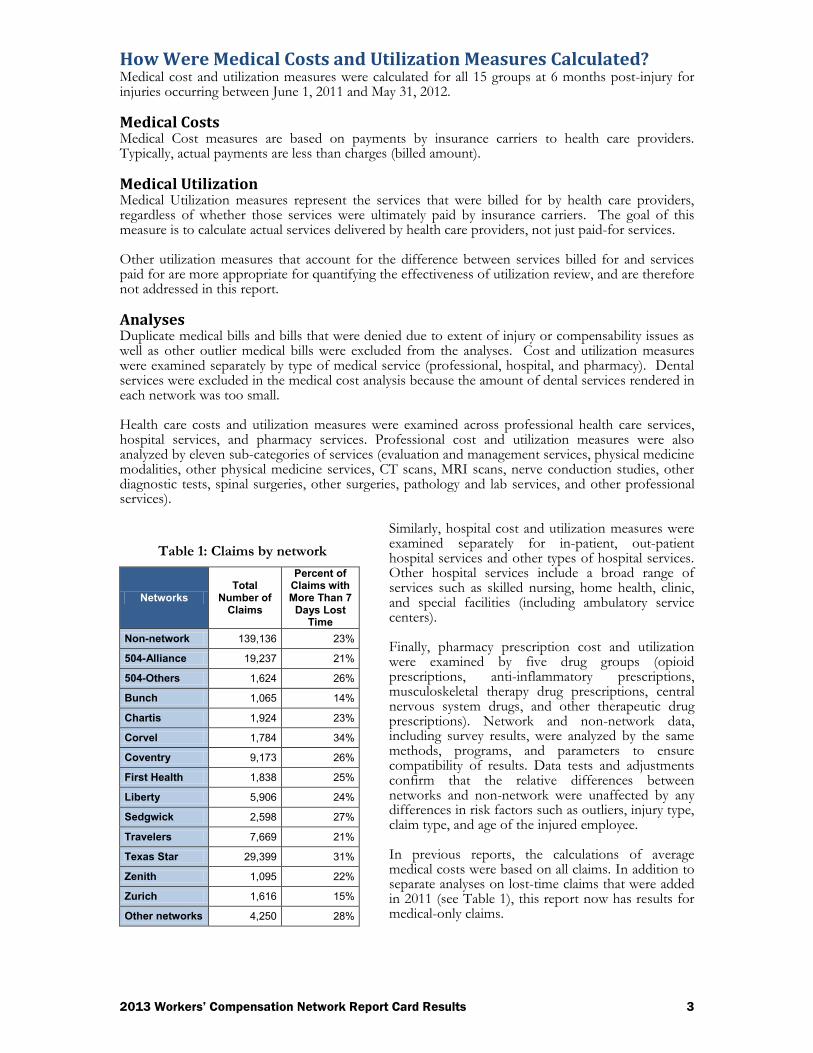
Analyses Duplicate medical bills and bills that were denied due to extent of injury or compensability issues as well as other outlier medical bills were excluded from the analyses. Cost and utilization measures were examined separately by type of medical service (professional, hospital, and pharmacy). Dental services were excluded in the medical cost analysis because the amount of dental services rendered in each network was too small. Health care costs and utilization measures were examined across professional health care services, hospital services, and pharmacy services. Professional cost and utilization measures were also analyzed by eleven sub-categories of services (evaluation and management services, physical medicine modalities, other physical medicine services, CT scans, MRI scans, nerve conduction studies, other diagnostic tests, spinal surgeries, other surgeries, pathology and lab services, and other professional services).
Table 1: Claims by network
Networks Total
Number of Claims
Percent of Claims with More Than 7
Days Lost Time
Non-network 139,136 23%
504-Alliance 19,237 21%
504-Others 1,624 26%
Bunch 1,065 14%
Chartis 1,924 23%
Corvel 1,784 34%
Coventry 9,173 26%
First Health 1,838 25%
Liberty 5,906 24%
Sedgwick 2,598 27%
Travelers 7,669 21%
Texas Star 29,399 31%
Zenith 1,095 22%
Zurich 1,616 15%
Other networks 4,250 28%
Similarly, hospital cost and utilization measures were examined separately for in-patient, out-patient hospital services and other types of hospital services. Other hospital services include a broad range of services such as skilled nursing, home health, clinic, and special facilities (including ambulatory service centers). Finally, pharmacy prescription cost and utilization were examined by five drug groups (opioid prescriptions, anti-inflammatory prescriptions, musculoskeletal therapy drug prescriptions, central nervous system drugs, and other therapeutic drug prescriptions). Network and non-network data, including survey results, were analyzed by the same methods, programs, and parameters to ensure compatibility of results. Data tests and adjustments confirm that the relative differences between networks and non-network were unaffected by any differences in risk factors such as outliers, injury type, claim type, and age of the injured employee. In previous reports, the calculations of average medical costs were based on all claims. In addition to separate analyses on lost-time claims that were added in 2011 (see Table 1), this report now has results for medical-only claims.
2013 Workers’ Compensation Network Report Card Results 4
.
Medical-Only and Lost-Time Average Costs Average costs for lost-time and medical-only claims may be higher for networks that succeed in reducing their percentage of lost-time claims in favor of a higher percentage of medical-only claims. As the population of lost-time claims decreases, a greater share of the remaining claims will be more severe and higher-cost injuries. This will increase the average cost per lost-time claim. Also, as the types of injuries that previously incurred lost time shift to medical-only claims, they may raise the average cost per claim for that group, since their costs will be typically higher than the general population of medical-only claims. While the overall average medical cost per claim is generally reflective of a network’s cost level, the average cost by lost-time and medical-only status tend to be influenced by the percentage of lost-time claims. Networks with relatively low overall average claim costs and low percentage of lost-time claims may therefore have higher lost-time and medical-only average costs when compared to other networks.
How Was the Injured Employee Survey Conducted? REG developed the injured employee survey instrument using a series of standardized questions from the Consumer Assessment of Health Plans Study, Version 3.0 (CAHPS™ 3.0), the Short Form 12, Version 2 (SF-12™), the URAC Survey of Worker Experiences and previous surveys conducted by the REG. The findings presented in this report are based on completed telephone surveys of 3,603 injured employees with new claims. Since network claims only represented approximately 29 percent of the total lost-time claim population for the analysis period, REG utilized a disproportionate random sample and over-sampled network claims. In order to analyze the outcomes of individual networks, injured employees of all injury durations within the study period were surveyed in July 2013 and an age-of-injury control was included in the analyses.
2013 Workers’ Compensation Network Report Card Results 5
Summary of Findings
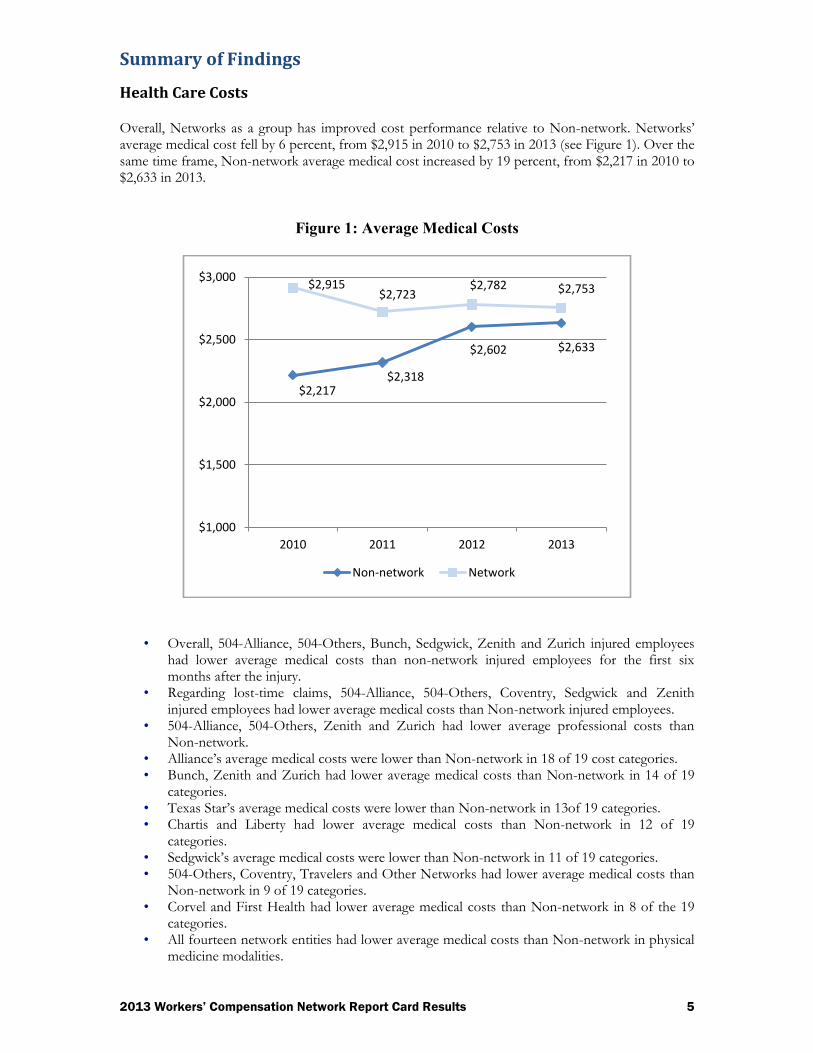
Health Care Costs Overall, Networks as a group has improved cost performance relative to Non-network. Networks’ average medical cost fell by 6 percent, from $2,915 in 2010 to $2,753 in 2013 (see Figure 1). Over the same time frame, Non-network average medical cost increased by 19 percent, from $2,217 in 2010 to $2,633 in 2013.
Figure 1: Average Medical Costs
• Overall, 504-Alliance, 504-Others, Bunch, Sedgwick, Zenith and Zurich injured employees
had lower average medical costs than non-network injured employees for the first six months after the injury.
• Regarding lost-time claims, 504-Alliance, 504-Others, Coventry, Sedgwick and Zenith injured employees had lower average medical costs than Non-network injured employees.
• 504-Alliance, 504-Others, Zenith and Zurich had lower average professional costs than Non-network.
• Alliance’s average medical costs were lower than Non-network in 18 of 19 cost categories. • Bunch, Zenith and Zurich had lower average medical costs than Non-network in 14 of 19
categories. • Texas Star’s average medical costs were lower than Non-network in 13of 19 categories. • Chartis and Liberty had lower average medical costs than Non-network in 12 of 19
categories. • Sedgwick’s average medical costs were lower than Non-network in 11 of 19 categories. • 504-Others, Coventry, Travelers and Other Networks had lower average medical costs than
Non-network in 9 of 19 categories. • Corvel and First Health had lower average medical costs than Non-network in 8 of the 19
categories. • All fourteen network entities had lower average medical costs than Non-network in physical
medicine modalities.
$2,217 $2,318
$2,602 $2,633
$2,915 $2,723
$2,782 $2,753
$1,000
$1,500
$2,000
$2,500
$3,000
2010 2011 2012 2013
Non-network Network
2013 Workers’ Compensation Network Report Card Results 6
• Twelve network entities (504-Alliance, 504-Others, Bunch, Chartis, Corvel, Liberty, Sedgwick, Travelers, Texas Star, Zenith, Zurich and Other Networks had lower average medical costs than Non-network in Nerve Conduction Diagnostic Testing.
• Nine network entities (504-Alliance, Bunch, Chartis, Corvel, First Health, Liberty, Travelers, Texas Star and Zenith) had lower or equal average medical costs than Non-network in MRI Diagnostic Testing.
• Eight network entities (504-Alliance, Bunch, Chartis, Corvel, First Health, Liberty, Travelers and Zurich) had lower average medical costs than Non-network in Spinal Surgery.
• 504-Alliance, Bunch, Sedgwick and Zurich had lower average hospital costs than Non-network.
• Ten network entities ((504-Alliance, 504-Others, Bunch, Chartis, Coventry, Liberty, Sedgwick, Travelers, Zurich and Other Networks) had lower average medical costs than Non-network in hospital in-patient services.
• 504-Alliance, 504-Others, Bunch, Sedgwick, Texas Star, Zenith, Zurich and Other Networks had lower or equal average pharmacy costs than Non-network.
• Eleven network entities (504-Alliance, 504-Others, Bunch, Chartis, Coventry, Liberty, Sedgwick, Texas Star, Zenith, Zurich and Other Networks) had lower average pharmacy costs then Non-network in the use of Analgesics-Anti-Inflammatory.
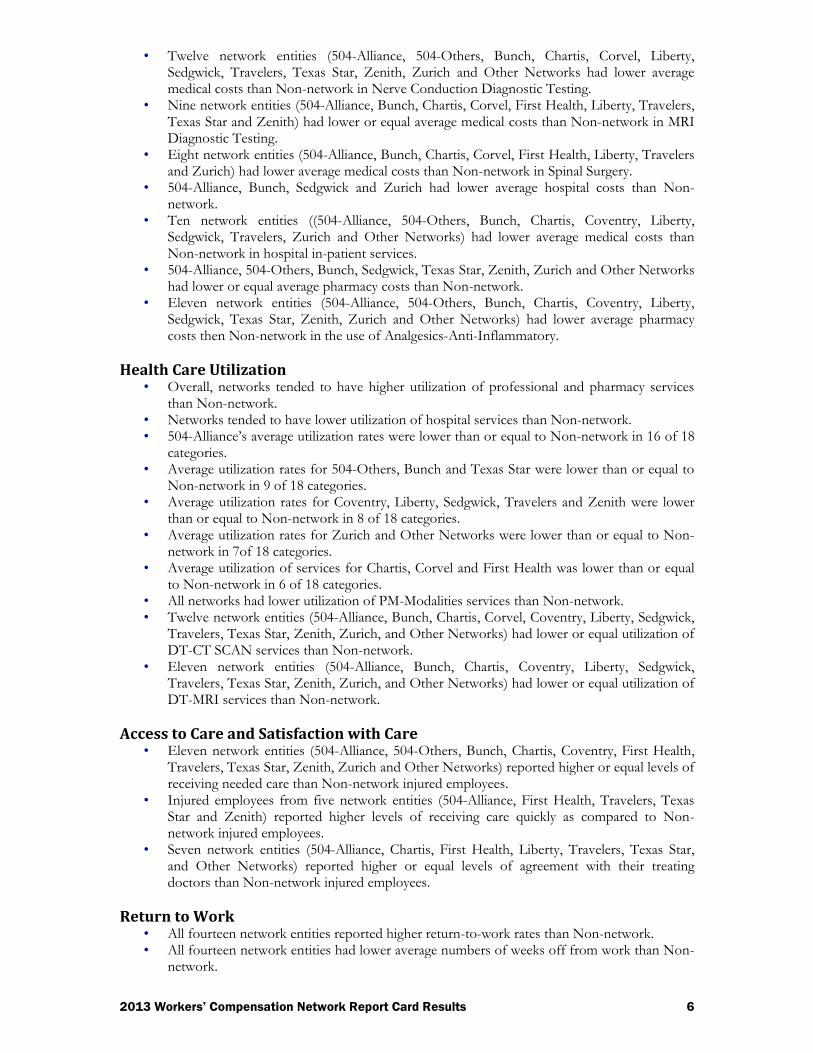
Health Care Utilization • Overall, networks tended to have higher utilization of professional and pharmacy services
than Non-network. • Networks tended to have lower utilization of hospital services than Non-network. • 504-Alliance’s average utilization rates were lower than or equal to Non-network in 16 of 18
categories. • Average utilization rates for 504-Others, Bunch and Texas Star were lower than or equal to
Non-network in 9 of 18 categories. • Average utilization rates for Coventry, Liberty, Sedgwick, Travelers and Zenith were lower
than or equal to Non-network in 8 of 18 categories. • Average utilization rates for Zurich and Other Networks were lower than or equal to Non-
network in 7of 18 categories. • Average utilization of services for Chartis, Corvel and First Health was lower than or equal
to Non-network in 6 of 18 categories. • All networks had lower utilization of PM-Modalities services than Non-network. • Twelve network entities (504-Alliance, Bunch, Chartis, Corvel, Coventry, Liberty, Sedgwick,
Travelers, Texas Star, Zenith, Zurich, and Other Networks) had lower or equal utilization of DT-CT SCAN services than Non-network.
• Eleven network entities (504-Alliance, Bunch, Chartis, Coventry, Liberty, Sedgwick, Travelers, Texas Star, Zenith, Zurich, and Other Networks) had lower or equal utilization of DT-MRI services than Non-network.
Access to Care and Satisfaction with Care • Eleven network entities (504-Alliance, 504-Others, Bunch, Chartis, Coventry, First Health,
Travelers, Texas Star, Zenith, Zurich and Other Networks) reported higher or equal levels of receiving needed care than Non-network injured employees.
• Injured employees from five network entities (504-Alliance, First Health, Travelers, Texas Star and Zenith) reported higher levels of receiving care quickly as compared to Non-network injured employees.
• Seven network entities (504-Alliance, Chartis, First Health, Liberty, Travelers, Texas Star, and Other Networks) reported higher or equal levels of agreement with their treating doctors than Non-network injured employees.
Return to Work • All fourteen network entities reported higher return-to-work rates than Non-network. • All fourteen network entities had lower average numbers of weeks off from work than Non-
network.

2013 Workers’ Compensation Network Report Card Results 7
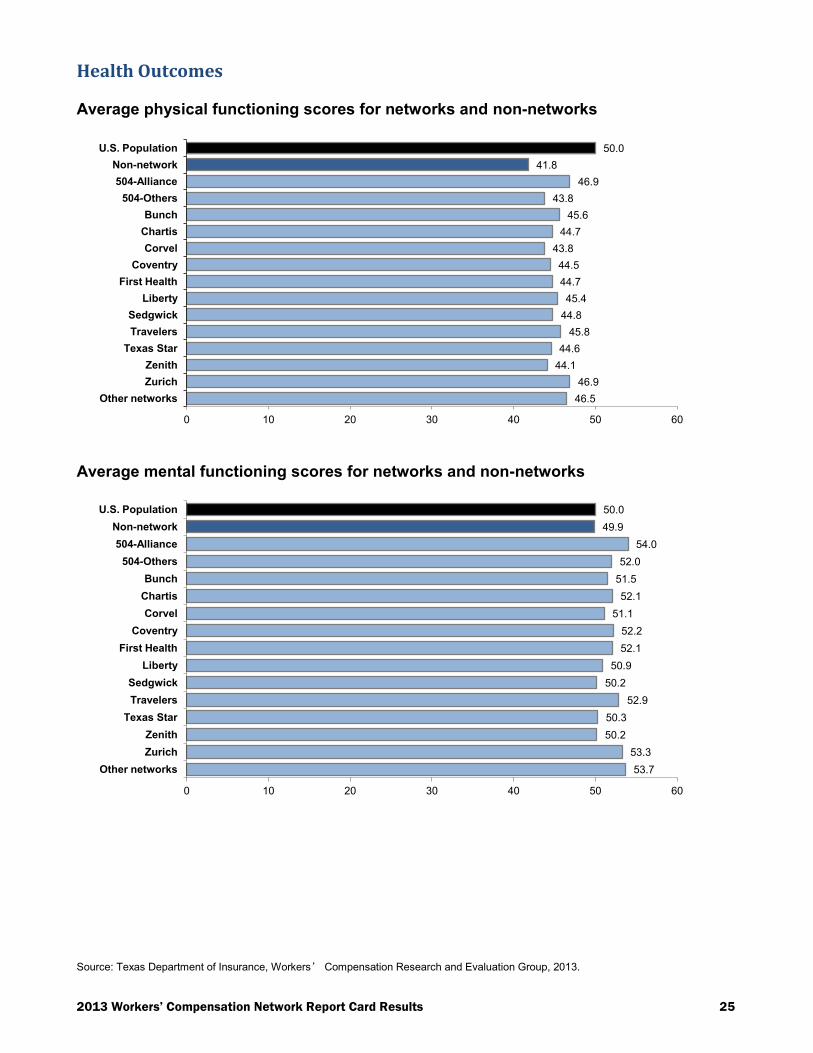
Health Outcomes • All network entities had higher physical functioning scores among their injured employees
than non-network injured employees. • All network entities surveyed had higher mental functioning scores among their injured
employees than Non-network injured employees and the U.S. population.

2013 Workers’ Compensation Network Report Card Results 8
Network Performance Summary Compared to Non-network
Health Care Costs
◉ Higher than non-network ○ Lower than non-network - Blanks indicate that there is no difference between the network and non-network
504-
All
ian
ce
504-
Oth
ers
Bu
nc
h
Ch
art
is
Co
rvel
Co
ven
try
Fir
st
Healt
h
Lib
ert
y
Sed
gw
ick
Tra
vele
rs
Te
xas
Sta
r
Ze
nit
h
Zu
rich
Oth
er
ne
two
rks
OVERALL ○ ○ ○ ◉ ◉ ◉ ◉ ◉ ○ ◉ ◉ ○ ○ ◉ PROFESSIONAL ○ ○ ◉ ◉ ◉ ◉ ◉ ◉ ◉ ◉ ◉ ○ ○ ◉ Evaluation & Management ○ ◉ ◉ ◉ ◉ ◉ ◉ ◉ ◉ ◉ ◉ ◉ ◉ ◉ PM-Modalities ○ ○ ○ ○ ○ ○ ○ ○ ○ ○ ○ ○ ○ ○ PM-Other ○ ○ ○ ○ ○ ○ ○ ○ ○ ◉ ○ ○ ○ ◉ DT-CT SCAN ○ ◉ ◉ ○ ◉ ◉ ◉ ◉ ◉ ◉ ○ ◉ ○ ◉ DT-MRI ○ ◉ ○
○ ◉ ○ ○ ◉ ○ ○ ○ ◉ ◉
DT-Nerve Conduction ○ ○ ○ ○ ○ ◉ ◉ ○ ○ ○ ○ ○ ○ ○ DT-Other ○ ◉ ○ ○ ◉ ◉ ○ ◉ ○ ○ ◉ ○ ◉ Spinal Surgery ○ ◉ ○ ○ ○ ◉ ○ ○ ◉ ○ ◉ ◉ ○ ◉ Other Surgery ○ ◉ ◉ ◉ ◉ ◉ ◉ ○ ◉ ○ ◉ ○ ○ ◉ Path. & Lab ○ ◉ ◉ ◉ ◉ ○ ○ ○ ◉ ○ ○ ○ ○ ○ All Others ○ ○ ○ ◉ ○ ○ ◉ ○ ○ ○ ○ ○ ○ ○ HOSPITAL ○ ◉ ◉ ◉ ◉ ◉ ◉ ◉ ○ ◉ ◉ ◉ ○ ◉ In-patient ○ ○ ○ ○ ◉ ○ ◉ ○ ○ ○ ◉ ◉ ○ ○ Out-patient ○ ◉ ◉ ◉ ◉ ◉ ◉ ◉ ◉ ◉ ◉ ○ ◉ ◉ Other ◉ ◉ ○ ○ ○ ○ ○ ◉ ○ ◉ ◉ ○ ○ ◉ PHARMACY ○ ○ ○ ◉ ◉ ◉ ◉ ◉ ○ ◉ ○ ○ ○ Analgesics-Opioid ○ ○ ○ ◉ ◉ ◉ ◉ ○ ◉ ○ ○ ○ ○ Analgesics-Anti-inflammatory ○ ○ ○ ○ ◉ ◉ ◉ ◉ ○ ◉ ○ ○ ○ ○ Musculoskeletal therapy ○ ○ ○ ○ ◉ ○ ◉ ○ ○ ◉ ○ ○ ○ ○ Central Nervous System Drugs ○ ◉ ○ ○ ◉ ○ ○ ◉ ○ ◉ ○ ○ ◉ ◉ Other ○ ○ ○ ◉ ◉ ◉ ◉ ○ ○ ◉ ○ ○ ◉ ○ Notes: PM-Other (other physical medicine) includes therapeutic procedures, orthotic/prosthetic management and training, cognitive rehabilitation, and chiropractic manipulative treatments.
Source: Texas Department of Insurance, Workers’ Compensation Research and Evaluation Group, 2013.
2013 Workers’ Compensation Network Report Card Results 9
Medical Utilization (Percentage of injured employees receiving each type of service)
◉ Higher than non-network ○ Lower than non-network - Blanks indicate that there is no difference between the network and non-network
504-
All
ian
ce
504-
Oth
ers
Bu
nc
h
Ch
art
is
Co
rvel
Co
ven
try
Fir
st
Healt
h
Lib
ert
y
Sed
gw
ick
Tra
vele
rs
Te
xas
Sta
r
Ze
nit
h
Zu
rich
Oth
er
ne
two
rks
PROFESSIONAL ◉ ◉ ◉ ◉ ◉ ◉ ◉ ◉ ◉ ◉ ◉ ◉ ◉ ◉ Evaluation & Management ◉ ◉ ◉ ◉ ◉ ◉ ◉ ◉ ◉ ◉ ◉ ◉ ◉ PM-Modalities ◉ ○ ◉ ◉ ◉ ◉ ◉ ◉ ◉ ○ ◉ ◉ PM-Other ○ ○ ◉ ◉ ◉ ◉ ◉ ◉ ◉ ◉ ◉ ◉ ◉ ◉ DT-CT SCAN ◉ ○ ◉ ◉ DT-MRI ○ ◉ ◉ ○ ○ ◉ ○ ◉ ○ ○ ○ ○ ◉ DT-Nerve Conduction ○ ◉ ◉ ◉ ◉ ◉ DT-Other
◉ ○ ◉ ◉ ◉ ◉ ◉ ◉ ◉ ◉ ○ ◉ ○
Spinal Surgery ◉ ◉ ◉ ◉ ◉ ◉ ○ Other Surgery ○ ○ ◉ ◉ ◉ ◉ ○ ◉ ◉ ◉ ◉ ◉ Path. & Lab ○ ○ ○ ○ ◉ ◉ ○ ○ ◉ ○ ◉ ◉ All Others ○ ◉ ◉ ◉ ◉ ◉ ◉ ◉ ◉ ◉ ◉ ◉ ◉ ◉ HOSPITAL ◉ ◉ ○ ○ ○ ○ ○ ○ ○ ○ ○ ○ ○ In-patient ○ ○ ◉ ◉ ◉ ◉ ◉ ○ ◉ ◉ ◉ ◉ Out-patient ◉ ○ ○ ○ ○ ○ ○ ○ ○ ○ PHARMACY ○ ◉ ◉ ○ ◉ ◉ ◉ ◉ ◉ ◉ ◉ ○ ◉ ◉ Analgesics-Opioid ○ ◉ ○ ◉ ◉ ○ ◉ ◉ ◉ ○ ◉ ○ ◉ Analgesics-Anti-inflammatory ○ ◉ ◉ ◉ ◉ ◉ ◉ ◉ ◉ ◉ ◉ ◉ ◉ ◉ Musculoskeletal therapy ○ ◉ ◉ ◉ ◉ ◉ ◉ ◉ ○ ○ ○ ◉ Central Nervous System Drugs ○ ○ ◉ ◉ ○ ○ ○ ○ ○ ○ Other ○ ○ ○ ◉ ○ ○ ○ ○ ◉ ◉ ◉ ◉ Note: PM-Other (other physical medicine) includes therapeutic procedures, orthotic/prosthetic management and training, cognitive rehabilitation, and chiropractic manipulative treatments.
Source: Texas Department of Insurance, Workers’ Compensation Research and Evaluation Group, 2013.
2013 Workers’ Compensation Network Report Card Results 10
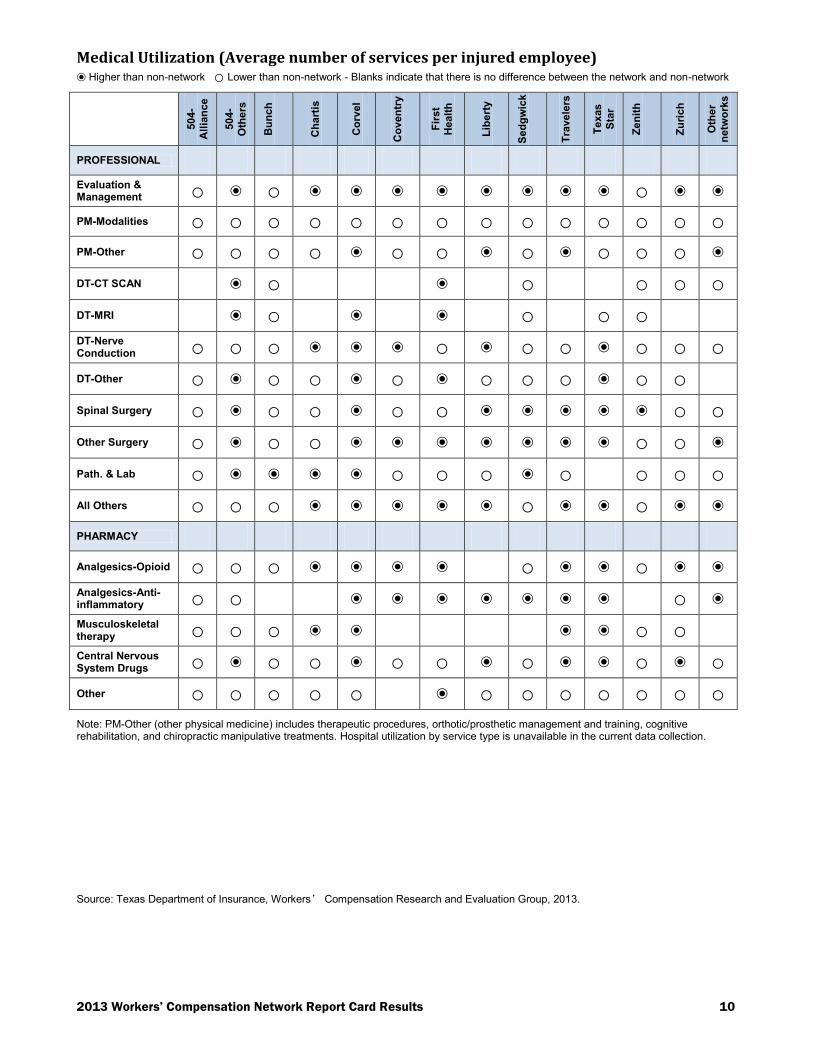
Medical Utilization (Average number of services per injured employee)
◉ Higher than non-network ○ Lower than non-network - Blanks indicate that there is no difference between the network and non-network
504-
All
ian
ce
504-
Oth
ers
Bu
nc
h
Ch
art
is
Co
rvel
Co
ven
try
Fir
st
Healt
h
Lib
ert
y
Sed
gw
ick
Tra
vele
rs
Te
xas
Sta
r
Ze
nit
h
Zu
rich
Oth
er
ne
two
rks
PROFESSIONAL Evaluation & Management ○ ◉ ○ ◉ ◉ ◉ ◉ ◉ ◉ ◉ ◉ ○ ◉ ◉ PM-Modalities ○ ○ ○ ○ ○ ○ ○ ○ ○ ○ ○ ○ ○ ○ PM-Other ○ ○ ○ ○ ◉ ○ ○ ◉ ○ ◉ ○ ○ ○ ◉ DT-CT SCAN ◉ ○ ◉ ○ ○ ○ ○ DT-MRI
◉ ○
◉
◉
○
○ ○
DT-Nerve Conduction ○ ○ ○ ◉ ◉ ◉ ○ ◉ ○ ○ ◉ ○ ○ ○ DT-Other ○ ◉ ○ ○ ◉ ○ ◉ ○ ○ ○ ◉ ○ ○ Spinal Surgery ○ ◉ ○ ○ ◉ ○ ○ ◉ ◉ ◉ ◉ ◉ ○ ○ Other Surgery ○ ◉ ○ ○ ◉ ◉ ◉ ◉ ◉ ◉ ◉ ○ ○ ◉ Path. & Lab ○ ◉ ◉ ◉ ◉ ○ ○ ○ ◉ ○ ○ ○ ○ All Others ○ ○ ○ ◉ ◉ ◉ ◉ ◉ ○ ◉ ◉ ○ ◉ ◉ PHARMACY Analgesics-Opioid ○ ○ ○ ◉ ◉ ◉ ◉ ○ ◉ ◉ ○ ◉ ◉ Analgesics-Anti-inflammatory ○ ○ ◉ ◉ ◉ ◉ ◉ ◉ ◉ ○ ◉ Musculoskeletal therapy ○ ○ ○ ◉ ◉ ◉ ◉ ○ ○ Central Nervous System Drugs ○ ◉ ○ ○ ◉ ○ ○ ◉ ○ ◉ ◉ ○ ◉ ○ Other ○ ○ ○ ○ ○ ◉ ○ ○ ○ ○ ○ ○ ○ Note: PM-Other (other physical medicine) includes therapeutic procedures, orthotic/prosthetic management and training, cognitive rehabilitation, and chiropractic manipulative treatments. Hospital utilization by service type is unavailable in the current data collection.
Source: Texas Department of Insurance, Workers’ Compensation Research and Evaluation Group, 2013.
2013 Workers’ Compensation Network Report Card Results 11
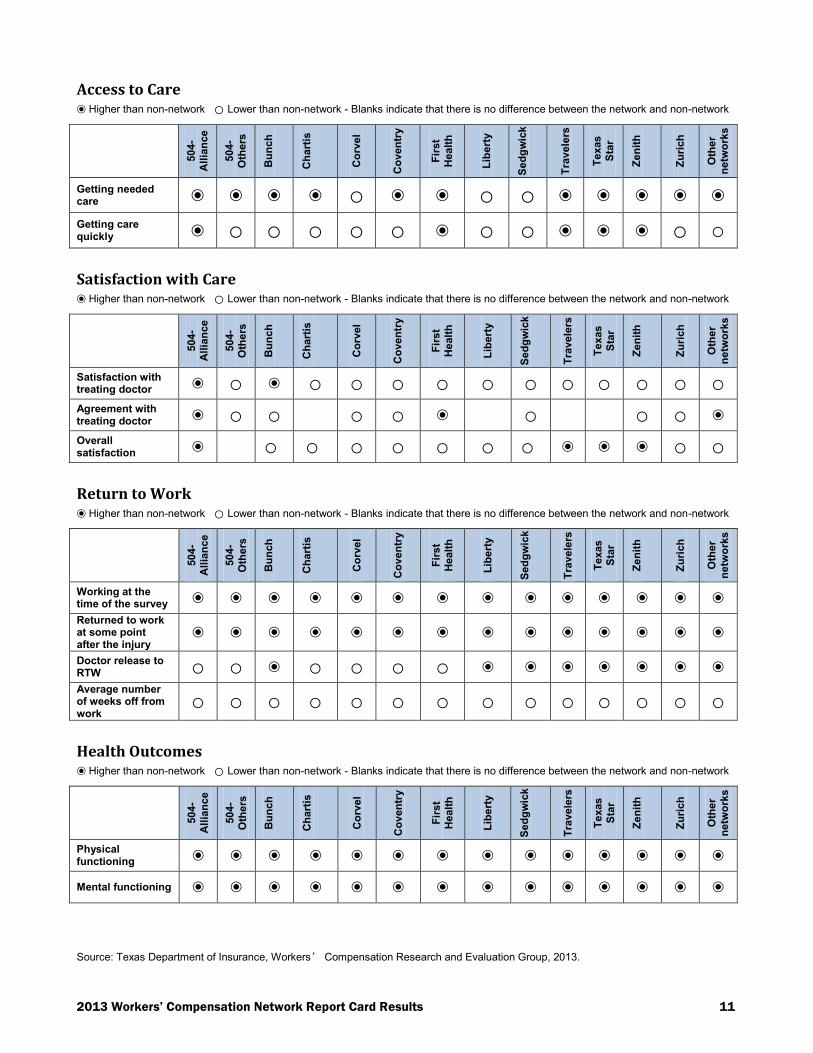
Access to Care
◉ Higher than non-network ○ Lower than non-network - Blanks indicate that there is no difference between the network and non-network
504-
All
ian
ce
504-
Oth
ers
Bu
nc
h
Ch
art
is
Co
rvel
Co
ven
try
Fir
st
Healt
h
Lib
ert
y
Sed
gw
ick
Tra
vele
rs
Te
xas
Sta
r
Ze
nit
h
Zu
rich
Oth
er
ne
two
rks
Getting needed care ◉ ◉ ◉ ◉ ○ ◉ ◉ ○ ○ ◉ ◉ ◉ ◉ ◉ Getting care quickly ◉ ○ ○ ○ ○ ○ ◉ ○ ○ ◉ ◉ ◉ ○ ○
Satisfaction with Care
◉ Higher than non-network ○ Lower than non-network - Blanks indicate that there is no difference between the network and non-network
504-
All
ian
ce
504-
Oth
ers
Bu
nc
h
Ch
art
is
Co
rvel
Co
ven
try
Fir
st
Healt
h
Lib
ert
y
Sed
gw
ick
Tra
vele
rs
Te
xas
Sta
r
Ze
nit
h
Zu
rich
Oth
er
ne
two
rks
Satisfaction with treating doctor ◉ ○ ◉ ○ ○ ○ ○ ○ ○ ○ ○ ○ ○ ○ Agreement with treating doctor ◉ ○ ○ ○ ○ ◉ ○ ○ ○ ◉ Overall satisfaction ◉
○ ○ ○ ○ ○ ○ ○ ◉ ◉ ◉ ○ ○
Return to Work
◉ Higher than non-network ○ Lower than non-network - Blanks indicate that there is no difference between the network and non-network
504-
All
ian
ce
504-
Oth
ers
Bu
nc
h
Ch
art
is
Co
rvel
Co
ven
try
Fir
st
Healt
h
Lib
ert
y
Sed
gw
ick
Tra
vele
rs
Te
xas
Sta
r
Ze
nit
h
Zu
rich
Oth
er
ne
two
rks
Working at the time of the survey ◉ ◉ ◉ ◉ ◉ ◉ ◉ ◉ ◉ ◉ ◉ ◉ ◉ ◉ Returned to work at some point after the injury
◉ ◉ ◉ ◉ ◉ ◉ ◉ ◉ ◉ ◉ ◉ ◉ ◉ ◉ Doctor release to RTW ○ ○ ◉ ○ ○ ○ ○ ◉ ◉ ◉ ◉ ◉ ◉ ◉ Average number of weeks off from work
○ ○ ○ ○ ○ ○ ○ ○ ○ ○ ○ ○ ○ ○
Health Outcomes
◉ Higher than non-network ○ Lower than non-network - Blanks indicate that there is no difference between the network and non-network
504-
All
ian
ce
504-
Oth
ers
Bu
nc
h
Ch
art
is
Co
rvel
Co
ven
try
Fir
st
Healt
h
Lib
ert
y
Sed
gw
ick
Tra
vele
rs
Te
xas
Sta
r
Ze
nit
h
Zu
rich
Oth
er
ne
two
rks
Physical functioning ◉ ◉ ◉ ◉ ◉ ◉ ◉ ◉ ◉ ◉ ◉ ◉ ◉ ◉ Mental functioning ◉ ◉ ◉ ◉ ◉ ◉ ◉ ◉ ◉ ◉ ◉ ◉ ◉ ◉
Source: Texas Department of Insurance, Workers’ Compensation Research and Evaluation Group, 2013.

2013 Workers’ Compensation Network Report Card Results 12
Health Care Costs (Overall)
Average overall medical cost per claim, six months post injury
All claims Lost-time claims Medical-only claims
Note: As some networks reduce their percentage of lost-time claims to mainly high-severity high-costs claims, they may experience increases in their lost-time average costs. Average medical cost for medical-only claims may also increase as the relative share of that group increases with the types of higher cost claims previously classified as lost-time.
Source: Texas Department of Insurance, Workers’ Compensation Research and Evaluation Group, 2013.
$2,633
$2,096
$2,535
$2,627
$3,057
$3,497
$2,967
$3,186
$2,765
$2,628
$2,743
$3,051
$2,514
$2,415
$2,950
$0 $1,000 $2,000 $3,000 $4,000 $5,000 $6,000 $7,000 $8,000 $9,000 $10,000
Non-network
504-Alliance
504-Others
Bunch
Chartis
Corvel
Coventry
First Health
Liberty
Sedgwick
Travelers
Texas Star
Zenith
Zurich
Other networks
$7,672
$6,598
$6,734
$9,910
$9,694
$7,930
$7,669
$9,224
$7,887
$6,832
$8,805
$7,803
$7,575
$8,624
$7,861
$0 $1,000 $2,000 $3,000 $4,000 $5,000 $6,000 $7,000 $8,000 $9,000 $10,000
Non-network
504-Alliance
504-Others
Bunch
Chartis
Corvel
Coventry
First Health
Liberty
Sedgwick
Travelers
Texas Star
Zenith
Zurich
Other networks
$1,134
$887
$1,085
$1,397
$1,113
$1,176
$1,301
$1,183
$1,118
$1,066
$1,140
$958
$1,048
$1,284
$1,079
$0 $1,000 $2,000 $3,000 $4,000 $5,000 $6,000 $7,000 $8,000 $9,000 $10,000
Non-network
504-Alliance
504-Others
Bunch
Chartis
Corvel
Coventry
First Health
Liberty
Sedgwick
Travelers
Texas Star
Zenith
Zurich
Other networks

2013 Workers’ Compensation Network Report Card Results 13
Health Care Costs (Professional)
Average professional cost per claim, six months post injury All claims Lost-time claims Medical-only claims
Source: Texas Department of Insurance, Workers’ Compensation Research and Evaluation Group, 2013.
$1,711
$1,368
$1,513
$1,821
$1,907
$2,034
$2,036
$1,992
$1,883
$2,056
$1,743
$1,726
$1,573
$1,672
$2,110
$0 $1,000 $2,000 $3,000 $4,000 $5,000 $6,000 $7,000 $8,000 $9,000 $10,000
Non-network
504-Alliance
504-Others
Bunch
Chartis
Corvel
Coventry
First Health
Liberty
Sedgwick
Travelers
Texas Star
Zenith
Zurich
Other networks
$4,426
$3,934
$3,618
$5,818
$5,358
$4,207
$4,839
$5,075
$4,716
$4,987
$4,908
$3,924
$4,074
$5,148
$5,229
$0 $1,000 $2,000 $3,000 $4,000 $5,000 $6,000 $7,000 $8,000 $9,000 $10,000
Non-network
504-Alliance
504-Others
Bunch
Chartis
Corvel
Coventry
First Health
Liberty
Sedgwick
Travelers
Texas Star
Zenith
Zurich
Other networks
$851
$664
$774
$1,117
$842
$883
$1,023
$937
$938
$939
$869
$706
$817
$1,009
$886
$0 $1,000 $2,000 $3,000 $4,000 $5,000 $6,000 $7,000 $8,000 $9,000 $10,000
Non-network
504-Alliance
504-Others
Bunch
Chartis
Corvel
Coventry
First Health
Liberty
Sedgwick
Travelers
Texas Star
Zenith
Zurich
Other networks

2013 Workers’ Compensation Network Report Card Results 14
Health Care Costs (Hospital)
Average hospital cost per claim, six months post injury All claims Lost-time claims Medical-only claims
Note: As some networks reduce hospital utilization to mainly high-severity high-costs claims, they may experience increases in their average hospital costs.
Source: Texas Department of Insurance, Workers’ Compensation Research and Evaluation Group, 2013.
$2,639
$1,921
$2,642
$2,764
$3,160
$4,095
$3,256
$3,784
$3,259
$2,480
$3,334
$3,887
$3,726
$2,557
$3,229
$0 $1,000 $2,000 $3,000 $4,000 $5,000 $6,000 $7,000 $8,000 $9,000 $10,000
Non-network
504-Alliance
504-Others
Bunch
Chartis
Corvel
Coventry
First Health
Liberty
Sedgwick
Travelers
Texas Star
Zenith
Zurich
Other networks
$5,676
$4,696
$4,307
$7,279
$7,322
$6,631
$6,197
$7,550
$5,971
$4,547
$6,703
$6,959
$8,376
$5,876
$5,640
$0 $1,000 $2,000 $3,000 $4,000 $5,000 $6,000 $7,000 $8,000 $9,000 $10,000
Non-network
504-Alliance
504-Others
Bunch
Chartis
Corvel
Coventry
First Health
Liberty
Sedgwick
Travelers
Texas Star
Zenith
Zurich
Other networks
$983
$642
$1,050
$1,086
$823
$1,042
$1,158
$942
$902
$683
$1,087
$974
$1,122
$1,096
$1,005
$0 $1,000 $2,000 $3,000 $4,000 $5,000 $6,000 $7,000 $8,000 $9,000 $10,000
Non-network
504-Alliance
504-Others
Bunch
Chartis
Corvel
Coventry
First Health
Liberty
Sedgwick
Travelers
Texas Star
Zenith
Zurich
Other networks
2013 Workers’ Compensation Network Report Card Results 15
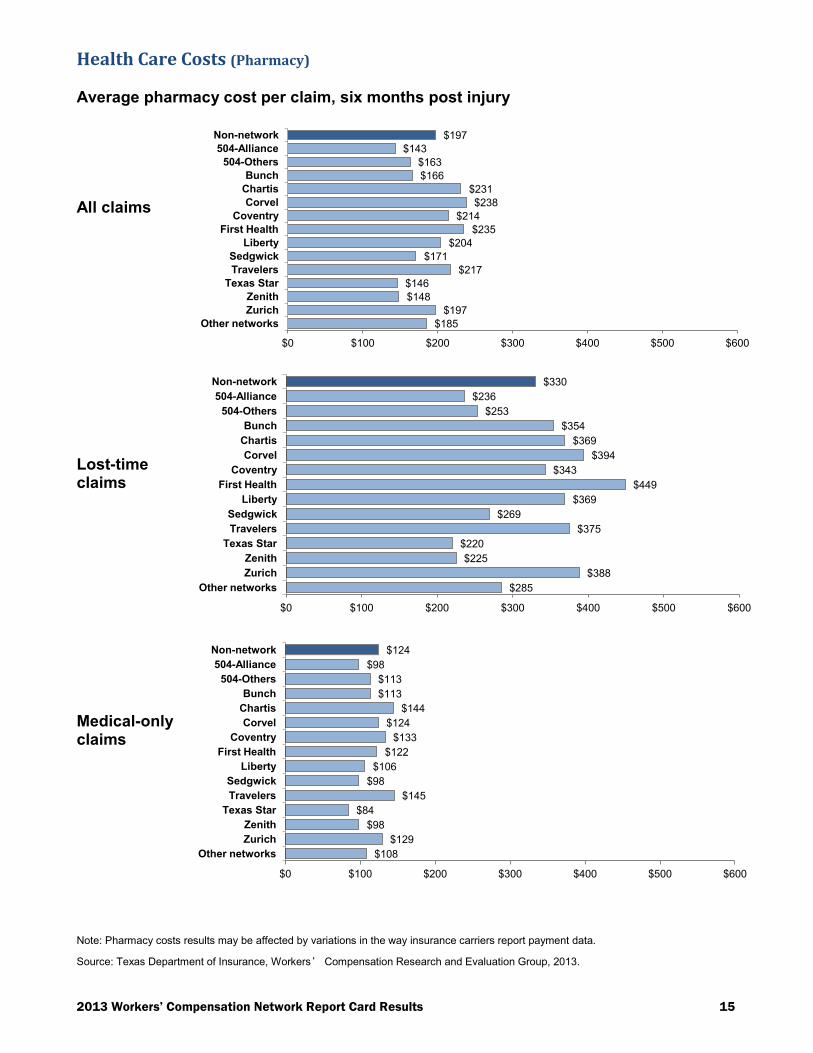
Health Care Costs (Pharmacy)
Average pharmacy cost per claim, six months post injury All claims Lost-time claims Medical-only claims
Note: Pharmacy costs results may be affected by variations in the way insurance carriers report payment data.
Source: Texas Department of Insurance, Workers’ Compensation Research and Evaluation Group, 2013.
$197
$143
$163
$166
$231
$238
$214
$235
$204
$171
$217
$146
$148
$197
$185
$0 $100 $200 $300 $400 $500 $600
Non-network
504-Alliance
504-Others
Bunch
Chartis
Corvel
Coventry
First Health
Liberty
Sedgwick
Travelers
Texas Star
Zenith
Zurich
Other networks
$330
$236
$253
$354
$369
$394
$343
$449
$369
$269
$375
$220
$225
$388
$285
$0 $100 $200 $300 $400 $500 $600
Non-network
504-Alliance
504-Others
Bunch
Chartis
Corvel
Coventry
First Health
Liberty
Sedgwick
Travelers
Texas Star
Zenith
Zurich
Other networks
$124
$98
$113
$113
$144
$124
$133
$122
$106
$98
$145
$84
$98
$129
$108
$0 $100 $200 $300 $400 $500 $600
Non-network
504-Alliance
504-Others
Bunch
Chartis
Corvel
Coventry
First Health
Liberty
Sedgwick
Travelers
Texas Star
Zenith
Zurich
Other networks
2013 Workers’ Compensation Network Report Card Results 16
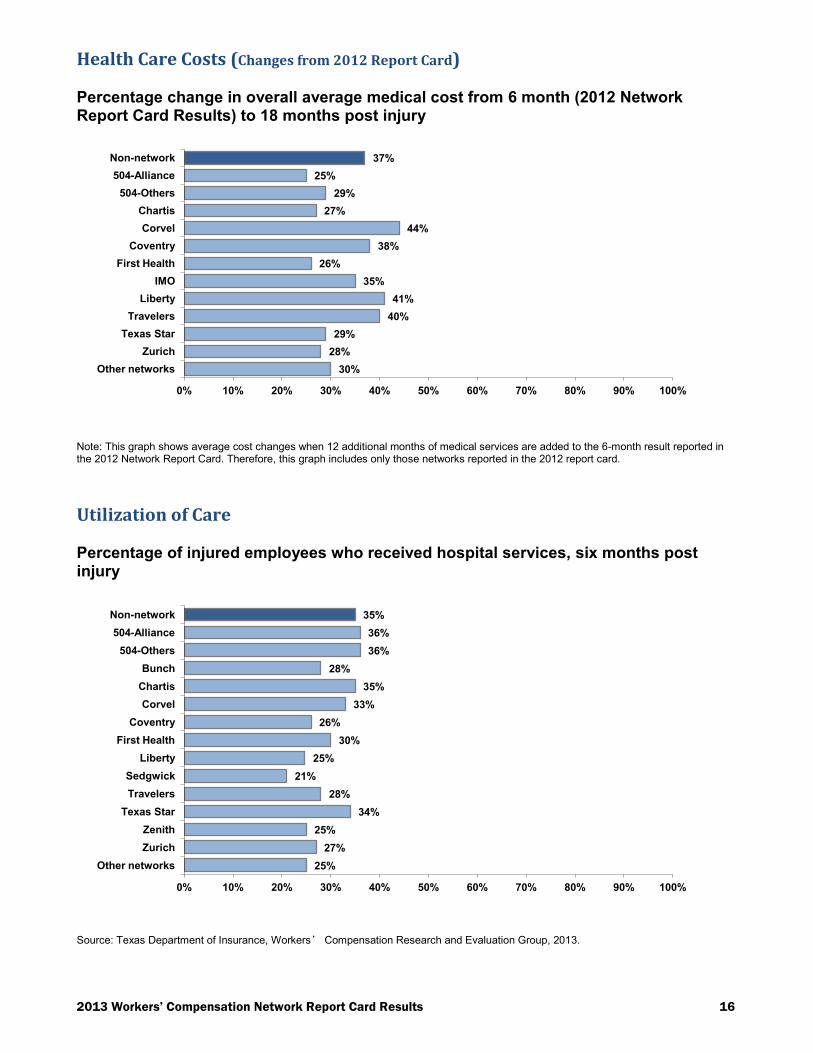
Health Care Costs (Changes from 2012 Report Card)
Percentage change in overall average medical cost from 6 month (2012 Network Report Card Results) to 18 months post injury
Note: This graph shows average cost changes when 12 additional months of medical services are added to the 6-month result reported in the 2012 Network Report Card. Therefore, this graph includes only those networks reported in the 2012 report card.
Utilization of Care
Percentage of injured employees who received hospital services, six months post injury
Source: Texas Department of Insurance, Workers’ Compensation Research and Evaluation Group, 2013.
37%
25%
29%
27%
44%
38%
26%
35%
41%
40%
29%
28%
30%
0% 10% 20% 30% 40% 50% 60% 70% 80% 90% 100%
Non-network
504-Alliance
504-Others
Chartis
Corvel
Coventry
First Health
IMO
Liberty
Travelers
Texas Star
Zurich
Other networks
35%
36%
36%
28%
35%
33%
26%
30%
25%
21%
28%
34%
25%
27%
25%
0% 10% 20% 30% 40% 50% 60% 70% 80% 90% 100%
Non-network
504-Alliance
504-Others
Bunch
Chartis
Corvel
Coventry
First Health
Liberty
Sedgwick
Travelers
Texas Star
Zenith
Zurich
Other networks

2013 Workers’ Compensation Network Report Card Results 17
Utilization of Care (Continued)
Percentage of injured employees who received pharmacy services, six months post injury
Average number of prescriptions per injured employee, six months post injury
Source: Texas Department of Insurance, Workers’ Compensation Research and Evaluation Group, 2013.
42%
34%
54%
52%
40%
53%
50%
48%
52%
46%
49%
50%
39%
49%
46%
0% 10% 20% 30% 40% 50% 60% 70% 80% 90% 100%
Non-network
504-Alliance
504-Others
Bunch
Chartis
Corvel
Coventry
First Health
Liberty
Sedgwick
Travelers
Texas Star
Zenith
Zurich
Other networks
4.0
2.9
3.9
3.7
4.4
4.7
4.2
4.2
4.1
4.4
4.4
4.3
3.8
3.9
4.3
0.0 1.0 2.0 3.0 4.0 5.0 6.0 7.0 8.0 9.0 10.0
Non-network
504-Alliance
504-Others
Bunch
Chartis
Corvel
Coventry
First Health
Liberty
Sedgwick
Travelers
Texas Star
Zenith
Zurich
Other networks
2013 Workers’ Compensation Network Report Card Results 18
Utilization of Care (Continued)
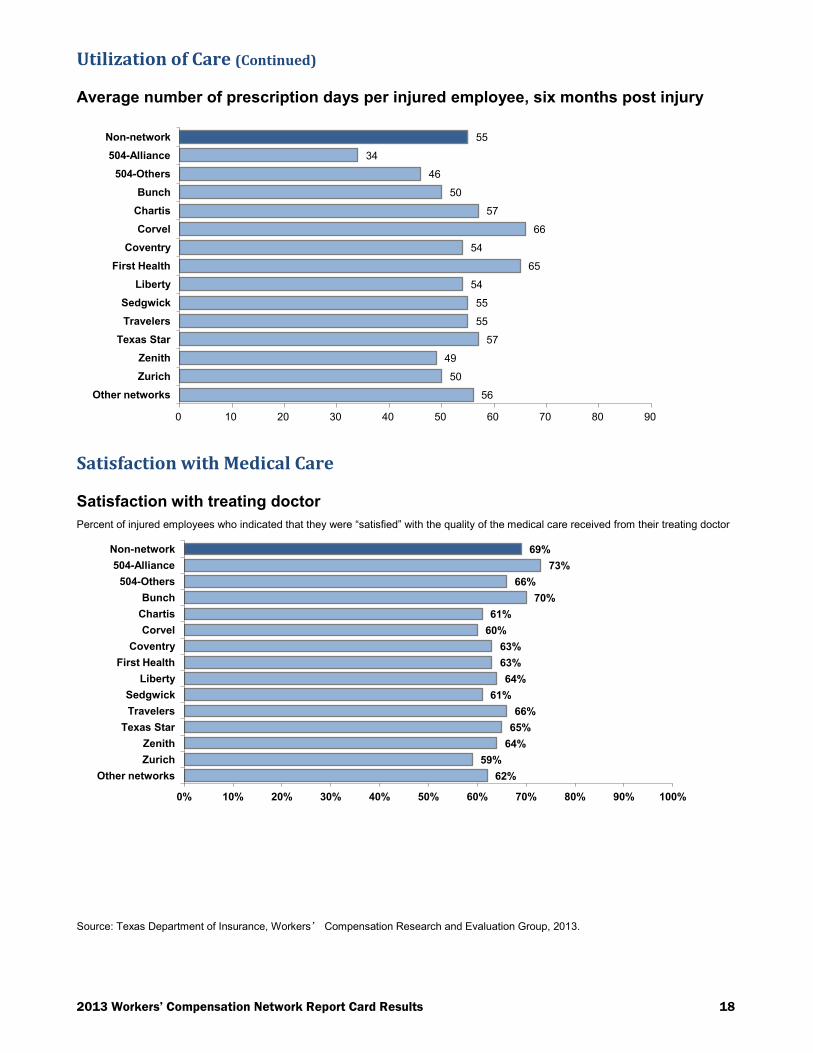
Average number of prescription days per injured employee, six months post injury
Satisfaction with Medical Care
Satisfaction with treating doctor
Percent of injured employees who indicated that they were “satisfied” with the quality of the medical care received from their treating doctor
Source: Texas Department of Insurance, Workers’ Compensation Research and Evaluation Group, 2013.
55
34
46
50
57
66
54
65
54
55
55
57
49
50
56
0 10 20 30 40 50 60 70 80 90
Non-network
504-Alliance
504-Others
Bunch
Chartis
Corvel
Coventry
First Health
Liberty
Sedgwick
Travelers
Texas Star
Zenith
Zurich
Other networks
69%
73%
66%
70%
61%
60%
63%
63%
64%
61%
66%
65%
64%
59%
62%
0% 10% 20% 30% 40% 50% 60% 70% 80% 90% 100%
Non-network
504-Alliance
504-Others
Bunch
Chartis
Corvel
Coventry
First Health
Liberty
Sedgwick
Travelers
Texas Star
Zenith
Zurich
Other networks
2013 Workers’ Compensation Network Report Card Results 19
Satisfaction with Medical Care (Continued)
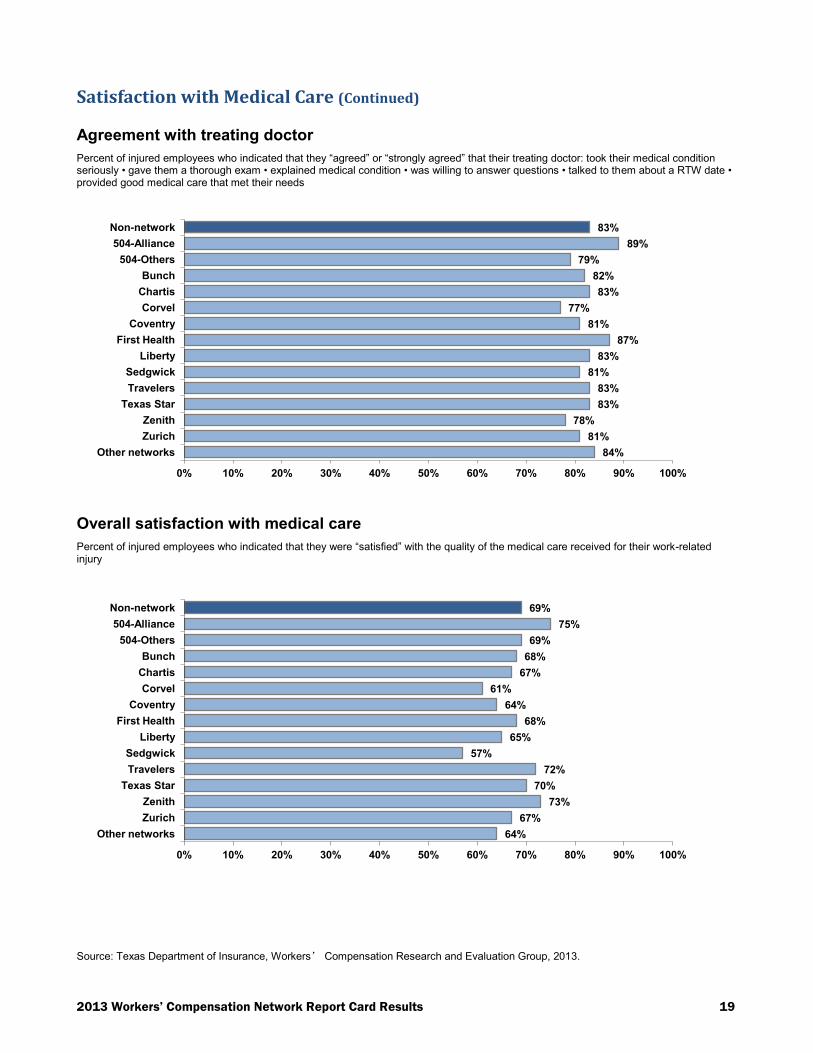
Agreement with treating doctor
Percent of injured employees who indicated that they “agreed” or “strongly agreed” that their treating doctor: took their medical condition seriously • gave them a thorough exam • explained medical condition • was willing to answer questions • talked to them about a RTW date • provided good medical care that met their needs
Overall satisfaction with medical care
Percent of injured employees who indicated that they were “satisfied” with the quality of the medical care received for their work-related injury
Source: Texas Department of Insurance, Workers’ Compensation Research and Evaluation Group, 2013.
83%
89%
79%
82%
83%
77%
81%
87%
83%
81%
83%
83%
78%
81%
84%
0% 10% 20% 30% 40% 50% 60% 70% 80% 90% 100%
Non-network
504-Alliance
504-Others
Bunch
Chartis
Corvel
Coventry
First Health
Liberty
Sedgwick
Travelers
Texas Star
Zenith
Zurich
Other networks
69%
75%
69%
68%
67%
61%
64%
68%
65%
57%
72%
70%
73%
67%
64%
0% 10% 20% 30% 40% 50% 60% 70% 80% 90% 100%
Non-network
504-Alliance
504-Others
Bunch
Chartis
Corvel
Coventry
First Health
Liberty
Sedgwick
Travelers
Texas Star
Zenith
Zurich
Other networks
2013 Workers’ Compensation Network Report Card Results 20
Satisfaction with Medical Care (Continued)
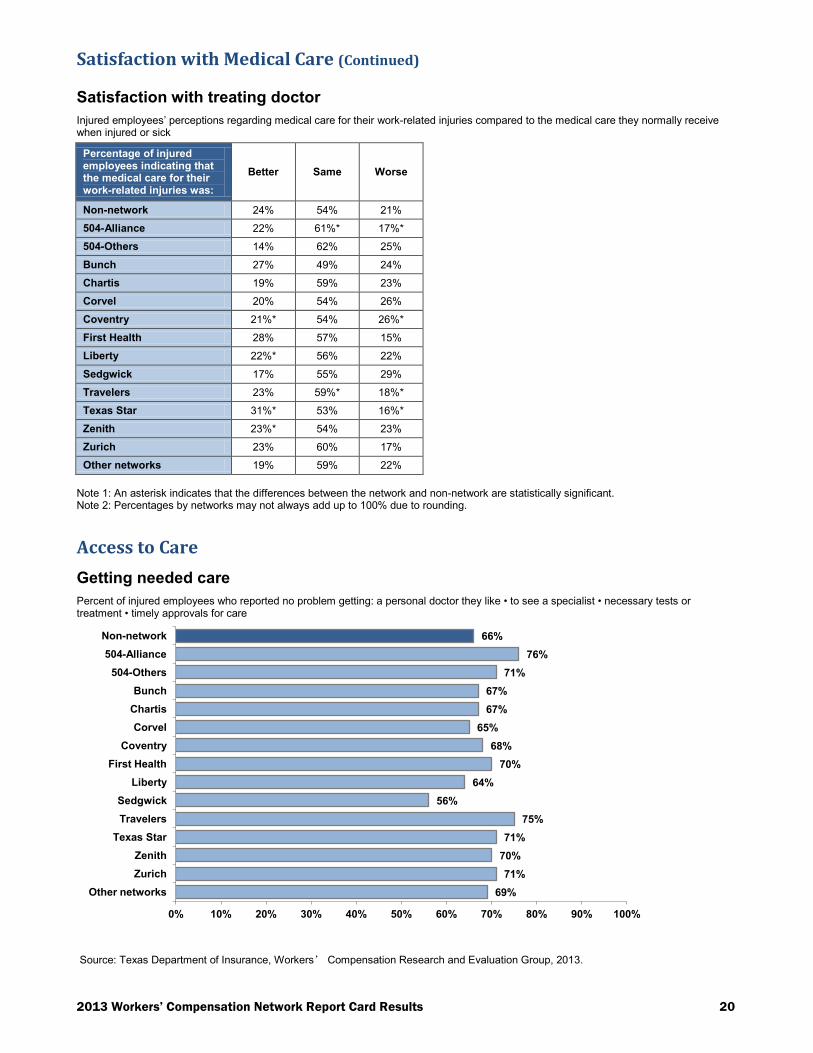
Satisfaction with treating doctor
Injured employees’ perceptions regarding medical care for their work-related injuries compared to the medical care they normally receive when injured or sick
Percentage of injured employees indicating that the medical care for their work-related injuries was:
Better Same Worse
Non-network 24% 54% 21%
504-Alliance 22% 61%* 17%*
504-Others 14% 62% 25%
Bunch 27% 49% 24%
Chartis 19% 59% 23%
Corvel 20% 54% 26%
Coventry 21%* 54% 26%*
First Health 28% 57% 15%
Liberty 22%* 56% 22%
Sedgwick 17% 55% 29%
Travelers 23% 59%* 18%*
Texas Star 31%* 53% 16%*
Zenith 23%* 54% 23%
Zurich 23% 60% 17%
Other networks 19% 59% 22%
Note 1: An asterisk indicates that the differences between the network and non-network are statistically significant. Note 2: Percentages by networks may not always add up to 100% due to rounding.
Access to Care
Getting needed care
Percent of injured employees who reported no problem getting: a personal doctor they like • to see a specialist • necessary tests or treatment • timely approvals for care
Source: Texas Department of Insurance, Workers’ Compensation Research and Evaluation Group, 2013.
66%
76%
71%
67%
67%
65%
68%
70%
64%
56%
75%
71%
70%
71%
69%
0% 10% 20% 30% 40% 50% 60% 70% 80% 90% 100%
Non-network
504-Alliance
504-Others
Bunch
Chartis
Corvel
Coventry
First Health
Liberty
Sedgwick
Travelers
Texas Star
Zenith
Zurich
Other networks
2013 Workers’ Compensation Network Report Card Results 21
Access to Care (Continued)
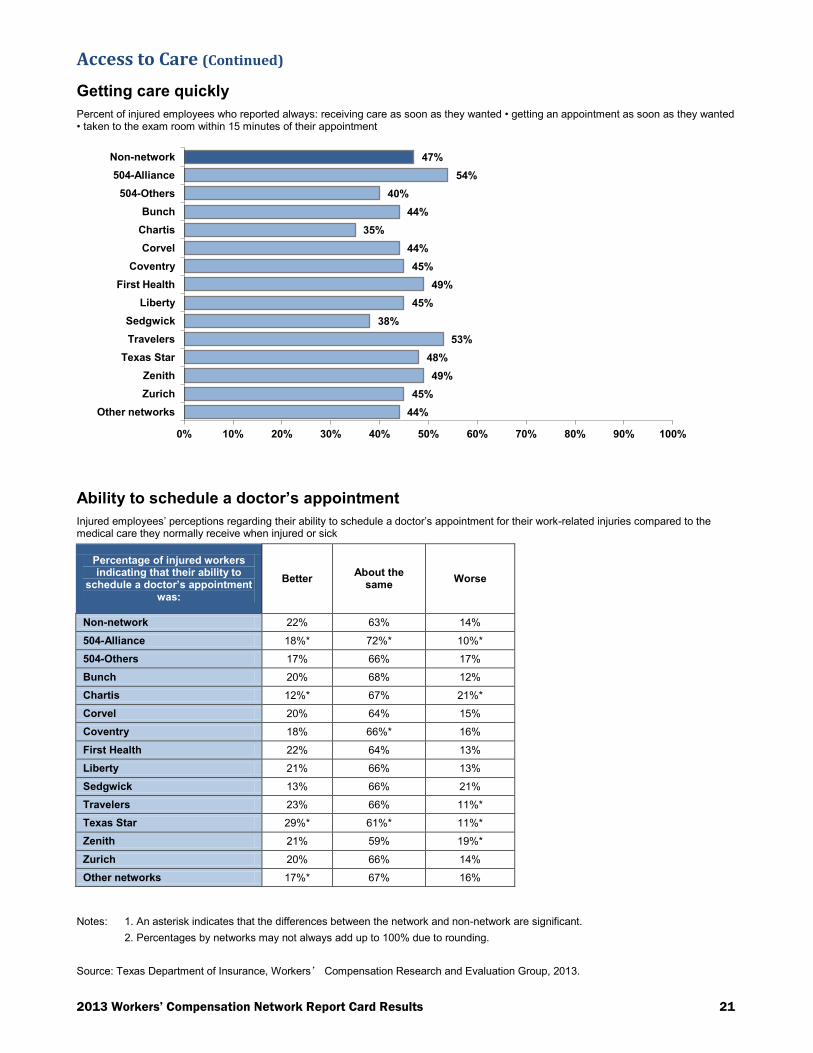
Getting care quickly
Percent of injured employees who reported always: receiving care as soon as they wanted • getting an appointment as soon as they wanted • taken to the exam room within 15 minutes of their appointment
Ability to schedule a doctor’s appointment
Injured employees’ perceptions regarding their ability to schedule a doctor’s appointment for their work-related injuries compared to the medical care they normally receive when injured or sick
Percentage of injured workers indicating that their ability to
schedule a doctor’s appointment was:
Better About the
same Worse
Non-network 22% 63% 14%
504-Alliance 18%* 72%* 10%*
504-Others 17% 66% 17%
Bunch 20% 68% 12%
Chartis 12%* 67% 21%*
Corvel 20% 64% 15%
Coventry 18% 66%* 16%
First Health 22% 64% 13%
Liberty 21% 66% 13%
Sedgwick 13% 66% 21%
Travelers 23% 66% 11%*
Texas Star 29%* 61%* 11%*
Zenith 21% 59% 19%*
Zurich 20% 66% 14%
Other networks 17%* 67% 16%
Notes: 1. An asterisk indicates that the differences between the network and non-network are significant.
2. Percentages by networks may not always add up to 100% due to rounding.
Source: Texas Department of Insurance, Workers’ Compensation Research and Evaluation Group, 2013.
47%
54%
40%
44%
35%
44%
45%
49%
45%
38%
53%
48%
49%
45%
44%
0% 10% 20% 30% 40% 50% 60% 70% 80% 90% 100%
Non-network
504-Alliance
504-Others
Bunch
Chartis
Corvel
Coventry
First Health
Liberty
Sedgwick
Travelers
Texas Star
Zenith
Zurich
Other networks
2013 Workers’ Compensation Network Report Card Results 22
Access to Care (Continued)
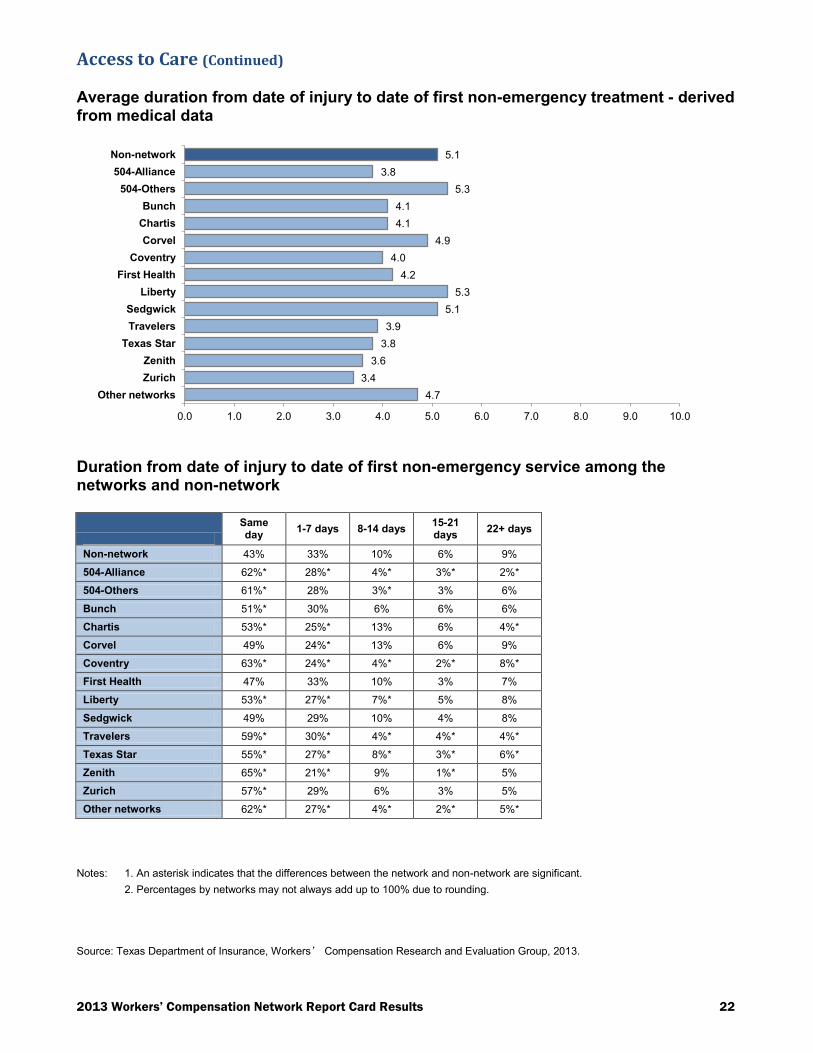
Average duration from date of injury to date of first non-emergency treatment - derived from medical data
Duration from date of injury to date of first non-emergency service among the networks and non-network
Same day
1-7 days 8-14 days 15-21 days
22+ days
Non-network 43% 33% 10% 6% 9%
504-Alliance 62%* 28%* 4%* 3%* 2%*
504-Others 61%* 28% 3%* 3% 6%
Bunch 51%* 30% 6% 6% 6%
Chartis 53%* 25%* 13% 6% 4%*
Corvel 49% 24%* 13% 6% 9%
Coventry 63%* 24%* 4%* 2%* 8%*
First Health 47% 33% 10% 3% 7%
Liberty 53%* 27%* 7%* 5% 8%
Sedgwick 49% 29% 10% 4% 8%
Travelers 59%* 30%* 4%* 4%* 4%*
Texas Star 55%* 27%* 8%* 3%* 6%*
Zenith 65%* 21%* 9% 1%* 5%
Zurich 57%* 29% 6% 3% 5%
Other networks 62%* 27%* 4%* 2%* 5%*
Notes: 1. An asterisk indicates that the differences between the network and non-network are significant.
2. Percentages by networks may not always add up to 100% due to rounding.
Source: Texas Department of Insurance, Workers’ Compensation Research and Evaluation Group, 2013.
5.1
3.8
5.3
4.1
4.1
4.9
4.0
4.2
5.3
5.1
3.9
3.8
3.6
3.4
4.7
0.0 1.0 2.0 3.0 4.0 5.0 6.0 7.0 8.0 9.0 10.0
Non-network
504-Alliance
504-Others
Bunch
Chartis
Corvel
Coventry
First Health
Liberty
Sedgwick
Travelers
Texas Star
Zenith
Zurich
Other networks

2013 Workers’ Compensation Network Report Card Results 23
Return to Work
Percentage of injured employees who indicated that they were currently working at the time they were surveyed
Percentage of injured employees who indicated that they went back to work at some point after their injury
Source: Texas Department of Insurance, Workers’ Compensation Research and Evaluation Group, 2013.
69%
85%
86%
78%
79%
81%
82%
76%
78%
80%
77%
78%
75%
78%
81%
50% 60% 70% 80% 90% 100%
Non-network
504-Alliance
504-Others
Bunch
Chartis
Corvel
Coventry
First Health
Liberty
Sedgwick
Travelers
Texas Star
Zenith
Zurich
Other networks
85%
96%
93%
97%
91%
92%
94%
92%
90%
95%
93%
91%
93%
94%
96%
50% 60% 70% 80% 90% 100%
Non-network
504-Alliance
504-Others
Bunch
Chartis
Corvel
Coventry
First Health
Liberty
Sedgwick
Travelers
Texas Star
Zenith
Zurich
Other networks

2013 Workers’ Compensation Network Report Card Results 24
Return to Work (Continued)
Average number of weeks injured employees reported being off work because of their work-related injury
Percentage of injured employees who had not returned to work and who reported that their doctor had released them to work with or without limitations
Source: Texas Department of Insurance, Workers’ Compensation Research and Evaluation Group, 2013.
20
5
8
8
13
11
10
12
12
15
10
11
9
8
9
0 5 10 15 20 25 30
Non-network
504-Alliance
504-Others
Bunch
Chartis
Corvel
Coventry
First Health
Liberty
Sedgwick
Travelers
Texas Star
Zenith
Zurich
Other networks
47%
45%
42%
80%
32%
39%
42%
26%
55%
75%
52%
49%
53%
57%
55%
0% 10% 20% 30% 40% 50% 60% 70% 80% 90% 100%
Non-network
504-Alliance
504-Others
Bunch
Chartis
Corvel
Coventry
First Health
Liberty
Sedgwick
Travelers
Texas Star
Zenith
Zurich
Other networks
2013 Workers’ Compensation Network Report Card Results 25
Health Outcomes
Average physical functioning scores for networks and non-networks
Average mental functioning scores for networks and non-networks
Source: Texas Department of Insurance, Workers’ Compensation Research and Evaluation Group, 2013.
50.0
41.8
46.9
43.8
45.6
44.7
43.8
44.5
44.7
45.4
44.8
45.8
44.6
44.1
46.9
46.5
0 10 20 30 40 50 60
U.S. Population
Non-network
504-Alliance
504-Others
Bunch
Chartis
Corvel
Coventry
First Health
Liberty
Sedgwick
Travelers
Texas Star
Zenith
Zurich
Other networks
50.0
49.9
54.0
52.0
51.5
52.1
51.1
52.2
52.1
50.9
50.2
52.9
50.3
50.2
53.3
53.7
0 10 20 30 40 50 60
U.S. Population
Non-network
504-Alliance
504-Others
Bunch
Chartis
Corvel
Coventry
First Health
Liberty
Sedgwick
Travelers
Texas Star
Zenith
Zurich
Other networks
2013 Workers’ Compensation Network Report Card Results 26
Appendix: Additional Network and Non-network
Comparisons
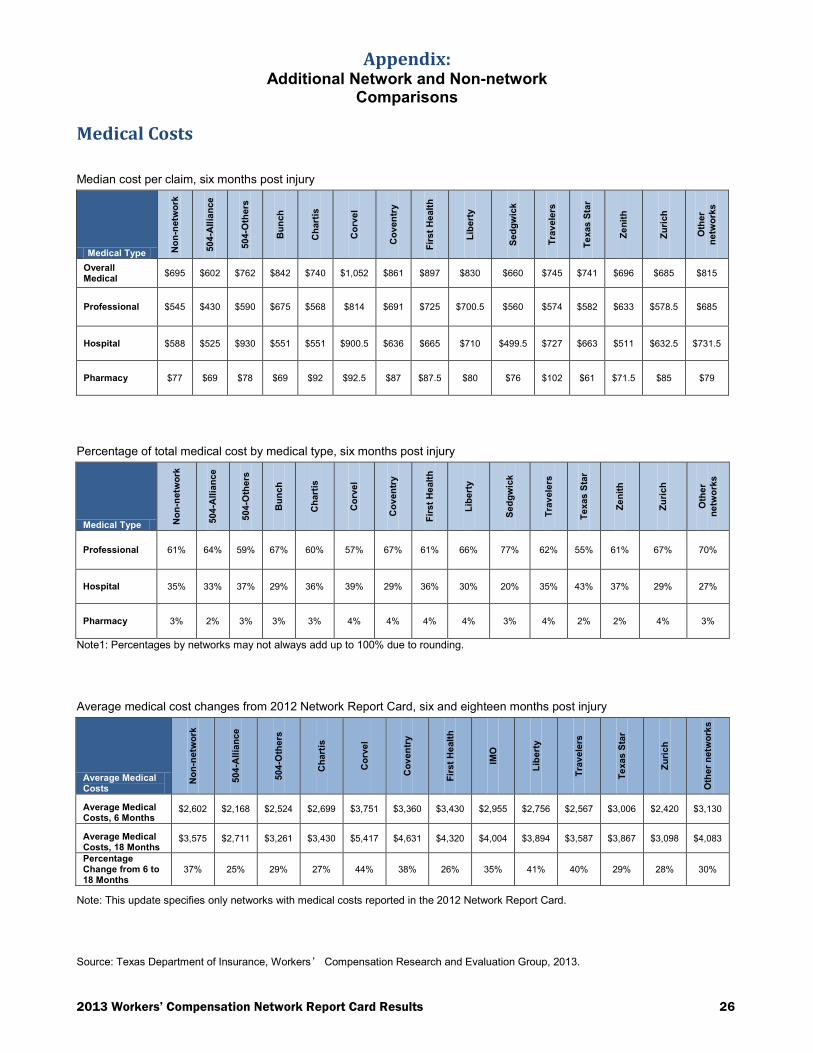
Medical Costs
Median cost per claim, six months post injury
Medical Type No
n-n
etw
ork
504
-All
ian
ce
504
-Oth
ers
Bu
nch
Ch
art
is
Co
rve
l
Co
ven
try
Fir
st
He
alt
h
Lib
ert
y
Sed
gw
ick
Tra
vele
rs
Te
xas
Sta
r
Ze
nit
h
Zu
rich
Oth
er
ne
two
rks
Overall Medical
$695 $602 $762 $842 $740 $1,052 $861 $897 $830 $660 $745 $741 $696 $685 $815
Professional $545 $430 $590 $675 $568 $814 $691 $725 $700.5 $560 $574 $582 $633 $578.5 $685
Hospital $588 $525 $930 $551 $551 $900.5 $636 $665 $710 $499.5 $727 $663 $511 $632.5 $731.5
Pharmacy $77 $69 $78 $69 $92 $92.5 $87 $87.5 $80 $76 $102 $61 $71.5 $85 $79
Percentage of total medical cost by medical type, six months post injury
Medical Type No
n-n
etw
ork
504
-All
ian
ce
504
-Oth
ers
Bu
nch
Ch
art
is
Co
rve
l
Co
ven
try
Fir
st
He
alt
h
Lib
ert
y
Sed
gw
ick
Tra
vele
rs
Te
xas
Sta
r
Ze
nit
h
Zu
rich
Oth
er
ne
two
rks
Professional 61% 64% 59% 67% 60% 57% 67% 61% 66% 77% 62% 55% 61% 67% 70%
Hospital 35% 33% 37% 29% 36% 39% 29% 36% 30% 20% 35% 43% 37% 29% 27%
Pharmacy 3% 2% 3% 3% 3% 4% 4% 4% 4% 3% 4% 2% 2% 4% 3%
Note1: Percentages by networks may not always add up to 100% due to rounding.
Average medical cost changes from 2012 Network Report Card, six and eighteen months post injury
Average Medical Costs
No
n-n
etw
ork
504
-All
ian
ce
504
-Oth
ers
Ch
art
is
Co
rve
l
Co
ven
try
Fir
st
He
alt
h
IMO
Lib
ert
y
Tra
vele
rs
Te
xas
Sta
r
Zu
rich
Oth
er
netw
ork
s
Average Medical Costs, 6 Months
$2,602 $2,168 $2,524 $2,699 $3,751 $3,360 $3,430 $2,955 $2,756 $2,567 $3,006 $2,420 $3,130
Average Medical Costs, 18 Months
$3,575 $2,711 $3,261 $3,430 $5,417 $4,631 $4,320 $4,004 $3,894 $3,587 $3,867 $3,098 $4,083
Percentage Change from 6 to 18 Months
37% 25% 29% 27% 44% 38% 26% 35% 41% 40% 29% 28% 30%
Note: This update specifies only networks with medical costs reported in the 2012 Network Report Card.
Source: Texas Department of Insurance, Workers’ Compensation Research and Evaluation Group, 2013.

2013 Workers’ Compensation Network Report Card Results 27
Professional Medical Costs
Average cost per claim for professional services by service type, 6 months post injury
Type of service
Evaluation & Management
PM-Modalities
PM-Other
DT-CT SCAN
DT-MRI DT-Nerve
Conduction DT-
Other Spinal
Surgery Other
Surgery Path. & Lab
All Others
Non-network $557 $162 $1,436 $204 $699 $1,048 $111 $3,837 $1,255 $141 $340
504-Alliance $466* $134* $1198* $180* $663* $958* $95* $2,833* $1,248 $117* $241*
504-Others $647* $111* $1,403 $262 $838* $900 $143* $7,523 $1,314 $146 $232*
Bunch $579 $146 $1247* $213 $648 $940 $105 $2,863 $1,455 $205 $272*
Chartis $599* $155 $1,431 $190 $699 $1,012 $104 $3,043 $1,317 $206 $428*
Corvel $643* $127* $1,241* $207 $649 $960 $111 $2,922 $1,445 $275* $288*
Coventry $626* $135* $1,391 $297* $963* $1,067 $113 $4,014 $1,372 $128 $335
First Health $637* $130* $1,194* $244 $691 $1,074 $123* $3,544 $1,330 $109 $390
Liberty $622* $72* $1,413 $241 $675 $770* $101* $3,780 $1,067* $86* $328
Sedgwick $622* $121* $1,366 $402* $1,719* $1,024 $123 $4,603 $1,679* $197 $247*
Travelers $591* $132* $1,511 $231 $680 $900* $104* $3,049 $1,014* $125 $274*
Texas Star $574* $123* $1,312* $191 $516* $721* $110 $3,959 $1,262 $74* $290*
Zenith $579 $76* $982* $212 $678 $858* $112 $6,255 $1,037 $64* $225*
Zurich $583 $104* $1,110* $158 $721 $938 $110 $2,478 $1,083 $93* $303
Other networks $628* $117* $1,682* $239 $709 $851* $124* $4,106 $1,448* $122 $312*
Hospital Costs
Average cost per claim for professional services by service type, 6 months post injury
Type of service In-patient Out-patient Other
Non-network $22,258 $1,603 $2,430
504-Alliance $19,981 $1,374* $2,631
504-Others $16,401 $2,013* $28015*
Bunch $20,078 $1,740 $2,016
Chartis $20,443 $1,785 $0
Corvel $22,913 $2,525* $1,572
Coventry $20,058 $2,163* $987*
First Health $28,447 $1,962* $1,031*
Liberty $19,792 $2,003* $8,362
Sedgwick $19,489 $2119* $567*
Travelers $21,043 $2,127* $2,515
Texas Star $23,452 $1,740* $2,963
Zenith $35,956 $1,526 $139*
Zurich $15,415* $1,657 $2,049
Other networks
$20,123 $2,293* $4,389
Notes 1: An asterisk indicates that the differences between the network and non-network are significant.
2: Extreme values may be the result of low claim counts.
Source: Texas Department of Insurance, Workers’ Compensation Research and Evaluation Group, 2013.

2013 Workers’ Compensation Network Report Card Results 28
Pharmacy Costs
Average cost per claim for pharmacy drug by type, 6 months post injury
Type of service No
n-n
etw
ork
504
-All
ian
ce
504
-Oth
ers
Bu
nch
Ch
art
is
Co
rve
l
Co
ven
try
Fir
st
He
alt
h
Lib
ert
y
Sed
gw
ick
Tra
vele
rs
Te
xas
Sta
r
Ze
nit
h
Zu
rich
Oth
er
ne
two
rks
Analgesics-Opioid
$72 $55* $46* $58* $78 $92* $72 $83 $74 $51* $86* $61* $58* $65 $68
Analgesics-Anti-inflammatory
$103 $84* $81* $82* $102 $115 $111 $117 $107 $82* $110* $66* $83* $90* $84*
Musculoskeletal therapy
$98 $83* $89 $71* $92 $117* $96 $126 $90 $79* $101 $67* $66* $83* $81*
Central Nervous System Drugs
$245 $172* $245 $237 $194 $282 $225 $222 $301 $179* $286 $201* $150* $404 $271
Other $120 90* $119 $109 $170 $122 $140* $145 $112 $106 $129 $90* $83* $140 $113
Professional Medical Utilization
Percent of workers receiving professional services by service type, 6 months post injury
Type of service
No
n-n
etw
ork
504
-All
ian
ce
504
-Oth
ers
Bu
nch
Ch
art
is
Co
rve
l
Co
ven
try
Fir
st
He
alt
h
Lib
ert
y
Sed
gw
ick
Tra
vele
rs
Te
xas
Sta
r
Ze
nit
h
Zu
rich
Oth
er
netw
ork
s
Evaluation & Management
96% 97%* 98%* 98%* 97%* 98%* 98%* 96%* 97%* 97%* 97%* 97%* 98%* 98%* 98%*
PM-Modalities 7% 8% 4%* 8% 9% 9%* 10%* 9%* 7% 9%* 10%* 7%* 6% 8% 11%*
PM-Other 25% 23%* 11%* 33%* 26% 33%* 34%* 32%* 35%* 30%* 29%* 28%* 30%* 30%* 33%*
DT-CT SCAN 2% 2%* 2% 2% 2% 2% 2%* 3% 2%* 1%* 2% 3%* 2% 2% 3%
DT-MRI 15% 14% 16% 16% 13% 14% 16%* 15% 13%* 17%* 13%* 14% 12% 13% 18%*
DT-Nerve Conduction
2% 1%* 2% 2% 2% 3% 2%* 2% 3%* 3% 2% 2%* 3% 2% 5%*
DT-Other 57% 57%* 64%* 56% 58% 62%* 58% 60% 60%* 59%* 58% 58%* 53%* 58% 55%*
Spinal Surgery 0.2% 0.2% 0.3% 0.5%* 0.3% 0.3% 0.2% 0.5%* 0.2% 0.2% 0.2% 0.2% 0.3% 0.1% 0.2%
Other Surgery 26% 21%* 17%* 26% 28%* 35%* 26% 29%* 28%* 23%* 28%* 31%* 30%* 27% 27%*
Path. & Lab 11% 8%* 6%* 9% 11% 8%* 13%* 15%* 6%* 8%* 13%* 10%* 20%* 21%* 11%
All Others 80% 78%* 96%* 87%* 81% 88%* 90%* 88%* 90%* 91%* 86%* 81%* 86%* 88%* 85%*
Note: An asterisk indicates that the differences between the network and non-network are significant.
Source: Texas Department of Insurance, Workers’ Compensation Research and Evaluation Group, 2013.
2013 Workers’ Compensation Network Report Card Results 29
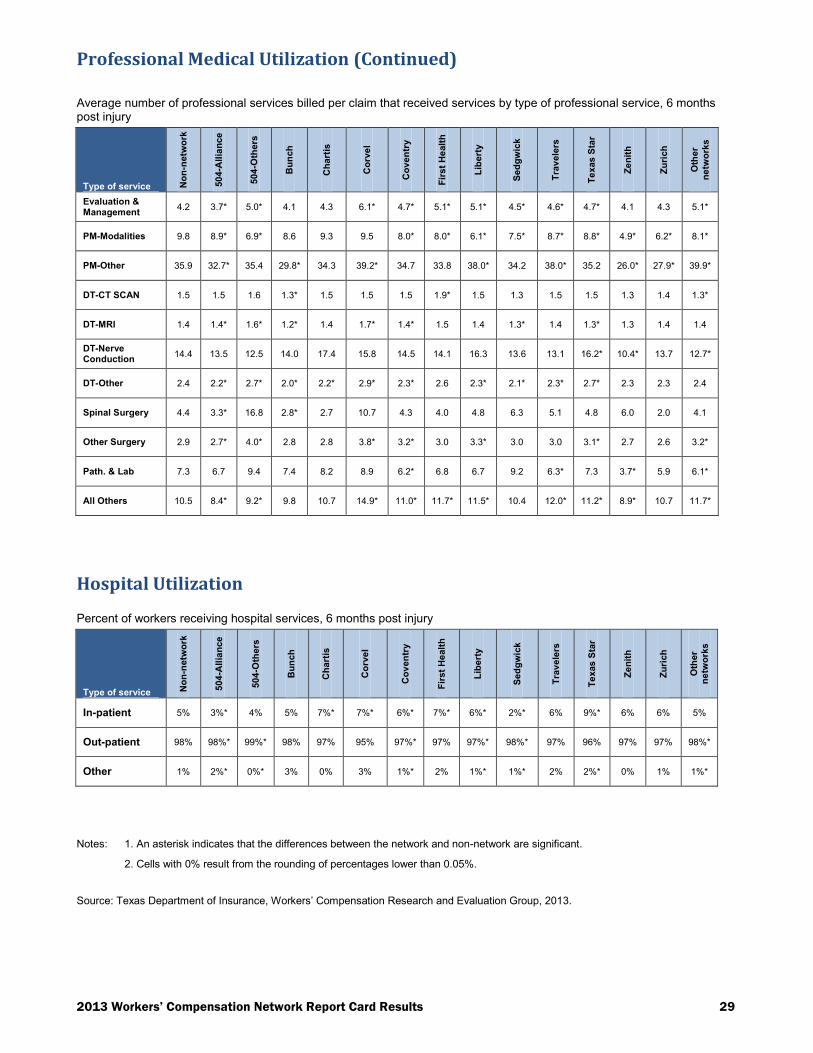
Professional Medical Utilization (Continued)
Average number of professional services billed per claim that received services by type of professional service, 6 months post injury
Type of service No
n-n
etw
ork
504
-All
ian
ce
504
-Oth
ers
Bu
nch
Ch
art
is
Co
rve
l
Co
ven
try
Fir
st
He
alt
h
Lib
ert
y
Sed
gw
ick
Tra
vele
rs
Te
xas
Sta
r
Ze
nit
h
Zu
rich
Oth
er
ne
two
rks
Evaluation & Management
4.2 3.7* 5.0* 4.1 4.3 6.1* 4.7* 5.1* 5.1* 4.5* 4.6* 4.7* 4.1 4.3 5.1*
PM-Modalities 9.8 8.9* 6.9* 8.6 9.3 9.5 8.0* 8.0* 6.1* 7.5* 8.7* 8.8* 4.9* 6.2* 8.1*
PM-Other 35.9 32.7* 35.4 29.8* 34.3 39.2* 34.7 33.8 38.0* 34.2 38.0* 35.2 26.0* 27.9* 39.9*
DT-CT SCAN 1.5 1.5 1.6 1.3* 1.5 1.5 1.5 1.9* 1.5 1.3 1.5 1.5 1.3 1.4 1.3*
DT-MRI 1.4 1.4* 1.6* 1.2* 1.4 1.7* 1.4* 1.5 1.4 1.3* 1.4 1.3* 1.3 1.4 1.4
DT-Nerve Conduction
14.4 13.5 12.5 14.0 17.4 15.8 14.5 14.1 16.3 13.6 13.1 16.2* 10.4* 13.7 12.7*
DT-Other 2.4 2.2* 2.7* 2.0* 2.2* 2.9* 2.3* 2.6 2.3* 2.1* 2.3* 2.7* 2.3 2.3 2.4
Spinal Surgery 4.4 3.3* 16.8 2.8* 2.7 10.7 4.3 4.0 4.8 6.3 5.1 4.8 6.0 2.0 4.1
Other Surgery 2.9 2.7* 4.0* 2.8 2.8 3.8* 3.2* 3.0 3.3* 3.0 3.0 3.1* 2.7 2.6 3.2*
Path. & Lab 7.3 6.7 9.4 7.4 8.2 8.9 6.2* 6.8 6.7 9.2 6.3* 7.3 3.7* 5.9 6.1*
All Others 10.5 8.4* 9.2* 9.8 10.7 14.9* 11.0* 11.7* 11.5* 10.4 12.0* 11.2* 8.9* 10.7 11.7*
Hospital Utilization
Percent of workers receiving hospital services, 6 months post injury
Type of service No
n-n
etw
ork
504
-All
ian
ce
504
-Oth
ers
Bu
nch
Ch
art
is
Co
rve
l
Co
ven
try
Fir
st
He
alt
h
Lib
ert
y
Sed
gw
ick
Tra
vele
rs
Te
xas
Sta
r
Ze
nit
h
Zu
rich
Oth
er
ne
two
rks
In-patient 5% 3%* 4% 5% 7%* 7%* 6%* 7%* 6%* 2%* 6% 9%* 6% 6% 5%
Out-patient 98% 98%* 99%* 98% 97% 95% 97%* 97% 97%* 98%* 97% 96% 97% 97% 98%*
Other 1% 2%* 0%* 3% 0% 3% 1%* 2% 1%* 1%* 2% 2%* 0% 1% 1%*
Notes: 1. An asterisk indicates that the differences between the network and non-network are significant.
2. Cells with 0% result from the rounding of percentages lower than 0.05%.
Source: Texas Department of Insurance, Workers’ Compensation Research and Evaluation Group, 2013.

2013 Workers’ Compensation Network Report Card Results 30
Pharmacy Utilization
Percent of workers receiving pharmacy drugs by type, 6 months post injury
Type of service No
n-n
etw
ork
504
-All
ian
ce
504
-Oth
ers
Bu
nch
Ch
art
is
Co
rve
l
Co
ven
try
Fir
st
He
alt
h
Lib
ert
y
Sed
gw
ick
Tra
vele
rs
Te
xas
Sta
r
Ze
nit
h
Zu
rich
Oth
er
netw
ork
s
Analgesics-Opioid
54% 49%* 67%* 53% 57% 60%* 52%* 56% 56% 62%* 53% 59%* 54% 51%* 56%
Analgesics-Anti-inflammatory
59% 58%* 64%* 69%* 62%* 65%* 65%* 62% 65%* 70%* 60%* 60% 60% 64% 65%*
Musculoskeletal therapy
33% 31%* 35% 35% 33% 35%* 37%* 35% 35% 41%* 31% 31%* 31% 37%* 33%
Central Nervous System Drugs
6% 5%* 5% 7% 7% 6% 5% 5% 5% 6% 5% 6%* 6% 4%* 5%
Other 42% 38% 31% 35%* 46% 40% 40%* 42%* 41%* 37%* 45% 42%* 43% 43% 47%
Mean number of prescriptions, 6 months post injury
Type of service
No
n-n
etw
ork
504
-All
ian
ce
504
-Oth
ers
Bu
nch
Ch
art
is
Co
rve
l
Co
ven
try
Fir
st
He
alt
h
Lib
ert
y
Sed
gw
ick
Tra
vele
rs
Te
xas
Sta
r
Ze
nit
h
Zu
rich
Oth
er
netw
ork
s
Analgesics-Opioid
2.4 1.9* 2.1* 2.2 2.7 2.7* 2.5 2.5 2.4 2.3 2.9* 2.7* 2.3 2.5 2.5
Analgesics-Anti-inflammatory
1.8 1.5* 1.7 1.8 1.8 2.0* 1.9* 1.9 1.9 2.0* 2.1* 1.9* 1.8 1.7 1.9*
Musculoskeletal therapy
1.9 1.5* 1.8 1.6* 2.1 2.2* 1.9 1.9 1.9 1.9 2.1* 2.0* 1.8 1.7* 1.9
Central Nervous Systems Drugs
2.4 1.9* 2.7 2.2 1.9* 2.7 2.2 1.8* 2.8 1.8* 2.7 2.7* 1.9* 2.9 2.0*
Other 2.0 1.6* 1.9 1.6* 1.9 1.8 2.0 2.1 1.7* 1.7* 1.8* 1.8* 1.9 1.7* 1.9
Mean number of drug days, 6 months post injury
Type of service
No
n-n
etw
ork
504
-All
ian
ce
504
-Oth
ers
Bu
nch
Ch
art
is
Co
rve
l
Co
ven
try
Fir
st
He
alt
h
Lib
ert
y
Sed
gw
ick
Tra
vele
rs
Te
xas
Sta
r
Ze
nit
h
Zu
rich
Oth
er
netw
ork
s
Analgesics-Opioid
23 19* 15* 22 24 26 21* 31* 22 19* 24 25* 18* 21 22
Analgesics-Anti-inflammatory
32 20* 27* 29 32 35 32 37* 30* 32 34 32 28* 28* 32
Musculoskeletal therapy
29 19* 22* 22* 31 35* 27* 32 28 25* 29 30* 24* 26 27*
Central Nervous System Drugs
60 41* 63 62 49 70 53 51 70 52 62 68* 41* 81 46*
Other 25 16* 23 18* 22 24 24 25 20* 19* 21* 21* 27 21 23
Note: An asterisk indicates that the differences between the network and non-network are significant.
Source: Texas Department of Insurance, Workers’ Compensation Research and Evaluation Group, 2013.
2013 Workers’ Compensation Network Report Card Results 31
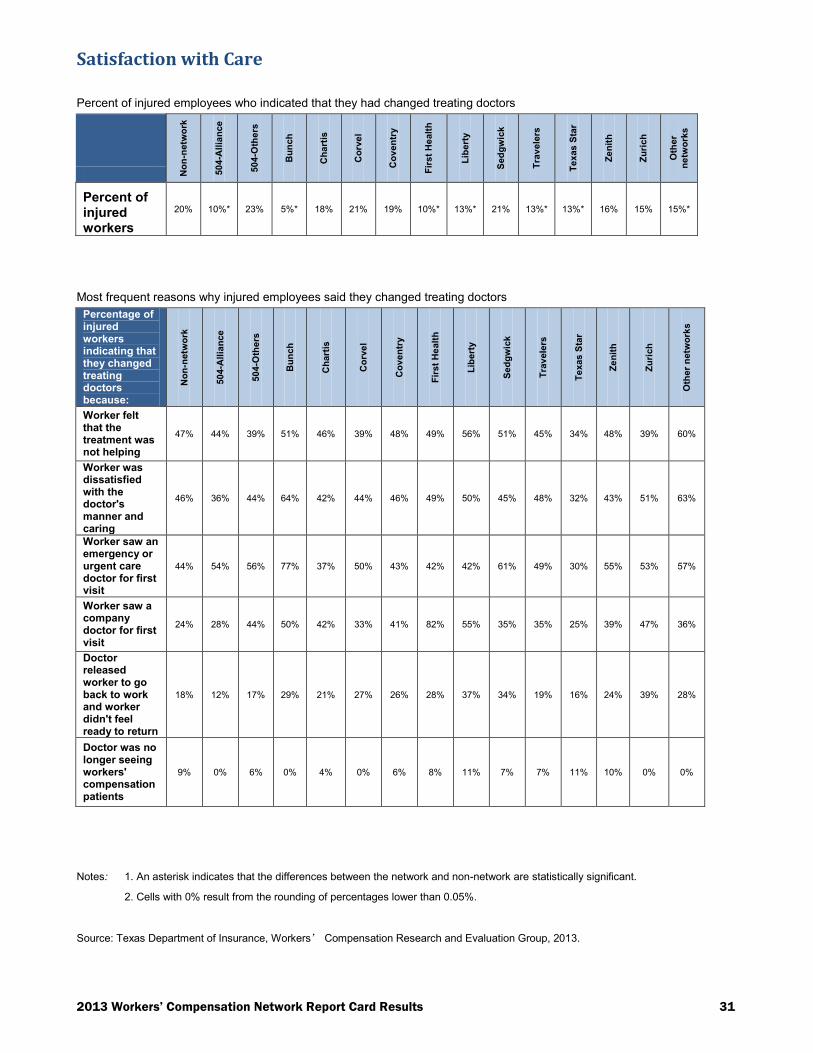
Satisfaction with Care
Percent of injured employees who indicated that they had changed treating doctors
No
n-n
etw
ork
504
-All
ian
ce
504
-Oth
ers
Bu
nch
Ch
art
is
Co
rve
l
Co
ven
try
Fir
st
He
alt
h
Lib
ert
y
Sed
gw
ick
Tra
vele
rs
Te
xas
Sta
r
Ze
nit
h
Zu
rich
Oth
er
ne
two
rks
Percent of injured workers
20% 10%* 23% 5%* 18% 21% 19% 10%* 13%* 21% 13%* 13%* 16% 15% 15%*
Most frequent reasons why injured employees said they changed treating doctors
Percentage of injured workers indicating that they changed treating doctors because:
No
n-n
etw
ork
504
-All
ian
ce
504
-Oth
ers
Bu
nch
Ch
art
is
Co
rve
l
Co
ven
try
Fir
st
He
alt
h
Lib
ert
y
Sed
gw
ick
Tra
vele
rs
Te
xas
Sta
r
Ze
nit
h
Zu
rich
Oth
er
netw
ork
s
Worker felt that the treatment was not helping
47% 44% 39% 51% 46% 39% 48% 49% 56% 51% 45% 34% 48% 39% 60%
Worker was dissatisfied with the doctor's manner and caring
46% 36% 44% 64% 42% 44% 46% 49% 50% 45% 48% 32% 43% 51% 63%
Worker saw an emergency or urgent care doctor for first visit
44% 54% 56% 77% 37% 50% 43% 42% 42% 61% 49% 30% 55% 53% 57%
Worker saw a company doctor for first visit
24% 28% 44% 50% 42% 33% 41% 82% 55% 35% 35% 25% 39% 47% 36%
Doctor released worker to go back to work and worker didn't feel ready to return
18% 12% 17% 29% 21% 27% 26% 28% 37% 34% 19% 16% 24% 39% 28%
Doctor was no longer seeing workers' compensation patients
9% 0% 6% 0% 4% 0% 6% 8% 11% 7% 7% 11% 10% 0% 0%
Notes: 1. An asterisk indicates that the differences between the network and non-network are statistically significant.
2. Cells with 0% result from the rounding of percentages lower than 0.05%.
Source: Texas Department of Insurance, Workers’ Compensation Research and Evaluation Group, 2013.
2013 Workers’ Compensation Network Report Card Results 32
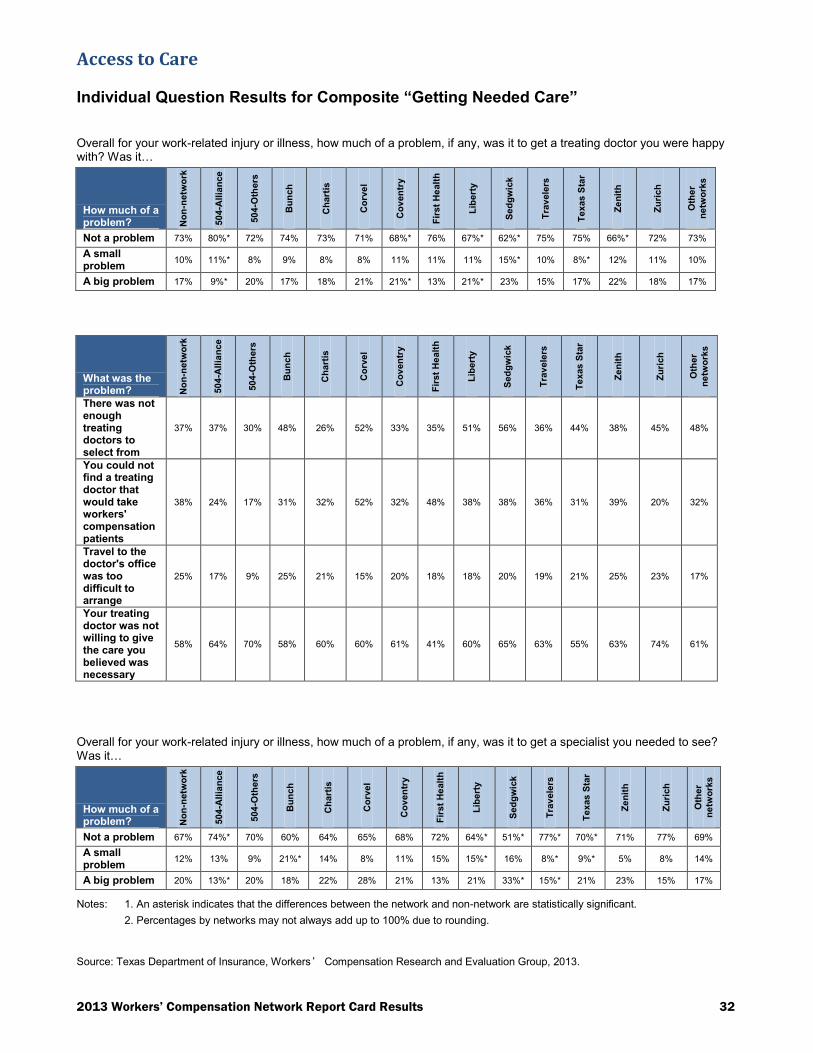
Access to Care
Individual Question Results for Composite “Getting Needed Care”
Overall for your work-related injury or illness, how much of a problem, if any, was it to get a treating doctor you were happy with? Was it…
How much of a problem? N
on
-netw
ork
504
-All
ian
ce
504
-Oth
ers
Bu
nch
Ch
art
is
Co
rve
l
Co
ven
try
Fir
st
He
alt
h
Lib
ert
y
Sed
gw
ick
Tra
vele
rs
Te
xas
Sta
r
Ze
nit
h
Zu
rich
Oth
er
ne
two
rks
Not a problem 73% 80%* 72% 74% 73% 71% 68%* 76% 67%* 62%* 75% 75% 66%* 72% 73%
A small problem
10% 11%* 8% 9% 8% 8% 11% 11% 11% 15%* 10% 8%* 12% 11% 10%
A big problem 17% 9%* 20% 17% 18% 21% 21%* 13% 21%* 23% 15% 17% 22% 18% 17%
What was the problem? N
on
-netw
ork
504
-All
ian
ce
504
-Oth
ers
Bu
nch
Ch
art
is
Co
rve
l
Co
ven
try
Fir
st
He
alt
h
Lib
ert
y
Sed
gw
ick
Tra
vele
rs
Te
xas
Sta
r
Ze
nit
h
Zu
rich
Oth
er
ne
two
rks
There was not enough treating doctors to select from
37% 37% 30% 48% 26% 52% 33% 35% 51% 56% 36% 44% 38% 45% 48%
You could not find a treating doctor that would take workers' compensation patients
38% 24% 17% 31% 32% 52% 32% 48% 38% 38% 36% 31% 39% 20% 32%
Travel to the doctor's office was too difficult to arrange
25% 17% 9% 25% 21% 15% 20% 18% 18% 20% 19% 21% 25% 23% 17%
Your treating doctor was not willing to give the care you believed was necessary
58% 64% 70% 58% 60% 60% 61% 41% 60% 65% 63% 55% 63% 74% 61%
Overall for your work-related injury or illness, how much of a problem, if any, was it to get a specialist you needed to see? Was it…
How much of a problem? N
on
-netw
ork
504
-All
ian
ce
504
-Oth
ers
Bu
nch
Ch
art
is
Co
rve
l
Co
ven
try
Fir
st
He
alt
h
Lib
ert
y
Sed
gw
ick
Tra
vele
rs
Te
xas
Sta
r
Ze
nit
h
Zu
rich
Oth
er
ne
two
rks
Not a problem 67% 74%* 70% 60% 64% 65% 68% 72% 64%* 51%* 77%* 70%* 71% 77% 69%
A small problem
12% 13% 9% 21%* 14% 8% 11% 15% 15%* 16% 8%* 9%* 5% 8% 14%
A big problem 20% 13%* 20% 18% 22% 28% 21% 13% 21% 33%* 15%* 21% 23% 15% 17%
Notes: 1. An asterisk indicates that the differences between the network and non-network are statistically significant.
2. Percentages by networks may not always add up to 100% due to rounding.
Source: Texas Department of Insurance, Workers’ Compensation Research and Evaluation Group, 2013.
2013 Workers’ Compensation Network Report Card Results 33
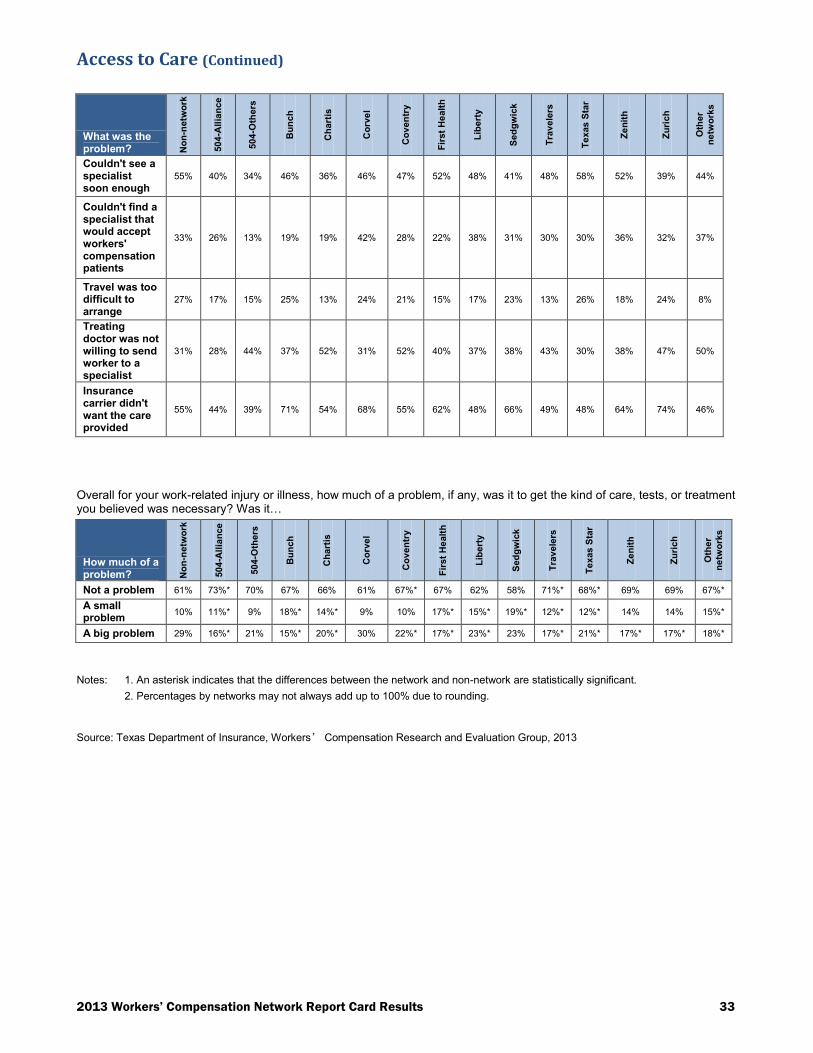
Access to Care (Continued)
What was the problem? N
on
-netw
ork
504
-All
ian
ce
504
-Oth
ers
Bu
nch
Ch
art
is
Co
rve
l
Co
ven
try
Fir
st
He
alt
h
Lib
ert
y
Sed
gw
ick
Tra
vele
rs
Te
xas
Sta
r
Ze
nit
h
Zu
rich
Oth
er
ne
two
rks
Couldn't see a specialist soon enough
55% 40% 34% 46% 36% 46% 47% 52% 48% 41% 48% 58% 52% 39% 44%
Couldn't find a specialist that would accept workers' compensation patients
33% 26% 13% 19% 19% 42% 28% 22% 38% 31% 30% 30% 36% 32% 37%
Travel was too difficult to arrange
27% 17% 15% 25% 13% 24% 21% 15% 17% 23% 13% 26% 18% 24% 8%
Treating doctor was not willing to send worker to a specialist
31% 28% 44% 37% 52% 31% 52% 40% 37% 38% 43% 30% 38% 47% 50%
Insurance carrier didn't want the care provided
55% 44% 39% 71% 54% 68% 55% 62% 48% 66% 49% 48% 64% 74% 46%
Overall for your work-related injury or illness, how much of a problem, if any, was it to get the kind of care, tests, or treatment you believed was necessary? Was it…
How much of a problem? N
on
-netw
ork
504
-All
ian
ce
504
-Oth
ers
Bu
nch
Ch
art
is
Co
rve
l
Co
ven
try
Fir
st
He
alt
h
Lib
ert
y
Sed
gw
ick
Tra
vele
rs
Te
xas
Sta
r
Ze
nit
h
Zu
rich
Oth
er
ne
two
rks
Not a problem 61% 73%* 70% 67% 66% 61% 67%* 67% 62% 58% 71%* 68%* 69% 69% 67%*
A small problem
10% 11%* 9% 18%* 14%* 9% 10% 17%* 15%* 19%* 12%* 12%* 14% 14% 15%*
A big problem 29% 16%* 21% 15%* 20%* 30% 22%* 17%* 23%* 23% 17%* 21%* 17%* 17%* 18%*
Notes: 1. An asterisk indicates that the differences between the network and non-network are statistically significant.
2. Percentages by networks may not always add up to 100% due to rounding.
Source: Texas Department of Insurance, Workers’ Compensation Research and Evaluation Group, 2013
2013 Workers’ Compensation Network Report Card Results 34
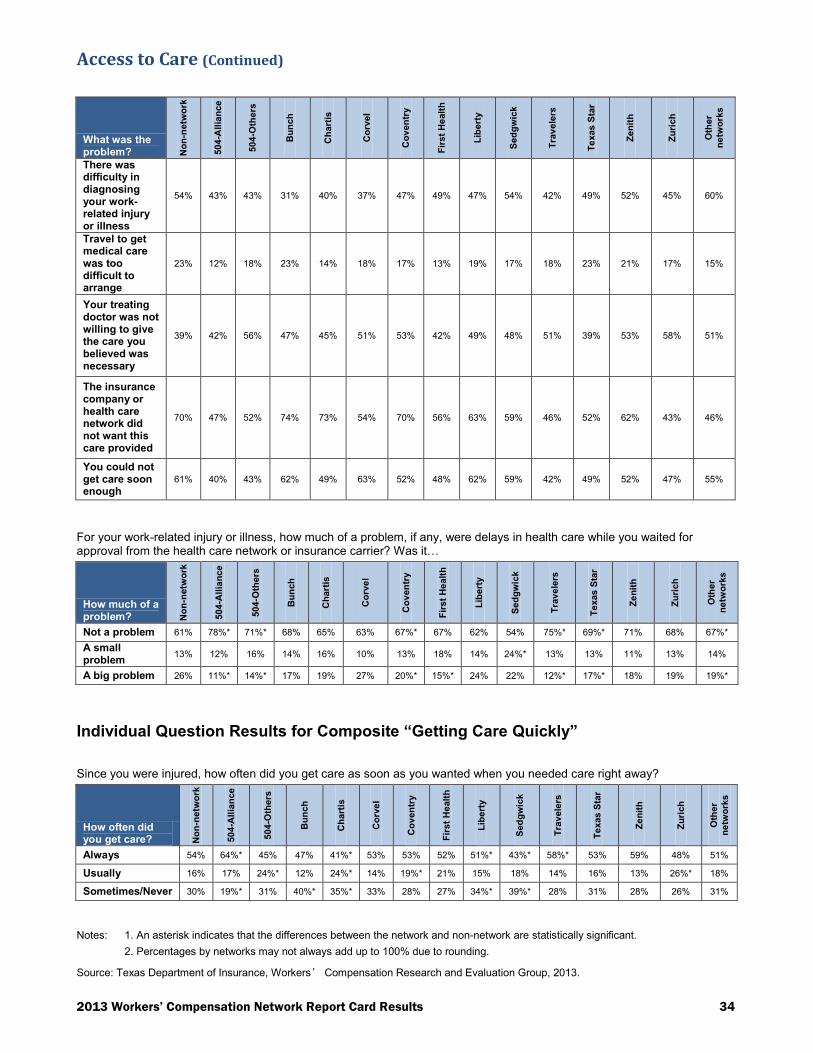
Access to Care (Continued)
What was the problem? N
on
-netw
ork
504
-All
ian
ce
504
-Oth
ers
Bu
nch
Ch
art
is
Co
rve
l
Co
ven
try
Fir
st
He
alt
h
Lib
ert
y
Sed
gw
ick
Tra
vele
rs
Te
xas
Sta
r
Ze
nit
h
Zu
rich
Oth
er
ne
two
rks
There was difficulty in diagnosing your work-related injury or illness
54% 43% 43% 31% 40% 37% 47% 49% 47% 54% 42% 49% 52% 45% 60%
Travel to get medical care was too difficult to arrange
23% 12% 18% 23% 14% 18% 17% 13% 19% 17% 18% 23% 21% 17% 15%
Your treating doctor was not willing to give the care you believed was necessary
39% 42% 56% 47% 45% 51% 53% 42% 49% 48% 51% 39% 53% 58% 51%
The insurance company or health care network did not want this care provided
70% 47% 52% 74% 73% 54% 70% 56% 63% 59% 46% 52% 62% 43% 46%
You could not get care soon enough
61% 40% 43% 62% 49% 63% 52% 48% 62% 59% 42% 49% 52% 47% 55%
For your work-related injury or illness, how much of a problem, if any, were delays in health care while you waited for approval from the health care network or insurance carrier? Was it…
How much of a problem? N
on
-netw
ork
504
-All
ian
ce
504
-Oth
ers
Bu
nch
Ch
art
is
Co
rve
l
Co
ven
try
Fir
st
He
alt
h
Lib
ert
y
Sed
gw
ick
Tra
vele
rs
Te
xas
Sta
r
Ze
nit
h
Zu
rich
Oth
er
ne
two
rks
Not a problem 61% 78%* 71%* 68% 65% 63% 67%* 67% 62% 54% 75%* 69%* 71% 68% 67%*
A small problem
13% 12% 16% 14% 16% 10% 13% 18% 14% 24%* 13% 13% 11% 13% 14%
A big problem 26% 11%* 14%* 17% 19% 27% 20%* 15%* 24% 22% 12%* 17%* 18% 19% 19%*
Individual Question Results for Composite “Getting Care Quickly”
Since you were injured, how often did you get care as soon as you wanted when you needed care right away?
How often did you get care? N
on
-netw
ork
504
-All
ian
ce
504
-Oth
ers
Bu
nch
Ch
art
is
Co
rve
l
Co
ven
try
Fir
st
He
alt
h
Lib
ert
y
Sed
gw
ick
Tra
vele
rs
Te
xas
Sta
r
Ze
nit
h
Zu
rich
Oth
er
ne
two
rks
Always 54% 64%* 45% 47% 41%* 53% 53% 52% 51%* 43%* 58%* 53% 59% 48% 51%
Usually 16% 17% 24%* 12% 24%* 14% 19%* 21% 15% 18% 14% 16% 13% 26%* 18%
Sometimes/Never 30% 19%* 31% 40%* 35%* 33% 28% 27% 34%* 39%* 28% 31% 28% 26% 31%
Notes: 1. An asterisk indicates that the differences between the network and non-network are statistically significant.
2. Percentages by networks may not always add up to 100% due to rounding.
Source: Texas Department of Insurance, Workers’ Compensation Research and Evaluation Group, 2013.

2013 Workers’ Compensation Network Report Card Results 35
Access to Care (Continued)
Since you were injured, not counting the times you needed care right away, how often did you get an appointment for your health care as soon as you wanted?
How often did you get an appointment N
on
-netw
ork
504
-All
ian
ce
504
-Oth
ers
Bu
nch
Ch
art
is
Co
rve
l
Co
ven
try
Fir
st
He
alt
h
Lib
ert
y
Sed
gw
ick
Tra
vele
rs
Te
xas
Sta
r
Ze
nit
h
Zu
rich
Oth
er
ne
two
rks
Always 55% 62%* 51% 45% 44%* 47% 51%* 56% 53% 47%* 62%* 56% 55% 54% 49%*
Usually 21% 21%* 22% 23% 29%* 15% 20% 23% 20% 22% 20% 20% 20% 23% 26%*
Sometimes/Never 24% 17%* 26% 32% 26% 38%* 29%* 21% 28%* 31%* 18%* 24% 26% 24% 24%
Since you were injured, how often were you taken to the exam room within 15 minutes of your appointment?
How often were you taken to the exam room within 15 minutes N
on
-netw
ork
504
-All
ian
ce
504
-Oth
ers
Bu
nch
Ch
art
is
Co
rve
l
Co
ven
try
Fir
st
He
alt
h
Lib
ert
y
Sed
gw
ick
Tra
vele
rs
Te
xas
Sta
r
Ze
nit
h
Zu
rich
Oth
er
netw
ork
s
Always 33% 35%* 25% 38% 21%* 31% 29%* 40% 31% 21%* 37%* 35% 32% 32% 32%
Usually 23% 22%* 22% 17% 26% 23% 21% 21% 23% 29% 20% 21% 20% 13%* 20%*
Sometimes/Never 44% 43% 53% 45% 53%* 46% 50%* 40% 46% 49% 43% 44% 48% 55%* 48%
Individual Question Results for Composite “Agreement with Treating Doctor” The treating doctor for your work-related injury or illness took your medical condition seriously.
Treating doctor took your medical condition seriously N
on
-netw
ork
504
-All
ian
ce
504
-Oth
ers
Bu
nch
Ch
art
is
Co
rve
l
Co
ven
try
Fir
st
He
alt
h
Lib
ert
y
Sed
gw
ick
Tra
vele
rs
Te
xas
Sta
r
Ze
nit
h
Zu
rich
Oth
er
netw
ork
s
Strongly agree/Agree
85% 90%* 80% 82% 86% 82% 85% 90% 82%* 83% 87% 85% 76%* 80% 86%
Not sure 1% 1%* 4%* 3%* 3%* 3% 3%* 2% 3%* 2% 2%* 3%* 4%* 3%* 2%
Strongly disagree/Disagree
14% 8%* 16% 15% 12% 15% 12% 8% 15%* 15% 11% 12% 20% 16% 12%
The treating doctor for your work-related injury or illness gave you a thorough examination.
Treating doctor gave you a thorough examination N
on
-netw
ork
504
-All
ian
ce
504
-Oth
ers
Bu
nch
Ch
art
is
Co
rve
l
Co
ven
try
Fir
st
He
alt
h
Lib
ert
y
Sed
gw
ick
Tra
vele
rs
Te
xas
Sta
r
Ze
nit
h
Zu
rich
Oth
er
ne
two
rks
Strongly agree/Agree
83% 84% 74%* 81% 78%* 74%* 75%* 84% 80%* 73%* 80%* 80%* 73%* 82% 81%
Not sure 2% 2% 1% 2%* 3% 3% 4%* 5% 3% 4% 1%* 3% 3% 2% 4%*
Strongly disagree/Disagree
15% 15% 25%* 16% 19%* 23%* 22%* 11% 17%* 24%* 19%* 16%* 24%* 16% 15%
Notes: 1. An asterisk indicates that the differences between the network and non-network are statistically significant.
2. Percentages by networks may not always add up to 100% due to rounding.
Source: Texas Department of Insurance, Workers’ Compensation Research and Evaluation Group, 2013.
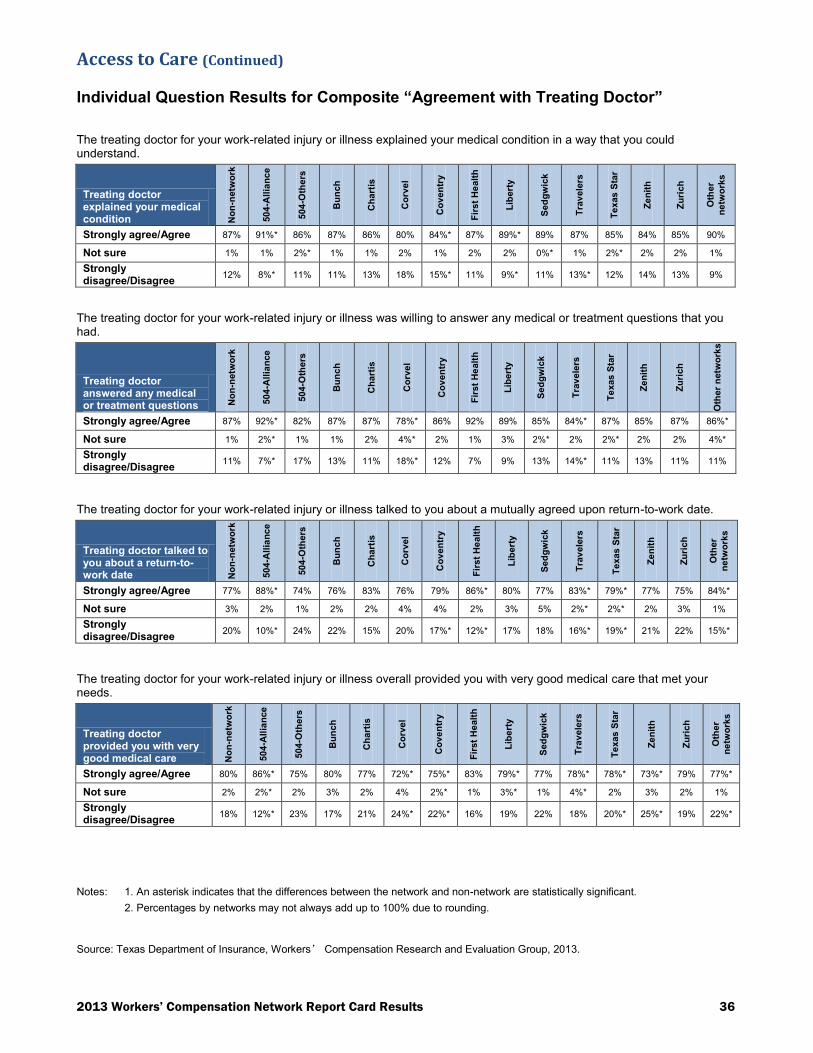
2013 Workers’ Compensation Network Report Card Results 36
Access to Care (Continued)
Individual Question Results for Composite “Agreement with Treating Doctor”
The treating doctor for your work-related injury or illness explained your medical condition in a way that you could understand.
Treating doctor explained your medical condition N
on
-netw
ork
504
-All
ian
ce
504
-Oth
ers
Bu
nch
Ch
art
is
Co
rve
l
Co
ven
try
Fir
st
He
alt
h
Lib
ert
y
Sed
gw
ick
Tra
vele
rs
Te
xas
Sta
r
Ze
nit
h
Zu
rich
Oth
er
ne
two
rks
Strongly agree/Agree 87% 91%* 86% 87% 86% 80% 84%* 87% 89%* 89% 87% 85% 84% 85% 90%
Not sure 1% 1% 2%* 1% 1% 2% 1% 2% 2% 0%* 1% 2%* 2% 2% 1%
Strongly disagree/Disagree
12% 8%* 11% 11% 13% 18% 15%* 11% 9%* 11% 13%* 12% 14% 13% 9%
The treating doctor for your work-related injury or illness was willing to answer any medical or treatment questions that you had.
Treating doctor answered any medical or treatment questions N
on
-netw
ork
504
-All
ian
ce
504
-Oth
ers
Bu
nch
Ch
art
is
Co
rve
l
Co
ven
try
Fir
st
He
alt
h
Lib
ert
y
Sed
gw
ick
Tra
vele
rs
Te
xas
Sta
r
Ze
nit
h
Zu
rich
Oth
er
netw
ork
s
Strongly agree/Agree 87% 92%* 82% 87% 87% 78%* 86% 92% 89% 85% 84%* 87% 85% 87% 86%*
Not sure 1% 2%* 1% 1% 2% 4%* 2% 1% 3% 2%* 2% 2%* 2% 2% 4%*
Strongly disagree/Disagree
11% 7%* 17% 13% 11% 18%* 12% 7% 9% 13% 14%* 11% 13% 11% 11%
The treating doctor for your work-related injury or illness talked to you about a mutually agreed upon return-to-work date.
Treating doctor talked to you about a return-to-work date N
on
-netw
ork
504
-All
ian
ce
504
-Oth
ers
Bu
nch
Ch
art
is
Co
rve
l
Co
ven
try
Fir
st
He
alt
h
Lib
ert
y
Sed
gw
ick
Tra
vele
rs
Te
xas
Sta
r
Ze
nit
h
Zu
rich
Oth
er
ne
two
rks
Strongly agree/Agree 77% 88%* 74% 76% 83% 76% 79% 86%* 80% 77% 83%* 79%* 77% 75% 84%*
Not sure 3% 2% 1% 2% 2% 4% 4% 2% 3% 5% 2%* 2%* 2% 3% 1%
Strongly disagree/Disagree
20% 10%* 24% 22% 15% 20% 17%* 12%* 17% 18% 16%* 19%* 21% 22% 15%*
The treating doctor for your work-related injury or illness overall provided you with very good medical care that met your needs.
Treating doctor provided you with very good medical care N
on
-netw
ork
504
-All
ian
ce
504
-Oth
ers
Bu
nch
Ch
art
is
Co
rve
l
Co
ven
try
Fir
st
He
alt
h
Lib
ert
y
Sed
gw
ick
Tra
vele
rs
Te
xas
Sta
r
Ze
nit
h
Zu
rich
Oth
er
ne
two
rks
Strongly agree/Agree 80% 86%* 75% 80% 77% 72%* 75%* 83% 79%* 77% 78%* 78%* 73%* 79% 77%*
Not sure 2% 2%* 2% 3% 2% 4% 2%* 1% 3%* 1% 4%* 2% 3% 2% 1%
Strongly disagree/Disagree
18% 12%* 23% 17% 21% 24%* 22%* 16% 19% 22% 18% 20%* 25%* 19% 22%*
Notes: 1. An asterisk indicates that the differences between the network and non-network are statistically significant.
2. Percentages by networks may not always add up to 100% due to rounding.
Source: Texas Department of Insurance, Workers’ Compensation Research and Evaluation Group, 2013.
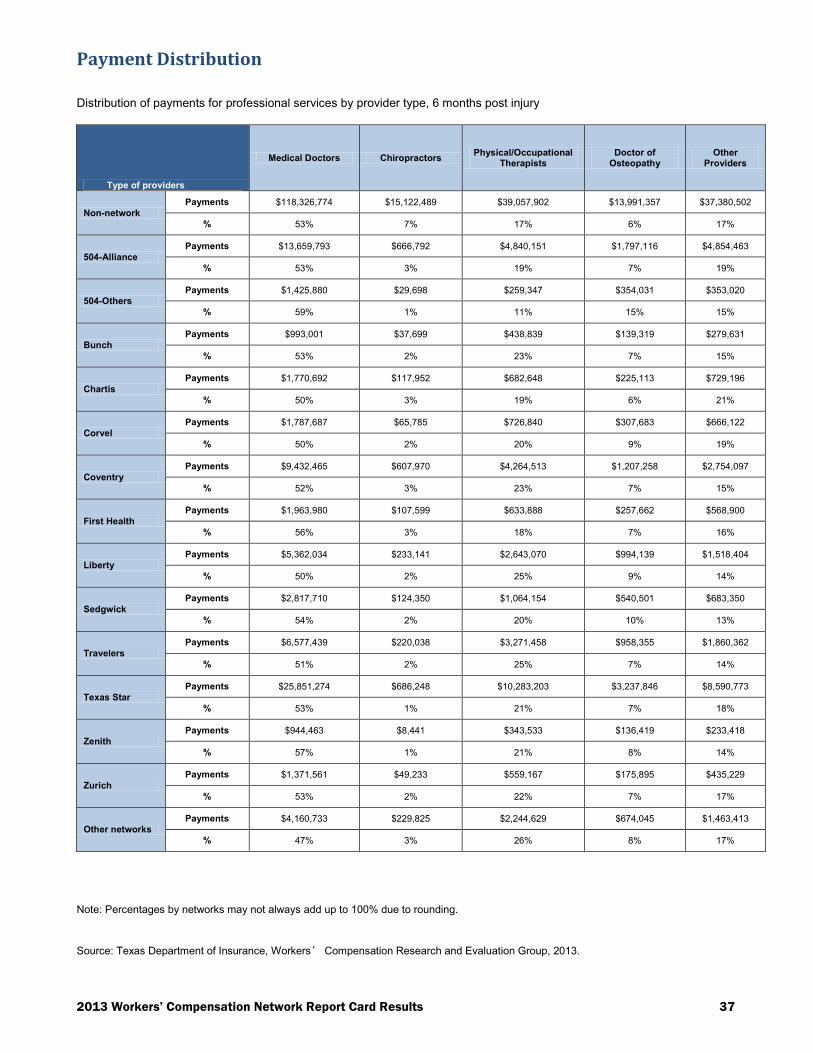
2013 Workers’ Compensation Network Report Card Results 37
Payment Distribution
Distribution of payments for professional services by provider type, 6 months post injury
Type of providers
Medical Doctors Chiropractors Physical/Occupational
Therapists Doctor of
Osteopathy Other
Providers
Non-network
Payments $118,326,774 $15,122,489 $39,057,902 $13,991,357 $37,380,502
% 53% 7% 17% 6% 17%
504-Alliance
Payments $13,659,793 $666,792 $4,840,151 $1,797,116 $4,854,463
% 53% 3% 19% 7% 19%
504-Others Payments $1,425,880 $29,698 $259,347 $354,031 $353,020
% 59% 1% 11% 15% 15%
Bunch
Payments $993,001 $37,699 $438,839 $139,319 $279,631
% 53% 2% 23% 7% 15%
Chartis
Payments $1,770,692 $117,952 $682,648 $225,113 $729,196
% 50% 3% 19% 6% 21%
Corvel
Payments $1,787,687 $65,785 $726,840 $307,683 $666,122
% 50% 2% 20% 9% 19%
Coventry
Payments $9,432,465 $607,970 $4,264,513 $1,207,258 $2,754,097
% 52% 3% 23% 7% 15%
First Health
Payments $1,963,980 $107,599 $633,888 $257,662 $568,900
% 56% 3% 18% 7% 16%
Liberty
Payments $5,362,034 $233,141 $2,643,070 $994,139 $1,518,404
% 50% 2% 25% 9% 14%
Sedgwick
Payments $2,817,710 $124,350 $1,064,154 $540,501 $683,350
% 54% 2% 20% 10% 13%
Travelers
Payments $6,577,439 $220,038 $3,271,458 $958,355 $1,860,362
% 51% 2% 25% 7% 14%
Texas Star
Payments $25,851,274 $686,248 $10,283,203 $3,237,846 $8,590,773
% 53% 1% 21% 7% 18%
Zenith
Payments $944,463 $8,441 $343,533 $136,419 $233,418
% 57% 1% 21% 8% 14%
Zurich
Payments $1,371,561 $49,233 $559,167 $175,895 $435,229
% 53% 2% 22% 7% 17%
Other networks Payments $4,160,733 $229,825 $2,244,629 $674,045 $1,463,413
% 47% 3% 26% 8% 17%
Note: Percentages by networks may not always add up to 100% due to rounding.
Source: Texas Department of Insurance, Workers’ Compensation Research and Evaluation Group, 2013.
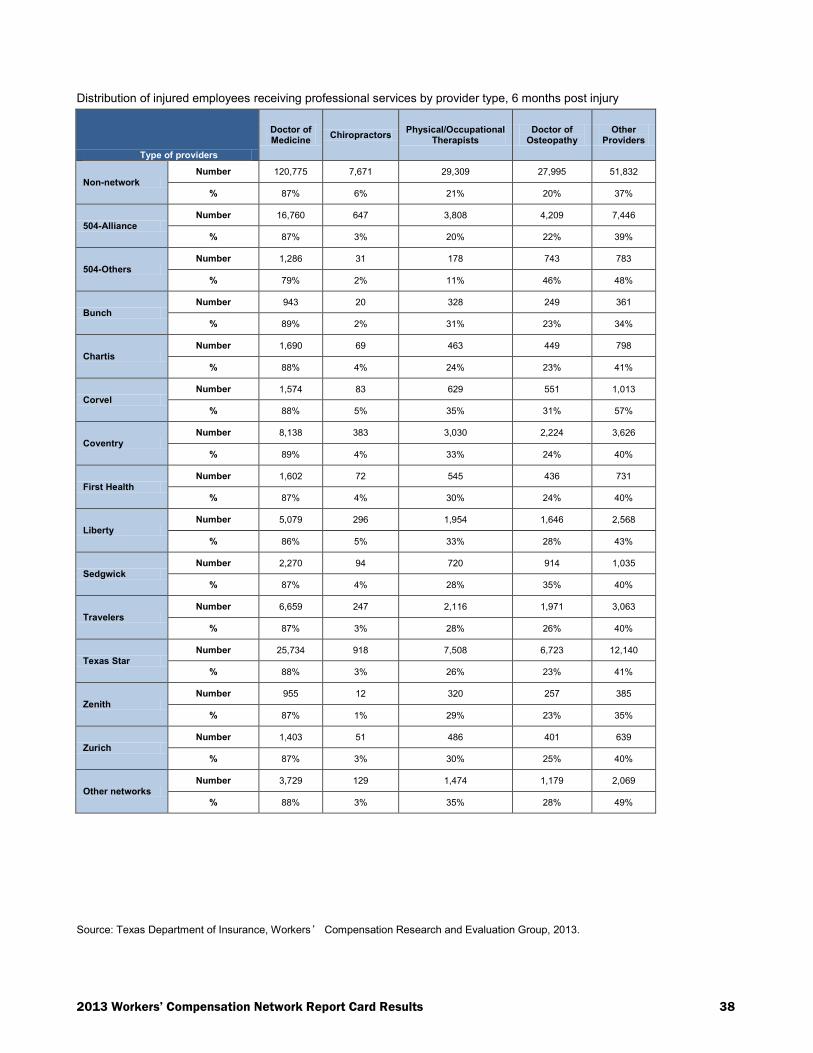
2013 Workers’ Compensation Network Report Card Results 38
Distribution of injured employees receiving professional services by provider type, 6 months post injury
Type of providers
Doctor of Medicine
Chiropractors Physical/Occupational
Therapists Doctor of
Osteopathy Other
Providers
Non-network Number 120,775 7,671 29,309 27,995 51,832
% 87% 6% 21% 20% 37%
504-Alliance Number 16,760 647 3,808 4,209 7,446
% 87% 3% 20% 22% 39%
504-Others Number 1,286 31 178 743 783
% 79% 2% 11% 46% 48%
Bunch Number 943 20 328 249 361
% 89% 2% 31% 23% 34%
Chartis Number 1,690 69 463 449 798
% 88% 4% 24% 23% 41%
Corvel Number 1,574 83 629 551 1,013
% 88% 5% 35% 31% 57%
Coventry Number 8,138 383 3,030 2,224 3,626
% 89% 4% 33% 24% 40%
First Health Number 1,602 72 545 436 731
% 87% 4% 30% 24% 40%
Liberty Number 5,079 296 1,954 1,646 2,568
% 86% 5% 33% 28% 43%
Sedgwick Number 2,270 94 720 914 1,035
% 87% 4% 28% 35% 40%
Travelers Number 6,659 247 2,116 1,971 3,063
% 87% 3% 28% 26% 40%
Texas Star Number 25,734 918 7,508 6,723 12,140
% 88% 3% 26% 23% 41%
Zenith Number 955 12 320 257 385
% 87% 1% 29% 23% 35%
Zurich Number 1,403 51 486 401 639
% 87% 3% 30% 25% 40%
Other networks Number 3,729 129 1,474 1,179 2,069
% 88% 3% 35% 28% 49%
Source: Texas Department of Insurance, Workers’ Compensation Research and Evaluation Group, 2013.
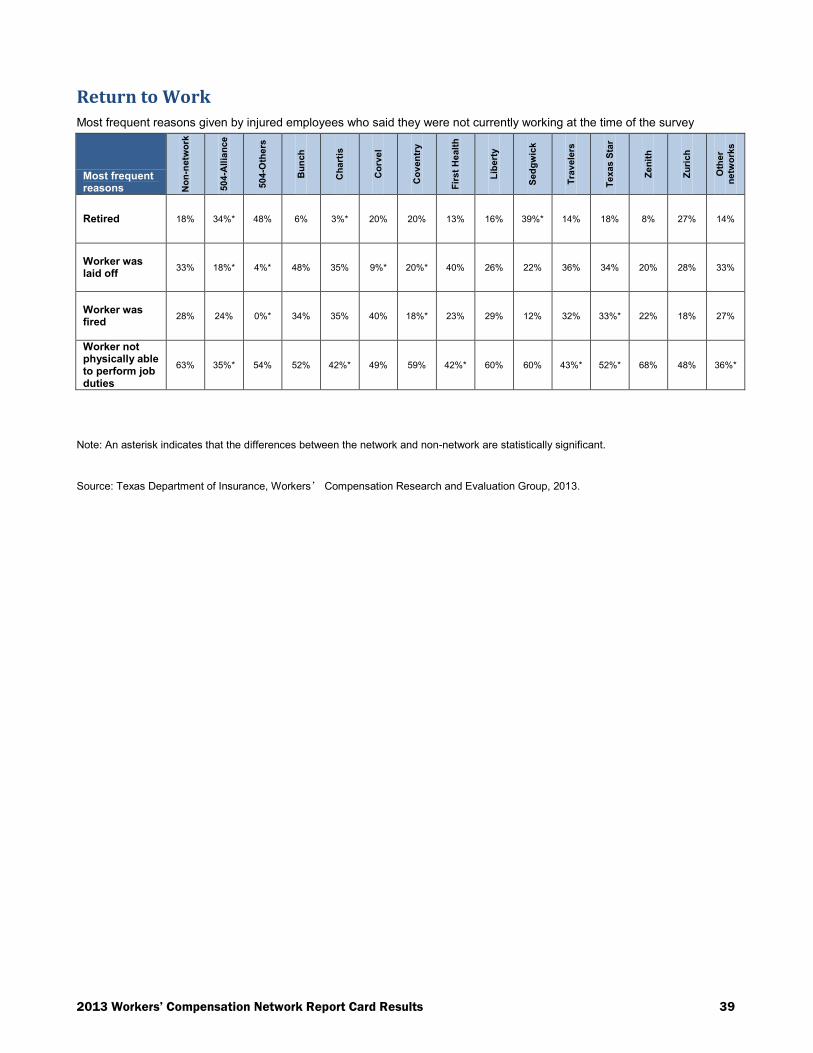
2013 Workers’ Compensation Network Report Card Results 39
Return to Work
Most frequent reasons given by injured employees who said they were not currently working at the time of the survey
Most frequent reasons N
on
-netw
ork
504
-All
ian
ce
504
-Oth
ers
Bu
nch
Ch
art
is
Co
rve
l
Co
ven
try
Fir
st
He
alt
h
Lib
ert
y
Sed
gw
ick
Tra
vele
rs
Te
xas
Sta
r
Ze
nit
h
Zu
rich
Oth
er
ne
two
rks
Retired 18% 34%* 48% 6% 3%* 20% 20% 13% 16% 39%* 14% 18% 8% 27% 14%
Worker was laid off
33% 18%* 4%* 48% 35% 9%* 20%* 40% 26% 22% 36% 34% 20% 28% 33%
Worker was fired
28% 24% 0%* 34% 35% 40% 18%* 23% 29% 12% 32% 33%* 22% 18% 27%
Worker not physically able to perform job duties
63% 35%* 54% 52% 42%* 49% 59% 42%* 60% 60% 43%* 52%* 68% 48% 36%*
Note: An asterisk indicates that the differences between the network and non-network are statistically significant.
Source: Texas Department of Insurance, Workers’ Compensation Research and Evaluation Group, 2013.
2013 Workers’ Compensation Network Report Card Results
Texas Department of Insurance Workers’ Compensation Research and Evaluation Group www.tdi.texas.gov
For more information on the networks certified by the Department, their service areas and their contact information, see www.tdi.texas.gov/wc/wcnet/index.html. Questions or complaints regarding certified networks should be directed to the Health and Workers’ Compensation Network Certification Division (HWCN) by e-mail at [email protected]. Questions about the report should be directed to the REG at [email protected]. This report is also available on the Department’s website:
www.tdi.texas.gov/wc/regulation/roc/index.html.