women’s health initiative (whi) clinical trials (ct) observational study (os) diet modification...
TRANSCRIPT
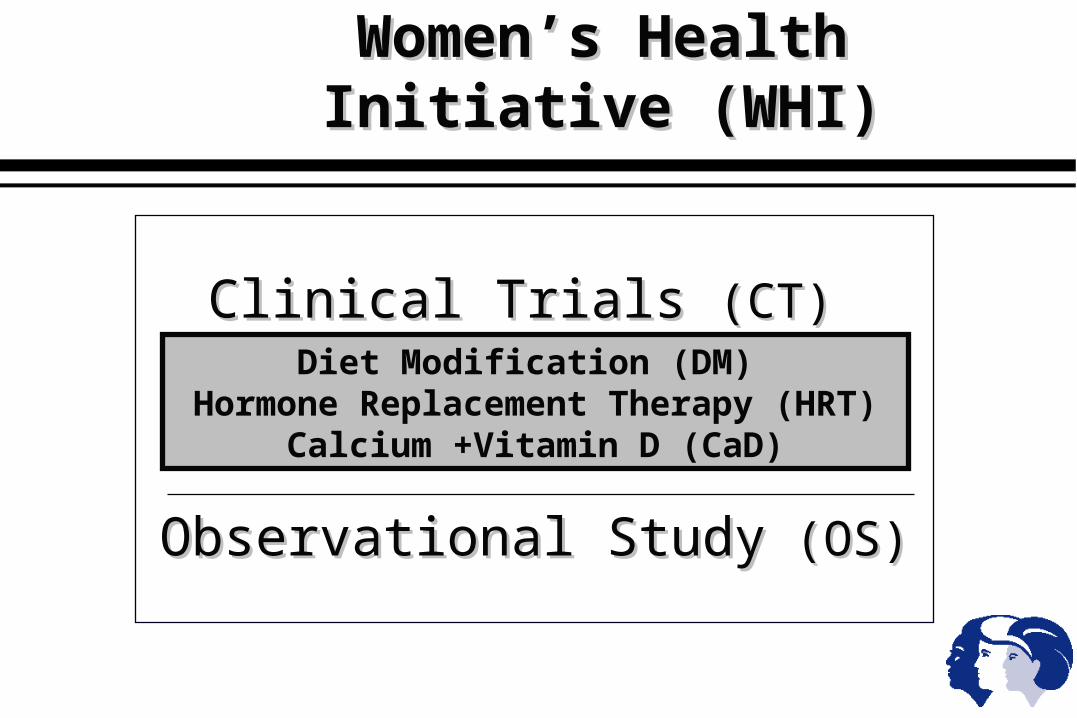
Women’s Health Initiative (WHI)Women’s Health Initiative (WHI)
Clinical Trials Clinical Trials (CT) (CT)
Observational StudyObservational Study (OS) (OS)
Diet Modification (DM) Hormone Replacement Therapy (HRT)
Calcium +Vitamin D (CaD)
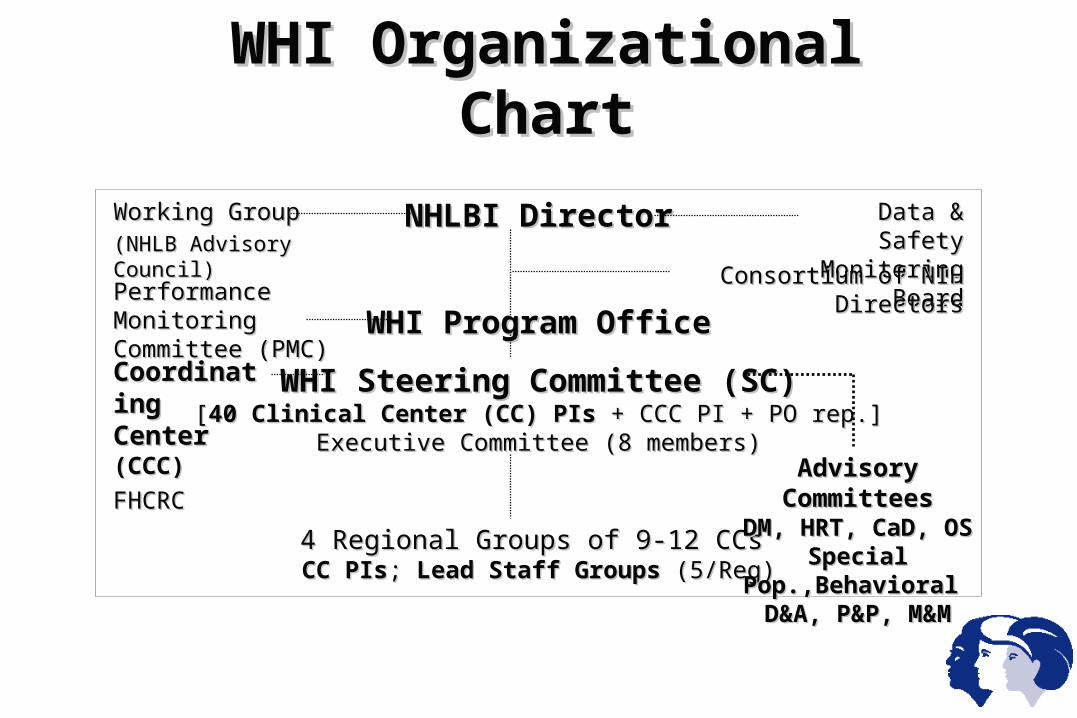
WHI Organizational ChartWHI Organizational Chart
NHLBI DirectorNHLBI Director
WHI Program OfficeWHI Program Office
WHI Steering Committee (SC)WHI Steering Committee (SC)[[40 Clinical Center (CC) PIs 40 Clinical Center (CC) PIs + CCC PI + PO rep.]+ CCC PI + PO rep.]
Executive Committee (8 members)Executive Committee (8 members)
4 Regional Groups of 9-12 CCs4 Regional Groups of 9-12 CCs CC PIsCC PIs; ; Lead Staff GroupsLead Staff Groups (5/Reg) (5/Reg)
Working GroupWorking Group(NHLB Advisory Council)(NHLB Advisory Council)
Data & Safety Data & Safety Monitoring BoardMonitoring Board
Consortium of NIH DirectorsConsortium of NIH Directors
Advisory CommitteesAdvisory CommitteesDM, HRT, CaD, OSDM, HRT, CaD, OS
Special Pop.,Behavioral Special Pop.,Behavioral D&A, P&P, M&MD&A, P&P, M&M
Performance Monitoring Performance Monitoring Committee (PMC)Committee (PMC)
CoordinatingCoordinatingCenterCenter (CCC) (CCC)
FHCRCFHCRC
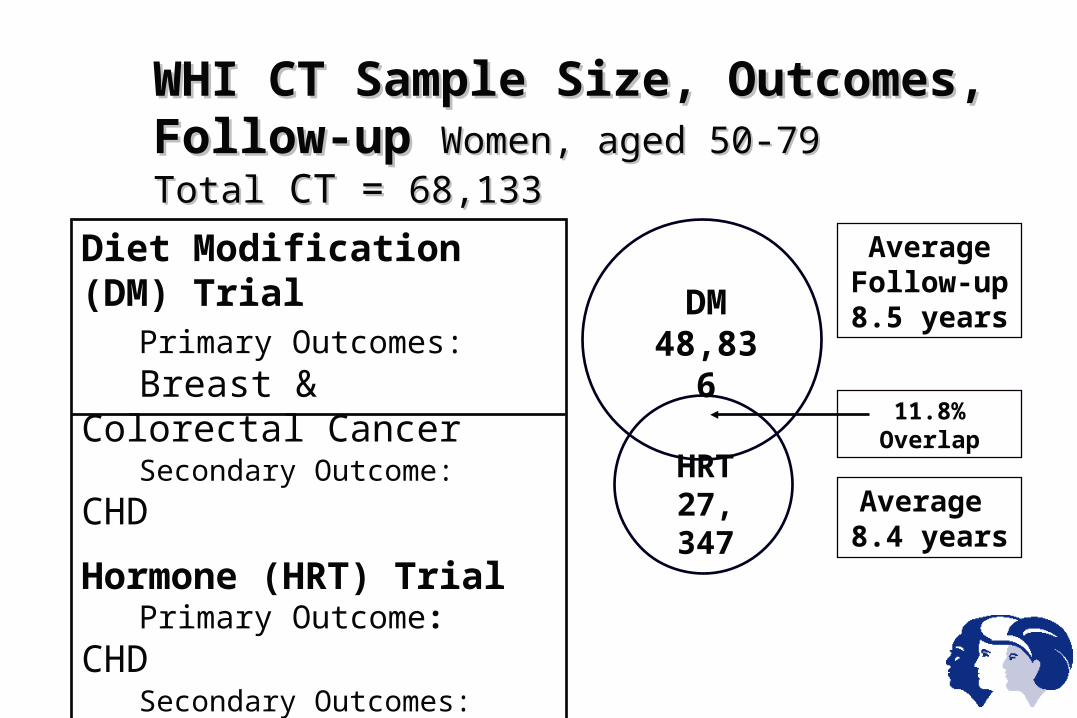
HRT27, 347
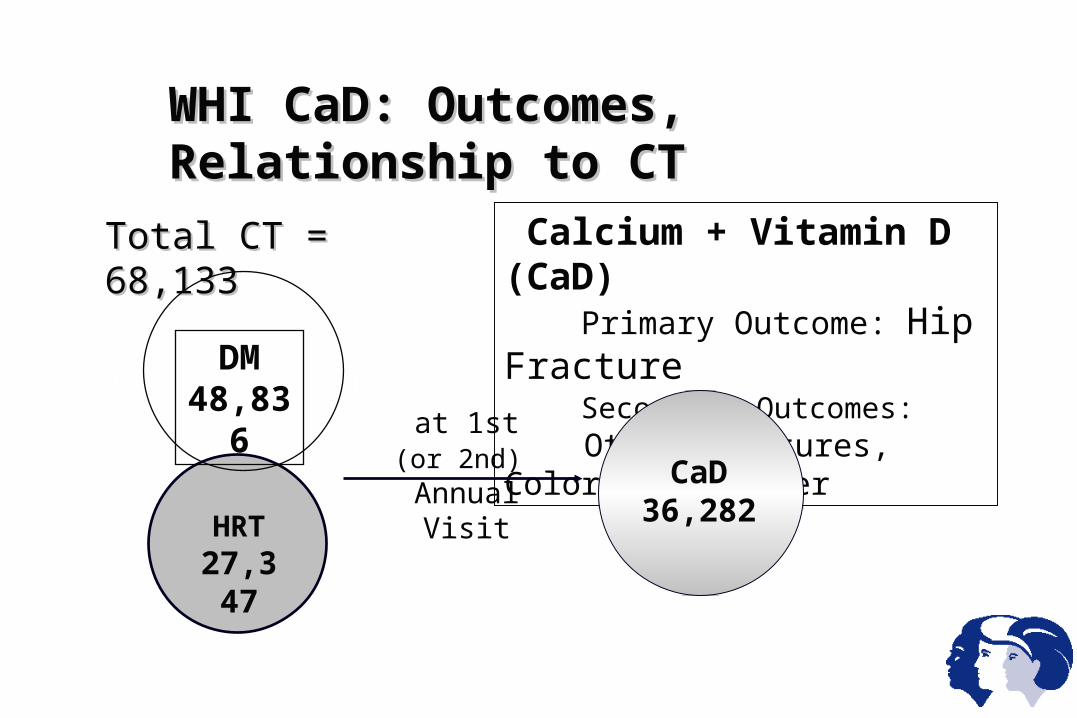
WHI CT Sample Size, Outcomes, Follow-upWHI CT Sample Size, Outcomes, Follow-up Women, aged 50-79 TotalWomen, aged 50-79 Total CT = CT = 68,133 68,133
DM48,836
Diet Modification (DM) Trial Primary Outcomes: Breast & Colorectal Cancer Secondary Outcome: CHD
Hormone (HRT) Trial Primary Outcome: CHD Secondary Outcomes: Hip Fracture, Breast Cancer
11.8% Overlap
Average Follow-up 8.5 years
Average 8.4 years
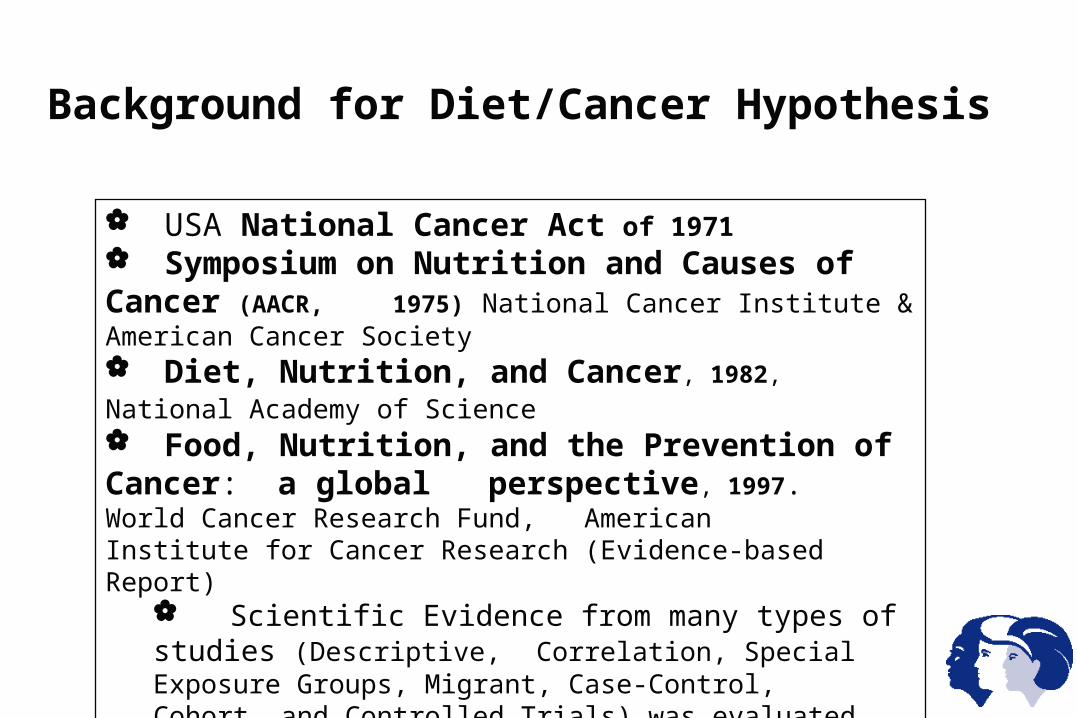
USA National Cancer Act of 1971 Symposium on Nutrition and Causes of Cancer (AACR,
1975) National Cancer Institute & American Cancer Society Diet, Nutrition, and Cancer, 1982, National Academy of Science Food, Nutrition, and the Prevention of Cancer: a global
perspective, 1997. World Cancer Research Fund, American Institute for Cancer Research (Evidence-based Report)
Scientific Evidence from many types of studies (Descriptive, Correlation, Special Exposure Groups, Migrant, Case-
Control, Cohort, and Controlled Trials) was evaluated and rated as Convincing, Probable, Possible, or Insufficient
to make judgements on causal relationships of dietary factors: decreases risk, increases risk, or no relationship
Background for Diet/Cancer Hypothesis
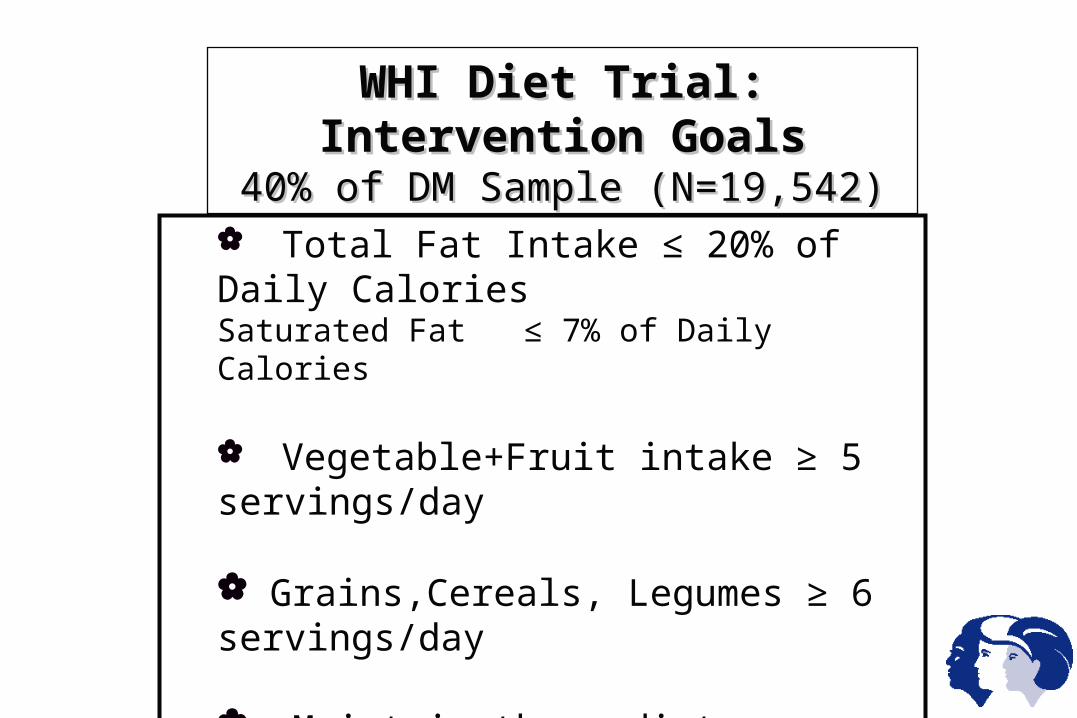
WHI Diet Trial: Intervention GoalsWHI Diet Trial: Intervention Goals40% of DM Sample (N=19,542)40% of DM Sample (N=19,542)
Total Fat Intake ≤ 20% of Daily Calories Saturated Fat ≤ 7% of Daily Calories
Vegetable+Fruit intake ≥ 5 servings/day
Grains,Cereals, Legumes ≥ 6 servings/day
Maintain these dietary changes for 9 years
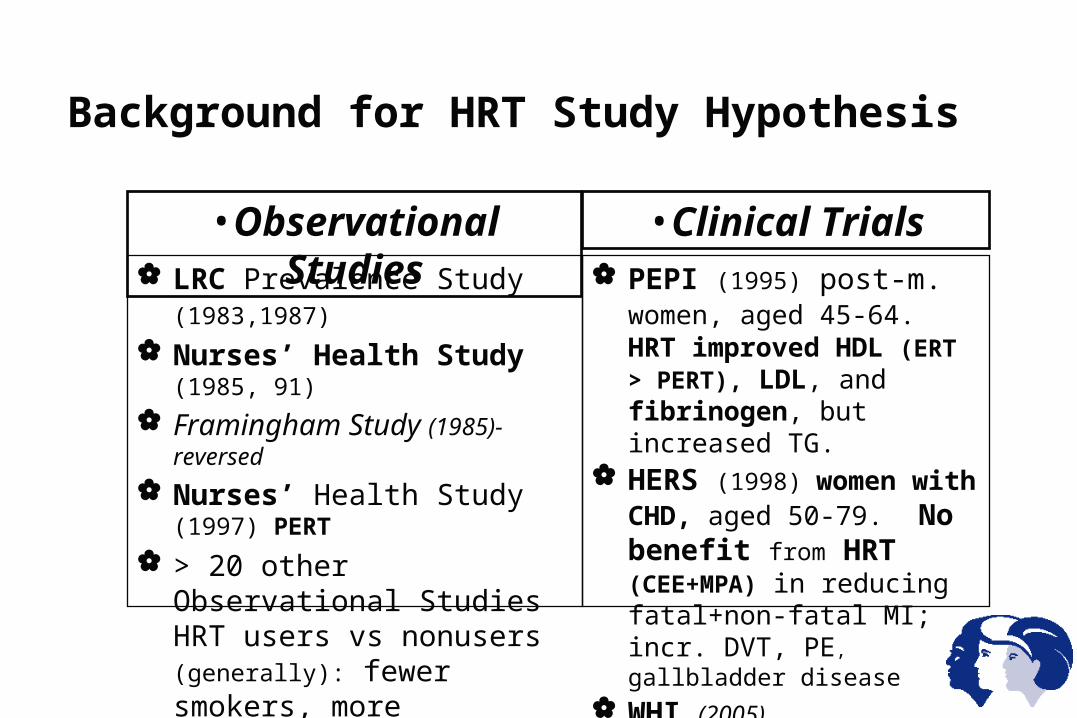
LRC Prevalence Study (1983,1987) Nurses’ Health Study (1985, 91)
Framingham Study (1985)-reversed
Nurses’ Health Study (1997) PERT
> 20 other Observational Studies HRT users vs nonusers (generally): fewer smokers, more physically active, leaner, healthier, at lower risk, more educated, higher SES
PEPI (1995) post-m. women, aged 45-64. HRT improved HDL (ERT > PERT), LDL, and fibrinogen, but increased TG.
HERS (1998) women with CHD, aged 50-79. No benefit from HRT (CEE+MPA) in reducing fatal+non-fatal MI; incr. DVT, PE, gallbladder disease
WHI (2005)
•Observational Studies •Clinical Trials
Background for HRT Study Hypothesis
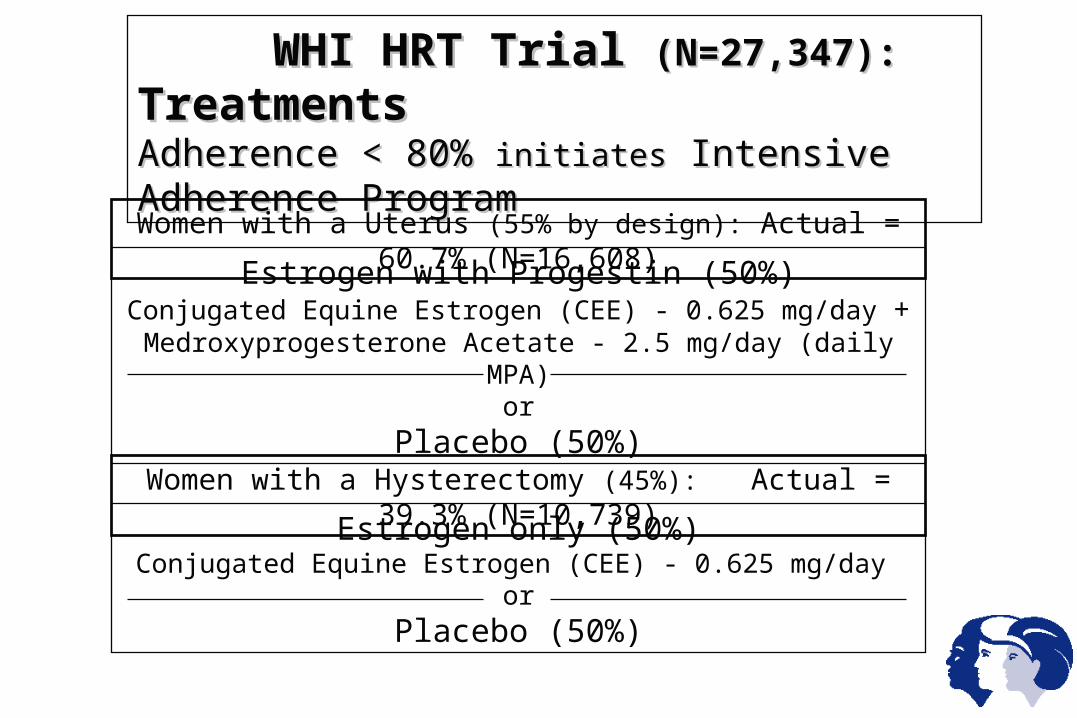
WHI HRT Trial WHI HRT Trial (N=27,347):(N=27,347): Treatments TreatmentsAdherence < 80% Adherence < 80% initiatesinitiates Intensive Adherence Program Intensive Adherence Program
Estrogen with Progestin (50%)Conjugated Equine Estrogen (CEE) - 0.625 mg/day +
Medroxyprogesterone Acetate - 2.5 mg/day (daily MPA)or
Placebo (50%)
Women with a Uterus (55% by design): Actual = 60.7% (N=16,608)
Women with a Hysterectomy (45%): Actual = 39.3% (N=10,739)
Estrogen only (50%)Conjugated Equine Estrogen (CEE) - 0.625 mg/day
or
Placebo (50%)
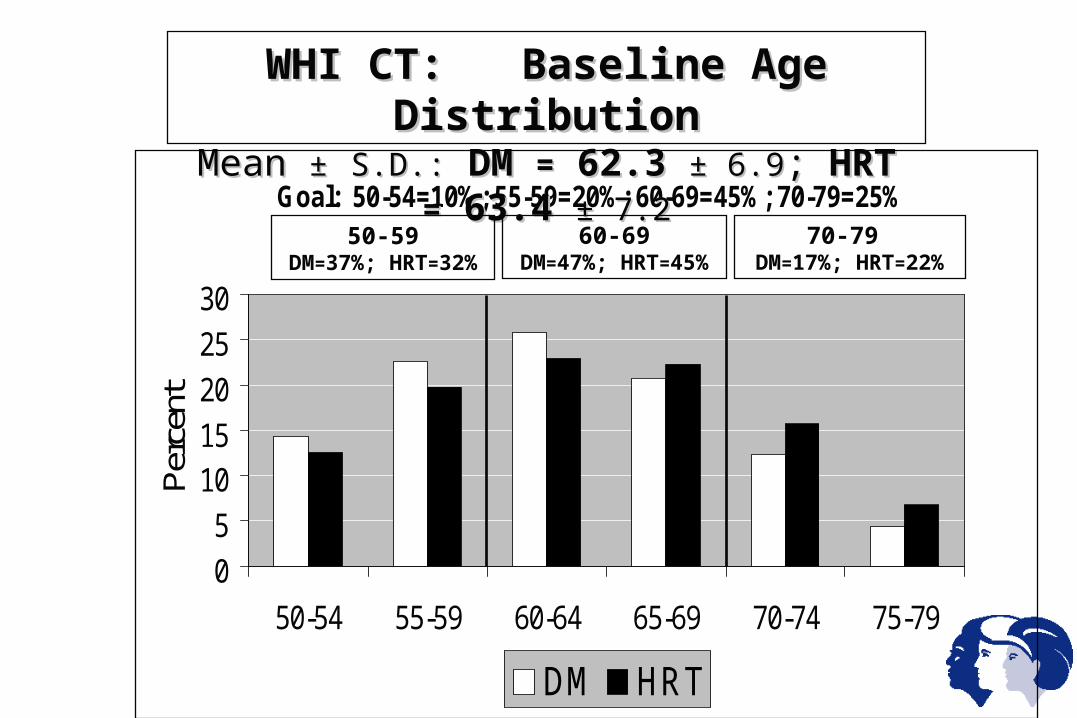
Goal: 50-54=10%; 55-59=20%; 60-69=45%; 70-79=25%
05
1015202530
50-54 55-59 60-64 65-69 70-74 75-79
Perc
ent
DM HRT
WHI CT: Baseline Age DistributionWHI CT: Baseline Age DistributionMean Mean ±± S.D.:S.D.: DM DM == 62.3 62.3 ± 6.9± 6.9; ; HRT HRT == 63.4 63.4 ± 7.2± 7.2
60-69DM=47%; HRT=45%
70-79 DM=17%; HRT=22%
50-59DM=37%; HRT=32%
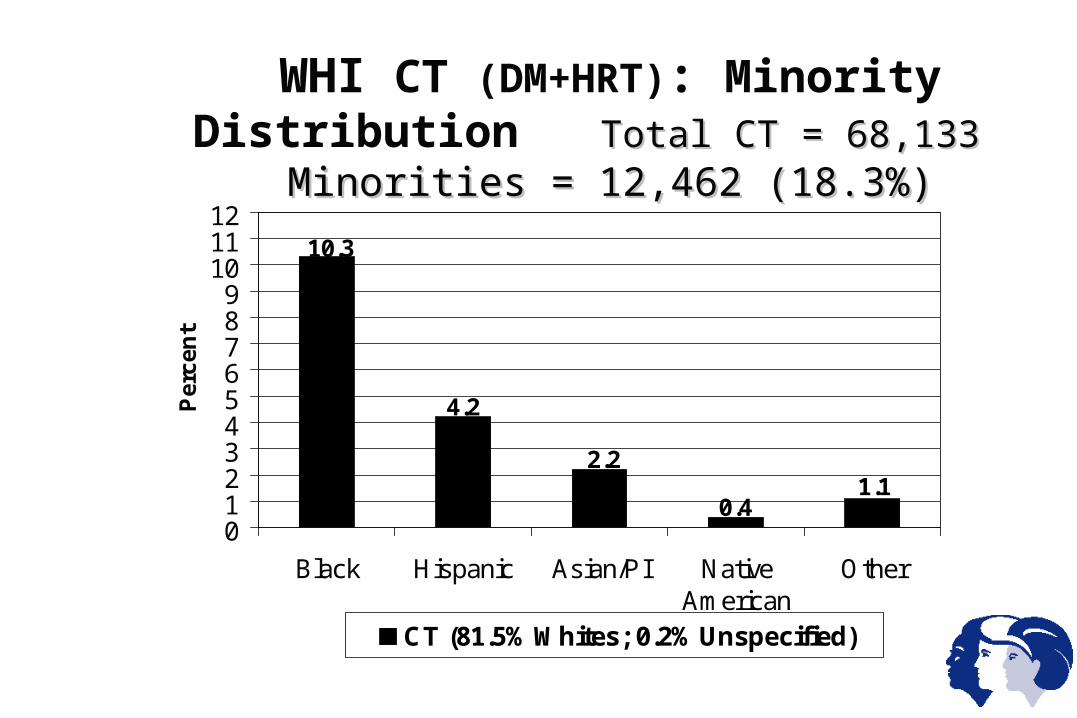
WHI CT (DM+HRT): Minority Distribution TotalTotal CT = 68,133CT = 68,133 Minorities = 12,462 (18.3%) Minorities = 12,462 (18.3%)
1.10.4
2.2
4.2
10.3
0123456789
101112
Black Hispanic Asian/PI NativeAmerican
Other
Per
cen
t
CT (81.5% Whites; 0.2% Unspecified)
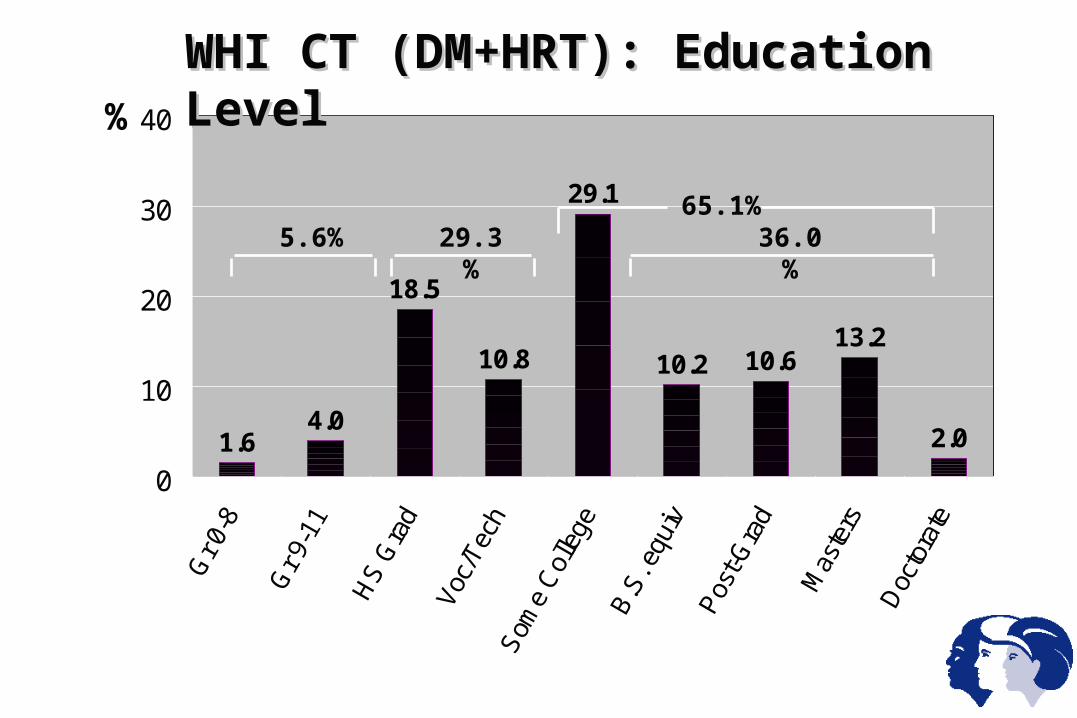
1.64.0
18.5
10.8
29.1
10.2 10.613.2
2.0
0
10
20
30
40
Gr 0
-8
Gr 9
-11
HS
Gra
d
Voc/
Tech
Som
e C
olle
geB
.S. e
quiv
Pos
t-Gra
d
Mas
ters
Doc
tora
te
WHI CT (DM+HRT): Education LevelWHI CT (DM+HRT): Education Level
36.0%29.3%5.6%65.1%
%
0
5
10
15
20
25
30
35
40
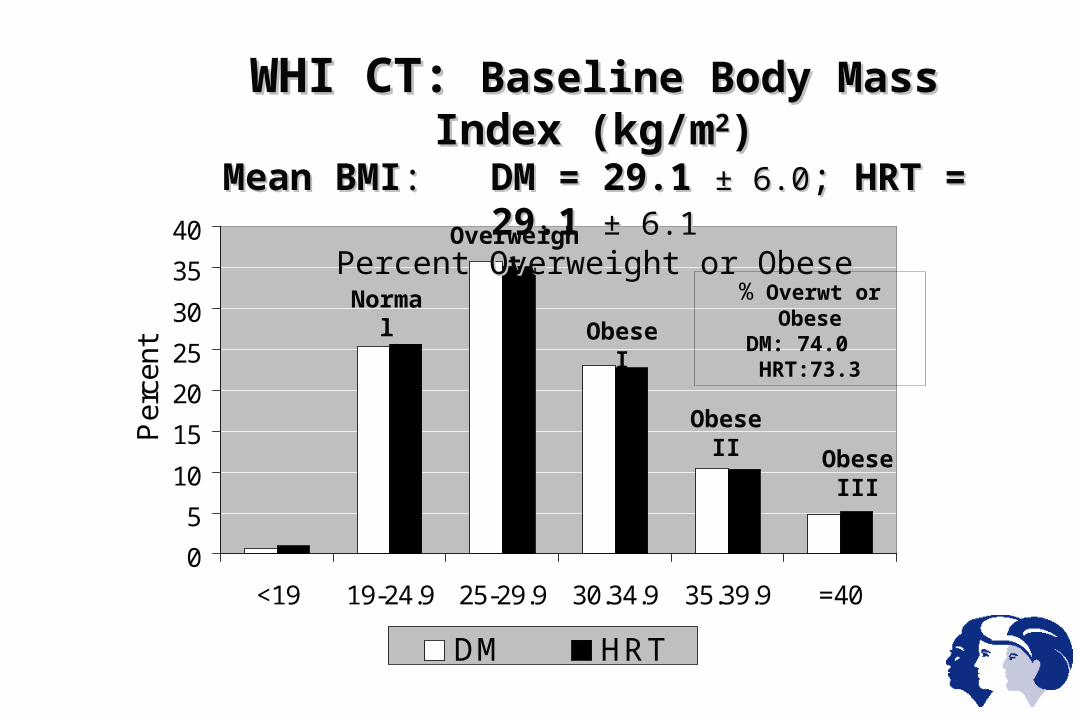
<19 19-24.9 25-29.9 30.34.9 35.39.9 =40
Per
cen
t
DM HRT
WHI CT: WHI CT: Baseline Body Mass Index (kg/mBaseline Body Mass Index (kg/m22))Mean BMIMean BMI: : DM = 29.1DM = 29.1 ± 6.0± 6.0; ; HRT = 29.1HRT = 29.1 ± 6.1± 6.1
Percent Overweight or ObesePercent Overweight or Obese
Normal
Overweight
Obese I
Obese II
Obese III
% Overwt or ObeseDM: 74.0 HRT:73.3
0
10
20
30
40
50
60
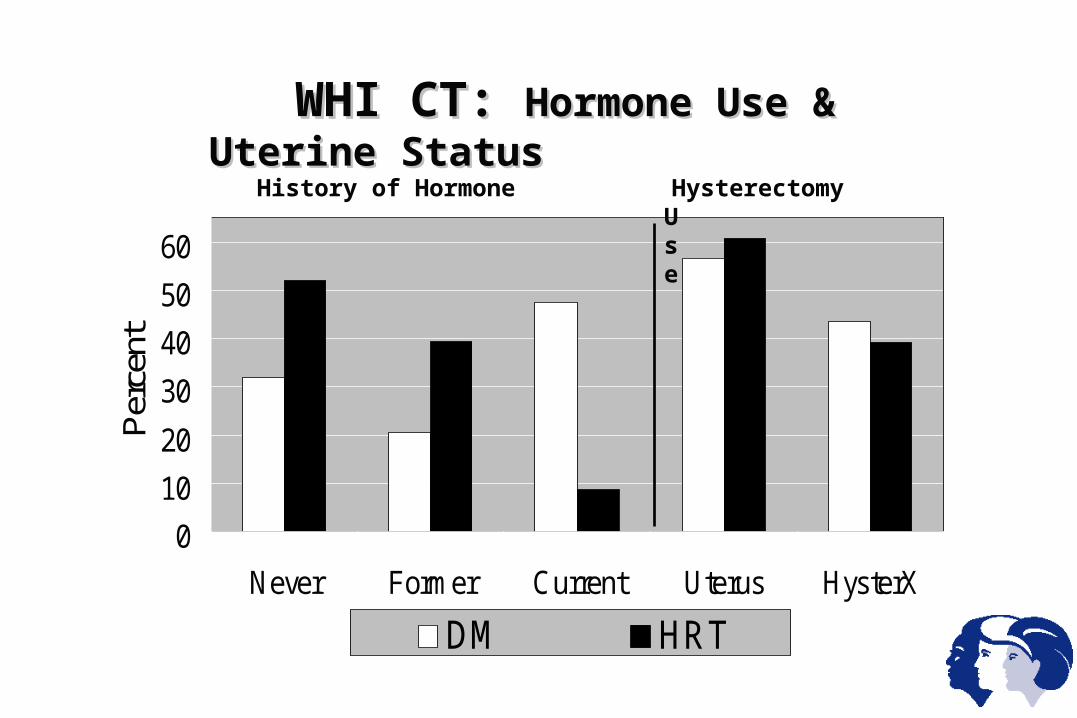
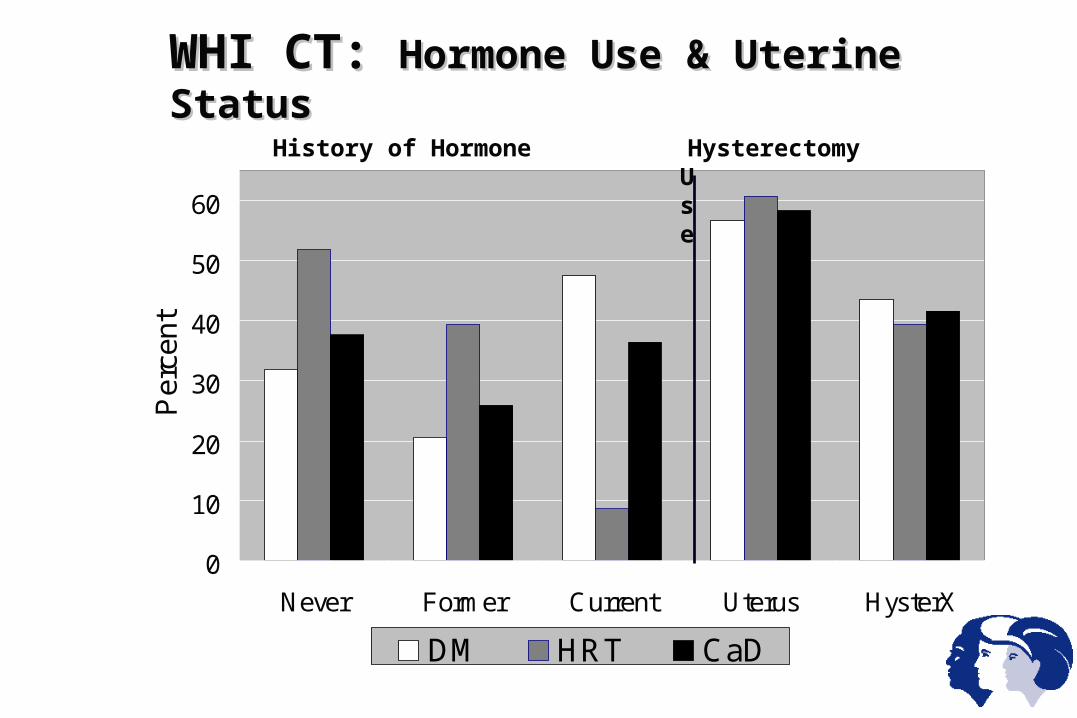
Never Former Current Uterus HysterX
Per
cent
DM HRT
WHI CT: WHI CT: Hormone Use & Uterine StatusHormone Use & Uterine Status
History of Hormone Use Hysterectomy Status
HRT27,347
WHI CaD: Outcomes, Relationship to CTWHI CaD: Outcomes, Relationship to CT
DM48,836
Calcium + Vitamin D (CaD) Primary Outcome: Hip Fracture Secondary Outcomes: Other Fractures, Colorectal Cancer
CaD36,282
at 1st (or 2nd) Annual Visit
Total CT = Total CT = 68,133 68,133
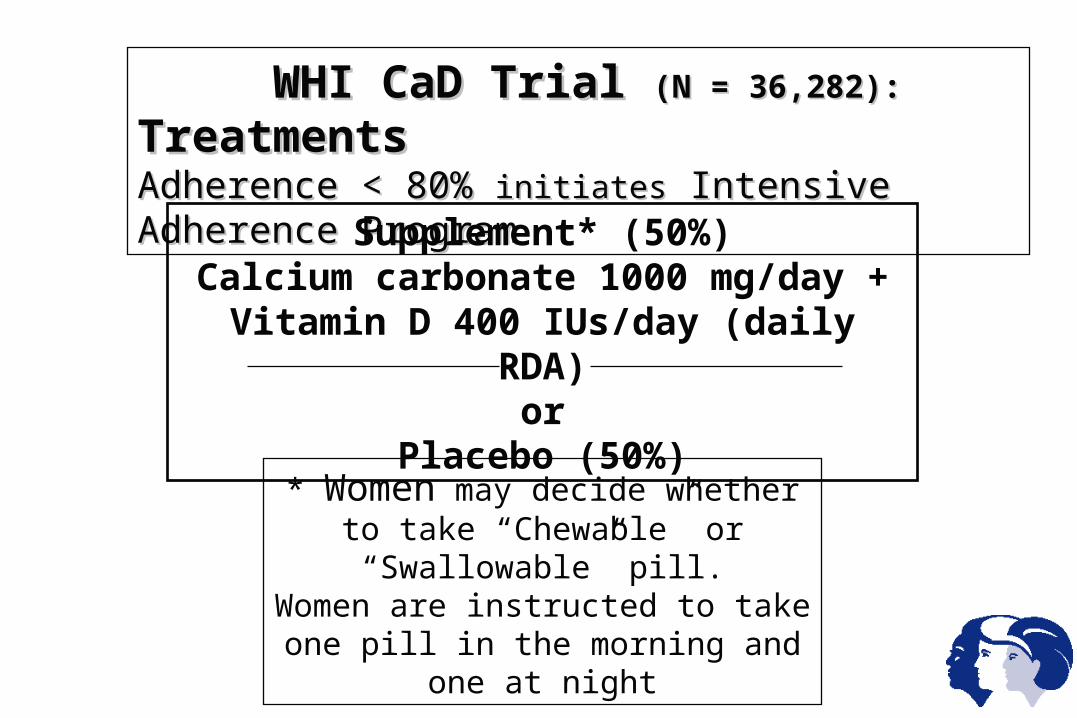
WHI CaD Trial WHI CaD Trial (N = 36,282):(N = 36,282): Treatments TreatmentsAdherence < 80% Adherence < 80% initiatesinitiates Intensive Adherence Program Intensive Adherence Program
Supplement* (50%)Calcium carbonate 1000 mg/day +
Vitamin D 400 IUs/day (daily RDA)or
Placebo (50%)
* Women may decide whether to take “Chewable” or “Swallowable” pill.
Women are instructed to take one pill in the morning and one at night
0
5
10
15
20
25
30
50-54 55-59 60-64 65-69 70-74 75-79
Perc
ent
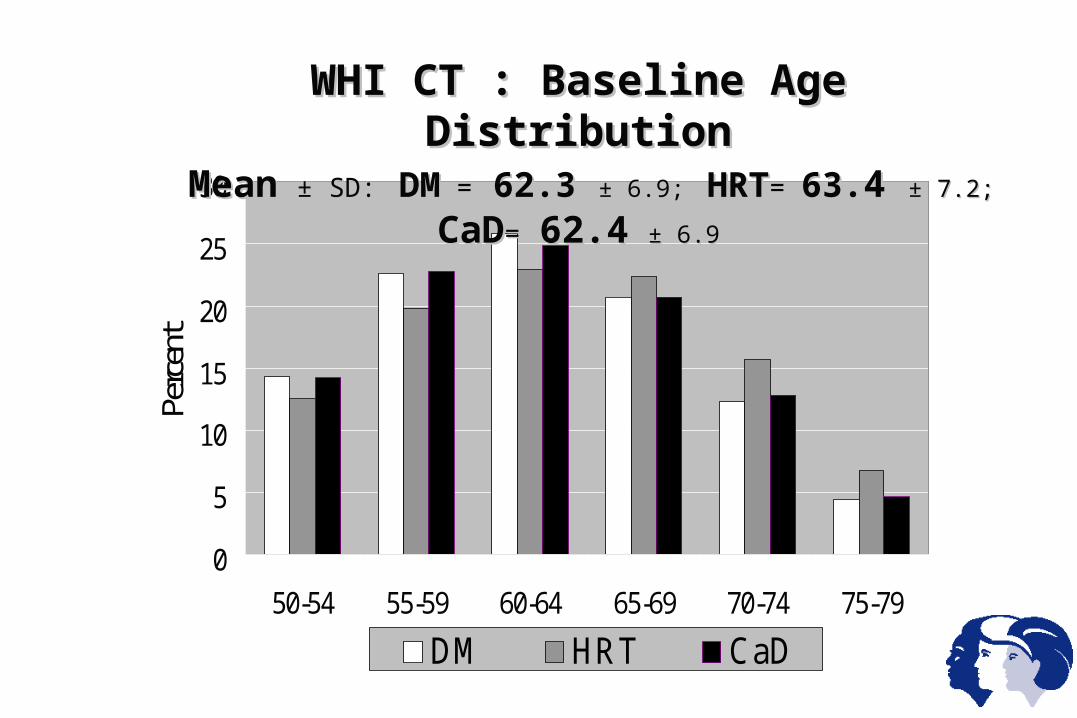
DM HRT CaD
WHI CT : Baseline Age DistributionWHI CT : Baseline Age Distribution MeanMean ± SD:± SD: DMDM == 62.362.3 ± 6.9;± 6.9; HRTHRT= = 63.63.44 ± 7.2;± 7.2; CaDCaD== 62.462.4 ± 6.9± 6.9
0
5
10
15
20
25
30
35
40
<19 19-24.9 25-29.9 30.34.9 35.39.9 =40
Per
cen
t
DM HRT CaD
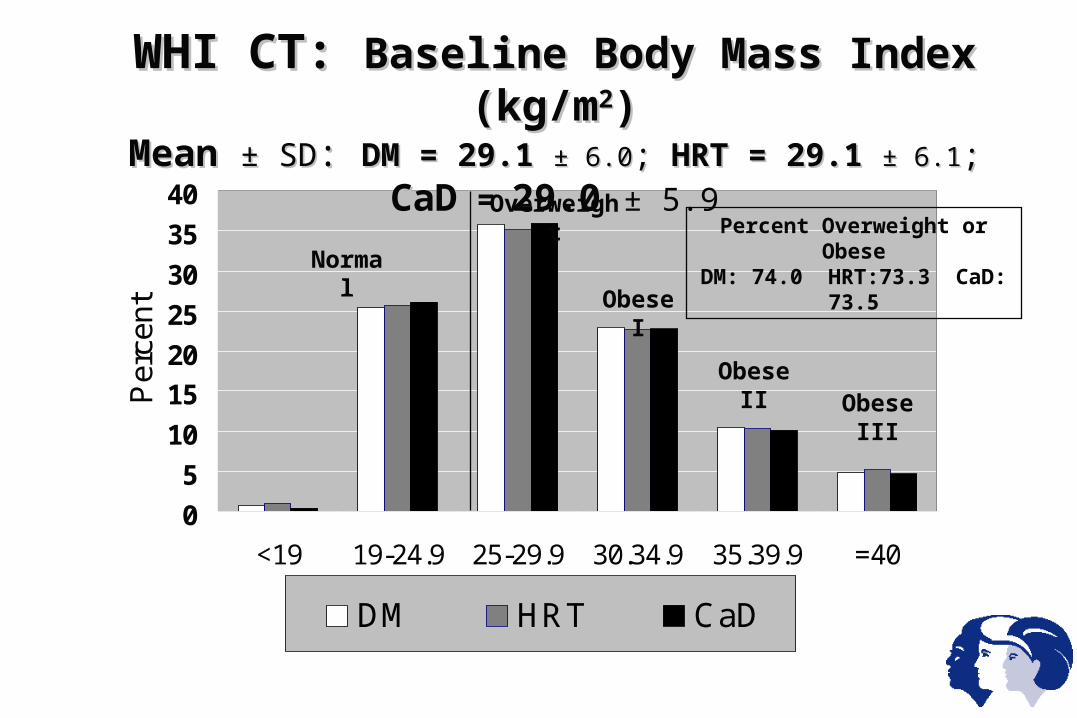
WHI CT: WHI CT: Baseline Body Mass Index (kg/mBaseline Body Mass Index (kg/m22))Mean Mean ± SD± SD: : DM = 29.1DM = 29.1 ± 6.0± 6.0; ; HRT = 29.1HRT = 29.1 ± 6.1± 6.1; ; CaDCaD = = 29.029.0 ± 5.9± 5.9
Normal
Overweight
Obese I
Obese II Obese
III
Percent Overweight or ObeseDM: 74.0 HRT:73.3 CaD: 73.5
0
10
20
30
40
50
60
Never Former Current Uterus HysterX
Per
cen
t
DM HRT CaD
WHI CT: WHI CT: Hormone Use & Uterine StatusHormone Use & Uterine Status
History of Hormone Use Hysterectomy Status
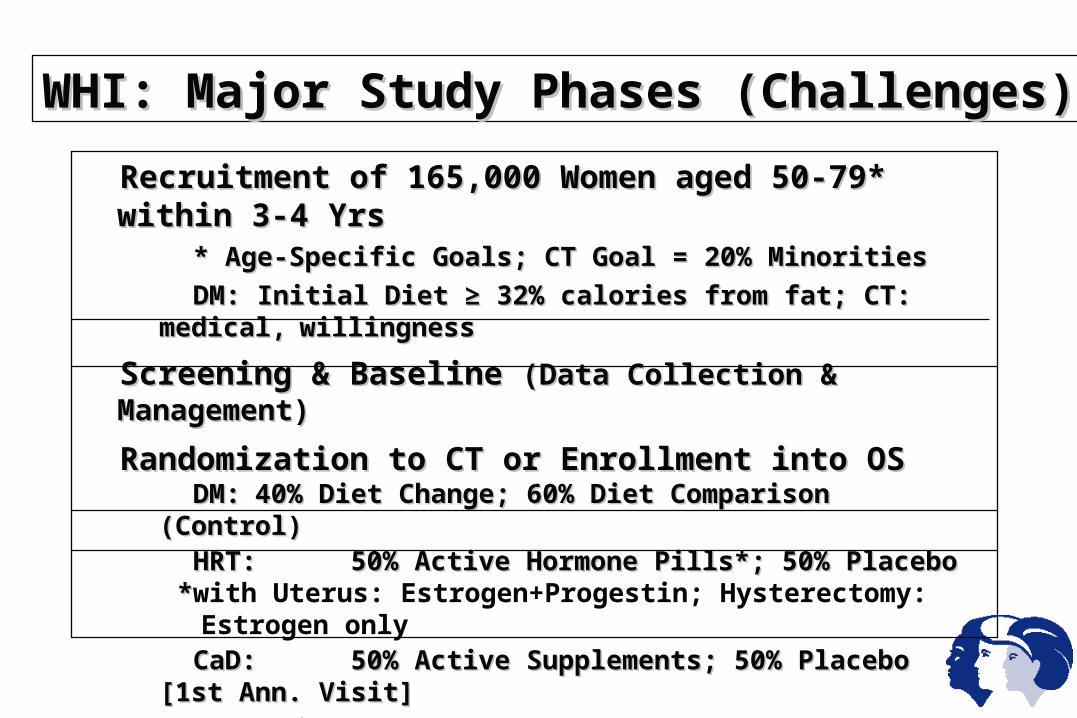
Recruitment of 165,000 Women aged 50-79* within 3-4 YrsRecruitment of 165,000 Women aged 50-79* within 3-4 Yrs * Age-Specific Goals; CT Goal = 20% Minorities* Age-Specific Goals; CT Goal = 20% Minorities
DM: Initial Diet ≥ 32% calories from fat; CT: medical,DM: Initial Diet ≥ 32% calories from fat; CT: medical, willingnesswillingness
Screening & Baseline Screening & Baseline (Data Collection & Management)(Data Collection & Management)
Randomization to CT or Enrollment into OS Randomization to CT or Enrollment into OS DM:DM: 40% Diet Change; 60% Diet Comparison (Control) 40% Diet Change; 60% Diet Comparison (Control) HRT:HRT: 50% Active Hormone Pills*; 50% Placebo50% Active Hormone Pills*; 50% Placebo
**with Uterus: Estrogen+Progestin; Hysterectomy: Estrogen only CaD:CaD: 50% Active Supplements; 50% Placebo [1st Ann. Visit]50% Active Supplements; 50% Placebo [1st Ann. Visit]
Interventions (Adherence & Safety Concerns)Interventions (Adherence & Safety Concerns)
Follow-up Visits (Retention) & Outcomes AscertainmentFollow-up Visits (Retention) & Outcomes Ascertainment
WHI: Major Study Phases (Challenges)WHI: Major Study Phases (Challenges)
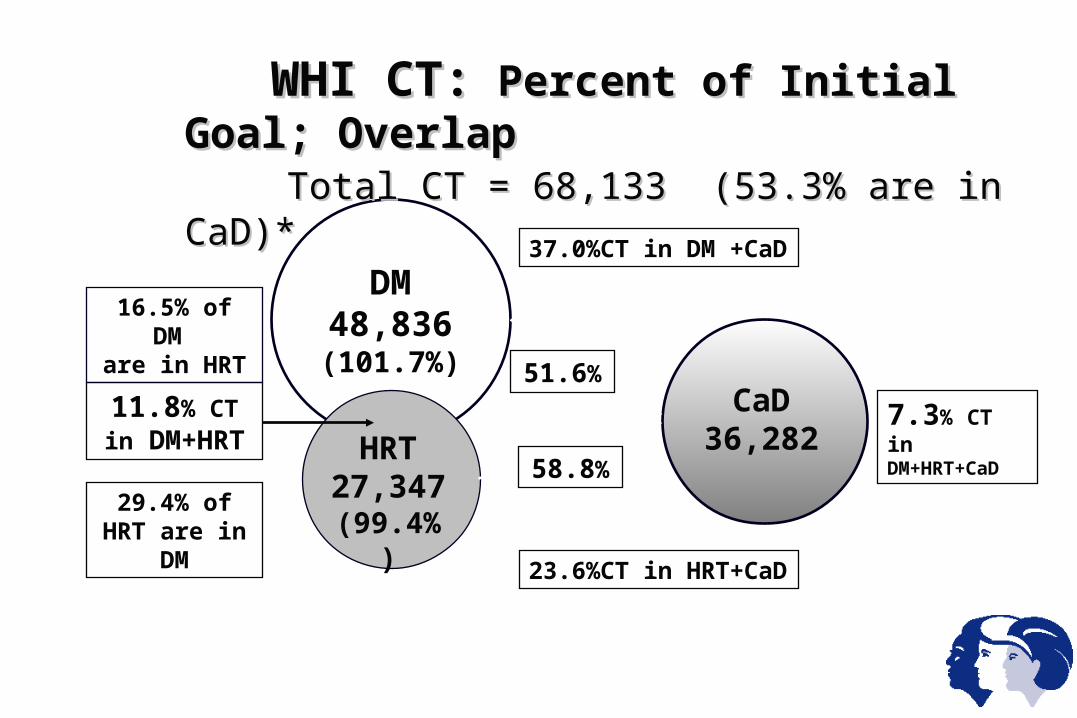
HRT27,347(99.4%)
WHI CT:WHI CT: Percent of Initial Goal; Overlap Percent of Initial Goal; Overlap Total CT = 68,133 (53.3% are in CaD)*Total CT = 68,133 (53.3% are in CaD)*
DM48,836
(101.7%)
11.8% CT in DM+HRT
29.4% of HRT are in DM
16.5% of DM are in HRT
CaD 36,282
51.6%
58.8%
7.3% CT in DM+HRT+CaD
23.6%CT in HRT+CaD
37.0%CT in DM +CaD
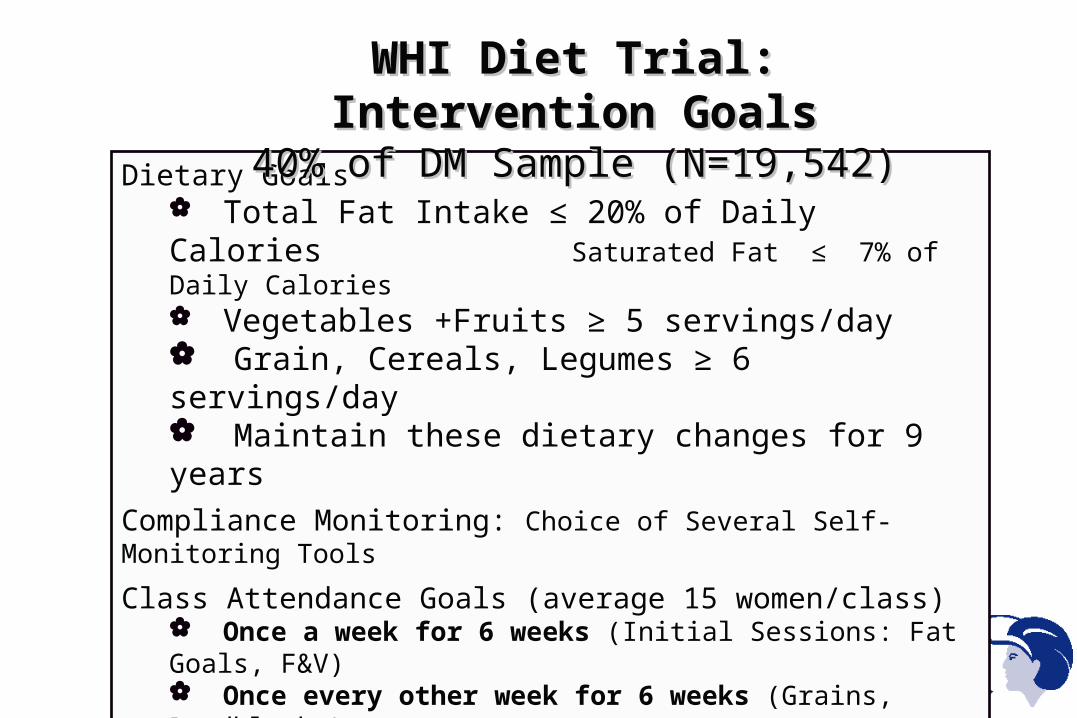
Dietary Goals Total Fat Intake ≤ 20% of Daily Calories Saturated Fat ≤ 7% of Daily Calories Vegetables +Fruits ≥ 5 servings/day Grain, Cereals, Legumes ≥ 6 servings/day Maintain these dietary changes for 9 years
Compliance Monitoring: Choice of Several Self-Monitoring Tools
Class Attendance Goals (average 15 women/class) Once a week for 6 weeks (Initial Sessions: Fat Goals, F&V) Once every other week for 6 weeks (Grains, Roadblocks) Once a month for 9 months (Behavioral Issues) Maintenance: Once every 3 months until Study Ends
WHI Diet Trial: Intervention GoalsWHI Diet Trial: Intervention Goals40% of DM Sample (N=19,542)40% of DM Sample (N=19,542)
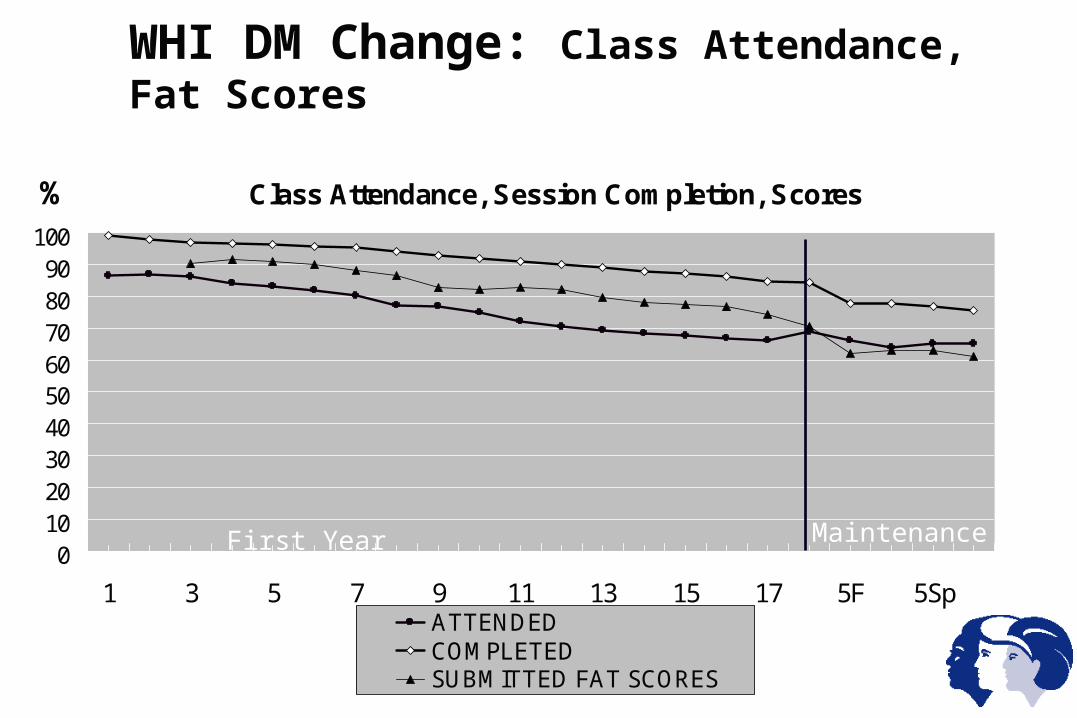
WHI DM Change: Class Attendance, Fat Scores
Class Attendance, Session Completion, Scores
0102030405060708090
100
1 3 5 7 9 11 13 15 17 5F 5SpATTENDEDCOMPLETEDSUBMITTED FAT SCORES
First Year Maintenance
%
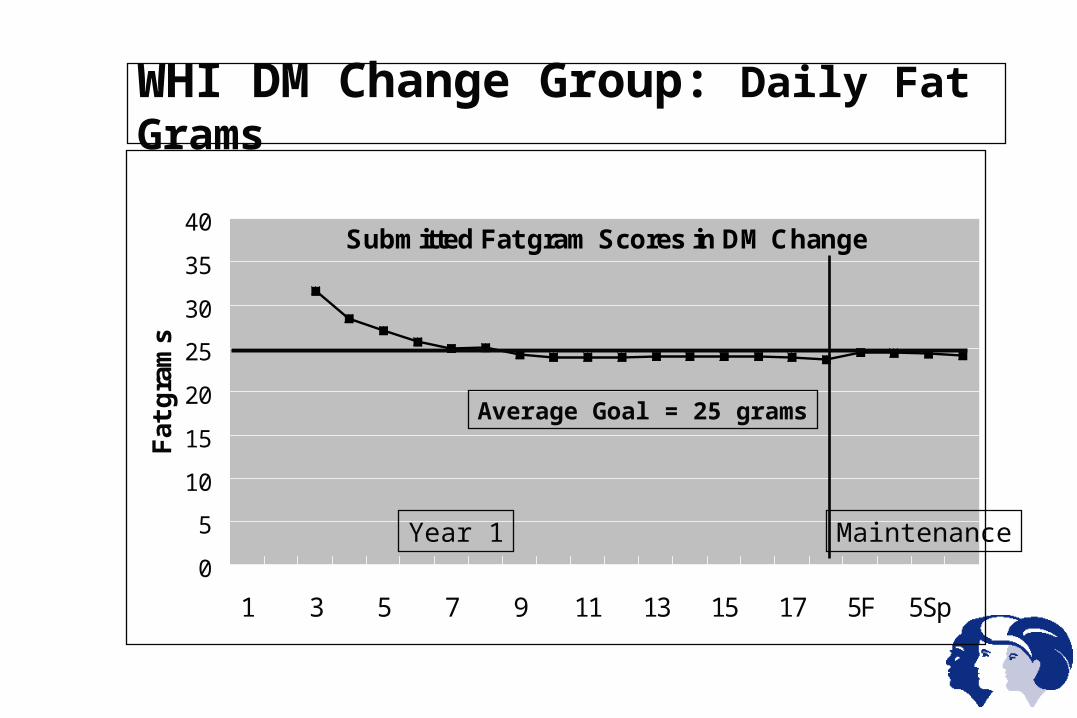
WHI DM Change Group: Daily Fat Grams
Submitted Fat gram Scores in DM Change
0
5
10
15
20
25
30
35
40
1 3 5 7 9 11 13 15 17 5F 5Sp
Fat
gra
ms
Maintenance
Average Goal = 25 grams
Year 1
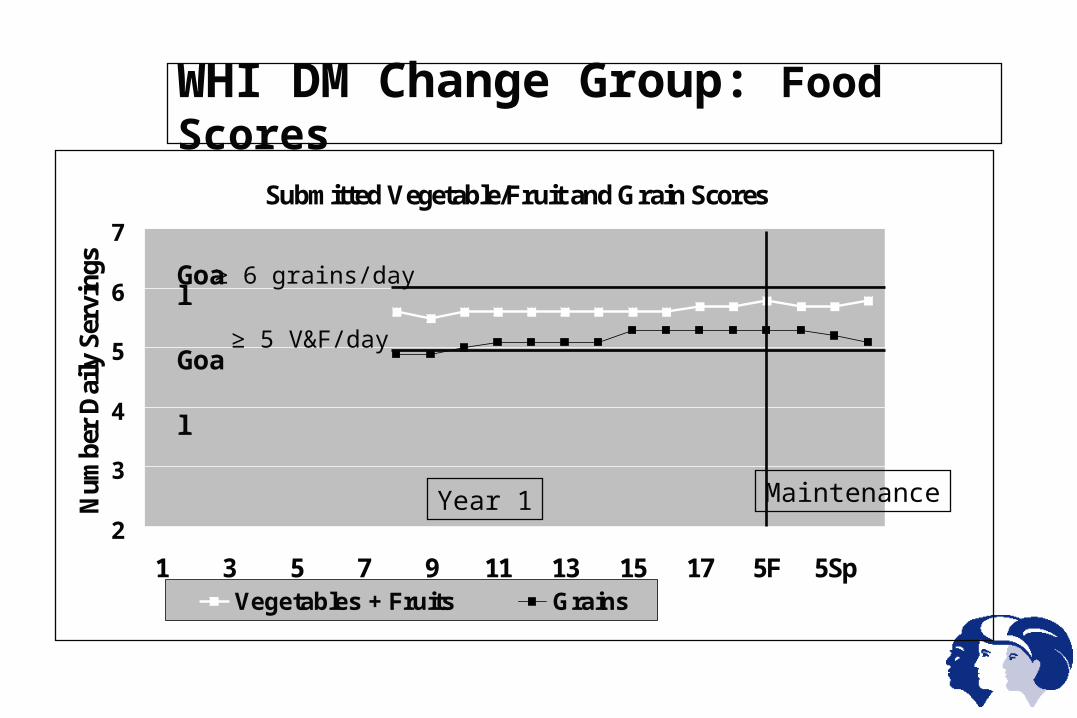
WHI DM Change Group: Food Scores
Submitted Vegetable/Fruit and Grain Scores
2
3
4
5
6
7
1 3 5 7 9 11 13 15 17 5F 5Sp
Num
ber
Dai
ly S
ervi
ngs
Vegetables + Fruits Grains
Year 1 Maintenance
Goal
Goal
≥ 6 grains/day
≥ 5 V&F/day
• HRT participants are contacted semi-annually and attend annual follow-up clinic visits, involving:
Breast exam (Annual Mammogram is also required) Pelvic Exam (for those with a uterus only) PAP smear (Baseline & Years 3,6, 9) ECG (Baseline & Years 3,6,9) Pill Collection to assess Adherence Risk counseling with any new information A subset of women have endometrial aspirations and blood
draws every 3 years (for later analyses)
WHI: Annual Clinic Visits
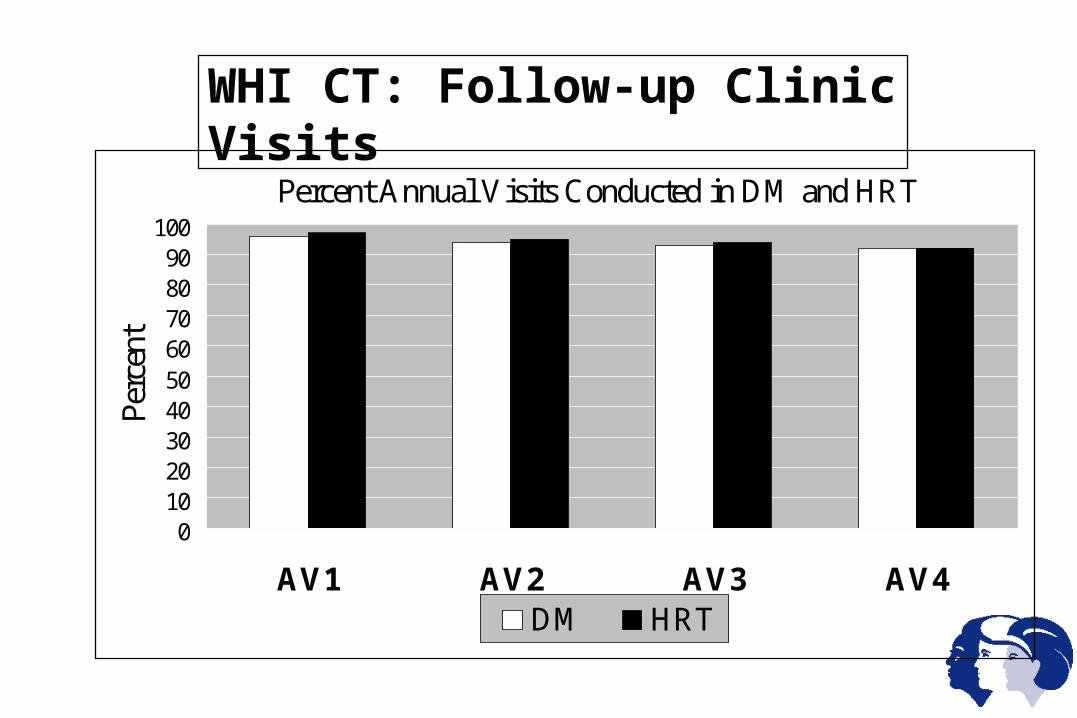
WHI CT: Follow-up Clinic VisitsPercent Annual Visits Conducted in DM and HRT
0102030405060708090
100
AV1 AV2 AV3 AV4
Perc
ent
DM HRT
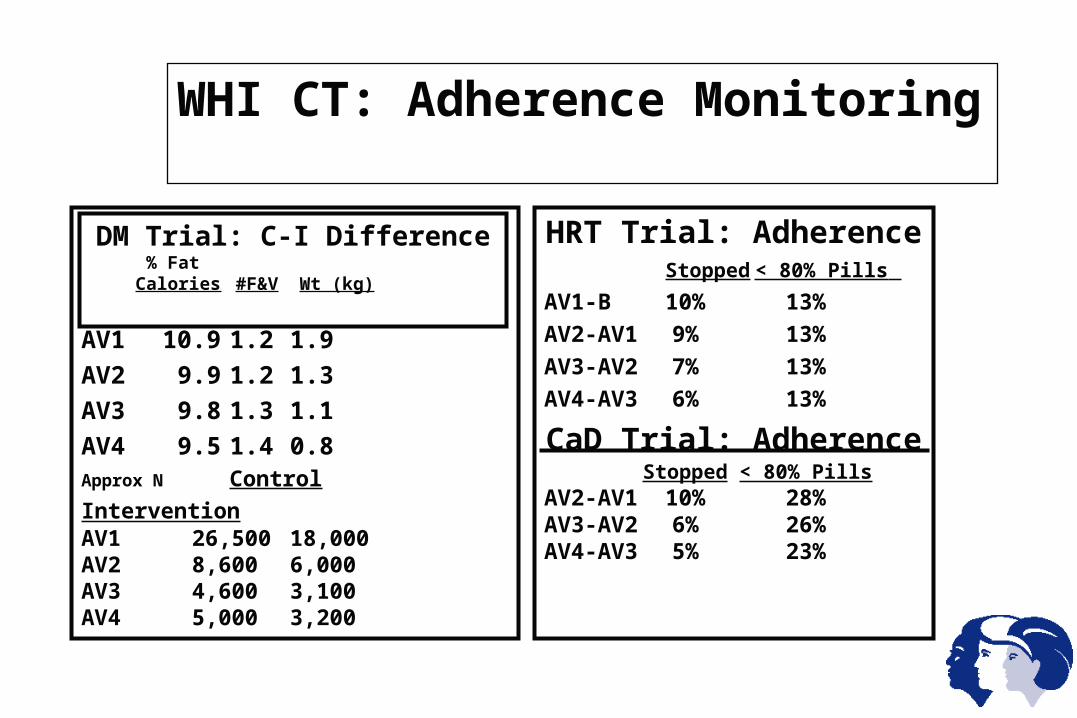
WHI CT: Adherence Monitoring
AV1 10.9 1.2 1.9
AV2 9.9 1.2 1.3
AV3 9.8 1.3 1.1
AV4 9.5 1.4 0.8Approx N Control Intervention AV1 26,500 18,000AV2 8,600 6,000AV3 4,600 3,100AV4 5,000 3,200
HRT Trial: AdherenceStopped < 80% Pills
AV1-B 10% 13%
AV2-AV1 9% 13%
AV3-AV2 7% 13%
AV4-AV3 6% 13%
CaD Trial: AdherenceStopped < 80% Pills
AV2-AV1 10% 28%AV3-AV2 6% 26%AV4-AV3 5% 23%
DM Trial: C-I Difference % Fat
Calories #F&V Wt (kg)
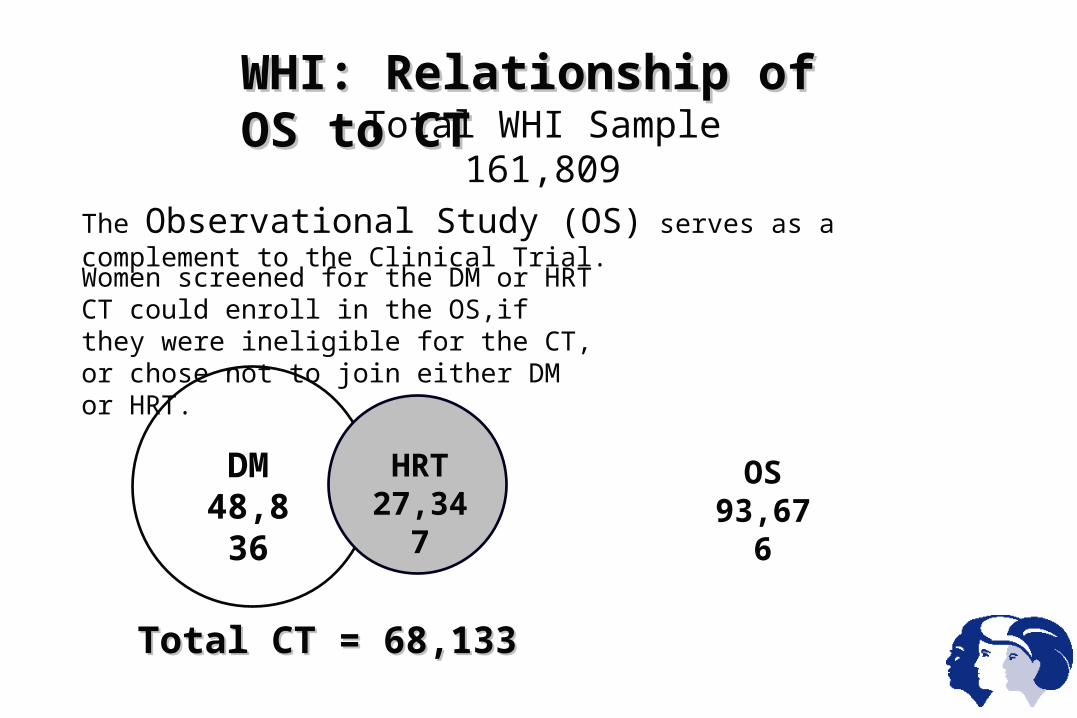
Total CT = 68,133Total CT = 68,133
HRT27,347
WHI: Relationship of OS to CTWHI: Relationship of OS to CT
DM48,836
The Observational Study (OS) serves as a complement to the Clinical Trial.
Total WHI Sample 161,809
Women screened for the DM or HRT CT could enroll in the OS,if they were ineligible for the CT, or chose not to join either DM or HRT.
OS93,676
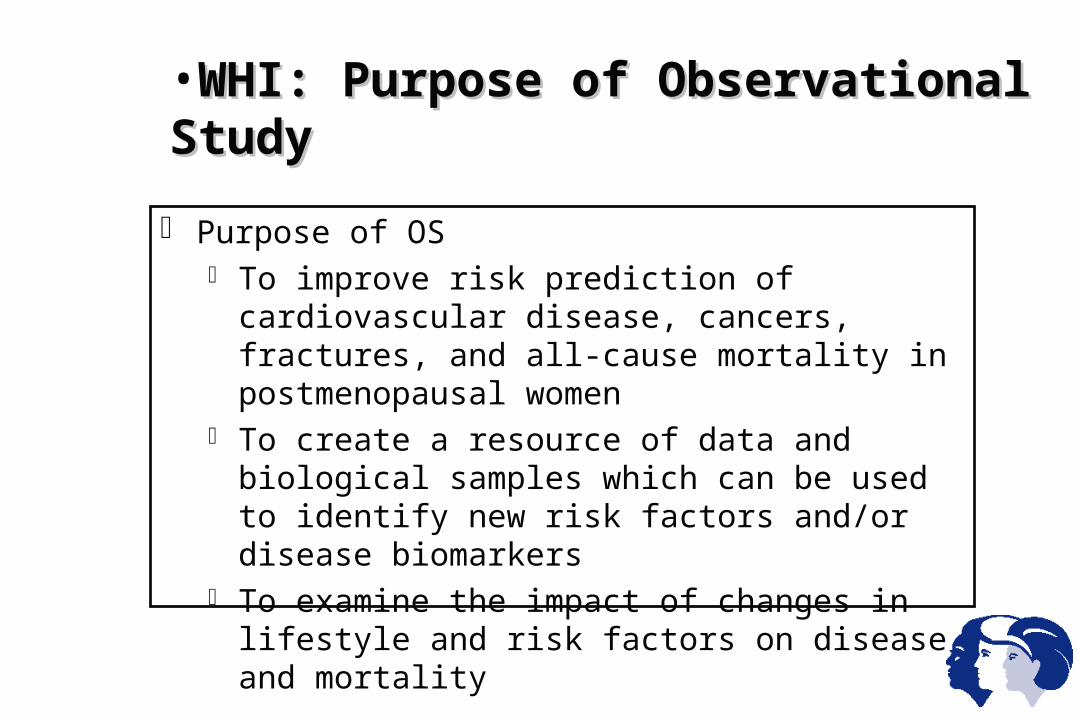
•WHI: Purpose of Observational StudyWHI: Purpose of Observational Study
Purpose of OS To improve risk prediction of cardiovascular
disease, cancers, fractures, and all-cause mortality in postmenopausal women
To create a resource of data and biological samples which can be used to identify new risk factors and/or disease biomarkers
To examine the impact of changes in lifestyle and risk factors on disease and mortality
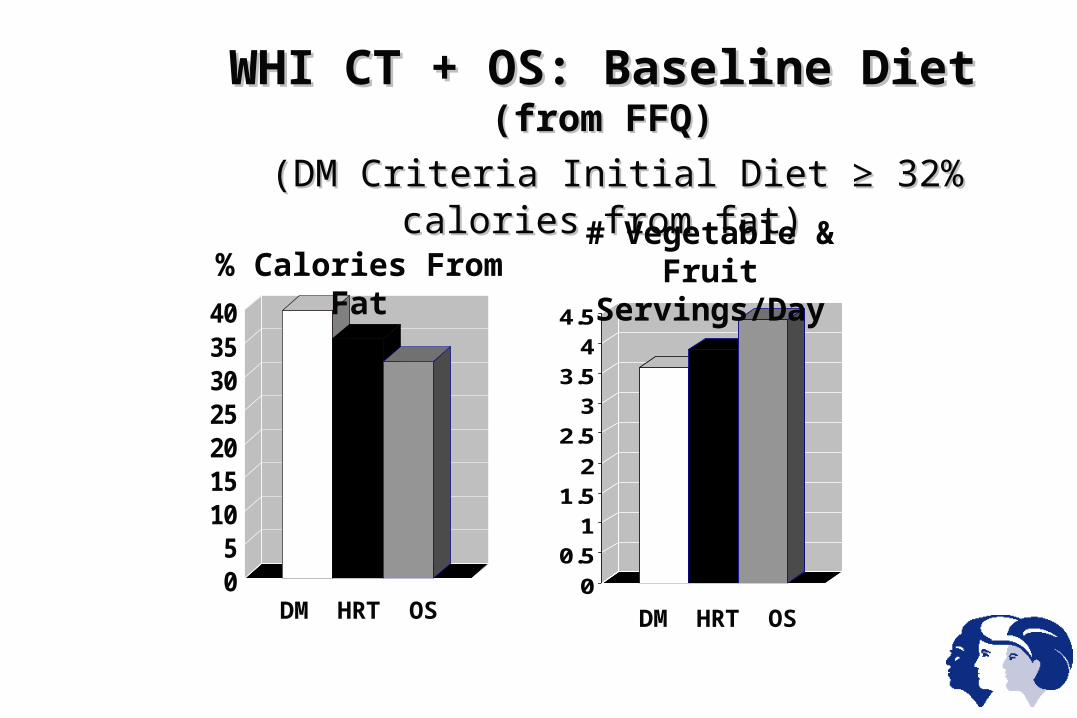
WHI CT + OS: Baseline Diet WHI CT + OS: Baseline Diet (from FFQ)(from FFQ)
(DM Criteria Initial Diet ≥ 32% calories from fat)(DM Criteria Initial Diet ≥ 32% calories from fat)
05
10152025303540
0
0.5
1
1.5
2
2.5
3
3.5
4
4.5
% Calories From Fat# Vegetable & Fruit
Servings/Day
DM HRT OS DM HRT OS
0
5
10
15
20
25
30
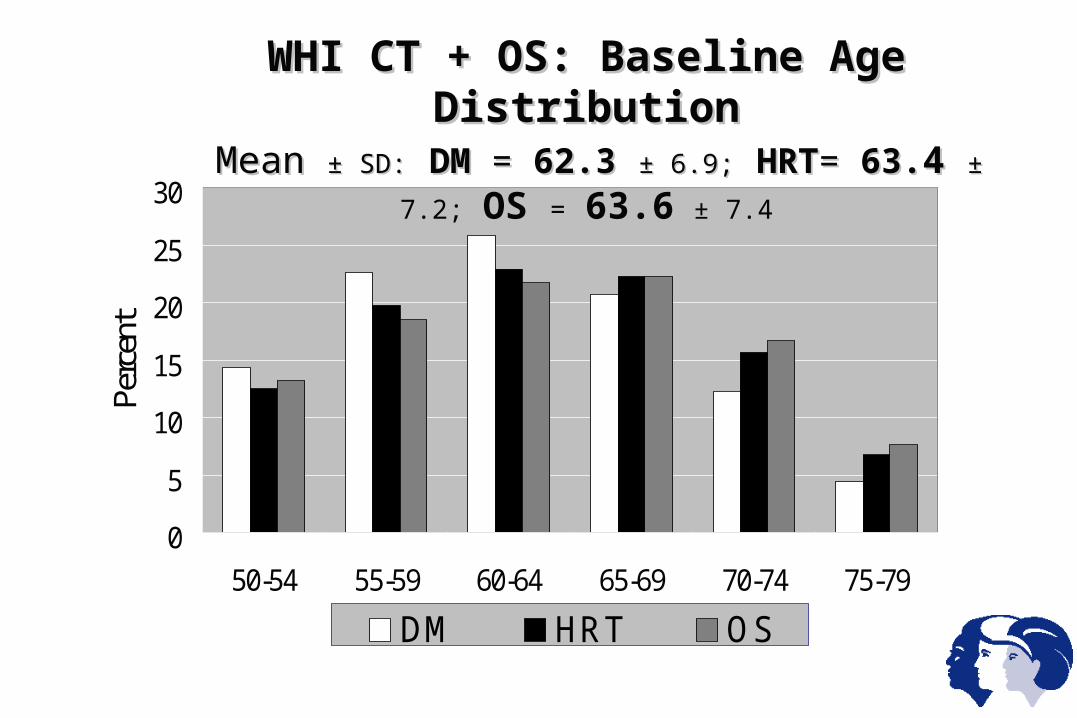
50-54 55-59 60-64 65-69 70-74 75-79
Perc
ent
DM HRT OS
WHI CT + OS: Baseline Age DistributionWHI CT + OS: Baseline Age Distribution Mean Mean ± SD:± SD: DM DM = = 62.362.3 ± 6.9;± 6.9; HRTHRT= = 63.63.44 ± 7.2;± 7.2; OS OS == 63.663.6 ± ±
7.47.4
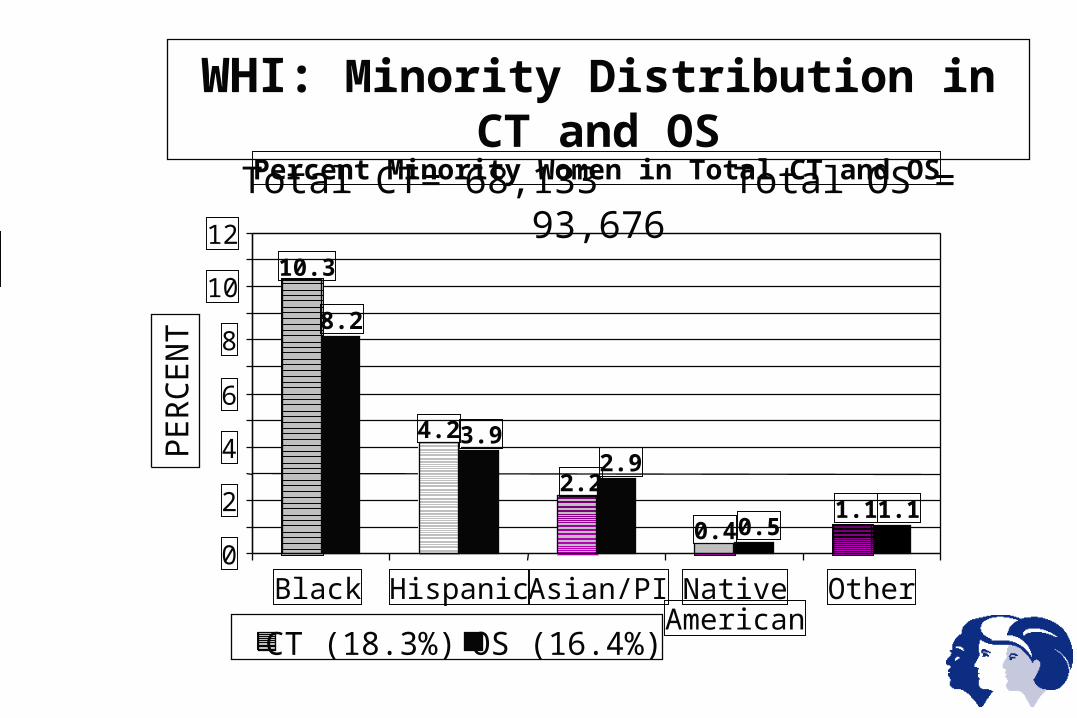
WHI: Minority Distribution in CT and OSTotal CT= 68,133 Total OS = 93,676Percent Minority Women in Total CT and OS
1.10.4
2.2
4.2
10.3
1.10.5
2.93.9
8.2
0
2
4
6
8
10
12
Black Hispanic Asian/PI NativeAmerican
Other
CT (18.3%) OS (16.4%)
PE
RC
EN
T
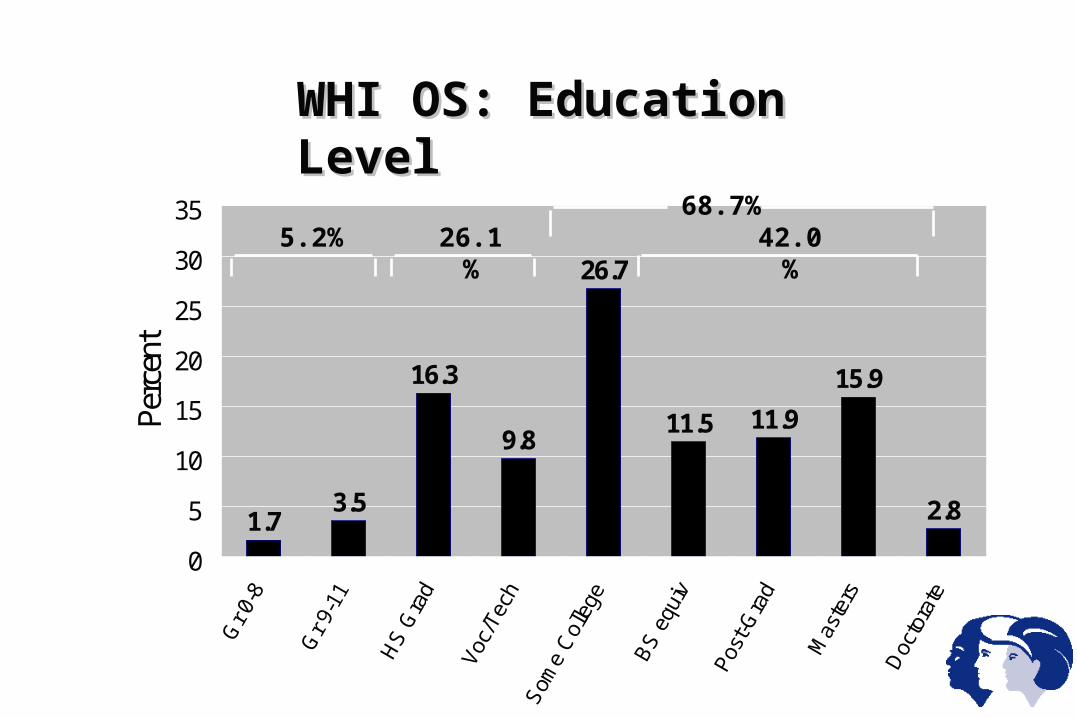
1.73.5
16.3
9.811.5 11.9
15.9
2.8
26.7
0
5
10
15
20
25
30
35G
r 0-8
Gr 9
-11
HS
Gra
d
Voc/
Tech
Som
e C
olle
ge
BS
equ
iv
Post
-Gra
d
Mas
ters
Doc
tora
te
Perc
ent
WHI OS: Education LevelWHI OS: Education Level
42.0%26.1%5.2%68.7%
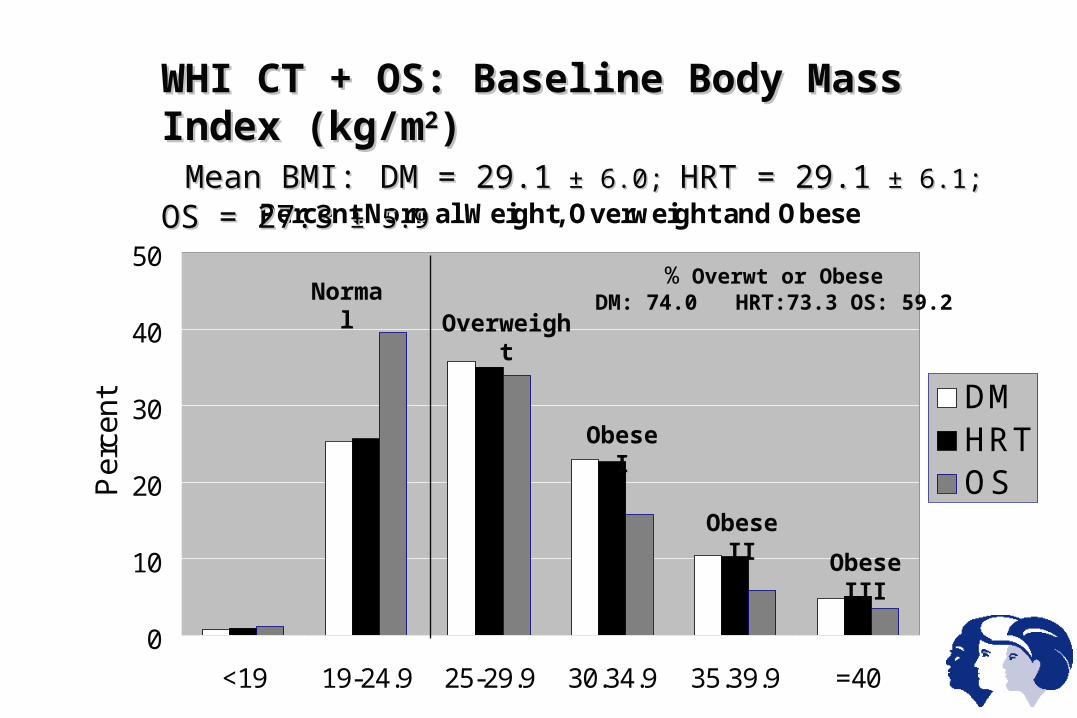
Percent Normal Weight, Overweight and Obese
0
10
20
30
40
50
<19 19-24.9 25-29.9 30.34.9 35.39.9 =40
Per
cen
t DMHRTOS
WHI CT + OS: Baseline Body Mass Index (kg/mWHI CT + OS: Baseline Body Mass Index (kg/m22)) Mean BMI:Mean BMI: DM = 29.1DM = 29.1 ± 6.0; ± 6.0; HRT = 29.1HRT = 29.1 ± 6.1; ± 6.1; OS = 27.3OS = 27.3 ± 5.9 ± 5.9
NormalOverweight
Obese I
Obese II
Obese III
% Overwt or ObeseDM: 74.0 HRT:73.3 OS: 59.2
0
10
20
30
40
50
60
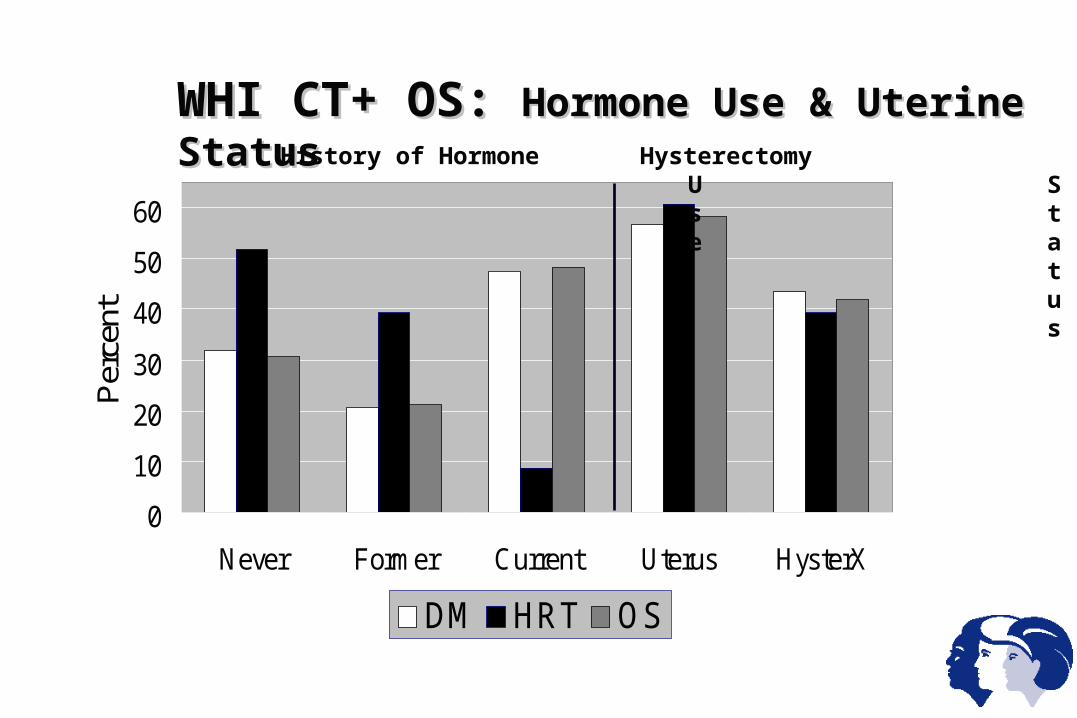
Never Former Current Uterus HysterX
Per
cent
DM HRT OS
WHI CT+ OS: WHI CT+ OS: Hormone Use & Uterine StatusHormone Use & Uterine StatusHistory of Hormone Use Hysterectomy Status