wisam&alkawai,&tapan&mukerji& … · quantitative seismic interpretation...
TRANSCRIPT
Basin and Petroleum System Modeling Industrial Affiliates Program
Integra(ng Basin Modeling with Seismic Technology and Rock Physics
Wisam AlKawai, Tapan Mukerji and Stephan Graham
Basin and Petroleum System Modeling Group 2013 Industrial Affiliates Mee(ng
November 13, 2013
Personal Introduction
M.S. Candidate Advisors: Stephan Graham and Tapan Mukerji Research Interests: Basin and Petroleum System Modeling,
Rock Physics and Quantitative Seismic Interpretation.
B.S. in Geophysics – University of Houston (2010). Geophysicist- Saudi Aramco (2010- 2012)
Outline
Motivation Data and Study Area Rock Physics Modeling 1D Basin Modeling Seismic Inversion Conclusions
Motivation
Use Quantitative Seismic Interpretation techniques at the basin scale.
Provide control for lithofacies input to a basin model.
Assess the link between basin modeling, rock physics and seismic technology.
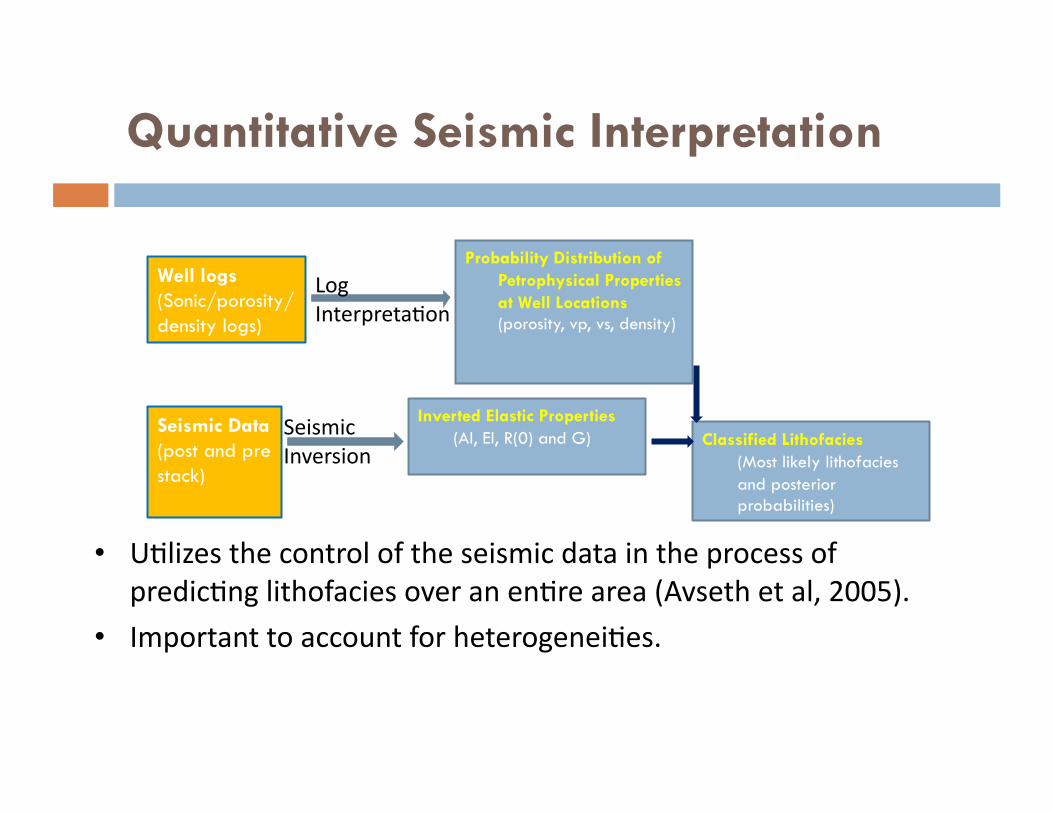
Quantitative Seismic Interpretation
Probability Distribution of Petrophysical Properties at Well Locations (porosity, vp, vs, density)
Well logs (Sonic/porosity/density logs)
Seismic Data (post and pre stack)
Inverted Elastic Properties (AI, EI, R(0) and G)
Log Interpreta>on
Seismic Inversion
Classified Lithofacies (Most likely lithofacies and posterior probabilities)
• U>lizes the control of the seismic data in the process of predic>ng lithofacies over an en>re area (Avseth et al, 2005).
• Important to account for heterogenei>es.
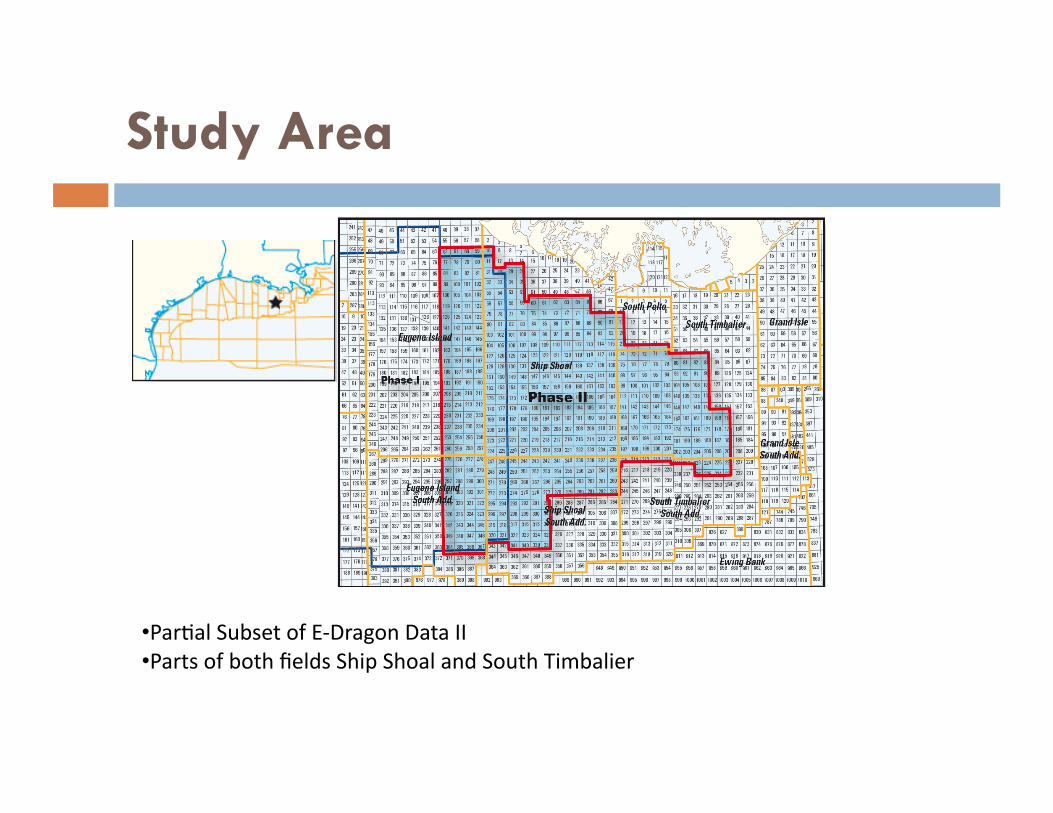
Study Area
• Par>al Subset of E-‐Dragon Data II • Parts of both fields Ship Shoal and South Timbalier
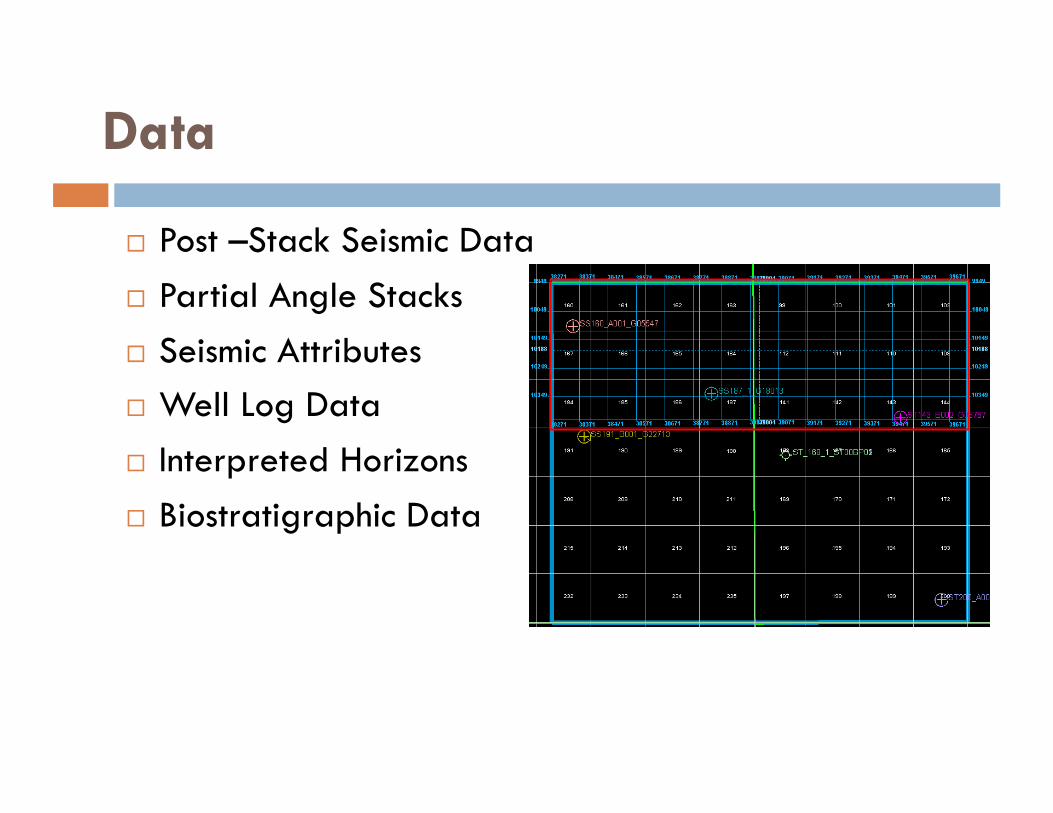
Data
Post –Stack Seismic Data Partial Angle Stacks Seismic Attributes Well Log Data Interpreted Horizons Biostratigraphic Data
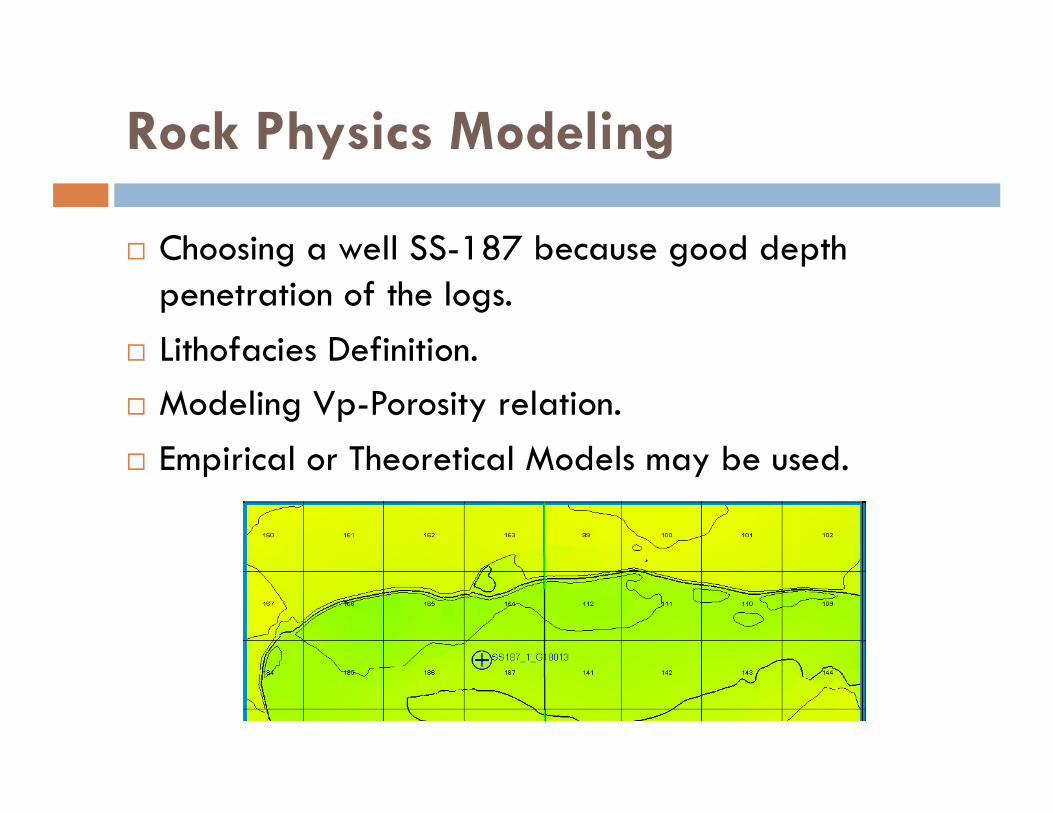
Rock Physics Modeling
Choosing a well SS-187 because good depth penetration of the logs.
Lithofacies Definition. Modeling Vp-Porosity relation. Empirical or Theoretical Models may be used.
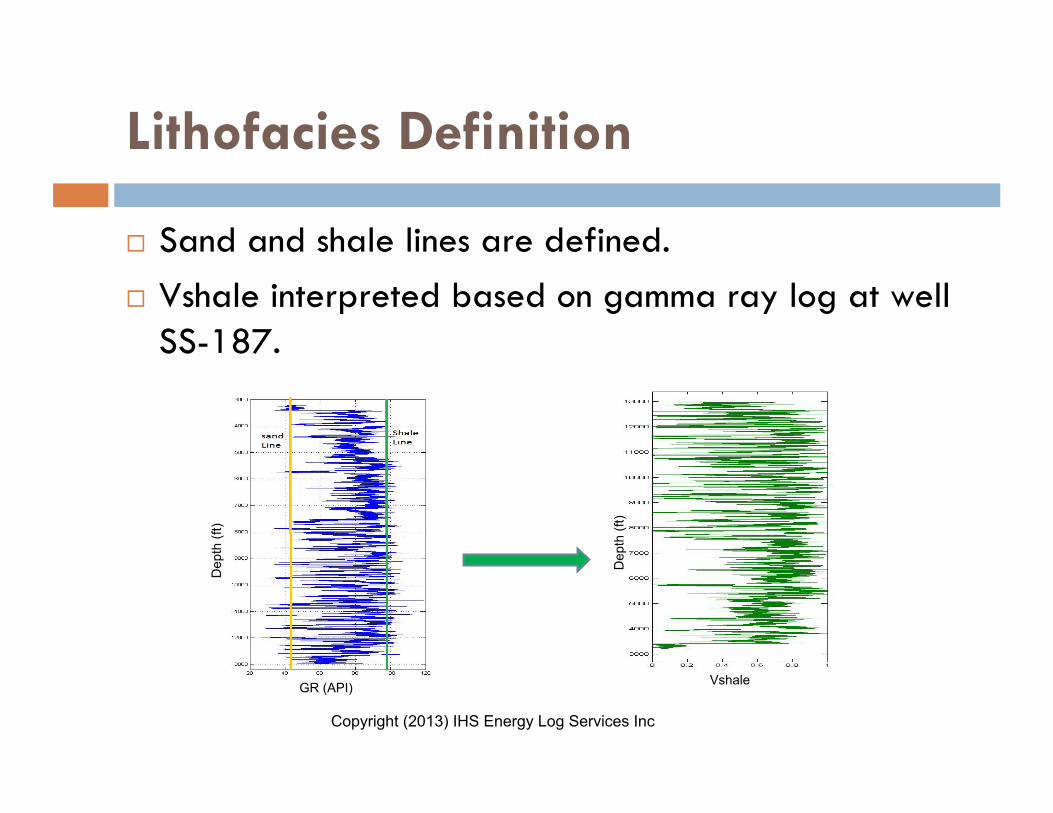
Lithofacies Definition
Sand and shale lines are defined. Vshale interpreted based on gamma ray log at well
SS-187.
Dep
th (f
t)
Dep
th (f
t)
GR (API) Vshale
Copyright (2013) IHS Energy Log Services Inc
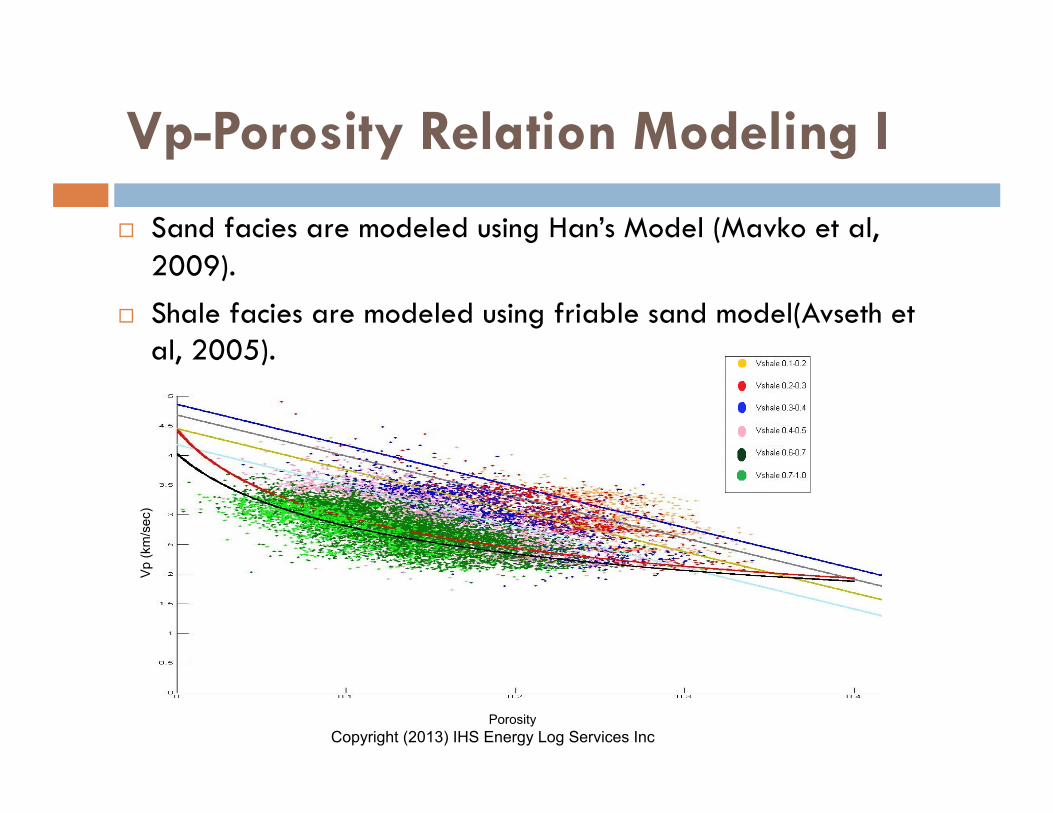
Vp-Porosity Relation Modeling I
Sand facies are modeled using Han’s Model (Mavko et al, 2009).
Shale facies are modeled using friable sand model(Avseth et al, 2005).
Vp
(km
/sec
)
Porosity Copyright (2013) IHS Energy Log Services Inc
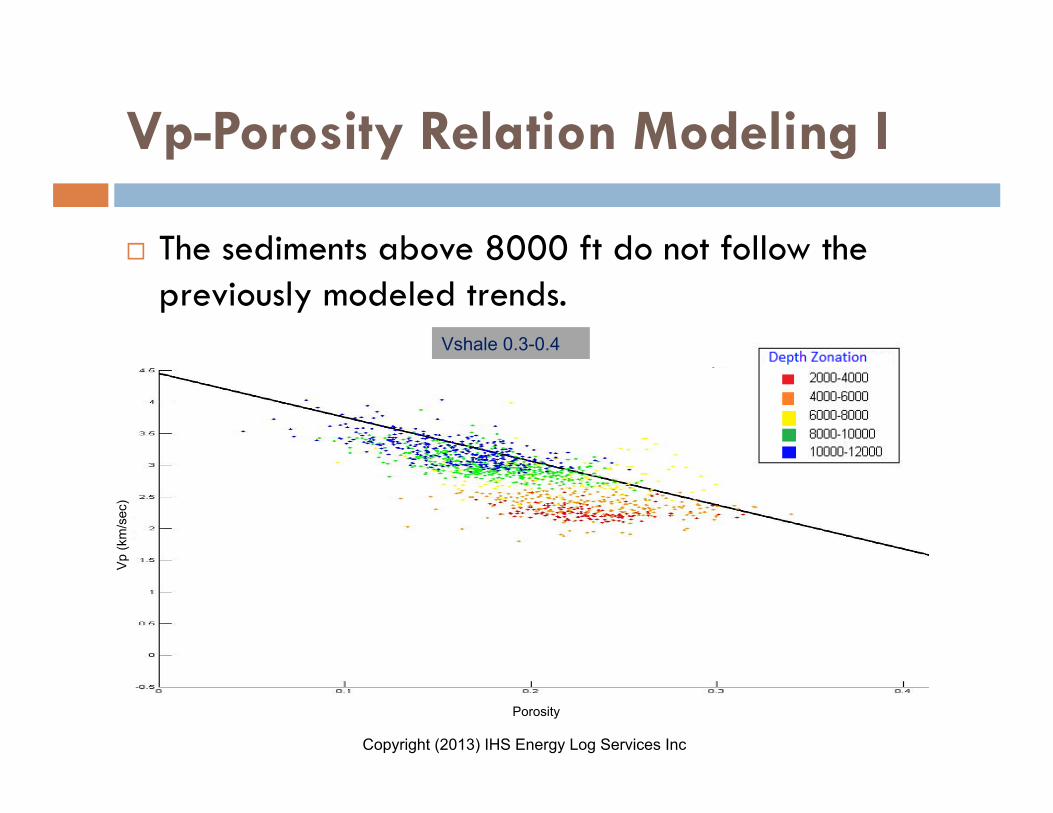
Vp-Porosity Relation Modeling I
The sediments above 8000 ft do not follow the previously modeled trends.
Copyright (2013) IHS Energy Log Services Inc
Vshale 0.3-0.4
Vp
(km
/sec
)
Porosity
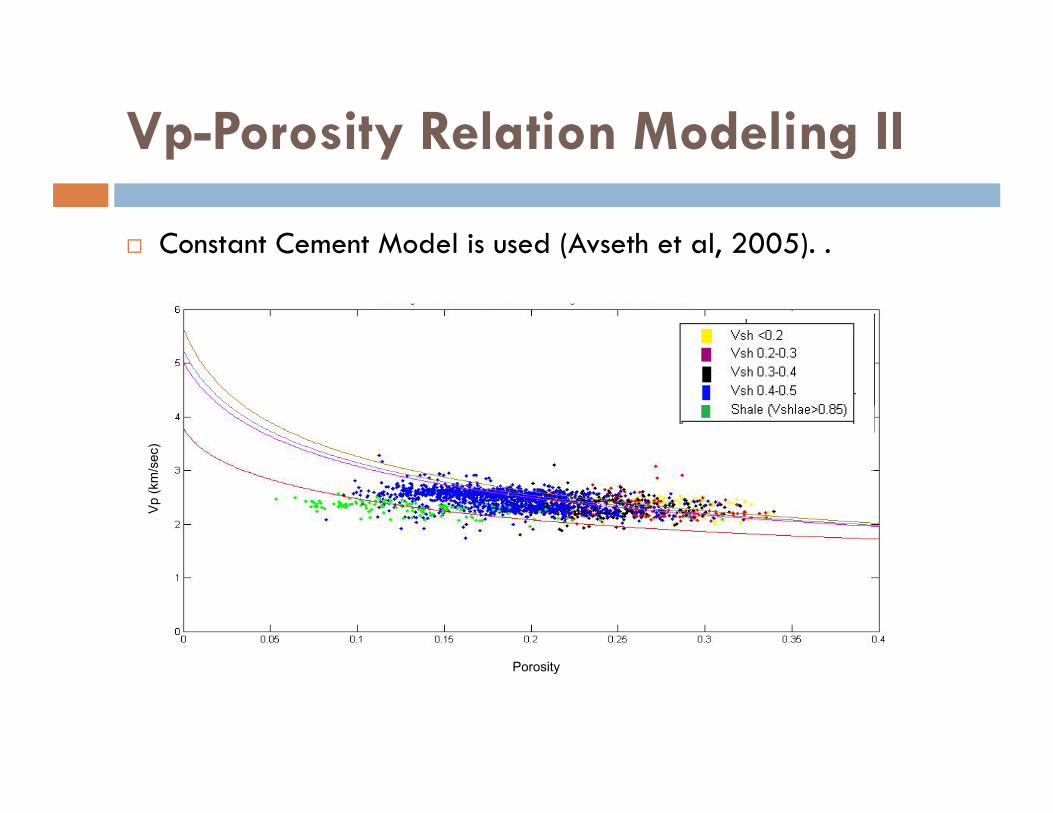
Vp-Porosity Relation Modeling II
Constant Cement Model is used (Avseth et al, 2005). .
Vp
(km
/sec
)
Porosity
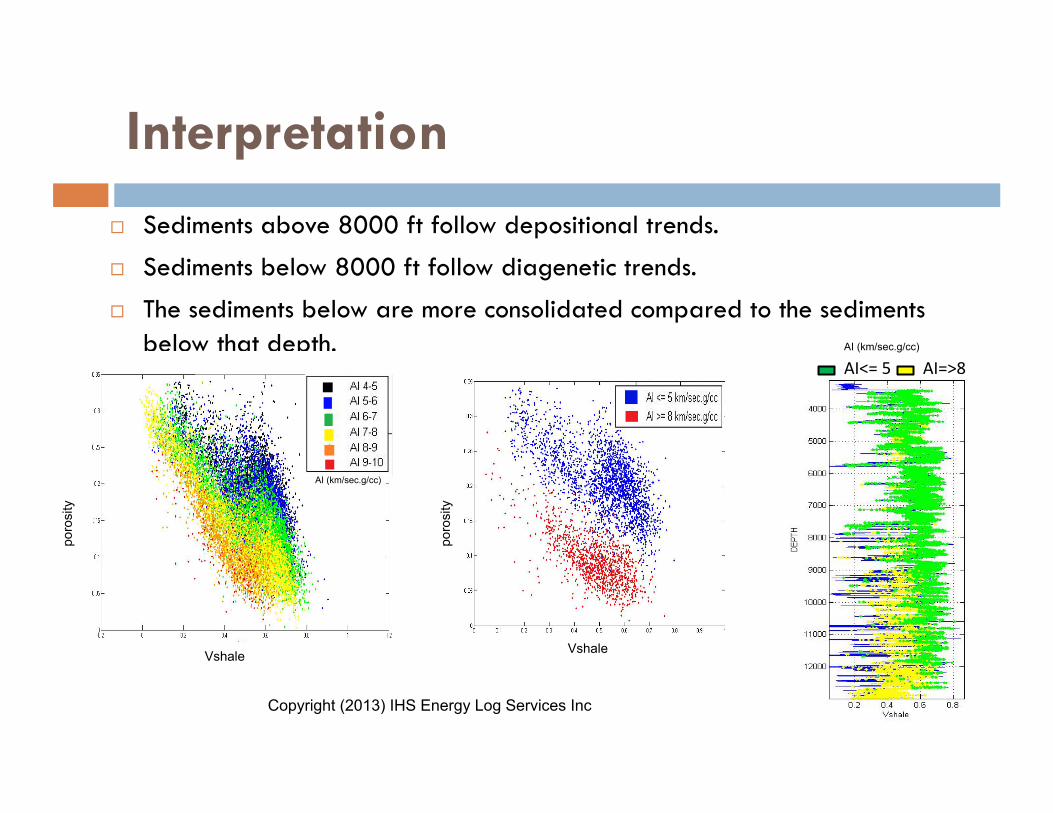
Interpretation Sediments above 8000 ft follow depositional trends.
Sediments below 8000 ft follow diagenetic trends.
The sediments below are more consolidated compared to the sediments below that depth.
AI<= 5 AI=>8
poro
sity
Vshale
poro
sity
Vshale
Copyright (2013) IHS Energy Log Services Inc
AI (km/sec.g/cc)
AI (km/sec.g/cc)
Previous Models for Diagenesis
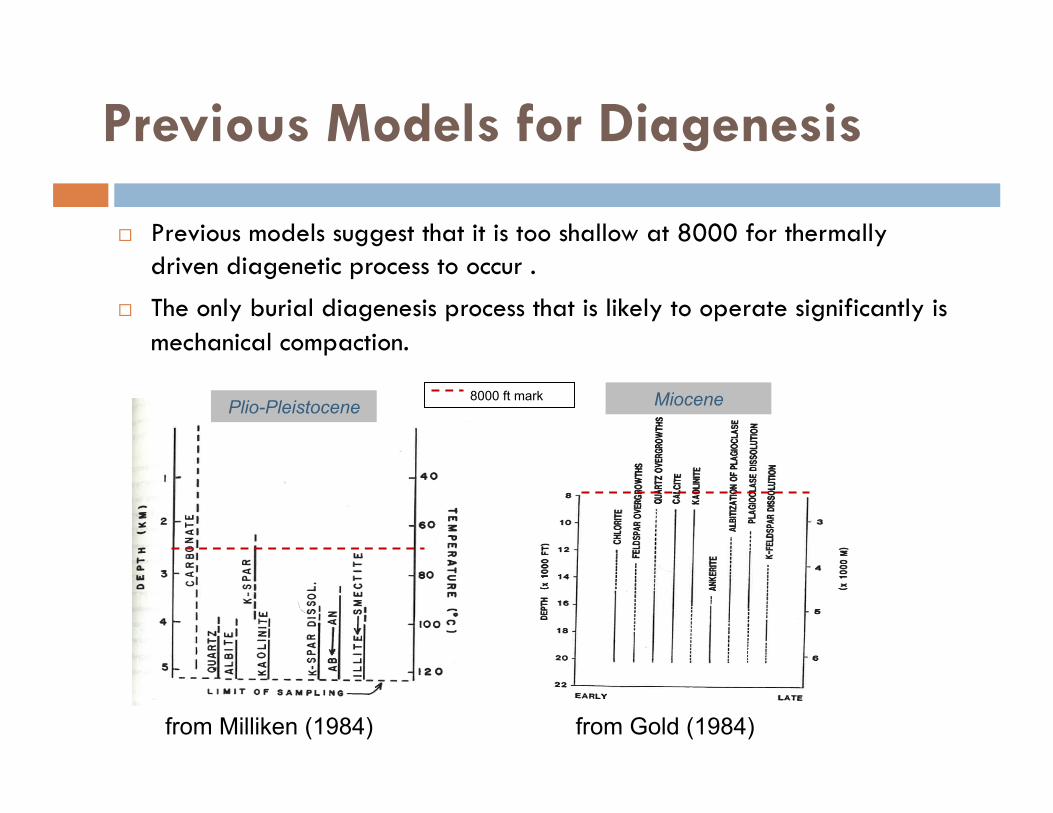
Previous models suggest that it is too shallow at 8000 for thermally driven diagenetic process to occur .
The only burial diagenesis process that is likely to operate significantly is mechanical compaction.
from Milliken (1984) from Gold (1984)
Plio-Pleistocene Miocene 8000 ft mark
1D Basin Modeling
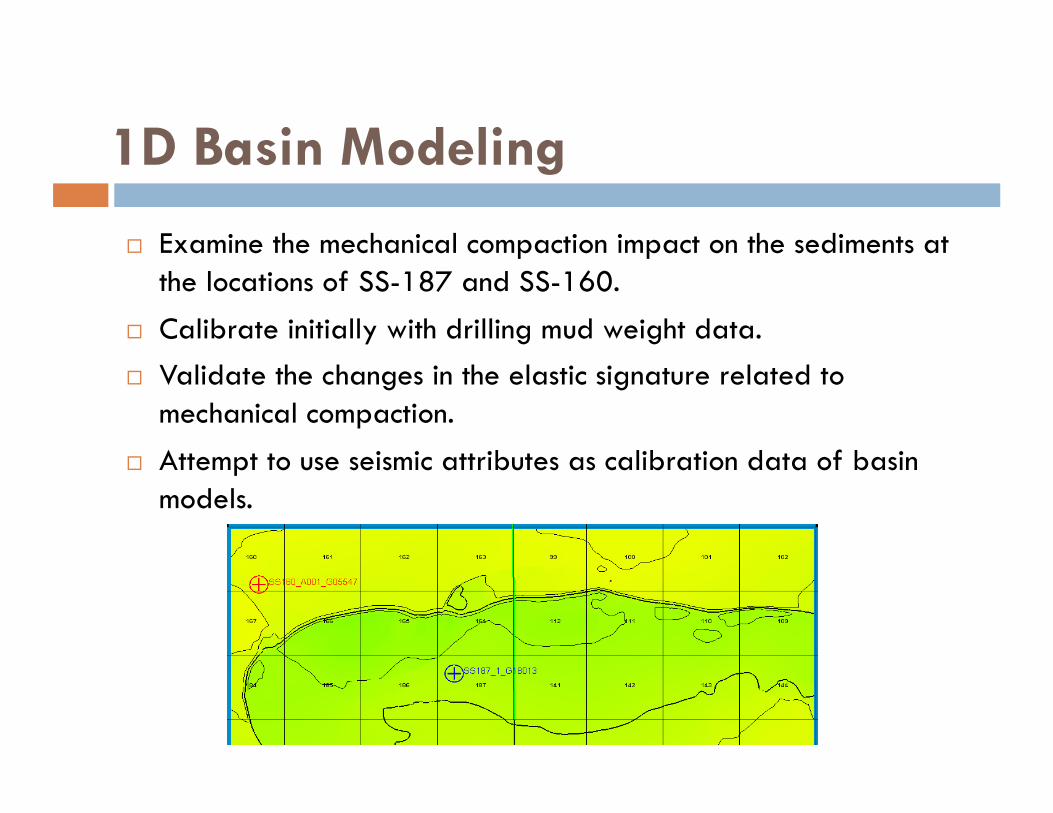
Examine the mechanical compaction impact on the sediments at the locations of SS-187 and SS-160.
Calibrate initially with drilling mud weight data. Validate the changes in the elastic signature related to
mechanical compaction.
Attempt to use seismic attributes as calibration data of basin models.
1D Basin Modeling Workflow
Age control is determined for each well location from interpreted horizons and available biostratigraphic data.
Lithofacies defined based on Vshale distribution in each layer at SS-187.
Porosity compaction curves are based on Arthy’s law and they are calibrated to porosity data from SS-187.
Permeability adjustment to calibrate with mud weight equivalent.
Values from elastic moduli are based on lab measurements data (Mavko et al, 2009).
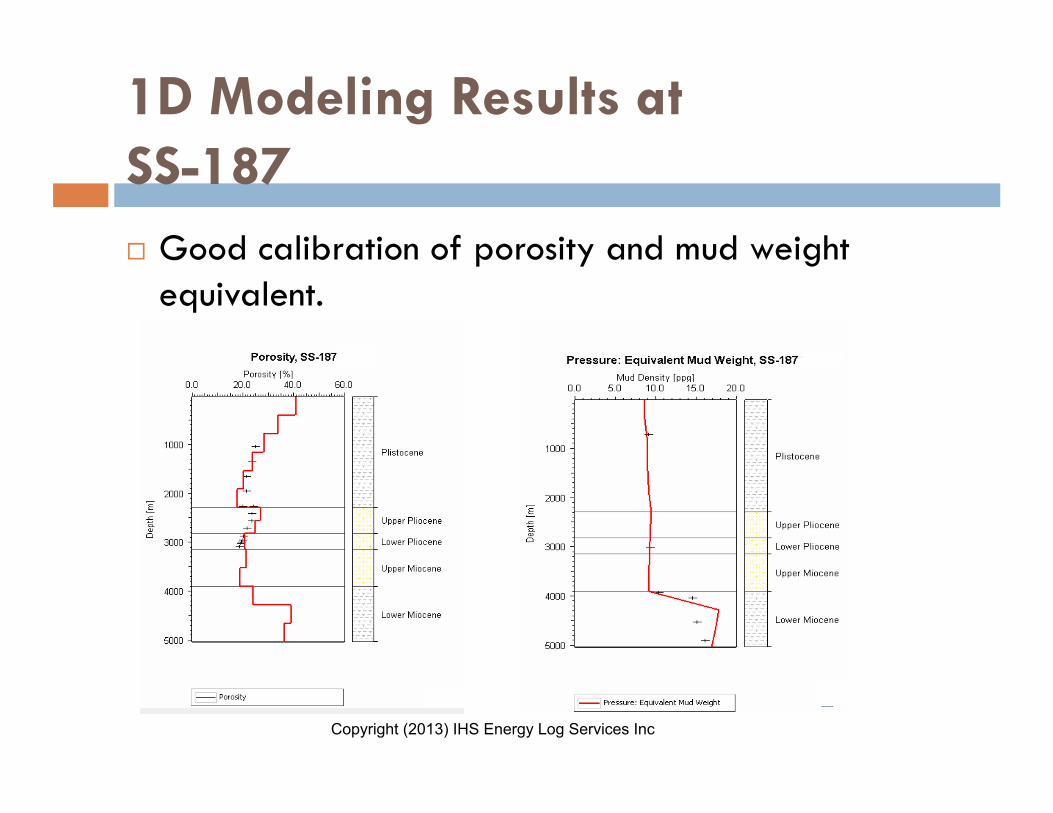
1D Modeling Results at SS-187 Good calibration of porosity and mud weight
equivalent.
Copyright (2013) IHS Energy Log Services Inc
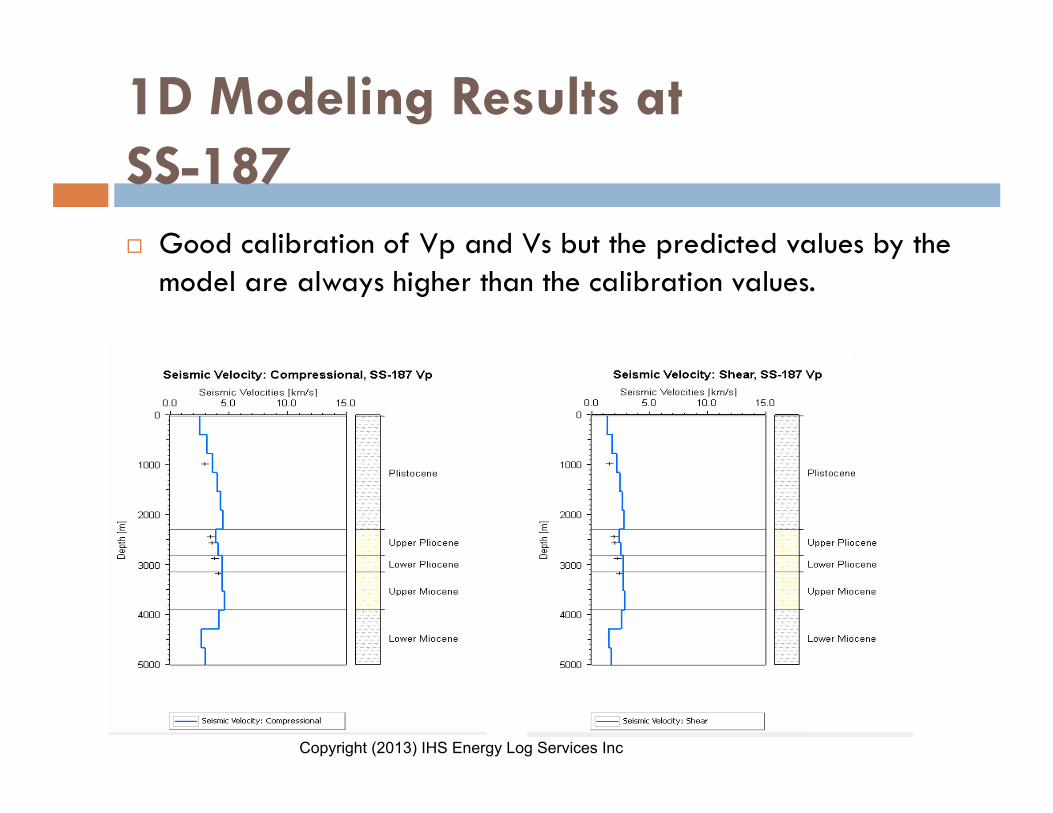
1D Modeling Results at SS-187 Good calibration of Vp and Vs but the predicted values by the
model are always higher than the calibration values.
Copyright (2013) IHS Energy Log Services Inc
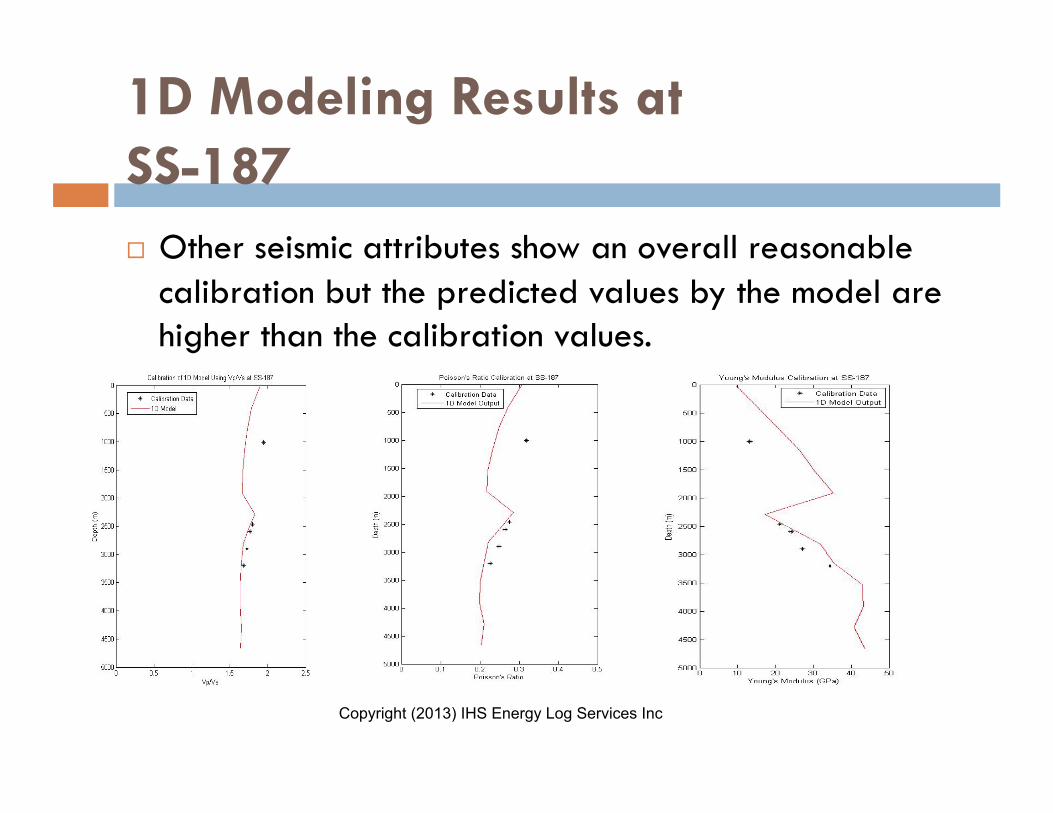
1D Modeling Results at SS-187 Other seismic attributes show an overall reasonable
calibration but the predicted values by the model are higher than the calibration values.
Copyright (2013) IHS Energy Log Services Inc
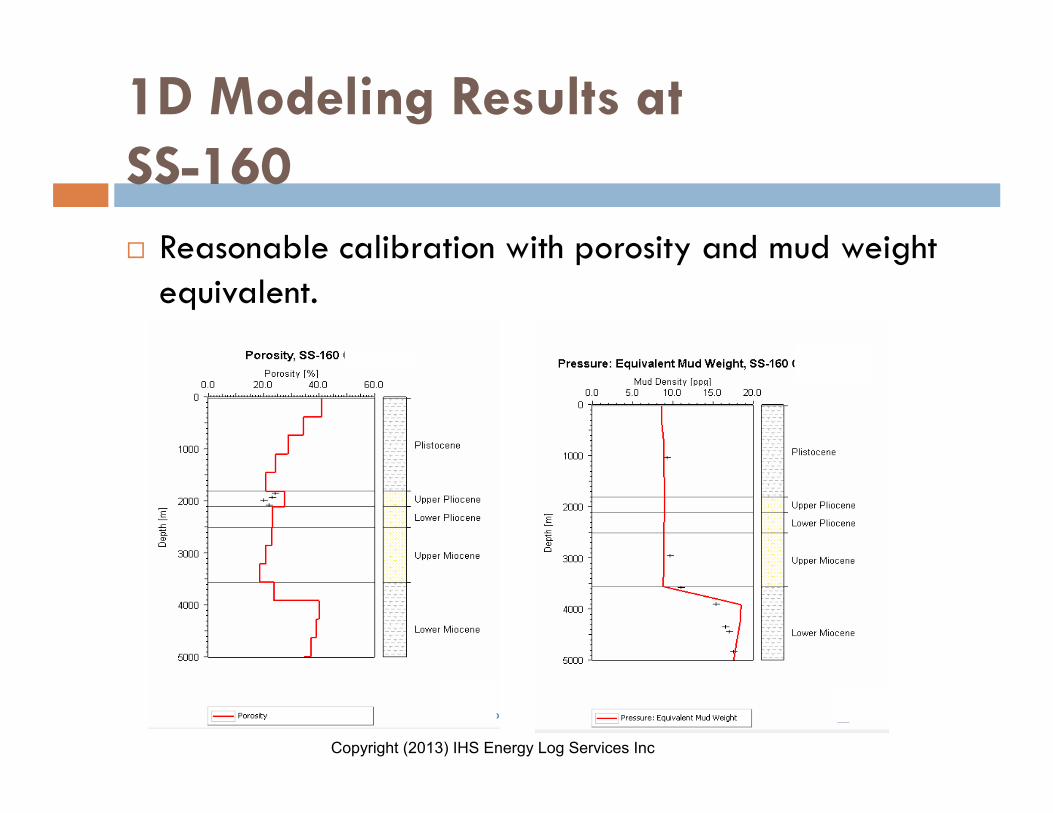
1D Modeling Results at SS-160 Reasonable calibration with porosity and mud weight
equivalent.
Copyright (2013) IHS Energy Log Services Inc
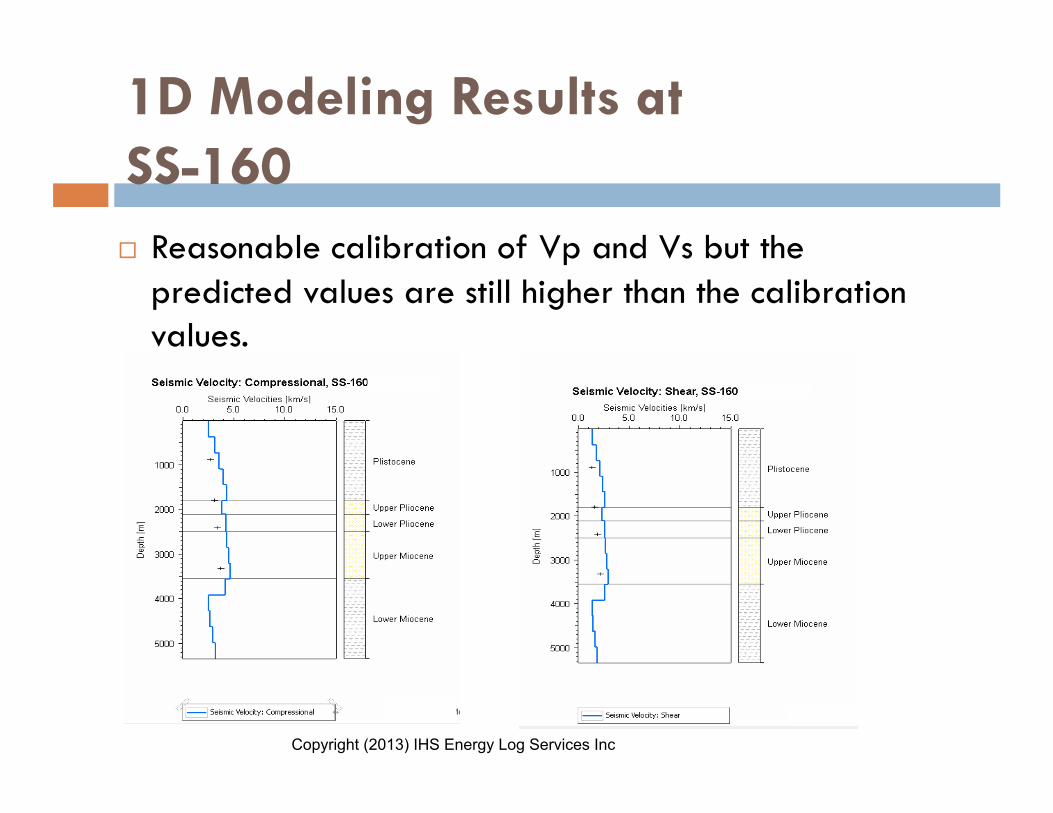
1D Modeling Results at SS-160 Reasonable calibration of Vp and Vs but the
predicted values are still higher than the calibration values.
Copyright (2013) IHS Energy Log Services Inc
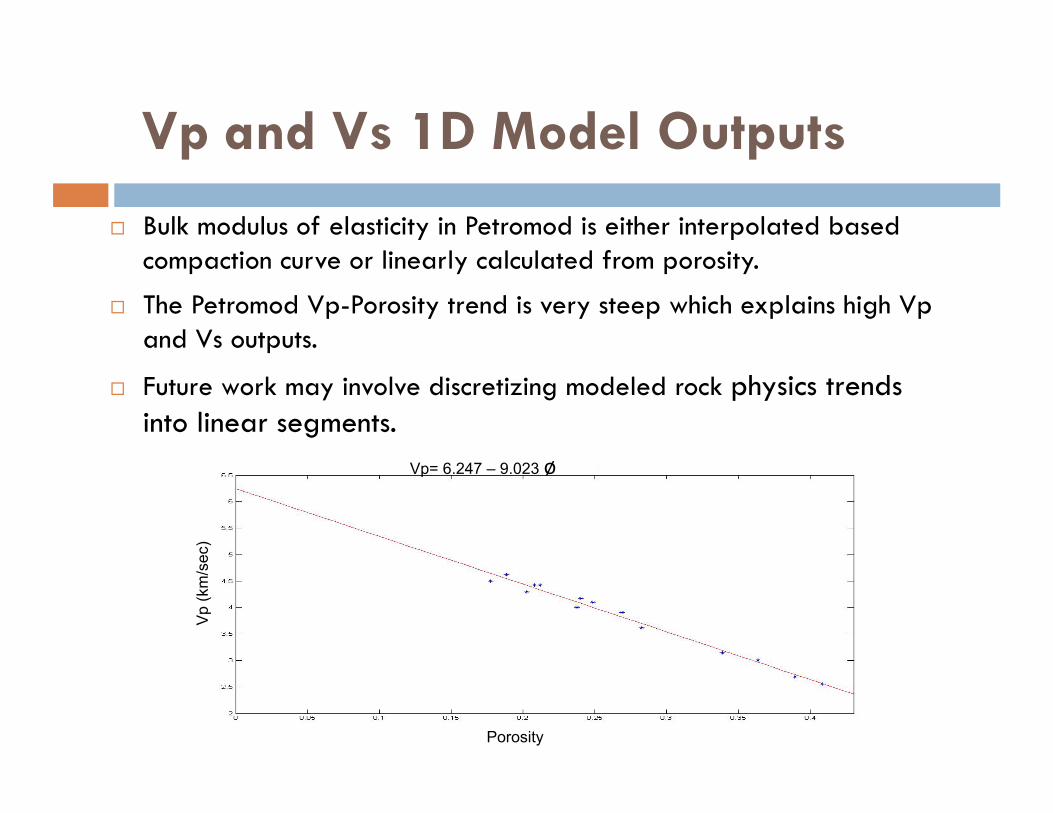
Vp and Vs 1D Model Outputs
Bulk modulus of elasticity in Petromod is either interpolated based compaction curve or linearly calculated from porosity.
The Petromod Vp-Porosity trend is very steep which explains high Vp and Vs outputs.
Future work may involve discretizing modeled rock physics trends into linear segments.
Vp
(km
/sec
)
Porosity
Vp= 6.247 – 9.023 ø
Partial Angle Stack Inversion
Model based inversion . Every angle stack is inverted separtely. Separate inversion of each zone of interest. Resulting elastic impedance (EI) volumes can be used
to classify lithofacies. EI volumes may be used to calibrate basin models
over an entire region.
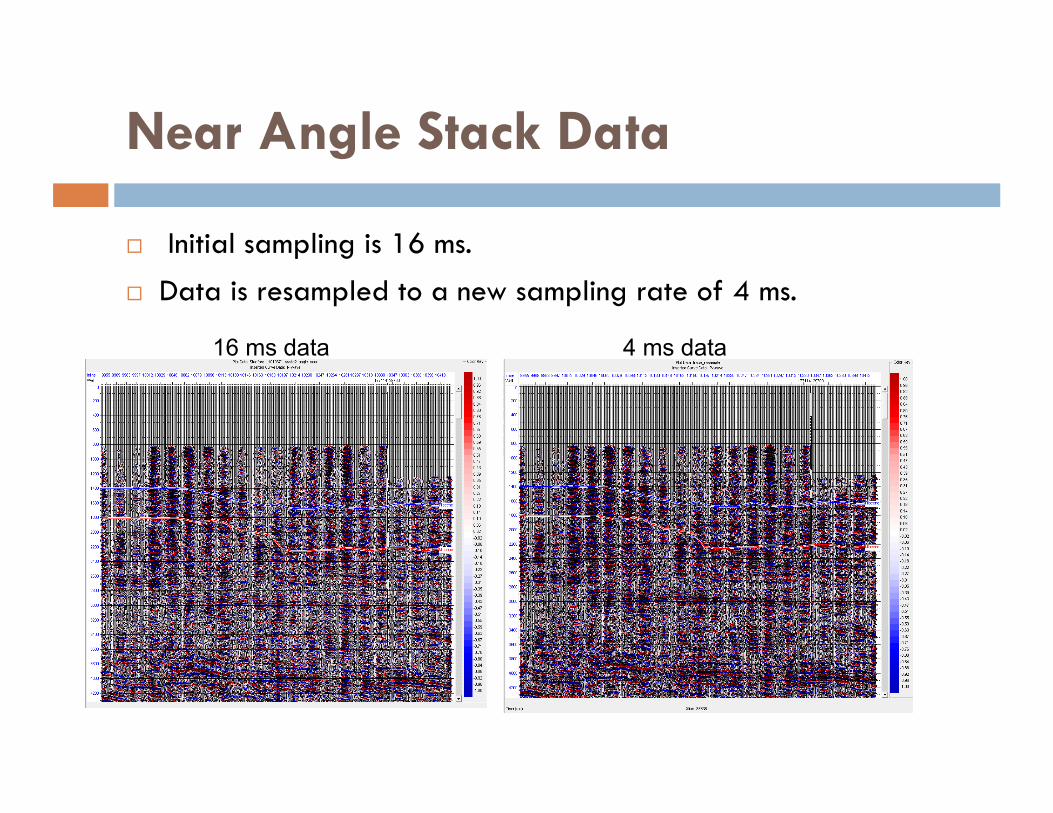
Near Angle Stack Data
Initial sampling is 16 ms.
Data is resampled to a new sampling rate of 4 ms.
16 ms data 4 ms data
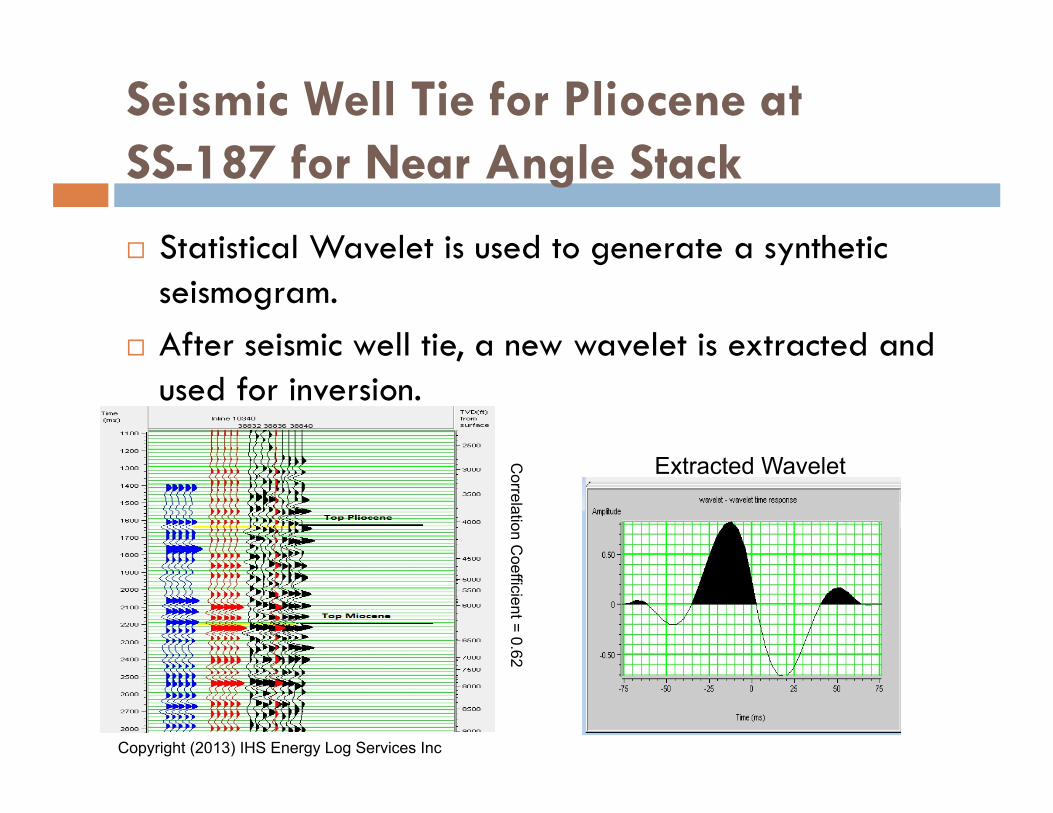
Seismic Well Tie for Pliocene at SS-187 for Near Angle Stack
Statistical Wavelet is used to generate a synthetic seismogram.
After seismic well tie, a new wavelet is extracted and used for inversion.
Correlation C
oefficient = 0.62
Extracted Wavelet
Copyright (2013) IHS Energy Log Services Inc
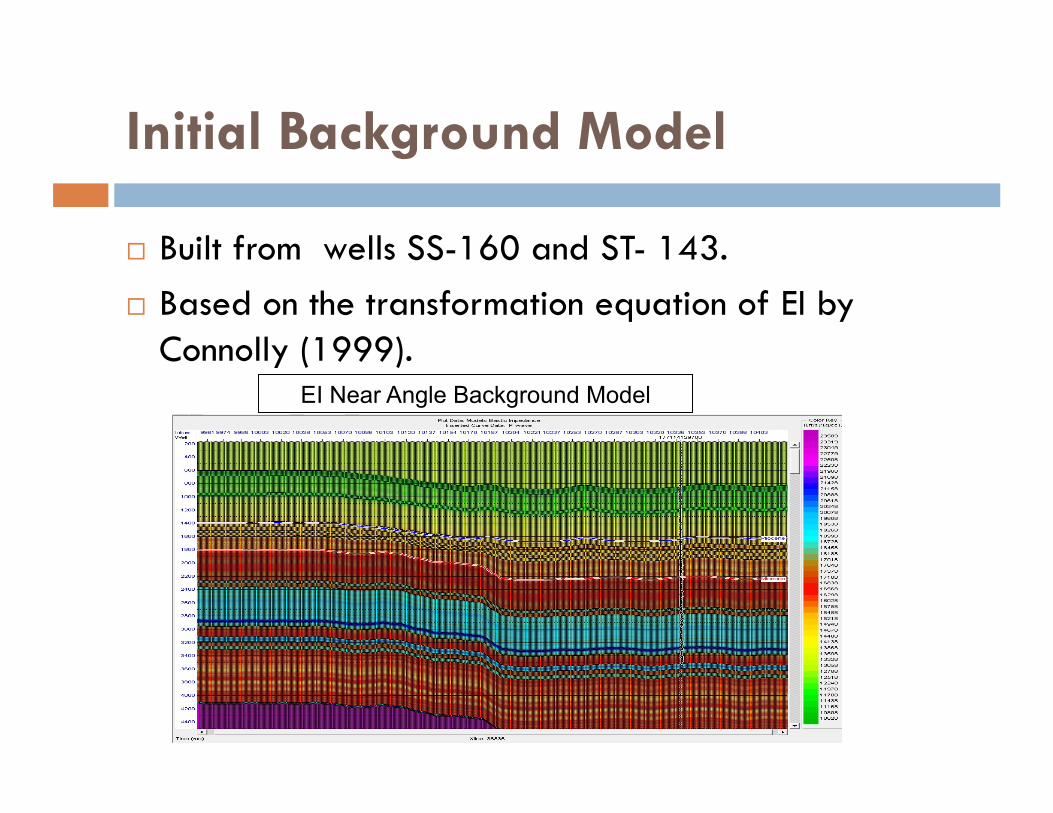
Initial Background Model
Built from wells SS-160 and ST- 143. Based on the transformation equation of EI by
Connolly (1999). EI Near Angle Background Model
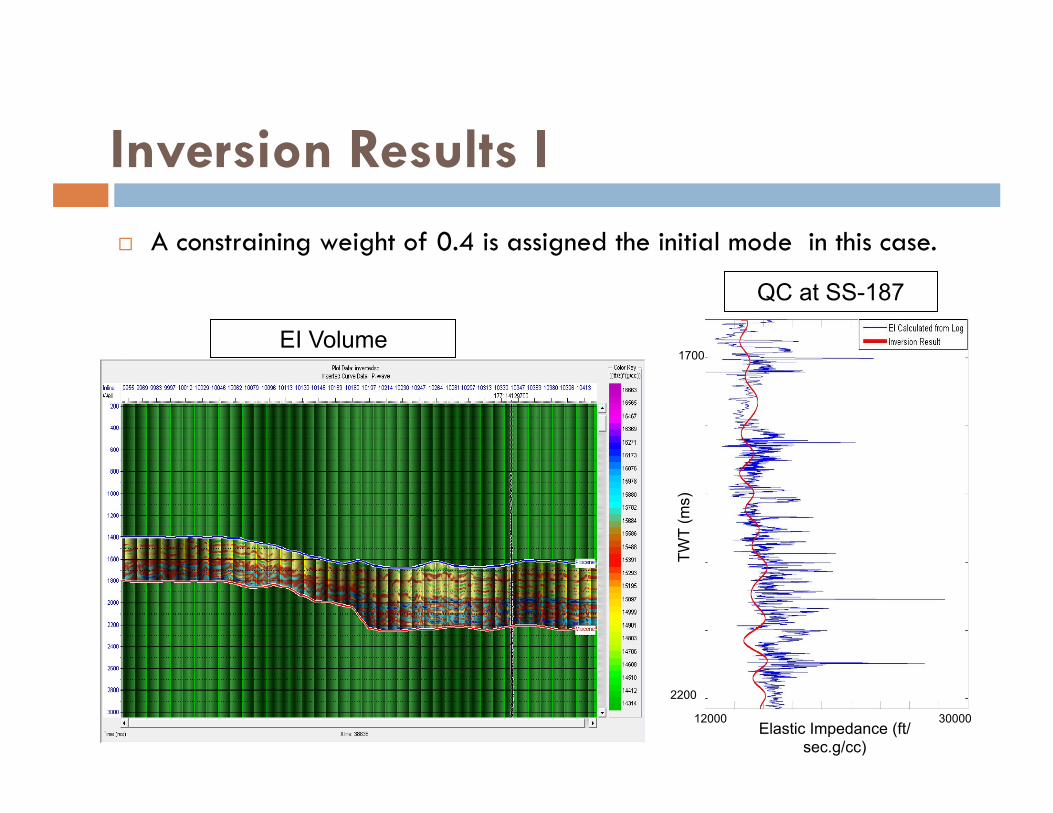
Inversion Results I A constraining weight of 0.4 is assigned the initial mode in this case.
1700
2200 TW
T (m
s)
12000 30000 Elastic Impedance (ft/
sec.g/cc)
EI Volume
QC at SS-187
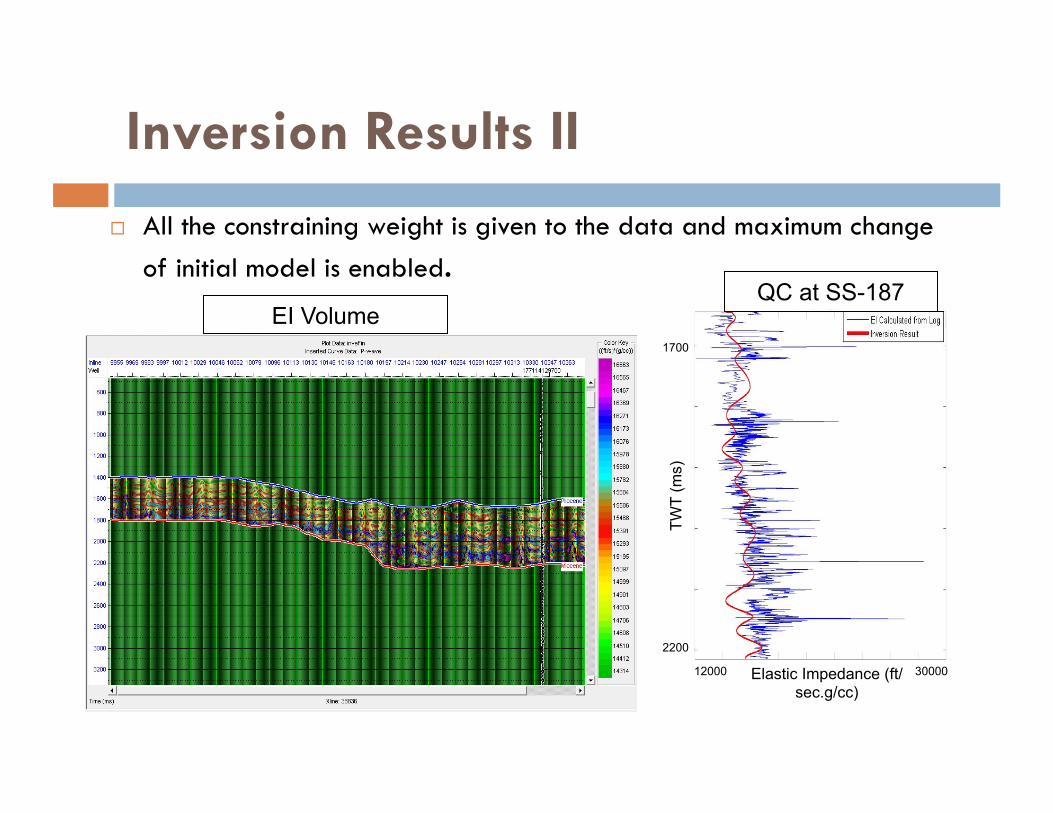
Inversion Results II
All the constraining weight is given to the data and maximum change of initial model is enabled.
1700
TWT
(ms)
2200
12000 30000 Elastic Impedance (ft/sec.g/cc)
EI Volume QC at SS-187
Inversion Results Quality
Inversion results are sensitive to the weight assigned to each input into the inversion algorithm.
A robust 3D basin model can provide an excellent background model for seismic inversion.
This can be useful in zones with poor seismic data quality such or in overpressured zones.
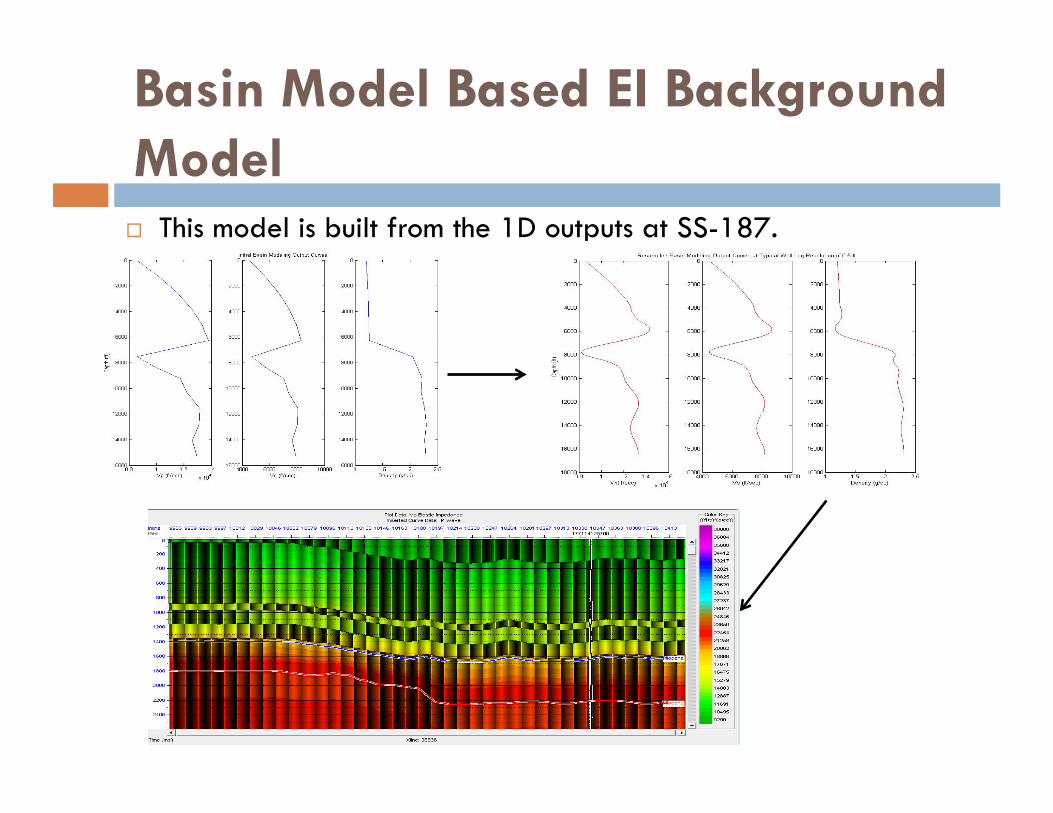
Basin Model Based EI Background Model This model is built from the 1D outputs at SS-187.
Conclusions
Rock physics modeling results along with the results from 1D basin modeling suggest that the nature of the sediments and hence the elastic signatures are changing around 8000 ft.
The 1D modeling results support the idea of mechanical compaction being the major factor behind that change.
Seismic attributes can be powerful tool in calibrating a basin model over an entire area.
Good rock physics models are essential in a basin model to calibrate it to seismic attributes.
Basin modeling outputs can be used to build background models for seismic inversion.
Wish List
Possibility to customize a rock physics model in Petromod.
Drop down menu with some well-known rock physics models in Petromod.
Well picks/ other age control data in the study area.
Thin sections/ XRD data to verify the mechanical compaction impact.
References
Avseth, P.,Mukerji, T.&Mavko, G. 2005. Quantitative Seismic Interpretation. Applying Rock Physics to Reduce Interpretation Risk.. Cambridge, New York, Melbourne: Cambridge University Press,359 p.
Connolly, P., 1999, Elastic Impedance, The LeadingEdge, April Issue, 438-452.
Gold, P.B., 1984, Diagenesis of Middle and Upper Miocene sandstones, Louisiana Gulf Coast: Master's Thesis, University of Texas, Austin, Texas, 160 p.
Mavko, G., T. Mukerji, and J. Dvorkin, 2009, The rock physics handbook : tools for seismic analysis of porous media, 2nd edition: Cambridge University Press, New York, 511 p.
Milliken, K. L., 1984, Petrology and burial diagenesis of Plio-Pleistocene sediments, northern Gulf of Mexico: Ph. D. dissertation, University of Texas at Austin, 130 p.
Acknowledgments
Special thanks to my advisors Tapan Mukerji and Stephan Graham. Thanks to Allegra Hosford-Scheirer, Ken Peters and Les Magoon. Thanks to Kristian Meisling for his support. Thanks to WesternGeCo/Schlumberger for providing the seismic
data set. Thanks to IHS for providing the well log data. Thanks to CGG for providing the license of HRS. Great thanks to David Greeley from BP for his great support. Thanks to John Snedden from UT Austin for useful discussion and
references. Thanks to Yunyue (Elita) Li for the helpful discussion about the
velocity models in the data.

Basin and Petroleum System Modeling Industrial Affiliates Program
Thank You