wireshark - basics
TRANSCRIPT
Network Troubleshooting Using Wireshark May 2014
Network Troubleshooting
Using Wireshark
Customer Forum
April 2015
Network Troubleshooting Using Wireshark May 2014
© All Rights Reserved to NDI Communications ©

Network Troubleshooting Using Wireshark May 2014
The OSI reference model was published in 1984 by ISO –
International Standard Organization, as a general model for data
communication. The standard was numbered ISO 35.100.01 and
35.100.05 as the basic standards, and 35.100.10/20/30/40/50/60/70
as standards for layers 1 to layer 7.
The OSI model was supposed to be the complete theoretical and
practical model for data communication.
Due to the raise of other practical models and technologies, the OSI-
RM model today is more a theoretical model, while the TCP/IP model
and protocols become the most popular one.
There are many architectures and protocols which are defined in them
- OSI, TCP/IP, DecNET, SNA, IPX/SPX, Bynan, AppleTalk etc.
Even though in all the above, the architectures are slightly different,
there are 4-7 layers, various protocols etc., the basic principles of

Network Troubleshooting Using Wireshark May 2014
communication are the same in all the architectures and protocols.
Network Troubleshooting Using Wireshark May 2014
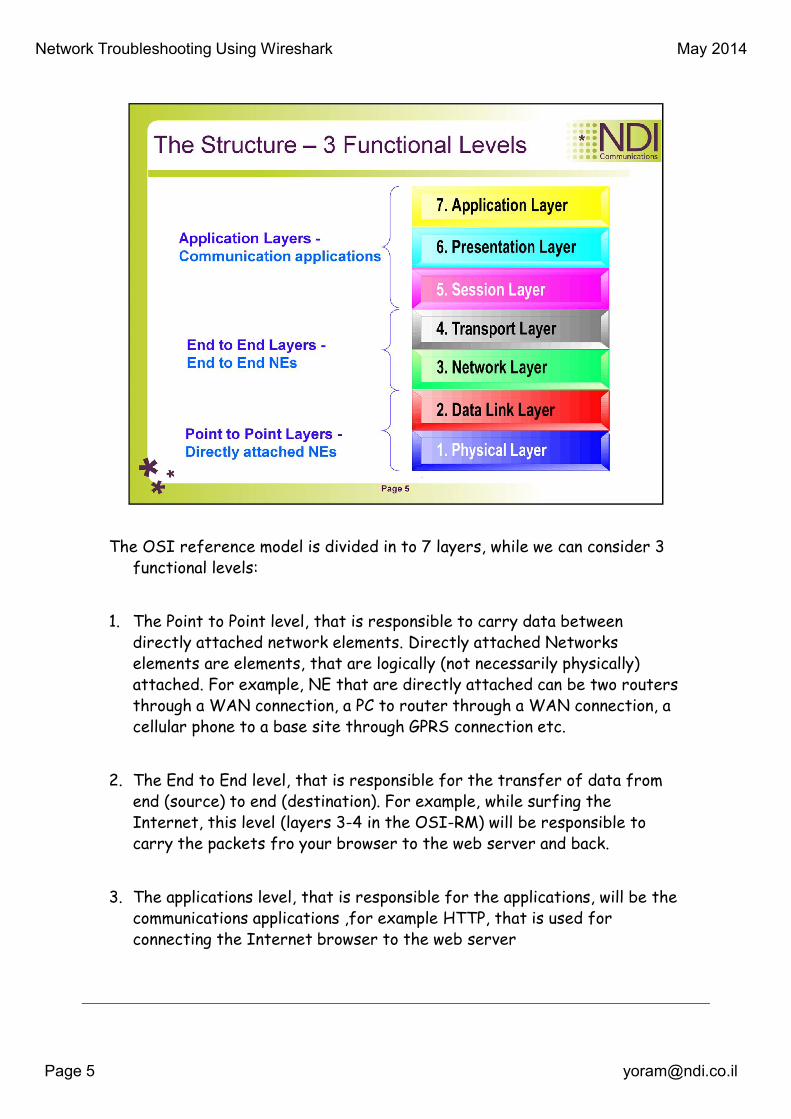
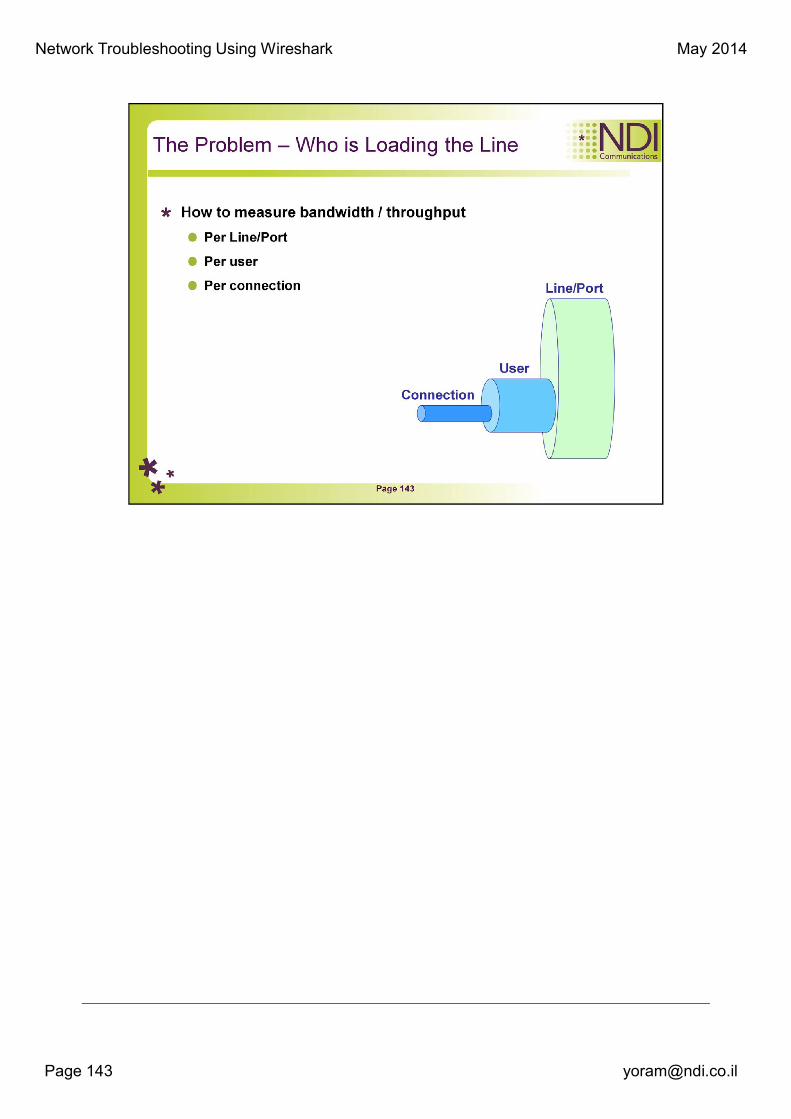
The OSI reference model is divided in to 7 layers, while we can consider 3
functional levels:
1. The Point to Point level, that is responsible to carry data between
directly attached network elements. Directly attached Networks
elements are elements, that are logically (not necessarily physically)
attached. For example, NE that are directly attached can be two routers
through a WAN connection, a PC to router through a WAN connection, a
cellular phone to a base site through GPRS connection etc.
2. The End to End level, that is responsible for the transfer of data from
end (source) to end (destination). For example, while surfing the
Internet, this level (layers 3-4 in the OSI-RM) will be responsible to
carry the packets fro your browser to the web server and back.
3. The applications level, that is responsible for the applications, will be the
communications applications ,for example HTTP, that is used for
connecting the Internet browser to the web server
Network Troubleshooting Using Wireshark May 2014
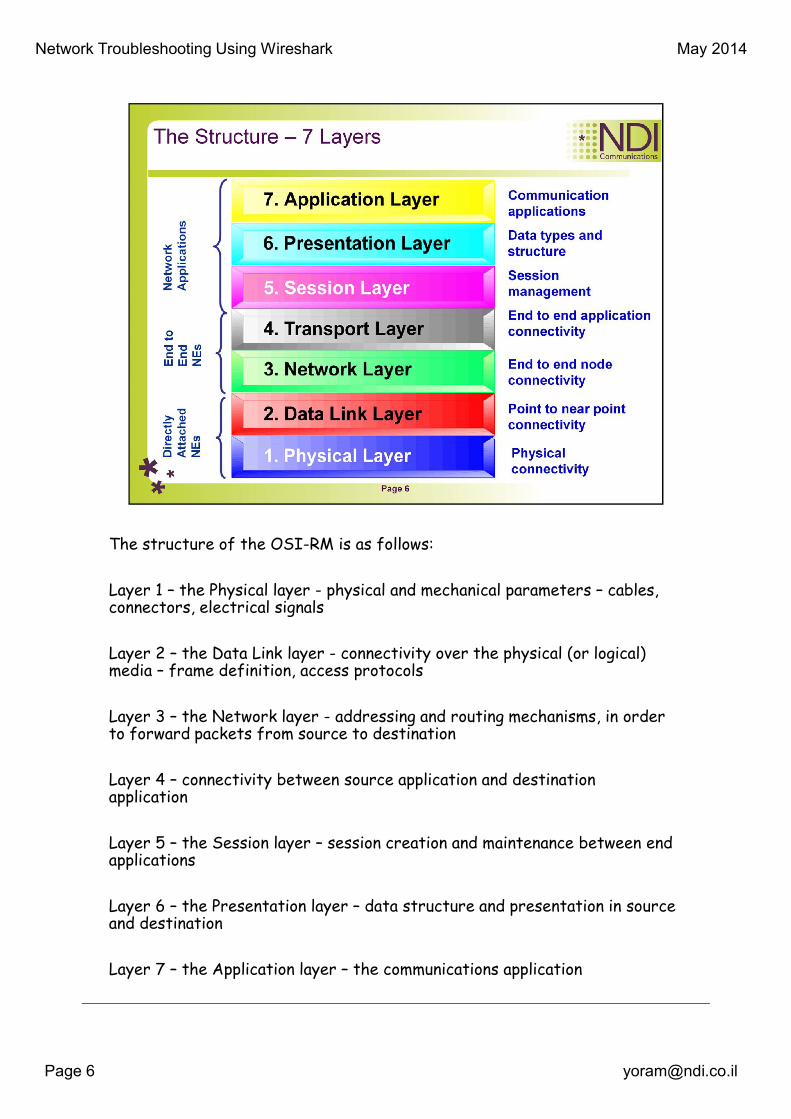
The structure of the OSI-RM is as follows:
Layer 1 – the Physical layer - physical and mechanical parameters – cables, connectors, electrical signals
Layer 2 – the Data Link layer - connectivity over the physical (or logical) media – frame definition, access protocols
Layer 3 – the Network layer - addressing and routing mechanisms, in order to forward packets from source to destination
Layer 4 – connectivity between source application and destination application
Layer 5 – the Session layer – session creation and maintenance between end applications
Layer 6 – the Presentation layer – data structure and presentation in source and destination
Layer 7 – the Application layer – the communications application
Network Troubleshooting Using Wireshark May 2014
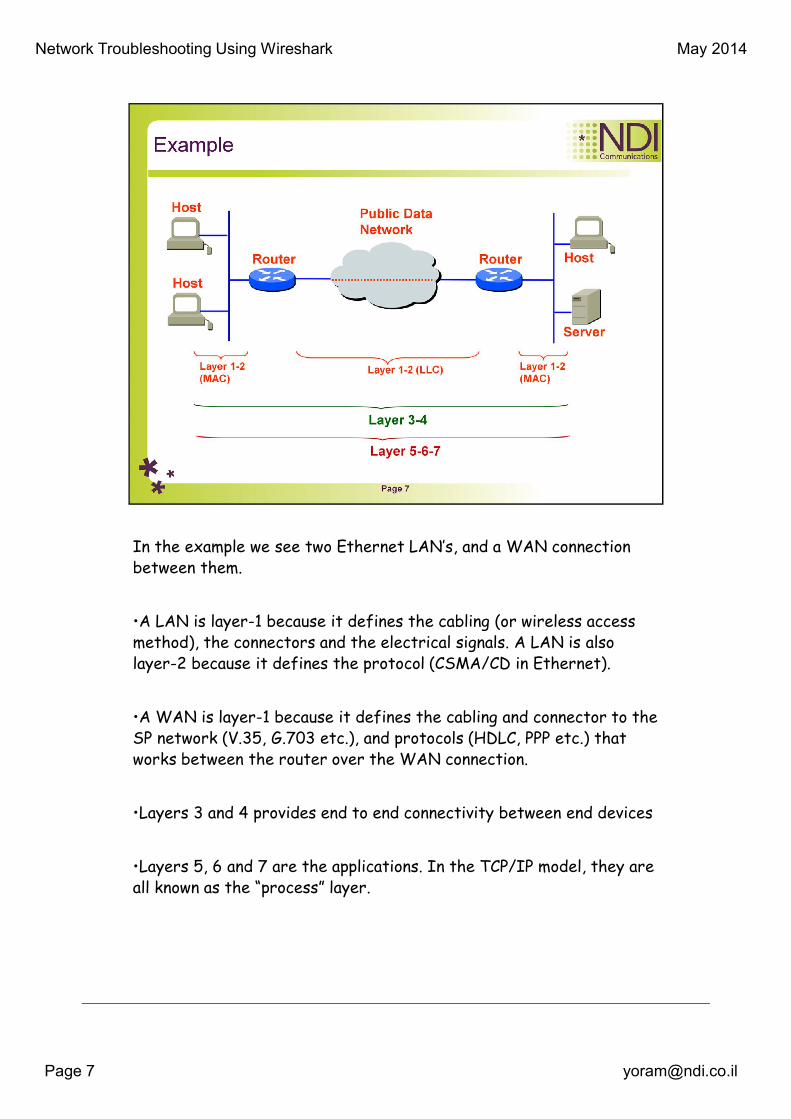
In the example we see two Ethernet LAN’s, and a WAN connection
between them.
•A LAN is layer-1 because it defines the cabling (or wireless access
method), the connectors and the electrical signals. A LAN is also
layer-2 because it defines the protocol (CSMA/CD in Ethernet).
•A WAN is layer-1 because it defines the cabling and connector to the
SP network (V.35, G.703 etc.), and protocols (HDLC, PPP etc.) that
works between the router over the WAN connection.
•Layers 3 and 4 provides end to end connectivity between end devices
•Layers 5, 6 and 7 are the applications. In the TCP/IP model, they are
all known as the “process” layer.
Network Troubleshooting Using Wireshark May 2014
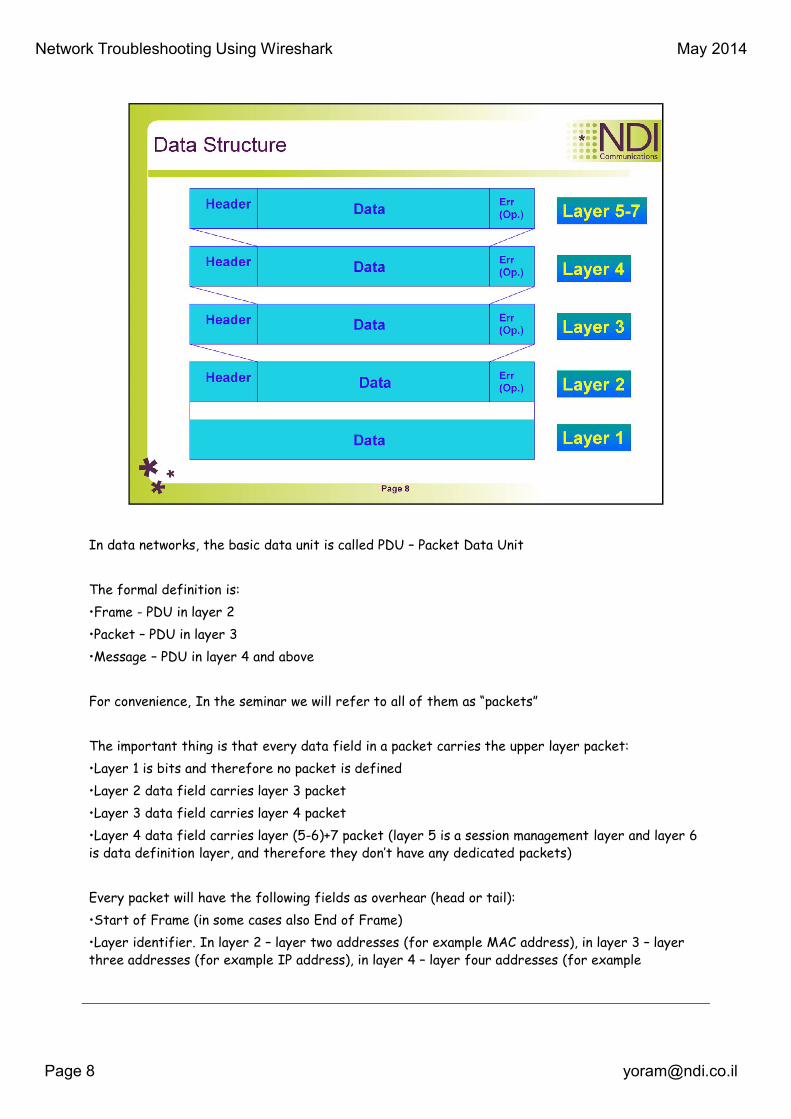
In data networks, the basic data unit is called PDU – Packet Data Unit
The formal definition is:
•Frame - PDU in layer 2
•Packet – PDU in layer 3
•Message – PDU in layer 4 and above
For convenience, In the seminar we will refer to all of them as “packets”
The important thing is that every data field in a packet carries the upper layer packet:
•Layer 1 is bits and therefore no packet is defined
•Layer 2 data field carries layer 3 packet
•Layer 3 data field carries layer 4 packet
•Layer 4 data field carries layer (5-6)+7 packet (layer 5 is a session management layer and layer 6
is data definition layer, and therefore they don’t have any dedicated packets)
Every packet will have the following fields as overhear (head or tail):
•Start of Frame (in some cases also End of Frame)
•Layer identifier. In layer 2 – layer two addresses (for example MAC address), in layer 3 – layer
three addresses (for example IP address), in layer 4 – layer four addresses (for example

Network Troubleshooting Using Wireshark May 2014
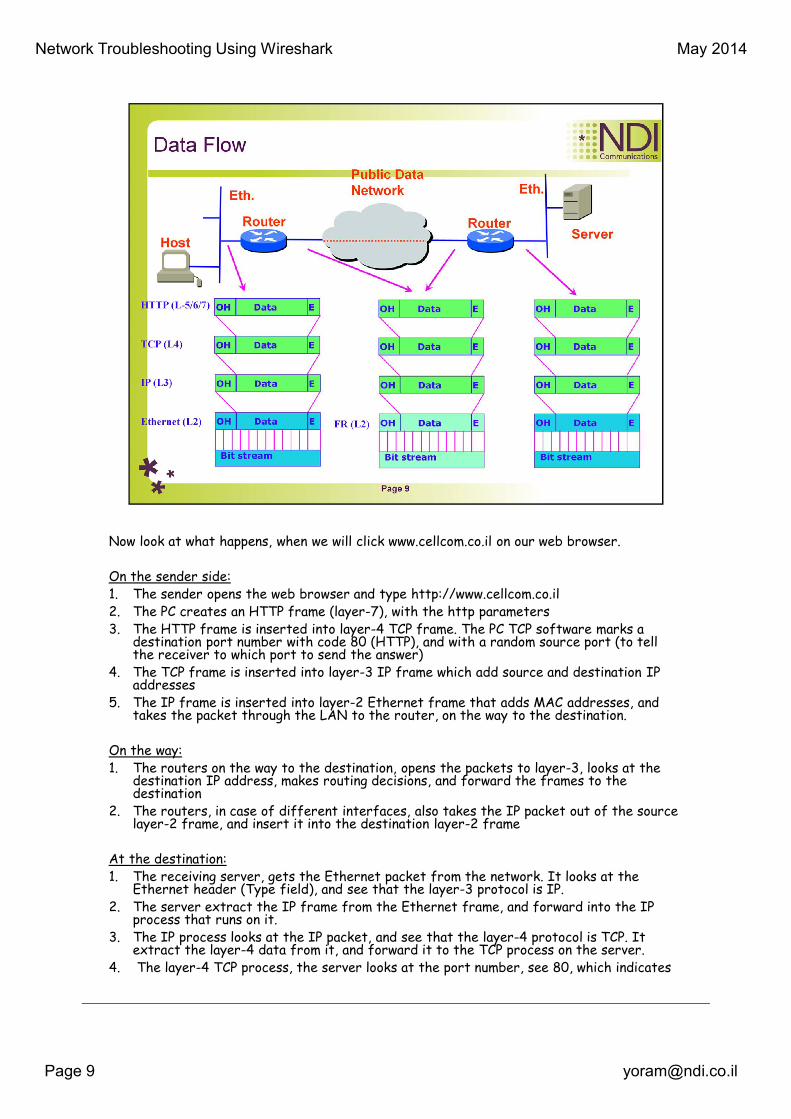
Now look at what happens, when we will click www.cellcom.co.il on our web browser.
On the sender side:
1. The sender opens the web browser and type http://www.cellcom.co.il
2. The PC creates an HTTP frame (layer-7), with the http parameters
3. The HTTP frame is inserted into layer-4 TCP frame. The PC TCP software marks a destination port number with code 80 (HTTP), and with a random source port (to tell the receiver to which port to send the answer)
4. The TCP frame is inserted into layer-3 IP frame which add source and destination IP addresses
5. The IP frame is inserted into layer-2 Ethernet frame that adds MAC addresses, and takes the packet through the LAN to the router, on the way to the destination.
On the way:
1. The routers on the way to the destination, opens the packets to layer-3, looks at the destination IP address, makes routing decisions, and forward the frames to the destination
2. The routers, in case of different interfaces, also takes the IP packet out of the source layer-2 frame, and insert it into the destination layer-2 frame
At the destination:
1. The receiving server, gets the Ethernet packet from the network. It looks at the Ethernet header (Type field), and see that the layer-3 protocol is IP.
2. The server extract the IP frame from the Ethernet frame, and forward into the IP process that runs on it.
3. The IP process looks at the IP packet, and see that the layer-4 protocol is TCP. It extract the layer-4 data from it, and forward it to the TCP process on the server.
4. The layer-4 TCP process, the server looks at the port number, see 80, which indicates

Network Troubleshooting Using Wireshark May 2014
“HTTP”, and forward it to the HTTP server
Network Troubleshooting Using Wireshark May 2014
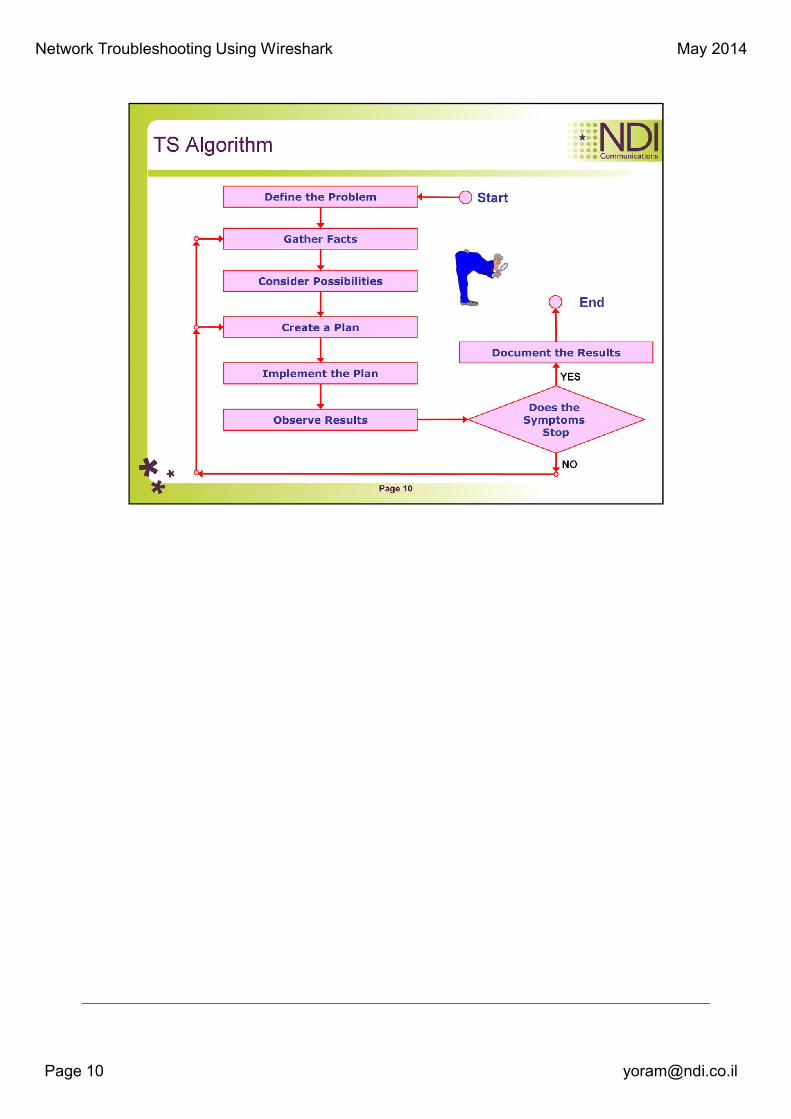
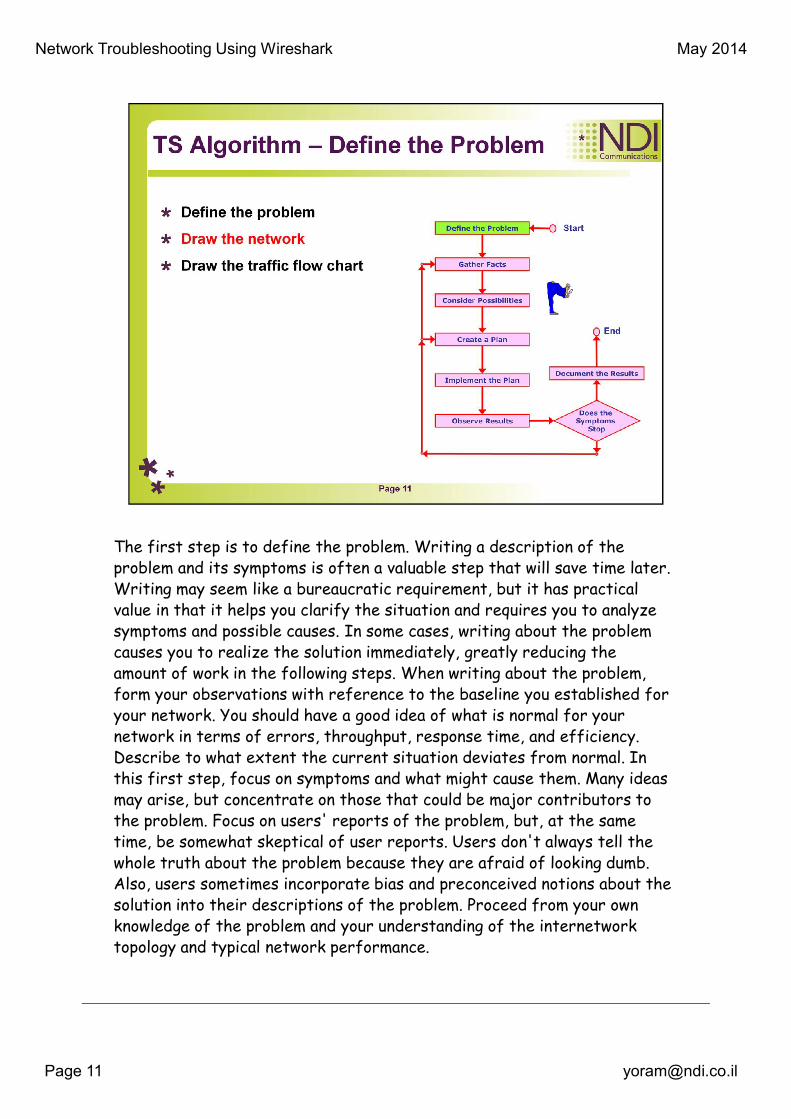
The first step is to define the problem. Writing a description of the
problem and its symptoms is often a valuable step that will save time later.
Writing may seem like a bureaucratic requirement, but it has practical
value in that it helps you clarify the situation and requires you to analyze
symptoms and possible causes. In some cases, writing about the problem
causes you to realize the solution immediately, greatly reducing the
amount of work in the following steps. When writing about the problem,
form your observations with reference to the baseline you established for
your network. You should have a good idea of what is normal for your
network in terms of errors, throughput, response time, and efficiency.
Describe to what extent the current situation deviates from normal. In
this first step, focus on symptoms and what might cause them. Many ideas
may arise, but concentrate on those that could be major contributors to
the problem. Focus on users' reports of the problem, but, at the same
time, be somewhat skeptical of user reports. Users don't always tell the
whole truth about the problem because they are afraid of looking dumb.
Also, users sometimes incorporate bias and preconceived notions about the
solution into their descriptions of the problem. Proceed from your own
knowledge of the problem and your understanding of the internetwork
topology and typical network performance.

Network Troubleshooting Using Wireshark May 2014
Gather additional facts from affected users, network administrators,
managers, and any key people involved with the network. Collect data
from network management systems, protocol analyzers, route and
switch diagnostic commands, software release notes, software bug
reports, and documentation about changes made to the network.
Check records that you kept (hopefully!) on the configuration of
hosts, servers, switches, routers, and any other configurable network
devices. Compare current configurations with saved configurations to
see if anything has changed. Determine answers to the following
questions:
•l How often does the problem happen?
•l When did the problem first occur?
•l What changes were made right before the problem started
happening?
•l Is the problem reproducible?
Network Troubleshooting Using Wireshark May 2014
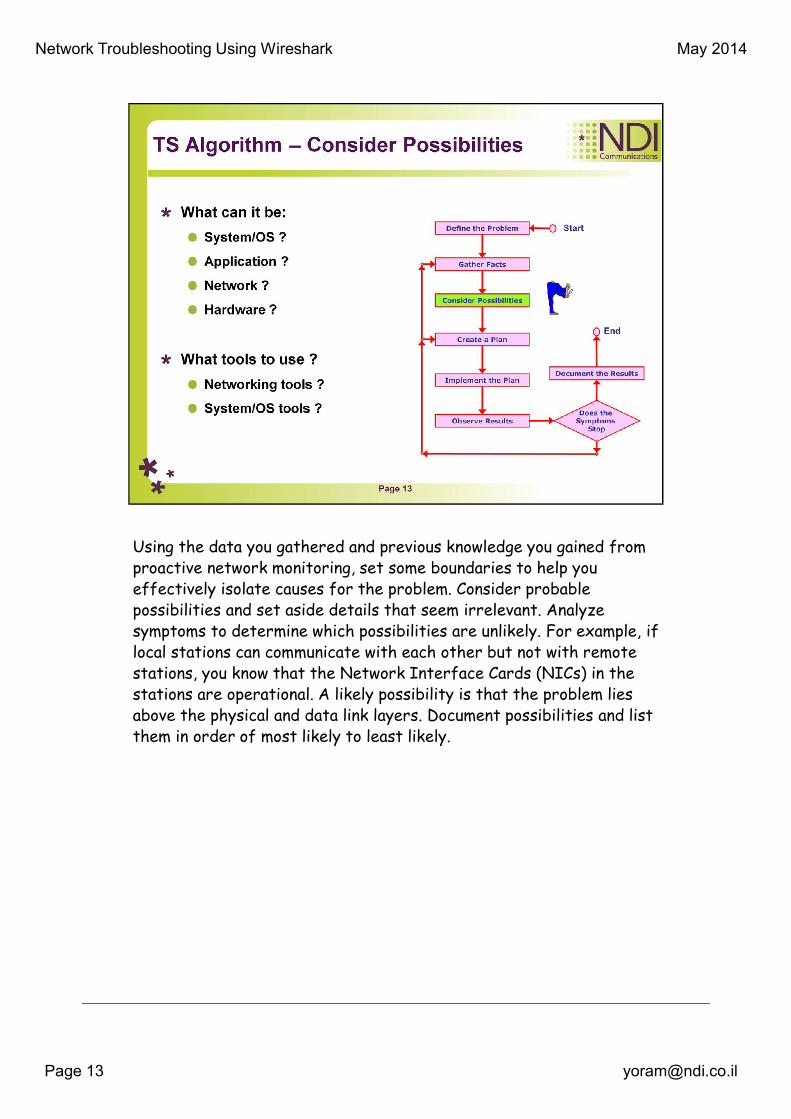
Using the data you gathered and previous knowledge you gained from
proactive network monitoring, set some boundaries to help you
effectively isolate causes for the problem. Consider probable
possibilities and set aside details that seem irrelevant. Analyze
symptoms to determine which possibilities are unlikely. For example, if
local stations can communicate with each other but not with remote
stations, you know that the Network Interface Cards (NICs) in the
stations are operational. A likely possibility is that the problem lies
above the physical and data link layers. Document possibilities and list
them in order of most likely to least likely.

Network Troubleshooting Using Wireshark May 2014
Develop a plan for how you will test the most likely causes of the
problem. Plan to change just one variable at a time; otherwise you
won't know which change resulted in the fix. It often helps to use a
divide-and-conquer approach whereby you partition your
troubleshooting domain into discrete areas that are logically or
physically isolated from each other. This approach will help you
pinpoint the cause's) of the problem. A testing-outward approach also
helps in many cases. For example, from a source station, plan to test
local communications first. Then create a plan to test reachability to
each network along a path to a remote network until the problem
occurs. Document your action plans. Each plan should describe a set of
steps to be executed. In addition, it is important to have a backout
plan in case your actions make matters worse. For example, in your
action plan, include an initial step of saving existing configurations. If
problems occur, you can go back to a known state with the saved
configurations.
Network Troubleshooting Using Wireshark May 2014
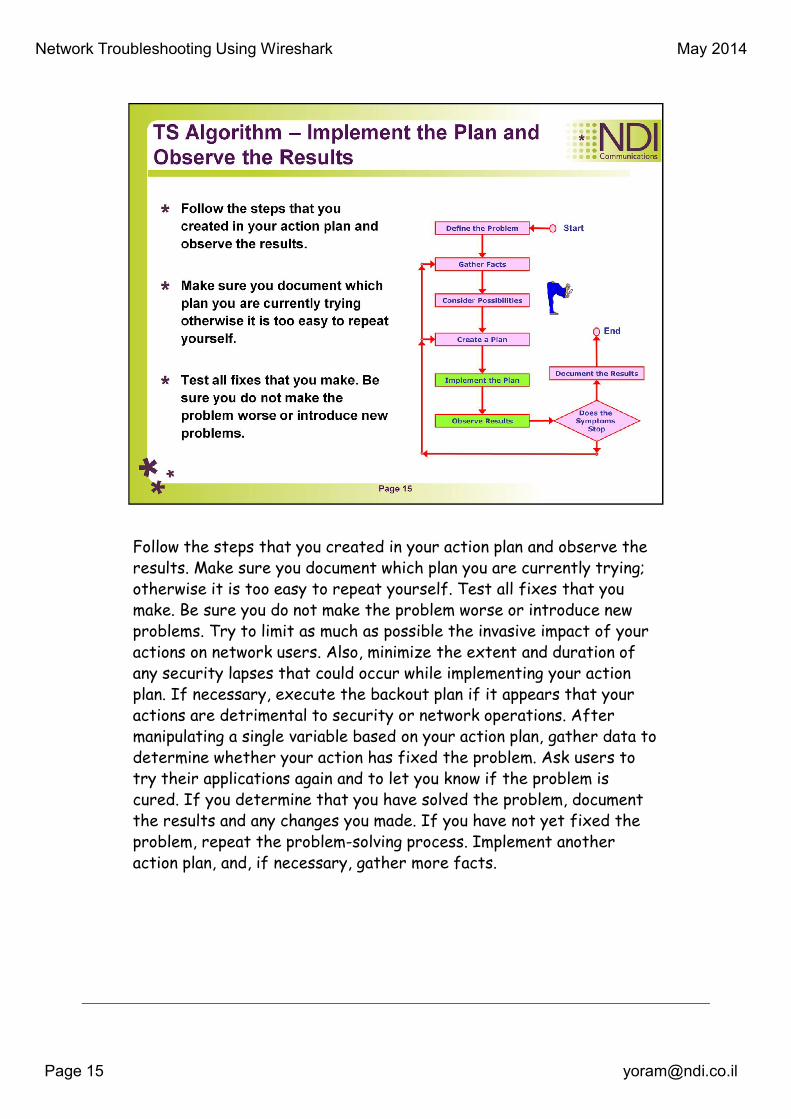
Follow the steps that you created in your action plan and observe the
results. Make sure you document which plan you are currently trying;
otherwise it is too easy to repeat yourself. Test all fixes that you
make. Be sure you do not make the problem worse or introduce new
problems. Try to limit as much as possible the invasive impact of your
actions on network users. Also, minimize the extent and duration of
any security lapses that could occur while implementing your action
plan. If necessary, execute the backout plan if it appears that your
actions are detrimental to security or network operations. After
manipulating a single variable based on your action plan, gather data to
determine whether your action has fixed the problem. Ask users to
try their applications again and to let you know if the problem is
cured. If you determine that you have solved the problem, document
the results and any changes you made. If you have not yet fixed the
problem, repeat the problem-solving process. Implement another
action plan, and, if necessary, gather more facts.

Network Troubleshooting Using Wireshark May 2014
When you have resolved the problem, you have one more
important step remaining documenting the results. You may
have tried many action plans. Be sure to complete the job by
recording which plan worked and why (if you know why).
Documenting the resolution will help you in the future when
a similar problem occurs. Also, if you determine later that
your fix unexpectedly caused another problem, you will have
a paper trail of what has changed. In addition to
documenting the resolution, be sure to save any
configuration changes you made. If necessary, update your
network map's).


Network Troubleshooting Using Wireshark May 2014
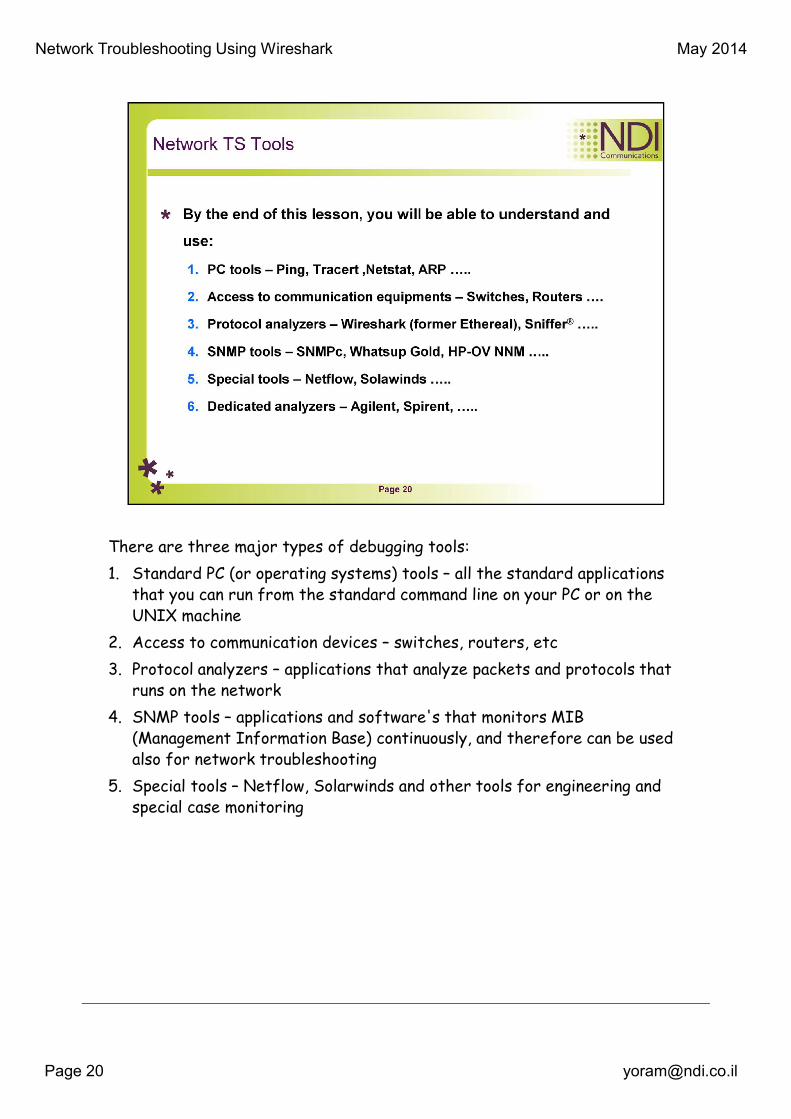
There are three major types of debugging tools:
1. Standard PC (or operating systems) tools – all the standard applications
that you can run from the standard command line on your PC or on the
UNIX machine
2. Access to communication devices – switches, routers, etc
3. Protocol analyzers – applications that analyze packets and protocols that
runs on the network
4. SNMP tools – applications and software's that monitors MIB
(Management Information Base) continuously, and therefore can be used
also for network troubleshooting
5. Special tools – Netflow, Solarwinds and other tools for engineering and
special case monitoring
Network Troubleshooting Using Wireshark May 2014
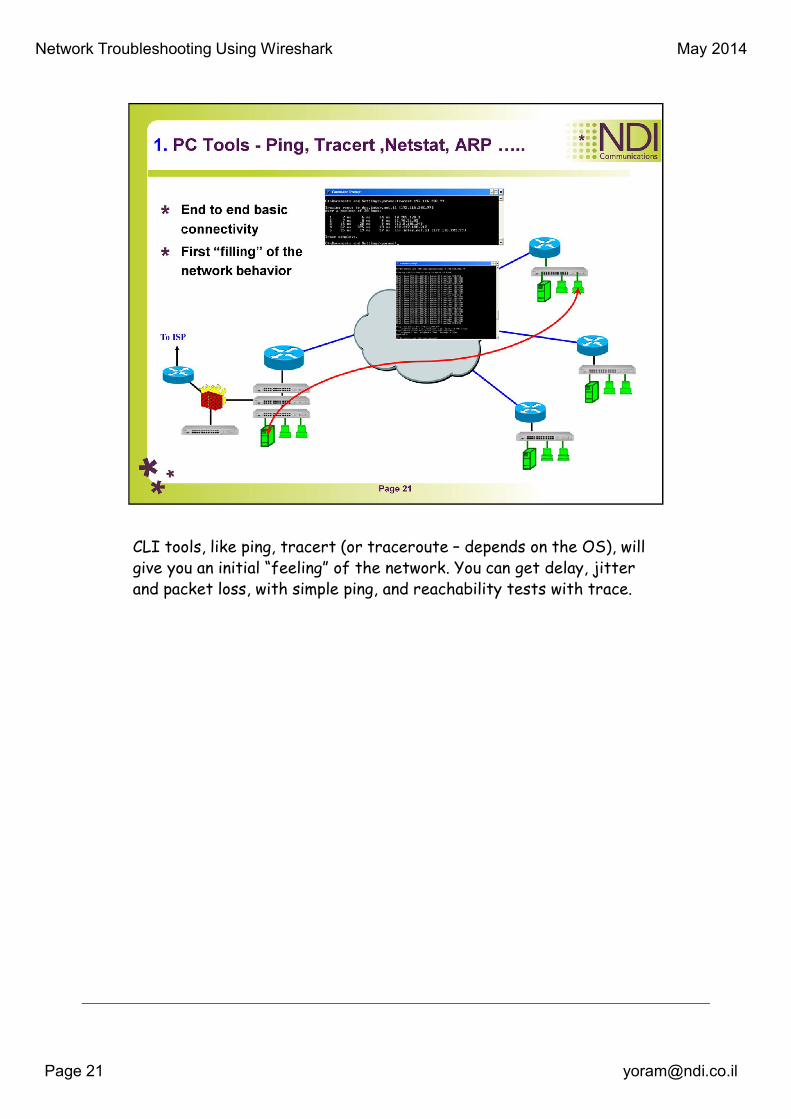
CLI tools, like ping, tracert (or traceroute – depends on the OS), will
give you an initial “feeling” of the network. You can get delay, jitter
and packet loss, with simple ping, and reachability tests with trace.
Network Troubleshooting Using Wireshark May 2014
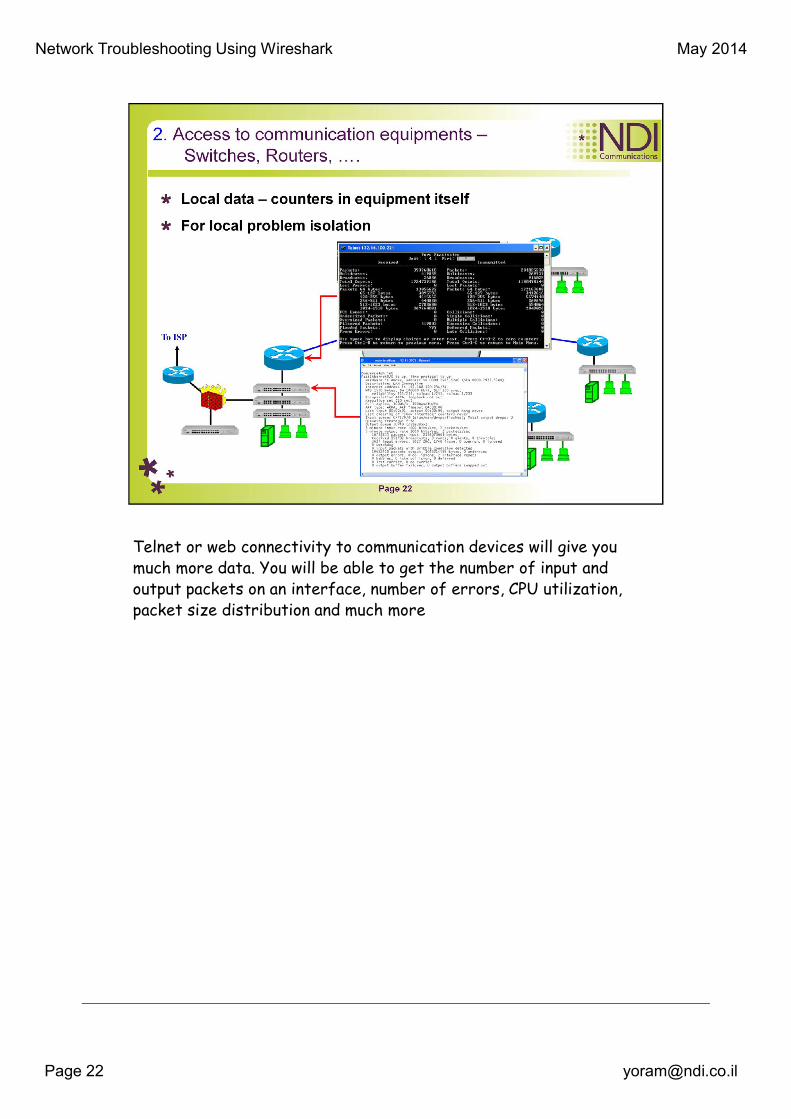
Telnet or web connectivity to communication devices will give you
much more data. You will be able to get the number of input and
output packets on an interface, number of errors, CPU utilization,
packet size distribution and much more
Network Troubleshooting Using Wireshark May 2014
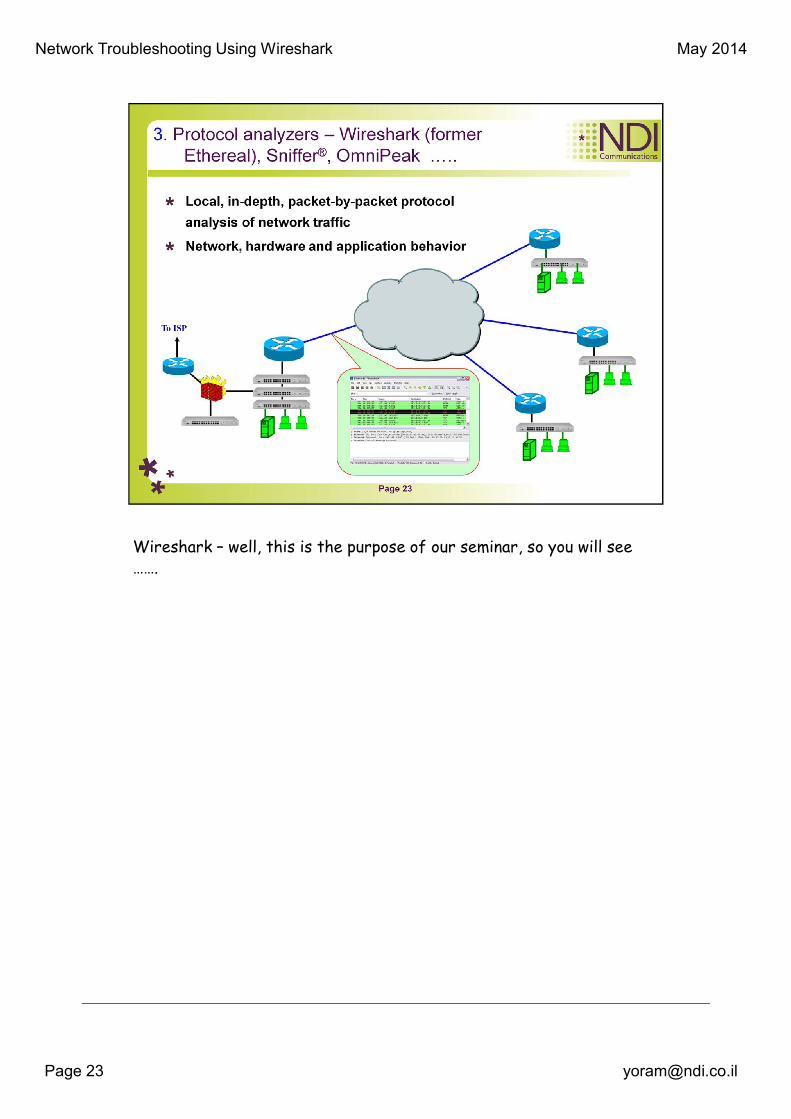
Wireshark – well, this is the purpose of our seminar, so you will see
…….
Network Troubleshooting Using Wireshark May 2014
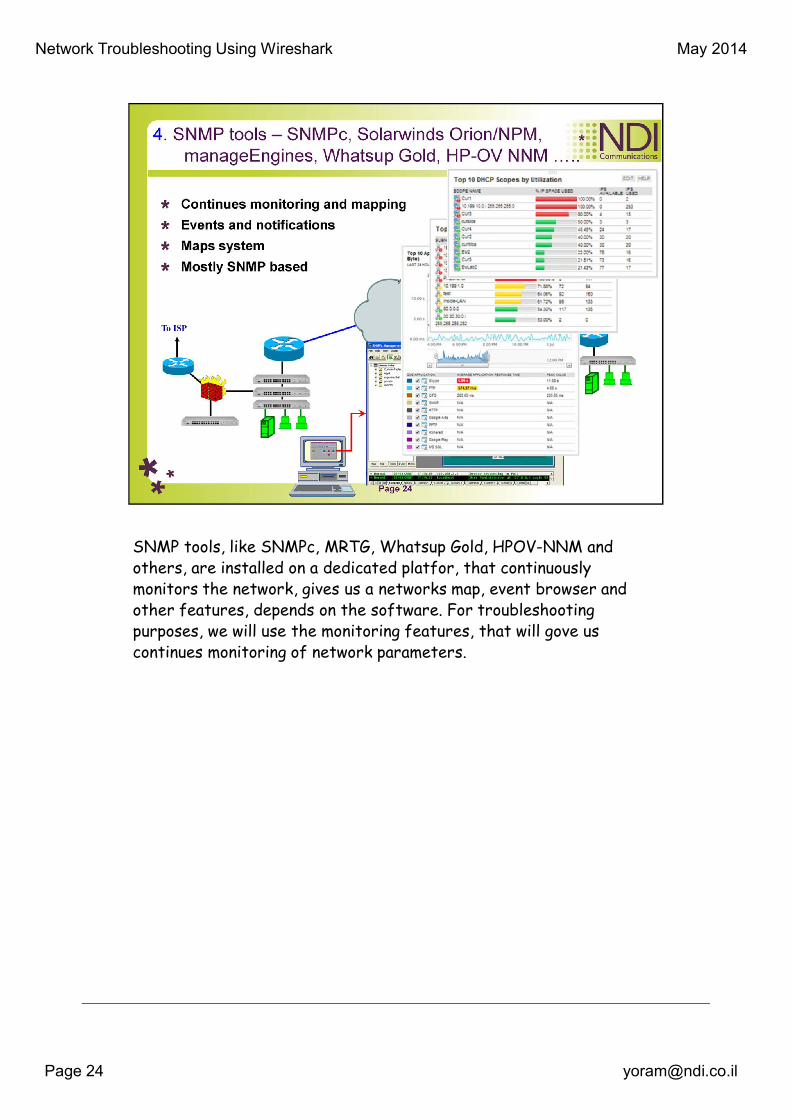
SNMP tools, like SNMPc, MRTG, Whatsup Gold, HPOV-NNM and
others, are installed on a dedicated platfor, that continuously
monitors the network, gives us a networks map, event browser and
other features, depends on the software. For troubleshooting
purposes, we will use the monitoring features, that will gove us
continues monitoring of network parameters.
Network Troubleshooting Using Wireshark May 2014
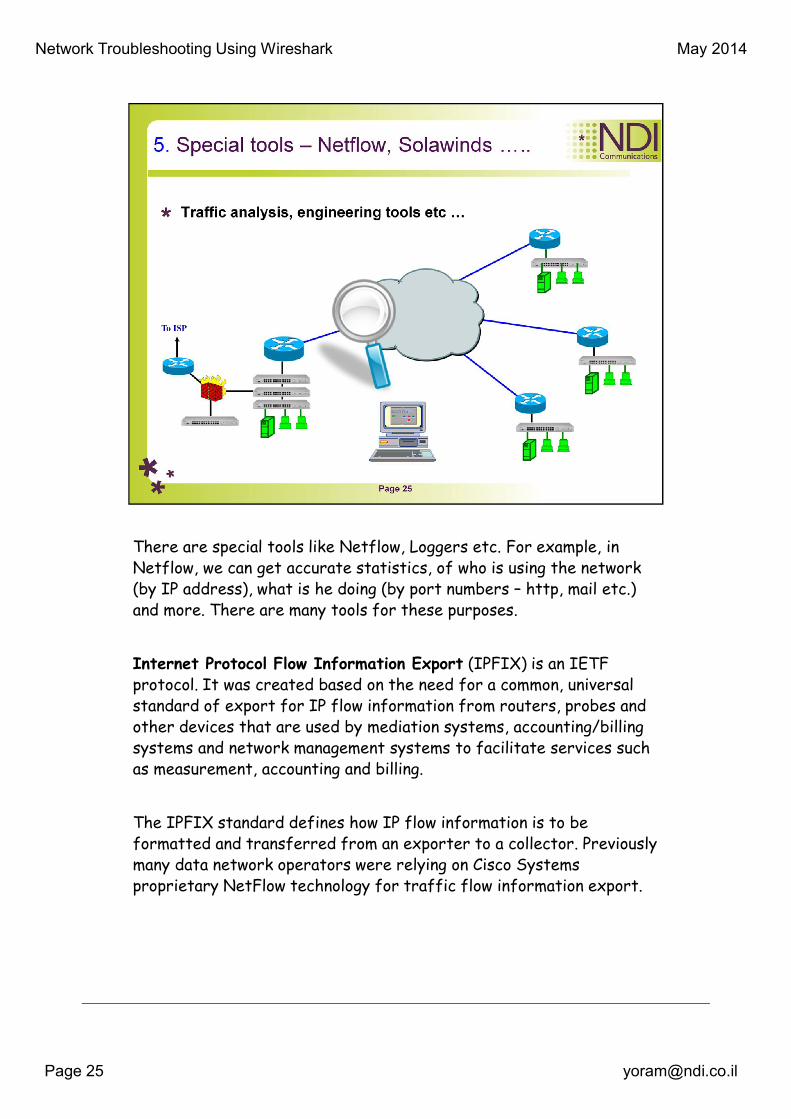
There are special tools like Netflow, Loggers etc. For example, in
Netflow, we can get accurate statistics, of who is using the network
(by IP address), what is he doing (by port numbers – http, mail etc.)
and more. There are many tools for these purposes.
Internet Protocol Flow Information Export (IPFIX) is an IETF
protocol. It was created based on the need for a common, universal
standard of export for IP flow information from routers, probes and
other devices that are used by mediation systems, accounting/billing
systems and network management systems to facilitate services such
as measurement, accounting and billing.
The IPFIX standard defines how IP flow information is to be
formatted and transferred from an exporter to a collector. Previously
many data network operators were relying on Cisco Systems
proprietary NetFlow technology for traffic flow information export.

Network Troubleshooting Using Wireshark May 2014
IF you need more then this, for example simulating network
conditions, you can use software tools (for example Shunra), od
hardware devices that will simulate error patterns, load, application
loads and more.


Network Troubleshooting Using Wireshark May 2014
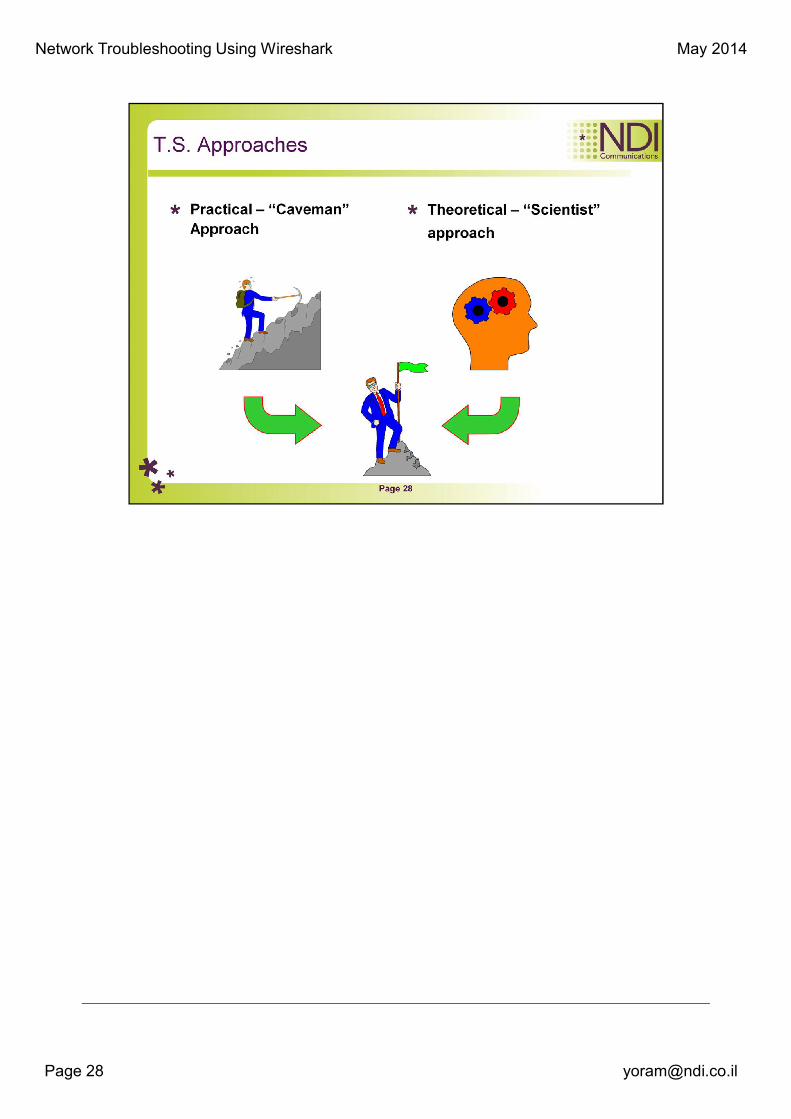
The “Scientist” approach will be to analyze and re-analyze the situation until the exact cause of the problem has been identified, rather than simply pinpointing the root of the problem and correcting it.
This approach will finally lead for solving the problem, but although this process is fairly reliable, most of the companies cannot afford to have their networks down for hours (or days!) for a proper, scientific, analysis.

Network Troubleshooting Using Wireshark May 2014
The “Caveman” first instinct is start swapping cards, cables, hub's,
and everything available, until miraculously, the network begins to
work, even though not always properly.
The problem with the “caveman” approach is that most of the times
the root cause of the problem will still be present.
Another thing that this approach lead to is a complete chaos in the
network, due to large number of parts being replaced with time.
Network Troubleshooting Using Wireshark May 2014
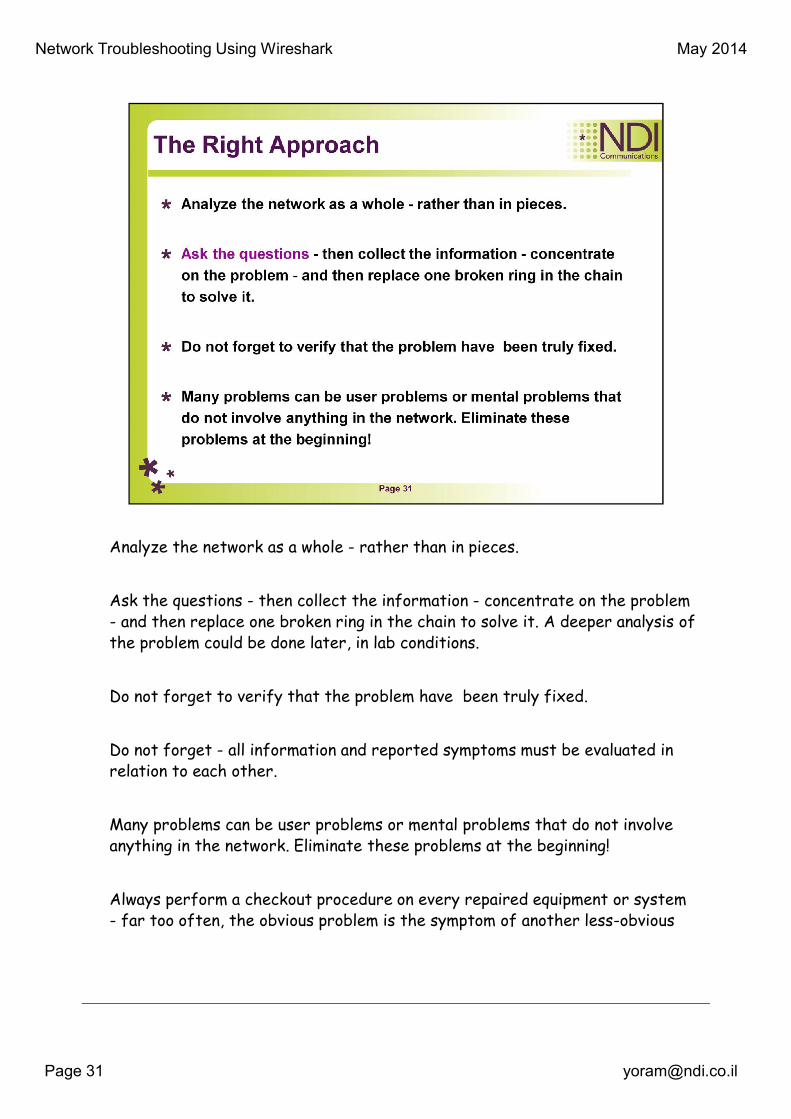
Analyze the network as a whole - rather than in pieces.
Ask the questions - then collect the information - concentrate on the problem
- and then replace one broken ring in the chain to solve it. A deeper analysis of
the problem could be done later, in lab conditions.
Do not forget to verify that the problem have been truly fixed.
Do not forget - all information and reported symptoms must be evaluated in
relation to each other.
Many problems can be user problems or mental problems that do not involve
anything in the network. Eliminate these problems at the beginning!
Always perform a checkout procedure on every repaired equipment or system
- far too often, the obvious problem is the symptom of another less-obvious

Network Troubleshooting Using Wireshark May 2014
problem, and until the source is eliminated, the situation will continue.

Network Troubleshooting Using Wireshark May 2014
© All Rights Reserved to NDI Communications ©


Network Troubleshooting Using Wireshark May 2014
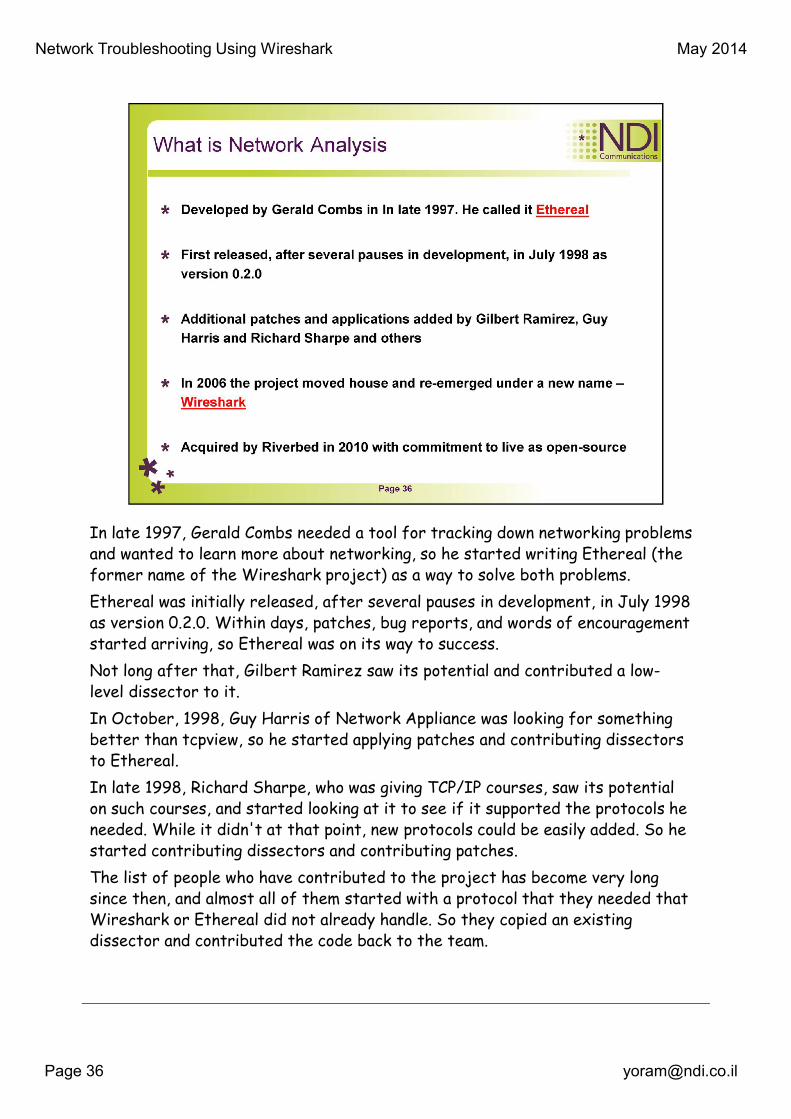
In late 1997, Gerald Combs needed a tool for tracking down networking problems
and wanted to learn more about networking, so he started writing Ethereal (the
former name of the Wireshark project) as a way to solve both problems.
Ethereal was initially released, after several pauses in development, in July 1998
as version 0.2.0. Within days, patches, bug reports, and words of encouragement
started arriving, so Ethereal was on its way to success.
Not long after that, Gilbert Ramirez saw its potential and contributed a low-
level dissector to it.
In October, 1998, Guy Harris of Network Appliance was looking for something
better than tcpview, so he started applying patches and contributing dissectors
to Ethereal.
In late 1998, Richard Sharpe, who was giving TCP/IP courses, saw its potential
on such courses, and started looking at it to see if it supported the protocols he
needed. While it didn't at that point, new protocols could be easily added. So he
started contributing dissectors and contributing patches.
The list of people who have contributed to the project has become very long
since then, and almost all of them started with a protocol that they needed that
Wireshark or Ethereal did not already handle. So they copied an existing
dissector and contributed the code back to the team.

Network Troubleshooting Using Wireshark May 2014
In 2006 the project moved house and re-emerged under a new name:
Wireshark.

Network Troubleshooting Using Wireshark May 2014
Here are some examples people use Wireshark for:
• network administrators use it to troubleshoot network problems
• network security engineers use it to examine security problems
• developers use it to debug protocol implementations
• people use it to learn network protocol internals
Beside these examples, Wireshark can be helpful in many other
situations too.

Network Troubleshooting Using Wireshark May 2014
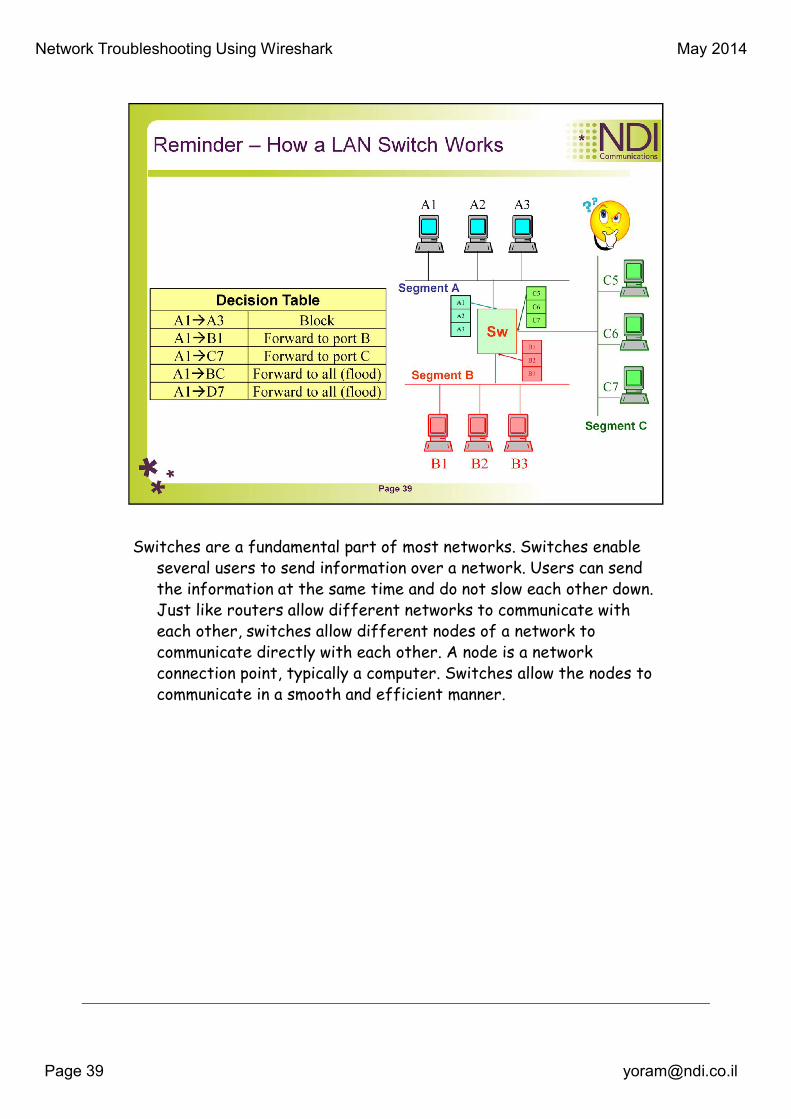
Switches are a fundamental part of most networks. Switches enable
several users to send information over a network. Users can send
the information at the same time and do not slow each other down.
Just like routers allow different networks to communicate with
each other, switches allow different nodes of a network to
communicate directly with each other. A node is a network
connection point, typically a computer. Switches allow the nodes to
communicate in a smooth and efficient manner.

Network Troubleshooting Using Wireshark May 2014
In Cisco – SPAN - Switched Port Analyzer:
http://www.cisco.com/en/US/products/hw/switches/ps708/products
_tech_note09186a008015c612.shtml
In Juniper – Port Mirror:
http://www.juniper.net/techpubs/en_US/junos9.2/topics/concept/po
rt-mirroring-ex-series-overview.html

Network Troubleshooting Using Wireshark May 2014
The wireshark, which is a protocol analyzer, will be located to monitor
specific traffic flow in the network. It can be located to monitor a
server, a router, a group of users etc.
Network Troubleshooting Using Wireshark May 2014
The current stable release of Wireshark is 1.10.7. It supersedes all
previous releases, including all releases of Ethereal. List of releases
are available in:
http://www.wireshark.org/download.html
File This menu contains items to open and merge capture files, save /
print / export capture files in whole or in part, and to quit from
Wireshark.
Edit This menu contains items to find a packet, time reference or
mark one or more packets, handle configuration profiles, and set your
preferences; (cut, copy, and paste are not presently implemented).
View This menu controls the display of the captured data, including
colorization of packets, zooming the font, showing a packet in a
separate window, expanding and collapsing trees in packet details.
Go This menu contains items to go to a specific packet.
Network Troubleshooting Using Wireshark May 2014
Capture This menu allows you to start and stop captures and to edit
capture filters.
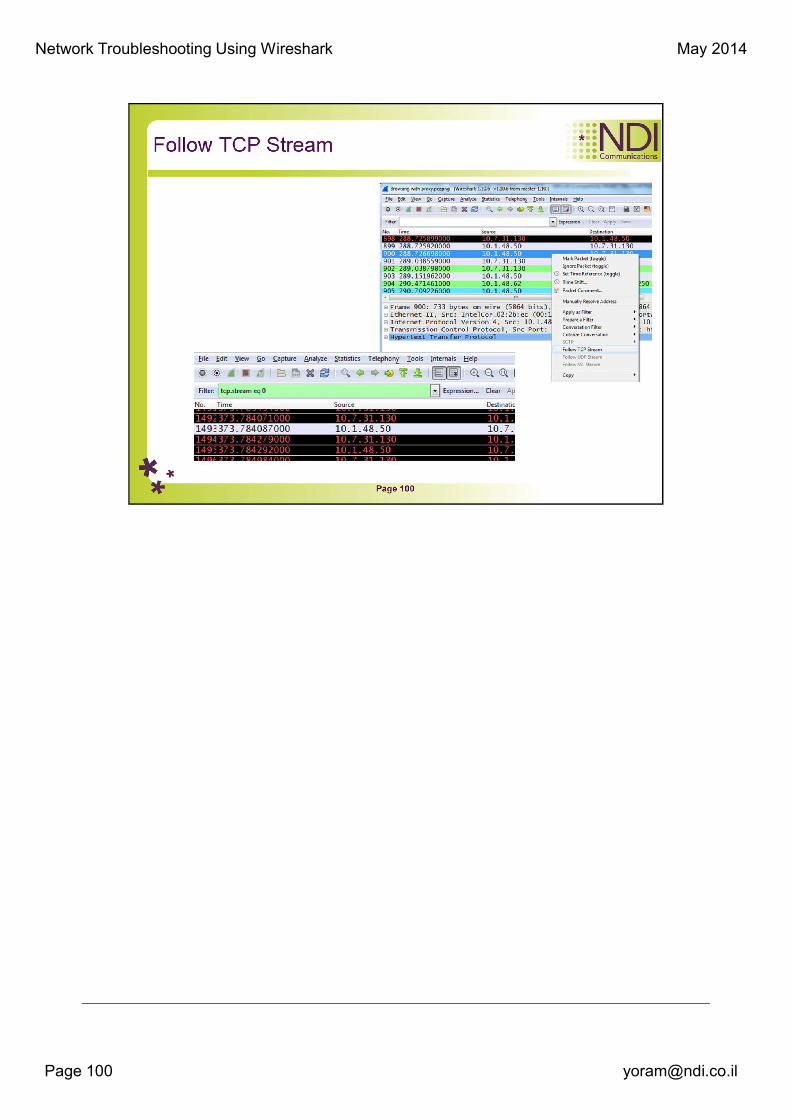
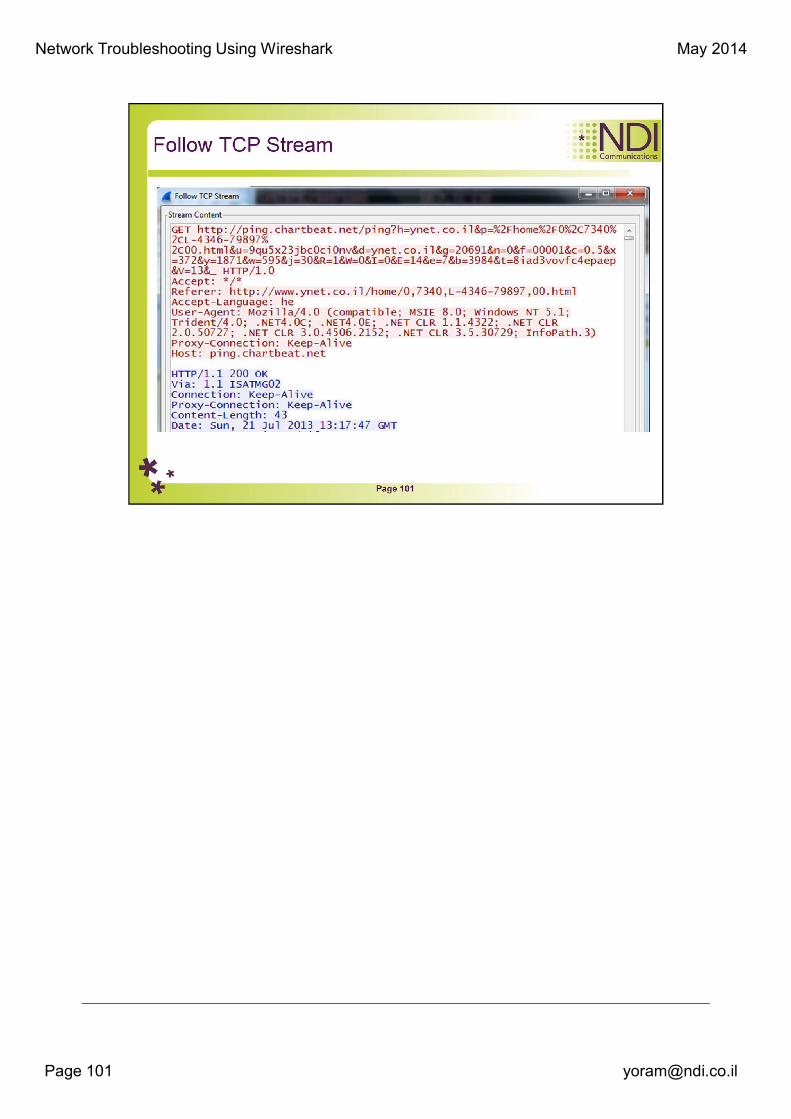
Analyze This menu contains items to manipulate display filters, enable
or disable the dissection of protocols, configure user specified
decodes and follow a TCP stream.
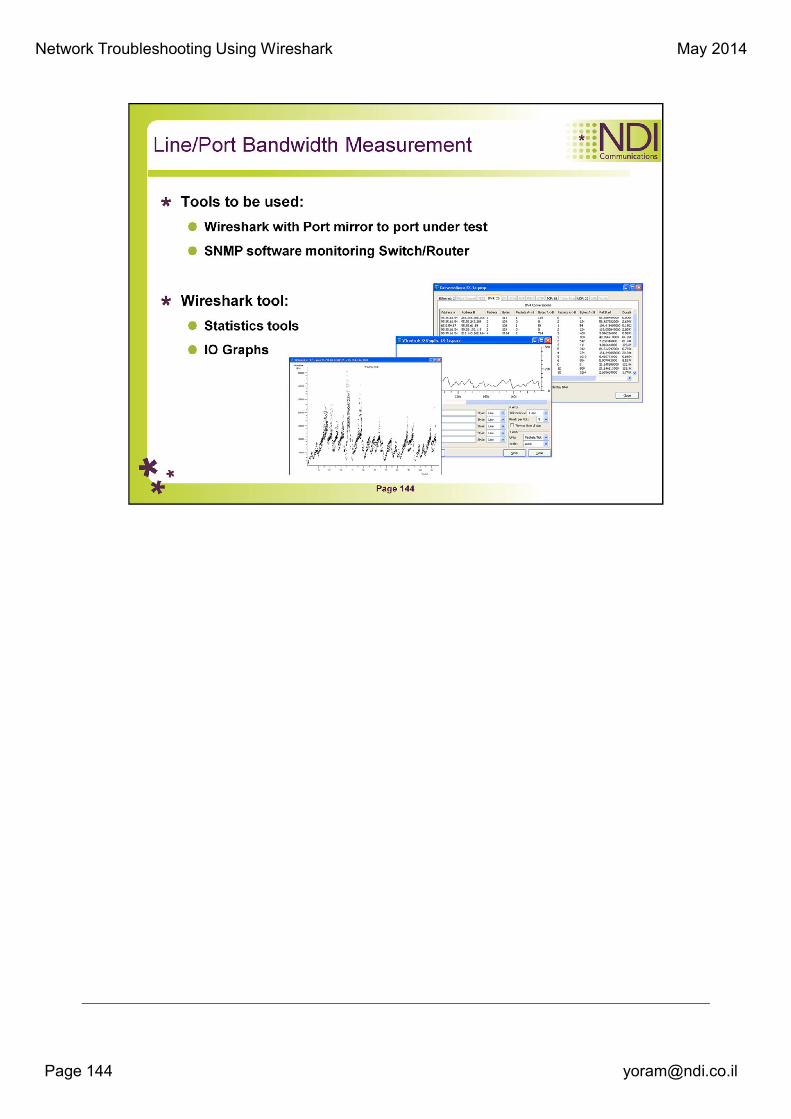
Statistics This menu contains items to display various statistic
windows, including a summary of the packets that have been captured,
display protocol hierarchy statistics and much more.
Tools This menu contains various tools available in Wireshark, such as
creating Firewall ACL Rules.
Help This menu contains items to help the user, e.g. access to some
basic help, a list of the supported protocols, manual pages, online
access to some of the webpages, and
the usual about dialog.

Network Troubleshooting Using Wireshark May 2014
One of the following methods can be used to start capturing packets with
Wireshark:
• You can get an overview of the available local interfaces using the "
Capture Interfaces" dialog box.
• You can start a capture from this dialog box, using (one of) the "Capture"
button(s).
• You can start capturing using the "Capture Options" dialog box.
• If you have selected the right capture options before, you can
immediately start a capture using the " Capture Start" menu / toolbar
item. The capture process will start immediately.

Network Troubleshooting Using Wireshark May 2014
Accelerator Description
Tab, Shift+Tab Move between screen elements, e.g. from the
toolbars to the packet list to the packet detail.
Down Move to the next packet or detail item.
Up Move to the previous packet or detail item.
Ctrl+Down, F8 Move to the next packet, even if the packet list
isn't focused.
Ctrl+Up, F7 Move to the previous packet, even if the packet
list isn't focused.
Left In the packet detail, closes the selected tree
item. If it's already closed, jumps to the parent node.
Right In the packet detail, opens the selected tree
item.

Network Troubleshooting Using Wireshark May 2014
Shift+Right In the packet detail, opens the selected
tree item and all of its subtrees.
Ctrl+Right In the packet detail, opens all tree items.
Ctrl+Left In the packet detail, closes all tree items.
Backspace In the packet detail, jumps to the parent
node. Return,
Enter In the packet detail, toggles the selected
tree item.


Network Troubleshooting Using Wireshark May 2014
Time display formats and time references:
While packets are captured, each packet is timestamped. These timestamps will be saved to the capture file, so they will be available for later analysis.
The timestamp presentation format and the precision in the packet list can be chosen using the View menu.
The available presentation formats are:
Date and Time of Day: 1970-01-01 01:02:03.123456 The absolute date and time of the day when the packet was captured.
Time of Day: 01:02:03.123456 The absolute time of the day when the packet was captured.
Seconds Since Beginning of Capture: 123.123456 The time relative to the start of the capture file or the first "Time Reference" before this packet.
Seconds Since Previous Captured Packet: 1.123456 The time relative to the previous captured packet.
Seconds Since Previous Displayed Packet: 1.123456 The time relative to the previous displayed packet.
Seconds Since Epoch (1970-01-01): 1234567890.123456 The time relative to epoch (midnight UTC of January 1, 1970).
Network Troubleshooting Using Wireshark May 2014
The available precisions (aka. the number of displayed decimal places) are:
Automatic The timestamp precision of the loaded capture file format will be used (the default).
Seconds, Deciseconds, Centiseconds, Milliseconds, Microseconds or Nanoseconds The timestamp precision will be forced to the given setting. If the actually available precision is smaller, zeros will be appended. If the precision is larger, the remaining decimal places will be cut off.
Precision example: If you have a timestamp and it's displayed using, "Seconds Since Previous Packet", : the value might be 1.123456. This will be displayed using the "Automatic" setting for libpcap files (which is microseconds). If you use Seconds it would show simply 1 and if you use Nanoseconds it shows 1.123456000.
Network Troubleshooting Using Wireshark May 2014
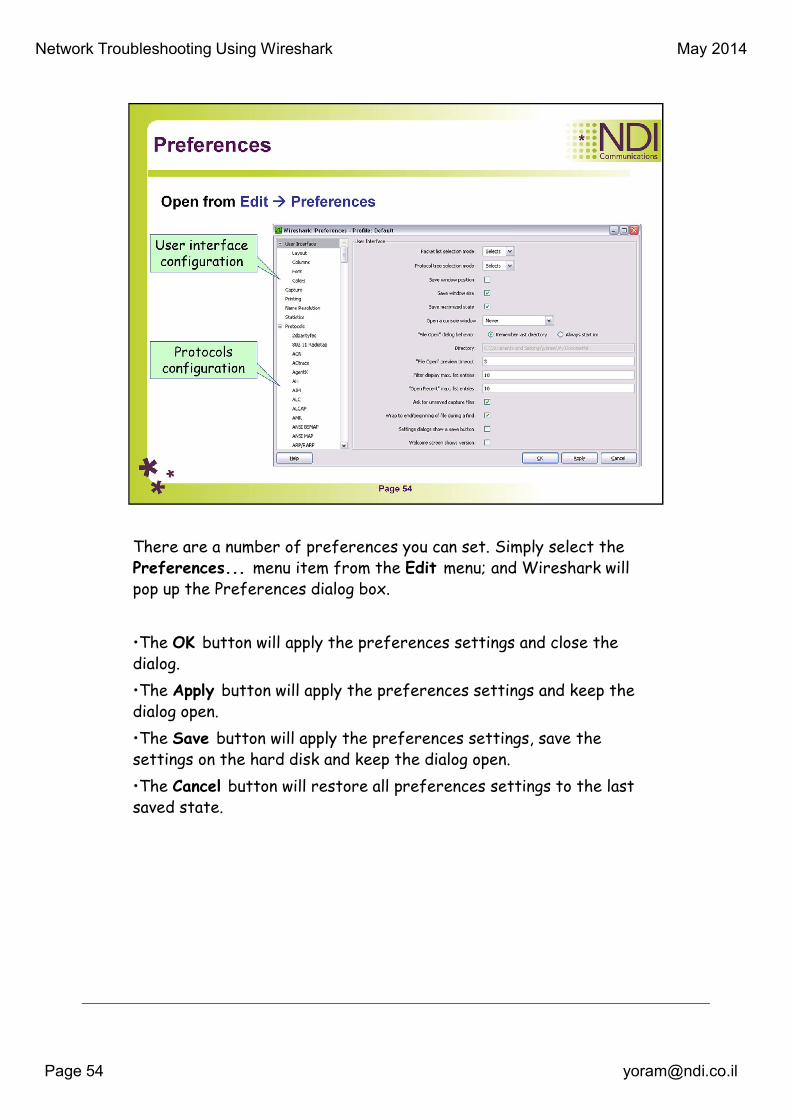
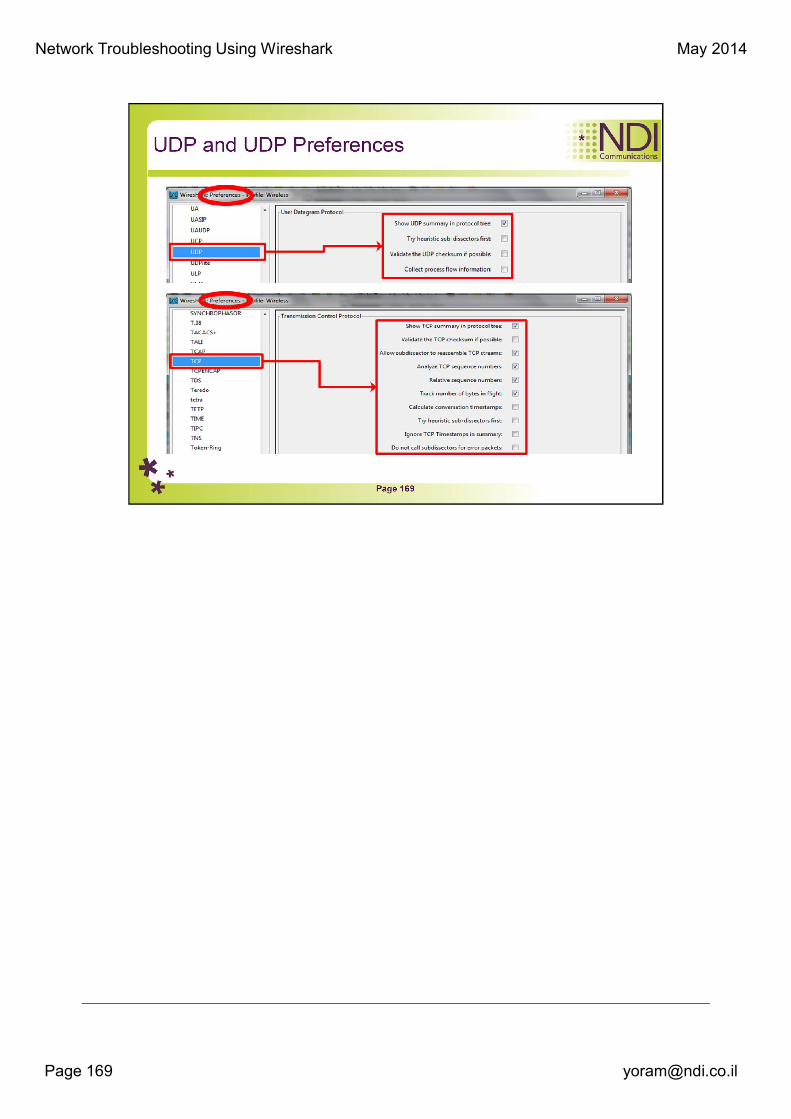
There are a number of preferences you can set. Simply select the
Preferences... menu item from the Edit menu; and Wireshark will
pop up the Preferences dialog box.
•The OK button will apply the preferences settings and close the
dialog.
•The Apply button will apply the preferences settings and keep the
dialog open.
•The Save button will apply the preferences settings, save the
settings on the hard disk and keep the dialog open.
•The Cancel button will restore all preferences settings to the last
saved state.

Network Troubleshooting Using Wireshark May 2014
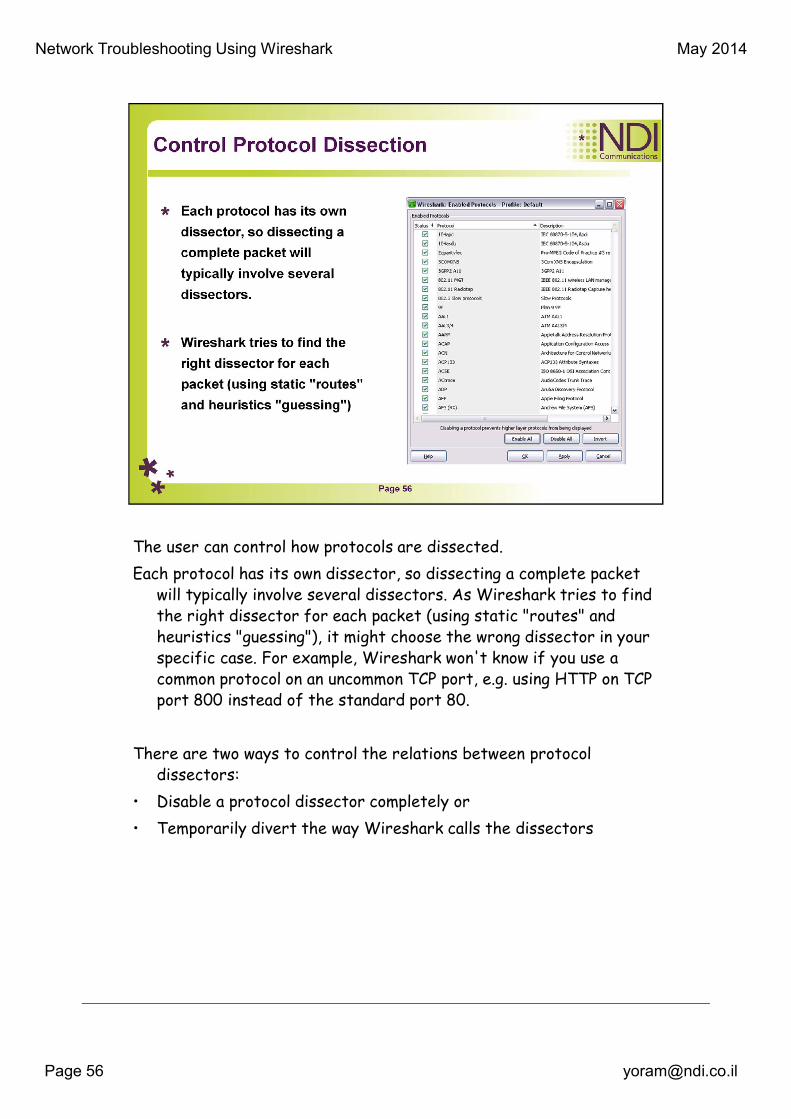
The user can control how protocols are dissected.
Each protocol has its own dissector, so dissecting a complete packet
will typically involve several dissectors. As Wireshark tries to find
the right dissector for each packet (using static "routes" and
heuristics "guessing"), it might choose the wrong dissector in your
specific case. For example, Wireshark won't know if you use a
common protocol on an uncommon TCP port, e.g. using HTTP on TCP
port 800 instead of the standard port 80.
There are two ways to control the relations between protocol
dissectors:
• Disable a protocol dissector completely or
• Temporarily divert the way Wireshark calls the dissectors


Network Troubleshooting Using Wireshark May 2014
© All Rights Reserved to NDI Communications ©


Network Troubleshooting Using Wireshark May 2014
Wireshark uses the libpcap filter language for capture filters. Libpcap
is a portable C/C++ library for network traffic capture.
You can find additional information on the Libpcap web site -
http://www.tcpdump.org/, and Capture Filter examples at
http://wiki.wireshark.org/CaptureFilters

Network Troubleshooting Using Wireshark May 2014
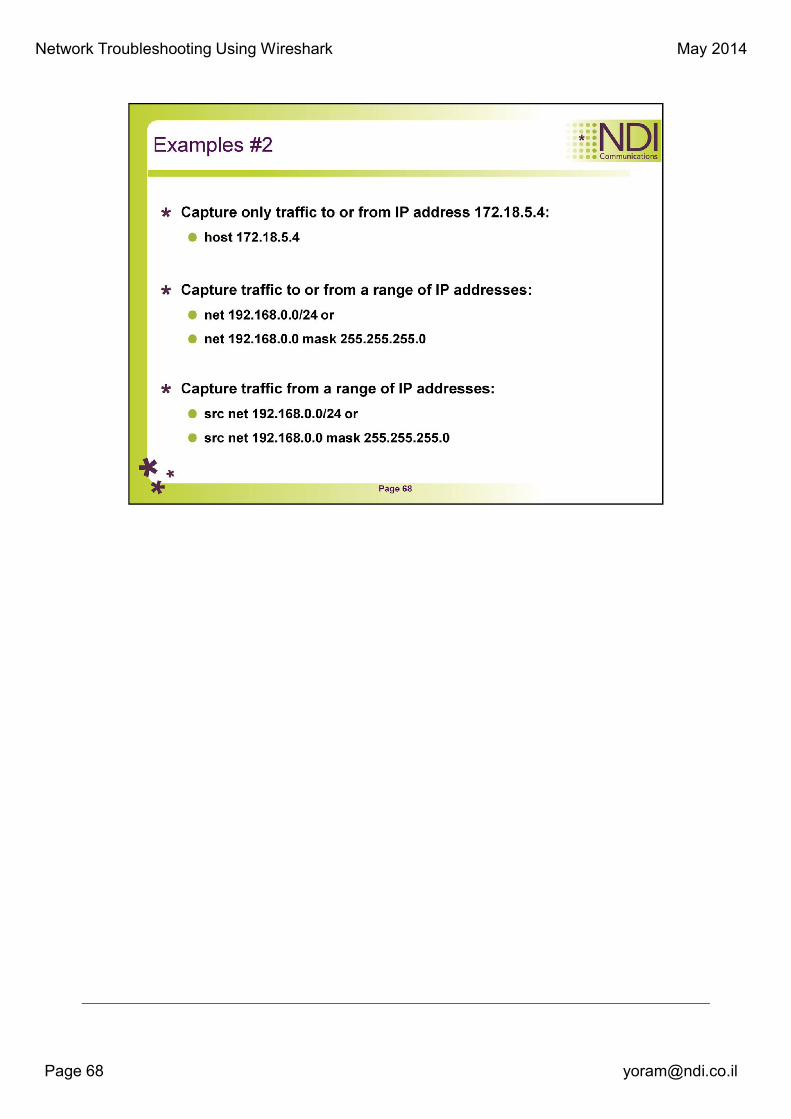
Examples:
host 10.10.10.10
Capture all packets to and from 10.10.10.10
src host 10.10.10.10
Capture all packets where 10.10.10.10 is the source
dst host 10.10.10.10
Capture all packets where 10.10.10.10 is the destination

Network Troubleshooting Using Wireshark May 2014
Examples:
port 80
Capture all packets where 80 is either the source or destination port
src port 80
Capture all packets where 80 is the source port
dst port 80
Capture all packets where 80 is the destination port

Network Troubleshooting Using Wireshark May 2014
Examples:
Net 192.168.100.0/24
Capture all packets to/from network 192.168.100.0/24
Network Troubleshooting Using Wireshark May 2014
Filters based on byte offset notation are the most powerful but confusing filters to
design. However, once you understand it you will be designing filters to capture ANY
kind of packet. Filters based on this notation can capture packets based on any value
in any location within the packet. Any of the preceding filters can be designed with
byte offset notation by locating its offset in the appropriate header.
The syntax is: proto [Offset in bytes from the start of the header : Number of
bytes to check]
Examples:
ip[8:1] = 1 Capture all IP packets where the TTL is 1
tcp[0:2] = 80 Capture all tcp segments (packets) where 80 is the source port. This is
equivalent to the filter: src port 80
Tips to help you with byte offset notation:
1. Remember that the headers start with byte zero.
2. Always keep a layout of the headers of interest handy when designing filters
with byte offset notation (for example: ip,udp,tcp and icmp).
3. If you don't specify the number of bytes to check, one byte will be checked. You
can specify 1,2 or 4 bytes to be checked.
4. Review the RFCs for IP, TCP, UDP and ICMP
Network Troubleshooting Using Wireshark May 2014
More examples:
tcp dst port 3128
Displays packets with destination TCP port 3128.
ip src host 10.1.1.1
Displays packets with source IP address equals to 10.1.1.1.
host 10.1.2.3
Displays packets with source or destination IP address equals to 10.1.1.1.
src portrange 2000-2500
Displays packets with source UDP or TCP ports in the 2000-2500 range.
not imcp
Displays everything except icmp packets. (icmp is typically used by the ping tool)
src host 10.7.2.12 and not dst net 10.200.0.0/16
Displays packets with source IP address equals to 10.7.2.12 and in the same time not with the destination IP network 10.200.0.0/16.
(src host 10.4.1.12 or src net 10.6.0.0/16) and tcp dst portrange 200-10000 and dst net 10.0.0.0/8
Displays packets with source IP address 10.4.1.12 or source network 10.6.0.0/16, the result is then concatenated with packets having destination TCP portrange from 200 to 10000 and destination IP network 10.0.0.0/8.

Network Troubleshooting Using Wireshark May 2014
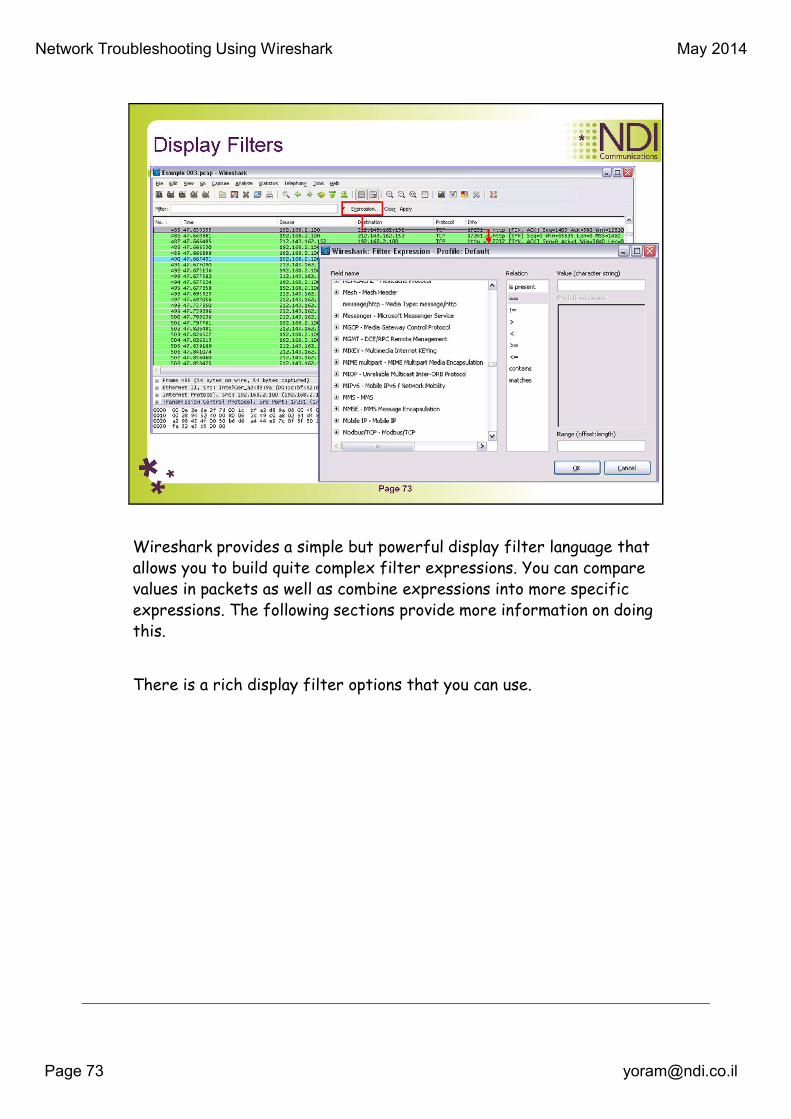
Wireshark provides a simple but powerful display filter language that
allows you to build quite complex filter expressions. You can compare
values in packets as well as combine expressions into more specific
expressions. The following sections provide more information on doing
this.
There is a rich display filter options that you can use.
Network Troubleshooting Using Wireshark May 2014
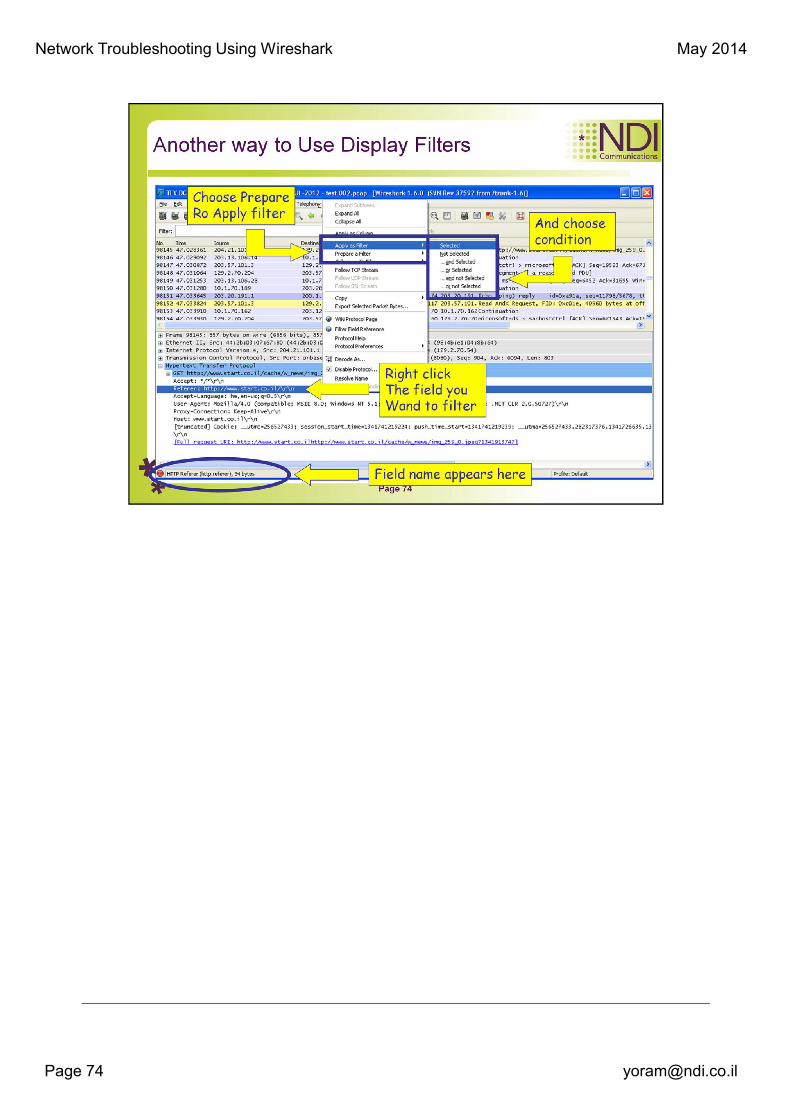
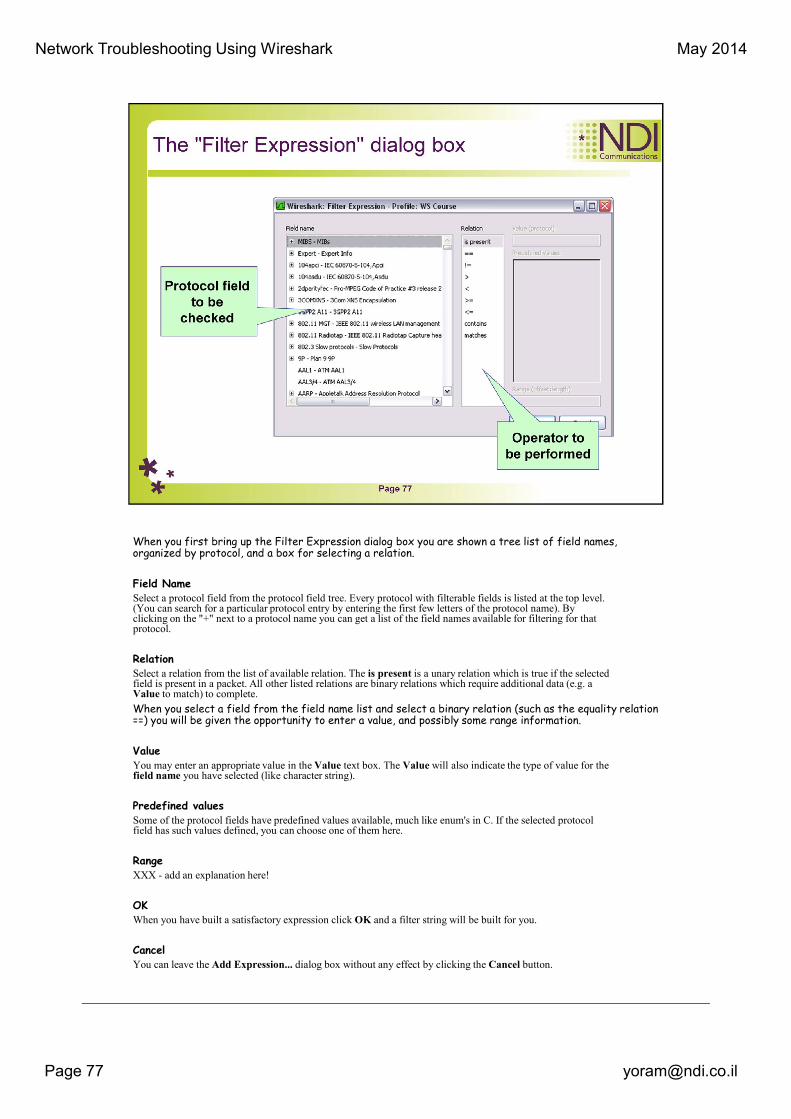
When you first bring up the Filter Expression dialog box you are shown a tree list of field names, organized by protocol, and a box for selecting a relation.
Field Name
Select a protocol field from the protocol field tree. Every protocol with filterable fields is listed at the top level. (You can search for a particular protocol entry by entering the first few letters of the protocol name). By clicking on the "+" next to a protocol name you can get a list of the field names available for filtering for that protocol.
Relation
Select a relation from the list of available relation. The is present is a unary relation which is true if the selected field is present in a packet. All other listed relations are binary relations which require additional data (e.g. a Value to match) to complete.
When you select a field from the field name list and select a binary relation (such as the equality relation ==) you will be given the opportunity to enter a value, and possibly some range information.
Value
You may enter an appropriate value in the Value text box. The Value will also indicate the type of value for the field name you have selected (like character string).
Predefined values
Some of the protocol fields have predefined values available, much like enum's in C. If the selected protocol field has such values defined, you can choose one of them here.
Range
XXX - add an explanation here!
OK
When you have built a satisfactory expression click OK and a filter string will be built for you.
Cancel
You can leave the Add Expression... dialog box without any effect by clicking the Cancel button.

Network Troubleshooting Using Wireshark May 2014
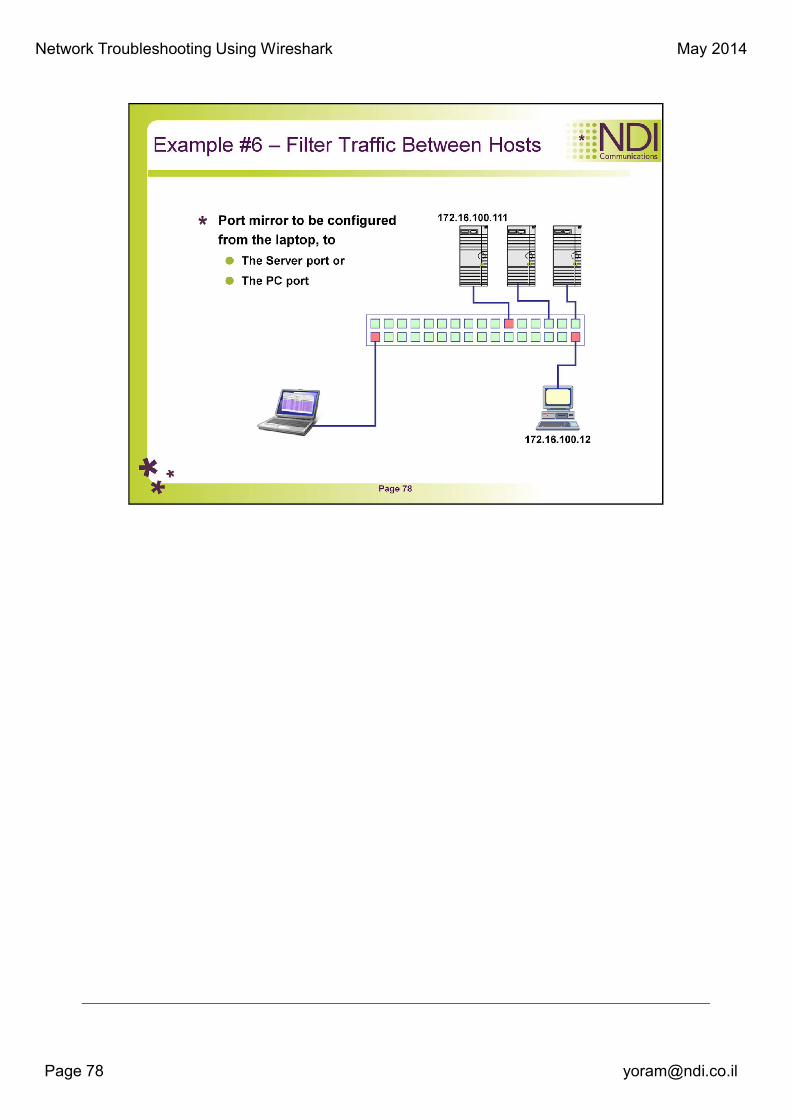
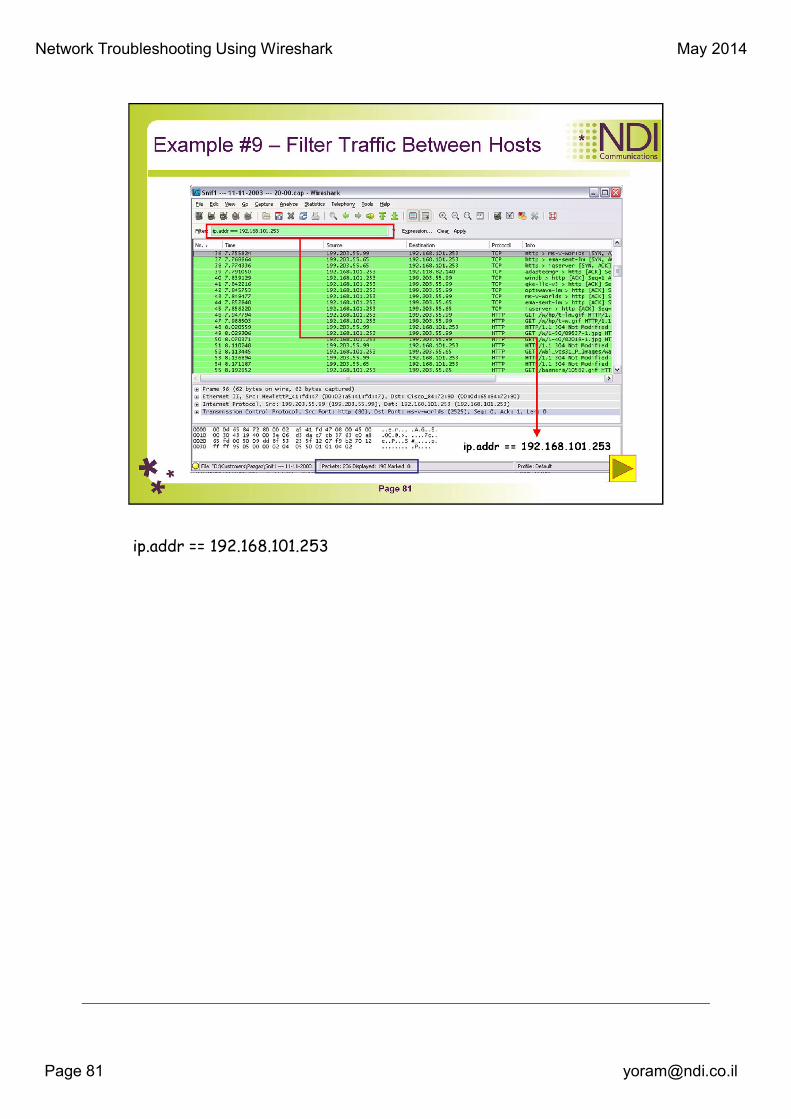
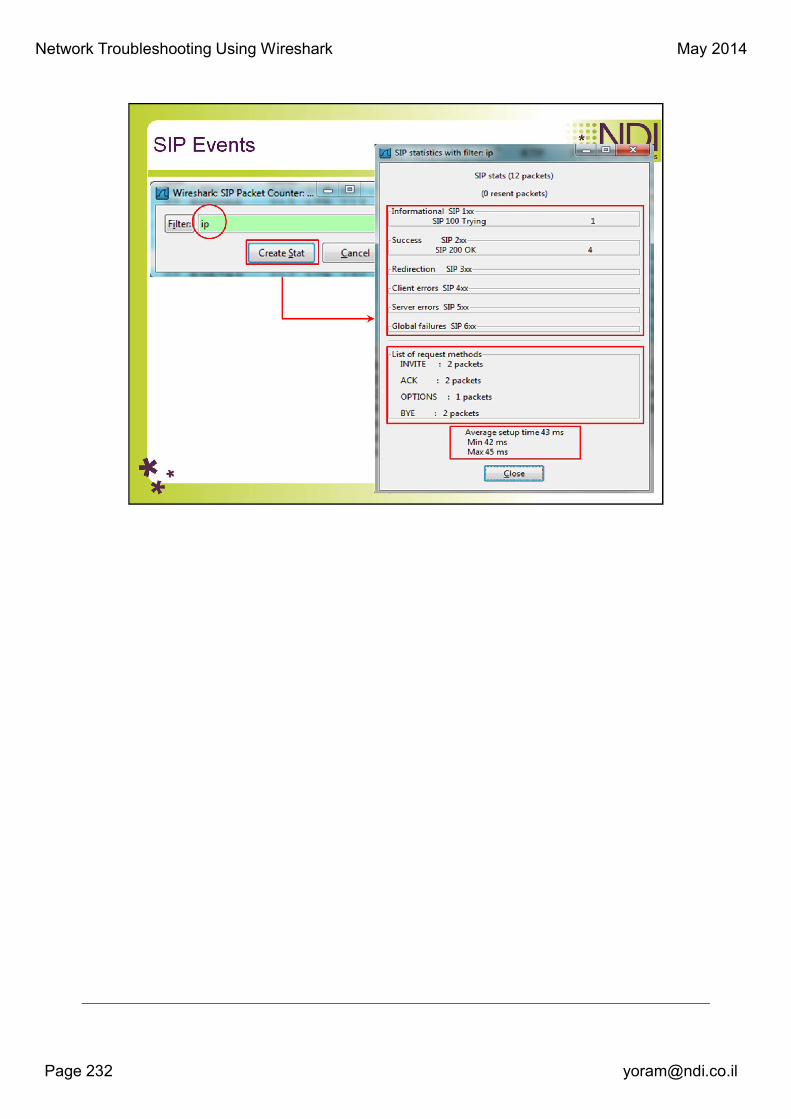
ip.addr == 172.16.100.111 and ip.addr == 172.16.100.12
Network Troubleshooting Using Wireshark May 2014
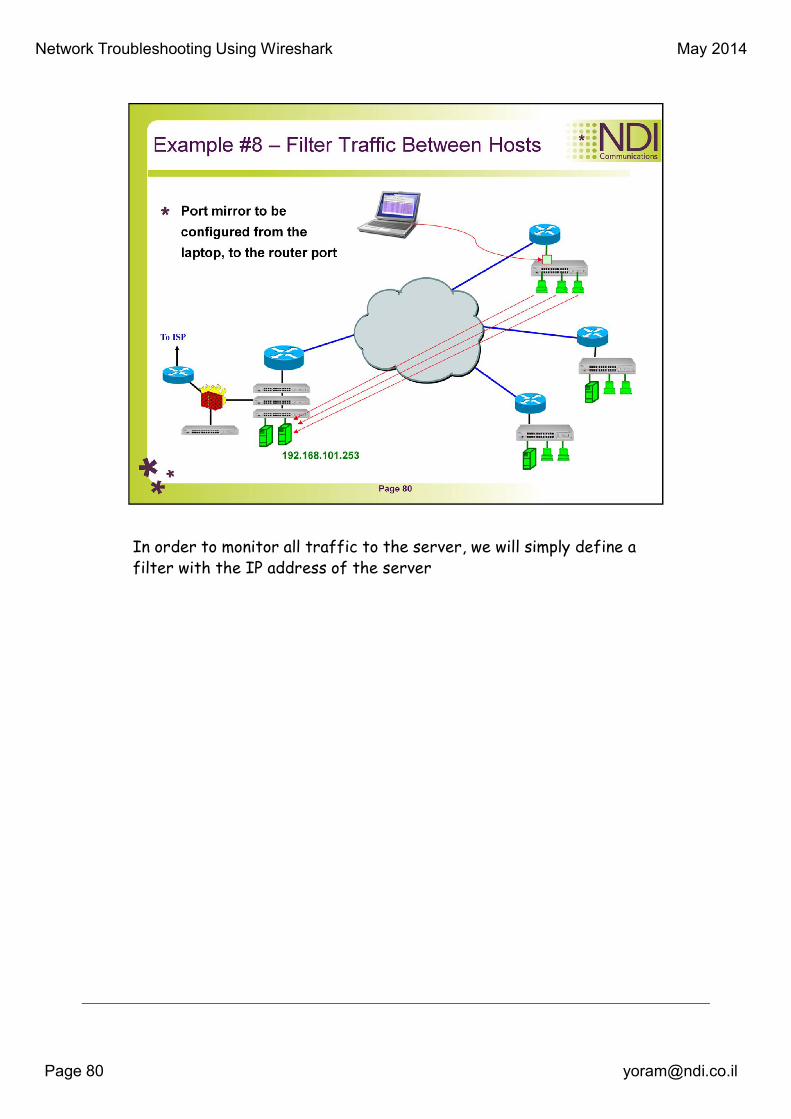
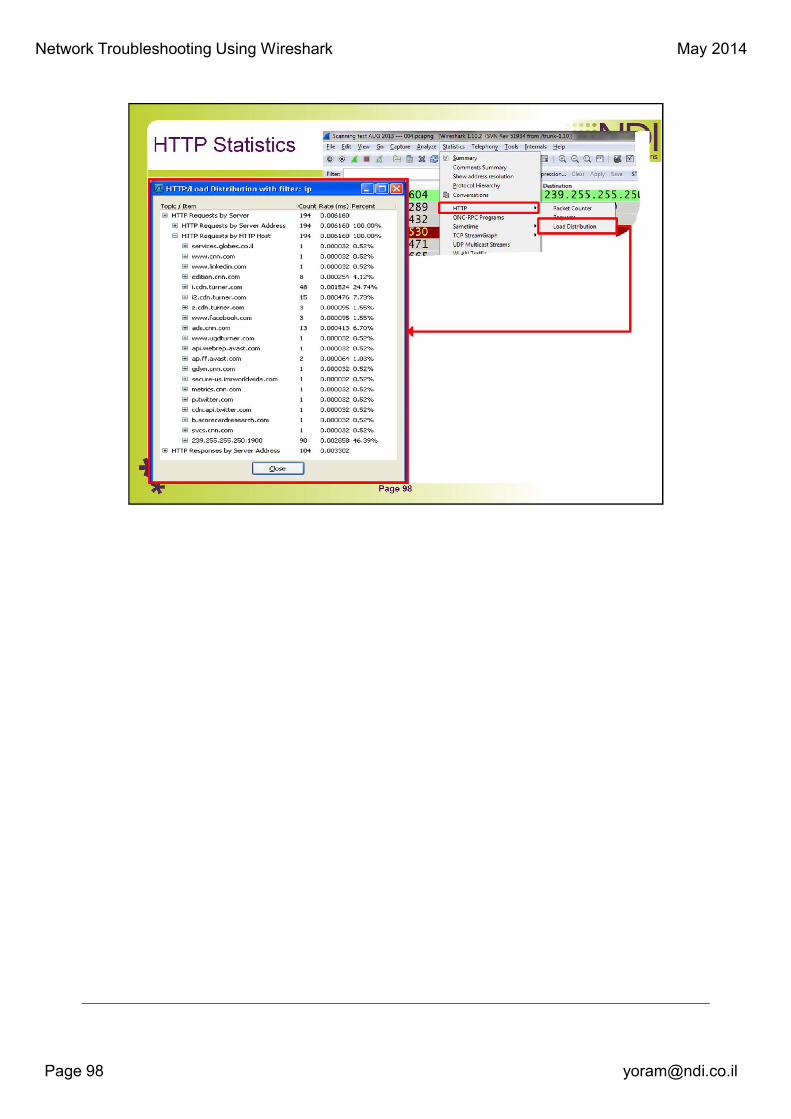
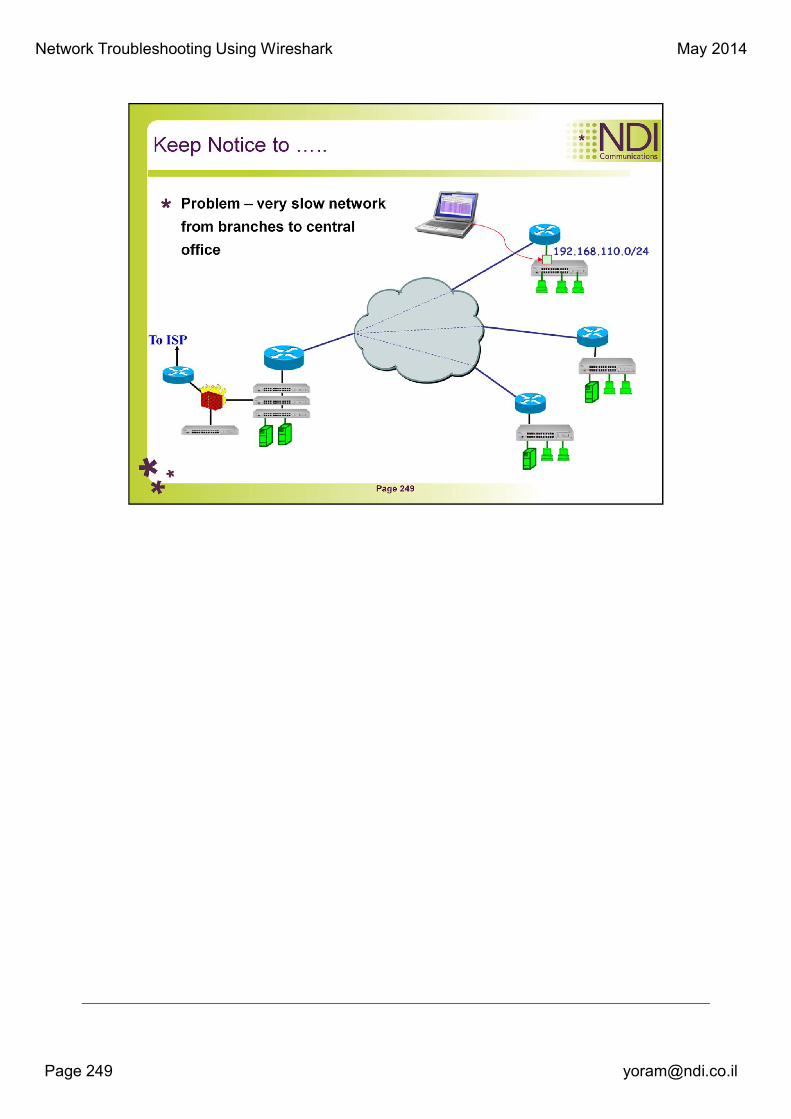
In order to monitor all traffic to the server, we will simply define a
filter with the IP address of the server
Network Troubleshooting Using Wireshark May 2014
© All Rights Reserved to NDI Communications ©


Network Troubleshooting Using Wireshark May 2014
File:
General information about the capture file.
Time:
The timestamps when the first and the last packet were captured (and the time
between them).
Capture:
Information from the time when the capture was done (only available if the packet
data was captured from the network and not loaded from a file).
Display:
Some display related information.
Traffic:
Some statistics of the network traffic seen. If a display filter is set, you will see
values in the Captured column, and if any packages are marked, you will see values in
the Marked column. The values in the Captured column will remain the same as
before, while the values in the Displayed column will reflect the values
corresponding to the packets shown in the display. The values in the Marked column
will reflect the values corresponding to the marked packages.
Network Troubleshooting Using Wireshark May 2014
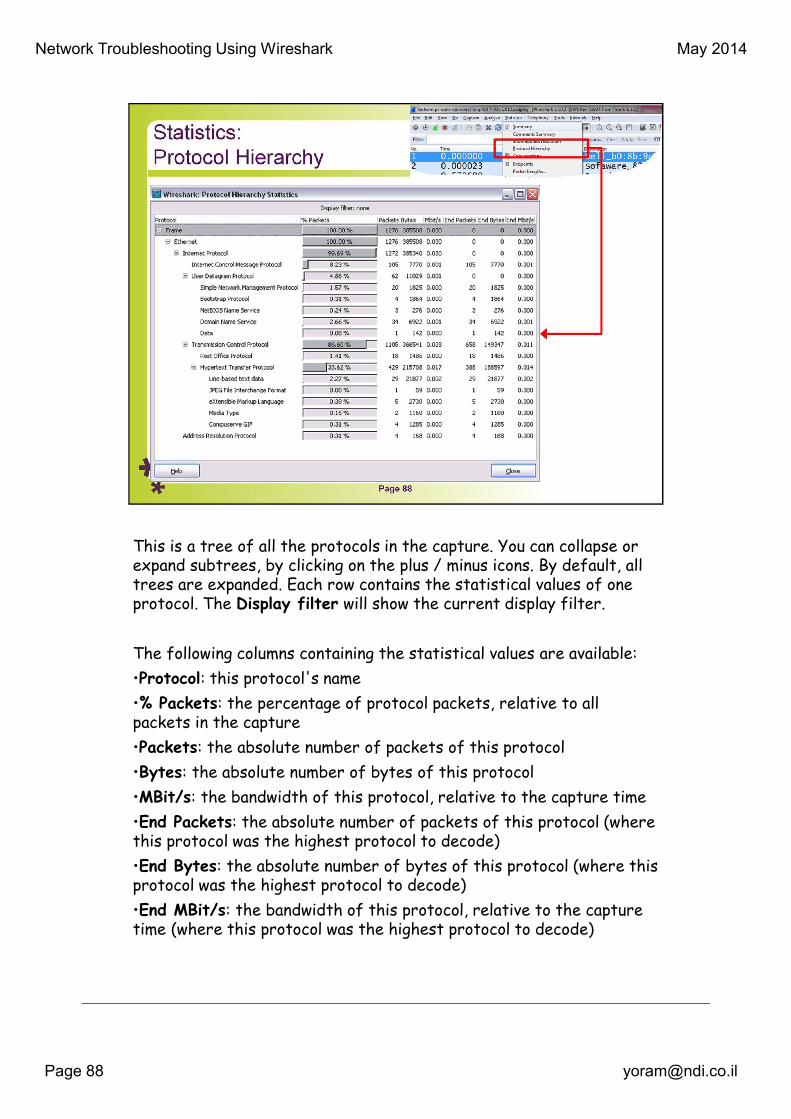
This is a tree of all the protocols in the capture. You can collapse or expand subtrees, by clicking on the plus / minus icons. By default, all trees are expanded. Each row contains the statistical values of one protocol. The Display filter will show the current display filter.
The following columns containing the statistical values are available:
•Protocol: this protocol's name
•% Packets: the percentage of protocol packets, relative to all packets in the capture
•Packets: the absolute number of packets of this protocol
•Bytes: the absolute number of bytes of this protocol
•MBit/s: the bandwidth of this protocol, relative to the capture time
•End Packets: the absolute number of packets of this protocol (where this protocol was the highest protocol to decode)
•End Bytes: the absolute number of bytes of this protocol (where this protocol was the highest protocol to decode)
•End MBit/s: the bandwidth of this protocol, relative to the capture time (where this protocol was the highest protocol to decode)


Network Troubleshooting Using Wireshark May 2014
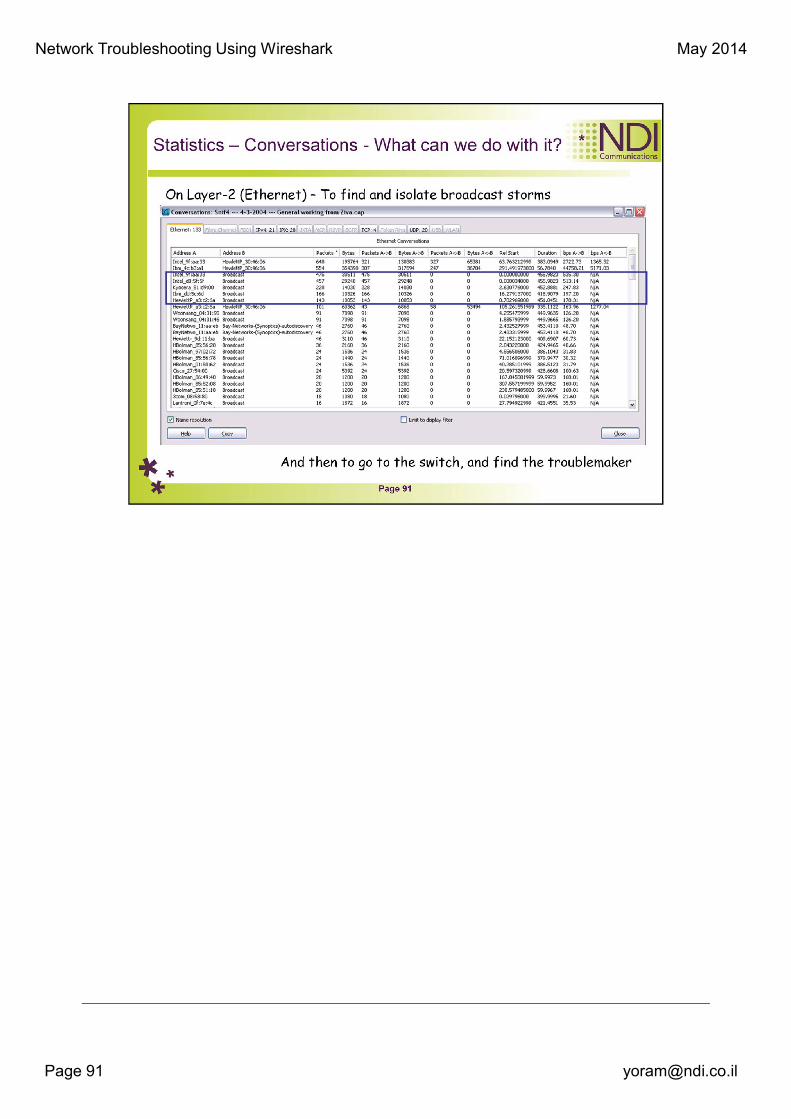
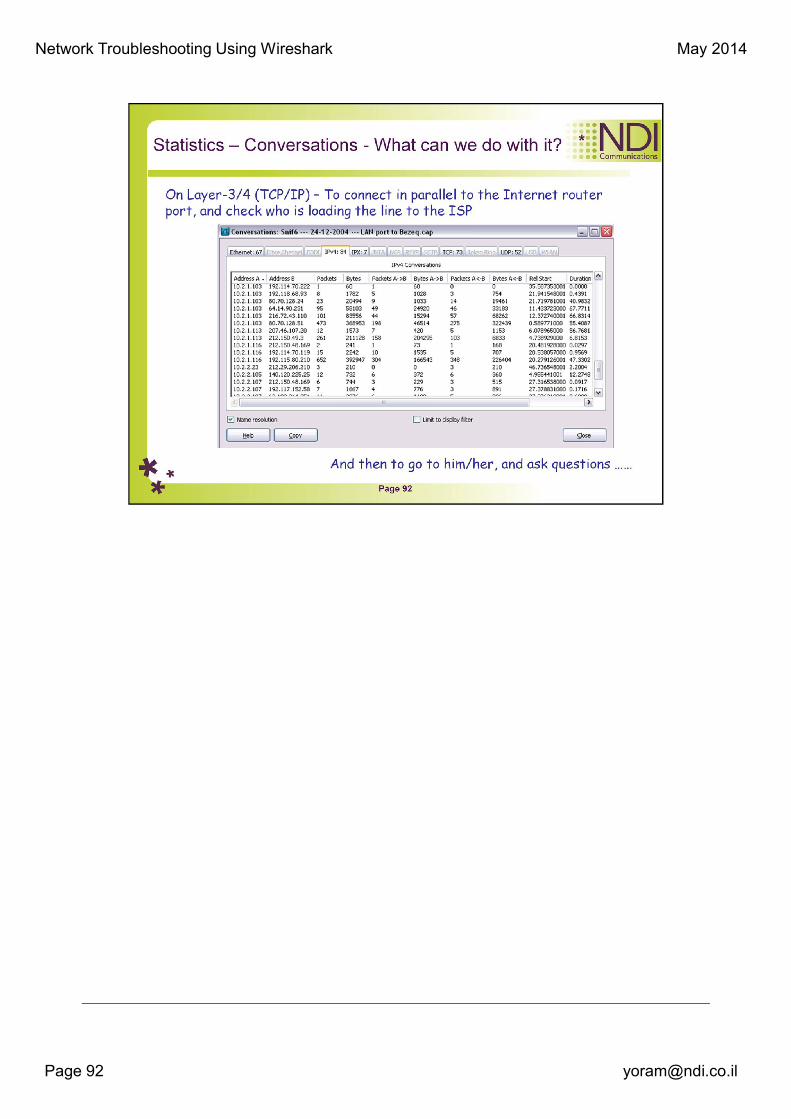
A network conversation is the traffic between two specific endpoints.
For example, an IP conversation is all the traffic between two IP
addresses. The conversations window is similar to the endpoint
Window. Along with addresses, packet counters, and byte counters
the conversation window adds four columns: the time in seconds
between the start of the capture and the start of the conversation
("Rel Start"), the duration of the conversation in seconds, and the
average bits (not bytes) per second in each direction.

Network Troubleshooting Using Wireshark May 2014
A network endpoint is the logical endpoint of separate protocol traffic of a specific protocol
layer. The endpoint statistics of Wireshark will take the following endpoints into account:
Ethernet: an Ethernet endpoint is identical to the Ethernet's MAC address.
Fibre Channel: XXX - insert info here.
FDDI: a FDDI endpoint is identical to the FDDI MAC address.
IPv4: an IP endpoint is identical to its IP address.
IPX: XXX - insert info here.
TCP: a TCP endpoint is a combination of the IP address and the TCP port used, so different
TCP ports on the same IP address are different TCP endpoints.
Token Ring: a Token Ring endpoint is identical to the Token Ring MAC address.
UDP: a UDP endpoint is a combination of the IP address and the UDP port used, so different
UDP ports on the same IP address are different UDP endpoints.
Name resolution will be done if selected in the window and if it is active for the specific
protocol layer (MAC layer for the selected Ethernet endpoints page). As you might have
noticed, the first row has a name resolution of the first three bytes "Netgear", the second
row's address was resolved to an IP address (using ARP) and the third was resolved to a
broadcast (unresolved this would still be: ff:ff:ff:ff:ff:ff); the last two Ethernet addresses
remain unresolved.
Limit to display filter will only show conversations matching the current display filter.
The copy button will copy the list values to the clipboard in CSV (Comma Separated Values)
format.

Network Troubleshooting Using Wireshark May 2014
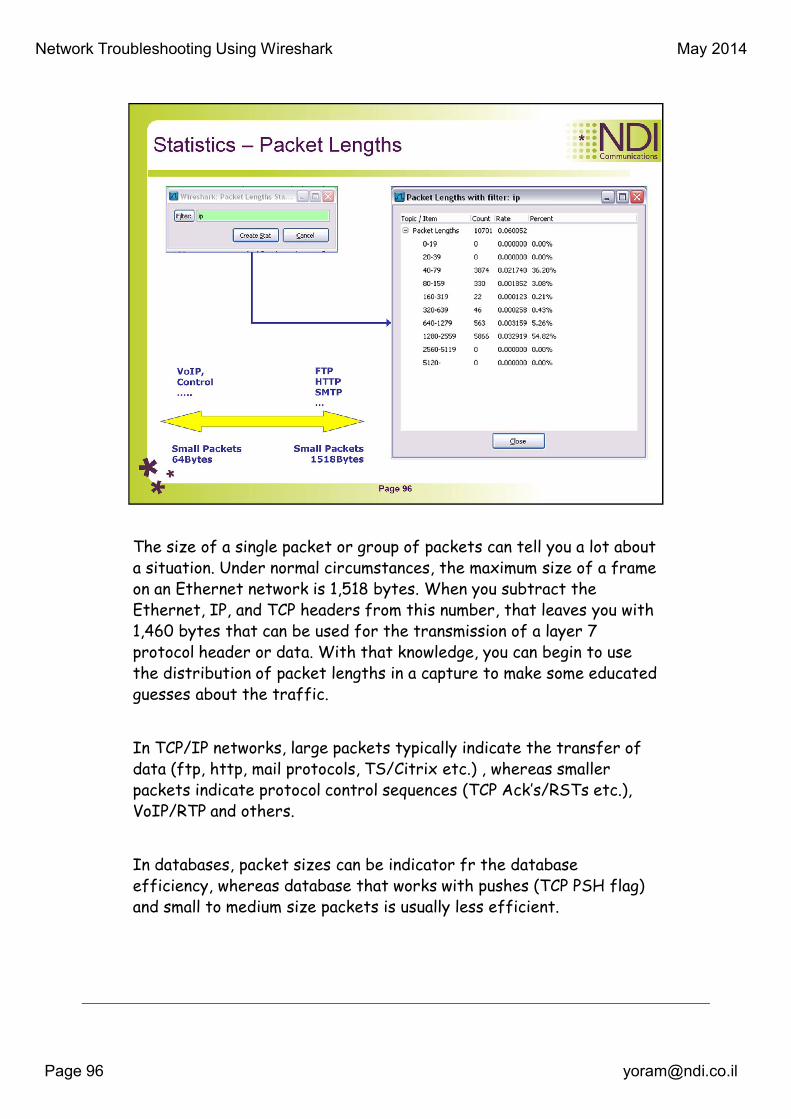
The size of a single packet or group of packets can tell you a lot about
a situation. Under normal circumstances, the maximum size of a frame
on an Ethernet network is 1,518 bytes. When you subtract the
Ethernet, IP, and TCP headers from this number, that leaves you with
1,460 bytes that can be used for the transmission of a layer 7
protocol header or data. With that knowledge, you can begin to use
the distribution of packet lengths in a capture to make some educated
guesses about the traffic.
In TCP/IP networks, large packets typically indicate the transfer of
data (ftp, http, mail protocols, TS/Citrix etc.) , whereas smaller
packets indicate protocol control sequences (TCP Ack’s/RSTs etc.),
VoIP/RTP and others.
In databases, packet sizes can be indicator fr the database
efficiency, whereas database that works with pushes (TCP PSH flag)
and small to medium size packets is usually less efficient.


Network Troubleshooting Using Wireshark May 2014
© All Rights Reserved to NDI Communications ©


Network Troubleshooting Using Wireshark May 2014
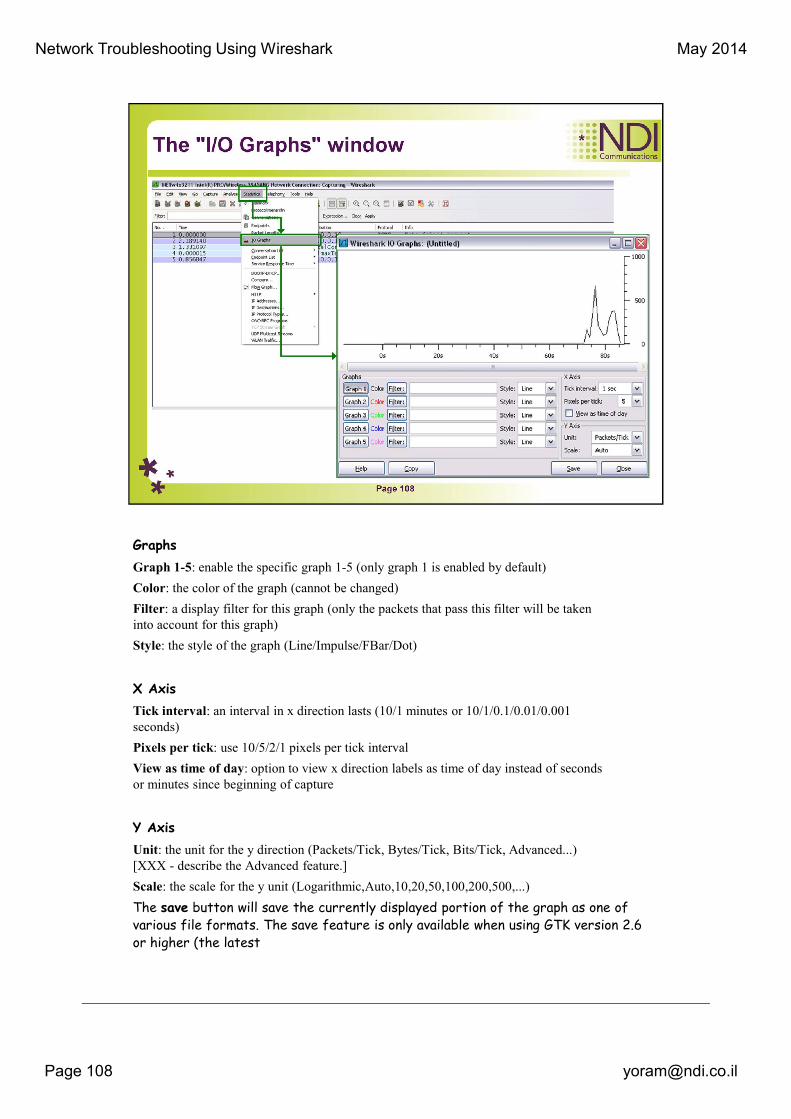
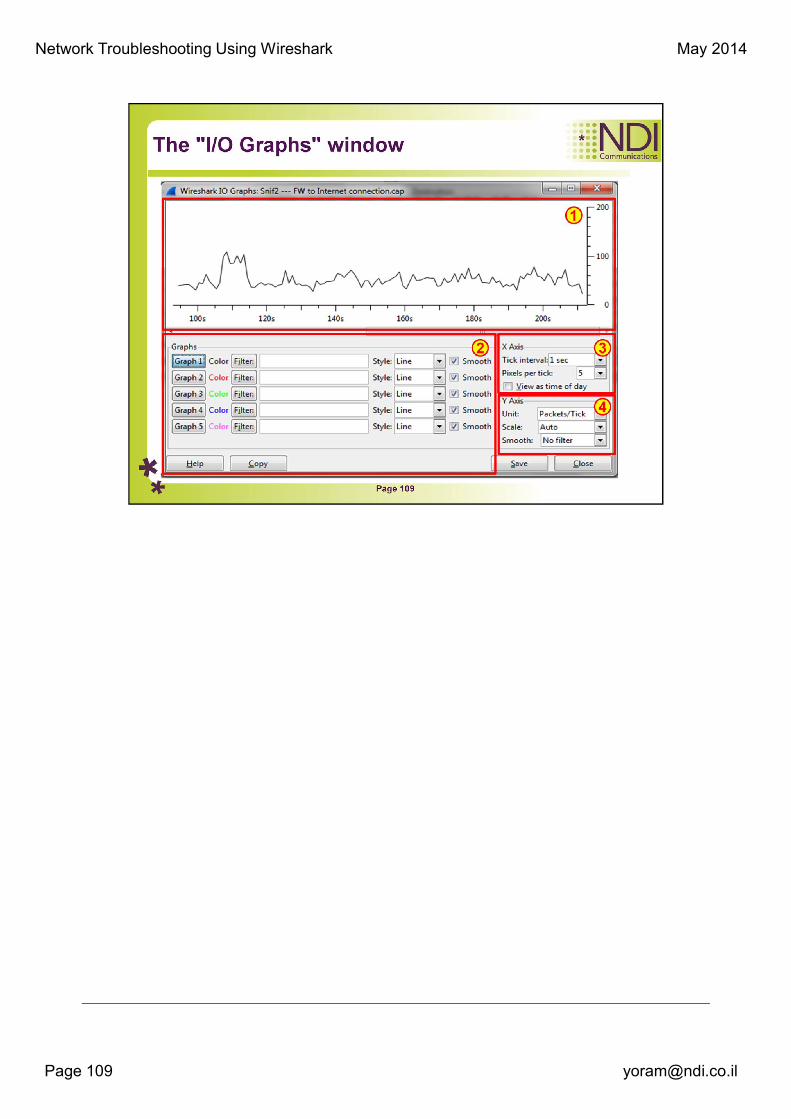
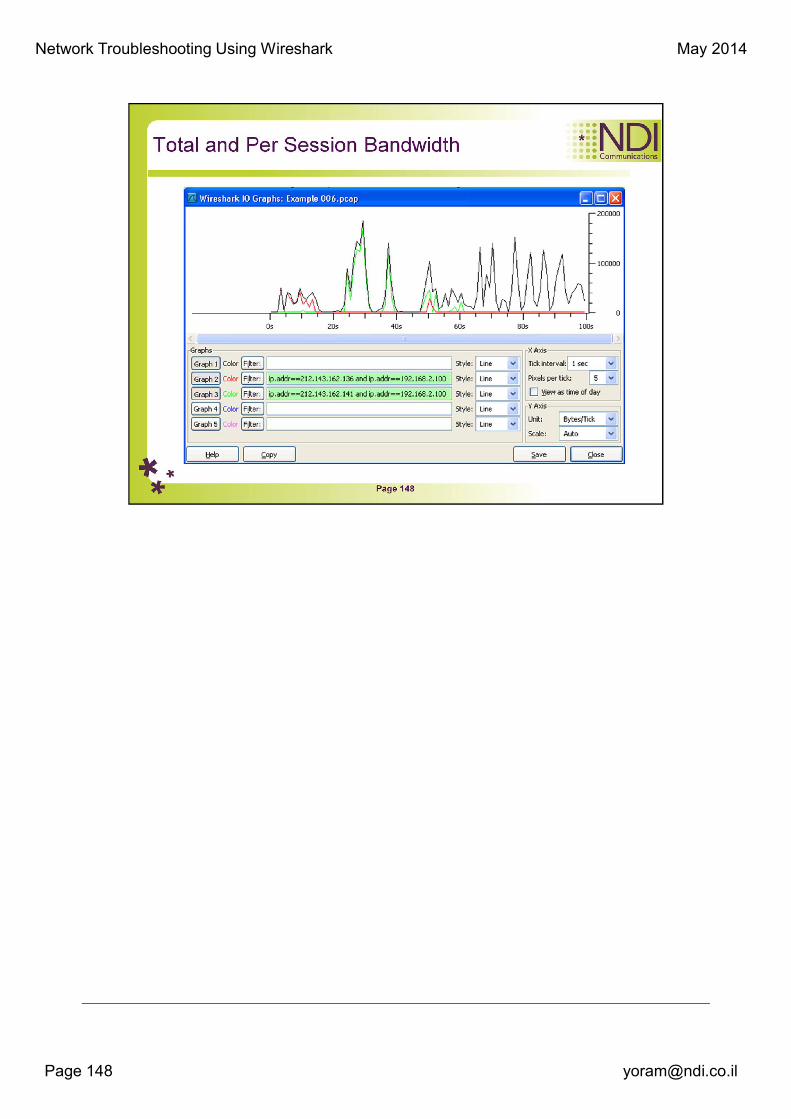
Graphs
Graph 1-5: enable the specific graph 1-5 (only graph 1 is enabled by default)
Color: the color of the graph (cannot be changed)
Filter: a display filter for this graph (only the packets that pass this filter will be taken into account for this graph)
Style: the style of the graph (Line/Impulse/FBar/Dot)
X Axis
Tick interval: an interval in x direction lasts (10/1 minutes or 10/1/0.1/0.01/0.001 seconds)
Pixels per tick: use 10/5/2/1 pixels per tick interval
View as time of day: option to view x direction labels as time of day instead of seconds or minutes since beginning of capture
Y Axis
Unit: the unit for the y direction (Packets/Tick, Bytes/Tick, Bits/Tick, Advanced...) [XXX - describe the Advanced feature.]
Scale: the scale for the y unit (Logarithmic,Auto,10,20,50,100,200,500,...)
The save button will save the currently displayed portion of the graph as one of
various file formats. The save feature is only available when using GTK version 2.6
or higher (the latest
Network Troubleshooting Using Wireshark May 2014
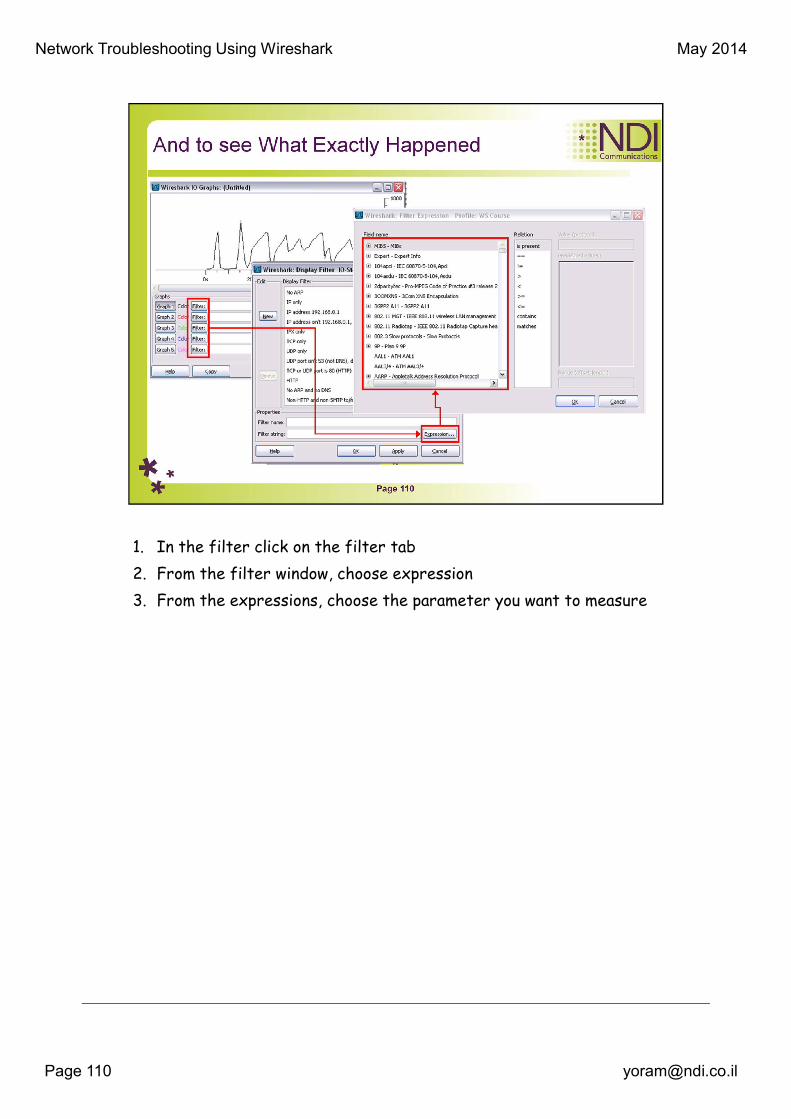
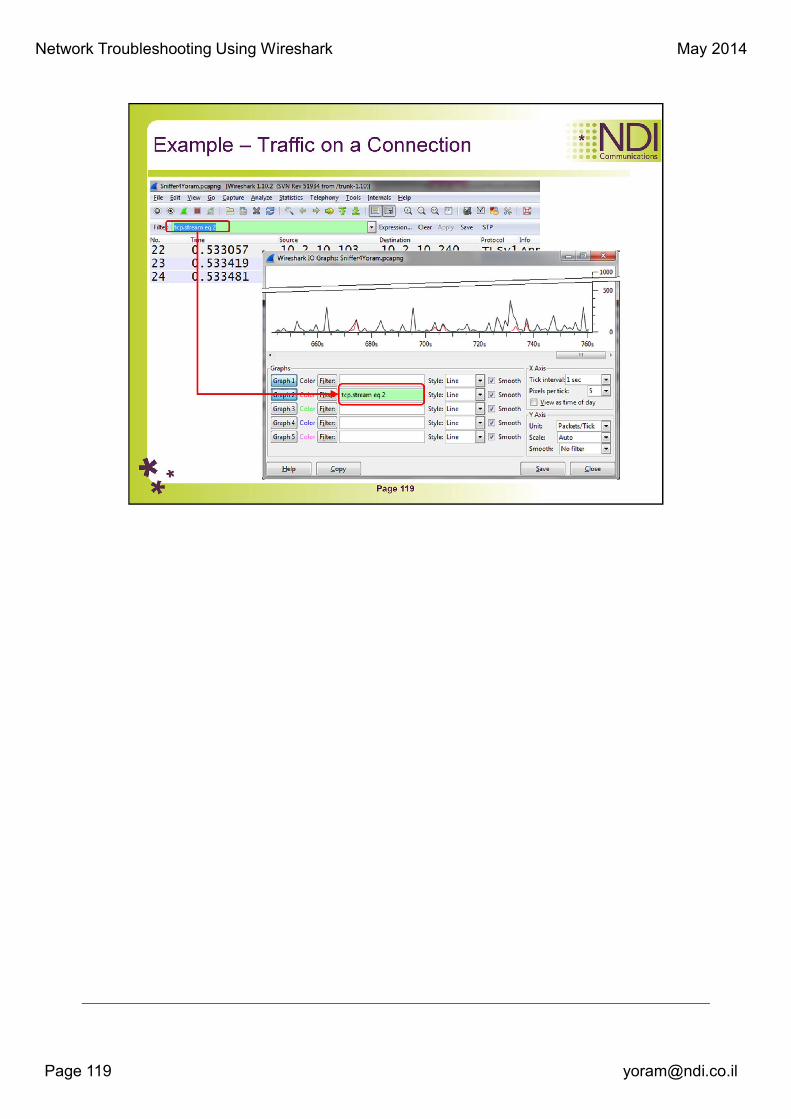
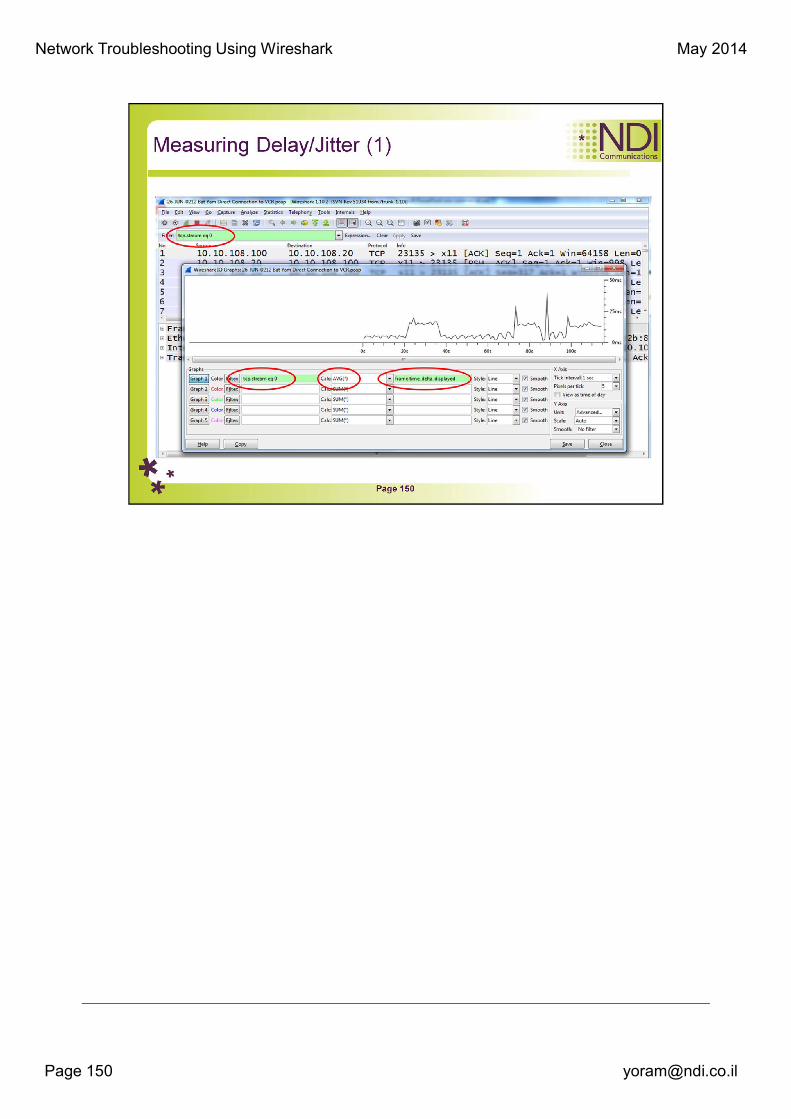
1. In the filter click on the filter tab
2. From the filter window, choose expression
3. From the expressions, choose the parameter you want to measure

Network Troubleshooting Using Wireshark May 2014
After fast retransmit sends what appears to be the missing segment,
congestion avoidance, but not slow start is performed. This is the fast
recovery algorithm. It is an improvement that allows high throughput
under moderate congestion, especially for large windows.
The reason for not performing slow start in this case is that the
receipt of the duplicate ACKs tells TCP more than just a packet has
been lost. Since the receiver can only generate the duplicate ACK
when another segment is received, that segment has left the network
and is in the receiver's buffer. That is, there is still data flowing
between the two ends, and TCP does not want to reduce the flow
abruptly by going into slow start.
The fast retransmit and fast recovery algorithms are usually
implemented together as follows.
1. When the third duplicate ACK in a row is received, set ssthresh to
one-half the current congestion window, cwnd, but no less than two
segments. Retransmit the missing segment. Set cwnd to ssthresh plus
3 times the segment size. This inflates the congestion window by the
number of segments that have left the network and which the other
end has cached .

Network Troubleshooting Using Wireshark May 2014
2. Each time another duplicate ACK arrives, increment cwnd by the
segment size. This inflates the congestion window for the additional
segment that has left the network. Transmit a packet, if allowed by
the new value of cwnd.
3. When the next ACK arrives that acknowledges new data, set cwnd
to ssthresh (the value set in step 1). This ACK should be the
acknowledgment of the retransmission from step 1, one round-trip
time after the retransmission. Additionally, this ACK should
acknowledge all the intermediate segments sent between the lost
packet and the receipt of the first duplicate ACK. This step is
congestion avoidance, since TCP is down to one-half the rate it was at
when the packet was lost.

Network Troubleshooting Using Wireshark May 2014
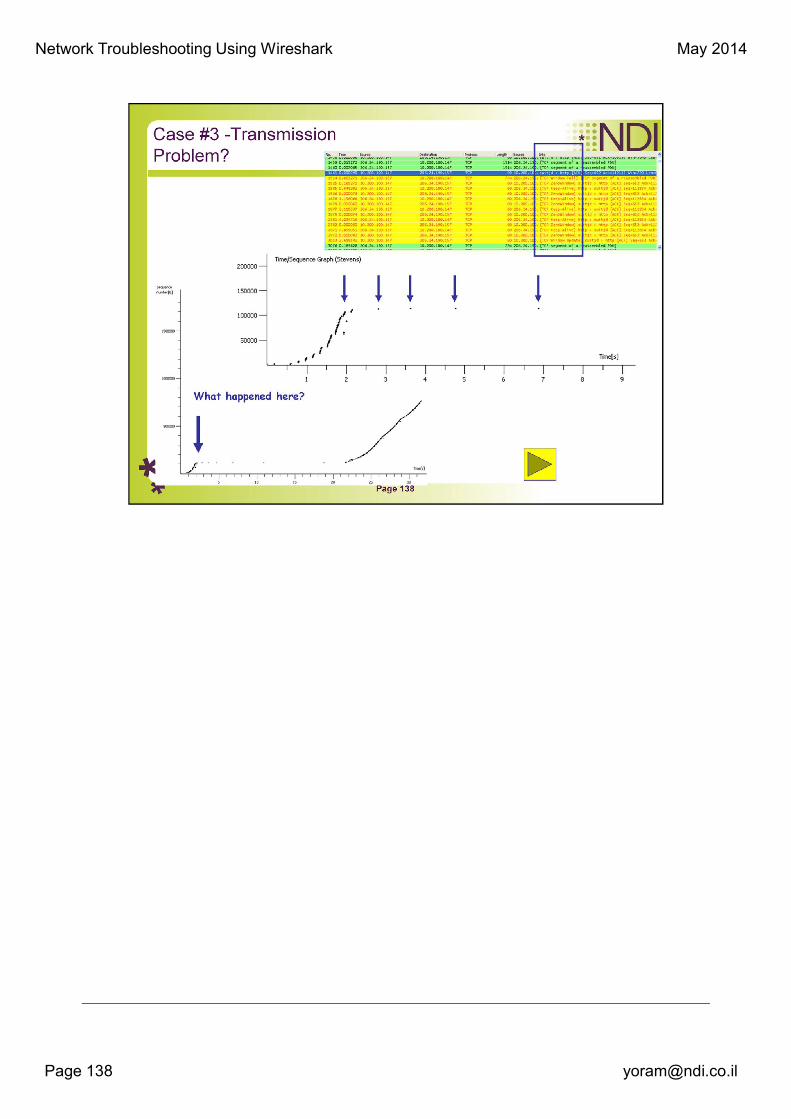
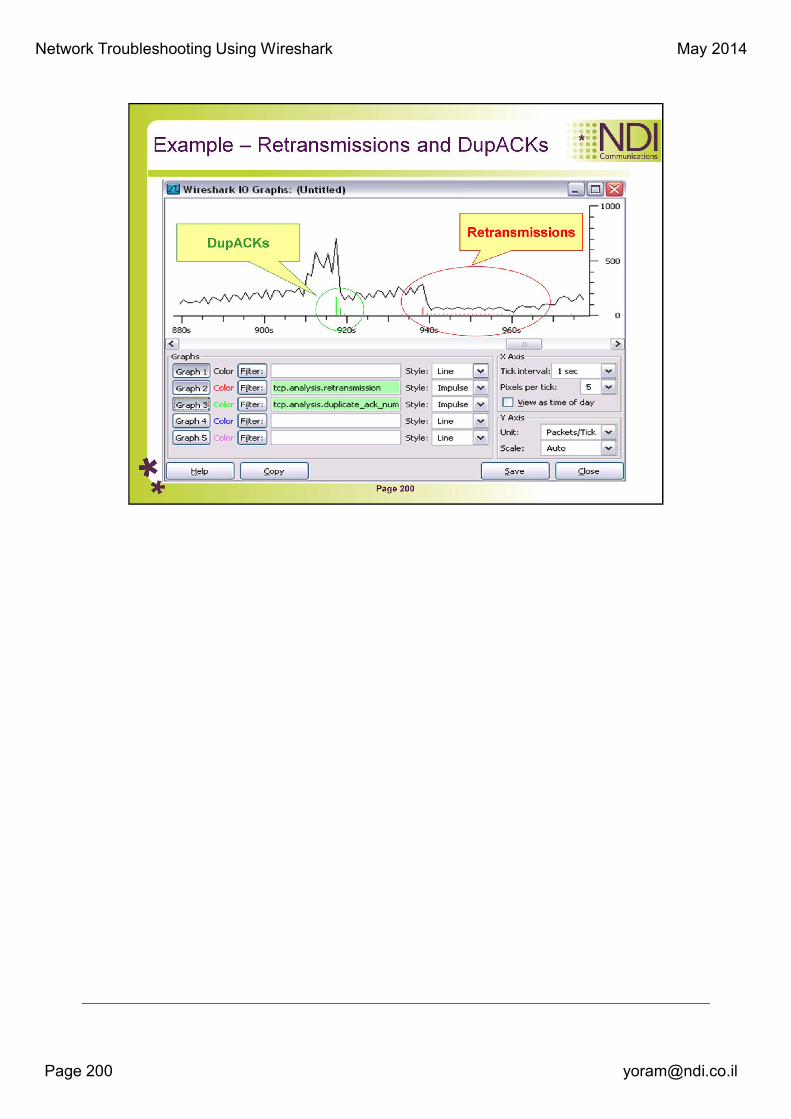
We can see from here, that a series of retransmissions reduces the
number if packet/sec to minimum, and then, a string of continues
retransmissions force it to stay so.

Network Troubleshooting Using Wireshark May 2014
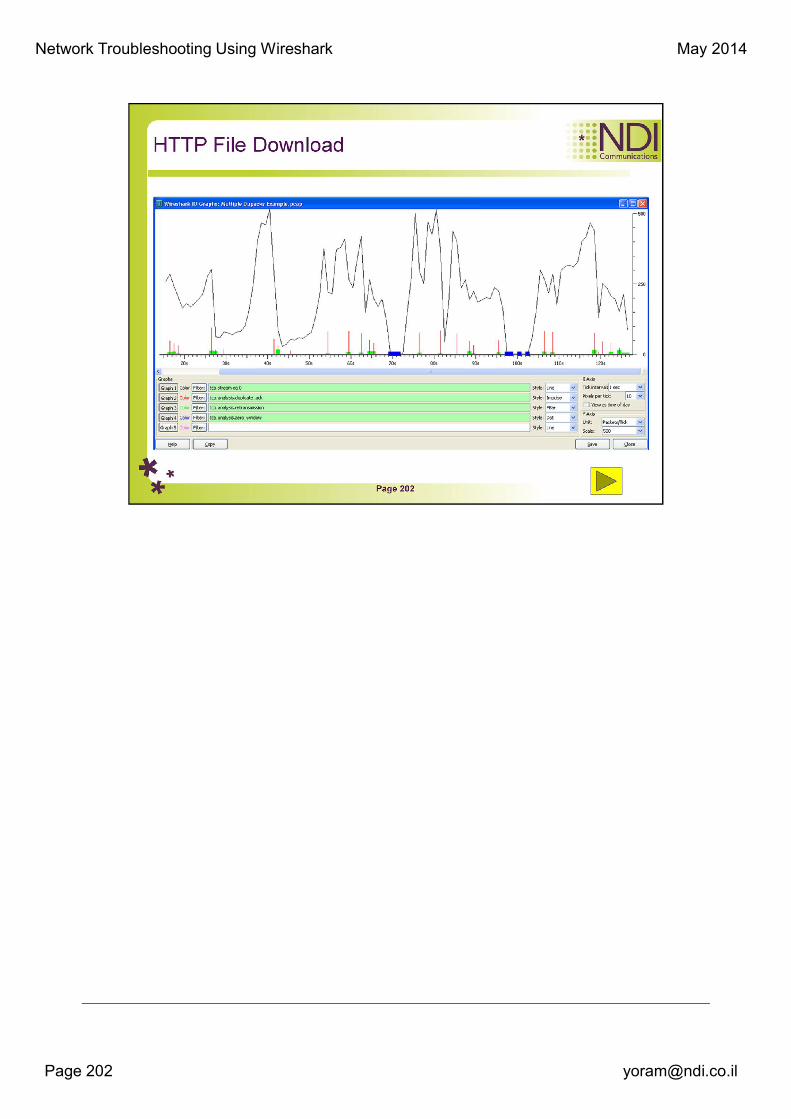
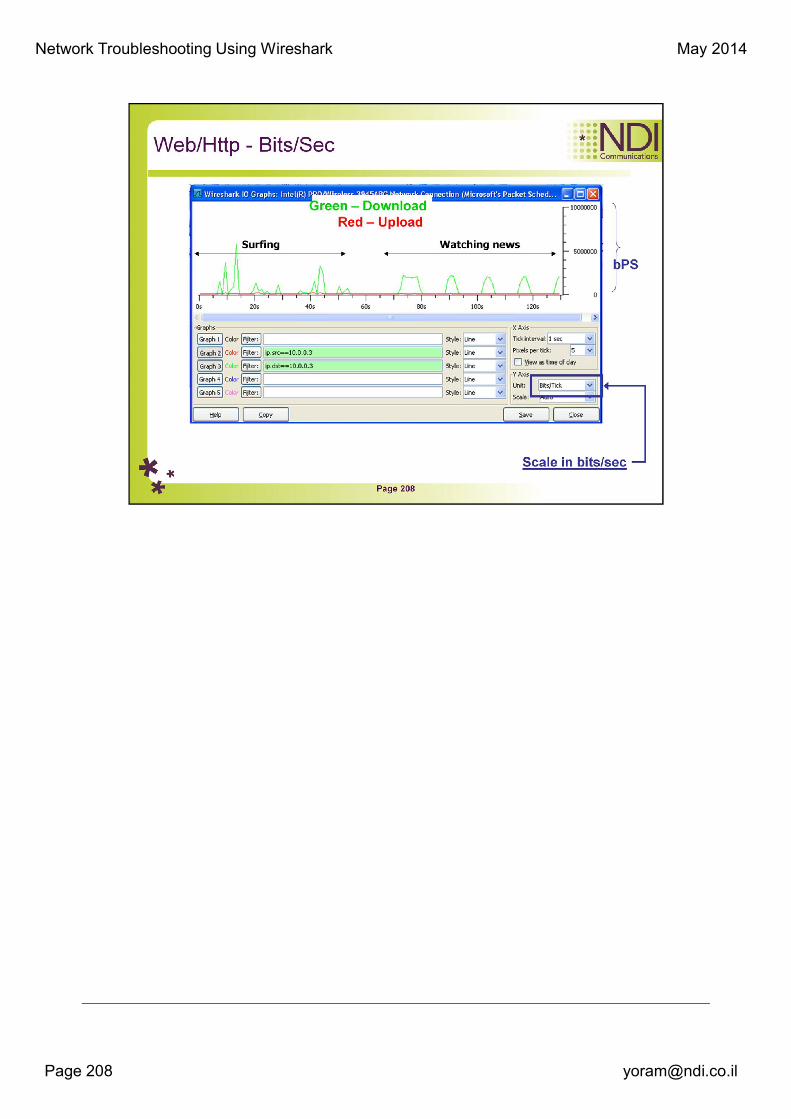
In this graph we can see:
•In black – all traffic through an interface
•In red – FTP data packets
•In green – HTTP packets


Network Troubleshooting Using Wireshark May 2014
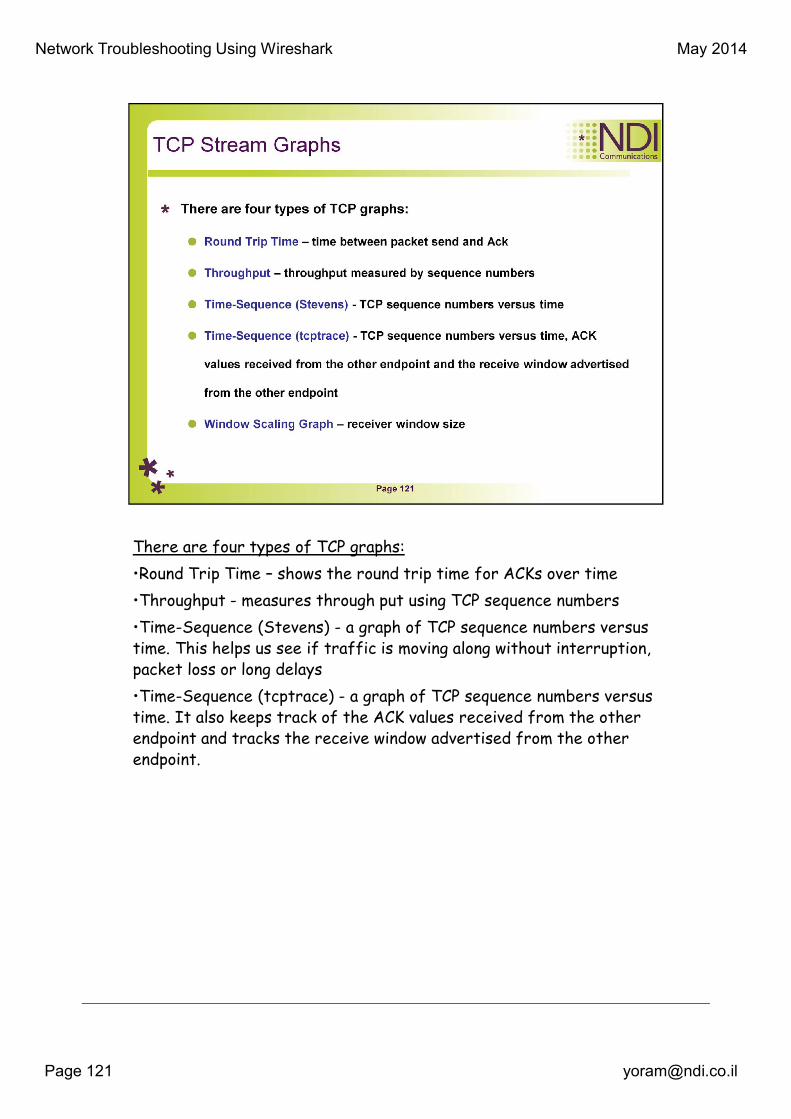
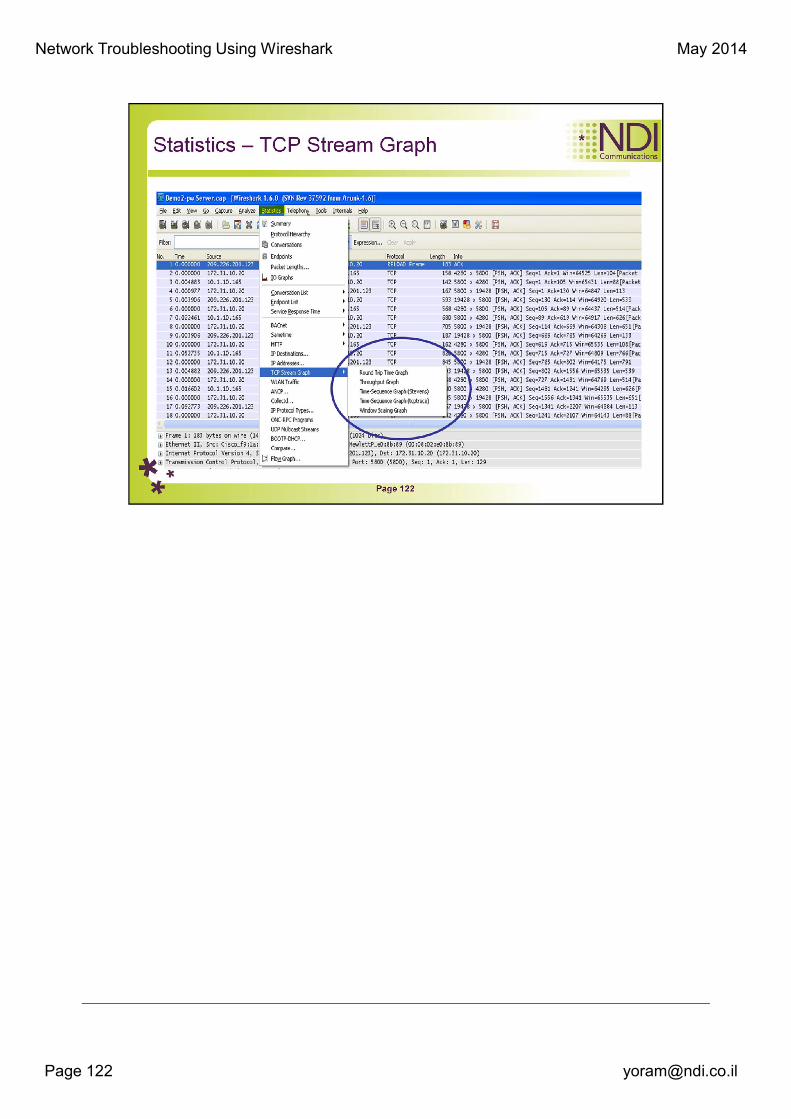
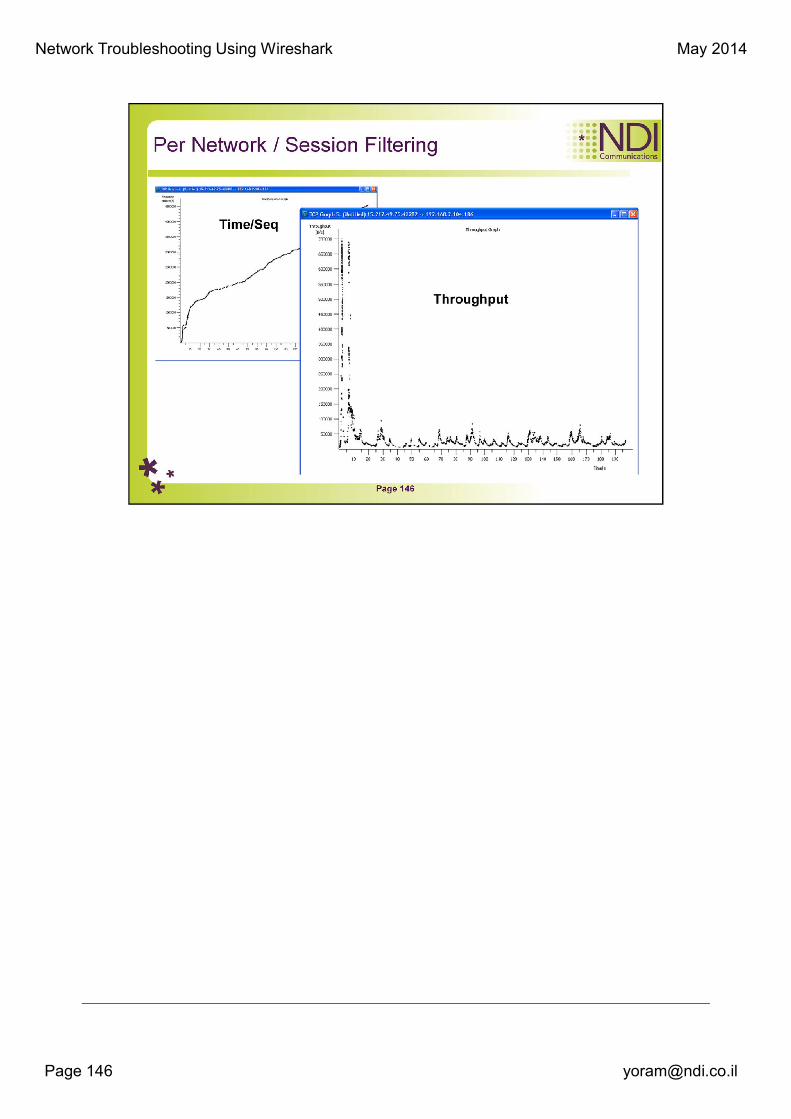
There are four types of TCP graphs:
•Round Trip Time – shows the round trip time for ACKs over time
•Throughput - measures through put using TCP sequence numbers
•Time-Sequence (Stevens) - a graph of TCP sequence numbers versus
time. This helps us see if traffic is moving along without interruption,
packet loss or long delays
•Time-Sequence (tcptrace) - a graph of TCP sequence numbers versus
time. It also keeps track of the ACK values received from the other
endpoint and tracks the receive window advertised from the other
endpoint.

Network Troubleshooting Using Wireshark May 2014
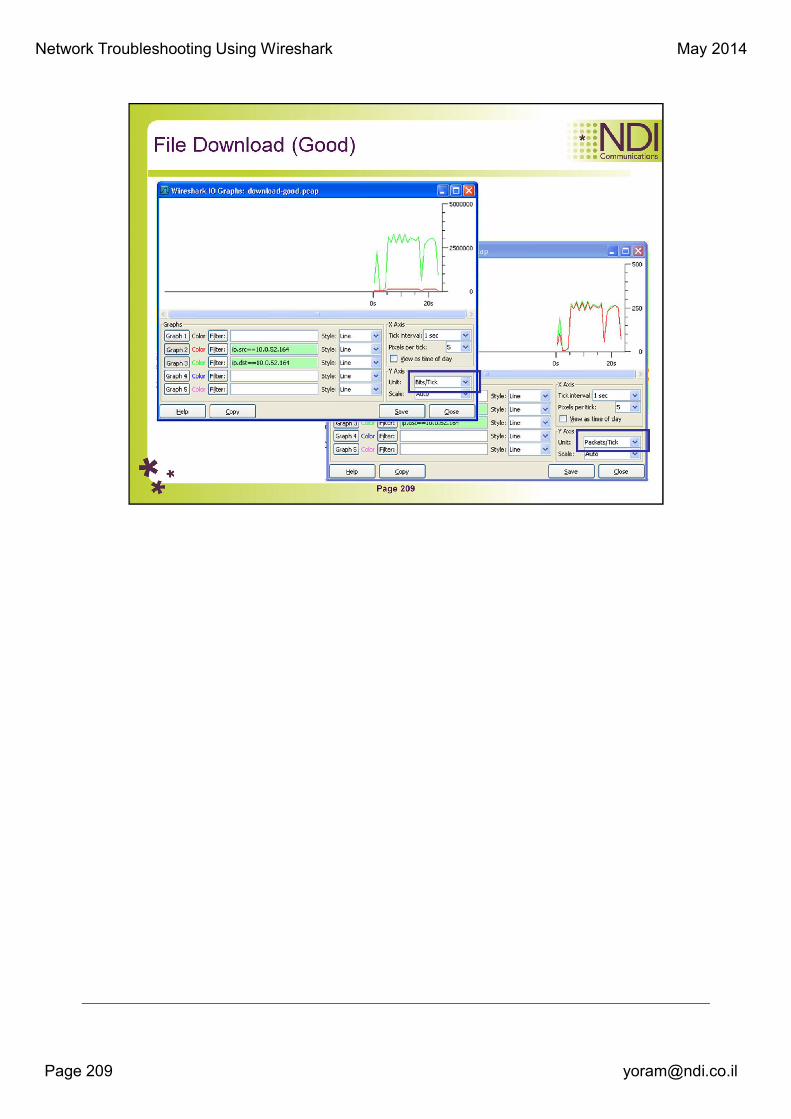
• Time / Sequence representes how sequence numbers advances with
time
• In a good connection (like in the example), the line will be linear
• The angle of the line indicates the speed of the connection. In this
example – fast connection
Network Troubleshooting Using Wireshark May 2014
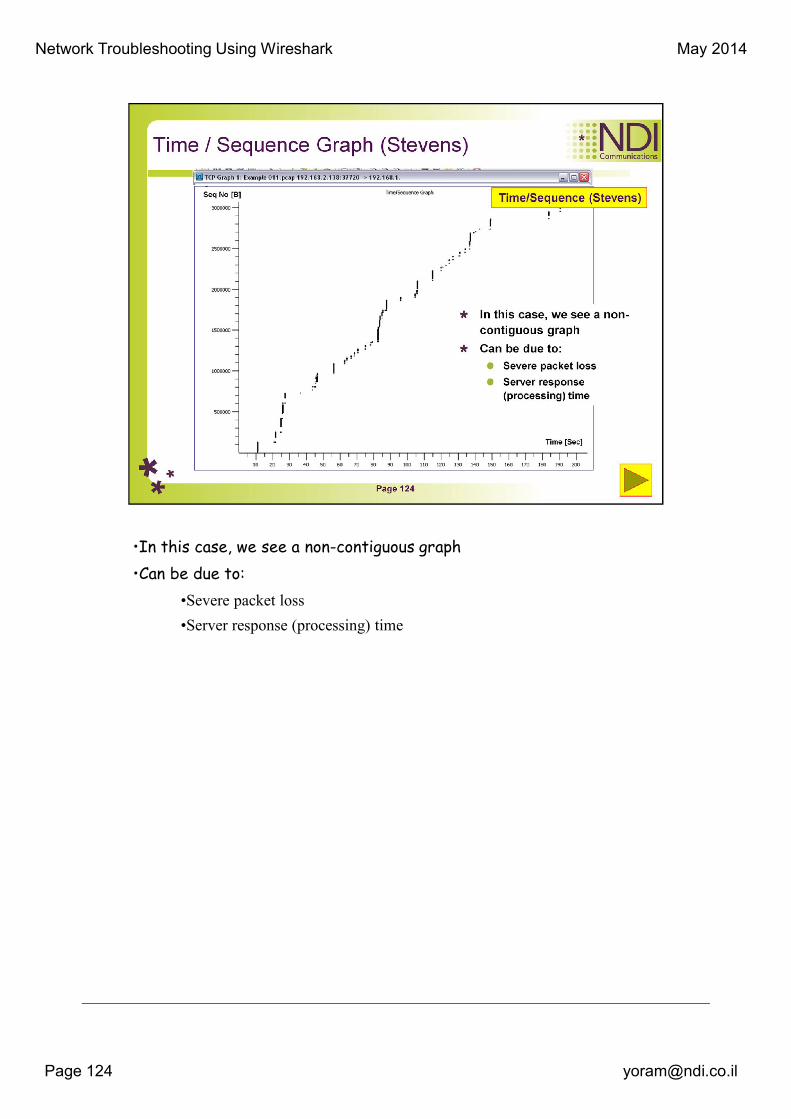
•In this case, we see a non-contiguous graph
•Can be due to:
•Severe packet loss
•Server response (processing) time
Network Troubleshooting Using Wireshark May 2014
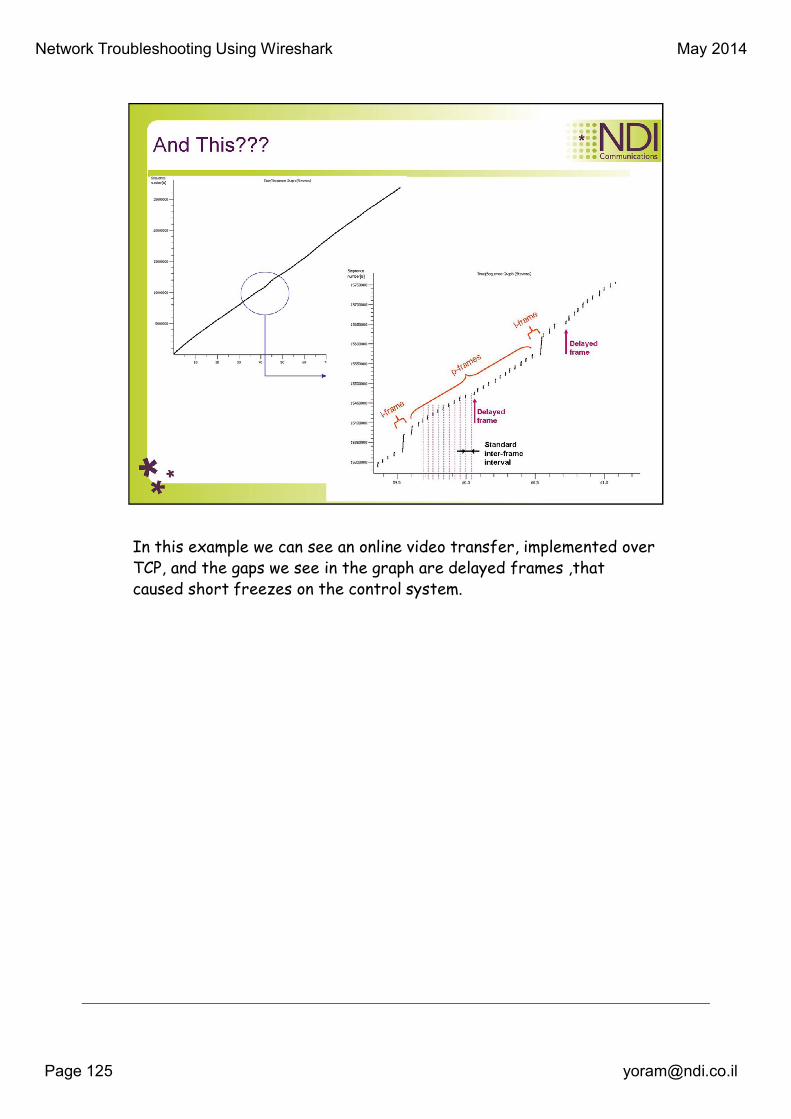
In this example we can see an online video transfer, implemented over
TCP, and the gaps we see in the graph are delayed frames ,that
caused short freezes on the control system.

Network Troubleshooting Using Wireshark May 2014
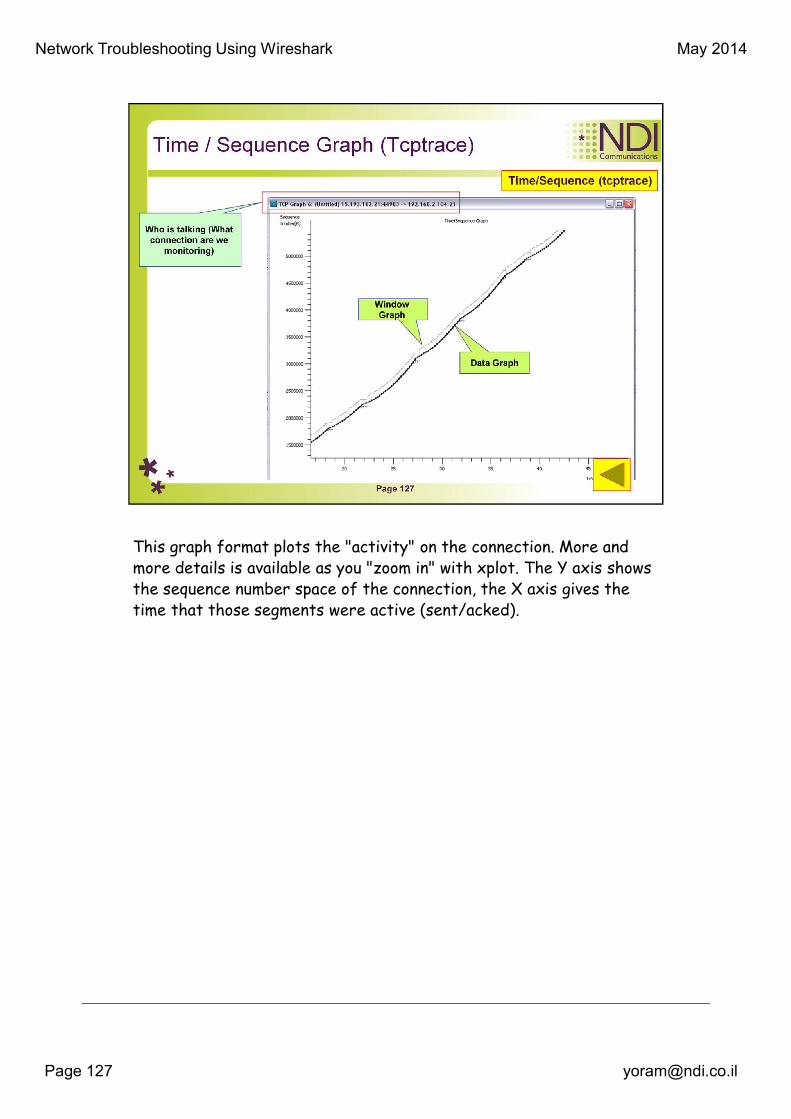
This graph format plots the "activity" on the connection. More and
more details is available as you "zoom in" with xplot. The Y axis shows
the sequence number space of the connection, the X axis gives the
time that those segments were active (sent/acked).
Network Troubleshooting Using Wireshark May 2014
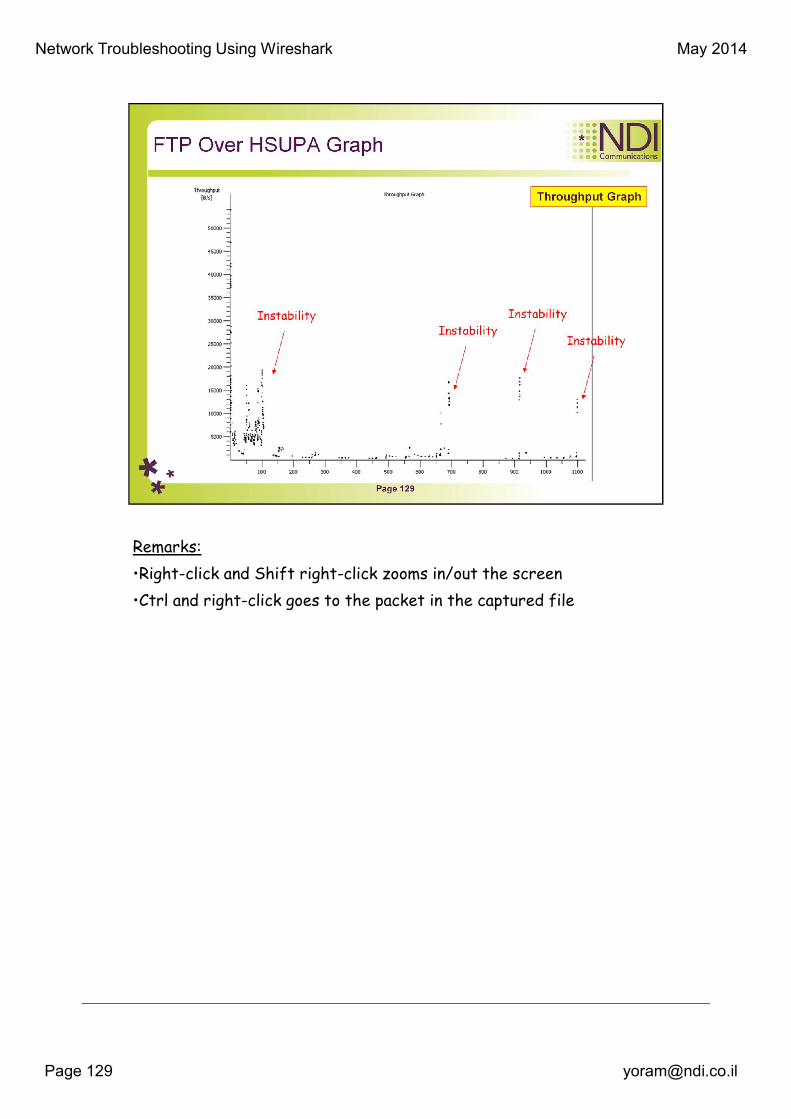
Remarks:
•Right-click and Shift right-click zooms in/out the screen
•Ctrl and right-click goes to the packet in the captured file

Network Troubleshooting Using Wireshark May 2014
Something happened here (After ~5.25 Seconds). What can it be?

Network Troubleshooting Using Wireshark May 2014
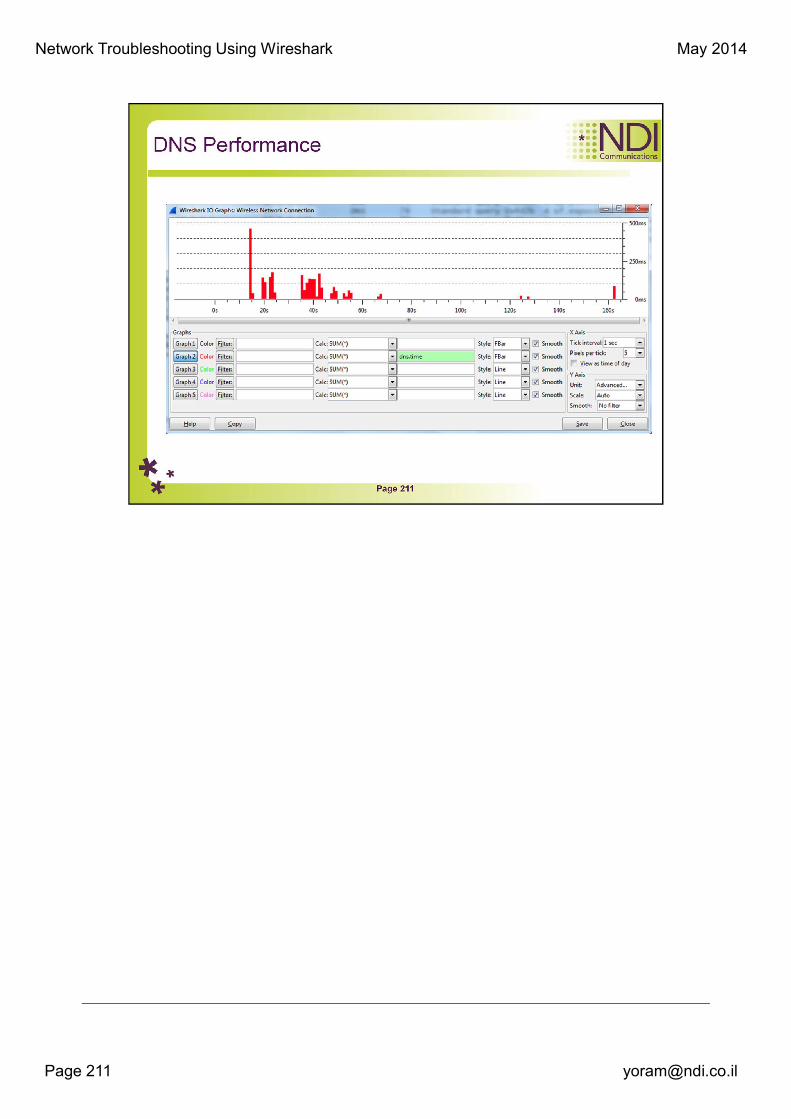
Another graphing feature of Wireshark is the ability to view a plot of roundtrip
times for a given capture file. The round-trip time (RTT) is the time it takes for an
acknowledgment to be received for a packet. Effectively, this is the time it took
your packet to get to its destination and for the acknowledgment of that packet to
be sent back to you. Analysis of RTTs is often done to find slow points or
bottlenecks in communication and to determine if there is any latency.
•RTT Vs. Sequence numbers gives us the time that take to Ack every packet.
•In case of variations, it can cause DUPACKs and even Retransmissions
•Usually will happen on communications lines:
•Over the Internet
•Over cellular networks
Each point in the graph represents the RTT of a packet. The default view shows
these values sorted by sequence number. You can click a plotted point within the
graph to be taken directly to that packet in the Packet List pane. It appears as
though the RTT graph for the fast download has RTT values mostly under 0.05
seconds, with a few slower points between 0.10 and 0.25 seconds. Although there
are quite a few values above acceptable limits, the majority of the RTT values are

Network Troubleshooting Using Wireshark May 2014
okay, so this would be considered an acceptable RTT for a file download.


Network Troubleshooting Using Wireshark May 2014
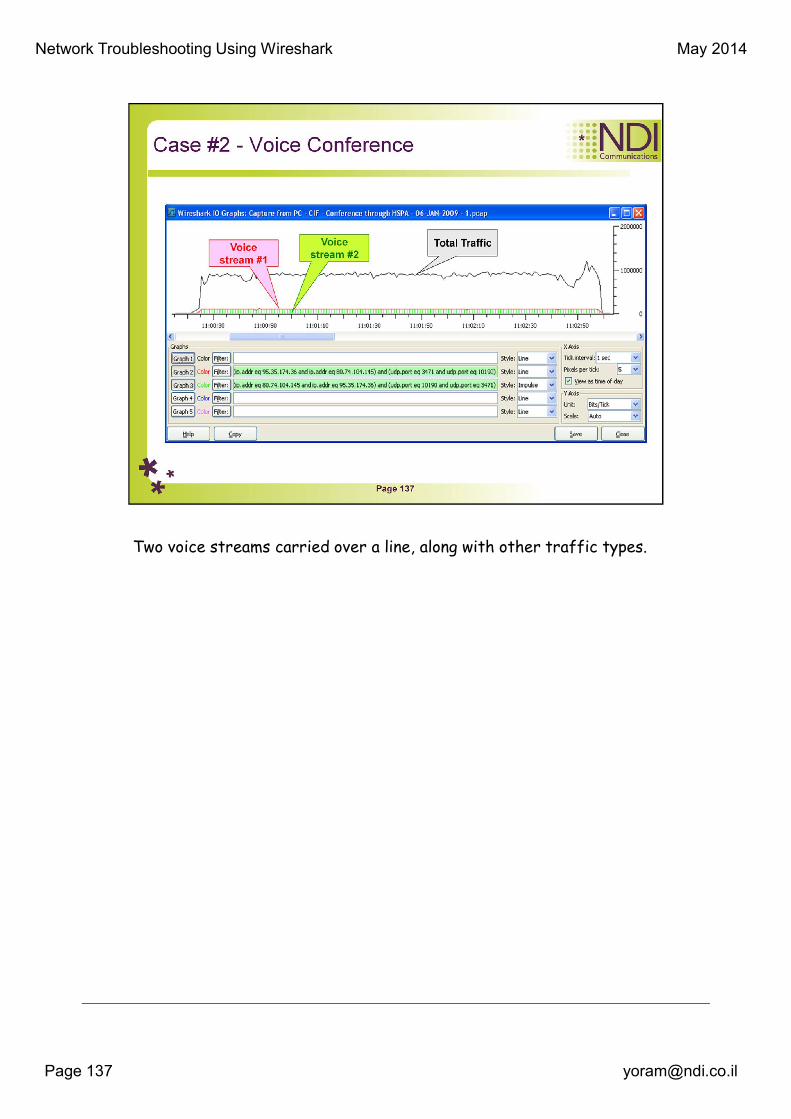
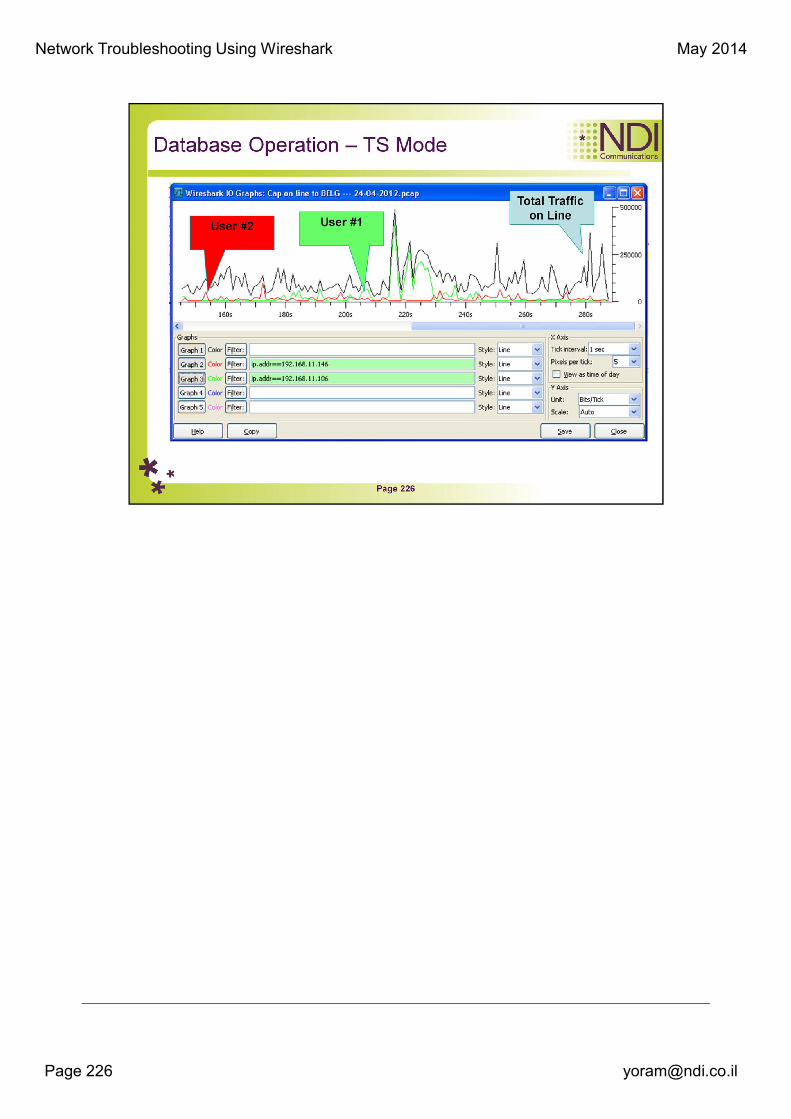
Two voice streams carried over a line, along with other traffic types.

Network Troubleshooting Using Wireshark May 2014
We’ve learned about:
1. Capturing data
2. Watch protocol behavior over a network
3. Packet colorization
4. Statistics and statistical tools
Network Troubleshooting Using Wireshark May 2014
© All Rights Reserved to NDI Communications ©


Network Troubleshooting Using Wireshark May 2014
We’ve learned about:
1. Capturing data
2. Watch protocol behavior over a network
3. Packet colorization
4. Statistics and statistical tools

Network Troubleshooting Using Wireshark May 2014
© All Rights Reserved to NDI Communications ©


Network Troubleshooting Using Wireshark May 2014
© All Rights Reserved to NDI Communications ©


Network Troubleshooting Using Wireshark May 2014
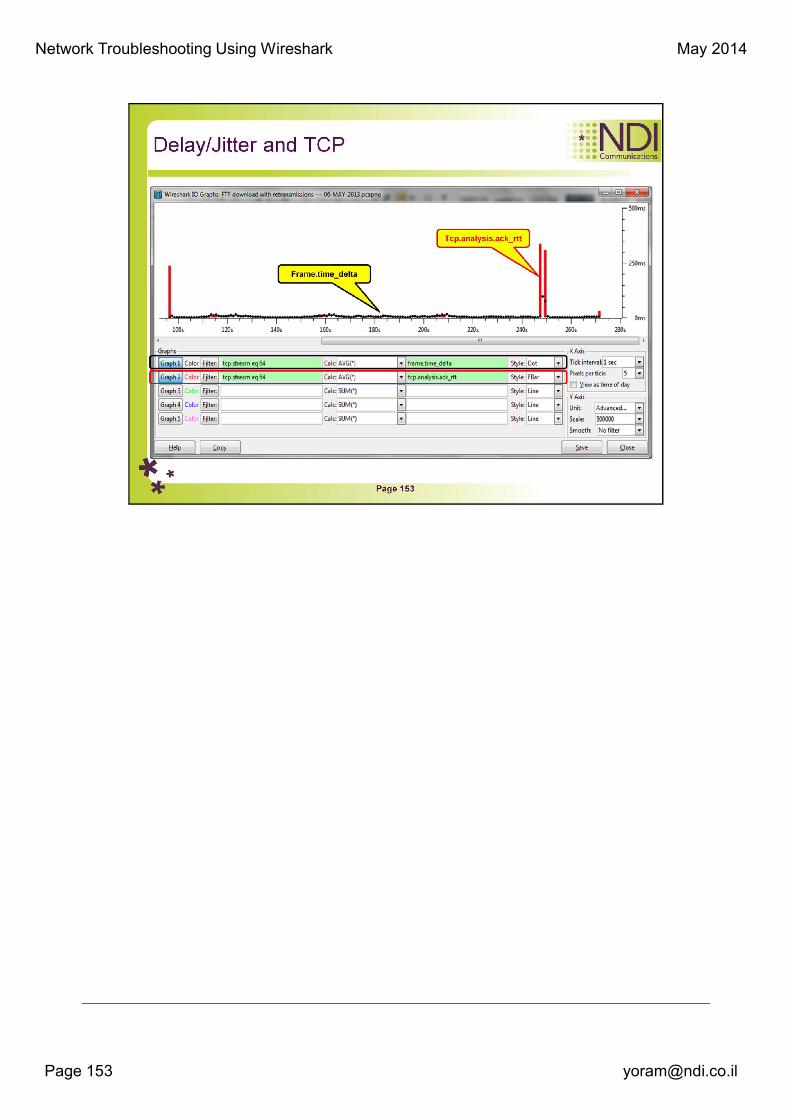
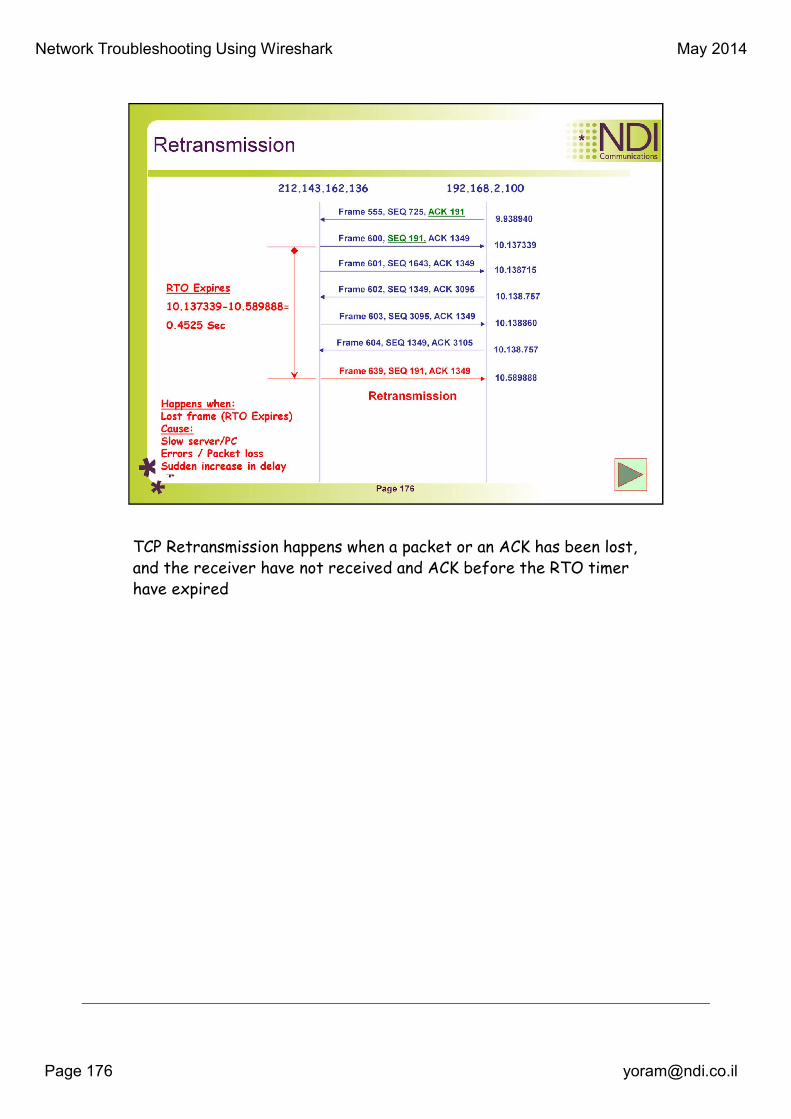
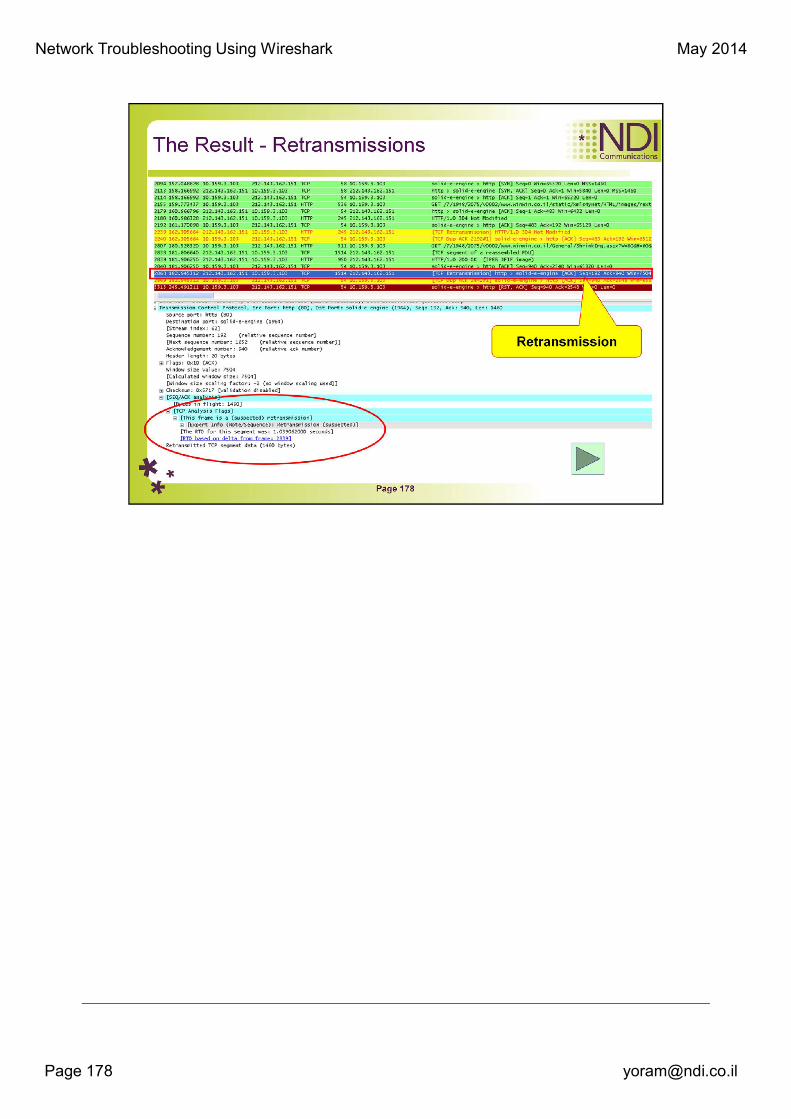
TCP Retransmission happens when a packet or an ACK has been lost,
and the receiver have not received and ACK before the RTO timer
have expired
Network Troubleshooting Using Wireshark May 2014
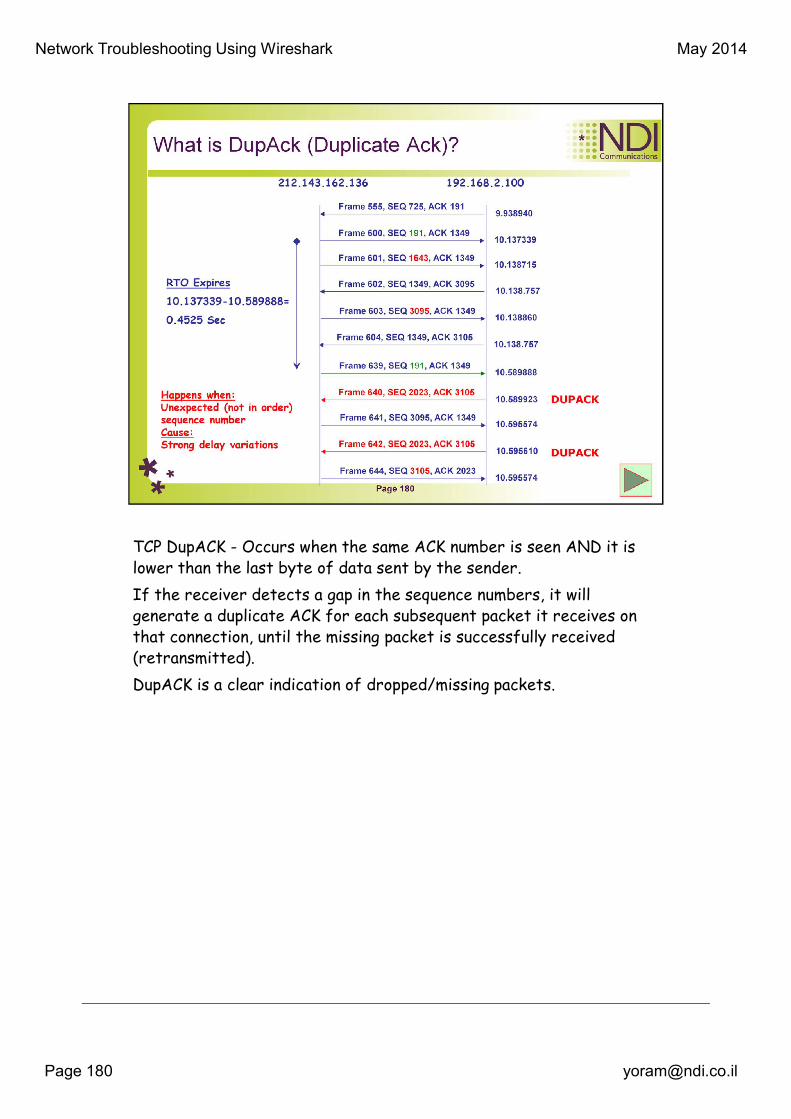
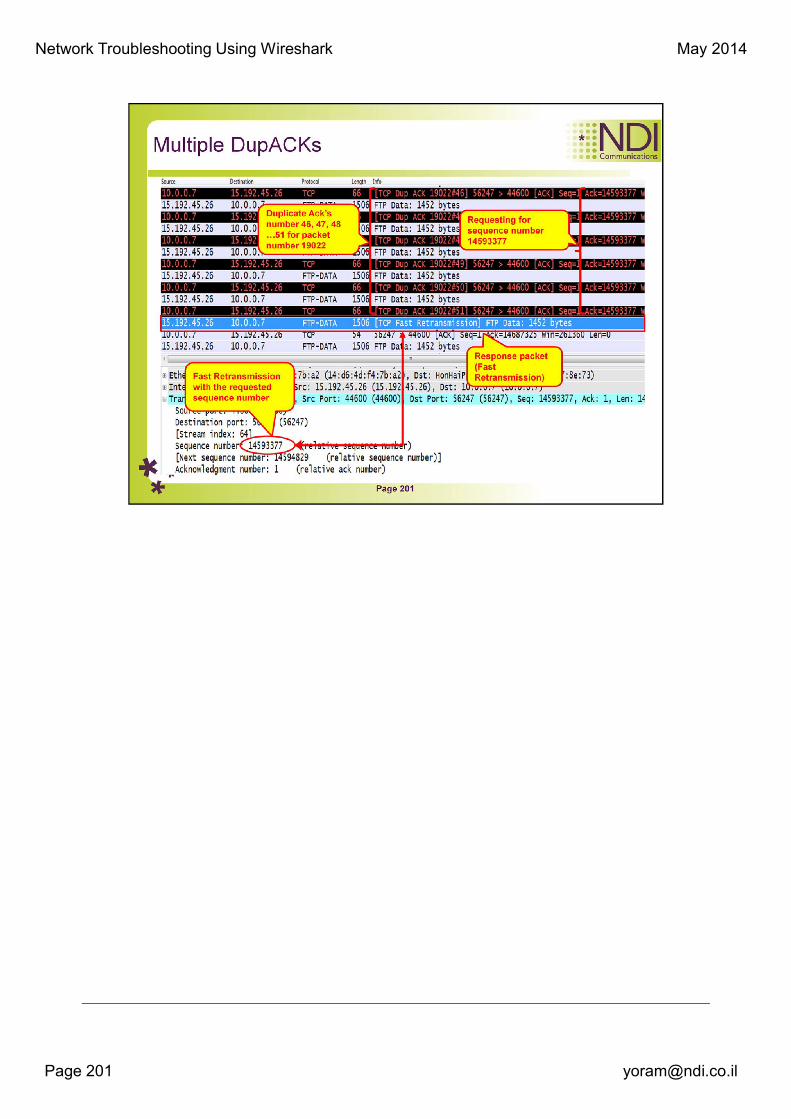
TCP DupACK - Occurs when the same ACK number is seen AND it is
lower than the last byte of data sent by the sender.
If the receiver detects a gap in the sequence numbers, it will
generate a duplicate ACK for each subsequent packet it receives on
that connection, until the missing packet is successfully received
(retransmitted).
DupACK is a clear indication of dropped/missing packets.
Network Troubleshooting Using Wireshark May 2014
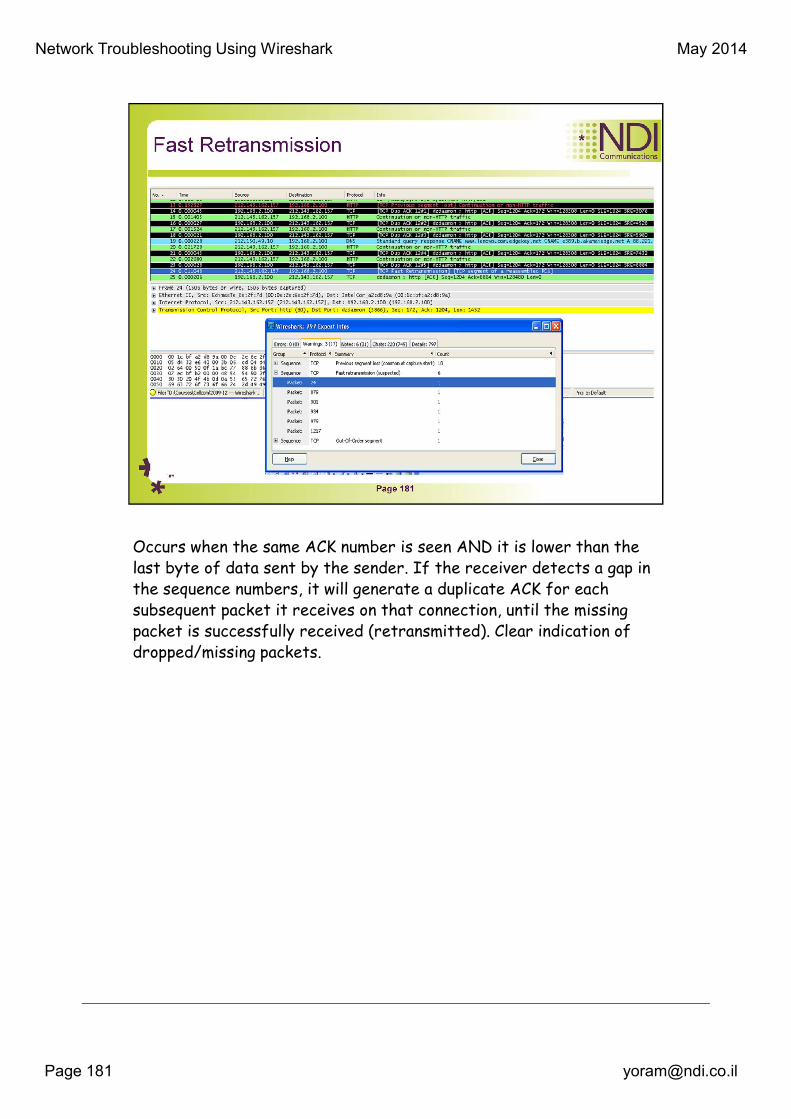
Occurs when the same ACK number is seen AND it is lower than the
last byte of data sent by the sender. If the receiver detects a gap in
the sequence numbers, it will generate a duplicate ACK for each
subsequent packet it receives on that connection, until the missing
packet is successfully received (retransmitted). Clear indication of
dropped/missing packets.


Network Troubleshooting Using Wireshark May 2014
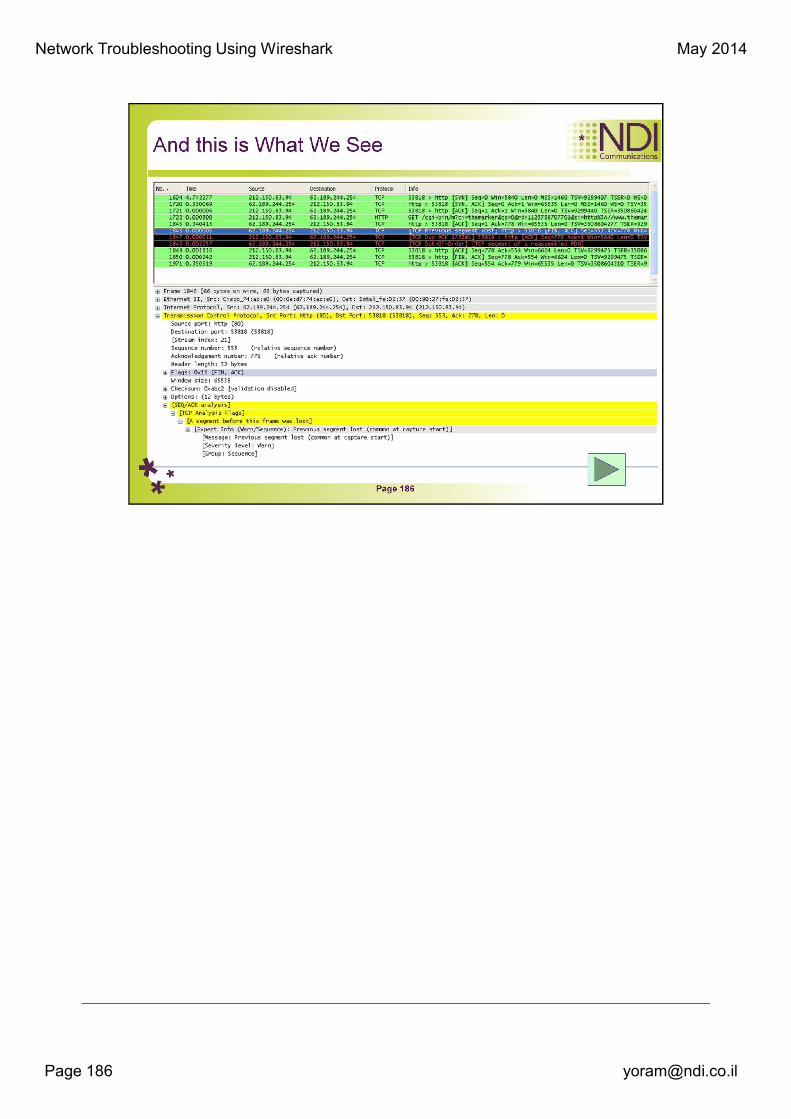
TCP Previous segment lost - Occurs when a packet arrives with a
sequence number greater than the "next expected sequence number"
on that connection, indicating that one or more packets prior to the
flagged packet did not arrive. This event is a good indicator of packet
loss and will likely be accompanied by "TCP Retransmission" events.

Network Troubleshooting Using Wireshark May 2014
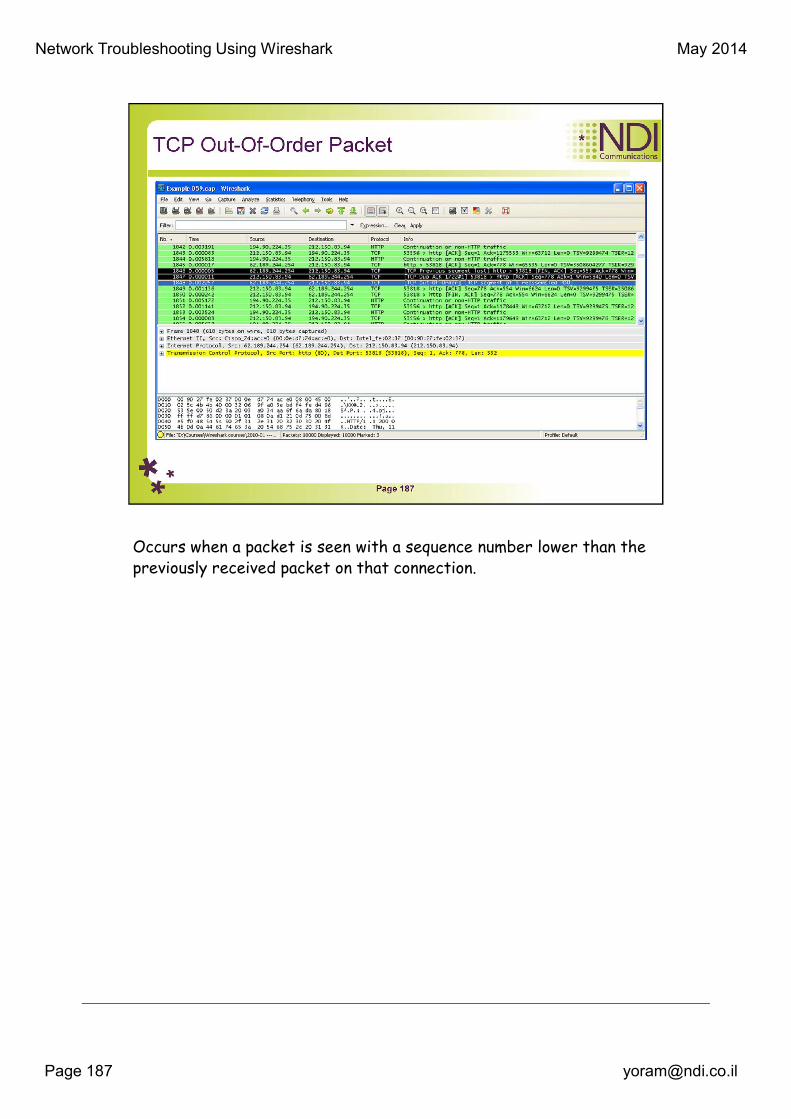
Occurs when a packet is seen with a sequence number lower than the
previously received packet on that connection.

Network Troubleshooting Using Wireshark May 2014
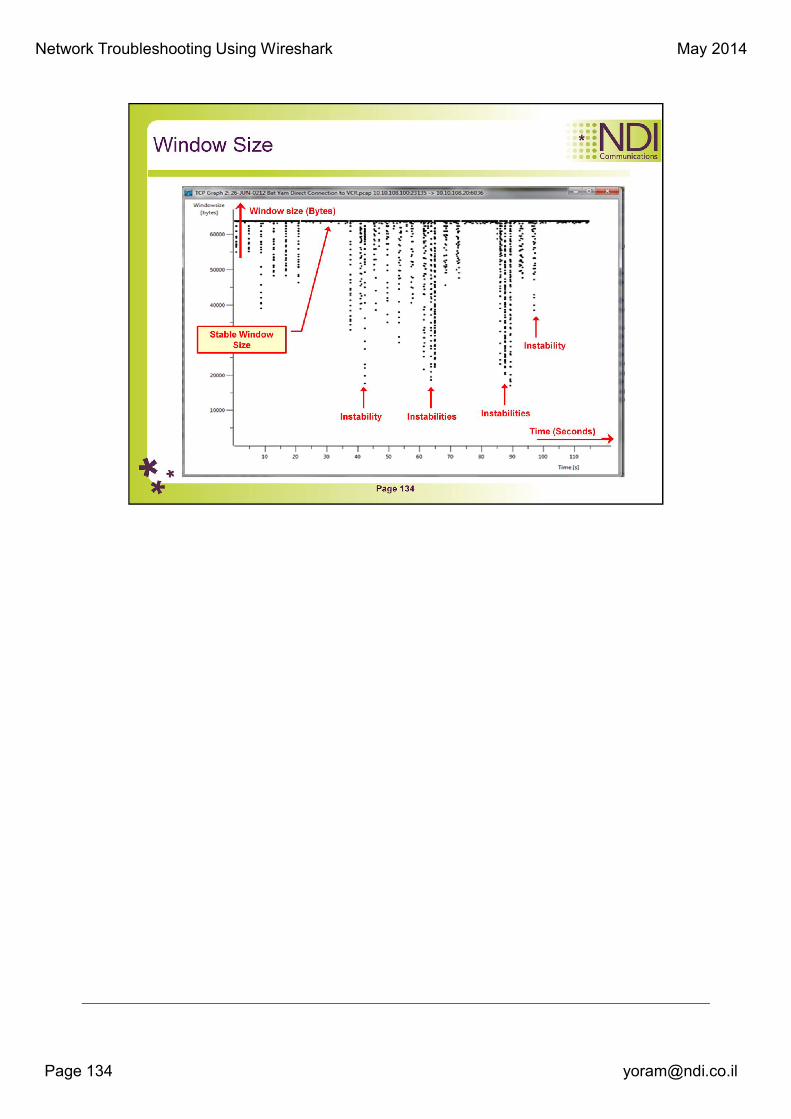
Sliding Window is the method of flow control TCP uses. The algorithm basically places a buffer between the application and the network data flow. The purpose of sliding window is to prevent from the sender to send too many packets to over flow the network resource or the receiver's buffer. The "sliding window size" is the maximum amount of data we can send without having to wait for ACK. TCP achieve the flow control by using the sliding Window algorithm which takes into consideration 2 important parameters. The first one is the receiver advertised window size which basically tells the sender what is the current buffer of TCP receiver, the second parameter is congestion window which control the number of packets a TCP flow may have in the network in any given time.
The Receiver Advertised Window (adwn) is the buffer size sent in each ACK from TCP receiver to TCP sender. The TCP header uses a 16 bit field to report the receive window size to the sender. Therefore, the largest window that can be used is 2^16=65k bytes.
Congestion Window (cwnd) controls the number of packets a TCP flow may have in the network in any given time. cwnd is dynamically adapting to changing network condition Slow-start is one of the algorithms that TCP uses in its quest to control congestion inside the network and it is also known as the exponential growth phase. Slow-start works by increasing the TCP congestion window each time the ACK is received. it increases the window size by the number segments acknowledged. If a loss event occurs, TCP assume this is due to network congestion and takes step to reduce the offered load on the network.

Network Troubleshooting Using Wireshark May 2014
When TCP reaches a certain threshold (also known as sstrsesh) it will enter the linear growth, Congestion avoidance. in our sliding window demo the threshold is fixed on 10. At this point, the window is increased by segmentSize*segmentsize/cwnd for each receiving ACK. Sliding Window Operation First, the sender creates a sequence number for each frame as it is transmitted. Throughout the communication, it maintains the send window size, the last acknowledgment received, and the last frame sent. To ensure that the window does not overflow, the sender ensures that the window size is greater than the sequence number of last frame sent minus the sequence number last acknowledgment received. When the sender transmits a frame, it increments the sequence number by one and starts a timer. The sequence number is sent with the frame so that the receiver can detect if a frame is received out of order. The sender continues sending frames until the buffer of unacknowledged frames is as large as the send window size.The sender then waits until it receives acknowledgments before transmitting more frames.
Whenever the sender receives an acknowledgment from the receiver, it increments the value of the last acknowledgment received, thereby sliding the "sliding window" to the right. If the timer for the frame expires before the sender receives an acknowledgment for the frame, it assumes that the frame was lost and retransmits it. The receiver holds onto three pieces of information as well: the receive window size, the last frame received, and the next frame to acknowledge. When a frame arrives, the receiver evaluates the frame to determine if it falls within the receiver's window. The size of the receiver's window is determined by the number of frames the receiver can buffer before overflowing. The receiver can not process frames received out of order. A frame is out of order if a gap exists between the sequence numbers of the newly received frame and that of the last frame received. If a frame is received with a sequence number that results in a gap larger than the size of the receiver's window, the frame is determined to be outside the window and is discarded. If a frame is received with a sequence number that is lower than or equal to that of the last frame received, this frame is by definition outside the window and must be a duplicate. It is also discarded. Packets with sequence numbers that fall within the window are accepted and put into the buffer. After accepting the frame, the receiver again checks the sequence number to determine if the frame was received in the correct order. The receiver compares the incoming frame's sequence number to next frame to acknowledge sequence number. If they match the receiver sends an acknowledgment. The next frame to acknowledge and last frame received are both incremented, thus sliding the window along.
Network Troubleshooting Using Wireshark May 2014
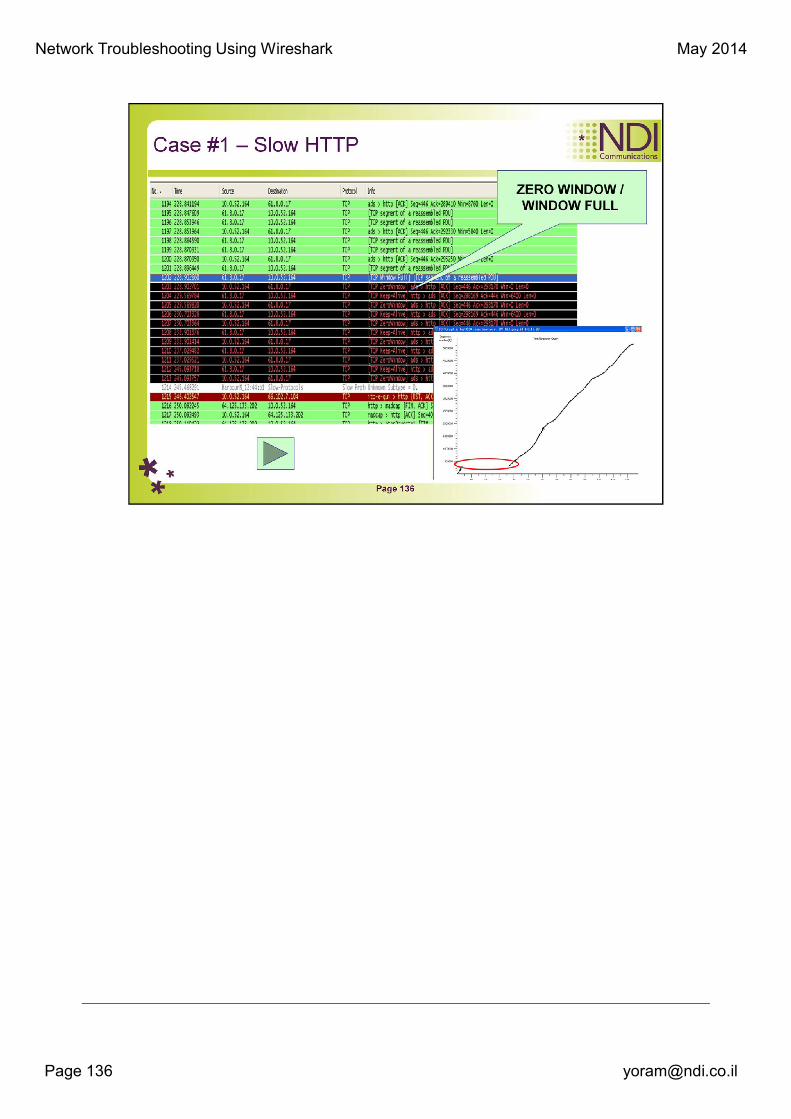
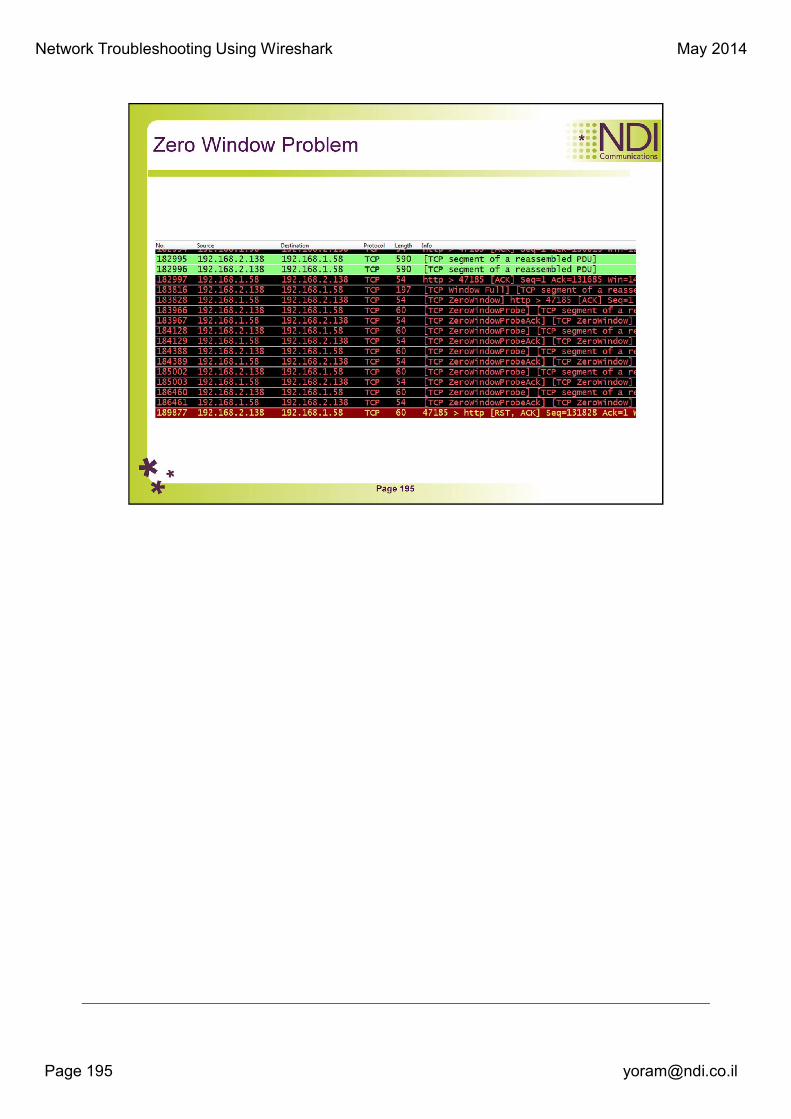
TCP ZeroWindow - Occurs when a receiver advertises a receive window size of zero. This effectively tells the sender to stop sending because the receiver's buffer is full. Indicates a resource issue on the receiver, as the application is not retrieving data from the TCP buffer in a timely manner.
TCP ZerowindowProbe - The sender is testing to see if the receiver's zero window condition still exists by sending the next byte of data to elicit an ACK from the receiver. If the window is still zero, the sender will double his timer before probing again.
TCP ZeroWindowViolation - The sender has ignored the zero window condition of the receiver and sent additional bytes of data.
TCP WindowUpdate - This indicates that the segment was a pure WindowUpdate segment. A WindowUpdate occurs when the application on the receiving side has consumed already received data from the RX buffer causing the TCP layer to send a WindowUpdate to the other side to indicate that there is now more space available in the buffer. Typically seen after a TCP ZeroWindow condition has occurred. Once the application on the receiver retrieves data from the TCP buffer, thereby freeing up space, the receiver should notify the sender that the TCP ZeroWindow condition no longer exists by sending a TCP

Network Troubleshooting Using Wireshark May 2014
WindowUpdate that advertises the current window size.
Network Troubleshooting Using Wireshark May 2014
TCP WindowFull - This flag is set on segments where the payload data
in the segment will completely fill the RX buffer on the host on the
other side of the TCP session. The sender, knowing that it has sent
enough data to fill the last known RX window size, must now stop
sending until at least some of the data is acknowledged (or until the
acknowledgement timer for the oldest unacknowledged packet
expires). This causes delays in the flow of data between sender and
receiver and lowers throughput. When this event occurs, a
ZeroWindow condition might occur on the other host and we might see
TCP ZeroWindow segments coming back. Do note that this can occur
even if no ZeroWindow condition is ever triggered. For example, if the
TCP WindowSize is too small to accomodate a high end-to-end latency
this will be indicated by TCP WindowFull and in that case there will
not be any TCP ZeroWindow indications at all. --- This should be
broken out to its own page with a more detailed explanation.
Network Troubleshooting Using Wireshark May 2014
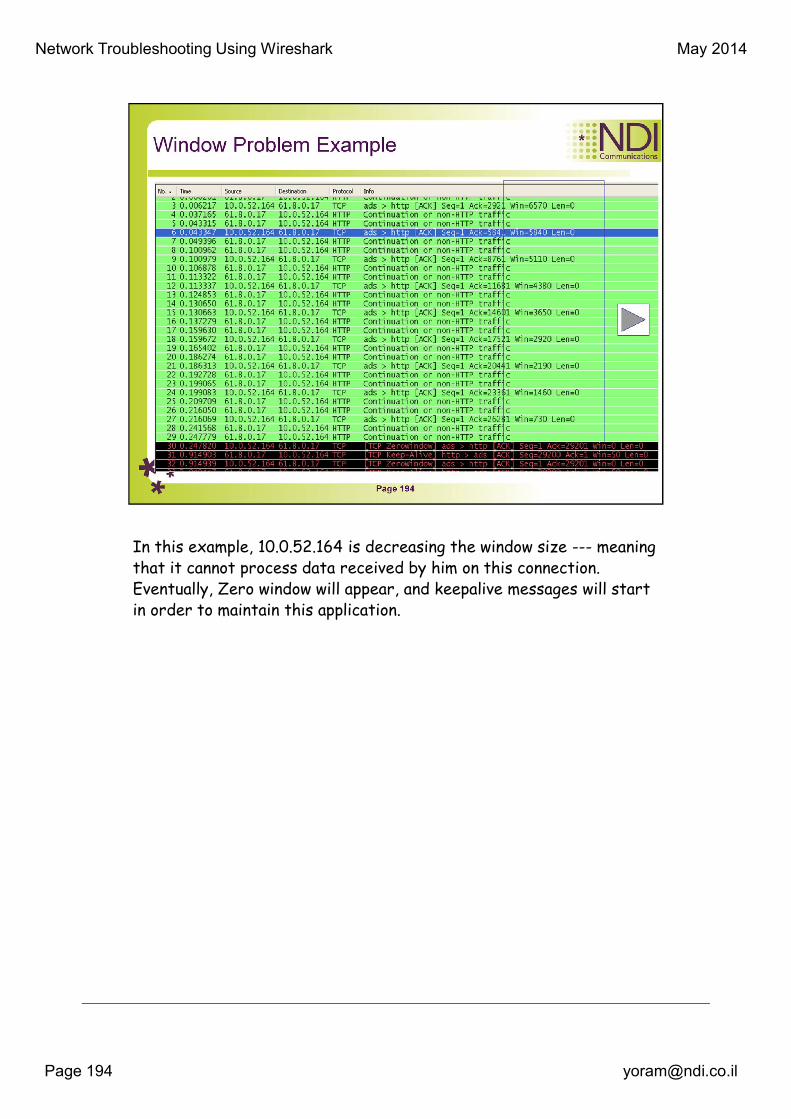
In this example, 10.0.52.164 is decreasing the window size --- meaning
that it cannot process data received by him on this connection.
Eventually, Zero window will appear, and keepalive messages will start
in order to maintain this application.


Network Troubleshooting Using Wireshark May 2014
© All Rights Reserved to NDI Communications ©


Network Troubleshooting Using Wireshark May 2014
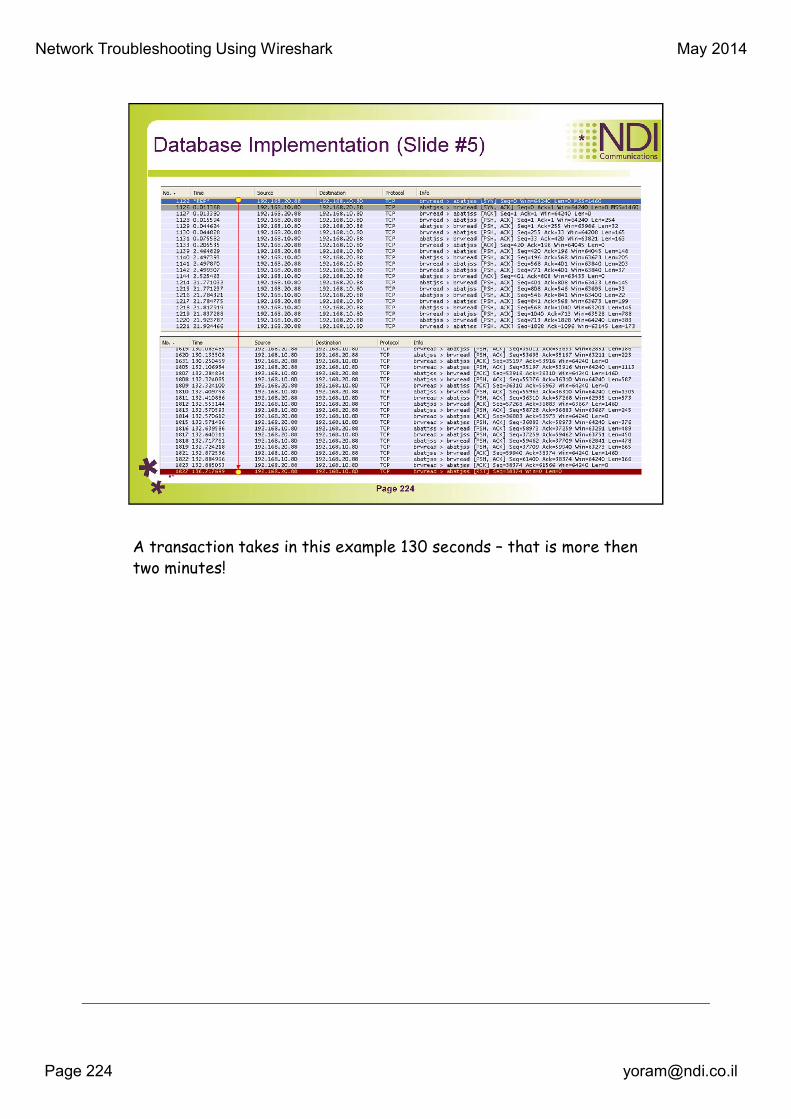
A transaction takes in this example 130 seconds – that is more then
two minutes!


Network Troubleshooting Using Wireshark May 2014
© All Rights Reserved to NDI Communications ©


Network Troubleshooting Using Wireshark May 2014
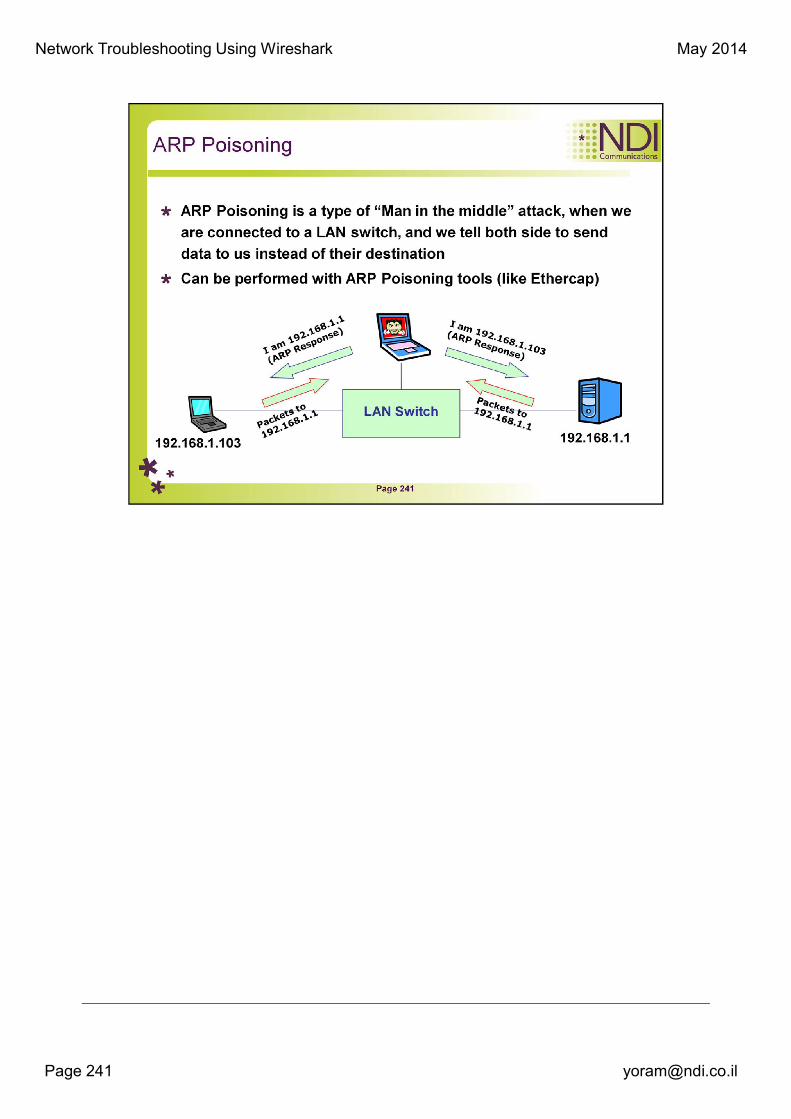
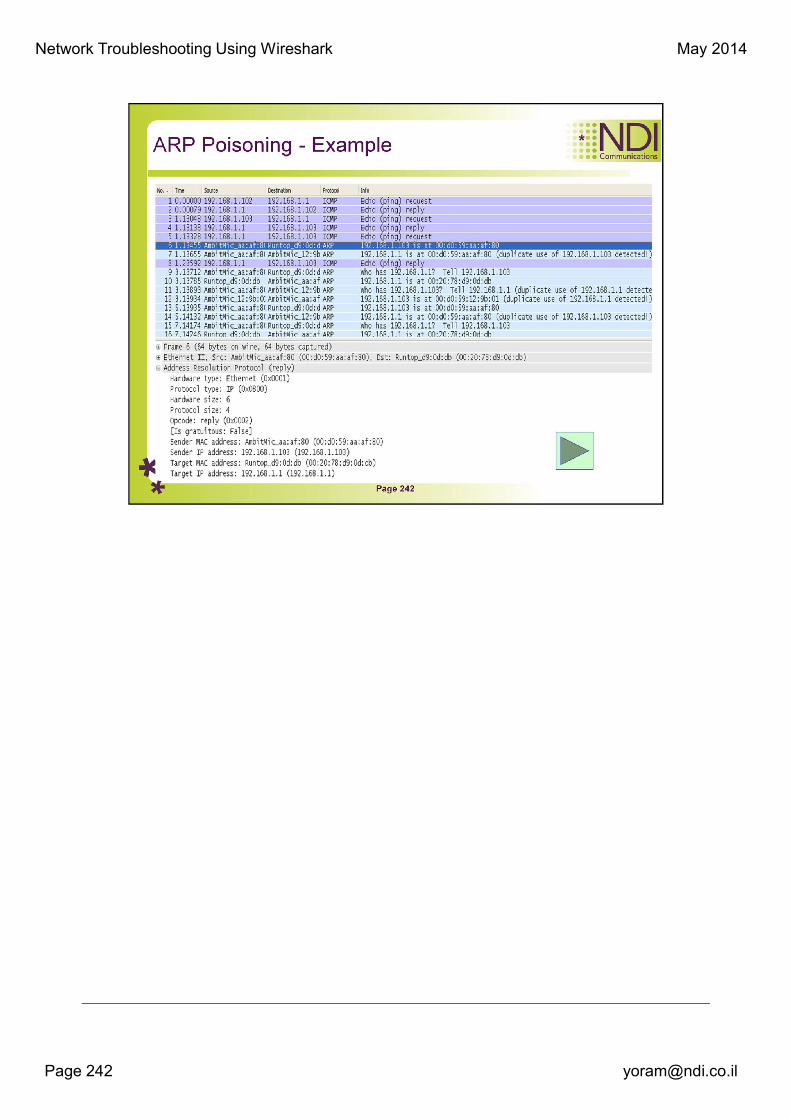
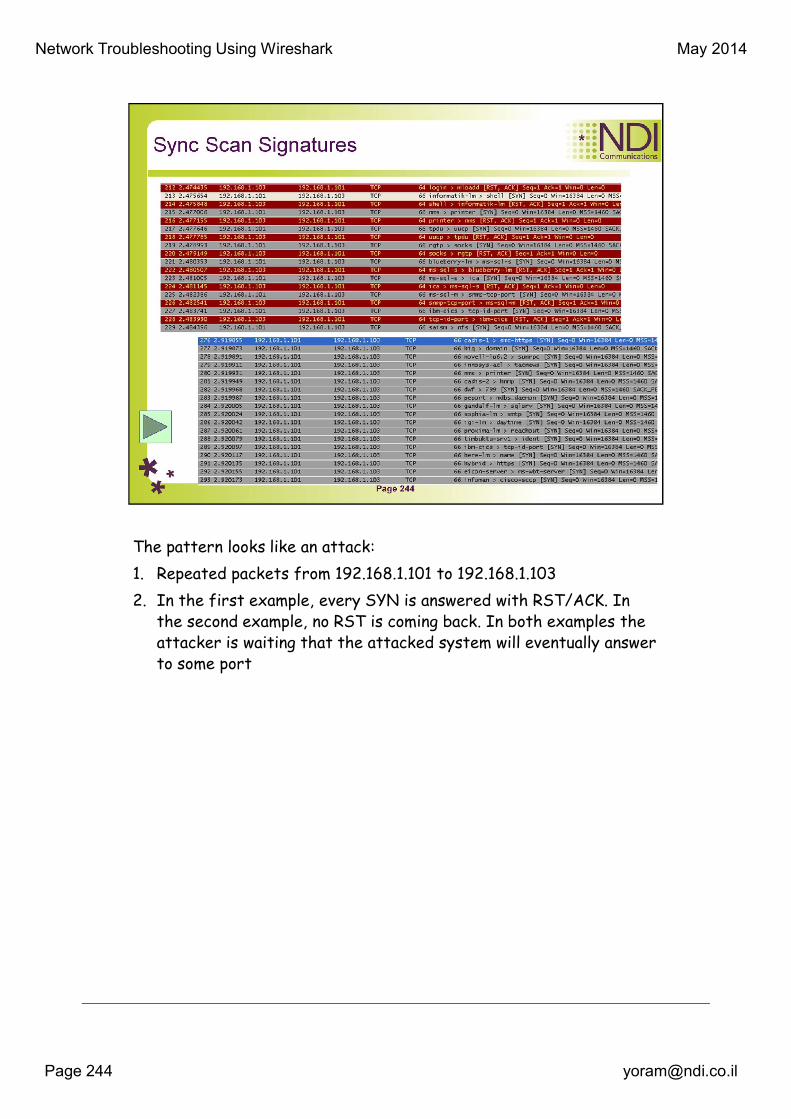
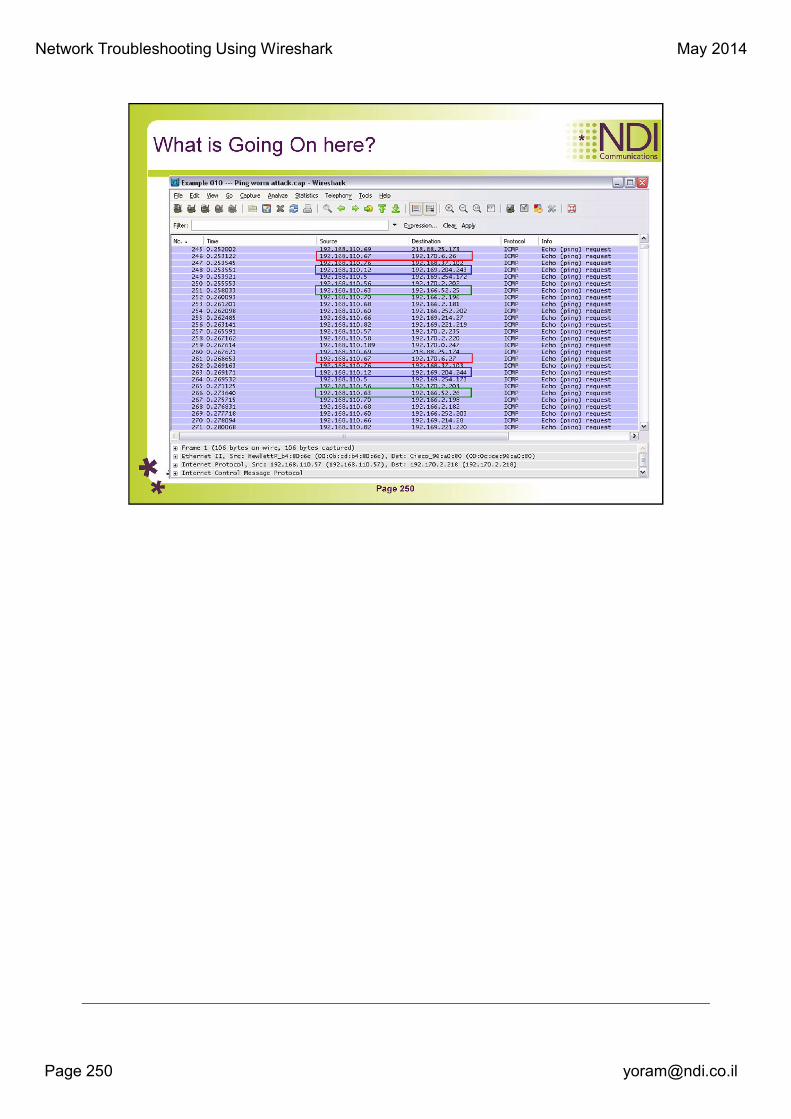
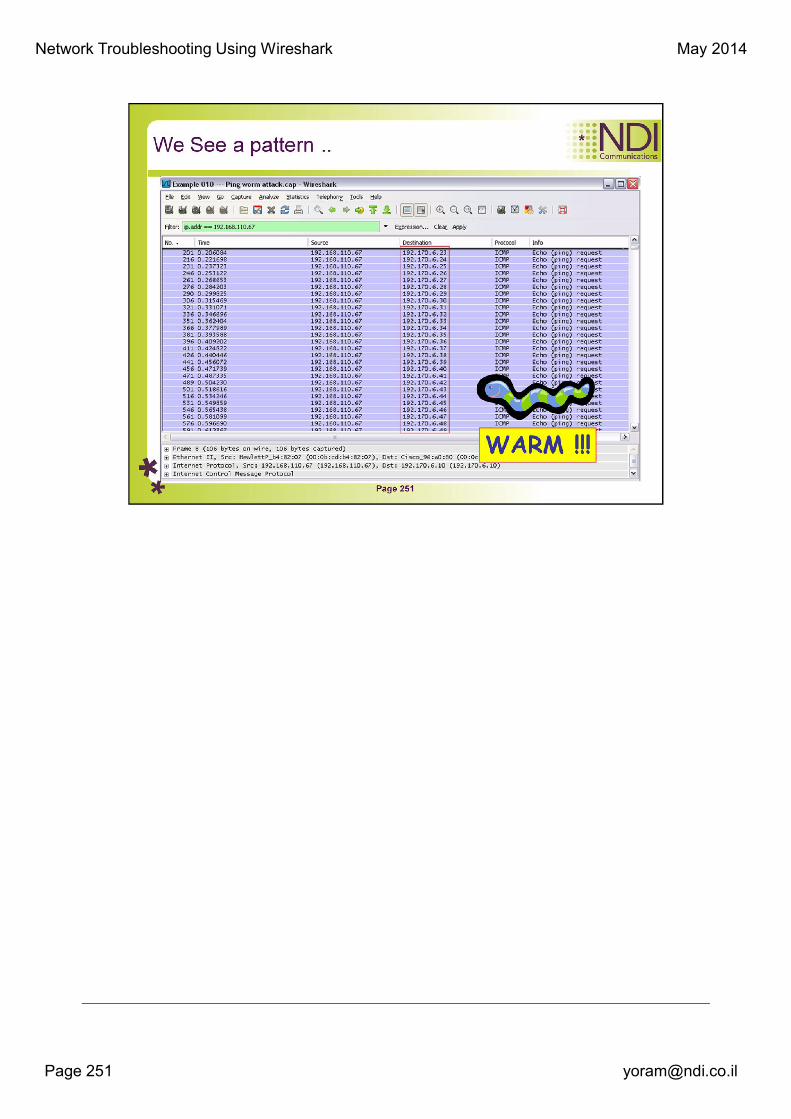
The pattern looks like an attack:
1. Repeated packets from 192.168.1.101 to 192.168.1.103
2. In the first example, every SYN is answered with RST/ACK. In
the second example, no RST is coming back. In both examples the
attacker is waiting that the attacked system will eventually answer
to some port
Network Troubleshooting Using Wireshark May 2014
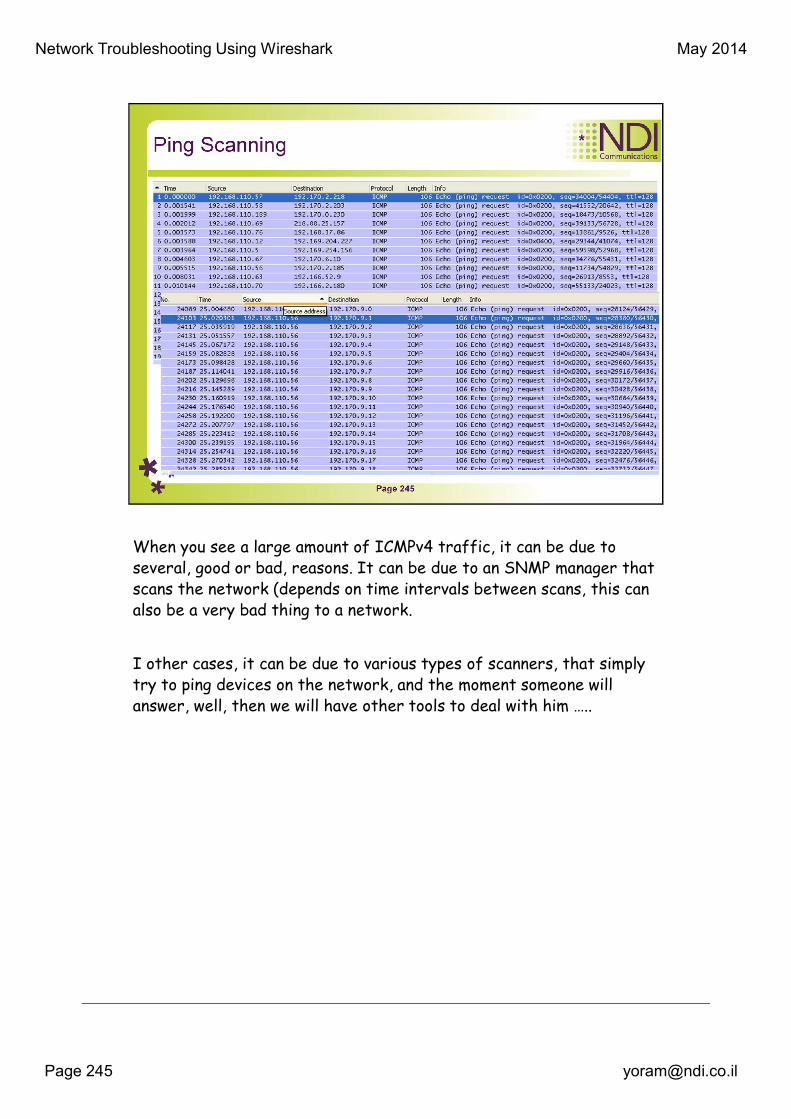
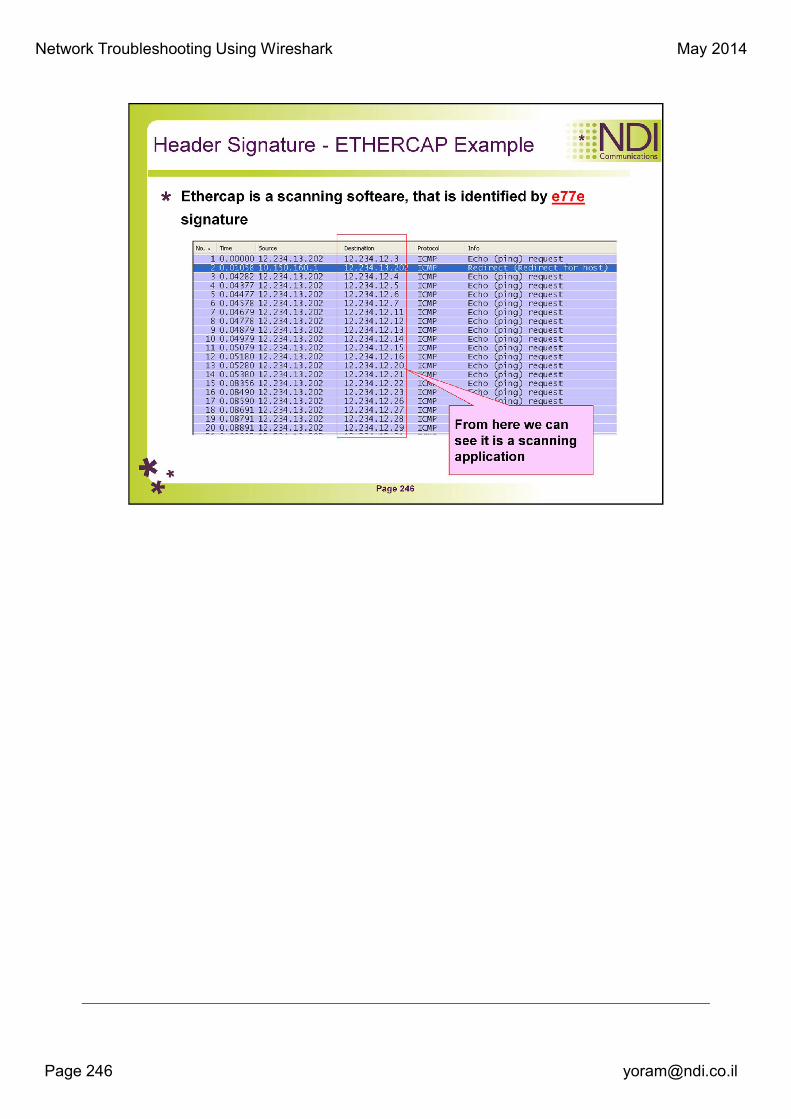
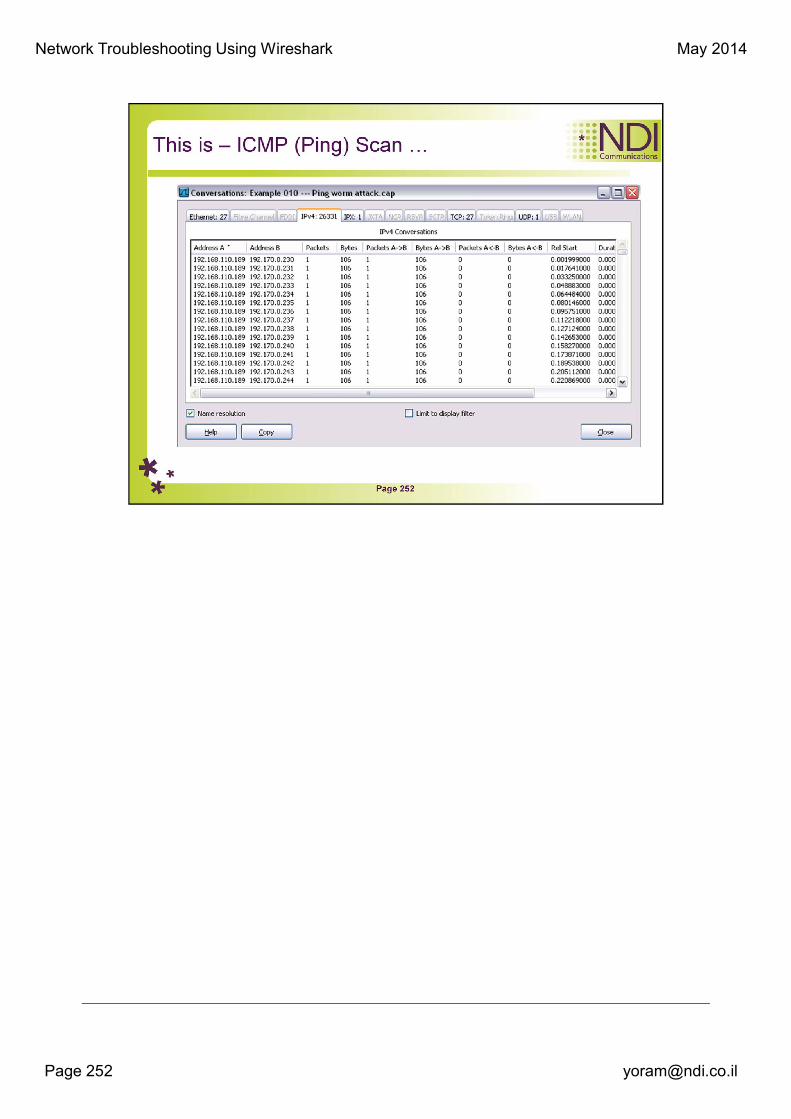
When you see a large amount of ICMPv4 traffic, it can be due to
several, good or bad, reasons. It can be due to an SNMP manager that
scans the network (depends on time intervals between scans, this can
also be a very bad thing to a network.
I other cases, it can be due to various types of scanners, that simply
try to ping devices on the network, and the moment someone will
answer, well, then we will have other tools to deal with him …..

Network Troubleshooting Using Wireshark May 2014
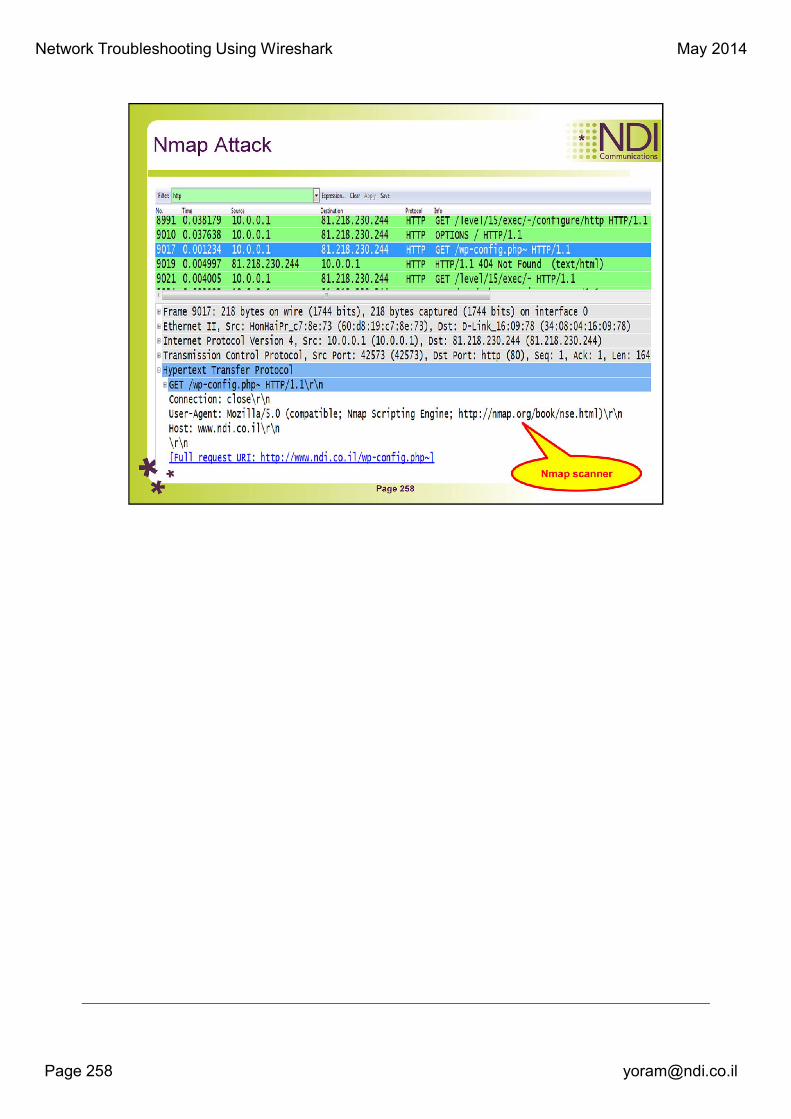
Port Scanning is one of the most popular reconnaissance techniques
attackers use to discover services they can break into. All machines
connected to a Local Area Network (LAN) or Internet run many
services that listen at well-known and not so well known ports. A port
scan helps the attacker find which ports are available (i.e., what
service might be listing to a port). Essentially, a port scan consists of
sending a message to each port, one at a time. The kind of response
received indicates whether the port is used and can therefore be
probed further for weakness.
Can I take legal action against port scanning?
A Port scan is like ringing the doorbell to see whether someone's at
home. The police usually can't do anything about it. They have to wait
until a crime is committed. The police might give it more consideration
if the doorbell is repeatedly rung causing the homeowner to complain
of harassment. Sometimes, if a computer system is affected too much
by a port scan, one can argue that the port scan was, in fact, a denial-
of-service (DoS) attack, which is usually an offense.


Network Troubleshooting Using Wireshark May 2014
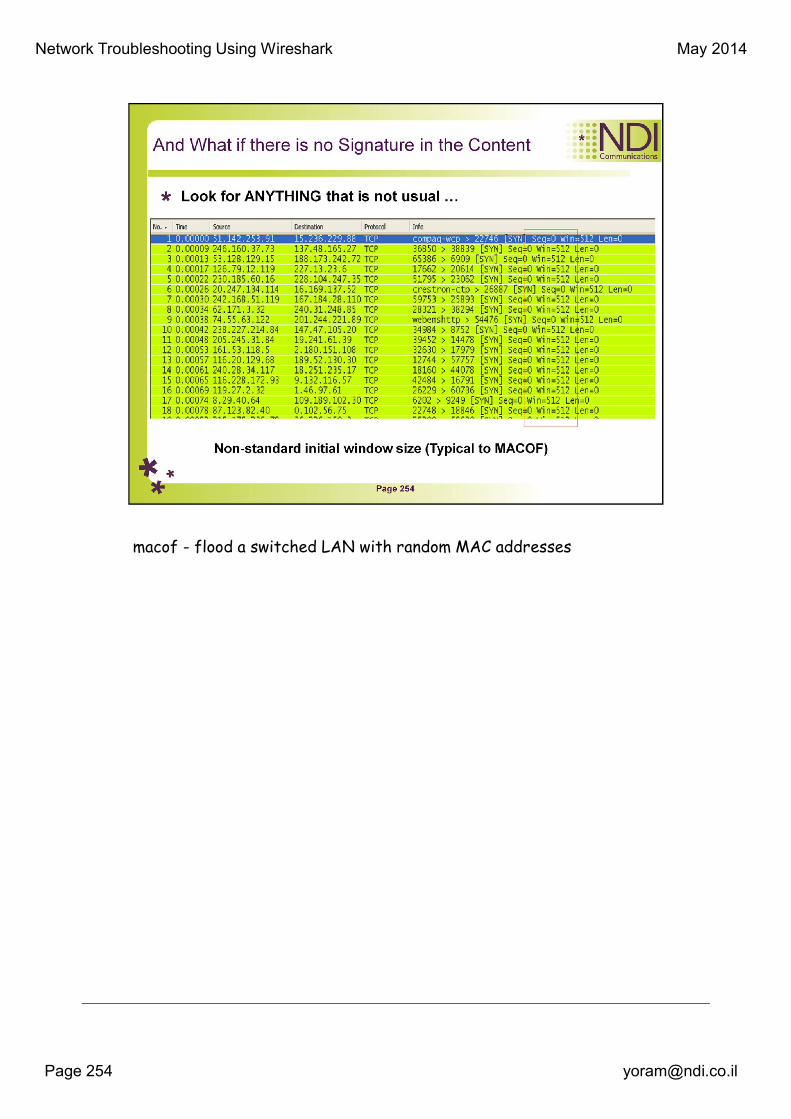
macof - flood a switched LAN with random MAC addresses


Network Troubleshooting Using Wireshark May 2014
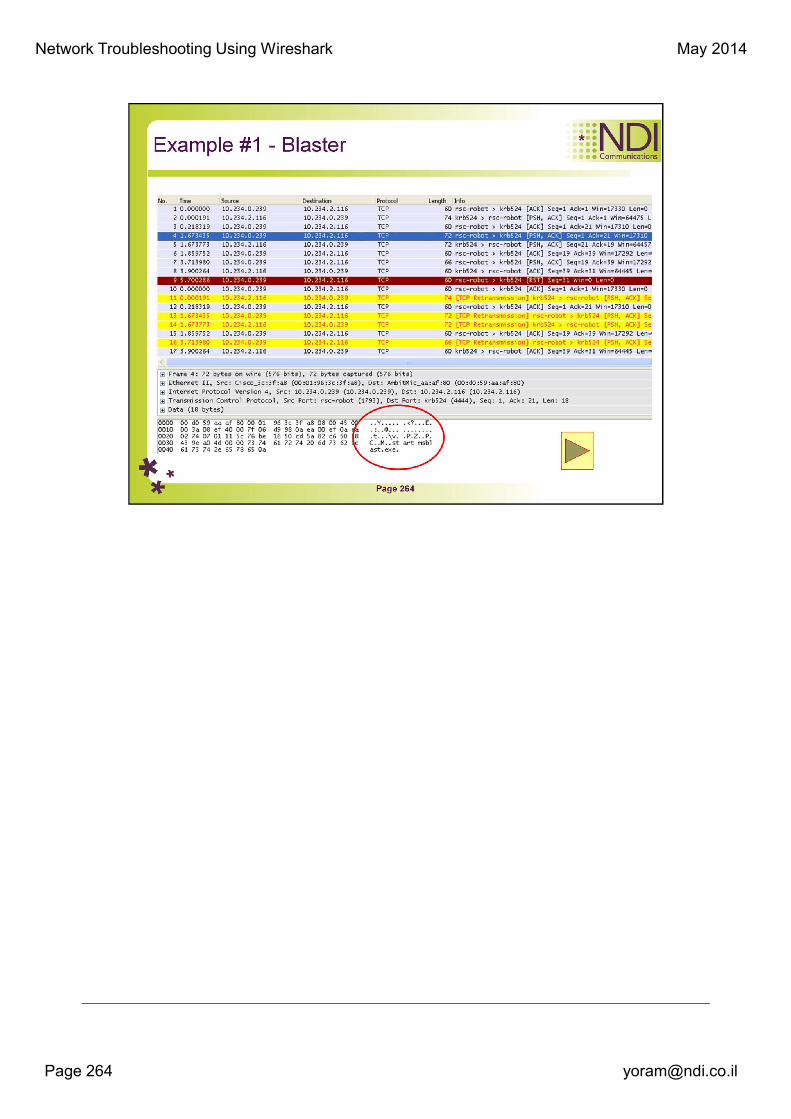
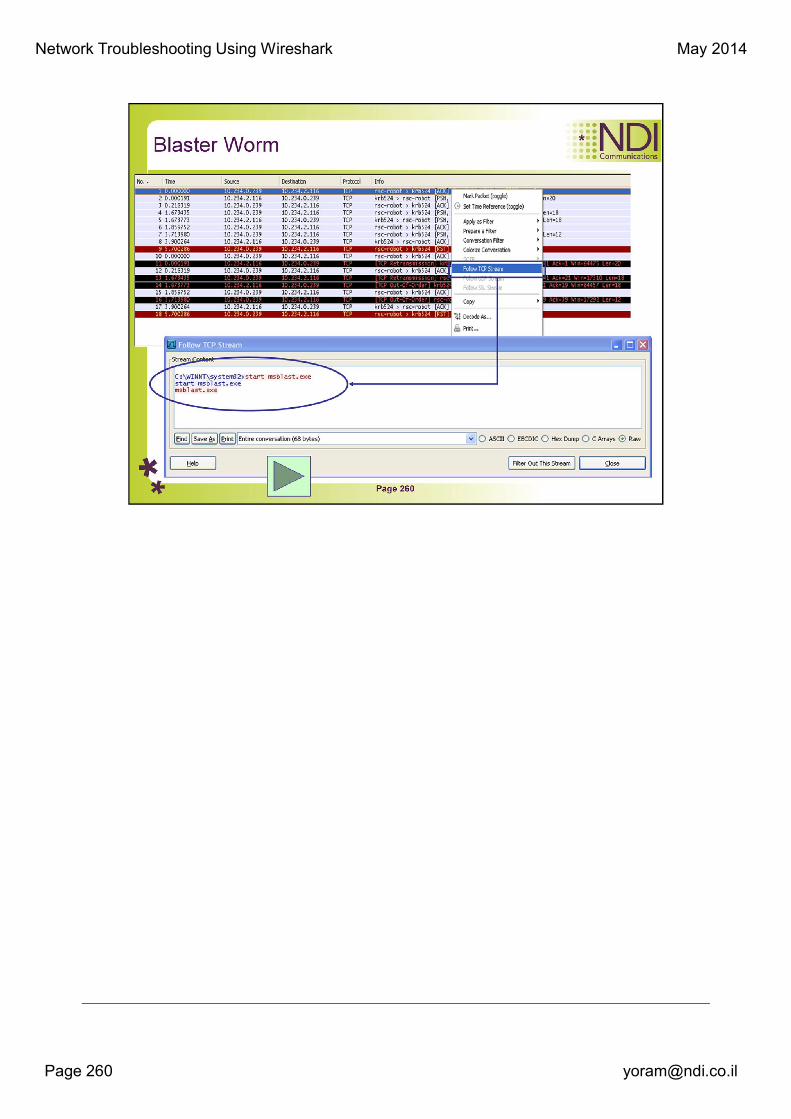
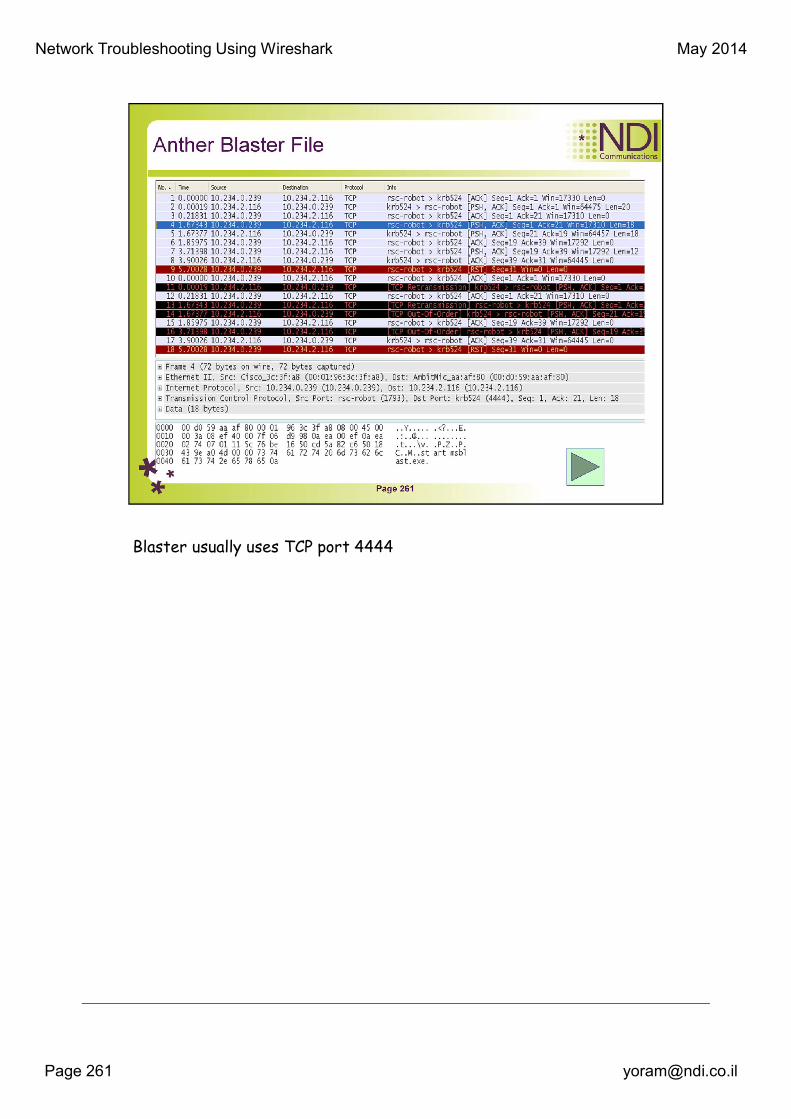
Blaster usually uses TCP port 4444