winter to summer monsoon variation of aerosol optical depth over the tropical indian ocean · ·...
TRANSCRIPT
Winter to summer monsoon variation of aerosol optical depth over the
tropical Indian Ocean
F. Li and V. RamanathanCenter for Clouds, Chemistry and Climate, Scripps Institution of Oceanography, University of California, San Diego,La Jolla, California, USA
Received 14 June 2001; revised 4 December 2001; accepted 19 December 2001; published 22 August 2002.
[1] The northern Indian Ocean undergoes a major transition from anthropogenic aerosolsduring the northeasterly winter monsoon season to mineral dust and sea salt during thesouthwest summer monsoon. The former is dominated by low-level transport from southand southeast Asia, while the latter results from low to mid tropospheric transport from theAfrican continent and the Arabian Peninsula. During the winter monsoon, low-leveltransport from the Indian subcontinent and neighboring nations is particularly important.This paper uses 5 years of satellite-derived aerosol optical depths (AODs) to document thelarge seasonal variations in AODs modulated by the monsoons. In situ data are used todevelop and validate the procedure we employ to derive visible AODs from the radiancesobserved by the advanced very high resolution radiometer (AVHRR) onboard polar-orbiting satellites. Monthly mean AOD over the Arabian Sea displays a clear annual cyclewith a maximum (0.60 ± 0.10) in July and a minimum (0.20 ± 0.05) in January. Thesummer monsoon maximum is due both to the southwest winds bringing dust from theHorn of Africa over the Arabian Sea and mid tropospheric transport of dust from theArabian Peninsula. Such long-range transports also lead to aerosol loading south of theequator. We also show that the Indonesia forest fires during the 1997 El Nino led to a largeincrease in AOD over most of the equatorial Indian Ocean. INDEX TERMS: 0305
Atmospheric Composition and Structure: Aerosols and particles (0345, 4801); 0360 Atmospheric Composition
and Structure: Transmission and scattering of radiation; 1640 Global Change: Remote sensing; KEYWORDS:
aerosols and particles, transmission and scattering of radiation, remote sensing
1. Introduction
[2] The tropical Indian Ocean is influenced by twocontrasting air masses (continental and marine) associatedwith the Indian monsoon system. The summer monsoon,also known as the southwest monsoon, usually starts by theend of May and continues until November. During thisperiod, winds are mainly southwesterly or westerly. Thewinter monsoon (also called the northeast monsoon)becomes established toward the end of November andcontinues until April. During this period the prevailingwinds are mostly northeasterly. This study examines howthe two contrasting monsoonal air masses influence theregional aerosol distribution. During the winter monsoonperiod, anthropogenic trace species and their reaction prod-ucts (e.g., sulfates and ozone) from the Northern Hemi-sphere are directly connected to the pristine air of theSouthern Hemisphere by a cross-equatorial monsoonal flowinto the Intertropical Convergence Zone (ITCZ) [Ramana-than et al., 2001]. The analysis during the winter monsoonrevealed that the AOD distributions over the ocean aredominated by anthropogenic aerosols [Rajeev et al., 2000;Ramanathan et al., 2001]. This paper completes the picture
by describing the aerosol optical depth (AOD) during thefull annual cycle.[3] Using the observed single scattering albedo (SSA),
and phase function derived from in situ data, Rajeev et al.[2000] studied the spatial distribution of aerosol opticaldepth over the tropical Indian Ocean based on AODretrieved from advanced very high resolution radiometer(AVHRR) visible channel radiances during January toMarch 1998. The aerosol scattering phase function andSSA used in the retrieval were obtained by integratingsurface aerosol optical depths and a comprehensive aerosolmodel [Satheesh et al., 1999]. The data were collectedduring February to March 1998 as part of the first fieldphase (FFP) of the Indian Ocean Experiment (INDOEX)[Ramanathan et al., 1995, 1996]. INDOEX focuses onstudying the long-range transport of trace species andaerosols from urban regions and assessing their direct andindirect radiative forcing.[4] In this study we have made several improvements to
the Rajeev et al. [2000] algorithm along the followinglines: incorporated new sensor calibration coefficientsobtained from Tahnk [2001]; added a correction term forwater-leaving radiance; introduced a correction for con-tamination of clear radiances by thin cirrus; and adopted aseasonal variation in the aerosol SSA and a composition-related phase function. With the improved retrievalmethod, 5-year AOD over the INDOEX area (30�N to
JOURNAL OF GEOPHYSICAL RESEARCH, VOL. 107, NO. D16, 4284, 10.1029/2001JD000949, 2002
Copyright 2002 by the American Geophysical Union.0148-0227/02/2001JD000949$09.00
AAC 2 - 1
�35�S, 40�E to �100�E) have been derived from theNOAA 14/AVHRR global area coverage (GAC) dataduring 1 January 1996 to 31 December 2000. In section2 the retrieval procedure and its improvements are pre-sented. With more than 2 years data for validation,comparison of the retrieved AOD to ground-based AODmeasurements is given in section 3. The patterns ofseasonal and interannual variation of AODs over thetropical Indian Ocean are described in section 4.
2. Data Analyses
2.1. Data and Method of Analysis
[5] We have used the NOAA 14/AVHRR GAC data forthe afternoon satellite pass in 2600-km-wide swaths overthe Indian Ocean. The spatial resolution of GAC data is1.1 � 4 km at nadir, sampled every third scan line, althoughgenerally treated as 4-km resolution. AVHRR has fivewavelength bands of observation, namely, visible (channel1, �580–680 nm); near infrared (channel 2, �720–1100nm); and infrared (channel 3, �3.5–4.0 mm) and channel 4,�10.5–11.5 mm and channel 5, �11.5–12.5 mm). Channel1 radiances are used for retrieving AOD over the oceanareas. Brightness temperatures derived from channels 4 and5, along with radiance from channels 1 and 2, are used forcloud detection. Fresnel reflection of the direct and diffusesolar radiation at the ocean surface varies with wind speedand is calculated for rough ocean on the basis of the modelproposed by Cox and Munk [1954]. This model givesprobability distribution of surface slopes as a function ofwind speed and direction. Magnitude of the surface reflec-tance and its variation with wind speed are maximum at thesolar side of satellite scan, and the error in retrieved AODwill be larger in this region because of the uncertainty in theactual wind speed. To minimize the effect of specularreflection from the ocean surface, only the antisolar sideof the scan line has been included in the analysis. Reflec-tance of radiation at ocean surface at each pixel is based ondaily surface wind speeds obtained from the NationalCenters for Environmental Prediction (NCEP)/NationalCenter for Atmospheric Research (NCAR) reanalysis (2.5�horizontal resolution).[6] The retrieval algorithm employs the aerosol model
developed by Satheesh et al. [1999]. The Satheesh et al.model is based on the chemical, microphysical, and opticalproperties of aerosols derived from the INDOEX dataarchives. However, these observations are valid only forthe winter monsoon period. The observed mean SSA at 0.55mm for the first 1 km from the surface is �0.90 andcorresponds to a mean relative humidity of 78% observedduring the period. The mean relative humidity varies withheight, which results in a height variation of the SSA. Thevalues of SSA as a function of relative humidity (RH)obtained based on the model of Hess et al. [1998] are 0.90for 78%; 0.874 for RH = 70%; 0.861 for RH = 60%; 0.85for RH = 50%; and 0.752 for RH = 35%. We have taken theaverage altitude profile of RH based on the balloon sondedata during the observation period as given by Satheesh etal. [1999] and used the corresponding altitude variation ofaerosol SSA. This model has been developed for the winterseason using INDOEX data. The revision of the model forthe summer season is described in section 2.2.4.
2.2. Retrieval of Aerosol Optical Depth
[7] We have made the following improvements to theRajeev et al. [2000] algorithm.2.2.1. Adding New Calibration Coefficients[8] The in-orbit performance of the AVHRR visible and
near-infrared channel degrades with time, initially duringstorage and then because of outgassing (e.g., water vaporloss from filter interstices) and subsequently because of thecontinued exposure to the harsh space environment [Cheand Price, 1992; Kaufman and Holben, 1993; Rao andChen, 1995]. This degradation makes the use of preflightcalibration coefficients unsuitable. Onboard calibrations forchannels 3, 4, and 5 are performed by scheduling the sensorto view cold space and one or more internal warm black-bodies as part of its normal scan sequences in orbit, butthere is no onboard calibration for channels 1 and 2. Thelack of onboard calibration for channels 1 and 2 makes thevisible and near-infrared band applications of the AVHRRdata particularly difficult. Efforts have been made on in-flight calibration using Earth-based targets. One of thepostlaunch calibrations chose the southeastern Libyandeserts as calibration sources [Rao and Chen, 1999]. Thebasic assumption is that the top-of-the-atmospheric albedoover the sites remains the same over a long period of time.In this study we adopted the approach developed by Loeb[1997] and Tahnk [2001], who used permanent ice sheets ofGreenland and the Antarctic as calibration targets. Theinterior zones of permanent ice sheets are spatially andtemporally stable. At high latitudes, there are numerousoverpasses that provide acceptable viewing geometries forthe determination of the calibration coefficients. A disad-vantage, of course, is that high-latitude snow and ice scenescan be viewed only during the summer season. From the 5-year of data (1996–2000) for Antarctica and Greenland,Tahnk [2001] has developed new calibration coefficients.We have applied the new calibration coefficients to all of1996 � 2000 AVHRR AOD retrievals.2.2.2. Water-Leaving Radiance Correction[9] Upwelling radiance from the sea surface consists of
two components: a Fresnel reflection component andupwelling radiation from layers below the surface, the so-called water-leaving radiance resulting from scattering byparticles in the ocean. The contribution due to water-leavingradiance at the wavelength of our interest was neglected inthe Rajeev et al. [2000] retrieval procedure. As shown byretrievals with the Sea-viewing Wide Field-of-view Sensor[Gordon and Wang, 1994] and with the Medium-ResolutionImaging Spectrometer [Moore et al., 1999], the waterleaving radiance has a nonnegligible impact on the retrievalof visible aerosol optical depths over the oceans. For thelow phytoplankton pigment concentrations the water leav-ing radiance can be assumed to be constant. The reflectanceof phytoplankton cultures near 505 nm is nearly independ-ent of the pigment concentration [Duntley et al., 1974].Since most of the open ocean may be considered as case 1waters (the phytoplankton concentration C < 0.25 gm m�3),the water-leaving radiance can be evaluated as a constantterm using the experimental measurements [Gordon andClark, 1981], which yield for clear water radiances (or A. Y.Morel’s (The scattering of light by seawater: Experimentalresults and theoretical approach, translated from French byG. Halikas, 161 pp., Scripps Institution of Oceanography,
AAC 2 - 2 LI AND RAMANATHAN: SEASONAL MONSOON VARIATION OVER INDIAN OCEAN

La Jolla, Calif., 1975) case I waters): 0.495, 0.280, and0.0123 mW cm�2 mm�1 sr�1, for wavelengths 520, 550,and 670 nm, respectively. We subtract this radiance (inter-polated to 0.63 mm) from the total reflectance measured bythe satellite sensor and perform the AOD retrieval on thecorrected radiance. As shown later, this correction decreasedthe offset of the retrieved AOD from the measured AOD(from ground Sun photometers) by �7%.2.2.3. Addition of a Thin Cirrus Test[10] The contamination of thin cirrus in the so-called
clear-sky radiance is a chronic problem in aerosol retrievalsthat rely on visible radiances. In our previous retrievalprocedure [Rajeev et al., 2000], three tests were used todetect and reject pixels partially filled and fully filled byclouds: (1) the threshold method (brightness temperatures inchannels 4 and 5), (2) the spatial coherence test (brightnesstemperatures in channels 1 and 4), and (3) the visible andnear-IR channel ratio method. In this study we added onemore test for filtering out thin cirrus clouds. The temper-ature difference between channels 4 and 5 can be used todetect most types of clouds including semitransparent cirrusclouds because of the different emissivities of cloud at thetwo wavelengths [Kriebel, 1996]. For the most cloud-freepixels the maximum temperature difference between chan-nels 4 and 5 which would be expected to be due to thetemperature dependence of the Planck function is only�1�K. Saunders and Kriebel [1988] used a set of precom-puted clear-sky AVHRR brightness temperatures to showthe expected dependence of the temperature difference onthe satellite zenith angle and the channel 4 brightnesstemperature. We used their Table 1 of differences to pickour clear-sky values. In other words, all pixels with abrightness temperature difference greater than the valuegiven in their Table 1 are then identified as cloud-contami-nated and removed.2.2.4. Season-Dependent Phase Function andSingle-Scattering Albedo[11] As mentioned in section 2.1, the aerosol chemical
composition ranges from mostly anthropogenic aerosolsduring winter and spring to mostly natural aerosol compo-sition of dust, sea salt, and sulfates (derived from dimethylsulfide). We account for this seasonal variation by modify-ing the aerosol scattering phase function and SSA modeldeveloped from the data collected during FFP/INDOEX,January to March 1998 [Satheesh et al., 1999]. TheSatheesh et al. aerosol model was constructed from thespectral column aerosol optical depth measurements usingthe CIMEL radiometer [Holben et al., 1998] and size-resolved aerosol chemical measurements at the surface.This aerosol model contains seven aerosol types, namely,sea salt, sulfate, nitrate, organics, ammonia, dust, and soot.Each of these components is assumed to have lognormalsize distribution, and the observed mean SSA at surface is~0.88 [Ramanathan et al., 2001]. During summer, however,in situ SSA measurements have not been made. We antici-pate from earlier papers [Husar et al., 1997; Herman et al.,1997] that dust and sea salt are the major aerosol compo-nents. The visible (�0.55 mm) SSA for the sea salt is 1.0.For dust, however, the precise value of SSA is not known,and its value can vary significantly from one region toanother. For example, the range extends from 0.65 to 0.70[Tanre et al., 1988; Sokolik and Toon, 1999], from 0.8 to 0.9
[Hess et al., 1998], and from 0.9 to 1.0 [Fukushima andToratani, 1997; Kaufman et al., 2001]. In this paper,persuaded by the recent results of Kaufman et al. [2001],we adopt SSA of 0.95 at 0.55 mm. Furthermore, we assumedthe SSA to be independent of RH.[12] We wish to point out that the SSA adopted in this
model is in excellent agreement with SSA retrieved byDubo vik e t a l. [2002] using Ae rosol Rob otic N etwork(AERONET) data. For Maldives, Dubovik et al. obtainedSSA of 0.89 for wintertime, in good agreement with ourvalue of 0.88. They have not retrieved summer value forMaldives. However, their value (0.94 � 0.96) at Bahrainand Solar Village (in Saudi Arabia) for desert dust andoceanic aerosols is in good agreement with the value (0.95)used in this paper.[13] We adopt the following SSAs: 0.88 for winter-spring
(approximately December–April) from INDOEX values:0.92 for the transition months (May and November), and0.95 for summer (approximately June–October). The phasefunction in the present study for winter is similar to the oneused by Rajeev et al. [2000], except that for summer it isrecalculated with dust, sea salt, and sulfates. We assume amixture of 40% dust, 50% sea salt, and 10% sulfate. Theassumed SSA of 0.95 applies to this mixture. The compositephase function for the mixture is not very sensitive to theassumed fractional concentration of these aerosol types. Inaddition, our phase function agrees to within 20% of thedust values given by Kaufman et al. [1994].
3. Validation
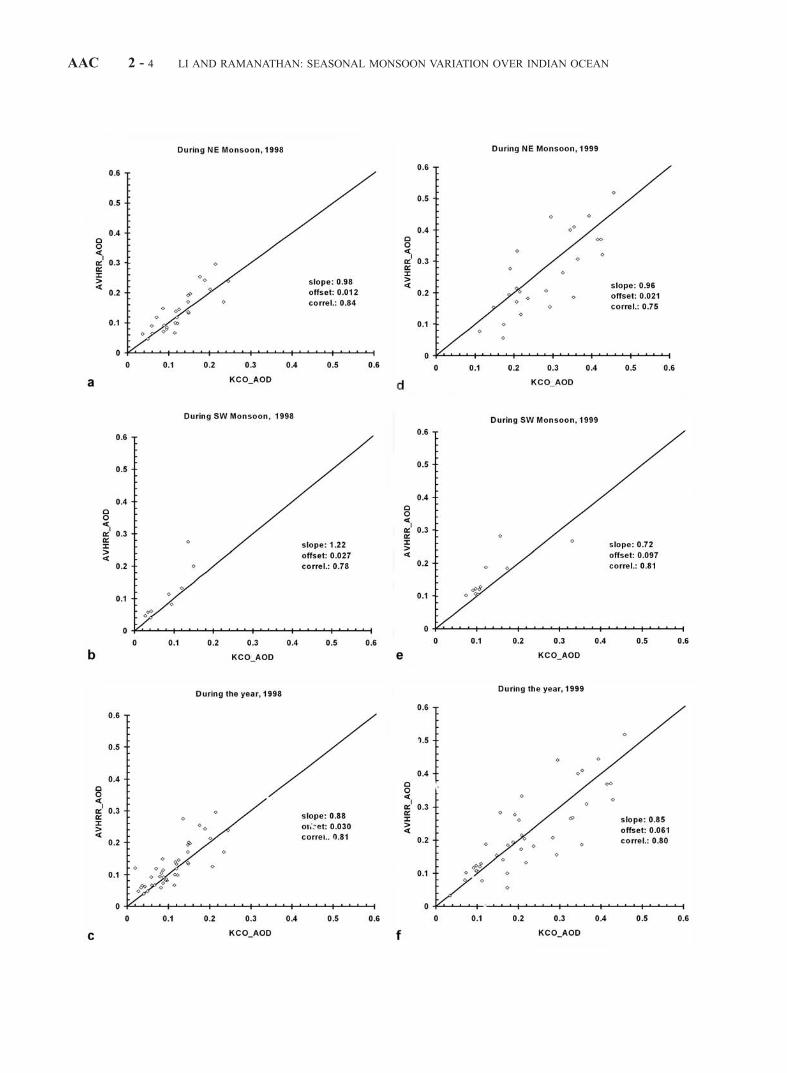
[14] Ground-based AOD measurements were made at theKaashidhoo Climate Observatory (KCO) located on theisland of Kaasihidhoo in the Maldives (see Satheesh et al.[1999] for a description of KCO). KCO was developed aspart of INDOEX. Among the many instruments at KCO, isthe automatic CIMEL Sun/sky radiometer. CIMEL is part ofthe AERONET [Holben et al., 1998]. We colocate theAVHRR-AOD data with CIMEL AOD, within ±1.0� lat-itude and longitude and within a time interval of ±60 min.We avoid the influence of land reflection from the 1-km-wide island by excluding satellite data within ±0.15� lat-itude and longitude. Figures 1a–1f compare the in situ AODwith AVHRR AOD. They are illustrated for the periods ofthe northeast (NE) monsoon (Figures 1a and 1d), thesouthwest (SW) monsoon (Figures 1b and 1e), and thewhole year (Figures 1c and 1f ) for 1998 and 1999. Overall,the retrieved AODs are in good agreement with the CIMELvalues. The consistency between the two data is much betterduring the NE monsoon (winter) than during the SW
Table 1. Comparison of the Retrieved Aerosol Optical Depths
With Tahnk’s [2001] Results (at 0.63 mm) in 10� � 10� Box With
Kaashidhoo Climate Observatory (KCO) at Centera
Year KCO Ours Tahnk’s
1996 . . . 0.16 0.191997 . . . 0.20 0.221998 0.13 0.13 0.171999 0.26 0.22 0.242000 0.17 0.19 0.21
aA 3-month average for January, February, and March.
LI AND RAMANATHAN: SEASONAL MONSOON VARIATION OVER INDIAN OCEAN AAC 2 - 3
AAC 2 - 4 LI AND RAMANATHAN: SEASONAL MONSOON VARIATION OVER INDIAN OCEAN
monsoon (summer). This should not be surprising since weused in situ chemical data for the NE monsoon as opposedto the best guess models for the other seasons. The slopes,the offsets, and the correlation coefficients (R) are listed inFigure 1. During the winter season the slopes between theCIMEL-AOD and the AVHRR-AOD are close to unity(0.97 on average), and the offsets are also smaller. Forsummer, however, the slopes vary between 0.72 and 1.22,and the offsets reach values as high 0.097. In situ exper-imental data for the aerosol size distribution and chemicalcomposition are needed for further improvement of theretrieval.[15] Error estimates show that for the winter monsoon the
in situ measured SSA is 0.88 ± 0.02 for the column average[Ramanathan et al., 2001]. The uncertainty in the retrievedAODs is ±15%. Owing to lack of real measurements duringthe transition periods and the summer monsoon we can onlyprovide best guesses for the uncertainty. The uncertainty ofSSA is estimated to be about ±0.03. Uncertainty of theretrieved AODs is ±20% for the transition periods and±25% for the summer monsoon. We also suggest thatnonsphericity of the dust may be responsible for some ofthe differences between AVHRR-AOD and KCO-AODduring the SW monsoon.[16] The AODs retrieved from the present scheme are
considerably better than the standard operational AODsavailable through the National Oceanic and AtmosphericAdministration (NOAA)web site (http://www.saa.noaa.gov).
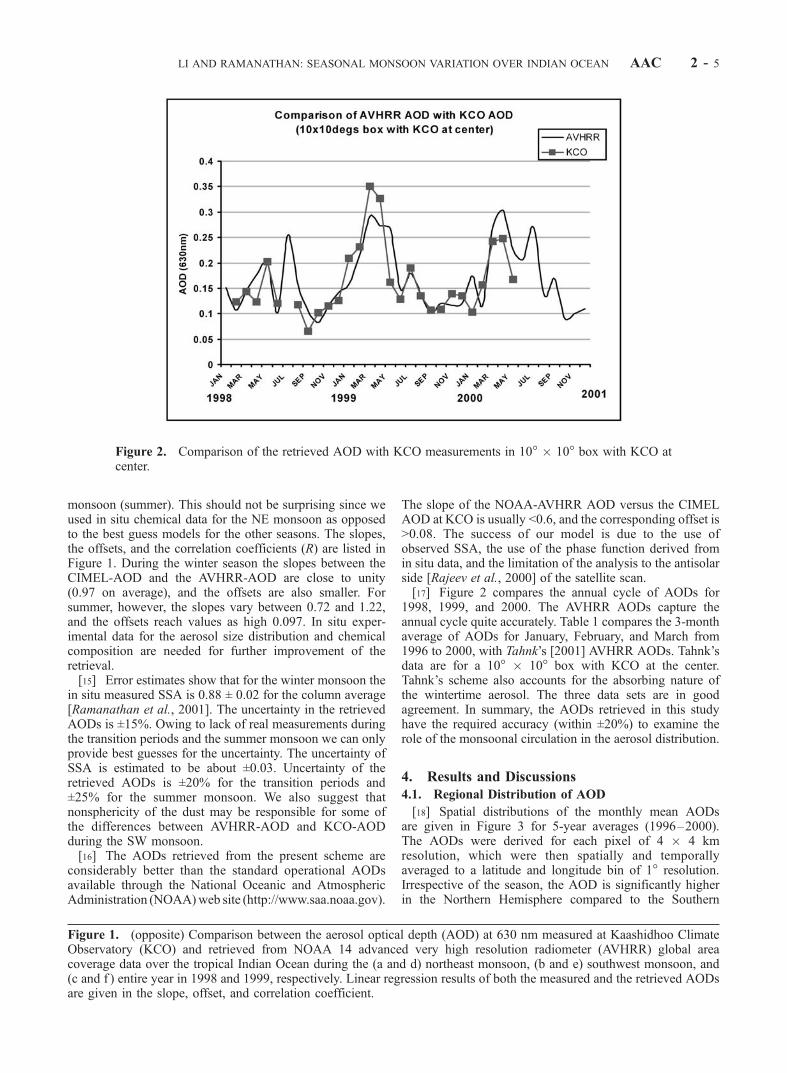
The slope of the NOAA-AVHRR AOD versus the CIMELAOD at KCO is usually <0.6, and the corresponding offset is>0.08. The success of our model is due to the use ofobserved SSA, the use of the phase function derived fromin situ data, and the limitation of the analysis to the antisolarside [Rajeev et al., 2000] of the satellite scan.[17] Figure 2 compares the annual cycle of AODs for
1998, 1999, and 2000. The AVHRR AODs capture theannual cycle quite accurately. Table 1 compares the 3-monthaverage of AODs for January, February, and March from1996 to 2000, with Tahnk’s [2001] AVHRR AODs. Tahnk’sdata are for a 10� � 10� box with KCO at the center.Tahnk’s scheme also accounts for the absorbing nature ofthe wintertime aerosol. The three data sets are in goodagreement. In summary, the AODs retrieved in this studyhave the required accuracy (within ±20%) to examine therole of the monsoonal circulation in the aerosol distribution.
4. Results and Discussions
4.1. Regional Distribution of AOD
[18] Spatial distributions of the monthly mean AODsare given in Figure 3 for 5-year averages (1996–2000).The AODs were derived for each pixel of 4 � 4 kmresolution, which were then spatially and temporallyaveraged to a latitude and longitude bin of 1� resolution.Irrespective of the season, the AOD is significantly higherin the Northern Hemisphere compared to the Southern
Figure 2. Comparison of the retrieved AOD with KCO measurements in 10� � 10� box with KCO atcenter.
Figure 1. (opposite) Comparison between the aerosol optical depth (AOD) at 630 nm measured at Kaashidhoo ClimateObservatory (KCO) and retrieved from NOAA 14 advanced very high resolution radiometer (AVHRR) global areacoverage data over the tropical Indian Ocean during the (a and d) northeast monsoon, (b and e) southwest monsoon, and(c and f ) entire year in 1998 and 1999, respectively. Linear regression results of both the measured and the retrieved AODsare given in the slope, offset, and correlation coefficient.
LI AND RAMANATHAN: SEASONAL MONSOON VARIATION OVER INDIAN OCEAN AAC 2 - 5
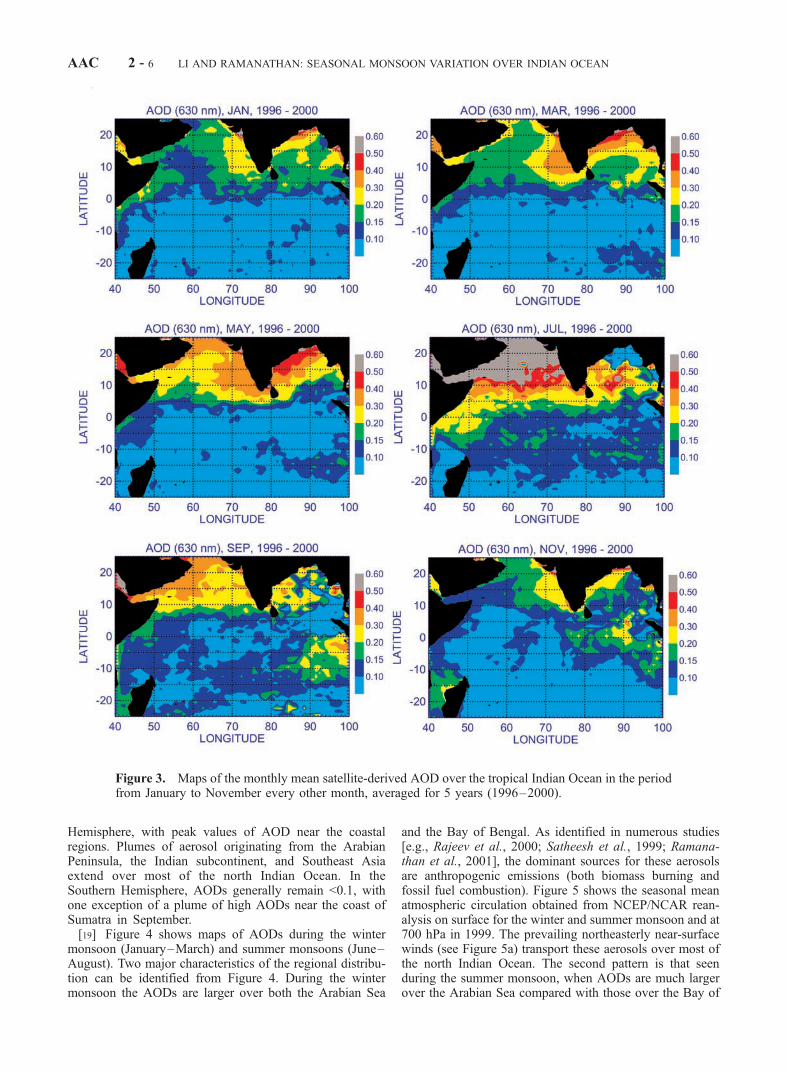
Hemisphere, with peak values of AOD near the coastalregions. Plumes of aerosol originating from the ArabianPeninsula, the Indian subcontinent, and Southeast Asiaextend over most of the north Indian Ocean. In theSouthern Hemisphere, AODs generally remain <0.1, withone exception of a plume of high AODs near the coast ofSumatra in September.[19] Figure 4 shows maps of AODs during the winter
monsoon (January–March) and summer monsoons (June–August). Two major characteristics of the regional distribu-tion can be identified from Figure 4. During the wintermonsoon the AODs are larger over both the Arabian Sea
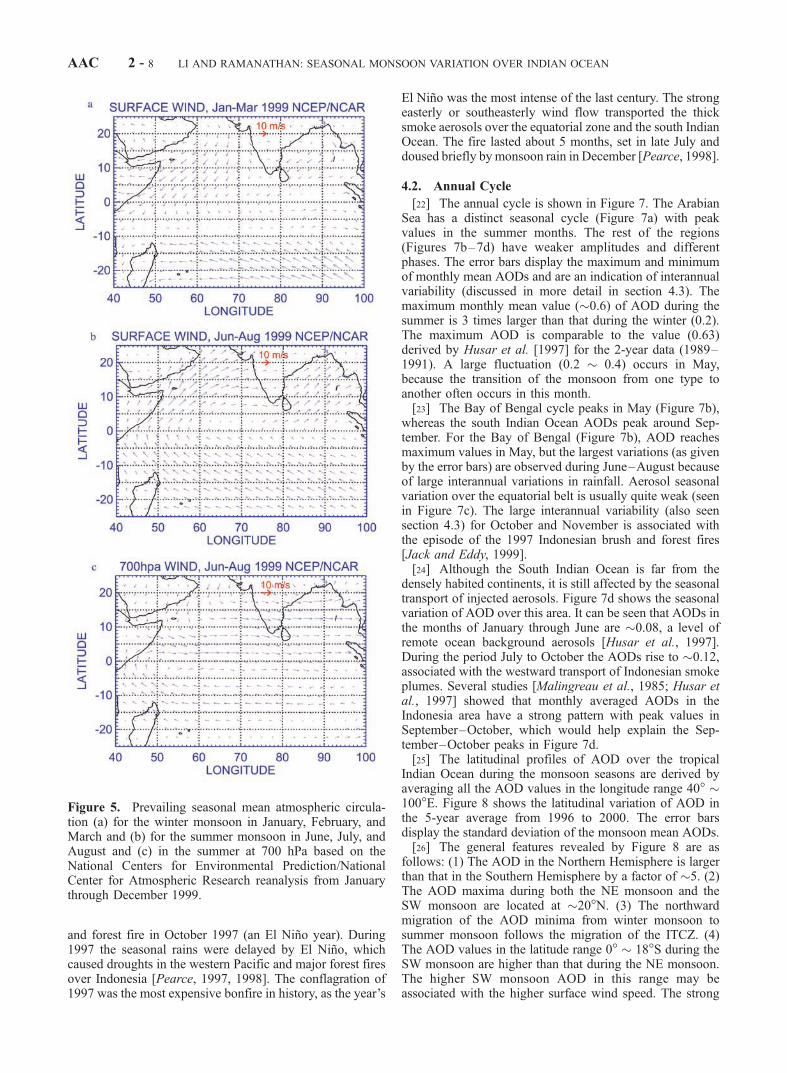
and the Bay of Bengal. As identified in numerous studies[e.g., Rajeev et al., 2000; Satheesh et al., 1999; Ramana-than et al., 2001], the dominant sources for these aerosolsare anthropogenic emissions (both biomass burning andfossil fuel combustion). Figure 5 shows the seasonal meanatmospheric circulation obtained from NCEP/NCAR rean-alysis on surface for the winter and summer monsoon and at700 hPa in 1999. The prevailing northeasterly near-surfacewinds (see Figure 5a) transport these aerosols over most ofthe north Indian Ocean. The second pattern is that seenduring the summer monsoon, when AODs are much largerover the Arabian Sea compared with those over the Bay of
Figure 3. Maps of the monthly mean satellite-derived AOD over the tropical Indian Ocean in the periodfrom January to November every other month, averaged for 5 years (1996–2000).
AAC 2 - 6 LI AND RAMANATHAN: SEASONAL MONSOON VARIATION OVER INDIAN OCEAN
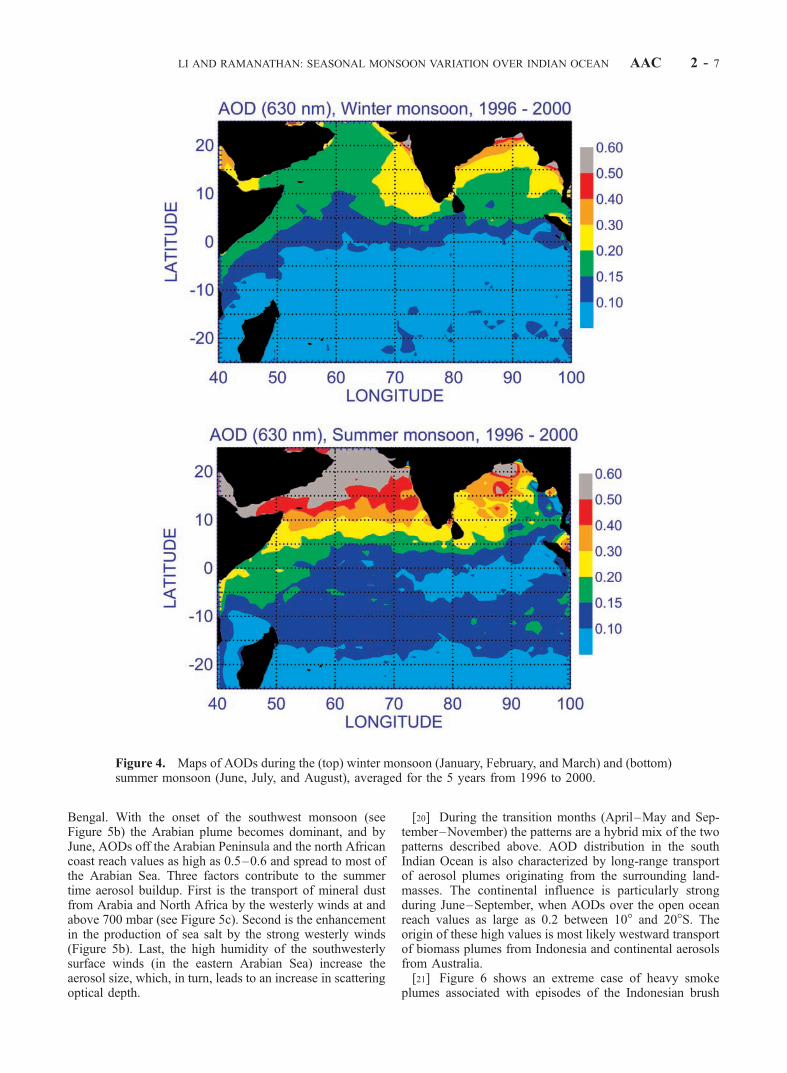
Bengal. With the onset of the southwest monsoon (seeFigure 5b) the Arabian plume becomes dominant, and byJune, AODs off the Arabian Peninsula and the north Africancoast reach values as high as 0.5–0.6 and spread to most ofthe Arabian Sea. Three factors contribute to the summertime aerosol buildup. First is the transport of mineral dustfrom Arabia and North Africa by the westerly winds at andabove 700 mbar (see Figure 5c). Second is the enhancementin the production of sea salt by the strong westerly winds(Figure 5b). Last, the high humidity of the southwesterlysurface winds (in the eastern Arabian Sea) increase theaerosol size, which, in turn, leads to an increase in scatteringoptical depth.
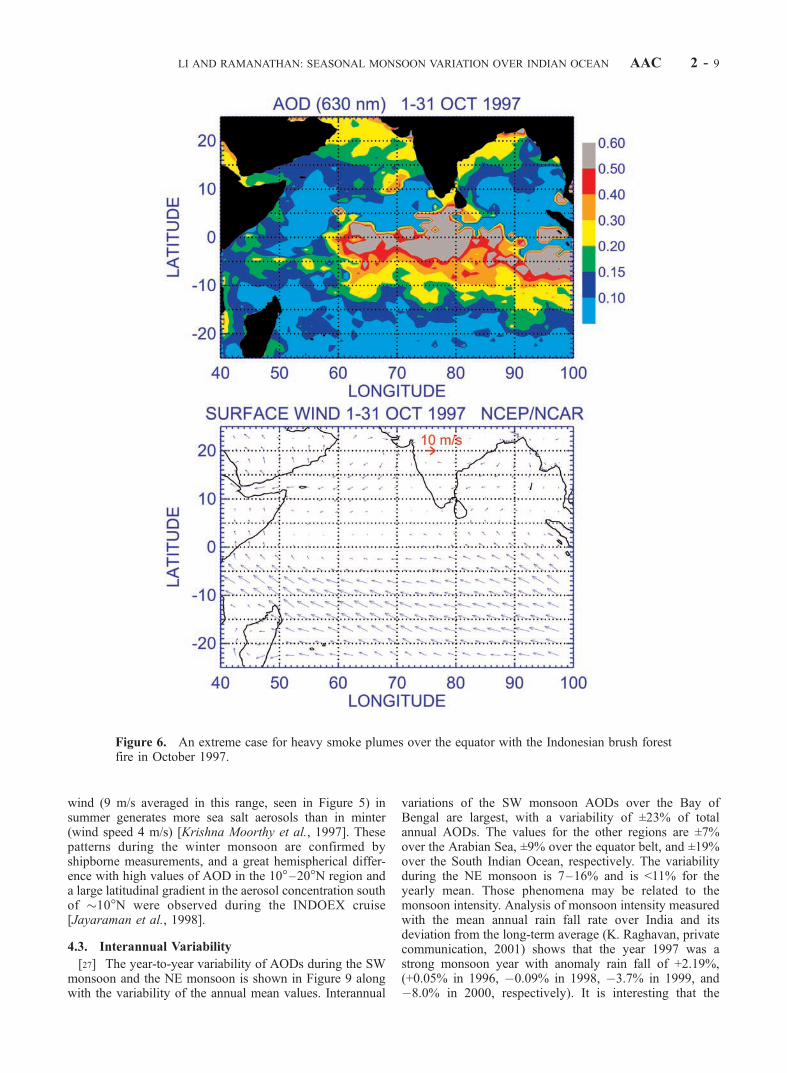
[20] During the transition months (April–May and Sep-tember–November) the patterns are a hybrid mix of the twopatterns described above. AOD distribution in the southIndian Ocean is also characterized by long-range transportof aerosol plumes originating from the surrounding land-masses. The continental influence is particularly strongduring June–September, when AODs over the open oceanreach values as large as 0.2 between 10� and 20�S. Theorigin of these high values is most likely westward transportof biomass plumes from Indonesia and continental aerosolsfrom Australia.[21] Figure 6 shows an extreme case of heavy smoke
plumes associated with episodes of the Indonesian brush
Figure 4. Maps of AODs during the (top) winter monsoon (January, February, and March) and (bottom)summer monsoon (June, July, and August), averaged for the 5 years from 1996 to 2000.
LI AND RAMANATHAN: SEASONAL MONSOON VARIATION OVER INDIAN OCEAN AAC 2 - 7
and forest fire in October 1997 (an El Nino year). During1997 the seasonal rains were delayed by El Nino, whichcaused droughts in the western Pacific and major forest firesover Indonesia [Pearce, 1997, 1998]. The conflagration of1997 was the most expensive bonfire in history, as the year’s
El Nino was the most intense of the last century. The strongeasterly or southeasterly wind flow transported the thicksmoke aerosols over the equatorial zone and the south IndianOcean. The fire lasted about 5 months, set in late July anddoused briefly bymonsoon rain in December [Pearce, 1998].
4.2. Annual Cycle
[22] The annual cycle is shown in Figure 7. The ArabianSea has a distinct seasonal cycle (Figure 7a) with peakvalues in the summer months. The rest of the regions(Figures 7b–7d) have weaker amplitudes and differentphases. The error bars display the maximum and minimumof monthly mean AODs and are an indication of interannualvariability (discussed in more detail in section 4.3). Themaximum monthly mean value (�0.6) of AOD during thesummer is 3 times larger than that during the winter (0.2).The maximum AOD is comparable to the value (0.63)derived by Husar et al. [1997] for the 2-year data (1989–1991). A large fluctuation (0.2 � 0.4) occurs in May,because the transition of the monsoon from one type toanother often occurs in this month.[23] The Bay of Bengal cycle peaks in May (Figure 7b),
whereas the south Indian Ocean AODs peak around Sep-tember. For the Bay of Bengal (Figure 7b), AOD reachesmaximum values in May, but the largest variations (as givenby the error bars) are observed during June–August becauseof large interannual variations in rainfall. Aerosol seasonalvariation over the equatorial belt is usually quite weak (seenin Figure 7c). The large interannual variability (also seensection 4.3) for October and November is associated withthe episode of the 1997 Indonesian brush and forest fires[Jack and Eddy, 1999].[24] Although the South Indian Ocean is far from the
densely habited continents, it is still affected by the seasonaltransport of injected aerosols. Figure 7d shows the seasonalvariation of AOD over this area. It can be seen that AODs inthe months of January through June are �0.08, a level ofremote ocean background aerosols [Husar et al., 1997].During the period July to October the AODs rise to �0.12,associated with the westward transport of Indonesian smokeplumes. Several studies [Malingreau et al., 1985; Husar etal., 1997] showed that monthly averaged AODs in theIndonesia area have a strong pattern with peak values inSeptember–October, which would help explain the Sep-tember–October peaks in Figure 7d.[25] The latitudinal profiles of AOD over the tropical
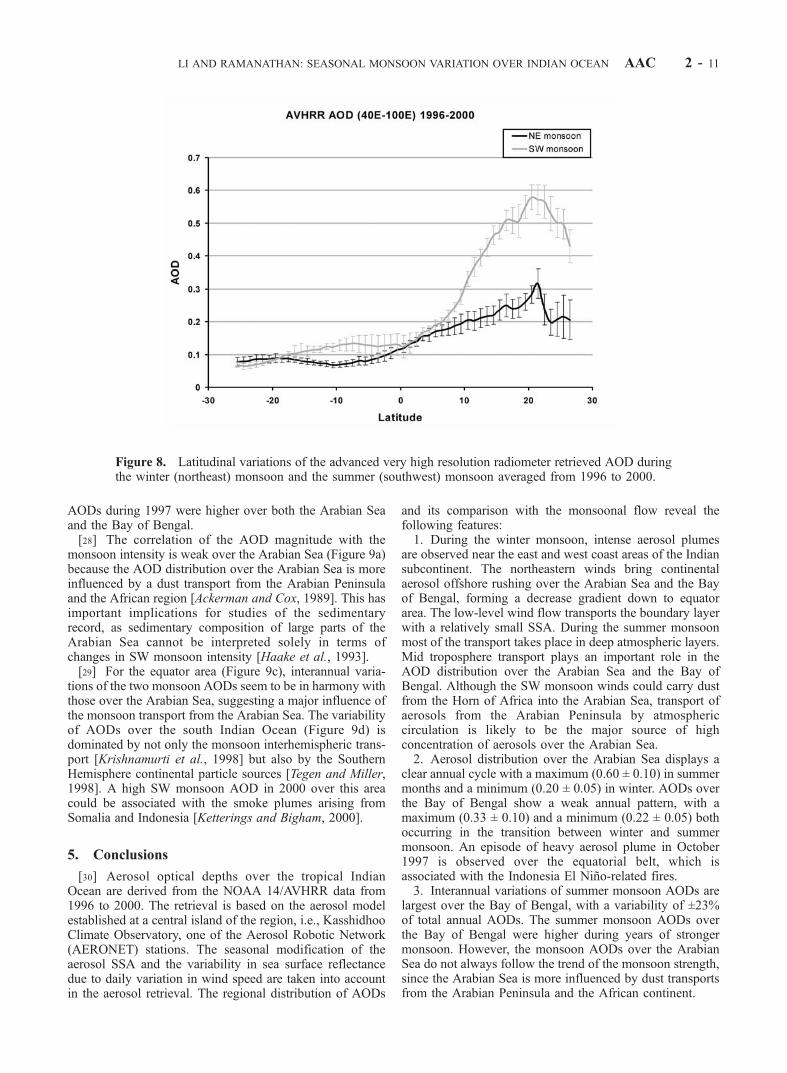
Indian Ocean during the monsoon seasons are derived byaveraging all the AOD values in the longitude range 40� �100�E. Figure 8 shows the latitudinal variation of AOD inthe 5-year average from 1996 to 2000. The error barsdisplay the standard deviation of the monsoon mean AODs.[26] The general features revealed by Figure 8 are as
follows: (1) The AOD in the Northern Hemisphere is largerthan that in the Southern Hemisphere by a factor of �5. (2)The AOD maxima during both the NE monsoon and theSW monsoon are located at �20�N. (3) The northwardmigration of the AOD minima from winter monsoon tosummer monsoon follows the migration of the ITCZ. (4)The AOD values in the latitude range 0� � 18�S during theSW monsoon are higher than that during the NE monsoon.The higher SW monsoon AOD in this range may beassociated with the higher surface wind speed. The strong
Figure 5. Prevailing seasonal mean atmospheric circula-tion (a) for the winter monsoon in January, February, andMarch and (b) for the summer monsoon in June, July, andAugust and (c) in the summer at 700 hPa based on theNational Centers for Environmental Prediction/NationalCenter for Atmospheric Research reanalysis from Januarythrough December 1999.
AAC 2 - 8 LI AND RAMANATHAN: SEASONAL MONSOON VARIATION OVER INDIAN OCEAN
wind (9 m/s averaged in this range, seen in Figure 5) insummer generates more sea salt aerosols than in minter(wind speed 4 m/s) [Krishna Moorthy et al., 1997]. Thesepatterns during the winter monsoon are confirmed byshipborne measurements, and a great hemispherical differ-ence with high values of AOD in the 10�–20�N region anda large latitudinal gradient in the aerosol concentration southof �10�N were observed during the INDOEX cruise[Jayaraman et al., 1998].
4.3. Interannual Variability
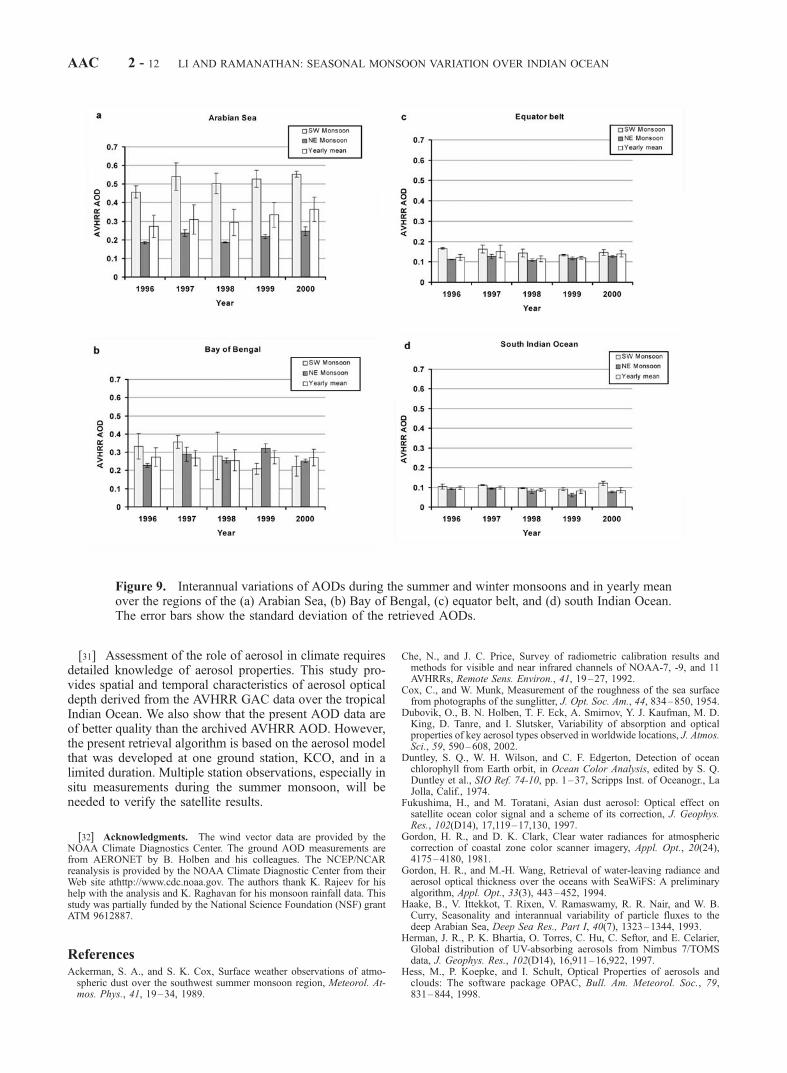
[27] The year-to-year variability of AODs during the SWmonsoon and the NE monsoon is shown in Figure 9 alongwith the variability of the annual mean values. Interannual
variations of the SW monsoon AODs over the Bay ofBengal are largest, with a variability of ±23% of totalannual AODs. The values for the other regions are ±7%over the Arabian Sea, ±9% over the equator belt, and ±19%over the South Indian Ocean, respectively. The variabilityduring the NE monsoon is 7–16% and is <11% for theyearly mean. Those phenomena may be related to themonsoon intensity. Analysis of monsoon intensity measuredwith the mean annual rain fall rate over India and itsdeviation from the long-term average (K. Raghavan, privatecommunication, 2001) shows that the year 1997 was astrong monsoon year with anomaly rain fall of +2.19%,(+0.05% in 1996, �0.09% in 1998, �3.7% in 1999, and�8.0% in 2000, respectively). It is interesting that the
Figure 6. An extreme case for heavy smoke plumes over the equator with the Indonesian brush forestfire in October 1997.
LI AND RAMANATHAN: SEASONAL MONSOON VARIATION OVER INDIAN OCEAN AAC 2 - 9
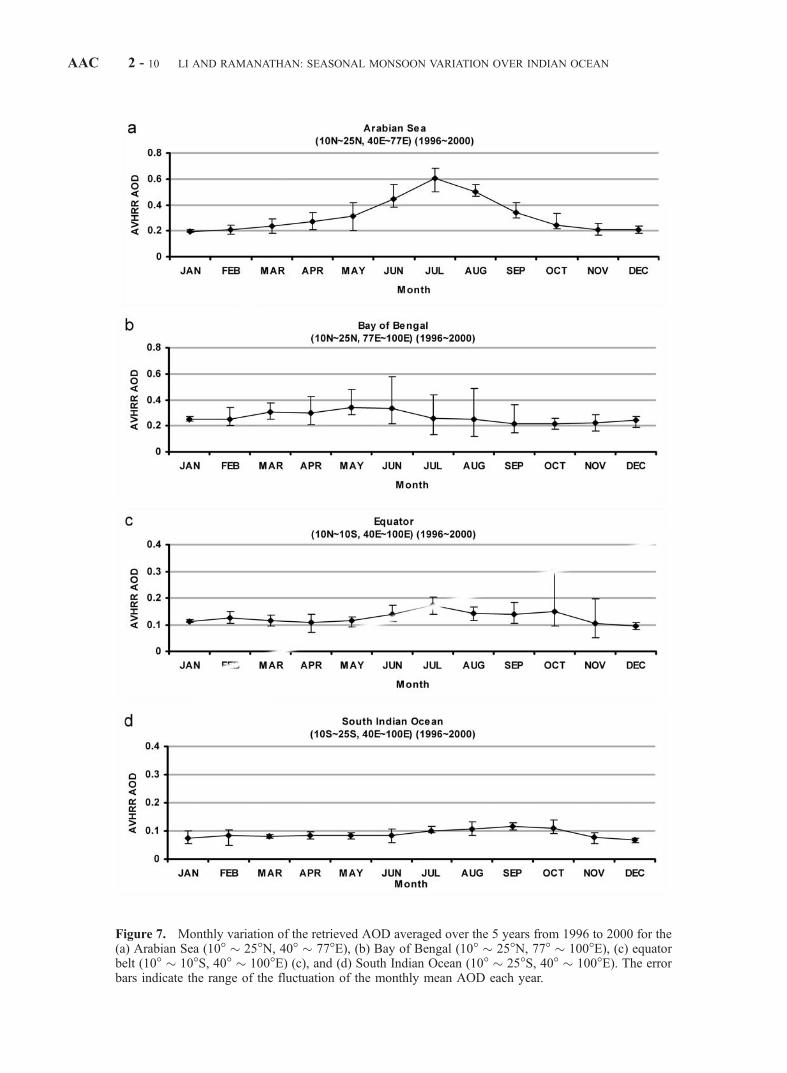
Figure 7. Monthly variation of the retrieved AOD averaged over the 5 years from 1996 to 2000 for the(a) Arabian Sea (10� � 25�N, 40� � 77�E), (b) Bay of Bengal (10� � 25�N, 77� � 100�E), (c) equatorbelt (10� � 10�S, 40� � 100�E) (c), and (d) South Indian Ocean (10� � 25�S, 40� � 100�E). The errorbars indicate the range of the fluctuation of the monthly mean AOD each year.
AAC 2 - 10 LI AND RAMANATHAN: SEASONAL MONSOON VARIATION OVER INDIAN OCEAN
AODs during 1997 were higher over both the Arabian Seaand the Bay of Bengal.[28] The correlation of the AOD magnitude with the
monsoon intensity is weak over the Arabian Sea (Figure 9a)because the AOD distribution over the Arabian Sea is moreinfluenced by a dust transport from the Arabian Peninsulaand the African region [Ackerman and Cox, 1989]. This hasimportant implications for studies of the sedimentaryrecord, as sedimentary composition of large parts of theArabian Sea cannot be interpreted solely in terms ofchanges in SW monsoon intensity [Haake et al., 1993].[29] For the equator area (Figure 9c), interannual varia-
tions of the two monsoon AODs seem to be in harmony withthose over the Arabian Sea, suggesting a major influence ofthe monsoon transport from the Arabian Sea. The variabilityof AODs over the south Indian Ocean (Figure 9d) isdominated by not only the monsoon interhemispheric trans-port [Krishnamurti et al., 1998] but also by the SouthernHemisphere continental particle sources [Tegen and Miller,1998]. A high SW monsoon AOD in 2000 over this areacould be associated with the smoke plumes arising fromSomalia and Indonesia [Ketterings and Bigham, 2000].
5. Conclusions
[30] Aerosol optical depths over the tropical IndianOcean are derived from the NOAA 14/AVHRR data from1996 to 2000. The retrieval is based on the aerosol modelestablished at a central island of the region, i.e., KasshidhooClimate Observatory, one of the Aerosol Robotic Network(AERONET) stations. The seasonal modification of theaerosol SSA and the variability in sea surface reflectancedue to daily variation in wind speed are taken into accountin the aerosol retrieval. The regional distribution of AODs
and its comparison with the monsoonal flow reveal thefollowing features:1. During the winter monsoon, intense aerosol plumes
are observed near the east and west coast areas of the Indiansubcontinent. The northeastern winds bring continentalaerosol offshore rushing over the Arabian Sea and the Bayof Bengal, forming a decrease gradient down to equatorarea. The low-level wind flow transports the boundary layerwith a relatively small SSA. During the summer monsoonmost of the transport takes place in deep atmospheric layers.Mid troposphere transport plays an important role in theAOD distribution over the Arabian Sea and the Bay ofBengal. Although the SW monsoon winds could carry dustfrom the Horn of Africa into the Arabian Sea, transport ofaerosols from the Arabian Peninsula by atmosphericcirculation is likely to be the major source of highconcentration of aerosols over the Arabian Sea.2. Aerosol distribution over the Arabian Sea displays a
clear annual cycle with a maximum (0.60 ± 0.10) in summermonths and a minimum (0.20 ± 0.05) in winter. AODs overthe Bay of Bengal show a weak annual pattern, with amaximum (0.33 ± 0.10) and a minimum (0.22 ± 0.05) bothoccurring in the transition between winter and summermonsoon. An episode of heavy aerosol plume in October1997 is observed over the equatorial belt, which isassociated with the Indonesia El Nino-related fires.3. Interannual variations of summer monsoon AODs are
largest over the Bay of Bengal, with a variability of ±23%of total annual AODs. The summer monsoon AODs overthe Bay of Bengal were higher during years of strongermonsoon. However, the monsoon AODs over the ArabianSea do not always follow the trend of the monsoon strength,since the Arabian Sea is more influenced by dust transportsfrom the Arabian Peninsula and the African continent.
Figure 8. Latitudinal variations of the advanced very high resolution radiometer retrieved AOD duringthe winter (northeast) monsoon and the summer (southwest) monsoon averaged from 1996 to 2000.
LI AND RAMANATHAN: SEASONAL MONSOON VARIATION OVER INDIAN OCEAN AAC 2 - 11
[31] Assessment of the role of aerosol in climate requiresdetailed knowledge of aerosol properties. This study pro-vides spatial and temporal characteristics of aerosol opticaldepth derived from the AVHRR GAC data over the tropicalIndian Ocean. We also show that the present AOD data areof better quality than the archived AVHRR AOD. However,the present retrieval algorithm is based on the aerosol modelthat was developed at one ground station, KCO, and in alimited duration. Multiple station observations, especially insitu measurements during the summer monsoon, will beneeded to verify the satellite results.
[32] Acknowledgments. The wind vector data are provided by theNOAA Climate Diagnostics Center. The ground AOD measurements arefrom AERONET by B. Holben and his colleagues. The NCEP/NCARreanalysis is provided by the NOAA Climate Diagnostic Center from theirWeb site athttp://www.cdc.noaa.gov. The authors thank K. Rajeev for hishelp with the analysis and K. Raghavan for his monsoon rainfall data. Thisstudy was partially funded by the National Science Foundation (NSF) grantATM 9612887.
ReferencesAckerman, S. A., and S. K. Cox, Surface weather observations of atmo-spheric dust over the southwest summer monsoon region, Meteorol. At-mos. Phys., 41, 19–34, 1989.
Che, N., and J. C. Price, Survey of radiometric calibration results andmethods for visible and near infrared channels of NOAA-7, -9, and 11AVHRRs, Remote Sens. Environ., 41, 19–27, 1992.
Cox, C., and W. Munk, Measurement of the roughness of the sea surfacefrom photographs of the sunglitter, J. Opt. Soc. Am., 44, 834–850, 1954.
Dubovik, O., B. N. Holben, T. F. Eck, A. Smirnov, Y. J. Kaufman, M. D.King, D. Tanre, and I. Slutsker, Variability of absorption and opticalproperties of key aerosol types observed in worldwide locations, J. Atmos.Sci. , 59, 590 – 608, 2002.
Duntley, S. Q., W. H. Wilson, and C. F. Edgerton, Detection of oceanchlorophyll from Earth orbit, in Ocean Color Analysis, edited by S. Q.Duntley et al., SIO Ref. 74-10, pp. 1–37, Scripps Inst. of Oceanogr., LaJolla, Calif., 1974.
Fukushima, H., and M. Toratani, Asian dust aerosol: Optical effect onsatellite ocean color signal and a scheme of its correction, J. Geophys.Res., 102(D14), 17,119–17,130, 1997.
Gordon, H. R., and D. K. Clark, Clear water radiances for atmosphericcorrection of coastal zone color scanner imagery, Appl. Opt., 20(24),4175–4180, 1981.
Gordon, H. R., and M.-H. Wang, Retrieval of water-leaving radiance andaerosol optical thickness over the oceans with SeaWiFS: A preliminaryalgorithm, Appl. Opt., 33(3), 443–452, 1994.
Haake, B., V. Ittekkot, T. Rixen, V. Ramaswamy, R. R. Nair, and W. B.Curry, Seasonality and interannual variability of particle fluxes to thedeep Arabian Sea, Deep Sea Res., Part I, 40(7), 1323–1344, 1993.
Herman, J. R., P. K. Bhartia, O. Torres, C. Hu, C. Seftor, and E. Celarier,Global distribution of UV-absorbing aerosols from Nimbus 7/TOMSdata, J. Geophys. Res., 102(D14), 16,911–16,922, 1997.
Hess, M., P. Koepke, and I. Schult, Optical Properties of aerosols andclouds: The software package OPAC, Bull. Am. Meteorol. Soc., 79,831–844, 1998.
Figure 9. Interannual variations of AODs during the summer and winter monsoons and in yearly meanover the regions of the (a) Arabian Sea, (b) Bay of Bengal, (c) equator belt, and (d) south Indian Ocean.The error bars show the standard deviation of the retrieved AODs.
AAC 2 - 12 LI AND RAMANATHAN: SEASONAL MONSOON VARIATION OVER INDIAN OCEAN
Holben, B. N., et al., AERONET: A federated instrument network and dataarchive for aerosol characterization, Remote Sens. Environ., 66, 1–16,1998.
Husar, R. B., J. M. Prospero, and L. L. Stowe, Characterization of tropo-spheric aerosols over the ocean with the NOAA advanced very highresolution radiometer optical thickness operational product, J. Geophys.Res., 102(D14), 16,889–16,909, 1997.
Jack, J., and B. Eddy, The great El Nino of 1997–1998: Impact on pre-cipitation and temperature, Consequences Nature Implications Environ.Change, 5, 17–26, 1999.
Jayaraman, A., D. Lubin, S. Ramchandran, V. Ramanathan, E. Woodbridge,W. D. Collins, and K. S. Zalpuri, Direct observations of aerosol radiativeforcing over the tropical Indian Ocean during the January–February 1996pre-INDOEX cruise, J. Geophys. Res., 103(D12), 13,827 – 13,836,1998.
Kaufman, Y. J., and B. N. Holben, Calibration of the AVHRR visible andnear-IR bands by atmospheric scattering, ocean glint and desert reflec-tion, Int. J. Remote Sens., 14, 21–52, 1993.
Kaufman, Y. J., A. Gitelson, A. Karnieli, E. Ganor, R. S. Fraser, T. Naka-jima, S. Mattoo, and B. N. Holben, Size distribution and scattering phasefunction of aerosol particles retrieved from sky brightness measurements,J. Geophys. Res., 99(D5), 10,341–10,356, 1994.
Kaufman, Y. J., A. Smirnov, B. N. Holben, and O. Dubovik, Baselinemaritime aerosol: Methodology to derive the optical thickness and scat-tering properties, Geophys. Res. Lett., 28(17), 3251–3256, 2001.
Ketterings, Q. M., and J. M. Bigham, Soil color as an indicator of slash-and-burn fire severity and soil fertility in Sumatra, Indonesia, Soil Sci.Soc. Am. J., 64(4), 1826–1832, 2000.
Kriebel, K. T., Cloud detection using AVHRR data, in Advances in the Useof NOAA AVHRR Data for Land Application, edited by G. D’Souza, A.S. Belward, and J. Malingreau, pp. 195–210, Kluwer Acad., Norwell,Mass., 1996.
Krishna Moorthy, K., S. K. Satheesh, and B. V. Krishna Murthy, Investiga-tion of marine aerosol over the tropical Indian Ocean, J. Geophys. Res.,102, 18,827–18,842, 1997.
Krishnamurti, T. N., B. Jha, J. M. Prospero, A. Jayaraman, and V. Rama-nathan, Aerosol and pollutant transport and their impact on radiative overthe tropical Indian Ocean during the January–February 1996 pre-IN-DOEX cruise, Tellus, Ser. B, 50, 521–542, 1998.
Loeb, N. G., In-flight calibration of NOAA AVHRR visible and near-IRbands over Greenland and Antarctica, Int. J. Remote Sens., 18, 477–490,1997.
Malingreau, J. P., G. Stephens, and L. Fellows, Remote sensing of forestfires: Kalimantan and North Borneo in 1982–83, Ambio, 14, 314–321,1985.
Moore, G. F., J. Aiken, and S. J. Lavender, The atmospheric correction ofwater color and the quantitative retrieval of suspended particulate matterin case II waters: Application to MERIS, Int. J. Remote Sens., 20, 1713–1733, 1999.
Pearce, F., Incendiary policies (fires in Indonesia caused by land clearance),New Sci., 156(2102), 4–5, 1997.
Pearce, F., Playing with fire (preventing forest fires in Indonesia), New Sci.,157(2126), 36–40, 1998.
Rajeev, K., V. Ramanathan, and J. Meywerk, Regional aerosol distributionand its long-range transport over the Indian Ocean, J. Geophys. Res.,105(D2), 2029–2043, 2000.
Ramanathan, V., et al., Indian Ocean Experiment (INDOEX), White Pap.C4, Publ.143, Scripps Inst. of Oceanogr., La Jolla, Calif., 1995.
Ramanathan, V., et al., Indian Ocean Experiment (INDOEX), White Pap.C4, Publ.162, Scripps Inst. of Oceanogr., La Jolla, Calif., 1996.
Ramanathan, V., et al., Indian Ocean Experiment: An integrated analysis ofthe climate forcing and effects of the great Indo-Asian haze, J. Geophys.Res., 106(D22), 28,371–28,398, 2001.
Rao, C. R. N., and J. Chen, Inter-satellite calibration linkages for the visibleand near-infrared channels of the advanced very high resolution radio-meter on the NOAA-7, -9, and -11 spacecraft, Int. J. Remote Sens., 16,21–52, 1995.
Rao, C. R. N., and J. Chen, Revised post-launch calibration of the visibleand near-infrared channels of the advanced very high resolution radio-meter (AVHRR) on the NOAA-14 spacecraft, Int. J. Remote Sens., 18,3485–3491, 1999.
Satheesh, S. K., V. Ramannathan, X. Li-Jones, J. M. Lobert, I. A. Podgorny,J. M. Prospero, B.N. Holben, and N. G. Loeb, A model for the naturaland anthropogenic aerosols over the tropical Indian Ocean derived fromIndian Ocean Experiment data, J. Geophys. Res., 104(D22), 27,421–27,440, 1999.
Saunders, R. W., and K. T. Kriebel, An improved method for detecting clearsky and cloudy radiances from AVHRR data, Int. J. Remote Sens., 9,123–150, 1988.
Sokolik, I. N., and O. B. Toon, Incorporation of mineralogical compositioninto models of the radiative properties of mineral aerosol from UV to IRwavelengths, J. Geophys. Res., 104(D8), 9423–9444, 1999.
Tahnk, W. R., INDOEX aerosol optical depths and radiative forcing derivedfrom AVHRR, Ph.D. thesis, Oreg. State Univ., Corvallis, 2001.
Tanre, D., P. Y. Deschamps, C. Devaux, and M. Merman, Estimation ofSaharan aerosol optical thickness from blurring effects in thematic map-per data, J. Geophys. Res., 93(D12), 15,955–15,964, 1988.
Tegen, I., and R. Miller, A general circulation model study on the inter-annual variability of soil dust aerosol, J. Geophys. Res., 103(D20),25,975–25,995, 1998.
�����������F. Li and V. Ramanathan, Center for Atmospheric Sciences, Center for
Clouds, Chemistry and Climate, Scripps Institution of Oceanography,University of California, San Diego, 9500 Gilman Drive, Mail Code 0221,La Jolla, CA 92093-0221, USA. ([email protected];[email protected])
LI AND RAMANATHAN: SEASONAL MONSOON VARIATION OVER INDIAN OCEAN AAC 2 - 13