winter 2017 enrollment report - grand valley state university · enrollment report 1. enrollment...
TRANSCRIPT
Winter 2017
Enrollment Report
1
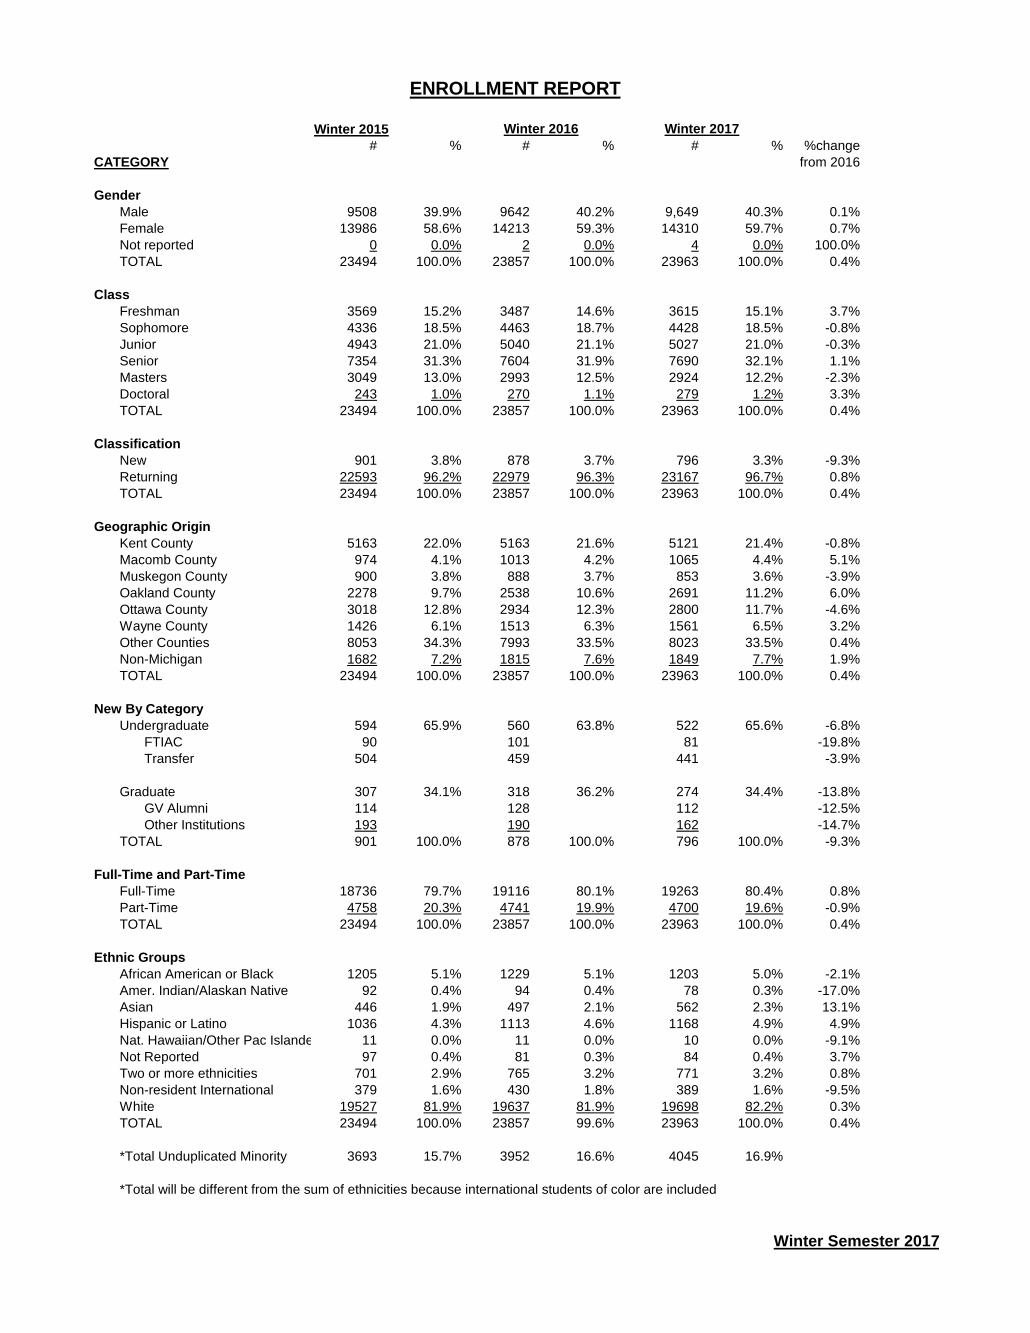
ENROLLMENT REPORT
Winter 2015
# % # % # % %change
CATEGORY from 2016
Gender
Male 9508 39.9% 9642 40.2% 9,649 40.3% 0.1%
Female 13986 58.6% 14213 59.3% 14310 59.7% 0.7%
Not reported 0 0.0% 2 0.0% 4 0.0% 100.0%
TOTAL 23494 100.0% 23857 100.0% 23963 100.0% 0.4%
Class
Freshman 3569 15.2% 3487 14.6% 3615 15.1% 3.7%
Sophomore 4336 18.5% 4463 18.7% 4428 18.5% -0.8%
Junior 4943 21.0% 5040 21.1% 5027 21.0% -0.3%
Senior 7354 31.3% 7604 31.9% 7690 32.1% 1.1%
Masters 3049 13.0% 2993 12.5% 2924 12.2% -2.3%
Doctoral 243 1.0% 270 1.1% 279 1.2% 3.3%
TOTAL 23494 100.0% 23857 100.0% 23963 100.0% 0.4%
Classification
New 901 3.8% 878 3.7% 796 3.3% -9.3%
Returning 22593 96.2% 22979 96.3% 23167 96.7% 0.8%
TOTAL 23494 100.0% 23857 100.0% 23963 100.0% 0.4%
Geographic Origin
Kent County 5163 22.0% 5163 21.6% 5121 21.4% -0.8%
Macomb County 974 4.1% 1013 4.2% 1065 4.4% 5.1%
Muskegon County 900 3.8% 888 3.7% 853 3.6% -3.9%
Oakland County 2278 9.7% 2538 10.6% 2691 11.2% 6.0%
Ottawa County 3018 12.8% 2934 12.3% 2800 11.7% -4.6%
Wayne County 1426 6.1% 1513 6.3% 1561 6.5% 3.2%
Other Counties 8053 34.3% 7993 33.5% 8023 33.5% 0.4%
Non-Michigan 1682 7.2% 1815 7.6% 1849 7.7% 1.9%
TOTAL 23494 100.0% 23857 100.0% 23963 100.0% 0.4%
New By Category
Undergraduate 594 65.9% 560 63.8% 522 65.6% -6.8%
FTIAC 90 101 81 -19.8%
Transfer 504 459 441 -3.9%
Graduate 307 34.1% 318 36.2% 274 34.4% -13.8%
GV Alumni 114 128 112 -12.5%
Other Institutions 193 190 162 -14.7%
TOTAL 901 100.0% 878 100.0% 796 100.0% -9.3%
Full-Time and Part-Time
Full-Time 18736 79.7% 19116 80.1% 19263 80.4% 0.8%
Part-Time 4758 20.3% 4741 19.9% 4700 19.6% -0.9%
TOTAL 23494 100.0% 23857 100.0% 23963 100.0% 0.4%
Ethnic Groups
African American or Black 1205 5.1% 1229 5.1% 1203 5.0% -2.1%
Amer. Indian/Alaskan Native 92 0.4% 94 0.4% 78 0.3% -17.0%
Asian 446 1.9% 497 2.1% 562 2.3% 13.1%
Hispanic or Latino 1036 4.3% 1113 4.6% 1168 4.9% 4.9%
Nat. Hawaiian/Other Pac Islander 11 0.0% 11 0.0% 10 0.0% -9.1%
Not Reported 97 0.4% 81 0.3% 84 0.4% 3.7%
Two or more ethnicities 701 2.9% 765 3.2% 771 3.2% 0.8%
Non-resident International 379 1.6% 430 1.8% 389 1.6% -9.5%
White 19527 81.9% 19637 81.9% 19698 82.2% 0.3%
TOTAL 23494 100.0% 23857 99.6% 23963 100.0% 0.4%
*Total Unduplicated Minority 3693 15.7% 3952 16.6% 4045 16.9%
*Total will be different from the sum of ethnicities because international students of color are included
Winter 2016 Winter 2017
Winter Semester 2017
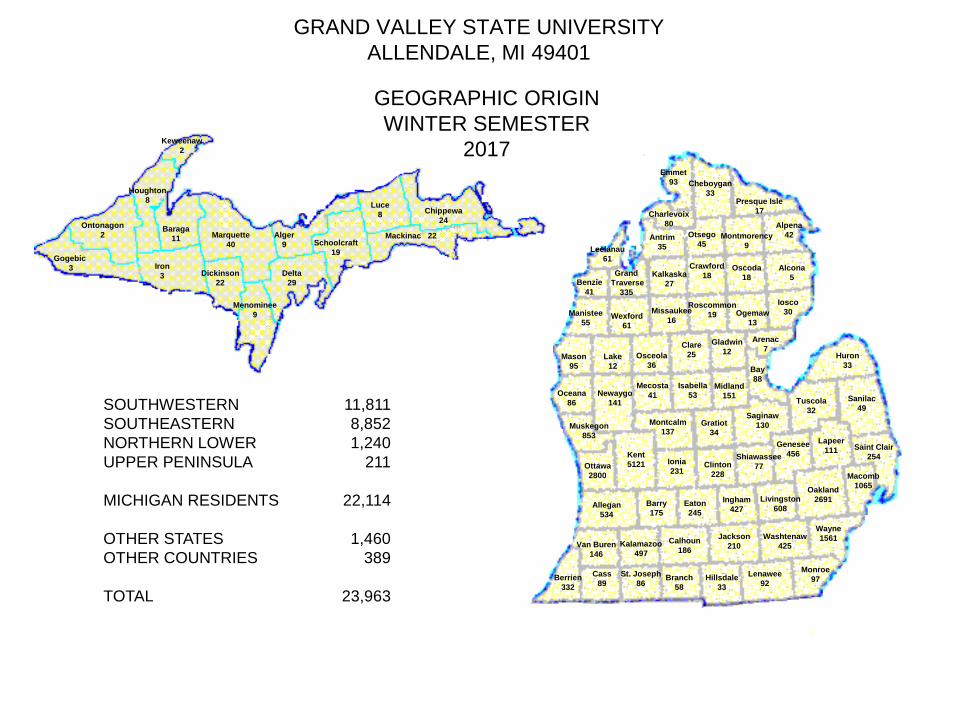
GRAND VALLEY STATE UNIVERSITY
ALLENDALE, MI 49401
Emmet
93 Cheboygan
33Presque Isle
17Charlevoix
80
Antrim
35
Otsego
45Montmorency
9
Alpena
42
Leelanau
61
Benzie
41
Grand
Traverse
335
Kalkaska
27
Crawford
18Oscoda
18
Alcona
5
Manistee
55Wexford
61
Missaukee
16
Roscommon
19 Ogemaw
13
Iosco
30
Mason
95
Lake
12
Osceola
36
Clare
25
Gladwin
12
Arenac
7
Oceana
86
Newaygo
141
Mecosta
41
Isabella
53Midland
151
Clinton
228
Bay
88
Huron
33
Muskegon
853
Montcalm
137
Kent
5121Ottawa
2800
Allegan
534
Ionia
231
Gratiot
34
Saginaw
130
Shiawassee
77
Genesee
456
Tuscola
32
Sanilac
49
Lapeer
111 Saint Clair
254
Barry
175
Eaton
245
Ingham
427
Livingston
608
Oakland
2691
Macomb
1065
Wayne
1561Washtenaw
425
Jackson
210Calhoun
186Kalamazoo
497Van Buren
146
Berrien
332
Cass
89
St. Joseph
86Branch
58
Hillsdale
33
Lenawee
92
Monroe
97
Chippewa
24
Mackinac 22
Luce
8
Schoolcraft
19
Alger
9
Delta
29
Menominee
9
Dickinson
22
Marquette
40
Baraga
11
Iron
3
Houghton
8
Keweenaw
2
Ontonagon
2
Gogebic
3
SOUTHWESTERN 11,811
SOUTHEASTERN 8,852
NORTHERN LOWER 1,240
UPPER PENINSULA 211
MICHIGAN RESIDENTS 22,114
OTHER STATES 1,460
OTHER COUNTRIES 389
TOTAL 23,963
GEOGRAPHIC ORIGIN
WINTER SEMESTER
2017
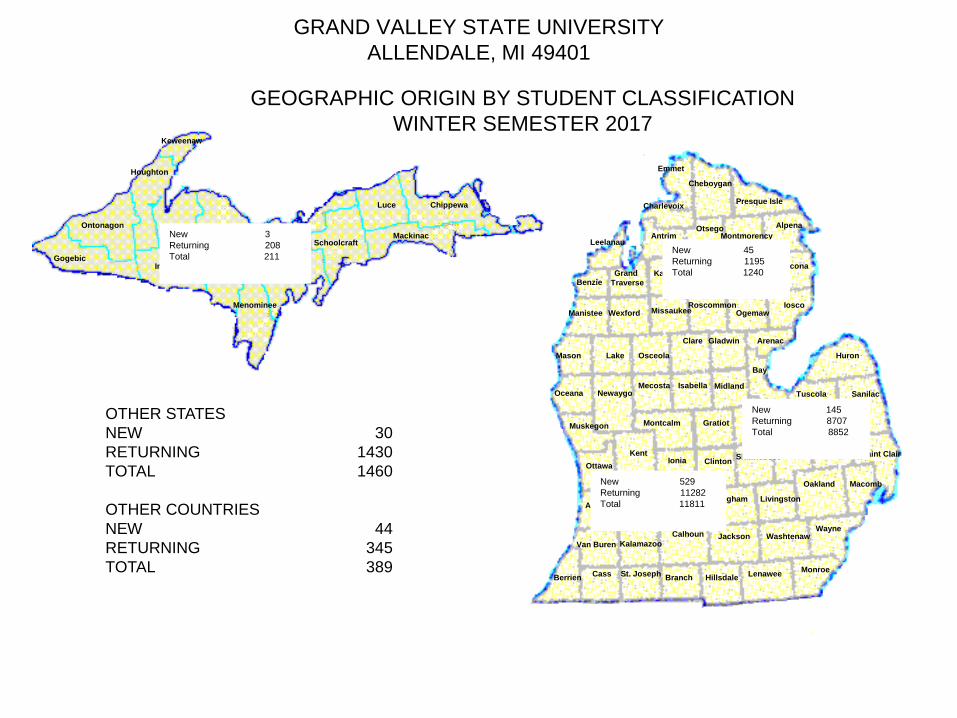
GRAND VALLEY STATE UNIVERSITY
ALLENDALE, MI 49401
Emmet
Cheboygan
Presque IsleCharlevoix
AntrimOtsego
Montmorency
Alpena
Leelanau
BenzieGrand
Traverse
KalkaskaCrawford Oscoda Alcona
Manistee Wexford MissaukeeRoscommon
OgemawIosco
Mason Lake Osceola
Clare Gladwin Arenac
Oceana NewaygoMecosta Isabella Midland
Clinton
Bay
Huron
Muskegon Montcalm
Kent
Ottawa
Allegan
Ionia
GratiotSaginaw
Shiawassee
Genesee
Tuscola Sanilac
Lapeer
Saint Clair
Barry Eaton Ingham Livingston
Oakland Macomb
WayneWashtenawJacksonCalhoun
KalamazooVan Buren
BerrienCass St. Joseph
Branch HillsdaleLenawee
Monroe
Chippewa
Mackinac
Luce
SchoolcraftAlger
Delta
Menominee
Dickinson
MarquetteBaraga
Iron
Houghton
Keweenaw
Ontonagon
Gogebic
OTHER STATES
NEW 30
RETURNING 1430
TOTAL 1460
OTHER COUNTRIES
NEW 44
RETURNING 345
TOTAL 389
GEOGRAPHIC ORIGIN BY STUDENT CLASSIFICATION
WINTER SEMESTER 2017
New 3
Returning 208
Total 211New 45
Returning 1195
Total 1240
New 145
Returning 8707
Total 8852
New 529
Returning 11282
Total 11811
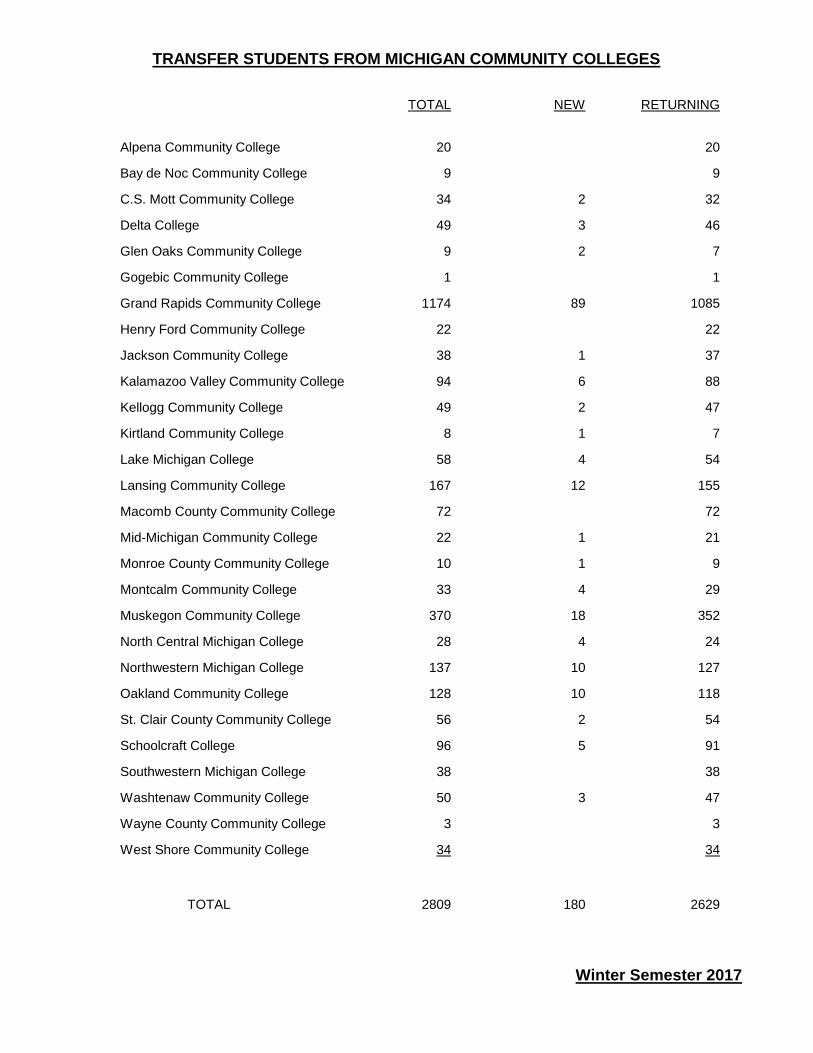
TRANSFER STUDENTS FROM MICHIGAN COMMUNITY COLLEGES
TOTAL NEW RETURNING
Alpena Community College 20 20
Bay de Noc Community College 9 9
C.S. Mott Community College 34 2 32
Delta College 49 3 46
Glen Oaks Community College 9 2 7
Gogebic Community College 1 1
Grand Rapids Community College 1174 89 1085
Henry Ford Community College 22 22
Jackson Community College 38 1 37
Kalamazoo Valley Community College 94 6 88
Kellogg Community College 49 2 47
Kirtland Community College 8 1 7
Lake Michigan College 58 4 54
Lansing Community College 167 12 155
Macomb County Community College 72 72
Mid-Michigan Community College 22 1 21
Monroe County Community College 10 1 9
Montcalm Community College 33 4 29
Muskegon Community College 370 18 352
North Central Michigan College 28 4 24
Northwestern Michigan College 137 10 127
Oakland Community College 128 10 118
St. Clair County Community College 56 2 54
Schoolcraft College 96 5 91
Southwestern Michigan College 38 38
Washtenaw Community College 50 3 47
Wayne County Community College 3 3
West Shore Community College 34 34
TOTAL 2809 180 2629
Winter Semester 2017
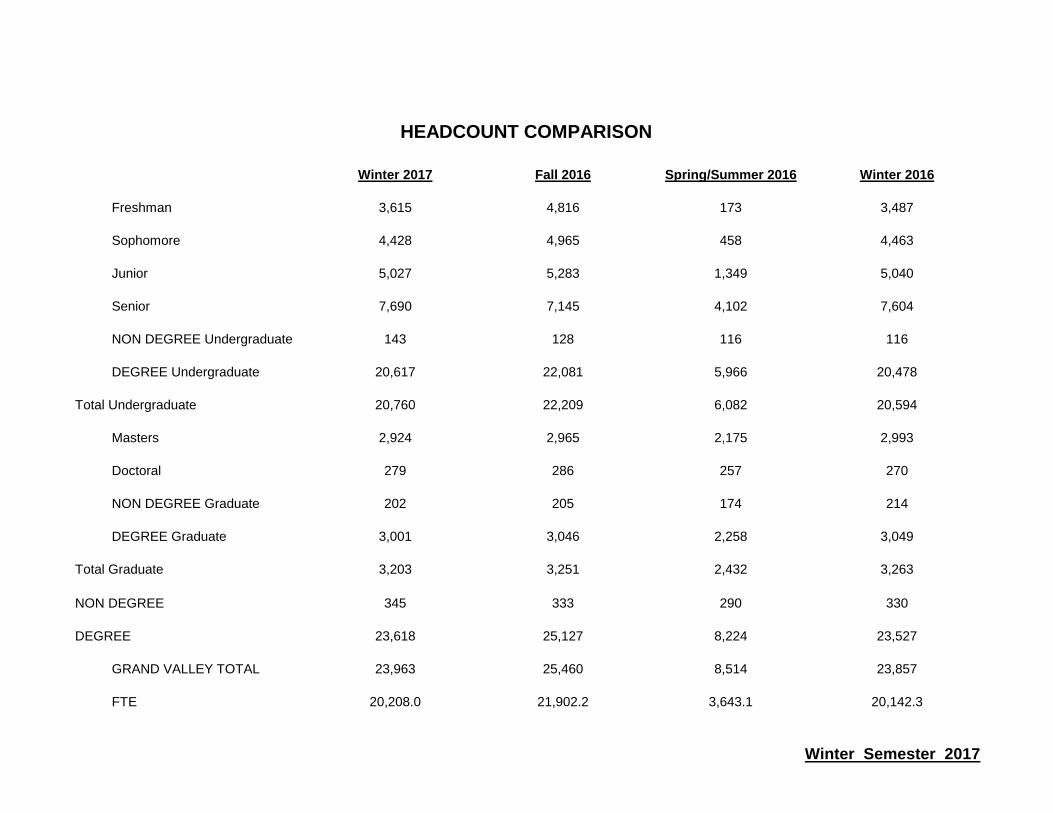
HEADCOUNT COMPARISON
Winter 2017 Fall 2016 Spring/Summer 2016 Winter 2016
Freshman 3,615 4,816 173 3,487
Sophomore 4,428 4,965 458 4,463
Junior 5,027 5,283 1,349 5,040
Senior 7,690 7,145 4,102 7,604
NON DEGREE Undergraduate 143 128 116 116
DEGREE Undergraduate 20,617 22,081 5,966 20,478
Total Undergraduate 20,760 22,209 6,082 20,594
Masters 2,924 2,965 2,175 2,993
Doctoral 279 286 257 270
NON DEGREE Graduate 202 205 174 214
DEGREE Graduate 3,001 3,046 2,258 3,049
Total Graduate 3,203 3,251 2,432 3,263
NON DEGREE 345 333 290 330
DEGREE 23,618 25,127 8,224 23,527
GRAND VALLEY TOTAL 23,963 25,460 8,514 23,857
FTE 20,208.0 21,902.2 3,643.1 20,142.3
Winter Semester 2017
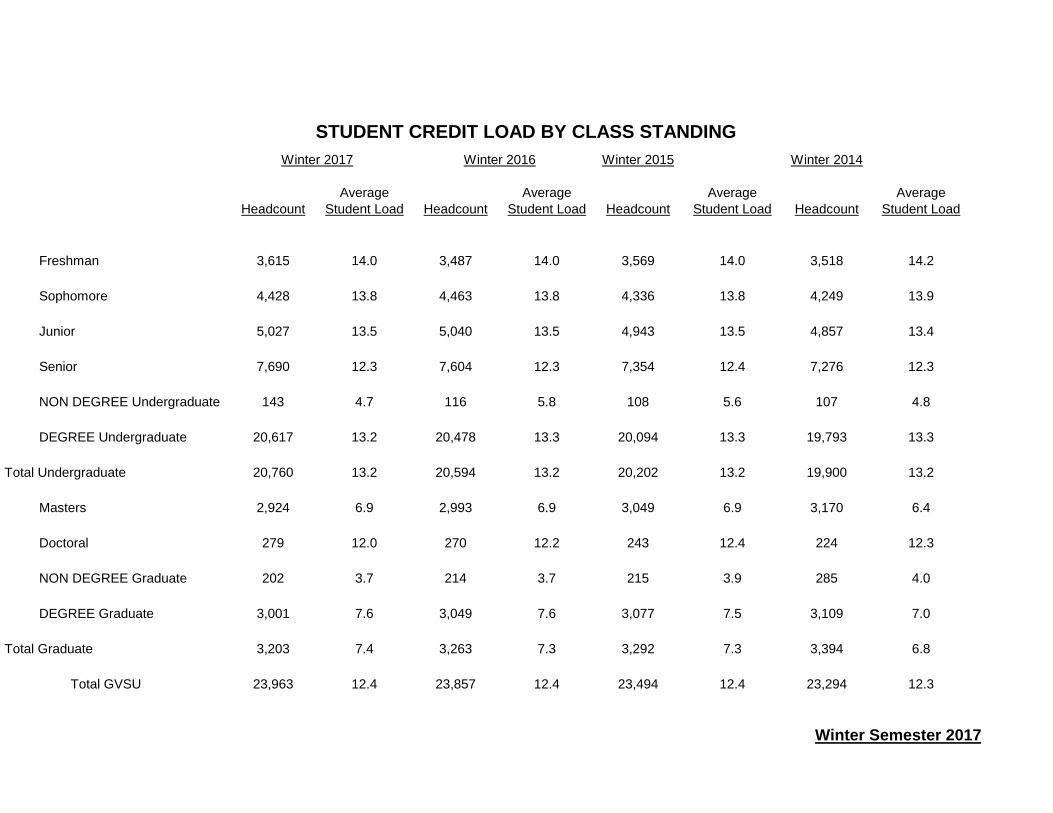
STUDENT CREDIT LOAD BY CLASS STANDING
Winter 2015 Winter 2014
Average Average Average Average
Headcount Student Load Headcount Student Load Headcount Student Load Headcount Student Load
Freshman 3,615 14.0 3,487 14.0 3,569 14.0 3,518 14.2
Sophomore 4,428 13.8 4,463 13.8 4,336 13.8 4,249 13.9
Junior 5,027 13.5 5,040 13.5 4,943 13.5 4,857 13.4
Senior 7,690 12.3 7,604 12.3 7,354 12.4 7,276 12.3
NON DEGREE Undergraduate 143 4.7 116 5.8 108 5.6 107 4.8
DEGREE Undergraduate 20,617 13.2 20,478 13.3 20,094 13.3 19,793 13.3
Total Undergraduate 20,760 13.2 20,594 13.2 20,202 13.2 19,900 13.2
Masters 2,924 6.9 2,993 6.9 3,049 6.9 3,170 6.4
Doctoral 279 12.0 270 12.2 243 12.4 224 12.3
NON DEGREE Graduate 202 3.7 214 3.7 215 3.9 285 4.0
DEGREE Graduate 3,001 7.6 3,049 7.6 3,077 7.5 3,109 7.0
Total Graduate 3,203 7.4 3,263 7.3 3,292 7.3 3,394 6.8
Total GVSU 23,963 12.4 23,857 12.4 23,494 12.4 23,294 12.3
Winter 2017 Winter 2016
Winter Semester 2017
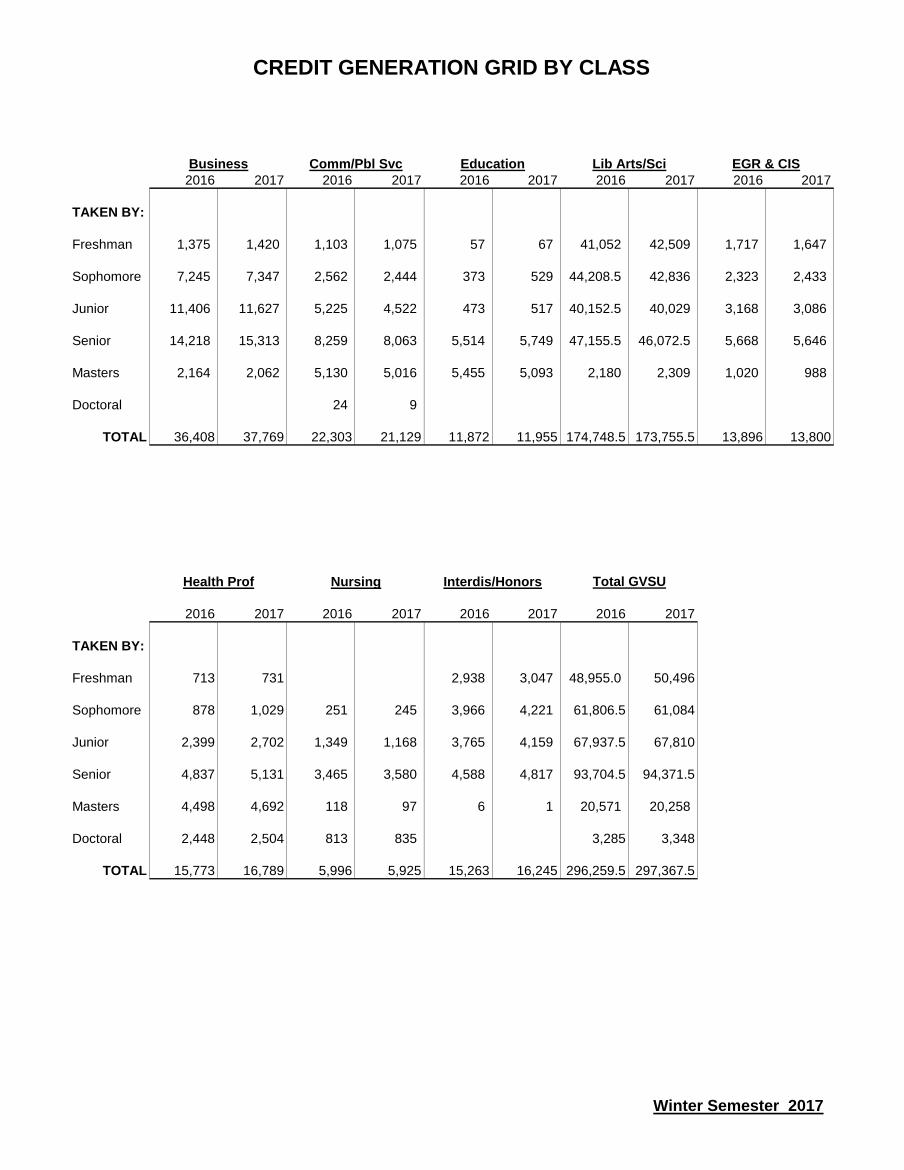
CREDIT GENERATION GRID BY CLASS
Business Comm/Pbl Svc Education Lib Arts/Sci EGR & CIS
2016 2017 2016 2017 2016 2017 2016 2017 2016 2017
TAKEN BY:
Freshman 1,375 1,420 1,103 1,075 57 67 41,052 42,509 1,717 1,647
Sophomore 7,245 7,347 2,562 2,444 373 529 44,208.5 42,836 2,323 2,433
Junior 11,406 11,627 5,225 4,522 473 517 40,152.5 40,029 3,168 3,086
Senior 14,218 15,313 8,259 8,063 5,514 5,749 47,155.5 46,072.5 5,668 5,646
Masters 2,164 2,062 5,130 5,016 5,455 5,093 2,180 2,309 1,020 988
Doctoral 24 9
TOTAL 36,408 37,769 22,303 21,129 11,872 11,955 174,748.5 173,755.5 13,896 13,800
Health Prof Nursing Interdis/Honors
2016 2017 2016 2017 2016 2017 2016 2017
TAKEN BY:
Freshman 713 731 2,938 3,047 48,955.0 50,496
Sophomore 878 1,029 251 245 3,966 4,221 61,806.5 61,084
Junior 2,399 2,702 1,349 1,168 3,765 4,159 67,937.5 67,810
Senior 4,837 5,131 3,465 3,580 4,588 4,817 93,704.5 94,371.5
Masters 4,498 4,692 118 97 6 1 20,571 20,258
Doctoral 2,448 2,504 813 835 3,285 3,348
TOTAL 15,773 16,789 5,996 5,925 15,263 16,245 296,259.5 297,367.5
Total GVSU
Winter Semester 2017
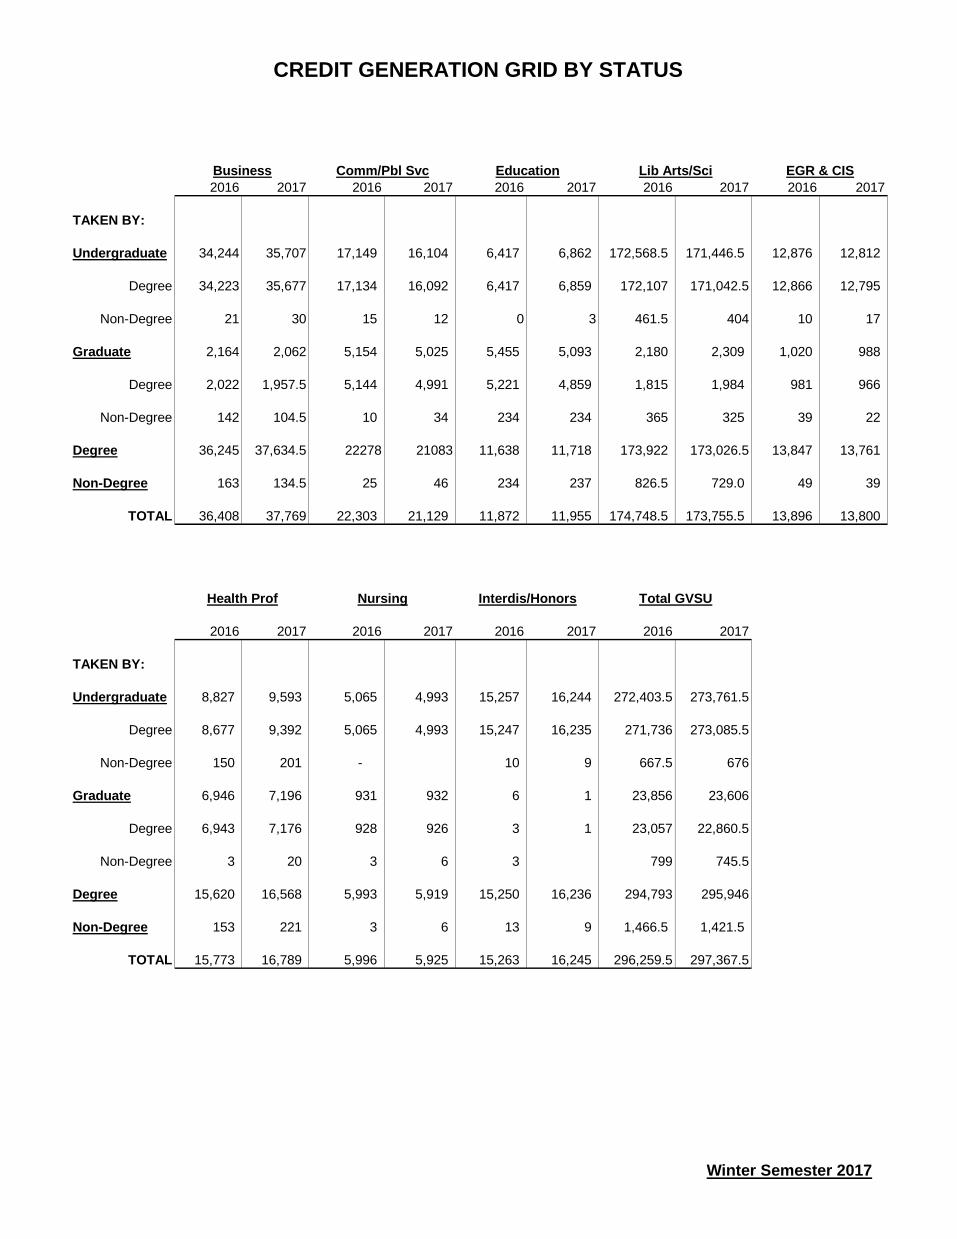
CREDIT GENERATION GRID BY STATUS
Business Comm/Pbl Svc Education Lib Arts/Sci EGR & CIS
2016 2017 2016 2017 2016 2017 2016 2017 2016 2017
TAKEN BY:
Undergraduate 34,244 35,707 17,149 16,104 6,417 6,862 172,568.5 171,446.5 12,876 12,812
Degree 34,223 35,677 17,134 16,092 6,417 6,859 172,107 171,042.5 12,866 12,795
Non-Degree 21 30 15 12 0 3 461.5 404 10 17
Graduate 2,164 2,062 5,154 5,025 5,455 5,093 2,180 2,309 1,020 988
Degree 2,022 1,957.5 5,144 4,991 5,221 4,859 1,815 1,984 981 966
Non-Degree 142 104.5 10 34 234 234 365 325 39 22
Degree 36,245 37,634.5 22278 21083 11,638 11,718 173,922 173,026.5 13,847 13,761
Non-Degree 163 134.5 25 46 234 237 826.5 729.0 49 39
TOTAL 36,408 37,769 22,303 21,129 11,872 11,955 174,748.5 173,755.5 13,896 13,800
Health Prof Nursing Interdis/Honors Total GVSU
2016 2017 2016 2017 2016 2017 2016 2017
TAKEN BY:
Undergraduate 8,827 9,593 5,065 4,993 15,257 16,244 272,403.5 273,761.5
Degree 8,677 9,392 5,065 4,993 15,247 16,235 271,736 273,085.5
Non-Degree 150 201 - 10 9 667.5 676
Graduate 6,946 7,196 931 932 6 1 23,856 23,606
Degree 6,943 7,176 928 926 3 1 23,057 22,860.5
Non-Degree 3 20 3 6 3 799 745.5
Degree 15,620 16,568 5,993 5,919 15,250 16,236 294,793 295,946
Non-Degree 153 221 3 6 13 9 1,466.5 1,421.5
TOTAL 15,773 16,789 5,996 5,925 15,263 16,245 296,259.5 297,367.5
Winter Semester 2017
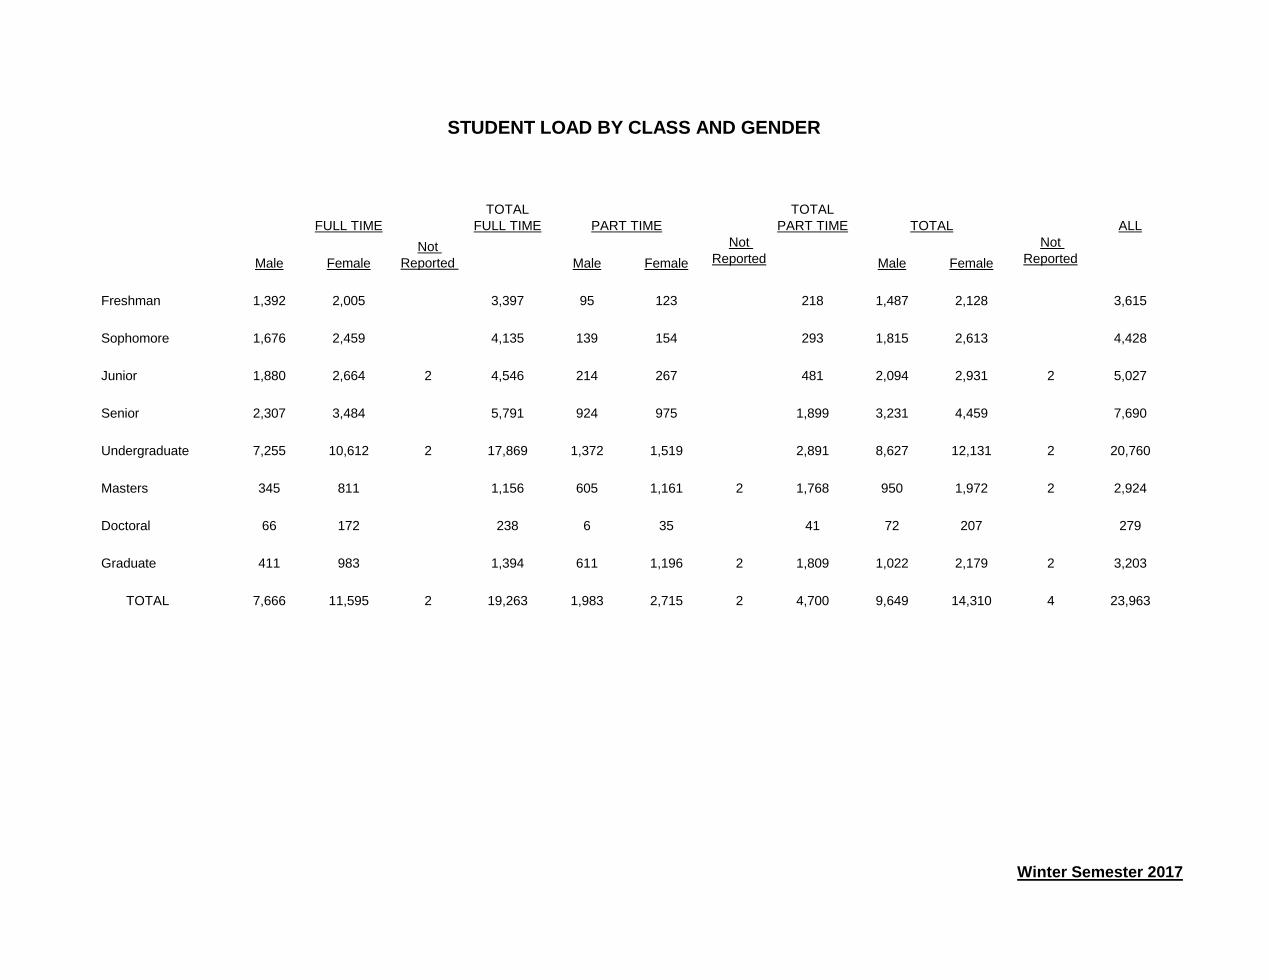
STUDENT LOAD BY CLASS AND GENDER
TOTAL TOTAL
FULL TIME FULL TIME PART TIME PART TIME TOTAL ALL
Male Female
Not
Reported Male Female
Not
Reported Male Female
Not
Reported
Freshman 1,392 2,005 3,397 95 123 218 1,487 2,128 3,615
Sophomore 1,676 2,459 4,135 139 154 293 1,815 2,613 4,428
Junior 1,880 2,664 2 4,546 214 267 481 2,094 2,931 2 5,027
Senior 2,307 3,484 5,791 924 975 1,899 3,231 4,459 7,690
Undergraduate 7,255 10,612 2 17,869 1,372 1,519 2,891 8,627 12,131 2 20,760
Masters 345 811 1,156 605 1,161 2 1,768 950 1,972 2 2,924
Doctoral 66 172 238 6 35 41 72 207 279
Graduate 411 983 1,394 611 1,196 2 1,809 1,022 2,179 2 3,203
TOTAL 7,666 11,595 2 19,263 1,983 2,715 2 4,700 9,649 14,310 4 23,963
Winter Semester 2017
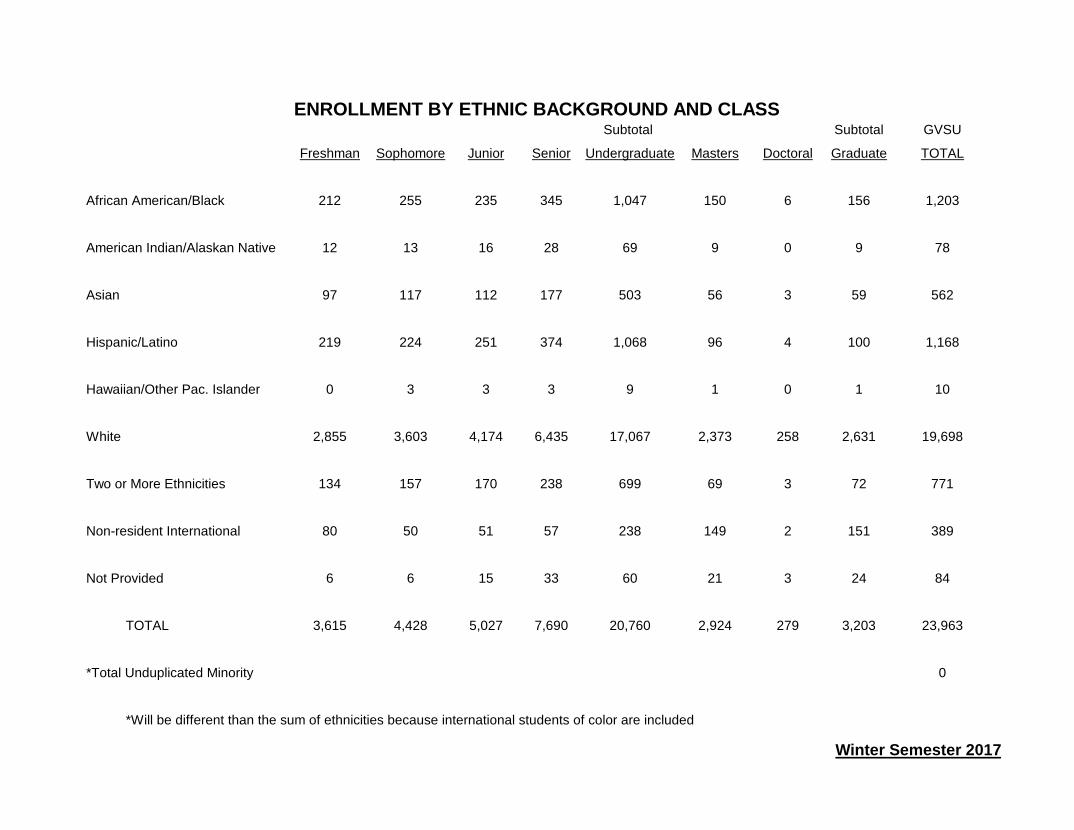
ENROLLMENT BY ETHNIC BACKGROUND AND CLASSSubtotal Subtotal GVSU
Freshman Sophomore Junior Senior Undergraduate Masters Doctoral Graduate TOTAL
African American/Black 212 255 235 345 1,047 150 6 156 1,203
American Indian/Alaskan Native 12 13 16 28 69 9 0 9 78
Asian 97 117 112 177 503 56 3 59 562
Hispanic/Latino 219 224 251 374 1,068 96 4 100 1,168
Hawaiian/Other Pac. Islander 0 3 3 3 9 1 0 1 10
White 2,855 3,603 4,174 6,435 17,067 2,373 258 2,631 19,698
Two or More Ethnicities 134 157 170 238 699 69 3 72 771
Non-resident International 80 50 51 57 238 149 2 151 389
Not Provided 6 6 15 33 60 21 3 24 84
TOTAL 3,615 4,428 5,027 7,690 20,760 2,924 279 3,203 23,963
*Total Unduplicated Minority 0
*Will be different than the sum of ethnicities because international students of color are included
Winter Semester 2017
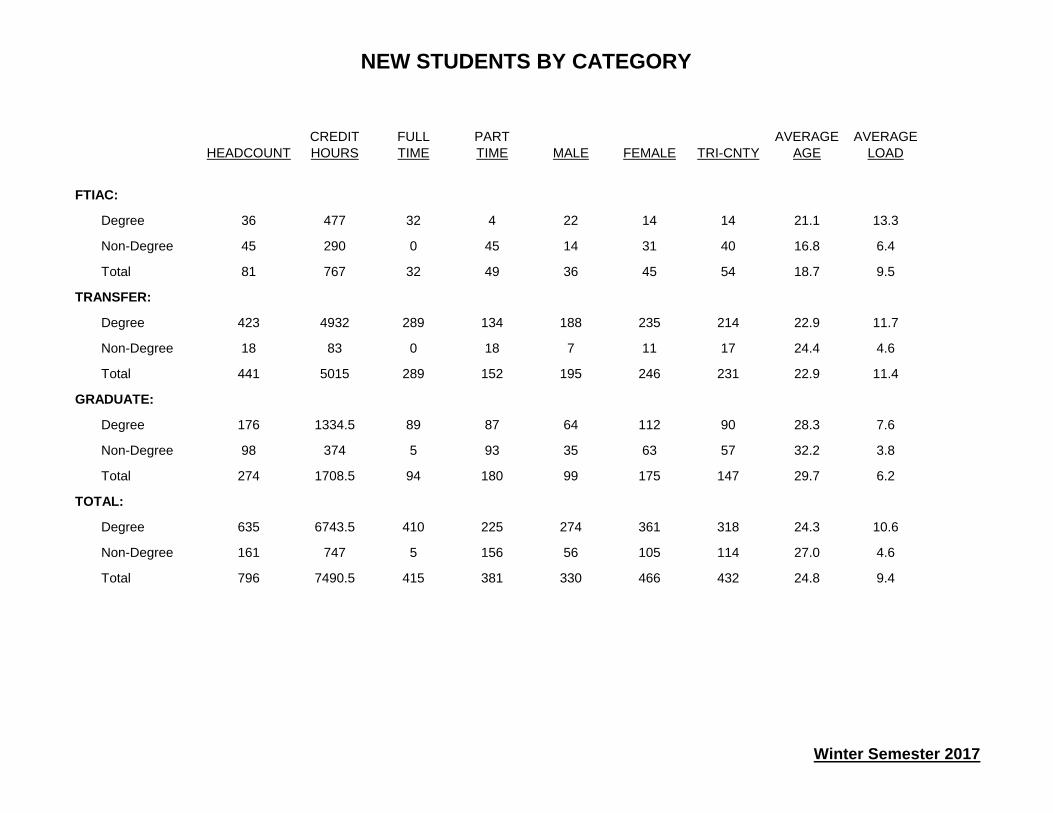
NEW STUDENTS BY CATEGORY
CREDIT FULL PART AVERAGE AVERAGE
HEADCOUNT HOURS TIME TIME MALE FEMALE TRI-CNTY AGE LOAD
FTIAC:
Degree 36 477 32 4 22 14 14 21.1 13.3
Non-Degree 45 290 0 45 14 31 40 16.8 6.4
Total 81 767 32 49 36 45 54 18.7 9.5
TRANSFER:
Degree 423 4932 289 134 188 235 214 22.9 11.7
Non-Degree 18 83 0 18 7 11 17 24.4 4.6
Total 441 5015 289 152 195 246 231 22.9 11.4
GRADUATE:
Degree 176 1334.5 89 87 64 112 90 28.3 7.6
Non-Degree 98 374 5 93 35 63 57 32.2 3.8
Total 274 1708.5 94 180 99 175 147 29.7 6.2
TOTAL:
Degree 635 6743.5 410 225 274 361 318 24.3 10.6
Non-Degree 161 747 5 156 56 105 114 27.0 4.6
Total 796 7490.5 415 381 330 466 432 24.8 9.4
Winter Semester 2017
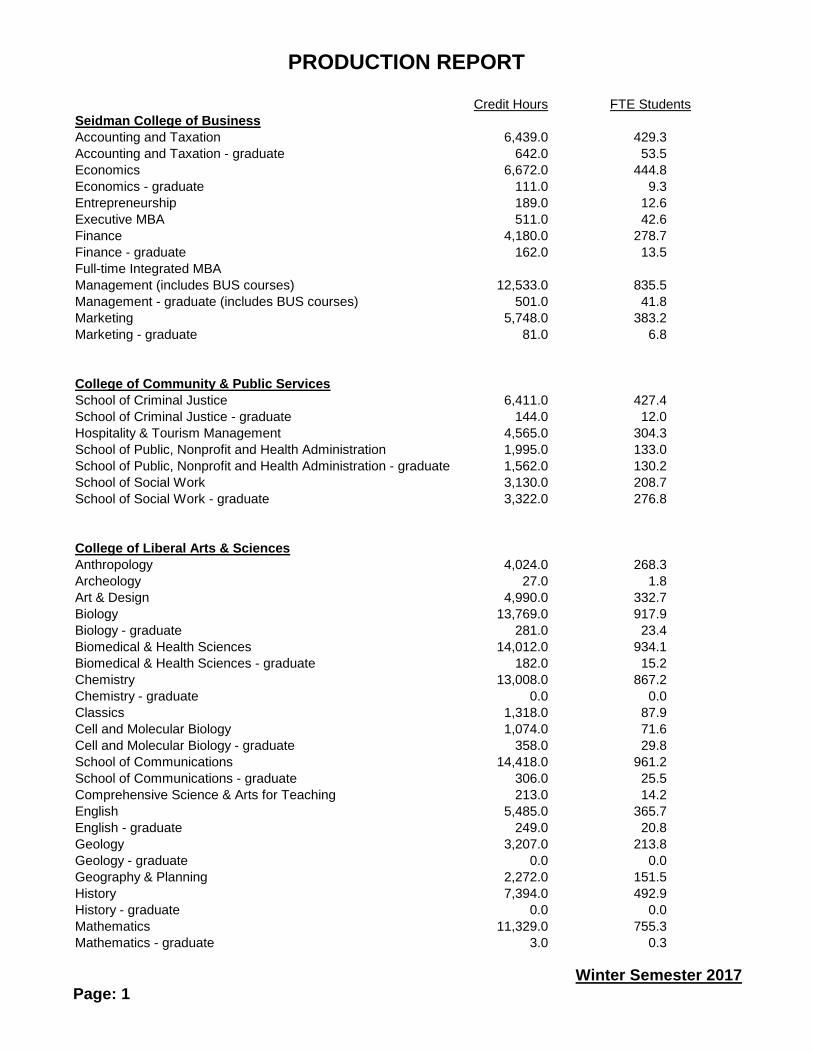
PRODUCTION REPORT
Credit Hours FTE Students
Seidman College of Business
Accounting and Taxation 6,439.0 429.3
Accounting and Taxation - graduate 642.0 53.5
Economics 6,672.0 444.8
Economics - graduate 111.0 9.3
Entrepreneurship 189.0 12.6
Executive MBA 511.0 42.6
Finance 4,180.0 278.7
Finance - graduate 162.0 13.5
Full-time Integrated MBA
Management (includes BUS courses) 12,533.0 835.5
Management - graduate (includes BUS courses) 501.0 41.8
Marketing 5,748.0 383.2
Marketing - graduate 81.0 6.8
College of Community & Public Services
School of Criminal Justice 6,411.0 427.4
School of Criminal Justice - graduate 144.0 12.0
Hospitality & Tourism Management 4,565.0 304.3
School of Public, Nonprofit and Health Administration 1,995.0 133.0
School of Public, Nonprofit and Health Administration - graduate 1,562.0 130.2
School of Social Work 3,130.0 208.7
School of Social Work - graduate 3,322.0 276.8
College of Liberal Arts & Sciences
Anthropology 4,024.0 268.3
Archeology 27.0 1.8
Art & Design 4,990.0 332.7
Biology 13,769.0 917.9
Biology - graduate 281.0 23.4
Biomedical & Health Sciences 14,012.0 934.1
Biomedical & Health Sciences - graduate 182.0 15.2
Chemistry 13,008.0 867.2
Chemistry - graduate 0.0 0.0
Classics 1,318.0 87.9
Cell and Molecular Biology 1,074.0 71.6
Cell and Molecular Biology - graduate 358.0 29.8
School of Communications 14,418.0 961.2
School of Communications - graduate 306.0 25.5
Comprehensive Science & Arts for Teaching 213.0 14.2
English 5,485.0 365.7
English - graduate 249.0 20.8
Geology 3,207.0 213.8
Geology - graduate 0.0 0.0
Geography & Planning 2,272.0 151.5
History 7,394.0 492.9
History - graduate 0.0 0.0
Mathematics 11,329.0 755.3
Mathematics - graduate 3.0 0.3
Page: 1
Winter Semester 2017
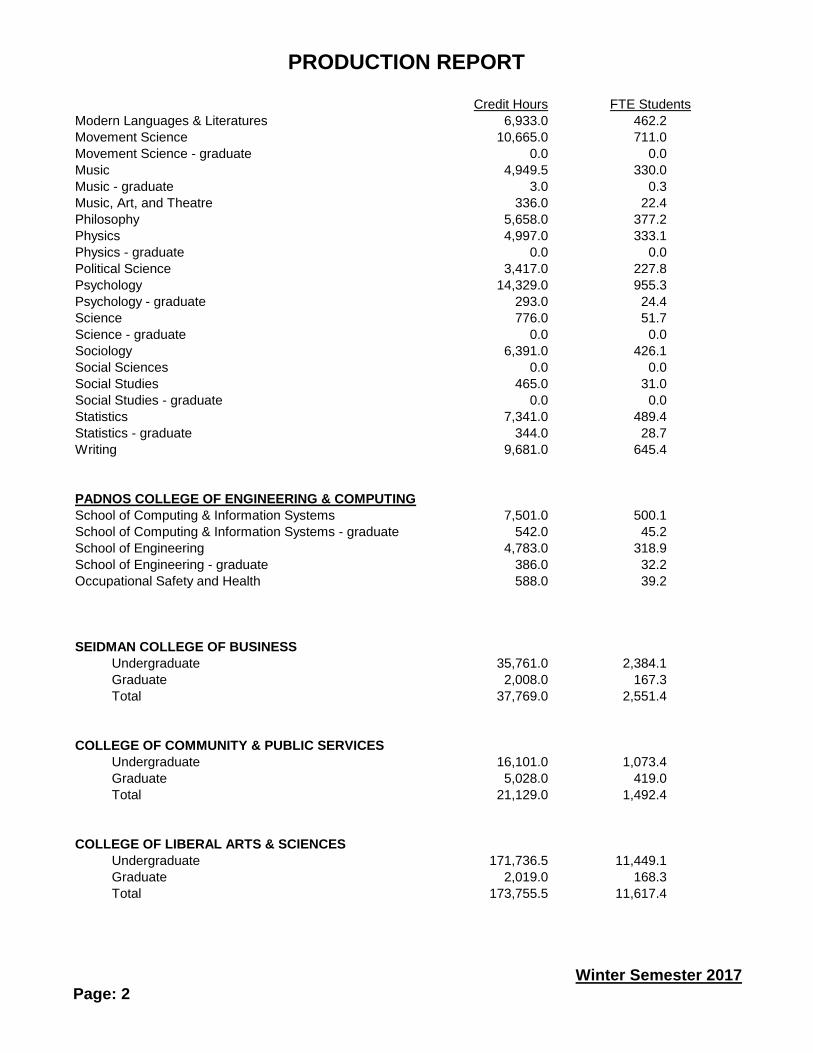
PRODUCTION REPORT
Credit Hours FTE Students
Modern Languages & Literatures 6,933.0 462.2
Movement Science 10,665.0 711.0
Movement Science - graduate 0.0 0.0
Music 4,949.5 330.0
Music - graduate 3.0 0.3
Music, Art, and Theatre 336.0 22.4
Philosophy 5,658.0 377.2
Physics 4,997.0 333.1
Physics - graduate 0.0 0.0
Political Science 3,417.0 227.8
Psychology 14,329.0 955.3
Psychology - graduate 293.0 24.4
Science 776.0 51.7
Science - graduate 0.0 0.0
Sociology 6,391.0 426.1
Social Sciences 0.0 0.0
Social Studies 465.0 31.0
Social Studies - graduate 0.0 0.0
Statistics 7,341.0 489.4
Statistics - graduate 344.0 28.7
Writing 9,681.0 645.4
PADNOS COLLEGE OF ENGINEERING & COMPUTING
School of Computing & Information Systems 7,501.0 500.1
School of Computing & Information Systems - graduate 542.0 45.2
School of Engineering 4,783.0 318.9
School of Engineering - graduate 386.0 32.2
Occupational Safety and Health 588.0 39.2
SEIDMAN COLLEGE OF BUSINESS
Undergraduate 35,761.0 2,384.1
Graduate 2,008.0 167.3
Total 37,769.0 2,551.4
COLLEGE OF COMMUNITY & PUBLIC SERVICES
Undergraduate 16,101.0 1,073.4
Graduate 5,028.0 419.0
Total 21,129.0 1,492.4
COLLEGE OF LIBERAL ARTS & SCIENCES
Undergraduate 171,736.5 11,449.1
Graduate 2,019.0 168.3
Total 173,755.5 11,617.4
Page: 2
Winter Semester 2017
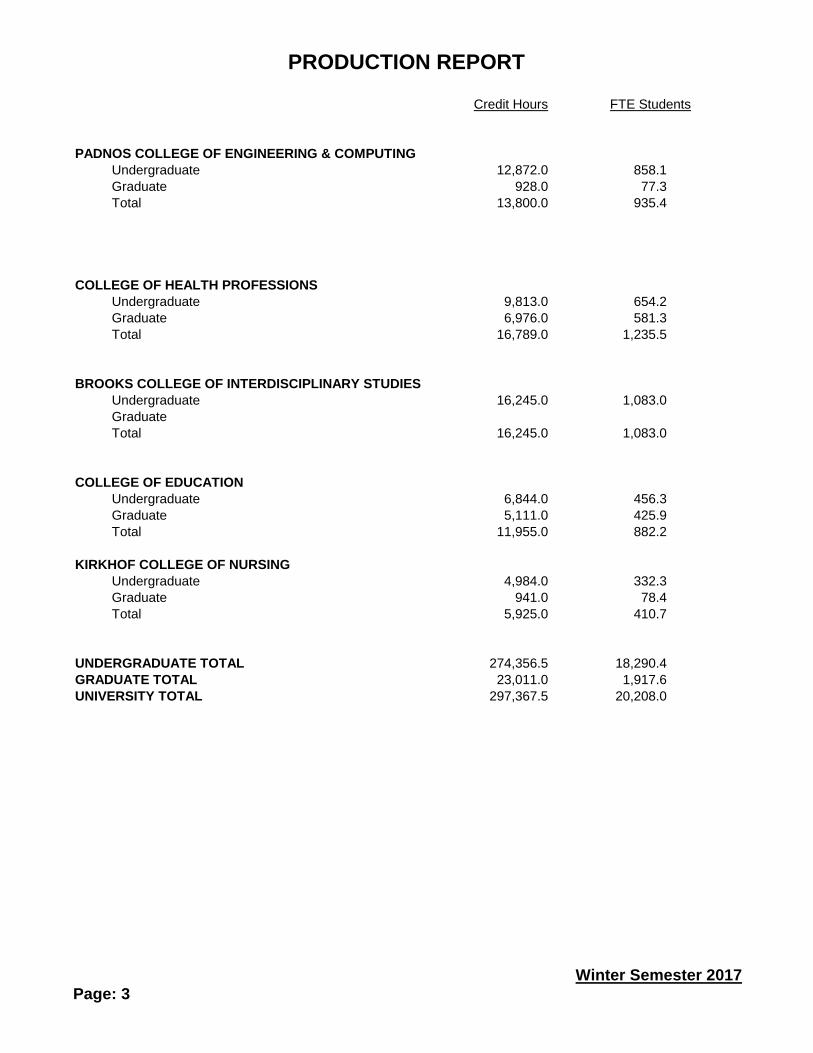
PRODUCTION REPORT
Credit Hours FTE Students
PADNOS COLLEGE OF ENGINEERING & COMPUTING
Undergraduate 12,872.0 858.1
Graduate 928.0 77.3
Total 13,800.0 935.4
COLLEGE OF HEALTH PROFESSIONS
Undergraduate 9,813.0 654.2
Graduate 6,976.0 581.3
Total 16,789.0 1,235.5
BROOKS COLLEGE OF INTERDISCIPLINARY STUDIES
Undergraduate 16,245.0 1,083.0
Graduate
Total 16,245.0 1,083.0
COLLEGE OF EDUCATION
Undergraduate 6,844.0 456.3
Graduate 5,111.0 425.9
Total 11,955.0 882.2
KIRKHOF COLLEGE OF NURSING
Undergraduate 4,984.0 332.3
Graduate 941.0 78.4
Total 5,925.0 410.7
UNDERGRADUATE TOTAL 274,356.5 18,290.4
GRADUATE TOTAL 23,011.0 1,917.6
UNIVERSITY TOTAL 297,367.5 20,208.0
Page: 3
Winter Semester 2017

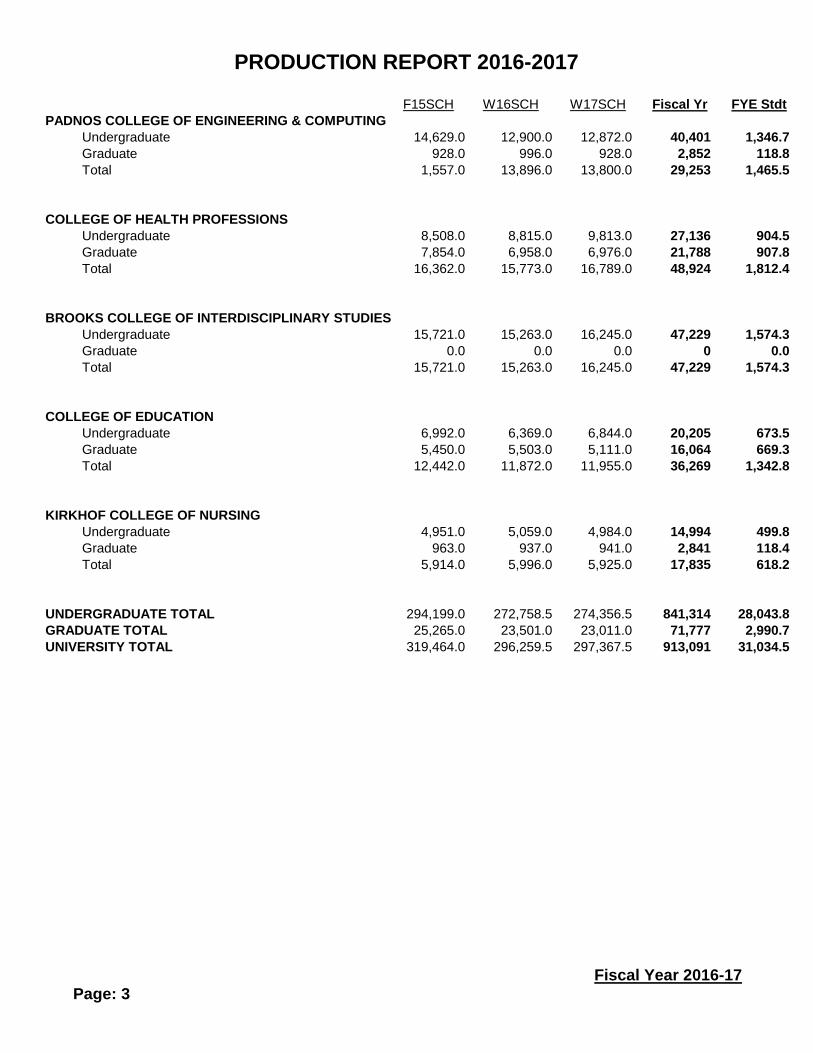
PRODUCTION REPORT 2016-2017
F15SCH W16SCH W17SCH Fiscal Yr FYE Stdt
Seidman College of Business
Accounting and Taxation 7,035.0 6,128.0 6,439.0 19,602 653.4
Accounting and Taxation - graduate 831.0 699.0 642.0 2,172 90.5
Business - graduate 418.0 418 17.4
Economics 6,655.0 6,880.0 6,672.0 20,207 673.6
Economics - graduate 168.0 153.0 111.0 432 18.0
Entrepreneurship 201.0 153.0 189.0 543 18.1
Executive MBA 0.0 396.0 511.0 907 30.2
Finance 4,011.0 4,023.0 4,180.0 12,214 407.1
Finance - graduate 123.0 174.0 162.0 459.0 19.1
Full-time Integrated MBA 165.0 52.5 217.5 9.1
Management (includes BUS courses) 12,192.0 11,711.0 12,533.0 36,436 1,214.5
Management - graduate (includes BUS courses) 557.0 566.0 501.0 1,624.0 67.7
Marketing 5,501.0 5,381.0 5,748.0 16,630 554.3
Marketing - graduate 81.0 91.5 81.0 254 10.6
College of Community & Public Services
School of Criminal Justice 6,985.0 6,926.0 6,411.0 20,322 677.4
School of Criminal Justice - graduate 180.0 157.0 144.0 481 20.0
Hospitality & Tourism Management 4,217.0 4,523.0 4,565.0 13,305 443.5
School of Public, Nonprofit, and Health Administration 1,792.0 2,098.0 1,995.0 5,885 196.2
School of Public, Nonprofit, and Health Administration - graduate 1,779.0 1,690.0 1,562.0 5,031 209.6
School of Social Work 3,920.0 3,602.0 3,130.0 10,652 355.1
School of Social Work - graduate 3,166.0 3,307.0 3,322.0 9,795 408.1
College of Liberal Arts & Sciences
Anthropology 3,889.0 3,582.0 4,024.0 11,495 383.2
Archeology 33.0 42.0 27.0 102 3.4
Art & Design 5,313.0 4,603.0 4,990.0 14,906 496.9
Biology 16,252.0 13,821.0 13,027.0 43,100 1,436.7
Biology - graduate 211.0 232.0 281.0 724 30.2
Biomedical & Health Sciences 12,988.0 13,316.0 14,012.0 40,316 1,343.9
Biomedical & Health Sciences - graduate 559.0 118.0 182.0 859 35.8
Chemistry 16,229.0 13,366.0 13,008.0 42,603 1,420.1
Chemistry - graduate 0.0 0.0 0.0 0 0.0
Classics 1,561.0 1,441.0 1,318.0 4,320 144.0
Cell and Molecular Biology 709.0 1,117.0 1,074.0 2,900 96.7
Cell and Molecular Biology - graduate 361.0 385.0 358.0 1,104 46.0
School of Communications 14,842.0 13,835.0 14,418.0 43,095 1,436.5
School of Communications - graduate 220.0 300.0 306.0 826 34.4
Comprehensive Science & Arts for Teaching 0.0 189.0 213.0 402 13.4
English 6,661.0 5,747.0 5,485.0 17,893 596.4
English - graduate 142.0 162.0 249.0 553 23.0
Geology 3,880.0 3,510.0 3,207.0 10,597 353.2
Geology - graduate 0.0 0.0 0.0 0 0.0
Geography & Planning 1,948.0 2,455.0 2,272.0 6,675 222.5
History 8,025.0 7,586.0 7,394.0 23,005 766.8
History - graduate 0.0 0.0 0.0 0 0.0
Mathematics 16,572.0 11,843.0 11,329.0 39,744 1,324.8
Page: 1
Fiscal Year 2016-17
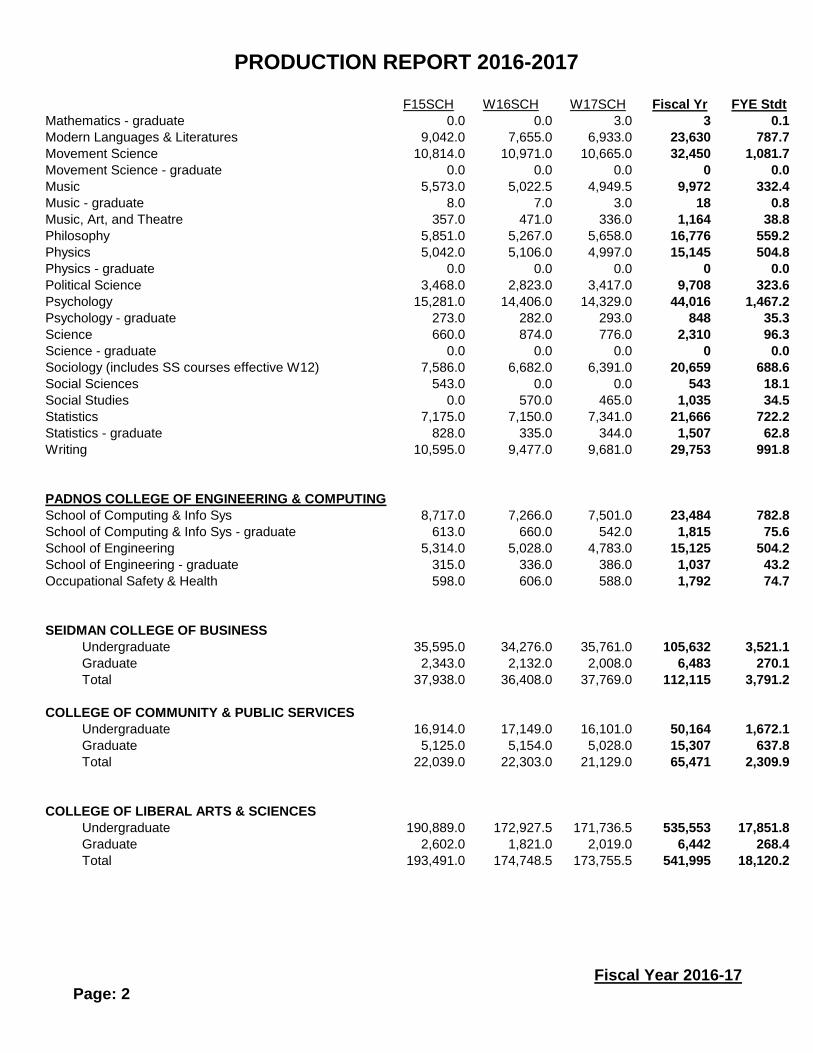
PRODUCTION REPORT 2016-2017
F15SCH W16SCH W17SCH Fiscal Yr FYE Stdt
Mathematics - graduate 0.0 0.0 3.0 3 0.1
Modern Languages & Literatures 9,042.0 7,655.0 6,933.0 23,630 787.7
Movement Science 10,814.0 10,971.0 10,665.0 32,450 1,081.7
Movement Science - graduate 0.0 0.0 0.0 0 0.0
Music 5,573.0 5,022.5 4,949.5 9,972 332.4
Music - graduate 8.0 7.0 3.0 18 0.8
Music, Art, and Theatre 357.0 471.0 336.0 1,164 38.8
Philosophy 5,851.0 5,267.0 5,658.0 16,776 559.2
Physics 5,042.0 5,106.0 4,997.0 15,145 504.8
Physics - graduate 0.0 0.0 0.0 0 0.0
Political Science 3,468.0 2,823.0 3,417.0 9,708 323.6
Psychology 15,281.0 14,406.0 14,329.0 44,016 1,467.2
Psychology - graduate 273.0 282.0 293.0 848 35.3
Science 660.0 874.0 776.0 2,310 96.3
Science - graduate 0.0 0.0 0.0 0 0.0
Sociology (includes SS courses effective W12) 7,586.0 6,682.0 6,391.0 20,659 688.6
Social Sciences 543.0 0.0 0.0 543 18.1
Social Studies 0.0 570.0 465.0 1,035 34.5
Statistics 7,175.0 7,150.0 7,341.0 21,666 722.2
Statistics - graduate 828.0 335.0 344.0 1,507 62.8
Writing 10,595.0 9,477.0 9,681.0 29,753 991.8
PADNOS COLLEGE OF ENGINEERING & COMPUTING
School of Computing & Info Sys 8,717.0 7,266.0 7,501.0 23,484 782.8
School of Computing & Info Sys - graduate 613.0 660.0 542.0 1,815 75.6
School of Engineering 5,314.0 5,028.0 4,783.0 15,125 504.2
School of Engineering - graduate 315.0 336.0 386.0 1,037 43.2
Occupational Safety & Health 598.0 606.0 588.0 1,792 74.7
SEIDMAN COLLEGE OF BUSINESS
Undergraduate 35,595.0 34,276.0 35,761.0 105,632 3,521.1
Graduate 2,343.0 2,132.0 2,008.0 6,483 270.1
Total 37,938.0 36,408.0 37,769.0 112,115 3,791.2
COLLEGE OF COMMUNITY & PUBLIC SERVICES
Undergraduate 16,914.0 17,149.0 16,101.0 50,164 1,672.1
Graduate 5,125.0 5,154.0 5,028.0 15,307 637.8
Total 22,039.0 22,303.0 21,129.0 65,471 2,309.9
COLLEGE OF LIBERAL ARTS & SCIENCES
Undergraduate 190,889.0 172,927.5 171,736.5 535,553 17,851.8
Graduate 2,602.0 1,821.0 2,019.0 6,442 268.4
Total 193,491.0 174,748.5 173,755.5 541,995 18,120.2
Page: 2
Fiscal Year 2016-17
PRODUCTION REPORT 2016-2017
F15SCH W16SCH W17SCH Fiscal Yr FYE Stdt
PADNOS COLLEGE OF ENGINEERING & COMPUTING
Undergraduate 14,629.0 12,900.0 12,872.0 40,401 1,346.7
Graduate 928.0 996.0 928.0 2,852 118.8
Total 1,557.0 13,896.0 13,800.0 29,253 1,465.5
COLLEGE OF HEALTH PROFESSIONS
Undergraduate 8,508.0 8,815.0 9,813.0 27,136 904.5
Graduate 7,854.0 6,958.0 6,976.0 21,788 907.8
Total 16,362.0 15,773.0 16,789.0 48,924 1,812.4
BROOKS COLLEGE OF INTERDISCIPLINARY STUDIES
Undergraduate 15,721.0 15,263.0 16,245.0 47,229 1,574.3
Graduate 0.0 0.0 0.0 0 0.0
Total 15,721.0 15,263.0 16,245.0 47,229 1,574.3
COLLEGE OF EDUCATION
Undergraduate 6,992.0 6,369.0 6,844.0 20,205 673.5
Graduate 5,450.0 5,503.0 5,111.0 16,064 669.3
Total 12,442.0 11,872.0 11,955.0 36,269 1,342.8
KIRKHOF COLLEGE OF NURSING
Undergraduate 4,951.0 5,059.0 4,984.0 14,994 499.8
Graduate 963.0 937.0 941.0 2,841 118.4
Total 5,914.0 5,996.0 5,925.0 17,835 618.2
UNDERGRADUATE TOTAL 294,199.0 272,758.5 274,356.5 841,314 28,043.8
GRADUATE TOTAL 25,265.0 23,501.0 23,011.0 71,777 2,990.7
UNIVERSITY TOTAL 319,464.0 296,259.5 297,367.5 913,091 31,034.5
Page: 3
Fiscal Year 2016-17