winning in growth cities 2016/2017 - ministère de la ... · pdf filenew york, usa in...
TRANSCRIPT

2016 / 2017
WINNING IN GROWTH CITIES
A CUSHMAN & WAKEFIELD CAPITAL MARKETS RESEARCH PUBLICATION

LONDON, UK
A Cushman & Wakefield Capital Markets Research Publication
2

CONTENTSEXECUTIVE SUMMARY 4
WINNING CITIES FOR INVESTMENT 8
BREXIT & GLOBAL CITIES 12
DRIVERS OF CITY CHANGE 16
MEASURING MARKET POWER 18
STRATEGY & OUTLOOK 20
GLOBAL YIELDS 24
INVESTMENT VOLUMES 25
TOP 1O CITIES FOR INVESTMENT BY SECTOR 26
ABOUT THE REPORT 28
RESEARCH SERVICES 28
CAPITAL MARKETS SERVICES 29
ABOUT CUSHMAN & WAKEFIELD 30
Welcome to the 6th edition of our Winning in Growth Cities report
3
HONG KONG, CHINA
EXECUTIVE SUMMARY:TODAY’S MARKETGlobal property investment rose 0.5% in the year to June but volumes for income producing assets fell and the market has clearly paused for breath after a busy 2015. Indeed, with the scale of change underway in the macro environment, (from war to disease to Brexit to Trump), many investors are now struggling to decide what comes next and where they should look for value.
While the year started with fear over a hard landing in China, Europe and the UK have taken over as a bigger cause of uncertainty while concerns over the US election also now loom large. Nonetheless, in such a volatile environment, more investors are turning to the stable cash flow and inflation hedging merits of real estate, particularly given that the fundamentals of the market on the occupier side are generally holding up well.
The globalisation of the market has continued meanwhile with cross border capital gaining market share and more investment also going direct into local platforms. The top five global investors have been the USA, China, Singapore, Canada and Qatar. Other key groups include South Korea, Hong Kong, the UAE and Germany.
Targets for foreign investment have shifted somewhat, with cross border flows growing faster in the Americas and Asia than Europe and the ranking of cities also changing. The most notable shift has been London losing its global crown to New York, but a range of other gateway markets are also down, such as Tokyo, Washington and Frankfurt, due to a combination of limited supply and local competition. By city, 10 of the top 25 targets were in EMEA, 6 in Asia and 9 in North America and while Asia and America saw greater global interest, cross border market share still varies significantly, from 16% in the Americas, to 30% in Asia and 47% in Europe.
While London lost out as Brexit concerns and high pricing hit even before the referendum, the make-up of the top 25 overall is little changed, with New York ahead of LA, London, San Francisco and Paris. New York increased its market share while Philadelphia, Denver, San Diego and Phoenix all saw strong increases. Outside of the US, Toronto had the best growth and Amsterdam and Paris saw strong increases.
The greater appeal of the US clearly comes through the data, with its cities dominating in all sectors, New York top for cross border buyers and Tier 2 markets also in favour. Overall, 24 of the 50 fastest growing, larger cities (volume over $1bn excluding development) were in North America, whilst 18 were in Europe and 8 in Asia.
In Europe, Tier 1 cities Paris, Amsterdam and Milan are in the top growth list but Tier 2 cities also feature heavily, led by Copenhagen, Rome and Helsinki together with regional UK and German markets. Asian representation was led by Chongqing, Shenzhen, Shanghai and Beijing in China, as well as Fukuoka, Singapore, Mumbai and Taipei.
A Cushman & Wakefield Capital Markets Research Publication
4
Looking ahead, we see stabilising markets but risks are still evident and change, if anything, is accelerating thanks to a combination of new technology as well as environmental, social and demographic pressure. As a result, occupier requirements will continue to evolve and the strength of different cities will change. To understand these patterns, we have reviewed a range of factors and looked at how cities compare:
TARGETS FOR THE FUTURE• Brexit is one of the most potentially significant factors
currently in play and on page 12 we’ve considered whether it could signal a significant change in the hierarchy of global cities.
• Until we know more about the shape of Brexit that question can’t be answered of course but our initial view is that any advantage is likely to accrue across a range of cities, not just one. New York for example may feel its influence grow as its chief rival is distracted. Asia may see increased trade and investment, benefiting larger centres such as Tokyo, Shanghai and Hong Kong but also potential regional HQ locations, Singapore and Sydney. In Europe, the fight for supremacy may be most notable but gains are likely to be spread across a number of cities including Amsterdam, Berlin and Dublin as well as Paris and Frankfurt, given their scale and business environment relative to London.
• Our analysis also suggests that global, rather than regional or national appeal may be a stronger draw for businesses and Brexit may free UK cities to build on the comparative advantages they already have and compete globally.
• Centres such as Manchester, Edinburgh and Cambridge could gain but London in particular could emerge as an even more important global centre. Hence not only will the battle for global leadership with New York continue, but the world in general will become more multi-nodal as key cities with specific skills, resources and specialisations operate within a global network.
• We have also looked at the drivers for city success on page 16 and, while a global elite exists, capable of sustaining and reinventing their hold on a top position, in general we have an increasingly competitive landscape. In broad terms, cities need to be connected, mixed-use, walkable and transit rich. Increasingly, however, they also need smart design in buildings and infrastructure as well as a strong focus on their target audience of talent and businesses, particularly for second tier cities. But how is this best achieved?
• Technology is key to answering many of the problems cities face eg tackling demographic change with robotics and congestion via data analytics. However, talent is the answer to the need for innovation in technology in the first place.
• The importance of governance is clearly growing; be that to create the right backdrop for growth and innovation or to reduce risk and promote change and a sharing of data.
• Construction is a key battleground for affordability and hence is important in other issues such as efficiency, inclusivity and innovation. This includes cost savings, improving sustainability and increasing space flexibility through materials used, construction techniques and process management.
• Health and healthy living are increasingly important from a cost and a quality of life perspective and this stretches across access to health services, exposure to health risks and the degree to which a city supports or encourages healthy living.
• On page 18 we have compared a range of variables that help determine market power including size, hub status, connectivity and quality of life. Scale remains an important driver of opportunity– not least in its influence on liquidity and diversity – but size is not everything and qualities that help to build, attract and retain a talented and creative workforce will be increasingly key. Cities are also now more independent of the countries they sit in and their resources, image and influence count for more. Above all perhaps, the access they give to information and ideas, as well as capital and talent, must be considered.
• Cities have part of their destiny in their own hands if they can capture the best of being “smart” and position themselves to draw in talent at all levels. However, the building blocks that make them more likely to succeed are the same as ever – centred on the existing economic and cultural resources of the city and how they come together in terms of the quality of the working and living environment.
Across the areas analysed in table 2, only a handful of markets take a global leading position in most, with only London and New York dominant in most categories, followed by Paris and San Francisco. However, while the established megacity elite dominate the upper reaches of the global ranking for most variables, quality of life is one exception where issues such as cost, security and environmental quality are often harder to deliver in a large city. Alongside the changes seen in rankings for tech hubs and air transport, this clearly points to areas of specialisation where second tier cities can compete.
5EXECUTIVE SUMMARY:
WHAT LIES AHEAD?While global uncertainty will continue to affect investors, corporate confidence has held up well and allied to the changes in demand being wrought by new technology, living and working practices, this underpins a robust medium term outlook for good quality real estate.
Indeed, the role of real estate in portfolio diversification is underpinned by sustained low interest rates, expectations of higher inflation and volatility in all asset classes.
What is more, with changes to society and business only accelerating, the importance of the right property is increasing – suggesting profit potential will be enhanced for the best, even as it falls for weaker property.
As a result, a focus on core markets should be maintained, where the fundamentals are right across a range of variables and the city can adapt and appeal to different users and sustain a vibrant, growing economy.
With still rising liquidity and demand alongside lower for longer interest rates, prime yields will be pushed lower but activity may be tempered by a lack of willing sellers given the shortage of alternate opportunities available. However, it is likely that more profit taking will be seen, helped by the diversity in opinions which are emerging with respect to issues such as Brexit and monetary policy.
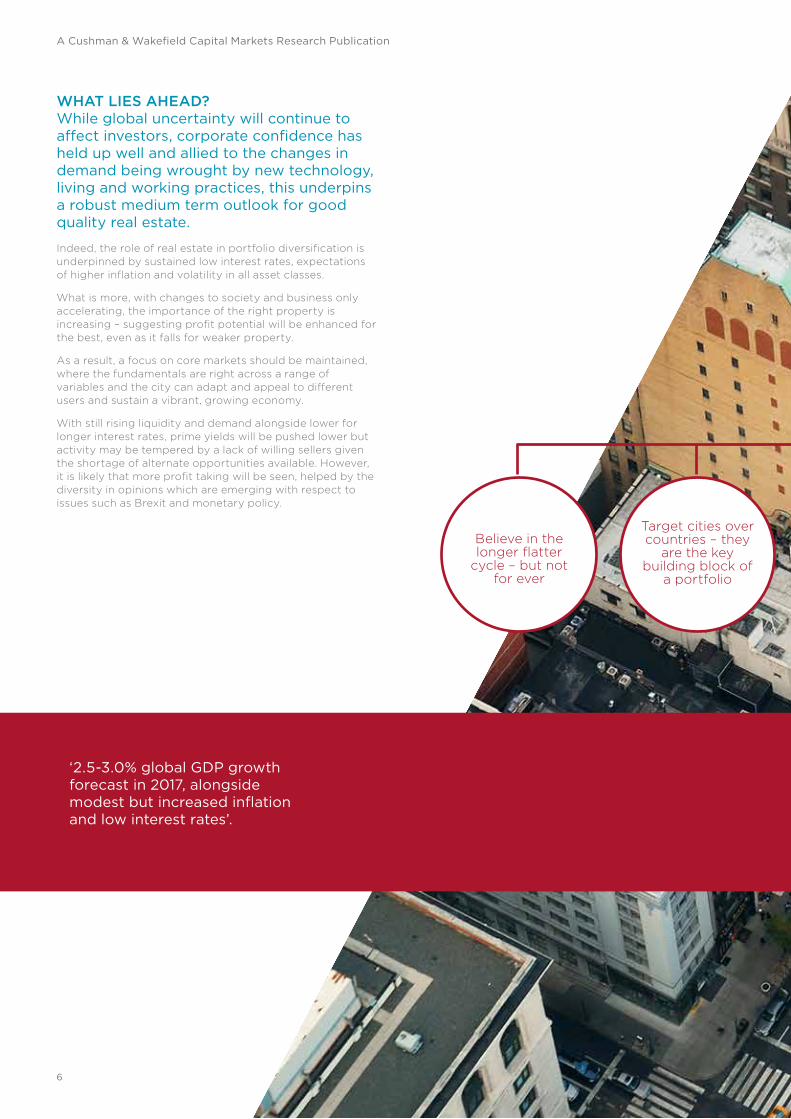
‘2.5-3.0% global GDP growth forecast in 2017, alongside modest but increased inflation and low interest rates’.
Target cities over countries – they
are the key building block of
a portfolio
Believe in the longer flatter
cycle – but not for ever
A Cushman & Wakefield Capital Markets Research Publication
6
NEW YORK, USA
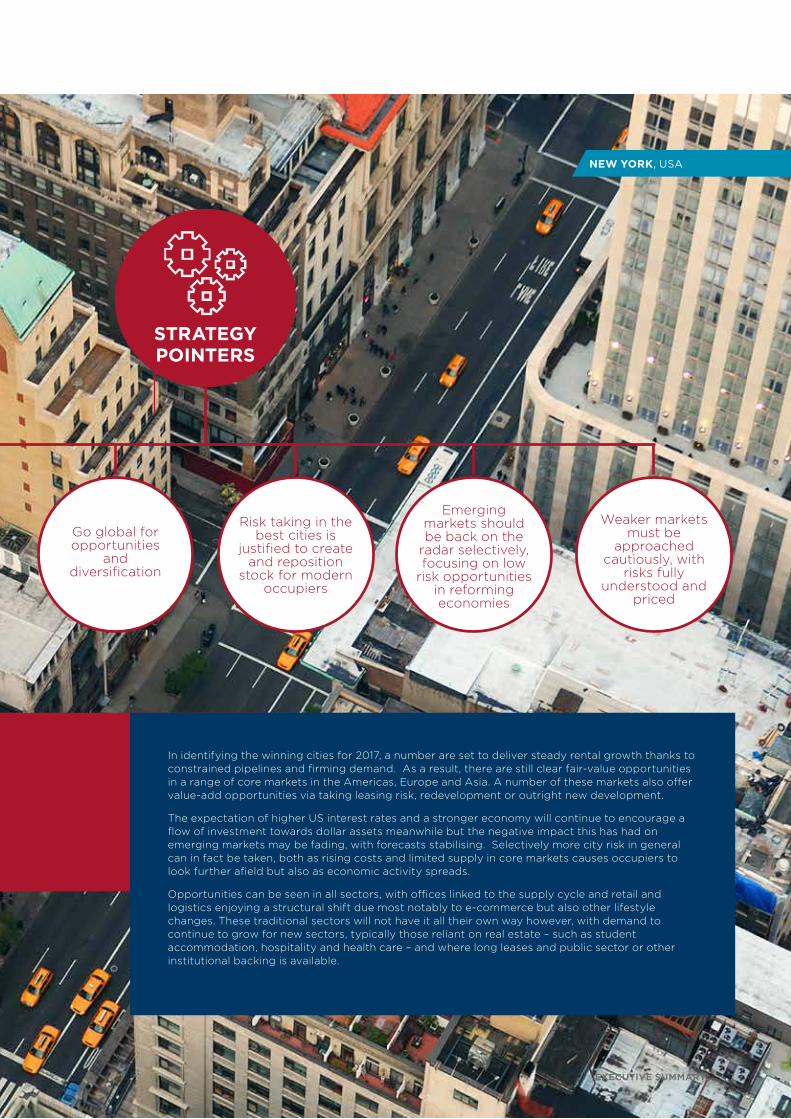
In identifying the winning cities for 2017, a number are set to deliver steady rental growth thanks to constrained pipelines and firming demand. As a result, there are still clear fair-value opportunities in a range of core markets in the Americas, Europe and Asia. A number of these markets also offer value-add opportunities via taking leasing risk, redevelopment or outright new development.
The expectation of higher US interest rates and a stronger economy will continue to encourage a flow of investment towards dollar assets meanwhile but the negative impact this has had on emerging markets may be fading, with forecasts stabilising. Selectively more city risk in general can in fact be taken, both as rising costs and limited supply in core markets causes occupiers to look further afield but also as economic activity spreads.
Opportunities can be seen in all sectors, with offices linked to the supply cycle and retail and logistics enjoying a structural shift due most notably to e-commerce but also other lifestyle changes. These traditional sectors will not have it all their own way however, with demand to continue to grow for new sectors, typically those reliant on real estate – such as student accommodation, hospitality and health care – and where long leases and public sector or other institutional backing is available.
Emerging markets should be back on the
radar selectively, focusing on low
risk opportunities in reforming economies
Go global for opportunities
and diversification
Weaker markets must be
approached cautiously, with
risks fully understood and
priced
Risk taking in the best cities is
justified to create and reposition
stock for modern occupiers
STRATEGY POINTERS
EXECUTIVE SUMMARY: 7
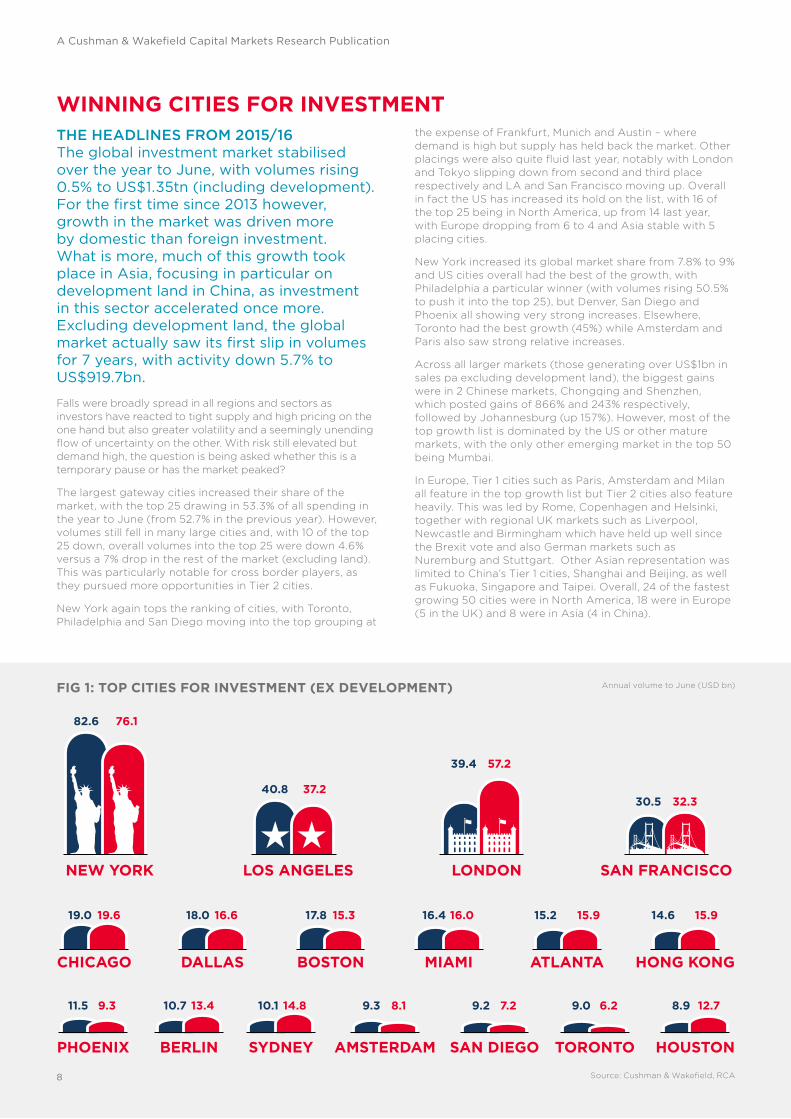
WINNING CITIES FOR INVESTMENTTHE HEADLINES FROM 2015/16The global investment market stabilised over the year to June, with volumes rising 0.5% to US$1.35tn (including development). For the first time since 2013 however, growth in the market was driven more by domestic than foreign investment. What is more, much of this growth took place in Asia, focusing in particular on development land in China, as investment in this sector accelerated once more. Excluding development land, the global market actually saw its first slip in volumes for 7 years, with activity down 5.7% to US$919.7bn.
Falls were broadly spread in all regions and sectors as investors have reacted to tight supply and high pricing on the one hand but also greater volatility and a seemingly unending flow of uncertainty on the other. With risk still elevated but demand high, the question is being asked whether this is a temporary pause or has the market peaked?
The largest gateway cities increased their share of the market, with the top 25 drawing in 53.3% of all spending in the year to June (from 52.7% in the previous year). However, volumes still fell in many large cities and, with 10 of the top 25 down, overall volumes into the top 25 were down 4.6% versus a 7% drop in the rest of the market (excluding land). This was particularly notable for cross border players, as they pursued more opportunities in Tier 2 cities.
New York again tops the ranking of cities, with Toronto, Philadelphia and San Diego moving into the top grouping at
the expense of Frankfurt, Munich and Austin – where demand is high but supply has held back the market. Other placings were also quite fluid last year, notably with London and Tokyo slipping down from second and third place respectively and LA and San Francisco moving up. Overall in fact the US has increased its hold on the list, with 16 of the top 25 being in North America, up from 14 last year, with Europe dropping from 6 to 4 and Asia stable with 5 placing cities.
New York increased its global market share from 7.8% to 9% and US cities overall had the best of the growth, with Philadelphia a particular winner (with volumes rising 50.5% to push it into the top 25), but Denver, San Diego and Phoenix all showing very strong increases. Elsewhere, Toronto had the best growth (45%) while Amsterdam and Paris also saw strong relative increases.
Across all larger markets (those generating over US$1bn in sales pa excluding development land), the biggest gains were in 2 Chinese markets, Chongqing and Shenzhen, which posted gains of 866% and 243% respectively, followed by Johannesburg (up 157%). However, most of the top growth list is dominated by the US or other mature markets, with the only other emerging market in the top 50 being Mumbai.
In Europe, Tier 1 cities such as Paris, Amsterdam and Milan all feature in the top growth list but Tier 2 cities also feature heavily. This was led by Rome, Copenhagen and Helsinki, together with regional UK markets such as Liverpool, Newcastle and Birmingham which have held up well since the Brexit vote and also German markets such as Nuremburg and Stuttgart. Other Asian representation was limited to China’s Tier 1 cities, Shanghai and Beijing, as well as Fukuoka, Singapore and Taipei. Overall, 24 of the fastest growing 50 cities were in North America, 18 were in Europe (5 in the UK) and 8 were in Asia (4 in China).
FIG 1: TOP CITIES FOR INVESTMENT (EX DEVELOPMENT) Annual volume to June (USD bn)
Source: Cushman & Wakefield, RCA
19.619.0
CHICAGO
18.0 16.6
DALLAS
16.4 16.0
MIAMI
17.8 15.3
BOSTON
14.6 15.9
HONG KONG
15.2 15.9
ATLANTA
11.5 9.3
PHOENIX
10.7 13.4
BERLIN
9.2 7.2
SAN DIEGO
9.0 6.2
TORONTO
8.9 12.7
HOUSTON
9.3 8.1
AMSTERDAM
10.1 14.8
SYDNEY
82.6 76.1
NEW YORK
40.8 37.2
LOS ANGELES
39.4 57.2
LONDON
30.5 32.3
SAN FRANCISCO
A Cushman & Wakefield Capital Markets Research Publication
8
HOTELS
RETAIL
INDUSTRIAL
OFFICES
MULTI-FAMILY
DEVSITE
-30% -25% -20% -15% -10% -5% 0% 5% 10% 15%
2015 2016
CROSS BORDER
MARKET
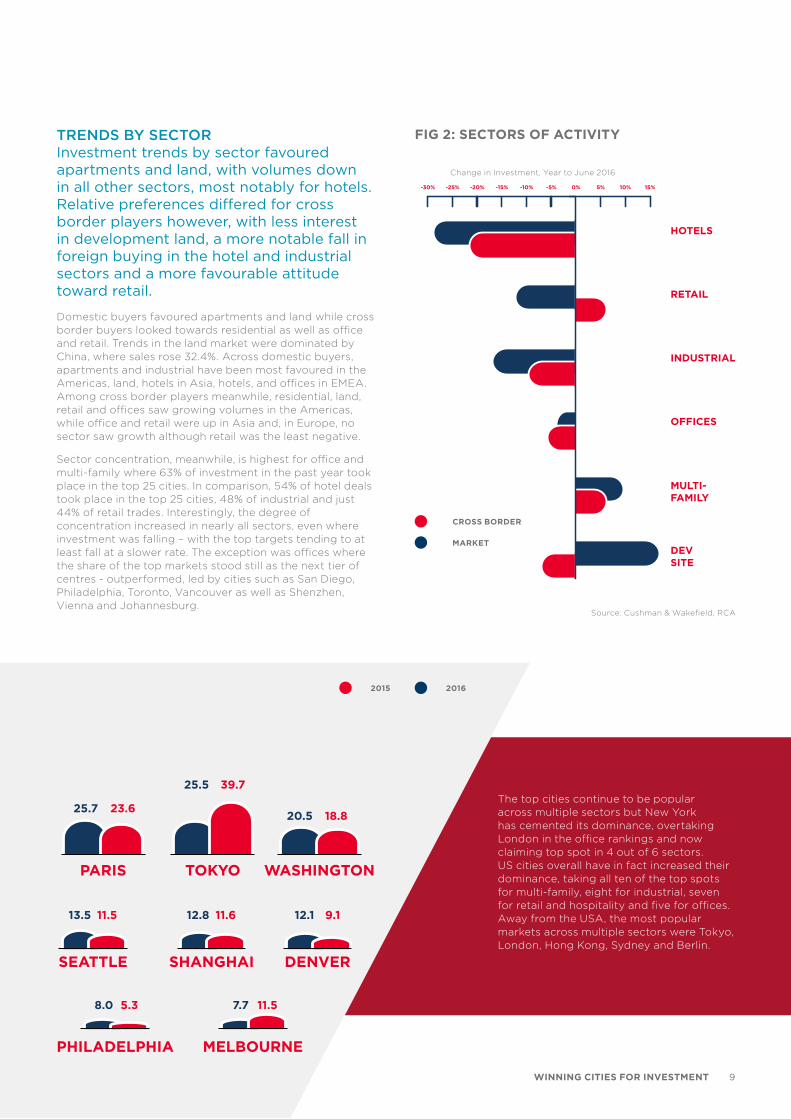
TRENDS BY SECTORInvestment trends by sector favoured apartments and land, with volumes down in all other sectors, most notably for hotels. Relative preferences differed for cross border players however, with less interest in development land, a more notable fall in foreign buying in the hotel and industrial sectors and a more favourable attitude toward retail.
Domestic buyers favoured apartments and land while cross border buyers looked towards residential as well as office and retail. Trends in the land market were dominated by China, where sales rose 32.4%. Across domestic buyers, apartments and industrial have been most favoured in the Americas, land, hotels in Asia, hotels, and offices in EMEA. Among cross border players meanwhile, residential, land, retail and offices saw growing volumes in the Americas, while office and retail were up in Asia and, in Europe, no sector saw growth although retail was the least negative.
Sector concentration, meanwhile, is highest for office and multi-family where 63% of investment in the past year took place in the top 25 cities. In comparison, 54% of hotel deals took place in the top 25 cities, 48% of industrial and just 44% of retail trades. Interestingly, the degree of concentration increased in nearly all sectors, even where investment was falling – with the top targets tending to at least fall at a slower rate. The exception was offices where the share of the top markets stood still as the next tier of centres - outperformed, led by cities such as San Diego, Philadelphia, Toronto, Vancouver as well as Shenzhen, Vienna and Johannesburg.
25.7 23.6
PARIS
20.5 18.8
25.5 39.7
WASHINGTONTOKYO
11.612.8
SHANGHAI
13.5 11.5
SEATTLE
7.7 11.5
MELBOURNE
8.0 5.3
PHILADELPHIA
DENVER
9.112.1
FIG 2: SECTORS OF ACTIVITY
Source: Cushman & Wakefield, RCA
Change in Investment, Year to June 2016
The top cities continue to be popular across multiple sectors but New York has cemented its dominance, overtaking London in the office rankings and now claiming top spot in 4 out of 6 sectors. US cities overall have in fact increased their dominance, taking all ten of the top spots for multi-family, eight for industrial, seven for retail and hospitality and five for offices. Away from the USA, the most popular markets across multiple sectors were Tokyo, London, Hong Kong, Sydney and Berlin.
WINNING CITIES FOR INVESTMENT 9
NEW YORKLONDON
PARISLA
AMSTERDAMSYDNEYBERLIN
HONG KONGSAN FRANCISCO
SHANGHAIBOSTON
SINGAPOREWASHINGTON DC
MELBOURNETOKYO
FRANKFURTCOPENHAGEN
MUNICHDUBLINMILANMIAMI
ATLANTACHICAGO
VIENNASEATTLE
0 5 10 15 20 25 30 35 40
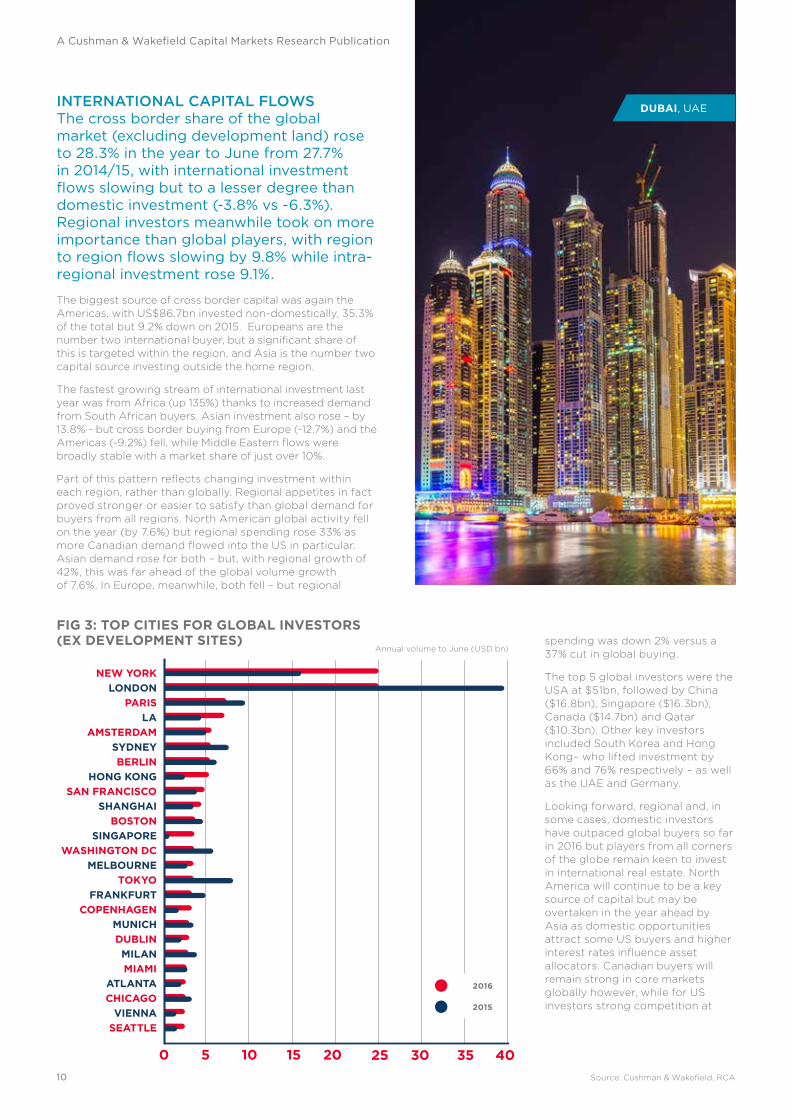
DUBAI, UAE
spending was down 2% versus a 37% cut in global buying.
The top 5 global investors were the USA at $51bn, followed by China ($16.8bn), Singapore ($16.3bn), Canada ($14.7bn) and Qatar ($10.3bn). Other key investors included South Korea and Hong Kong– who lifted investment by 66% and 76% respectively – as well as the UAE and Germany.
Looking forward, regional and, in some cases, domestic investors have outpaced global buyers so far in 2016 but players from all corners of the globe remain keen to invest in international real estate. North America will continue to be a key source of capital but may be overtaken in the year ahead by Asia as domestic opportunities attract some US buyers and higher interest rates influence asset allocators. Canadian buyers will remain strong in core markets globally however, while for US investors strong competition at
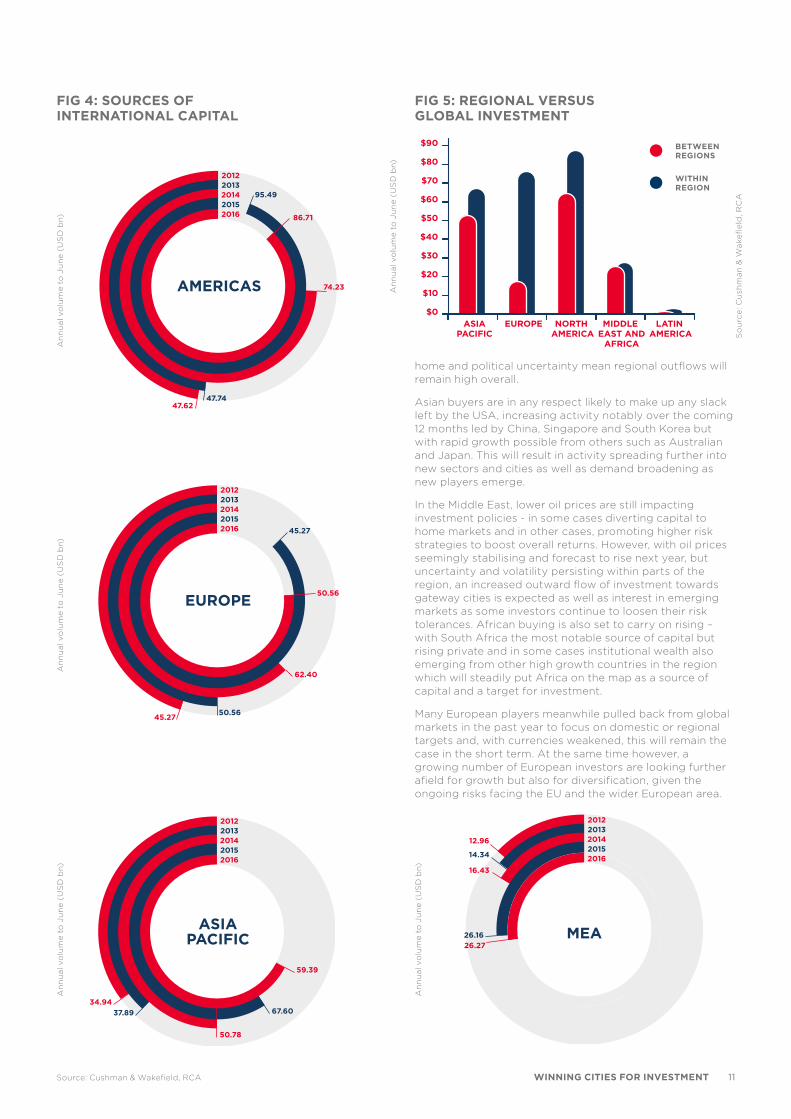
INTERNATIONAL CAPITAL FLOWSThe cross border share of the global market (excluding development land) rose to 28.3% in the year to June from 27.7% in 2014/15, with international investment flows slowing but to a lesser degree than domestic investment (-3.8% vs -6.3%). Regional investors meanwhile took on more importance than global players, with region to region flows slowing by 9.8% while intra-regional investment rose 9.1%.
The biggest source of cross border capital was again the Americas, with US$86.7bn invested non-domestically, 35.3% of the total but 9.2% down on 2015. Europeans are the number two international buyer, but a significant share of this is targeted within the region, and Asia is the number two capital source investing outside the home region.
The fastest growing stream of international investment last year was from Africa (up 135%) thanks to increased demand from South African buyers. Asian investment also rose – by 13.8% - but cross border buying from Europe (-12.7%) and the Americas (-9.2%) fell, while Middle Eastern flows were broadly stable with a market share of just over 10%.
Part of this pattern reflects changing investment within each region, rather than globally. Regional appetites in fact proved stronger or easier to satisfy than global demand for buyers from all regions. North American global activity fell on the year (by 7.6%) but regional spending rose 33% as more Canadian demand flowed into the US in particular. Asian demand rose for both – but, with regional growth of 42%, this was far ahead of the global volume growth of 7.6%. In Europe, meanwhile, both fell – but regional
FIG 3: TOP CITIES FOR GLOBAL INVESTORS (EX DEVELOPMENT SITES)
2016
2015
Source: Cushman & Wakefield, RCA
Annual volume to June (USD bn)
A Cushman & Wakefield Capital Markets Research Publication
10
ASIAPACIFIC
EUROPE NORTH AMERICA
MIDDLE EAST AND
AFRICA
LATIN AMERICA
$90
$80
$70
$60
$50
$40
$30
$20
$10
$0
47.62
74.23
86.71
47.74
95.49
20122013201420152016
AMERICAS
45.27
62.40
50.56
50.56
45.27
20122013201420152016
EUROPE
34.94
50.78
59.39
37.89 67.60
20122013201420152016
ASIAPACIFIC
12.96
16.43
14.34
26.16
20122013201420152016
MEA26.27
home and political uncertainty mean regional outflows will remain high overall.
Asian buyers are in any respect likely to make up any slack left by the USA, increasing activity notably over the coming 12 months led by China, Singapore and South Korea but with rapid growth possible from others such as Australian and Japan. This will result in activity spreading further into new sectors and cities as well as demand broadening as new players emerge.
In the Middle East, lower oil prices are still impacting investment policies - in some cases diverting capital to home markets and in other cases, promoting higher risk strategies to boost overall returns. However, with oil prices seemingly stabilising and forecast to rise next year, but uncertainty and volatility persisting within parts of the region, an increased outward flow of investment towards gateway cities is expected as well as interest in emerging markets as some investors continue to loosen their risk tolerances. African buying is also set to carry on rising – with South Africa the most notable source of capital but rising private and in some cases institutional wealth also emerging from other high growth countries in the region which will steadily put Africa on the map as a source of capital and a target for investment.
Many European players meanwhile pulled back from global markets in the past year to focus on domestic or regional targets and, with currencies weakened, this will remain the case in the short term. At the same time however, a growing number of European investors are looking further afield for growth but also for diversification, given the ongoing risks facing the EU and the wider European area.
Source: Cushman & Wakefield, RCA
FIG 4: SOURCES OF INTERNATIONAL CAPITAL
FIG 5: REGIONAL VERSUS GLOBAL INVESTMENT
An
nu
al v
olu
me
to J
un
e (U
SD
bn)
An
nu
al v
olu
me
to J
un
e (U
SD
bn)
An
nu
al v
olu
me
to J
un
e (U
SD
bn)
An
nu
al v
olu
me
to J
un
e (U
SD
bn)
An
nu
al v
olu
me
to J
un
e (U
SD
bn)
So
urc
e: C
ush
man
& W
ake
fie
ld, R
CA
BETWEEN REGIONS
WITHIN REGION
WINNING CITIES FOR INVESTMENT 11
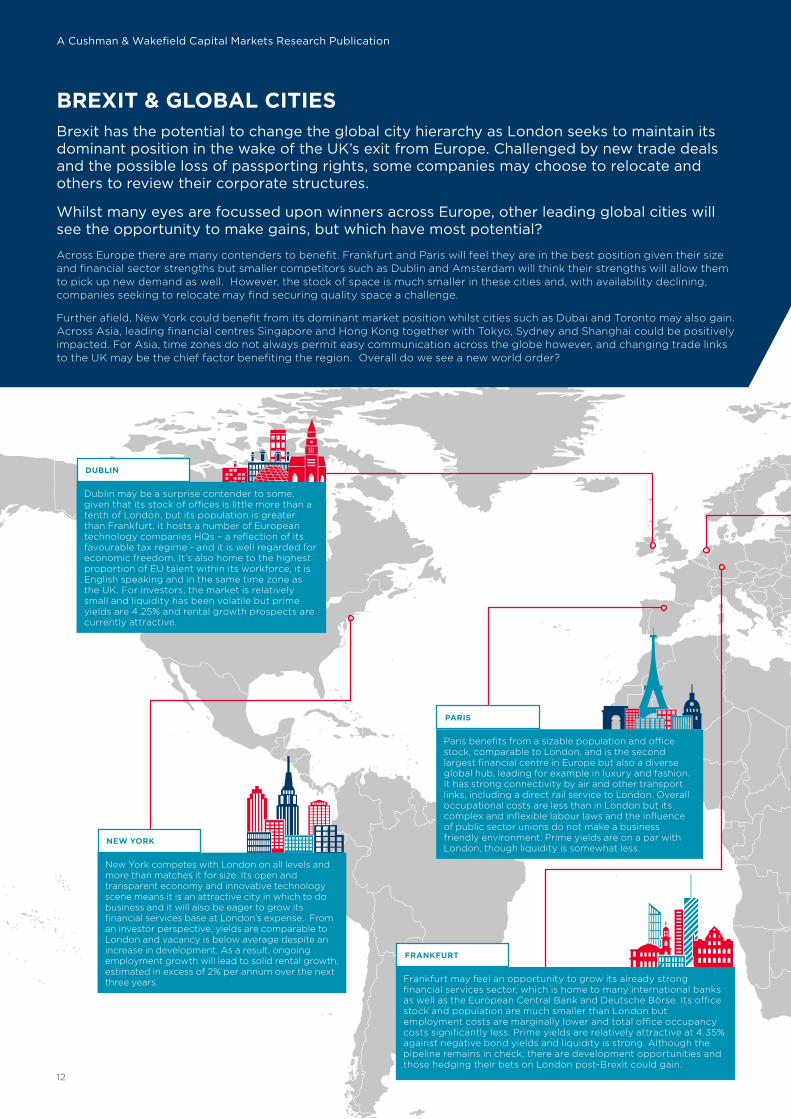
BREXIT & GLOBAL CITIESBrexit has the potential to change the global city hierarchy as London seeks to maintain its dominant position in the wake of the UK’s exit from Europe. Challenged by new trade deals and the possible loss of passporting rights, some companies may choose to relocate and others to review their corporate structures.
Whilst many eyes are focussed upon winners across Europe, other leading global cities will see the opportunity to make gains, but which have most potential?
Across Europe there are many contenders to benefit. Frankfurt and Paris will feel they are in the best position given their size and financial sector strengths but smaller competitors such as Dublin and Amsterdam will think their strengths will allow them to pick up new demand as well. However, the stock of space is much smaller in these cities and, with availability declining, companies seeking to relocate may find securing quality space a challenge.
Further afield, New York could benefit from its dominant market position whilst cities such as Dubai and Toronto may also gain. Across Asia, leading financial centres Singapore and Hong Kong together with Tokyo, Sydney and Shanghai could be positively impacted. For Asia, time zones do not always permit easy communication across the globe however, and changing trade links to the UK may be the chief factor benefiting the region. Overall do we see a new world order?
Frankfurt may feel an opportunity to grow its already strong financial services sector, which is home to many international banks as well as the European Central Bank and Deutsche Börse. Its office stock and population are much smaller than London but employment costs are marginally lower and total office occupancy costs significantly less. Prime yields are relatively attractive at 4.35% against negative bond yields and liquidity is strong. Although the pipeline remains in check, there are development opportunities and those hedging their bets on London post-Brexit could gain.
FRANKFURT
Paris benefits from a sizable population and office stock, comparable to London, and is the second largest financial centre in Europe but also a diverse global hub, leading for example in luxury and fashion. It has strong connectivity by air and other transport links, including a direct rail service to London. Overall occupational costs are less than in London but its complex and inflexible labour laws and the influence of public sector unions do not make a business friendly environment. Prime yields are on a par with London, though liquidity is somewhat less.
PARIS
Dublin may be a surprise contender to some, given that its stock of offices is little more than a tenth of London, but its population is greater than Frankfurt, it hosts a number of European technology companies HQs – a reflection of its favourable tax regime - and it is well regarded for economic freedom. It’s also home to the highest proportion of EU talent within its workforce, it is English speaking and in the same time zone as the UK. For investors, the market is relatively small and liquidity has been volatile but prime yields are 4.25% and rental growth prospects are currently attractive.
DUBLIN
New York competes with London on all levels and more than matches it for size. Its open and transparent economy and innovative technology scene means it is an attractive city in which to do business and it will also be eager to grow its financial services base at London’s expense. From an investor perspective, yields are comparable to London and vacancy is below average despite an increase in development. As a result, ongoing employment growth will lead to solid rental growth, estimated in excess of 2% per annum over the next three years.
NEW YORK
12
A Cushman & Wakefield Capital Markets Research Publication

With a strong occupier base in the banking and financial services sector, and an office stock double that of Dublin, Amsterdam may feel a worthy contender to gain market share from London. The city’s population has strong language skills and high proficiency in English. Rents and occupancy costs are favourable for occupiers and it is generally a business friendly environment. A relatively high vacancy rate will keep rental growth in check despite there being little construction. Prime yields at 5% are favourable to investors seeking opportunities in this liquid market.
AMSTERDAM
Hong Kong has maintained strong ties with the UK and is a major financial centre in the region. It also benefits from strong transparency and legal framework which have made it attractive to many Chinese companies listing and using the city as a springboard to the rest of the world. In the short-term Hong Kong is likely to maintain a lead over Shanghai but this could be weakened over the longer term as transparency improves in mainland China. Investors might be dissuaded by prime yields at sub 3%, but rental growth is forecast to average 3% pa over the next five years.
HONG KONG
Singapore benefits from a strong education system, leading universities and strong language skills. The country also sits alongside Hong Kong for its high level of economic freedom. Prime yields are on a par with London and, despite being roughly a tenth the size of London, it competes to be one of the most liquid investment markets globally. The economy continues to perform well, especially for office-based sectors, and despite increased development, vacancy is low. In the near term, rents are expected to moderate, providing an opportune time for occupiers to expand.
SINGAPORE
Sydney is a relatively small market with an office stock roughly one-fifth that of London. While volumes over the past year were roughly a quarter of the UK capital, the city does benefit from strong liquidity over the cycle and with prime yields above 5%, it is an attractive proposition for investors. The city has a high degree of economic freedom, strong language skills and proficiency in English. With Australia supportive of an early new trade agreement with the UK, it could benefit from stronger trade ties, albeit its size relative to other markets in the region will limit growth.
SYDNEY
Tokyo is one of the few Asian office markets that can rival the size of London. Japan also enjoys strong ties with the UK and could benefit from longer-term trade deals. Risks in Japan are also relatively low but language and education can be an issue for incoming businesses and this could hold the country back. The city is also seen as a more domestic market and this is reflected in market activity with liquidity relatively weak for a market of this size. Prime yields are below 4%, though this is partially offset by rental growth projected at over 3% per annum for the next five years.
TOKYO
OUTLOOKWe are some way from knowing the likely form of any UK exit from the EU but it is clear there will be a range of contenders to gain from the process, including those benefiting from a shift in trade and investment as well as those that see demand diverted and grow in influence as a result.
In particular, the loss of passporting rights could see a shift of some financial service business functions to cities such as Dublin, Frankfurt or Paris – although at present it looks likely that any such moves will be on the margins of overall headcount.
Whatever happens however, London is likely to continue to reinvent itself as a leading global city, just as it has in the past, and to vie with New York as the leading global city. In fact while London could lose some of its European importance, it could become even more global in the years to come.
BREXIT & GLOBAL CITIES 13
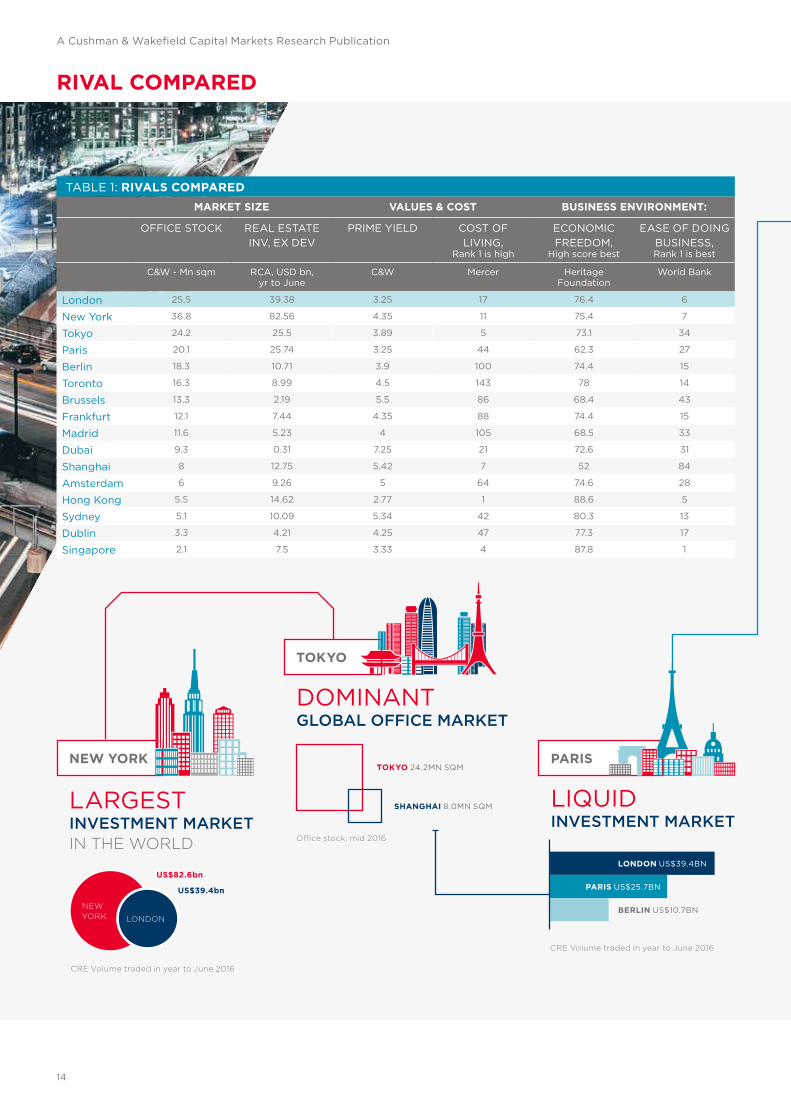
TABLE 1: RIVALS COMPAREDMARKET SIZE VALUES & COST BUSINESS ENVIRONMENT:
OFFICE STOCK REAL ESTATE INV, EX DEV
PRIME YIELD COST OF LIVING,
Rank 1 is high
ECONOMIC FREEDOM,
High score best
EASE OF DOING BUSINESS, Rank 1 is best
C&W - Mn sqm RCA, USD bn, yr to June
C&W Mercer Heritage Foundation
World Bank
London 25.5 39.38 3.25 17 76.4 6
New York 36.8 82.56 4.35 11 75.4 7
Tokyo 24.2 25.5 3.89 5 73.1 34
Paris 20.1 25.74 3.25 44 62.3 27
Berlin 18.3 10.71 3.9 100 74.4 15
Toronto 16.3 8.99 4.5 143 78 14
Brussels 13.3 2.19 5.5 86 68.4 43
Frankfurt 12.1 7.44 4.35 88 74.4 15
Madrid 11.6 5.23 4 105 68.5 33
Dubai 9.3 0.31 7.25 21 72.6 31
Shanghai 8 12.75 5.42 7 52 84
Amsterdam 6 9.26 5 64 74.6 28
Hong Kong 5.5 14.62 2.77 1 88.6 5
Sydney 5.1 10.09 5.34 42 80.3 13
Dublin 3.3 4.21 4.25 47 77.3 17
Singapore 2.1 7.5 3.33 4 87.8 1
RIVAL COMPARED
NEW YORK
LARGESTINVESTMENT MARKETIN THE WORLD
NEWYORK LONDON
US$82.6bn
US$39.4bn
CRE Volume traded in year to June 2016
TOKYO
DOMINANTGLOBAL OFFICE MARKET
TOKYO 24.2MN SQM
SHANGHAI 8.0MN SQM
Office stock, mid 2016
PARIS
LIQUIDINVESTMENT MARKET
LONDON US$39.4BN
PARIS US$25.7BN
BERLIN US$10.7BN
CRE Volume traded in year to June 2016
A Cushman & Wakefield Capital Markets Research Publication
14
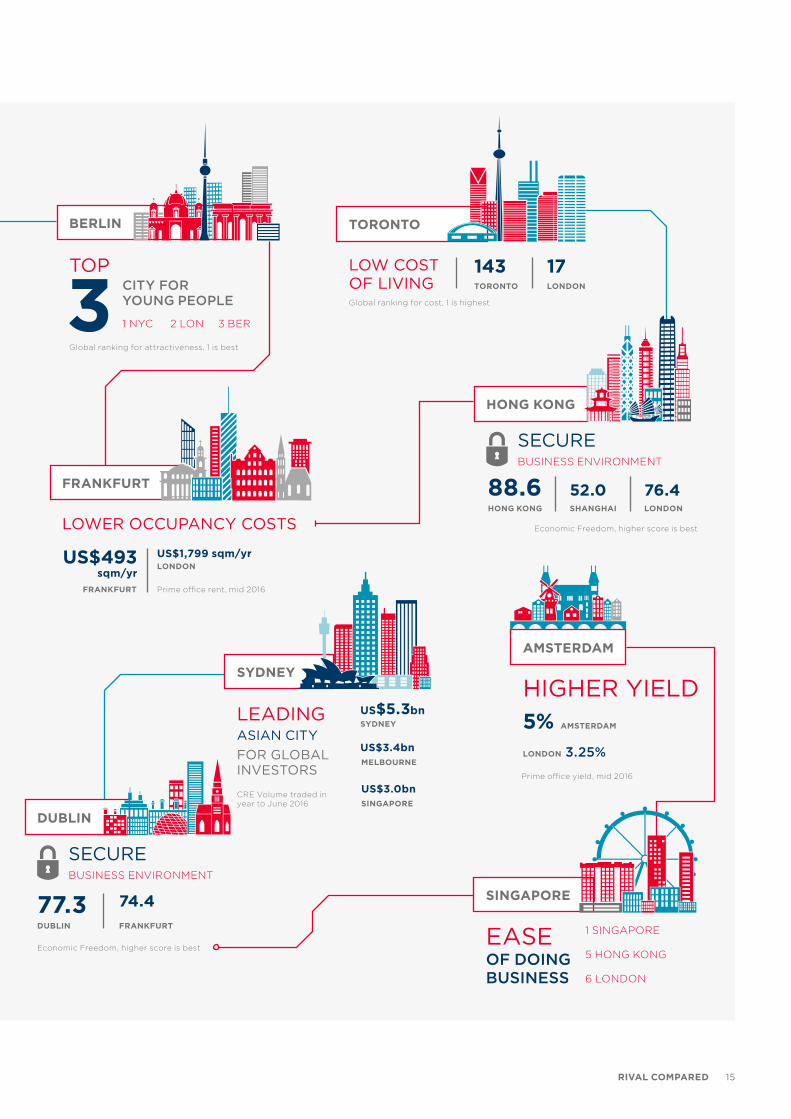
AMSTERDAM
HIGHER YIELD
Prime office yield, mid 2016
LONDON 3.25%
5% AMSTERDAM
BERLIN
TOPCITY FOR YOUNG PEOPLE
Global ranking for attractiveness, 1 is best
1 NYC 2 LON 3 BER
TORONTO
LOW COST OF LIVINGGlobal ranking for cost, 1 is highest
143 17TORONTO LONDON
FRANKFURT
LOWER OCCUPANCY COSTS
Prime office rent, mid 2016
US$493 sqm/yr
FRANKFURT
US$1,799 sqm/yrLONDON
SECURE
HONG KONG
BUSINESS ENVIRONMENT
88.6HONG KONG
52.0 76.4SHANGHAI LONDON
Economic Freedom, higher score is best
SYDNEY
LEADINGASIAN CITYFOR GLOBAL INVESTORS
SYDNEYUS$5.3bn
US$3.4bn
US$3.0bn
MELBOURNE
SINGAPORECRE Volume traded in year to June 2016
SECURE
77.3DUBLIN
DUBLIN
BUSINESS ENVIRONMENT
74.4FRANKFURT
Economic Freedom, higher score is best
SINGAPORE
EASEOF DOING BUSINESS
1 SINGAPORE
5 HONG KONG
6 LONDON
RIVAL COMPARED 15

• Affordability to live, work and play will increasingly define winning cities as the talent they need becomes yet more discerning and mobile.
• One aspect of this is how to make buildings both more productive but also more affordable through construction standards, materials and techniques. Some building providers already find they can attract the same demand and rents with a lower cost fit out through the overall quality and value-add of the space they offer.
• Well-connected, safe public transport is a vital aspect of affordability and an area where government policy can have a rapid impact.
• Spreading demand to best effect is critical in tackling affordability and will continue to be influenced by advancing technology but may also demand a rethink on issues such as what is a suburb. Is it a location for lower cost but accessible functions or is it a mixed-use, integrated alternative submarket? For example, a refocusing on public rather than private transport in the USA and Europe is opening up more viable alternatives to expensive CBDs while delivering new submarkets with scale and critical mass is dramatically changing the choices occupiers face in many global cities, notably Hong Kong and Singapore at present.
• To make cities work they will still need to be denser than today so they can deliver accessibility and proximity at an affordable cost. Smart buildings make this possible but making denser living and working more desirable also requires creative planning and design.
• All of the ingredients for success usually rely on effective infrastructure.
• Infrastructure needs go way beyond transportation of course, including utilities, waste, information and public space. These are all needed to boost safety and efficiency and to raise a city’s profile and confidence in its governance, but with public investment under pressure, partnerships and incentivising private sector investment will be critical.
• Transport planning needs to embrace pedestrians and cyclists as well as vehicles, often a particular challenge in emerging markets, and connections across all transport forms need to be integrated, effective, safe and affordable.
• In terms of specific changes, assisted driving is already here and fully automated vehicles may be closer than many think. However, public acceptance lags behind and applications such as public transport and delivery may be first to see wide scale uptake. Indeed, car sharing rather than automation could be the most revolutionary short-term aspect of the changes to come.
DRIVERS OF CITY CHANGE
• The need for more secure urban environments is growing in the face of crime, terrorism and social unrest. In a risk averse economy, social and institutional risk also come more to the fore.
• All segments of society feel the impact, with safety the top concern among younger people for example (Youthfulcities 2016). This stretches across crime, clean streets and access to public areas. It is also an area where the survey identifies the biggest gap between what people want and what they get – and as such should be a real priority.
• Technology of course has a clear role to play in this - through hardware such as drones, sensors and cameras, on to software and systems to analyse and make use of the data.
• Increasing inequality is also an issue to be addressed. Concentrations of the super-rich can be a threat, as well as an opportunity, and cities must be seen to serve all segments of the community. However high-skilled a city becomes, it still needs a mix of workers and must accommodate their needs for housing, transportation and services.
SECURITY
INFR
AST
RU
CTU
RE
THE NEED FOR MORE
IS GROWING
SECURE, HEALTHIER URBANENVIRONMENTS
TRANSPORT PLANNINGNEEDS TO EMBRACE
PEDESTRIANS & CYCLISTS
CITIESWILL NEEDTO BE DENSER
AFFORDABILITY
A Cushman & Wakefield Capital Markets Research Publication
16
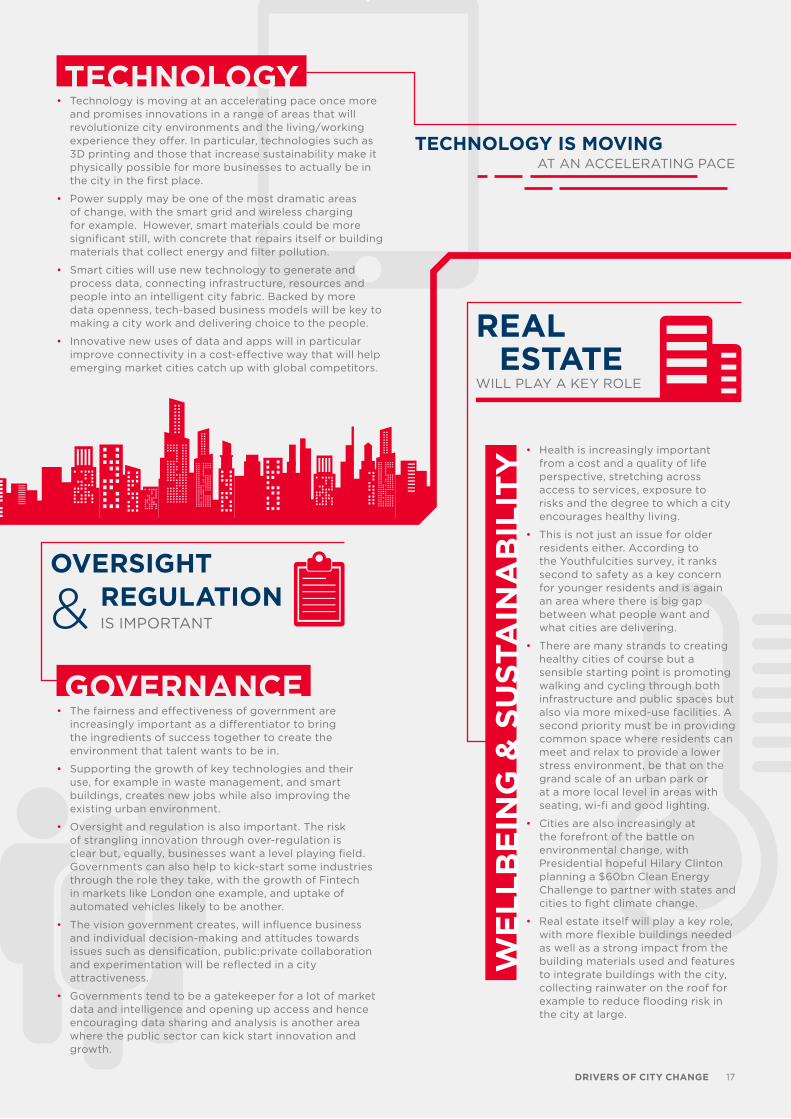
• Health is increasingly important from a cost and a quality of life perspective, stretching across access to services, exposure to risks and the degree to which a city encourages healthy living.
• This is not just an issue for older residents either. According to the Youthfulcities survey, it ranks second to safety as a key concern for younger residents and is again an area where there is big gap between what people want and what cities are delivering.
• There are many strands to creating healthy cities of course but a sensible starting point is promoting walking and cycling through both infrastructure and public spaces but also via more mixed-use facilities. A second priority must be in providing common space where residents can meet and relax to provide a lower stress environment, be that on the grand scale of an urban park or at a more local level in areas with seating, wi-fi and good lighting.
• Cities are also increasingly at the forefront of the battle on environmental change, with Presidential hopeful Hilary Clinton planning a $60bn Clean Energy Challenge to partner with states and cities to fight climate change.
• Real estate itself will play a key role, with more flexible buildings needed as well as a strong impact from the building materials used and features to integrate buildings with the city, collecting rainwater on the roof for example to reduce flooding risk in the city at large.
• Technology is moving at an accelerating pace once more and promises innovations in a range of areas that will revolutionize city environments and the living/working experience they offer. In particular, technologies such as 3D printing and those that increase sustainability make it physically possible for more businesses to actually be in the city in the first place.
• Power supply may be one of the most dramatic areas of change, with the smart grid and wireless charging for example. However, smart materials could be more significant still, with concrete that repairs itself or building materials that collect energy and filter pollution.
• Smart cities will use new technology to generate and process data, connecting infrastructure, resources and people into an intelligent city fabric. Backed by more data openness, tech-based business models will be key to making a city work and delivering choice to the people.
• Innovative new uses of data and apps will in particular improve connectivity in a cost-effective way that will help emerging market cities catch up with global competitors.
• The fairness and effectiveness of government are increasingly important as a differentiator to bring the ingredients of success together to create the environment that talent wants to be in.
• Supporting the growth of key technologies and their use, for example in waste management, and smart buildings, creates new jobs while also improving the existing urban environment.
• Oversight and regulation is also important. The risk of strangling innovation through over-regulation is clear but, equally, businesses want a level playing field. Governments can also help to kick-start some industries through the role they take, with the growth of Fintech in markets like London one example, and uptake of automated vehicles likely to be another.
• The vision government creates, will influence business and individual decision-making and attitudes towards issues such as densification, public:private collaboration and experimentation will be reflected in a city attractiveness.
• Governments tend to be a gatekeeper for a lot of market data and intelligence and opening up access and hence encouraging data sharing and analysis is another area where the public sector can kick start innovation and growth.
TECHNOLOGY
GOVERNANCE
WE
LLB
EIN
G &
SU
STA
INA
BIL
ITY
TECHNOLOGY IS MOVINGAT AN ACCELERATING PACE
OVERSIGHTREGULATION& IS IMPORTANT
REALESTATE
WILL PLAY A KEY ROLE
DRIVERS OF CITY CHANGE 17
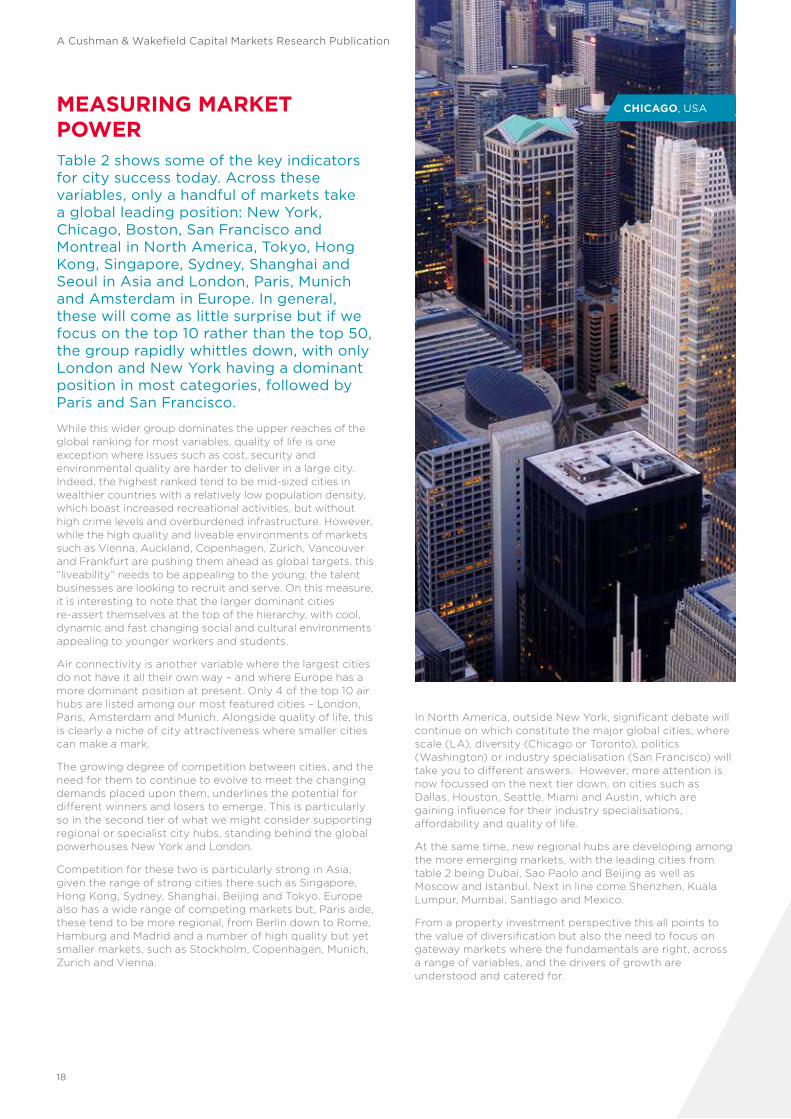
CHICAGO, USAMEASURING MARKET POWERTable 2 shows some of the key indicators for city success today. Across these variables, only a handful of markets take a global leading position: New York, Chicago, Boston, San Francisco and Montreal in North America, Tokyo, Hong Kong, Singapore, Sydney, Shanghai and Seoul in Asia and London, Paris, Munich and Amsterdam in Europe. In general, these will come as little surprise but if we focus on the top 10 rather than the top 50, the group rapidly whittles down, with only London and New York having a dominant position in most categories, followed by Paris and San Francisco.
While this wider group dominates the upper reaches of the global ranking for most variables, quality of life is one exception where issues such as cost, security and environmental quality are harder to deliver in a large city. Indeed, the highest ranked tend to be mid-sized cities in wealthier countries with a relatively low population density, which boast increased recreational activities, but without high crime levels and overburdened infrastructure. However, while the high quality and liveable environments of markets such as Vienna, Auckland, Copenhagen, Zurich, Vancouver and Frankfurt are pushing them ahead as global targets, this “liveability” needs to be appealing to the young; the talent businesses are looking to recruit and serve. On this measure, it is interesting to note that the larger dominant cities re-assert themselves at the top of the hierarchy, with cool, dynamic and fast changing social and cultural environments appealing to younger workers and students.
Air connectivity is another variable where the largest cities do not have it all their own way – and where Europe has a more dominant position at present. Only 4 of the top 10 air hubs are listed among our most featured cities – London, Paris, Amsterdam and Munich. Alongside quality of life, this is clearly a niche of city attractiveness where smaller cities can make a mark.
The growing degree of competition between cities, and the need for them to continue to evolve to meet the changing demands placed upon them, underlines the potential for different winners and losers to emerge. This is particularly so in the second tier of what we might consider supporting regional or specialist city hubs, standing behind the global powerhouses New York and London.
Competition for these two is particularly strong in Asia, given the range of strong cities there such as Singapore, Hong Kong, Sydney, Shanghai, Beijing and Tokyo. Europe also has a wide range of competing markets but, Paris aide, these tend to be more regional, from Berlin down to Rome, Hamburg and Madrid and a number of high quality but yet smaller markets, such as Stockholm, Copenhagen, Munich, Zurich and Vienna.
In North America, outside New York, significant debate will continue on which constitute the major global cities, where scale (LA), diversity (Chicago or Toronto), politics (Washington) or industry specialisation (San Francisco) will take you to different answers. However, more attention is now focussed on the next tier down, on cities such as Dallas, Houston, Seattle, Miami and Austin, which are gaining influence for their industry specialisations, affordability and quality of life.
At the same time, new regional hubs are developing among the more emerging markets, with the leading cities from table 2 being Dubai, Sao Paolo and Beijing as well as Moscow and Istanbul. Next in line come Shenzhen, Kuala Lumpur, Mumbai, Santiago and Mexico.
From a property investment perspective this all points to the value of diversification but also the need to focus on gateway markets where the fundamentals are right, across a range of variables, and the drivers of growth are understood and catered for.
A Cushman & Wakefield Capital Markets Research Publication
18
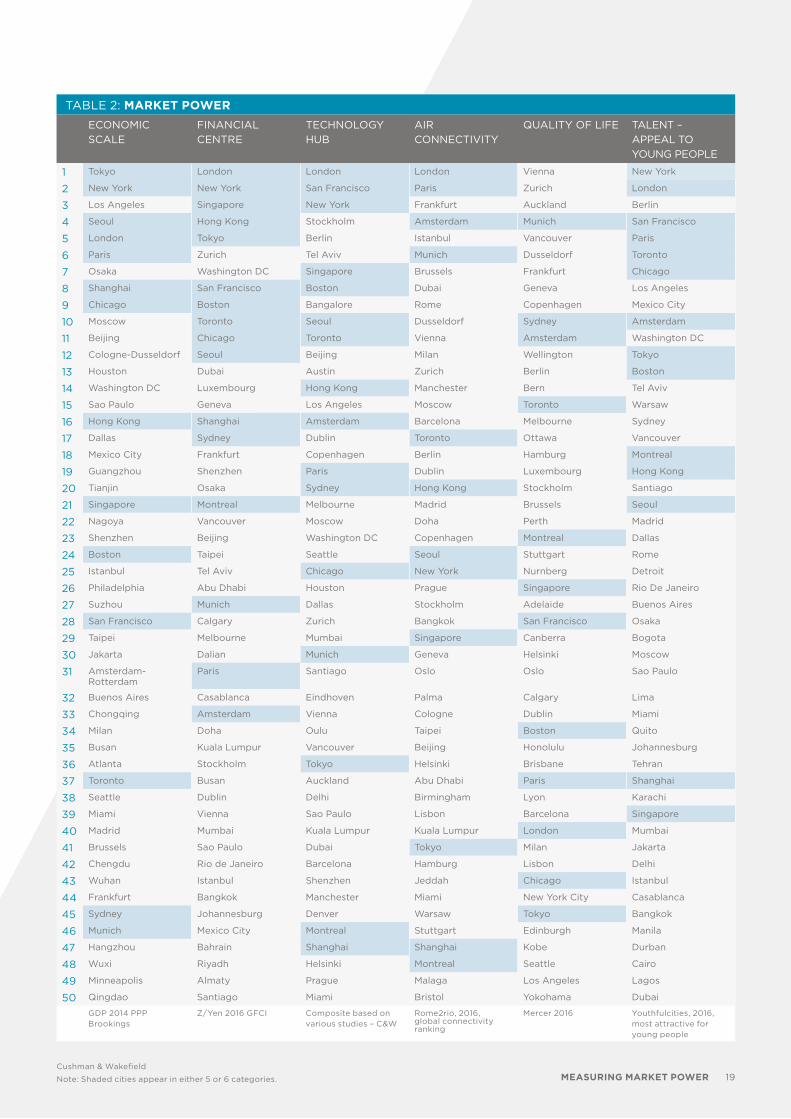
TABLE 2: MARKET POWERECONOMIC SCALE
FINANCIAL CENTRE
TECHNOLOGY HUB
AIR CONNECTIVITY
QUALITY OF LIFE TALENT – APPEAL TO YOUNG PEOPLE
1 Tokyo London London London Vienna New York
2 New York New York San Francisco Paris Zurich London
3 Los Angeles Singapore New York Frankfurt Auckland Berlin
4 Seoul Hong Kong Stockholm Amsterdam Munich San Francisco
5 London Tokyo Berlin Istanbul Vancouver Paris
6 Paris Zurich Tel Aviv Munich Dusseldorf Toronto
7 Osaka Washington DC Singapore Brussels Frankfurt Chicago
8 Shanghai San Francisco Boston Dubai Geneva Los Angeles
9 Chicago Boston Bangalore Rome Copenhagen Mexico City
10 Moscow Toronto Seoul Dusseldorf Sydney Amsterdam
11 Beijing Chicago Toronto Vienna Amsterdam Washington DC
12 Cologne-Dusseldorf Seoul Beijing Milan Wellington Tokyo
13 Houston Dubai Austin Zurich Berlin Boston
14 Washington DC Luxembourg Hong Kong Manchester Bern Tel Aviv
15 Sao Paulo Geneva Los Angeles Moscow Toronto Warsaw
16 Hong Kong Shanghai Amsterdam Barcelona Melbourne Sydney
17 Dallas Sydney Dublin Toronto Ottawa Vancouver
18 Mexico City Frankfurt Copenhagen Berlin Hamburg Montreal
19 Guangzhou Shenzhen Paris Dublin Luxembourg Hong Kong
20 Tianjin Osaka Sydney Hong Kong Stockholm Santiago
21 Singapore Montreal Melbourne Madrid Brussels Seoul
22 Nagoya Vancouver Moscow Doha Perth Madrid
23 Shenzhen Beijing Washington DC Copenhagen Montreal Dallas
24 Boston Taipei Seattle Seoul Stuttgart Rome
25 Istanbul Tel Aviv Chicago New York Nurnberg Detroit
26 Philadelphia Abu Dhabi Houston Prague Singapore Rio De Janeiro
27 Suzhou Munich Dallas Stockholm Adelaide Buenos Aires
28 San Francisco Calgary Zurich Bangkok San Francisco Osaka
29 Taipei Melbourne Mumbai Singapore Canberra Bogota
30 Jakarta Dalian Munich Geneva Helsinki Moscow
31 Amsterdam-Rotterdam
Paris Santiago Oslo Oslo Sao Paulo
32 Buenos Aires Casablanca Eindhoven Palma Calgary Lima
33 Chongqing Amsterdam Vienna Cologne Dublin Miami
34 Milan Doha Oulu Taipei Boston Quito
35 Busan Kuala Lumpur Vancouver Beijing Honolulu Johannesburg
36 Atlanta Stockholm Tokyo Helsinki Brisbane Tehran
37 Toronto Busan Auckland Abu Dhabi Paris Shanghai
38 Seattle Dublin Delhi Birmingham Lyon Karachi
39 Miami Vienna Sao Paulo Lisbon Barcelona Singapore
40 Madrid Mumbai Kuala Lumpur Kuala Lumpur London Mumbai
41 Brussels Sao Paulo Dubai Tokyo Milan Jakarta
42 Chengdu Rio de Janeiro Barcelona Hamburg Lisbon Delhi
43 Wuhan Istanbul Shenzhen Jeddah Chicago Istanbul
44 Frankfurt Bangkok Manchester Miami New York City Casablanca
45 Sydney Johannesburg Denver Warsaw Tokyo Bangkok
46 Munich Mexico City Montreal Stuttgart Edinburgh Manila
47 Hangzhou Bahrain Shanghai Shanghai Kobe Durban
48 Wuxi Riyadh Helsinki Montreal Seattle Cairo
49 Minneapolis Almaty Prague Malaga Los Angeles Lagos
50 Qingdao Santiago Miami Bristol Yokohama Dubai
GDP 2014 PPP Brookings
Z/Yen 2016 GFCI Composite based on various studies – C&W
Rome2rio, 2016, global connectivity ranking
Mercer 2016 Youthfulcities, 2016, most attractive for young people
Cushman & Wakefield
Note: Shaded cities appear in either 5 or 6 categories. MEASURING MARKET POWER 19
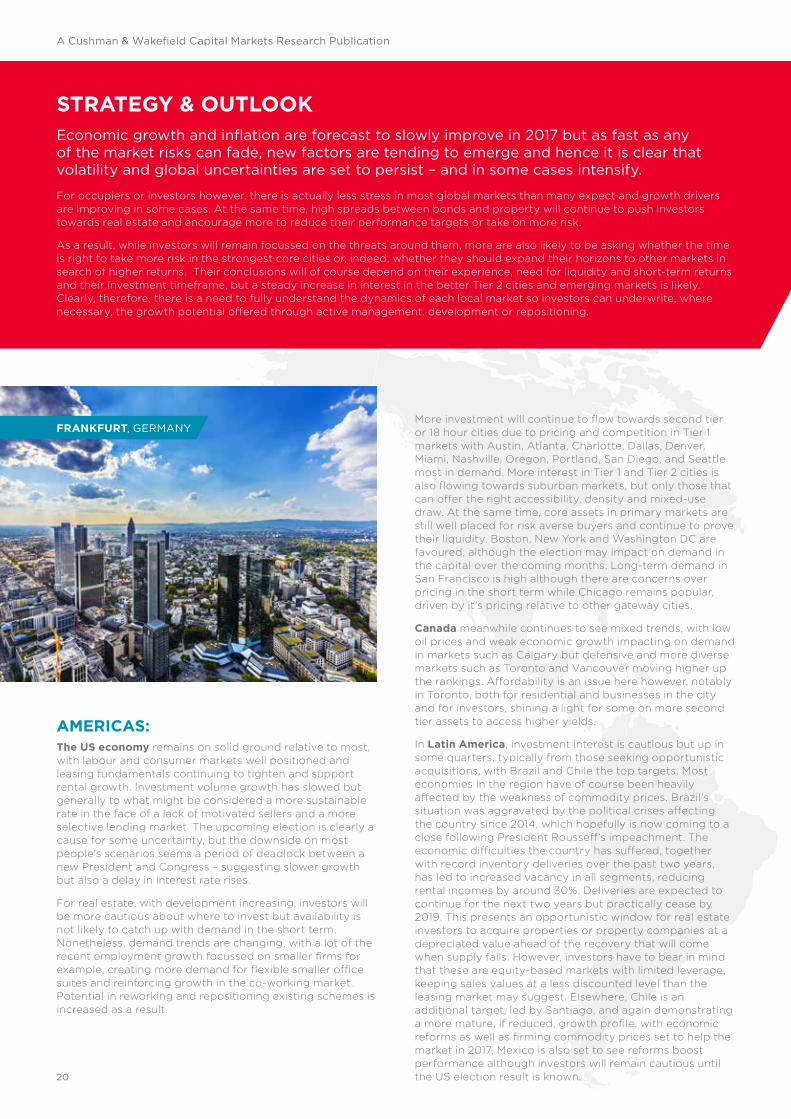
FRANKFURT, GERMANY
AMERICAS:The US economy remains on solid ground relative to most, with labour and consumer markets well positioned and leasing fundamentals continuing to tighten and support rental growth. Investment volume growth has slowed but generally to what might be considered a more sustainable rate in the face of a lack of motivated sellers and a more selective lending market. The upcoming election is clearly a cause for some uncertainty, but the downside on most people’s scenarios seems a period of deadlock between a new President and Congress – suggesting slower growth but also a delay in interest rate rises.
For real estate, with development increasing, investors will be more cautious about where to invest but availability is not likely to catch up with demand in the short term. Nonetheless, demand trends are changing, with a lot of the recent employment growth focussed on smaller firms for example, creating more demand for flexible smaller office suites and reinforcing growth in the co-working market. Potential in reworking and repositioning existing schemes is increased as a result.
STRATEGY & OUTLOOKEconomic growth and inflation are forecast to slowly improve in 2017 but as fast as any of the market risks can fade, new factors are tending to emerge and hence it is clear that volatility and global uncertainties are set to persist – and in some cases intensify.
For occupiers or investors however, there is actually less stress in most global markets than many expect and growth drivers are improving in some cases. At the same time, high spreads between bonds and property will continue to push investors towards real estate and encourage more to reduce their performance targets or take on more risk.
As a result, while investors will remain focussed on the threats around them, more are also likely to be asking whether the time is right to take more risk in the strongest core cities or, indeed, whether they should expand their horizons to other markets in search of higher returns. Their conclusions will of course depend on their experience, need for liquidity and short-term returns and their investment timeframe, but a steady increase in interest in the better Tier 2 cities and emerging markets is likely. Clearly, therefore, there is a need to fully understand the dynamics of each local market so investors can underwrite, where necessary, the growth potential offered through active management, development or repositioning.
More investment will continue to flow towards second tier or 18 hour cities due to pricing and competition in Tier 1 markets with Austin, Atlanta, Charlotte, Dallas, Denver, Miami, Nashville, Oregon, Portland, San Diego, and Seattle most in demand. More interest in Tier 1 and Tier 2 cities is also flowing towards suburban markets, but only those that can offer the right accessibility, density and mixed-use draw. At the same time, core assets in primary markets are still well placed for risk averse buyers and continue to prove their liquidity. Boston, New York and Washington DC are favoured, although the election may impact on demand in the capital over the coming months. Long-term demand in San Francisco is high although there are concerns over pricing in the short term while Chicago remains popular, driven by it’s pricing relative to other gateway cities.
Canada meanwhile continues to see mixed trends, with low oil prices and weak economic growth impacting on demand in markets such as Calgary but defensive and more diverse markets such as Toronto and Vancouver moving higher up the rankings. Affordability is an issue here however, notably in Toronto, both for residential and businesses in the city and for investors, shining a light for some on more second tier assets to access higher yields.
In Latin America, investment interest is cautious but up in some quarters, typically from those seeking opportunistic acquisitions, with Brazil and Chile the top targets. Most economies in the region have of course been heavily affected by the weakness of commodity prices. Brazil’s situation was aggravated by the political crises affecting the country since 2014, which hopefully is now coming to a close following President Rousseff’s impeachment. The economic difficulties the country has suffered, together with record inventory deliveries over the past two years, has led to increased vacancy in all segments, reducing rental incomes by around 30%. Deliveries are expected to continue for the next two years but practically cease by 2019. This presents an opportunistic window for real estate investors to acquire properties or property companies at a depreciated value ahead of the recovery that will come when supply falls. However, investors have to bear in mind that these are equity-based markets with limited leverage, keeping sales values at a less discounted level than the leasing market may suggest. Elsewhere, Chile is an additional target, led by Santiago, and again demonstrating a more mature, if reduced, growth profile, with economic reforms as well as firming commodity prices set to help the market in 2017. Mexico is also set to see reforms boost performance although investors will remain cautious until the US election result is known.
A Cushman & Wakefield Capital Markets Research Publication
20

SHANGHAI, CHINA
EUROPEEconomic headwinds have increased in Europe, with Brexit adding to a subdued outlook. However, conditions generally are stable rather than declining, with labour demand and low interest rates supporting domestic demand, in particular, and suggesting retail, residential and logistics growth will continue.
Indeed, the real estate market in general has become more balanced over the past year, with investment markets strong but stabilizing. Meanwhile, occupier markets have steadily improved, with take-up overall generally rising and positive rental growth evident. However, the growth story is strongly linked to prime space and to the strongest cities, with recovery still far from evident in secondary markets.
Germany is performing steadily and set to benefit from Brexit as Europe’s next most liquid and stable market. However, finding stock is very difficult, forcing more investors to look further afield and hence, while core is in favour, buyers are being
displaced from the core and this will set up a ripple effect of greater demand filtering to other markets. The Nordics are already benefiting from this – offering high quality city markets but also strong growth dynamics. Despite political uncertainty, Paris will also be a beneficiary, with low vacancy and improving labour markets suggesting rental pressures will mount and long-term potential arising from infrastructure development. Madrid and Barcelona are similarly positive while Dublin is also in a growth phase that has further to run.
Other core markets such as Amsterdam appeal to investors thanks to their ongoing recovery potential and relative yield levels, while some such as Lisbon are gaining favour as an occupational target and hence are on the radar for more investors as well. Central and some eastern markets are in recovery mode with good relative medium term potential while for higher risk takers, the Russian market is judged close to stabilising, setting the scene for an upturn in demand in Moscow as banks restructure bad loans.
ASIADespite global concerns, macro conditions in Asia have generally been healthy in 2016 to date, with growth stable in China and rising in markets such as India, Indonesia and Australia, while central bank and government support continues to stimulate the market. Occupier markets are more mixed, with generally good tenant activity but some caution, and also some markets starting to cope with higher supply. Nonetheless, with ultra-low vacancy in many markets and sectors of strong growth such as services in Australia and Tier 1 China, technology in Indian markets like Bengaluru and Hyderabad and the buoyant BPO market in Manila, many markets are landlord friendly.
For core players, Australia and Japan will remain in demand despite the increasingly crowded nature of their markets but this may lead to more diversification into new markets and sectors as well as more joint ventures or takeovers. In more emerging markets meanwhile, new supply may blunt rental growth but will also be a catalyst for new occupiers to arrive, reinforcing the emergence of these cities over the medium term. The key areas of activity are expected to be core cities in China, Singapore and South Korea, as well as markets such as Taipei, Auckland and secondary cities in core countries.
STRATEGY & OUTLOOK 21
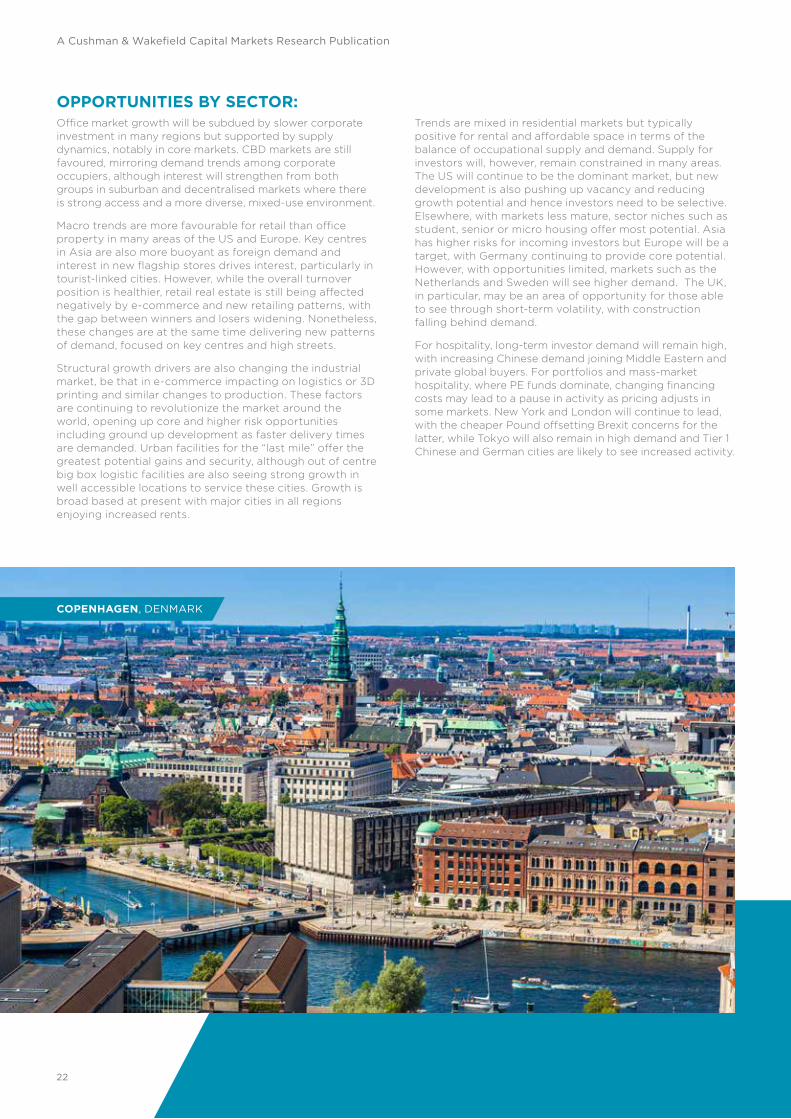
COPENHAGEN, DENMARK
OPPORTUNITIES BY SECTOR:Office market growth will be subdued by slower corporate investment in many regions but supported by supply dynamics, notably in core markets. CBD markets are still favoured, mirroring demand trends among corporate occupiers, although interest will strengthen from both groups in suburban and decentralised markets where there is strong access and a more diverse, mixed-use environment.
Macro trends are more favourable for retail than office property in many areas of the US and Europe. Key centres in Asia are also more buoyant as foreign demand and interest in new flagship stores drives interest, particularly in tourist-linked cities. However, while the overall turnover position is healthier, retail real estate is still being affected negatively by e-commerce and new retailing patterns, with the gap between winners and losers widening. Nonetheless, these changes are at the same time delivering new patterns of demand, focused on key centres and high streets.
Structural growth drivers are also changing the industrial market, be that in e-commerce impacting on logistics or 3D printing and similar changes to production. These factors are continuing to revolutionize the market around the world, opening up core and higher risk opportunities including ground up development as faster delivery times are demanded. Urban facilities for the “last mile” offer the greatest potential gains and security, although out of centre big box logistic facilities are also seeing strong growth in well accessible locations to service these cities. Growth is broad based at present with major cities in all regions enjoying increased rents.
Trends are mixed in residential markets but typically positive for rental and affordable space in terms of the balance of occupational supply and demand. Supply for investors will, however, remain constrained in many areas. The US will continue to be the dominant market, but new development is also pushing up vacancy and reducing growth potential and hence investors need to be selective. Elsewhere, with markets less mature, sector niches such as student, senior or micro housing offer most potential. Asia has higher risks for incoming investors but Europe will be a target, with Germany continuing to provide core potential. However, with opportunities limited, markets such as the Netherlands and Sweden will see higher demand. The UK, in particular, may be an area of opportunity for those able to see through short-term volatility, with construction falling behind demand.
For hospitality, long-term investor demand will remain high, with increasing Chinese demand joining Middle Eastern and private global buyers. For portfolios and mass-market hospitality, where PE funds dominate, changing financing costs may lead to a pause in activity as pricing adjusts in some markets. New York and London will continue to lead, with the cheaper Pound offsetting Brexit concerns for the latter, while Tokyo will also remain in high demand and Tier 1 Chinese and German cities are likely to see increased activity.
A Cushman & Wakefield Capital Markets Research Publication
22

Source: Cushman & Wakefield, Global Capital Markets
Increasing competition in the core will push pricing higher and also deflect more demand towards new city targets.
Table 3: CITY TARGETS FOR INVESTMENT IN 2017AMERICAS ASIA PACIFIC EMEA
CO
RE
• Offices: US CBD gateway cities led by NYC, Washington DC and Boston followed by core Canadian cities (Toronto, Vancouver)
• Retail: Infill strips, plus core 24 hr gateway cities in USA and Canada
• Apartments: Multi-family in top US cities eg NY, Boston, SF, LA plus build-to core strategies in the above plus the southeast and southwest
• Logistics: Core assets: South California, New Jersey
• Offices: Sydney, Melbourne, Tokyo, Singapore, Seoul
• Retail and Hospitality: Tokyo, Sydney, Osaka, Singapore
• Residential: Japan
• Logistics: Singapore, Sydney, Hong Kong, Tokyo, Osaka
• Office: London, Paris, Stockholm, Copenhagen, Munich, Frankfurt, Berlin, Madrid
• Retail: Dominant centres and flagship high streets in core German and Nordic cities plus Paris, London, Milan, Madrid, Barcelona, Lisbon, Dublin, Amsterdam and Brussels
• Logistics: London, Paris, Hamburg, Munich, Berlin, Rotterdam, Antwerp
CO
RE
-PLU
S
• Offices: Repositioning strategies in gateway cities, plus growth markets (Miami, Atlanta, Seattle, Denver and other tech or lifestyle cities)
• Transit rich secondary markets and near in suburbs of primary markets
• Logistics: Development in space constrained top 10 markets
• Offices: Hong Kong, Seoul, key Indian cities: NCR, Mumbai and Bangalore, plus Shanghai, Beijing and potentially stronger tier 2 Chinese cities
• Retail: Growth markets such as Singapore, Jakarta, Kuala Lumpur and Seoul
• Retail centres in core areas of Shanghai and Beijing
• Residential: Singapore
• Offices: Amsterdam, tier 2 German and select UK cities, Budapest, Barcelona, Vienna, Milan, Lisbon, plus repositioning in core cities in West and Central Europe.
• Retail: Refurbishment in core cities in northern Europe. Core space in larger cities in Italy, Spain and Central Europe.
• Logistics: German tier 2, Dublin, Madrid, Warsaw, Prague and Budapest
OP
PO
RT
UN
IST
IC
• Logistics: Markets servicing key Brazilian and Mexican cities
• Retail and residential: Santiago, Mexican and Colombian cities
• Assets or platforms in Brazil where current over supply is leading to discounted prices. Tier 1 shopping centres a particular long term target
• Repositioning/redeveloping suburban office product in the US and core assets in tertiary US markets
• Offices: In emerging growth markets: Manila, Jakarta, Kuala Lumpur
• Retail: Emerging markets: Hanoi, Bangkok, New Delhi and other top Indian cities
• Logistics: Gateway China cities: Shanghai, Beijing, Guangdong and India hubs
• China: Targeting over-leveraged or distressed developers, via investment in local platforms
• Offices: Spec development and repositioning in core west and Nordic cities plus let property in the EU east and potentially Moscow
• Retail: Repositioning eastern markets of the EU and active management/development in larger western cities and long term infrastructure gains in Istanbul
• Logistics: Development and units serving large CEE cities and peripheral western cities: eg Oporto, Barcelona and Milan
23STRATEGY & OUTLOOK
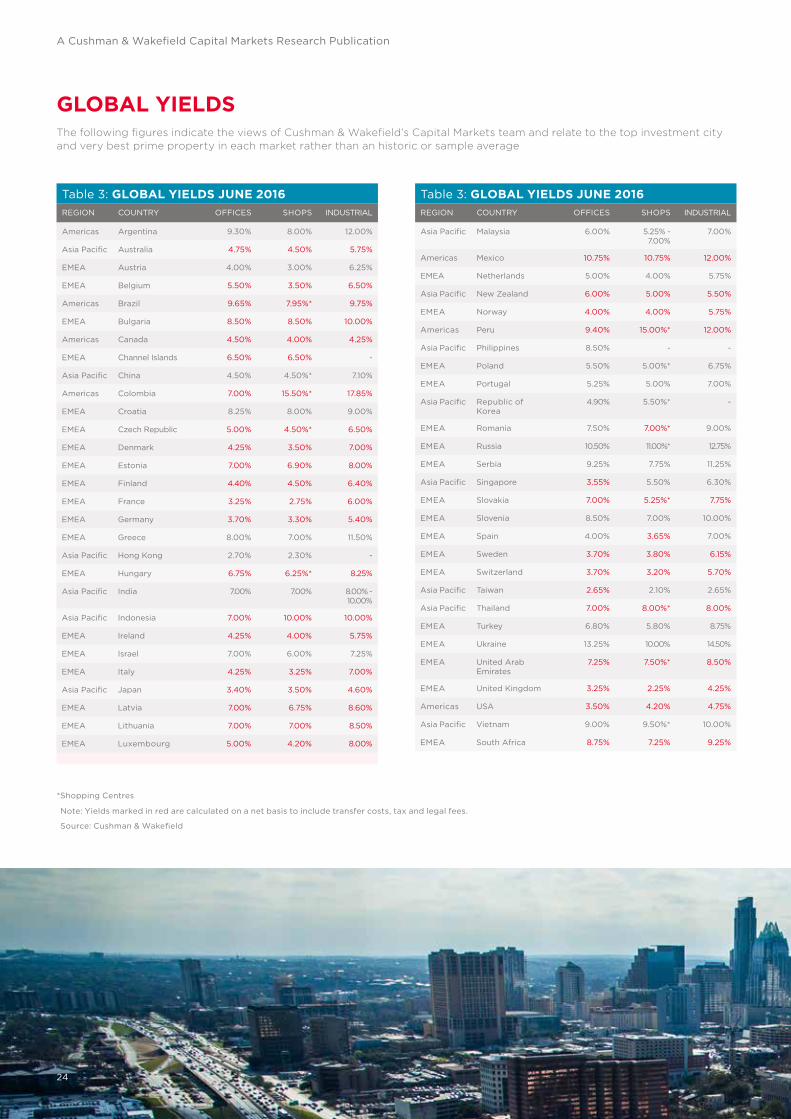
*Shopping Centres
Source: Cushman & Wakefield
Note: Yields marked in red are calculated on a net basis to include transfer costs, tax and legal fees.
GLOBAL YIELDSThe following figures indicate the views of Cushman & Wakefield’s Capital Markets team and relate to the top investment city and very best prime property in each market rather than an historic or sample average
Table 3: GLOBAL YIELDS JUNE 2016REGION COUNTRY OFFICES SHOPS INDUSTRIAL
Americas Argentina 9.30% 8.00% 12.00%
Asia Pacific Australia 4.75% 4.50% 5.75%
EMEA Austria 4.00% 3.00% 6.25%
EMEA Belgium 5.50% 3.50% 6.50%
Americas Brazil 9.65% 7.95%* 9.75%
EMEA Bulgaria 8.50% 8.50% 10.00%
Americas Canada 4.50% 4.00% 4.25%
EMEA Channel Islands 6.50% 6.50% -
Asia Pacific China 4.50% 4.50%* 7.10%
Americas Colombia 7.00% 15.50%* 17.85%
EMEA Croatia 8.25% 8.00% 9.00%
EMEA Czech Republic 5.00% 4.50%* 6.50%
EMEA Denmark 4.25% 3.50% 7.00%
EMEA Estonia 7.00% 6.90% 8.00%
EMEA Finland 4.40% 4.50% 6.40%
EMEA France 3.25% 2.75% 6.00%
EMEA Germany 3.70% 3.30% 5.40%
EMEA Greece 8.00% 7.00% 11.50%
Asia Pacific Hong Kong 2.70% 2.30% -
EMEA Hungary 6.75% 6.25%* 8.25%
Asia Pacific India 7.00% 7.00% 8.00% - 10.00%
Asia Pacific Indonesia 7.00% 10.00% 10.00%
EMEA Ireland 4.25% 4.00% 5.75%
EMEA Israel 7.00% 6.00% 7.25%
EMEA Italy 4.25% 3.25% 7.00%
Asia Pacific Japan 3.40% 3.50% 4.60%
EMEA Latvia 7.00% 6.75% 8.60%
EMEA Lithuania 7.00% 7.00% 8.50%
EMEA Luxembourg 5.00% 4.20% 8.00%
Table 3: GLOBAL YIELDS JUNE 2016REGION COUNTRY OFFICES SHOPS INDUSTRIAL
Asia Pacific Malaysia 6.00% 5.25% - 7.00%
7.00%
Americas Mexico 10.75% 10.75% 12.00%
EMEA Netherlands 5.00% 4.00% 5.75%
Asia Pacific New Zealand 6.00% 5.00% 5.50%
EMEA Norway 4.00% 4.00% 5.75%
Americas Peru 9.40% 15.00%* 12.00%
Asia Pacific Philippines 8.50% - -
EMEA Poland 5.50% 5.00%* 6.75%
EMEA Portugal 5.25% 5.00% 7.00%
Asia Pacific Republic of Korea
4.90% 5.50%* -
EMEA Romania 7.50% 7.00%* 9.00%
EMEA Russia 10.50% 11.00%* 12.75%
EMEA Serbia 9.25% 7.75% 11.25%
Asia Pacific Singapore 3.55% 5.50% 6.30%
EMEA Slovakia 7.00% 5.25%* 7.75%
EMEA Slovenia 8.50% 7.00% 10.00%
EMEA Spain 4.00% 3.65% 7.00%
EMEA Sweden 3.70% 3.80% 6.15%
EMEA Switzerland 3.70% 3.20% 5.70%
Asia Pacific Taiwan 2.65% 2.10% 2.65%
Asia Pacific Thailand 7.00% 8.00%* 8.00%
EMEA Turkey 6.80% 5.80% 8.75%
EMEA Ukraine 13.25% 10.00% 14.50%
EMEA United Arab Emirates
7.25% 7.50%* 8.50%
EMEA United Kingdom 3.25% 2.25% 4.25%
Americas USA 3.50% 4.20% 4.75%
Asia Pacific Vietnam 9.00% 9.50%* 10.00%
EMEA South Africa 8.75% 7.25% 9.25%
A Cushman & Wakefield Capital Markets Research Publication
24
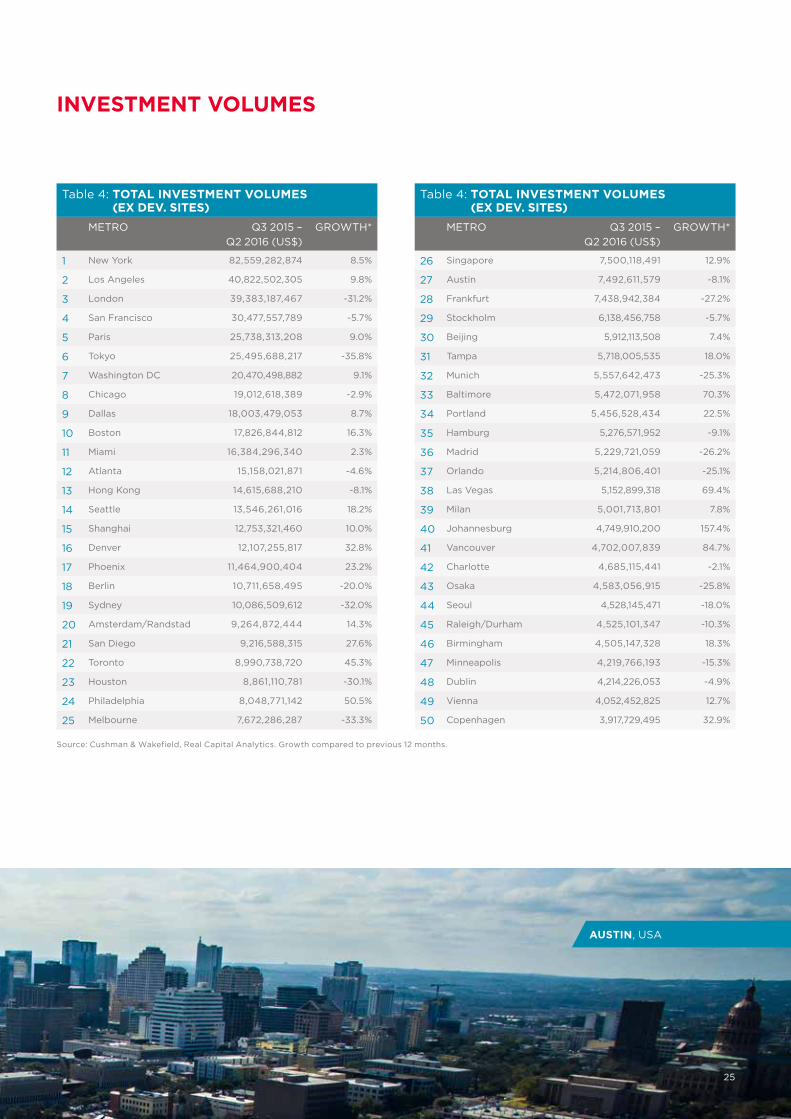
Source: Cushman & Wakefield, Real Capital Analytics. Growth compared to previous 12 months.
AUSTIN, USA
INVESTMENT VOLUMES
Table 4: TOTAL INVESTMENT VOLUMES (EX DEV. SITES)
METRO Q3 2015 – Q2 2016 (US$)
GROWTH*
1 New York 82,559,282,874 8.5%
2 Los Angeles 40,822,502,305 9.8%
3 London 39,383,187,467 -31.2%
4 San Francisco 30,477,557,789 -5.7%
5 Paris 25,738,313,208 9.0%
6 Tokyo 25,495,688,217 -35.8%
7 Washington DC 20,470,498,882 9.1%
8 Chicago 19,012,618,389 -2.9%
9 Dallas 18,003,479,053 8.7%
10 Boston 17,826,844,812 16.3%
11 Miami 16,384,296,340 2.3%
12 Atlanta 15,158,021,871 -4.6%
13 Hong Kong 14,615,688,210 -8.1%
14 Seattle 13,546,261,016 18.2%
15 Shanghai 12,753,321,460 10.0%
16 Denver 12,107,255,817 32.8%
17 Phoenix 11,464,900,404 23.2%
18 Berlin 10,711,658,495 -20.0%
19 Sydney 10,086,509,612 -32.0%
20 Amsterdam/Randstad 9,264,872,444 14.3%
21 San Diego 9,216,588,315 27.6%
22 Toronto 8,990,738,720 45.3%
23 Houston 8,861,110,781 -30.1%
24 Philadelphia 8,048,771,142 50.5%
25 Melbourne 7,672,286,287 -33.3%
Table 4: TOTAL INVESTMENT VOLUMES (EX DEV. SITES)
METRO Q3 2015 – Q2 2016 (US$)
GROWTH*
26 Singapore 7,500,118,491 12.9%
27 Austin 7,492,611,579 -8.1%
28 Frankfurt 7,438,942,384 -27.2%
29 Stockholm 6,138,456,758 -5.7%
30 Beijing 5,912,113,508 7.4%
31 Tampa 5,718,005,535 18.0%
32 Munich 5,557,642,473 -25.3%
33 Baltimore 5,472,071,958 70.3%
34 Portland 5,456,528,434 22.5%
35 Hamburg 5,276,571,952 -9.1%
36 Madrid 5,229,721,059 -26.2%
37 Orlando 5,214,806,401 -25.1%
38 Las Vegas 5,152,899,318 69.4%
39 Milan 5,001,713,801 7.8%
40 Johannesburg 4,749,910,200 157.4%
41 Vancouver 4,702,007,839 84.7%
42 Charlotte 4,685,115,441 -2.1%
43 Osaka 4,583,056,915 -25.8%
44 Seoul 4,528,145,471 -18.0%
45 Raleigh/Durham 4,525,101,347 -10.3%
46 Birmingham 4,505,147,328 18.3%
47 Minneapolis 4,219,766,193 -15.3%
48 Dublin 4,214,226,053 -4.9%
49 Vienna 4,052,452,825 12.7%
50 Copenhagen 3,917,729,495 32.9%
25
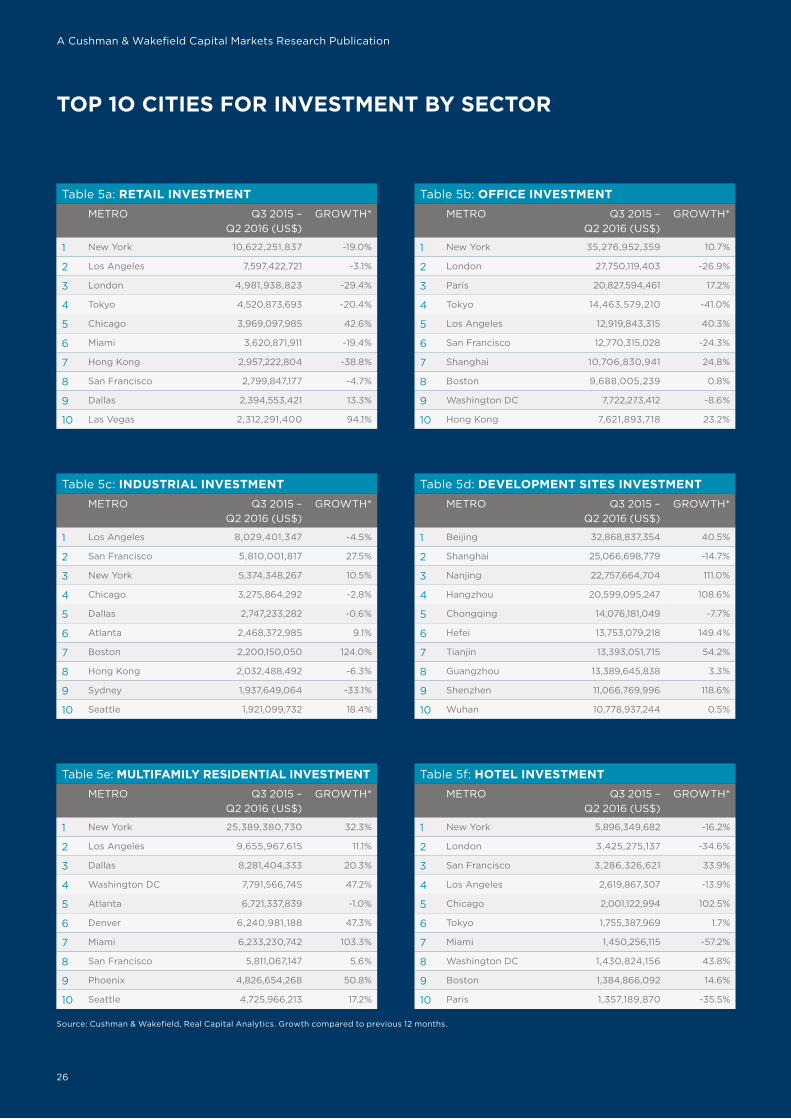
Table 5a: RETAIL INVESTMENTMETRO Q3 2015 –
Q2 2016 (US$)GROWTH*
1 New York 10,622,251,837 -19.0%
2 Los Angeles 7,597,422,721 -3.1%
3 London 4,981,938,823 -29.4%
4 Tokyo 4,520,873,693 -20.4%
5 Chicago 3,969,097,985 42.6%
6 Miami 3,620,871,911 -19.4%
7 Hong Kong 2,957,222,804 -38.8%
8 San Francisco 2,799,847,177 -4.7%
9 Dallas 2,394,553,421 13.3%
10 Las Vegas 2,312,291,400 94.1%
Table 5c: INDUSTRIAL INVESTMENTMETRO Q3 2015 –
Q2 2016 (US$)GROWTH*
1 Los Angeles 8,029,401,347 -4.5%
2 San Francisco 5,810,001,817 27.5%
3 New York 5,374,348,267 10.5%
4 Chicago 3,275,864,292 -2.8%
5 Dallas 2,747,233,282 -0.6%
6 Atlanta 2,468,372,985 9.1%
7 Boston 2,200,150,050 124.0%
8 Hong Kong 2,032,488,492 -6.3%
9 Sydney 1,937,649,064 -33.1%
10 Seattle 1,921,099,732 18.4%
Table 5e: MULTIFAMILY RESIDENTIAL INVESTMENTMETRO Q3 2015 –
Q2 2016 (US$)GROWTH*
1 New York 25,389,380,730 32.3%
2 Los Angeles 9,655,967,615 11.1%
3 Dallas 8,281,404,333 20.3%
4 Washington DC 7,791,566,745 47.2%
5 Atlanta 6,721,337,839 -1.0%
6 Denver 6,240,981,188 47.3%
7 Miami 6,233,230,742 103.3%
8 San Francisco 5,811,067,147 5.6%
9 Phoenix 4,826,654,268 50.8%
10 Seattle 4,725,966,213 17.2%
Table 5b: OFFICE INVESTMENTMETRO Q3 2015 –
Q2 2016 (US$)GROWTH*
1 New York 35,276,952,359 10.7%
2 London 27,750,119,403 -26.9%
3 Paris 20,827,594,461 17.2%
4 Tokyo 14,463,579,210 -41.0%
5 Los Angeles 12,919,843,315 40.3%
6 San Francisco 12,770,315,028 -24.3%
7 Shanghai 10,706,830,941 24.8%
8 Boston 9,688,005,239 0.8%
9 Washington DC 7,722,273,412 -8.6%
10 Hong Kong 7,621,893,718 23.2%
Table 5d: DEVELOPMENT SITES INVESTMENTMETRO Q3 2015 –
Q2 2016 (US$)GROWTH*
1 Beijing 32,868,837,354 40.5%
2 Shanghai 25,066,698,779 -14.7%
3 Nanjing 22,757,664,704 111.0%
4 Hangzhou 20,599,095,247 108.6%
5 Chongqing 14,076,181,049 -7.7%
6 Hefei 13,753,079,218 149.4%
7 Tianjin 13,393,051,715 54.2%
8 Guangzhou 13,389,645,838 3.3%
9 Shenzhen 11,066,769,996 118.6%
10 Wuhan 10,778,937,244 0.5%
Table 5f: HOTEL INVESTMENTMETRO Q3 2015 –
Q2 2016 (US$)GROWTH*
1 New York 5,896,349,682 -16.2%
2 London 3,425,275,137 -34.6%
3 San Francisco 3,286,326,621 33.9%
4 Los Angeles 2,619,867,307 -13.9%
5 Chicago 2,001,122,994 102.5%
6 Tokyo 1,755,387,969 1.7%
7 Miami 1,450,256,115 -57.2%
8 Washington DC 1,430,824,156 43.8%
9 Boston 1,384,866,092 14.6%
10 Paris 1,357,189,870 -35.5%
TOP 1O CITIES FOR INVESTMENT BY SECTOR
Source: Cushman & Wakefield, Real Capital Analytics. Growth compared to previous 12 months.
26
A Cushman & Wakefield Capital Markets Research Publication

TORONTO, CANADA
27TOP 1O CITIES FOR INVESTMENT BY SECTOR

ABOUT THE REPORTTHE REPORTThis report has been written by David Hutchings in our Capital Markets Investment Strategy team with support from Emily Tonkin, the global research group and Nigel Almond, author of “Brexit & Global Cities”. The report has been prepared using data collected through our own research as well as information available to us from public and other external sources. The transaction information used relates to non-confidential reported market deals, excluding indirect investment and future commitments. All investment volumes are quoted pertaining to deals of USD 5 million and above. Alongside Cushman & Wakefield information, data has been used from Real Capital Analytics (RCA). Where the data was sourced from RCA, it is as at 18 August 2016.
In respect of all external information, the sources are believed to be reliable and have been used in good faith. However, Cushman & Wakefield cannot accept responsibility for their accuracy and completeness, nor for any undisclosed matters that would affect the conclusions drawn. Certain assumptions and definitions used in this research work are given within the body of the text. Information on any other matters can be obtained from Cushman & Wakefield.
A number of the rankings contained within this Winning in Growth Cities 2016/2017 report are Cushman & Wakefield composite rankings, collated using a variety of in-house proprietary data, reliable secondary sources and a range of data indicators.
SOURCESINVESTMENT DATACushman & Wakefield, Real Capital Analytics
OTHER SOURCES AND MARKET POWER RANKINGSCushman & Wakefield, Oxford Economics Forecasts, Brookings, Economist Intelligence Unit (EIU), Mercer, Youthfulcities. Z/Yen Group, Rome2rio, Heritage Foundation.
For more information, please contact:
David Hutchings EMEA Investment Strategy [email protected] +44 20 7152 5029
Emily Tonkin EMEA Investment Strategy [email protected] +44 20 7152 5877
RESEARCH SERVICESCushman & Wakefield is known the world-over as an industry knowledge leader. Through the delivery of timely, accurate, high-quality research reports on the leading trends, markets around the world and business issues of the day, we aim to assist our clients in making property decisions that meet their objectives and enhance their competitive position.
For more information, please contact:
Elisabeth Troni Head of EMEA Research & Insight [email protected] +44 20 3296 2121
Joanna Tano Head of Operations EMEA Research [email protected] +44 20 7152 5944
Nigel Almond Capital Markets Research [email protected] +44 20 3296 2328
A Cushman & Wakefield Capital Markets Research Publication
28

CAPITAL MARKETS SERVICESCapital Markets provides comprehensive advice and execution services to clients engaged in buying, selling, investing in, financing or developing real estate and real estate-related assets across the globe. Our solutions are tailored to meet the objectives of private and institutional owners and investors, as well as corporate owners and occupiers.
Whether you are seeking to dispose of an asset in Hong Kong, finance the purchase of a hotel in New York, or structure a complex cross border portfolio deal in Europe, Cushman & Wakefield’s expertise in capital markets is the gold standard.
Located in major markets around the world, our professionals execute customised acquisition and disposal strategies across all major property types. Additionally, we provide our clients with unique access to opportunities and capital sources worldwide. As a global leader in investment transactions, we have an unsurpassed network of buyers and sellers, access to international capital and superior market data.
Our services include but are not limited to:• Investment Sales & Acquisitions
• Investment Advisory Services
• Investment Strategy and Market Analysis
• Investment Management
• Equity, Debt & Structured Finance
• Corporate Finance & Investment Banking
For more information, please contact:
GLOBAL
Carlo Barel di Sant’Albano Chief Executive Global Capital Markets & Investor Services [email protected] +44 20 7152 5846
INVESTMENT STRATEGY
EMEA David Hutchings EMEA Investment Strategy [email protected] +44 20 7152 5029
THE AMERICAS Janice Stanton Global Capital Advisory [email protected] +1 212 841 5025
ASIA PACIFIC Sigrid Zialcita Asia Pacific Research [email protected] +65 6232 0875
CAPITAL MARKETS
EMEA Jan-Willem Bastijn EMEA Capital Markets [email protected] +31 20 800 2081
THE AMERICAS Noble Carpenter Americas Capital Markets [email protected] +1 212-318-9745
ASIA PACIFIC James Quigley Asia Pacific Capital Markets [email protected] +61 2 8243 9999
CAPITAL MARKETS SERVICES 29

Copyright © 2016 Cushman & Wakefield. All rights reserved. The information contained within this report is gathered from multiple sources considered to be reliable. The information may contain errors or omissions and is presented without any warranty or representations as to its accuracy.
ABOUT CUSHMAN & WAKEFIELDCushman & Wakefield is a leading global real estate services firm that helps clients transform the way people work, shop, and live. The firm’s 43,000 employees in more than 60 countries provide deep local and global insights that create significant value for occupiers and investors around the world. Cushman & Wakefield is among the largest commercial real estate services firms with revenue of $5 billion across core services of agency leasing, asset services, capital markets, facility services (C&W Services), global occupier services, investment & asset management (DTZ Investors), project & development services, tenant representation, and valuation & advisory.
To learn more, visit cushmanwakefield.com
Follow us on social channels:
Twitter: @Cushwake LinkedIn: linkedin.com/company/cushman-&-wakefieldFacebook: facebook.com/cushmanwakefield
Or download My C&W Research App: cushwk.co/myresearch
30
A Cushman & Wakefield Capital Markets Research Publication

SAO PAULO, BRAZIL
31ABOUT CUSHMAN & WAKEFIELD