why latin america - scg legalscglegal.com/meetings/sao paulo/3 - why latin america 2013.pdfcivets:...
TRANSCRIPT
WHY LATIN AMERICA
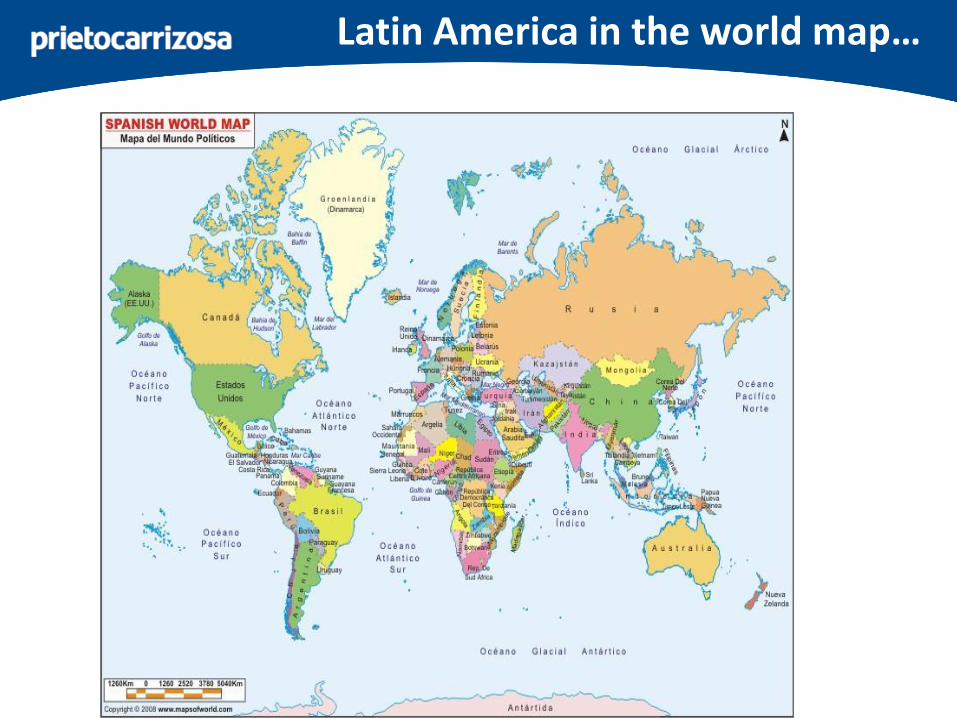
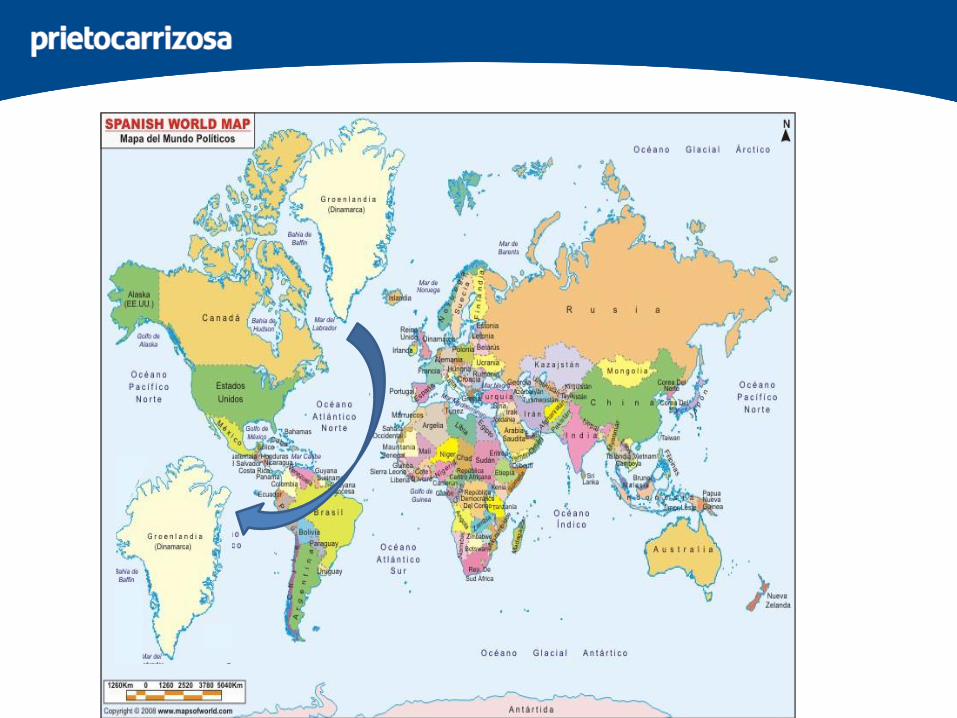
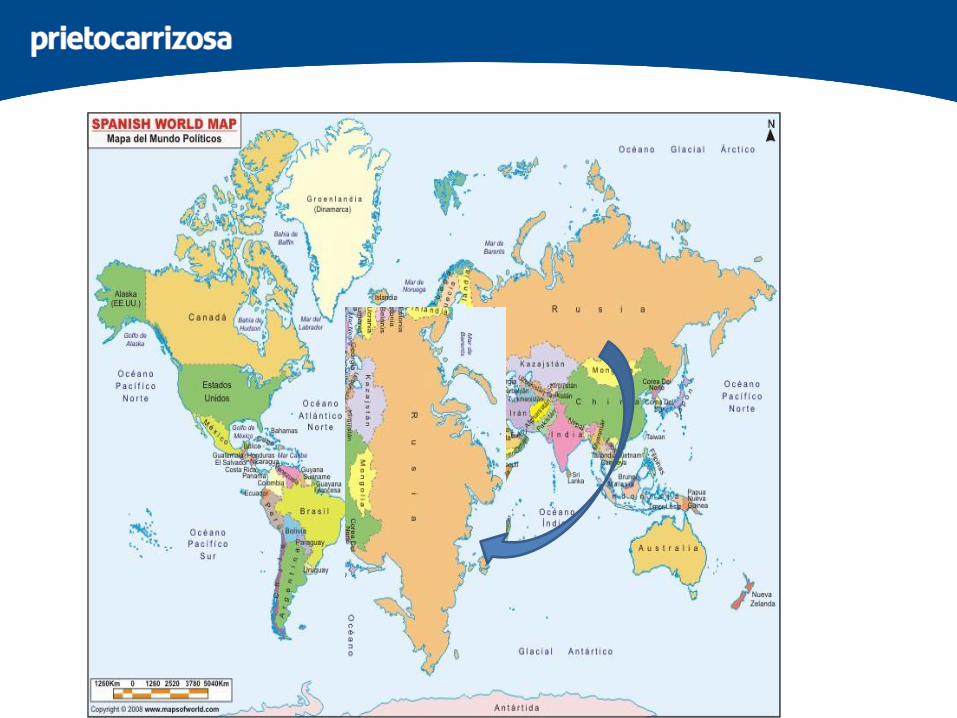
Latin America in the world map…
|
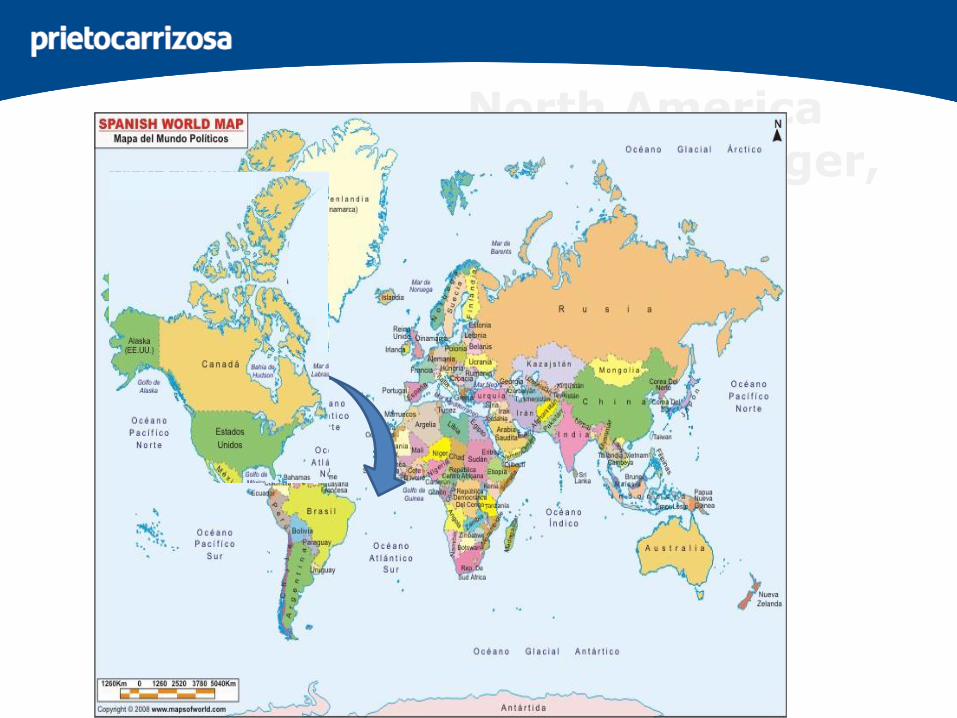
… North America seems to be larger,
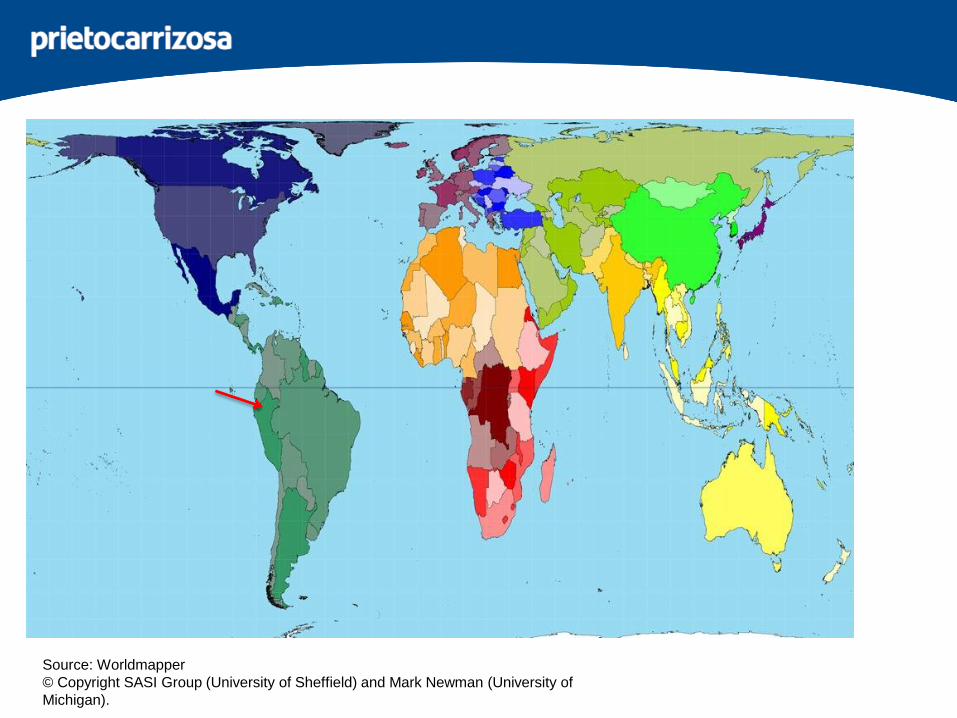
Source: Worldmapper
© Copyright SASI Group (University of Sheffield) and Mark Newman (University of
Michigan).
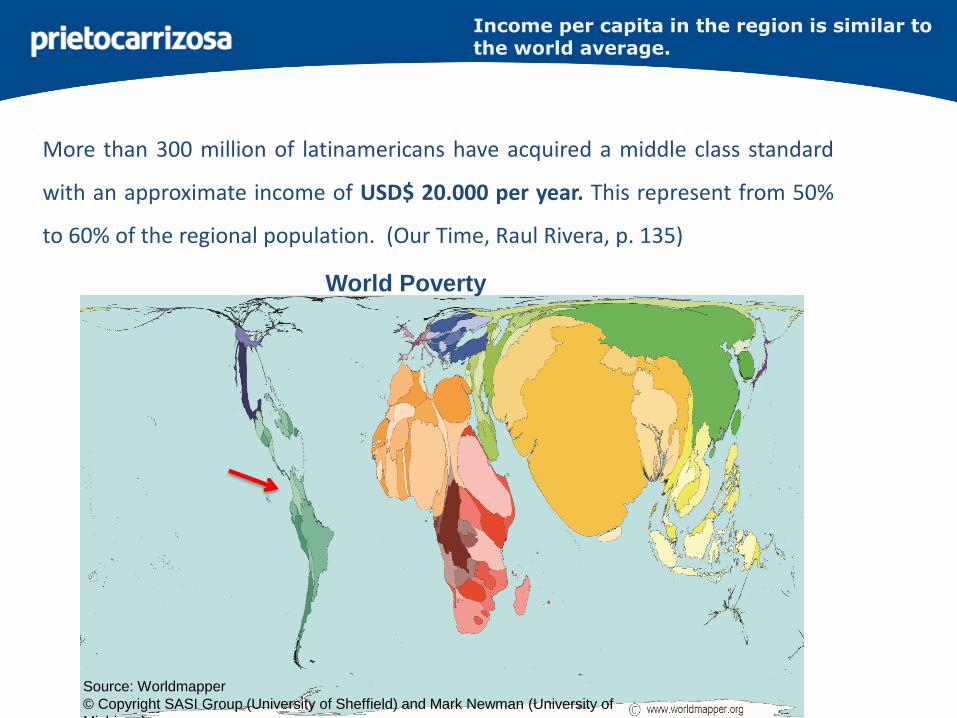
Income per capita in the region is similar to the world average.
More than 300 million of latinamericans have acquired a middle class standard
with an approximate income of USD$ 20.000 per year. This represent from 50%
to 60% of the regional population. (Our Time, Raul Rivera, p. 135)
World Poverty
Source: Worldmapper
© Copyright SASI Group (University of Sheffield) and Mark Newman (University of
Michigan).
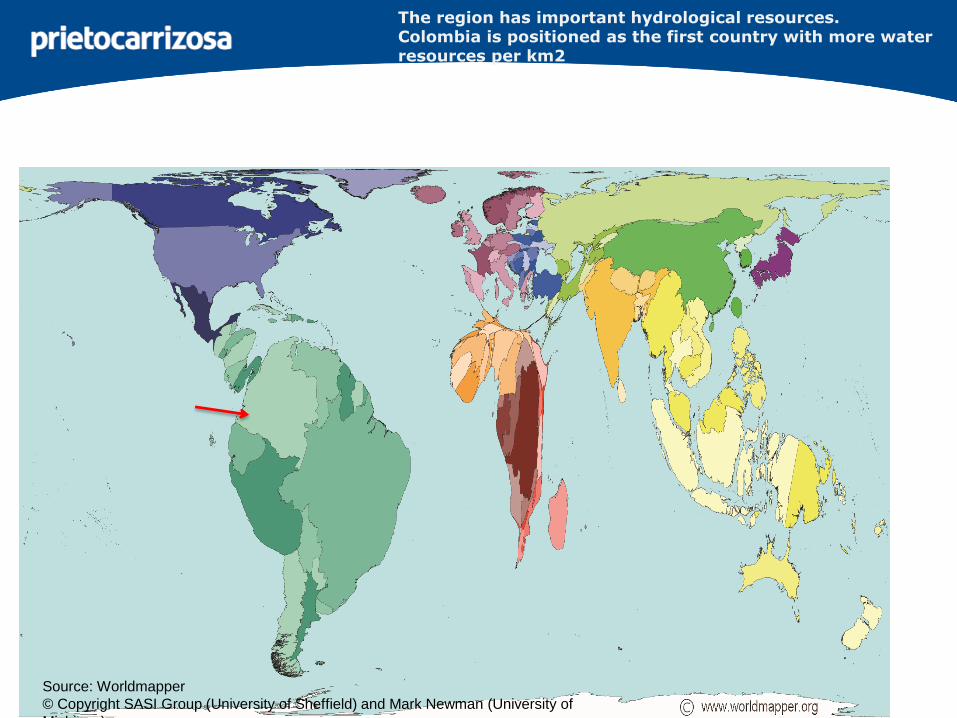
The region has important hydrological resources. Colombia is positioned as the first country with more water resources per km2
Source: Worldmapper
© Copyright SASI Group (University of Sheffield) and Mark Newman (University of
Michigan).
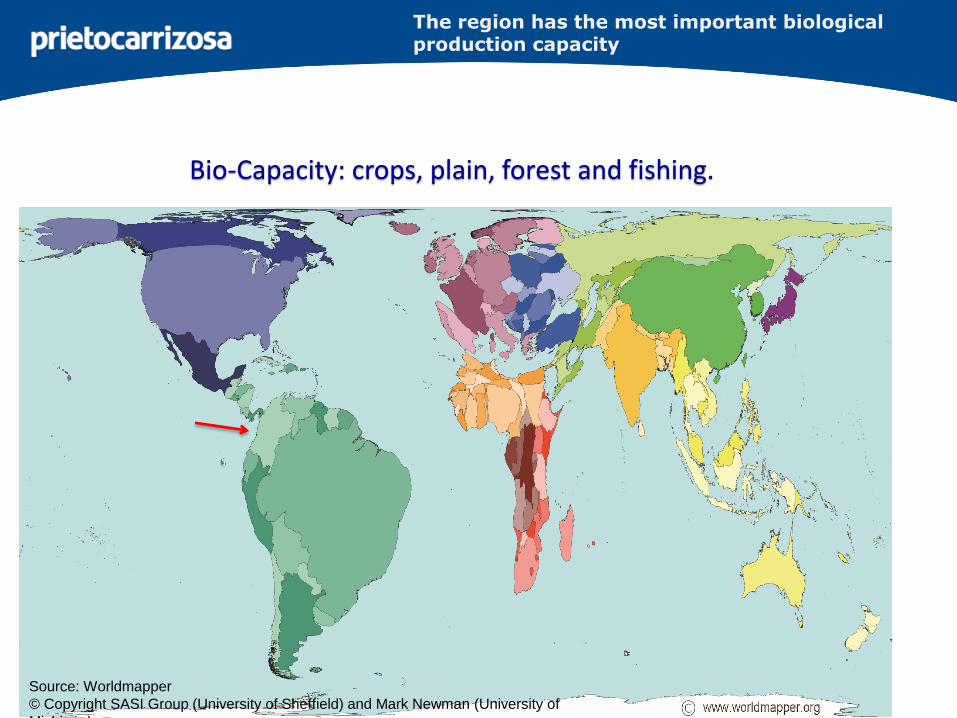
The region has the most important biological production capacity
Bio-Capacity: crops, plain, forest and fishing.
Source: Worldmapper
© Copyright SASI Group (University of Sheffield) and Mark Newman (University of
Michigan).
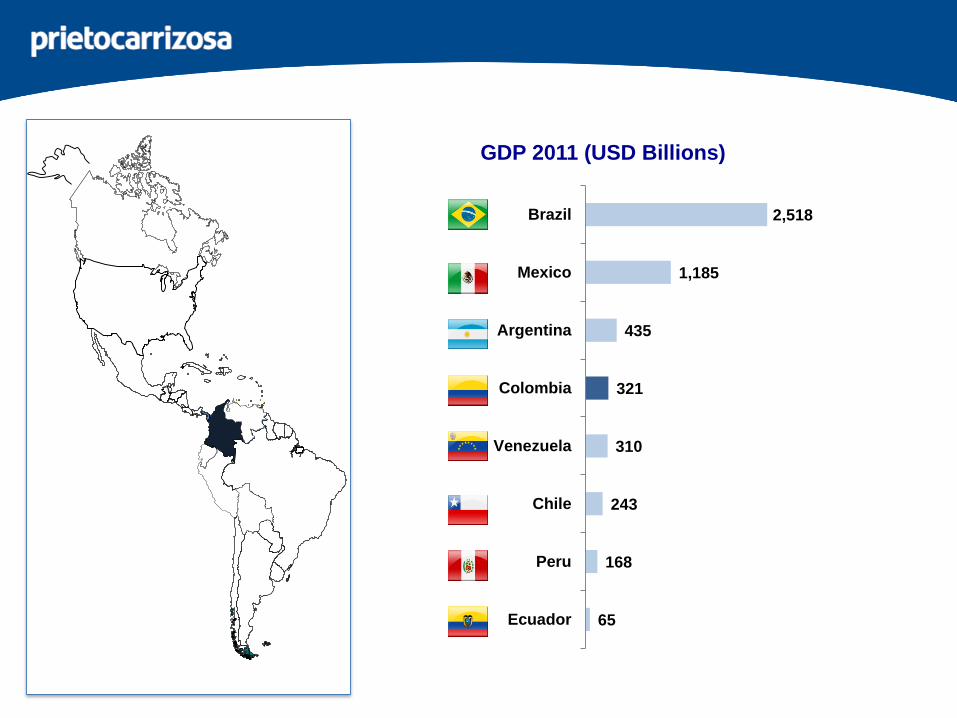
2,518
1,185
435
321
310
243
168
65
Brazil
Mexico
Argentina
Colombia
Venezuela
Chile
Peru
Ecuador
GDP 2011 (USD Billions)
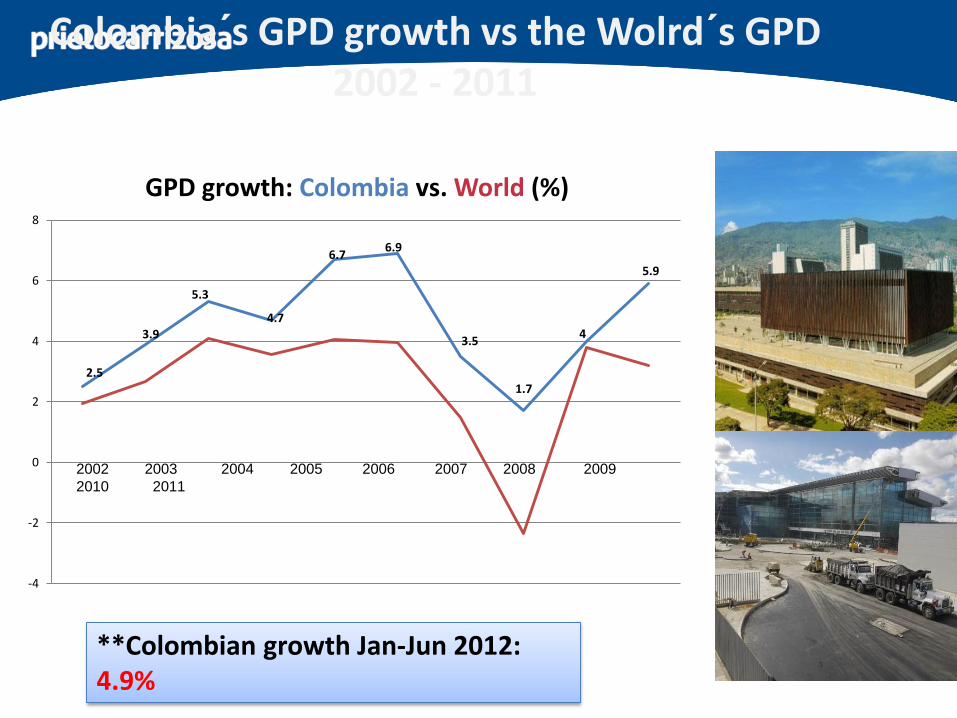
Colombia´s GPD growth vs the Wolrd´s GPD 2002 - 2011
2.5
3.9
5.3
4.7
6.76.9
3.5
1.7
4
5.9
-4
-2
0
2
4
6
8
GPD growth: Colombia vs. World (%)
2002 2003 2004 2005 2006 2007 2008 2009
2010 2011
**Colombian growth Jan-Jun 2012: 4.9%
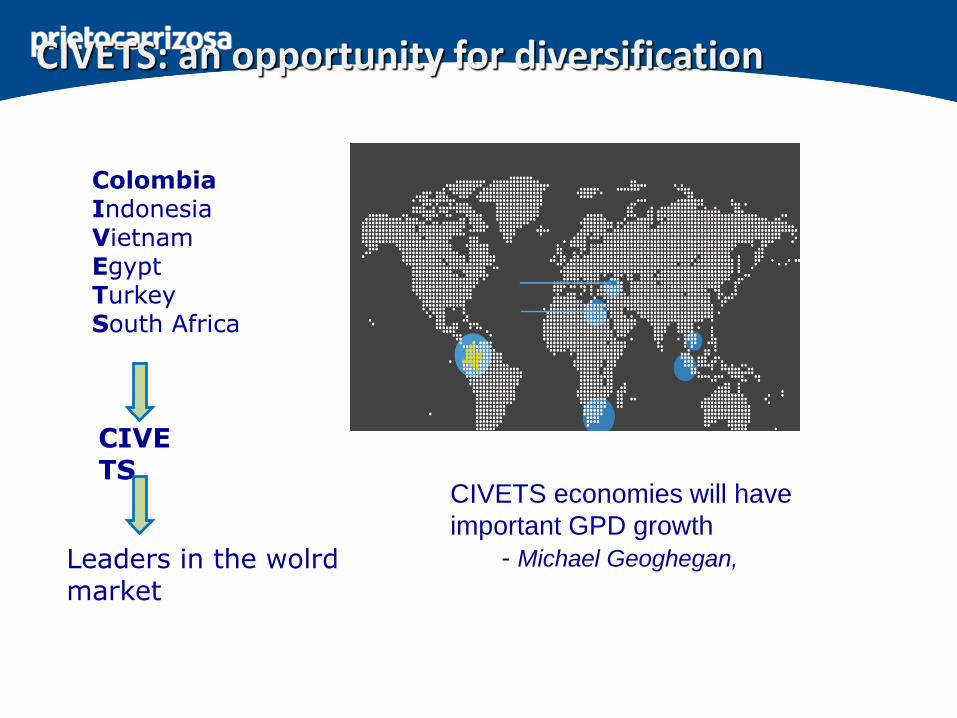
CIVETS: an opportunity for diversification
ColombiaIndonesia VietnamEgyptTurkeySouth Africa
CIVETS
Leaders in the wolrd market
CIVETS economies will have
important GPD growth
- Michael Geoghegan,
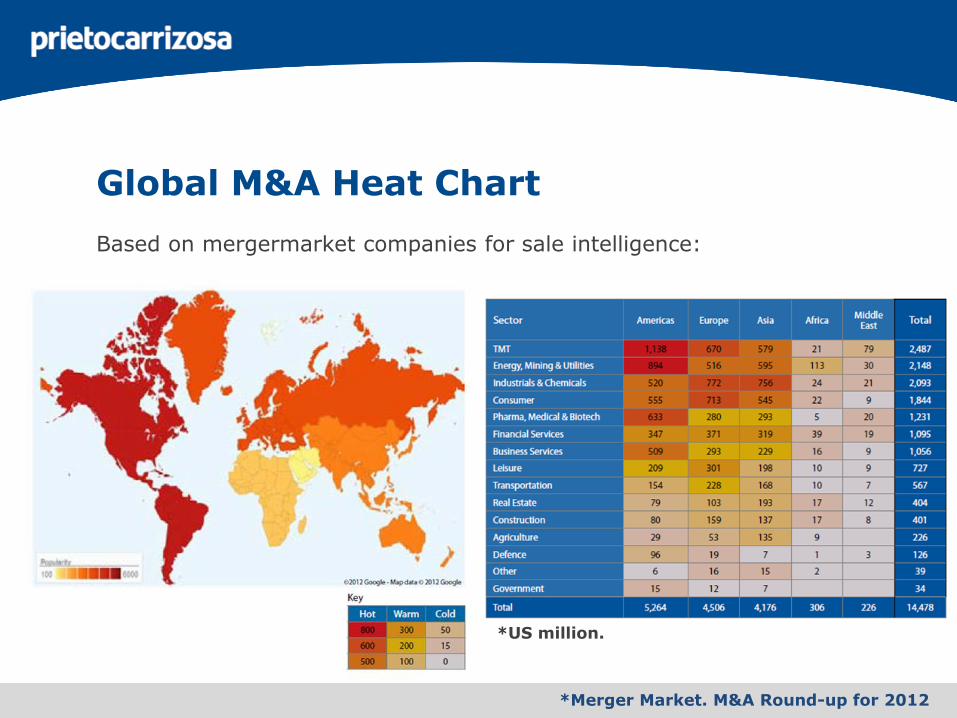
Global M&A Heat Chart
*US million.
Based on mergermarket companies for sale intelligence:
*Merger Market. M&A Round-up for 2012
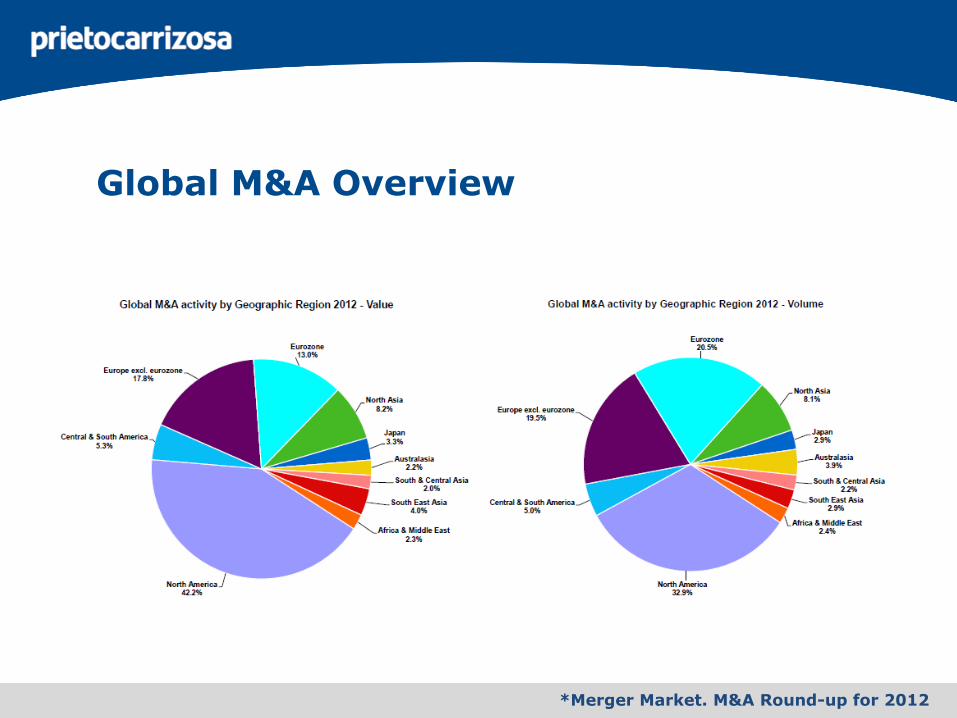
Global M&A Overview
*Merger Market. M&A Round-up for 2012

Global M&A Overview
*Merger Market. M&A Round-up for 2012
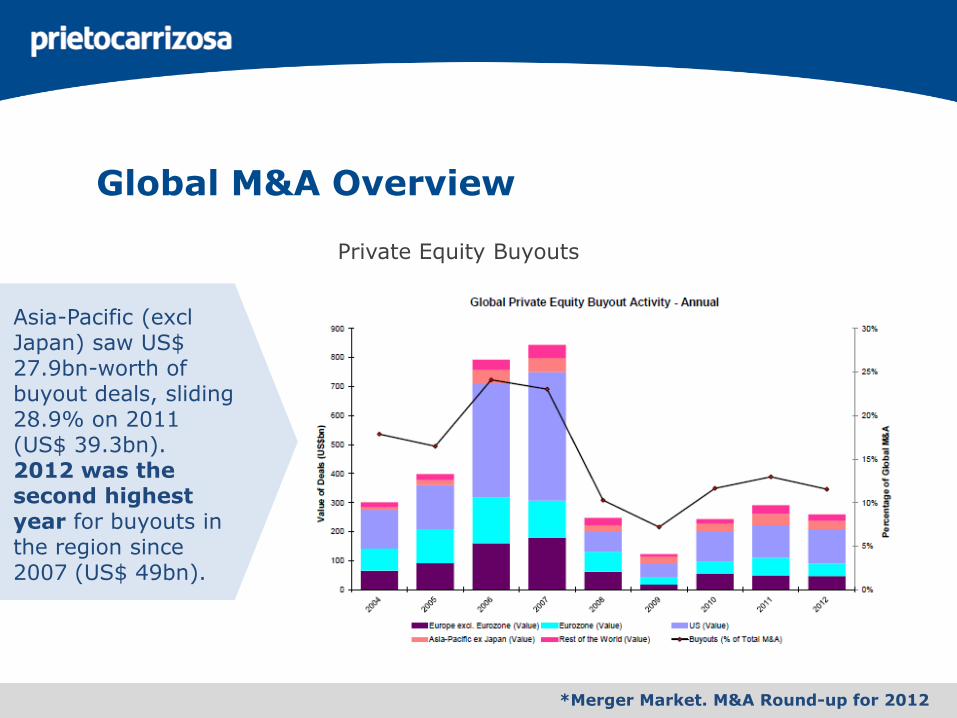
Global M&A Overview
*Merger Market. M&A Round-up for 2012
Private Equity Buyouts
Asia-Pacific (excl Japan) saw US$ 27.9bn-worth of buyout deals, sliding 28.9% on 2011 (US$ 39.3bn). 2012 was the second highest year for buyouts in the region since 2007 (US$ 49bn).
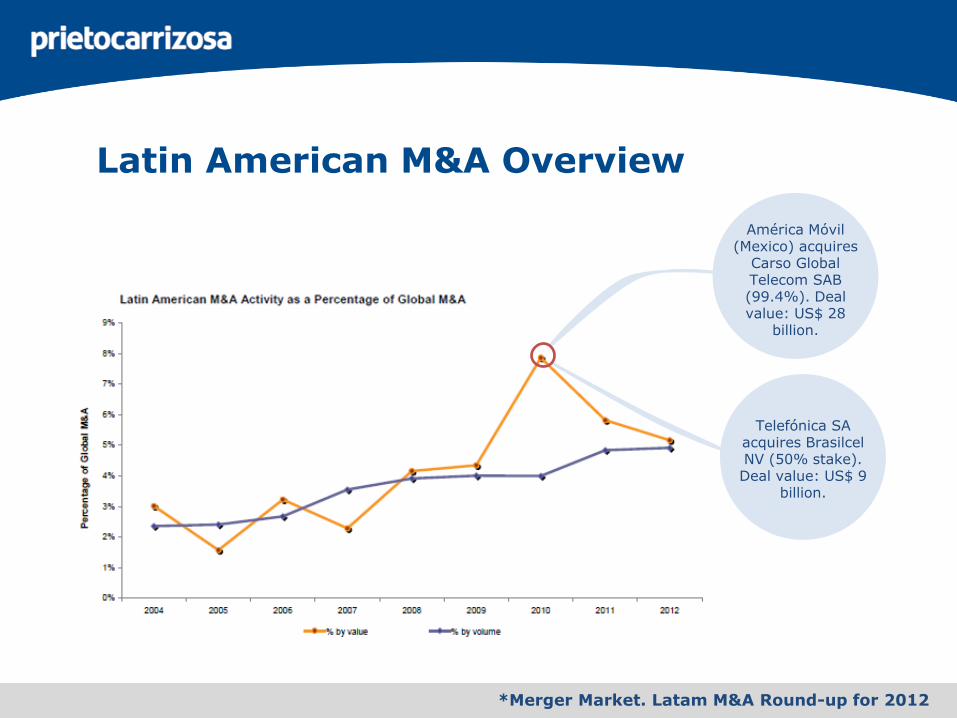
Latin American M&A Overview
*Merger Market. Latam M&A Round-up for 2012
Telefónica SA acquires BrasilcelNV (50% stake). Deal value: US$ 9
billion.
América Móvil(Mexico) acquires
Carso Global Telecom SAB (99.4%). Deal value: US$ 28
billion.
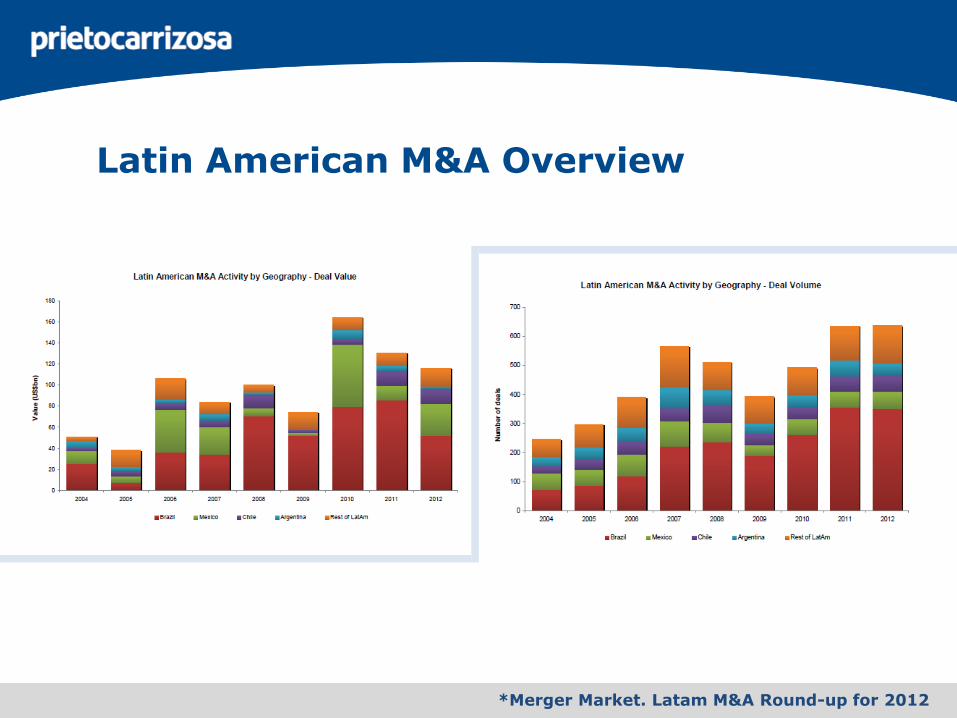
Latin American M&A Overview
*Merger Market. Latam M&A Round-up for 2012
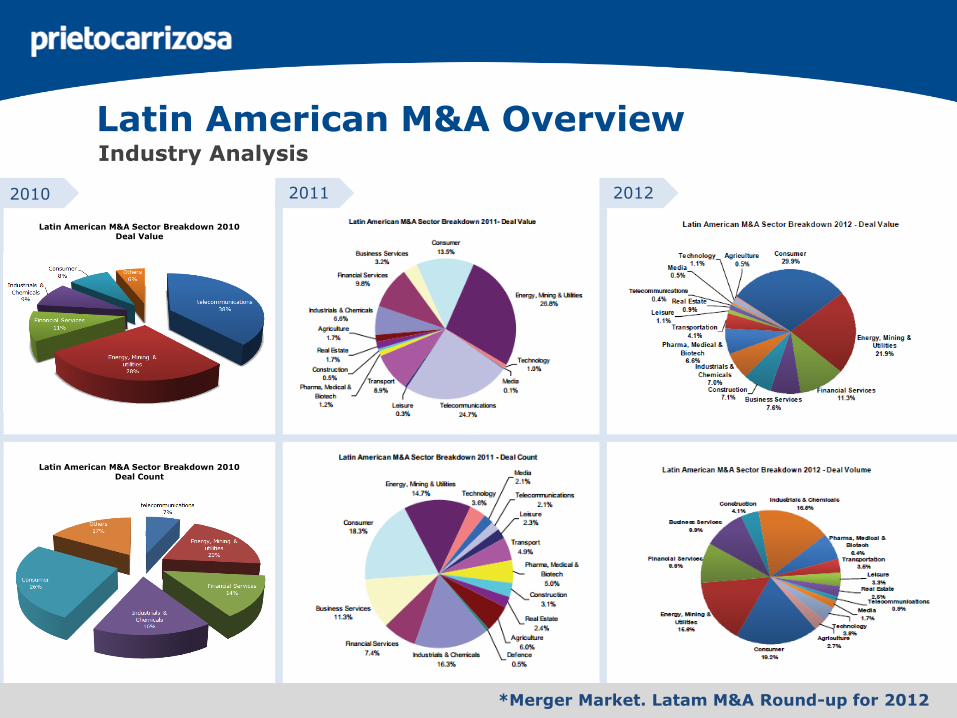
Latin American M&A Overview
*Merger Market. Latam M&A Round-up for 2012
Industry Analysis
2010 2011 2012
Latin American M&A Sector Breakdown 2010 Deal Value
Latin American M&A Sector Breakdown 2010 Deal Count
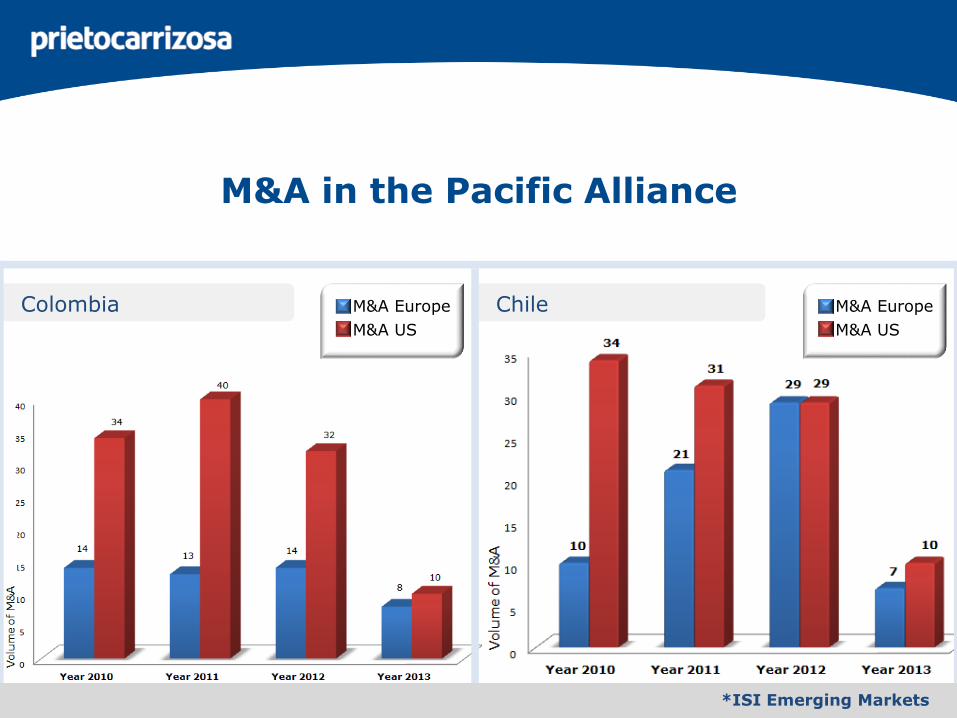
M&A in the Pacific Alliance
M&A Europe
M&A US
ChileColombia M&A Europe
M&A US
*ISI Emerging Markets

M&A in the Pacific Alliance
PeruMexicoM&A US
M&A Europe
M&A US
M&A Europe
*ISI Emerging Markets
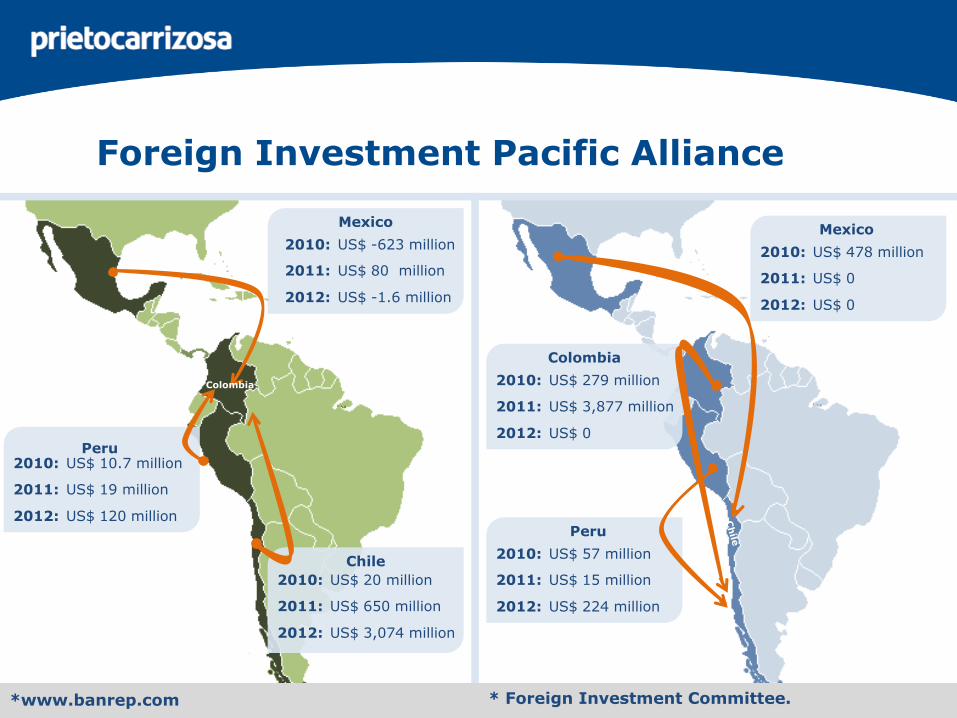
Foreign Investment Pacific Alliance
*www.banrep.com
Mexico
Peru
Mexico
Colombia
Peru
2010:
2011:
2012:
US$ -623 million
US$ 80 million
US$ -1.6 million
Chile
2010:
2011:
2012:
US$ 20 million
US$ 650 million
US$ 3,074 million
2010:
2011:
2012:
US$ 10.7 million
US$ 19 million
US$ 120 million
2010:
2011:
2012:
US$ 57 million
US$ 15 million
US$ 224 million
2010:
2011:
2012:
US$ 279 million
US$ 3,877 million
US$ 0
2010:
2011:
2012:
US$ 478 million
US$ 0
US$ 0
* Foreign Investment Committee.
Colombia
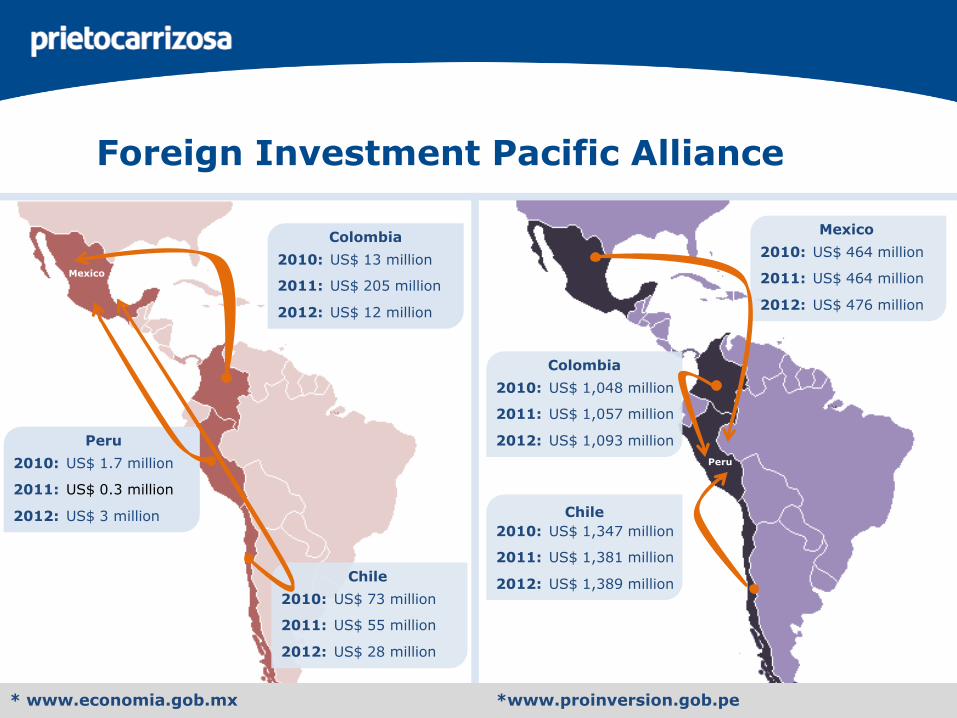
*www.proinversion.gob.pe
Chile
Colombia
Peru
Mexico
2010:
2011:
2012:
US$ 13 million
US$ 205 million
US$ 12 million
2010:
2011:
2012:
US$ 1.7 million
US$ 0.3 million
US$ 3 million
Chile
2010:
2011:
2012:
US$ 73 million
US$ 55 million
US$ 28 million
* www.economia.gob.mx
Mexico
2010:
2011:
2012:
US$ 464 million
US$ 464 million
US$ 476 million
Colombia
2010:
2011:
2012:
US$ 1,048 million
US$ 1,057 million
US$ 1,093 million
2010:
2011:
2012:
US$ 1,347 million
US$ 1,381 million
US$ 1,389 million
Foreign Investment Pacific Alliance
Peru
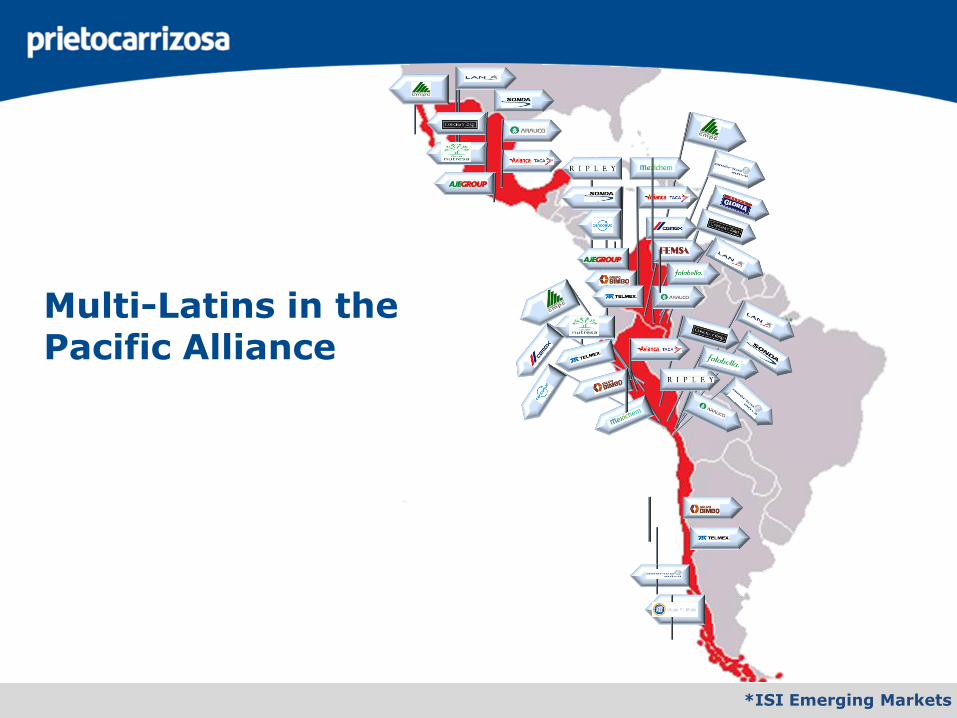
Multi-Latins in the Pacific Alliance
*ISI Emerging Markets
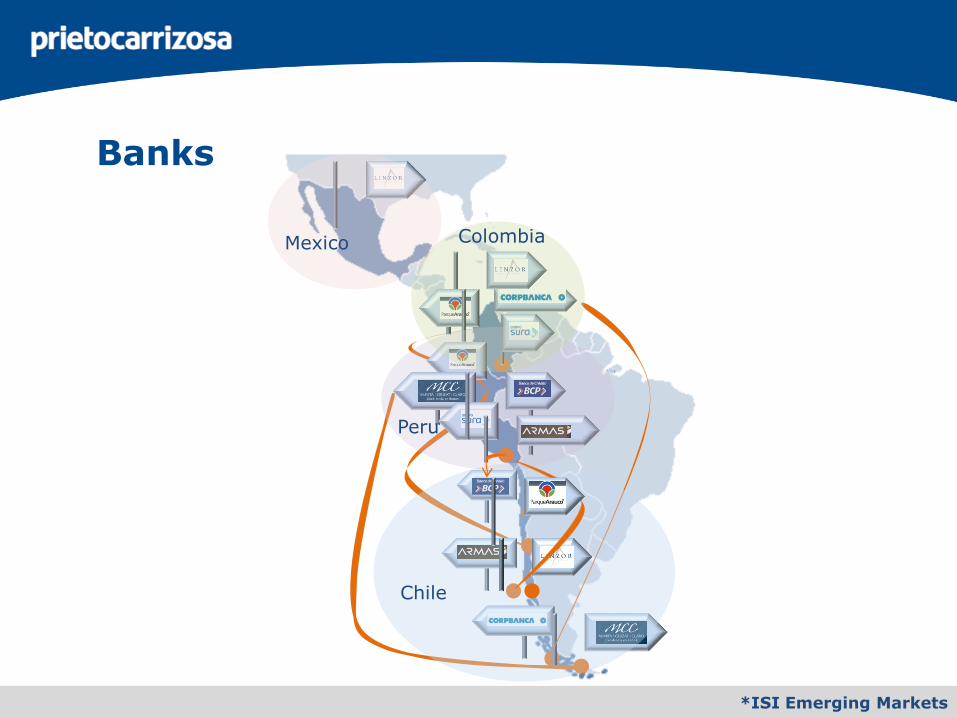
Banks
*ISI Emerging Markets
Chile
Mexico Colombia
Peru
00
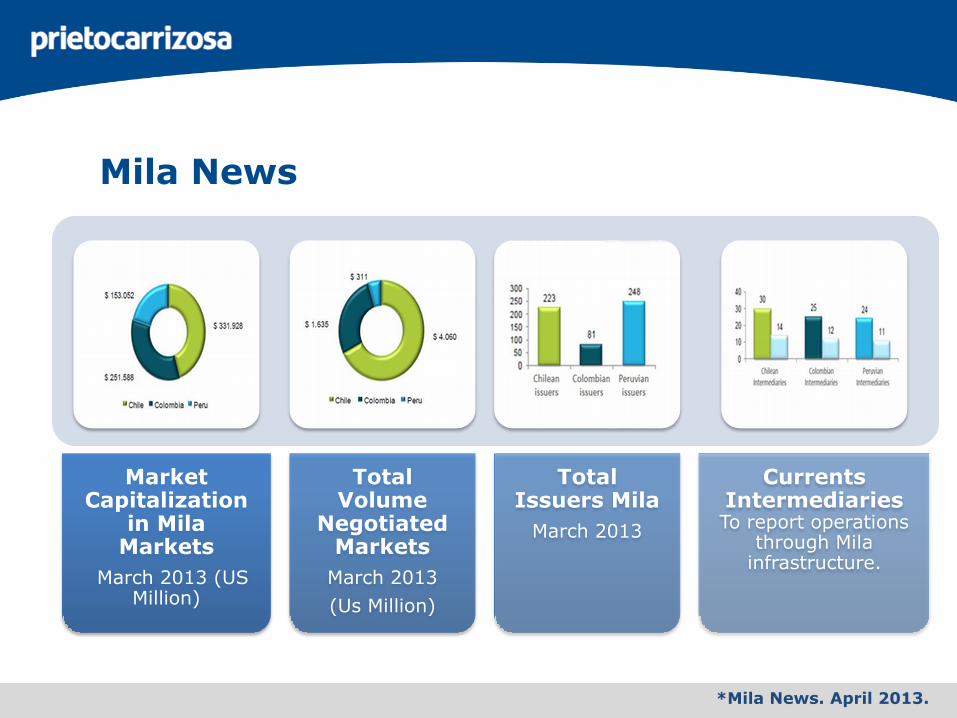
Market Capitalization
in Mila Markets
March 2013 (US Million)
Total Volume
Negotiated Markets
March 2013
(Us Million)
Total Issuers Mila
March 2013
Currents Intermediaries To report operations
through Mila infrastructure.
*Mila News. April 2013.
Mila News
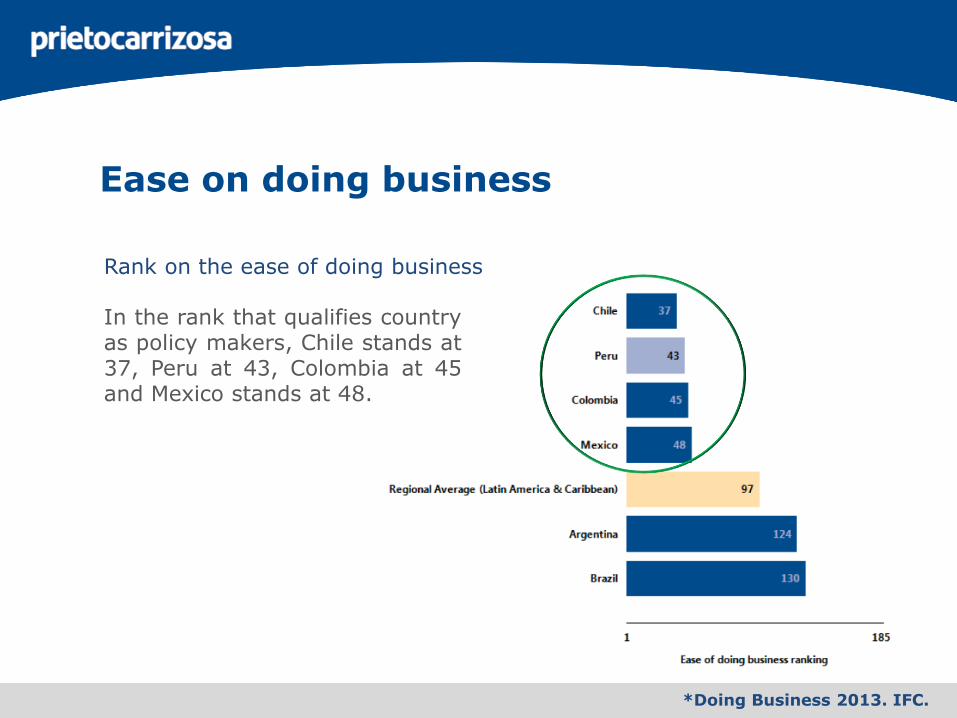
Ease on doing business
*Doing Business 2013. IFC.
Rank on the ease of doing business
In the rank that qualifies countryas policy makers, Chile stands at37, Peru at 43, Colombia at 45and Mexico stands at 48.
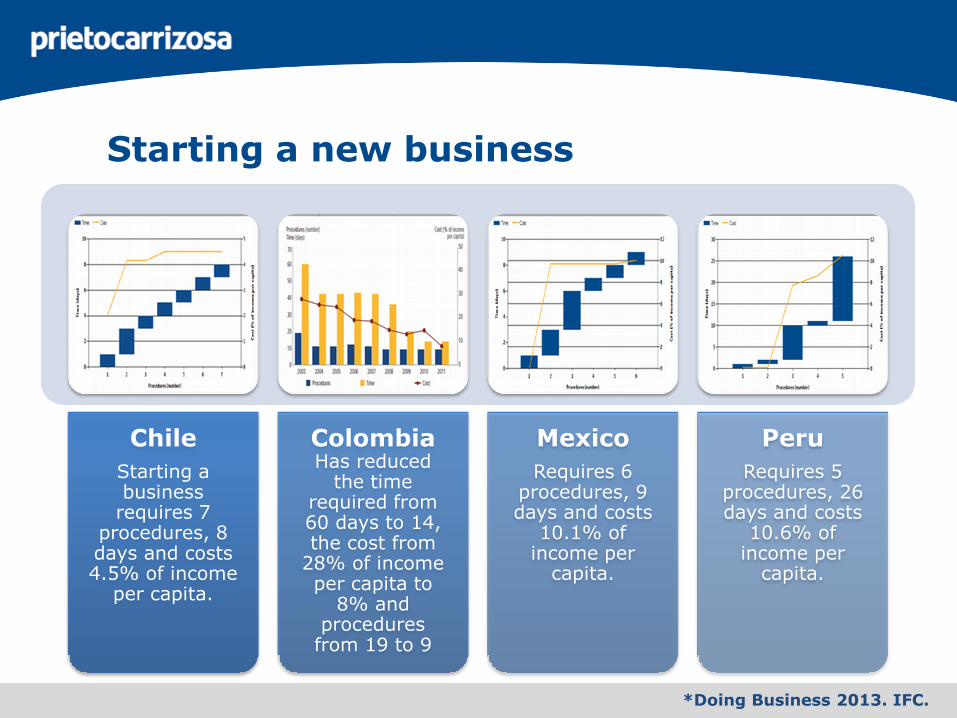
Starting a new business
Chile
Starting a business
requires 7 procedures, 8 days and costs 4.5% of income
per capita.
ColombiaHas reduced
the time required from 60 days to 14, the cost from
28% of income per capita to
8% and procedures
from 19 to 9
Mexico
Requires 6 procedures, 9 days and costs
10.1% of income per
capita.
Peru
Requires 5 procedures, 26 days and costs
10.6% of income per
capita.
*Doing Business 2013. IFC.
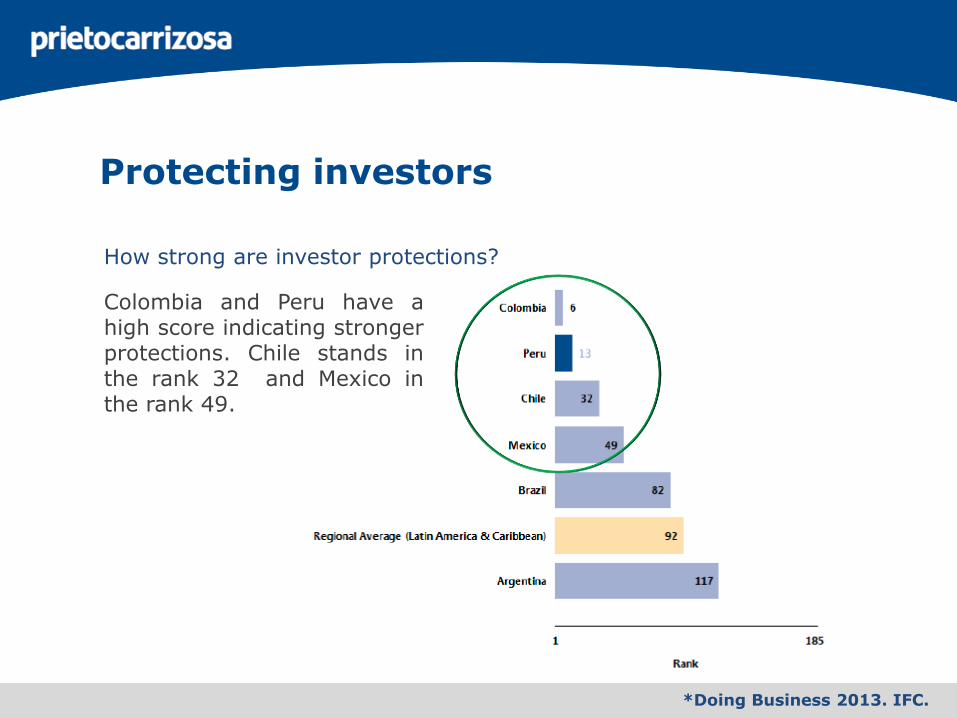
Protecting investors
*Doing Business 2013. IFC.
How strong are investor protections?
Colombia and Peru have ahigh score indicating strongerprotections. Chile stands inthe rank 32 and Mexico inthe rank 49.

*Doing Business 2013. IFC. Page 3.
Business-friendly regulation
Chile, Peru, Colombia andMexico are in the top 5ranking of Latin Americancountries on the ease ofdoing business thatmeasures the economieswith the most business-friendly regulation.
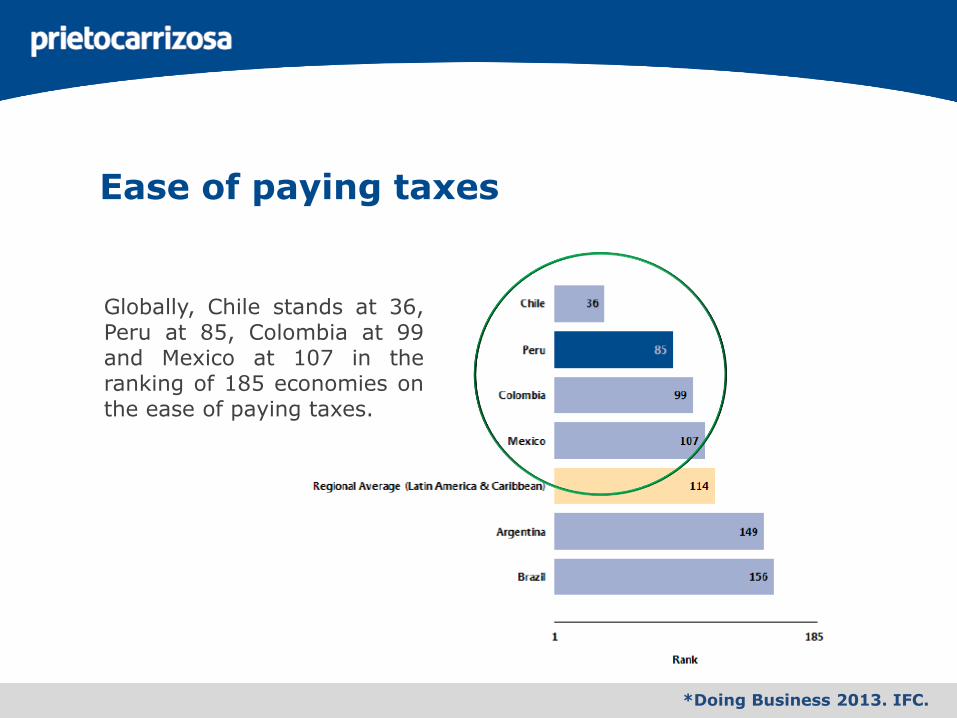
Ease of paying taxes
*Doing Business 2013. IFC.
Globally, Chile stands at 36,Peru at 85, Colombia at 99and Mexico at 107 in theranking of 185 economies onthe ease of paying taxes.
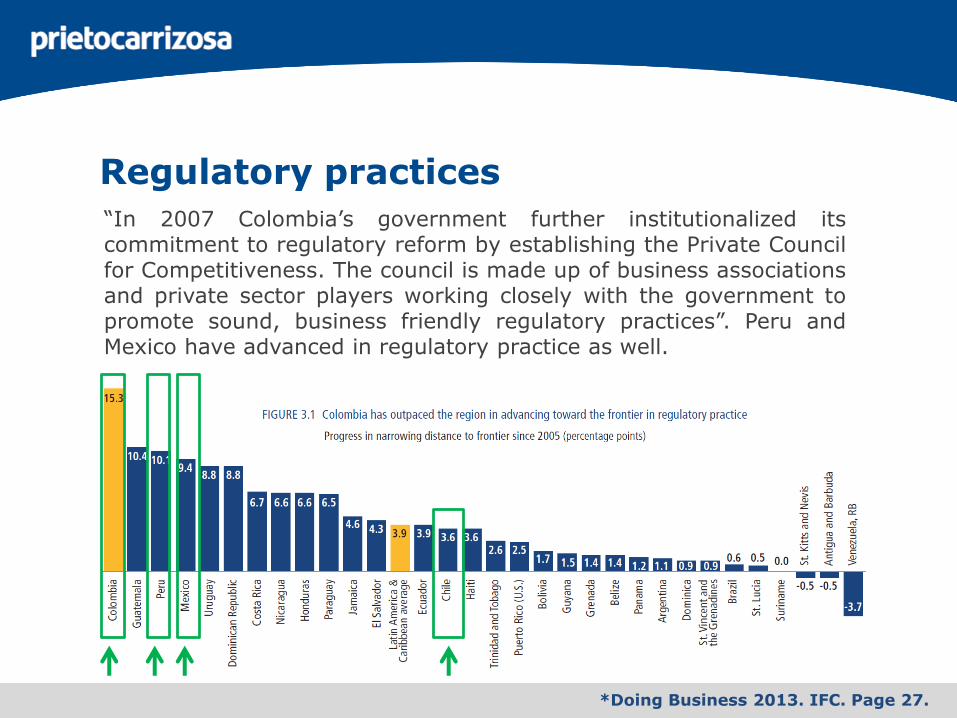
“In 2007 Colombia’s government further institutionalized itscommitment to regulatory reform by establishing the Private Councilfor Competitiveness. The council is made up of business associationsand private sector players working closely with the government topromote sound, business friendly regulatory practices”. Peru andMexico have advanced in regulatory practice as well.
*Doing Business 2013. IFC. Page 27.
Regulatory practices
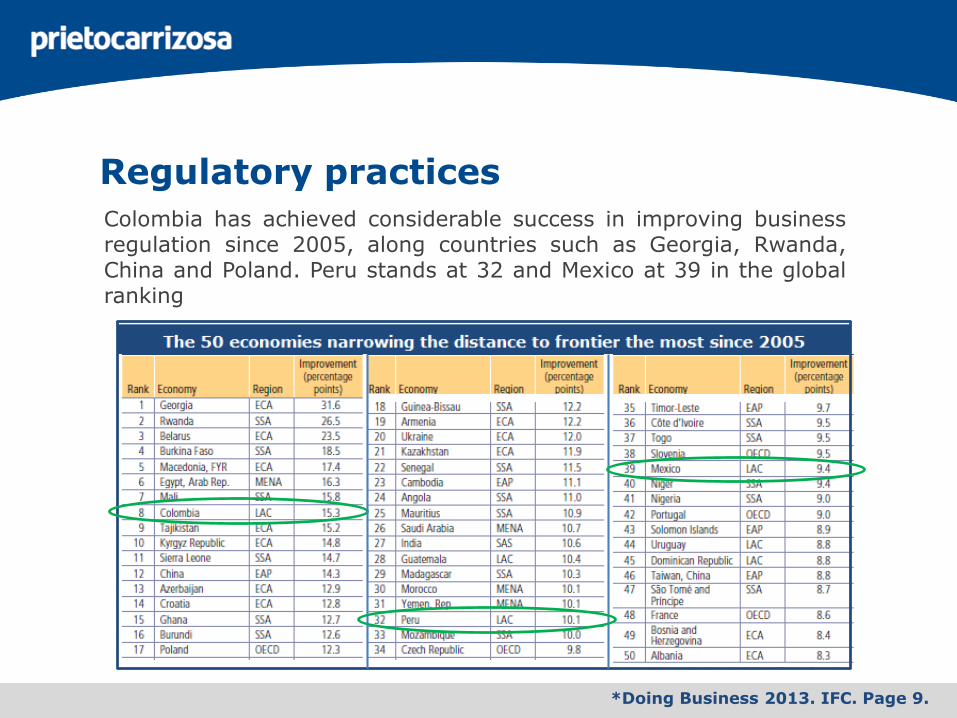
*Doing Business 2013. IFC. Page 9.
Colombia has achieved considerable success in improving businessregulation since 2005, along countries such as Georgia, Rwanda,China and Poland. Peru stands at 32 and Mexico at 39 in the globalranking
Regulatory practices
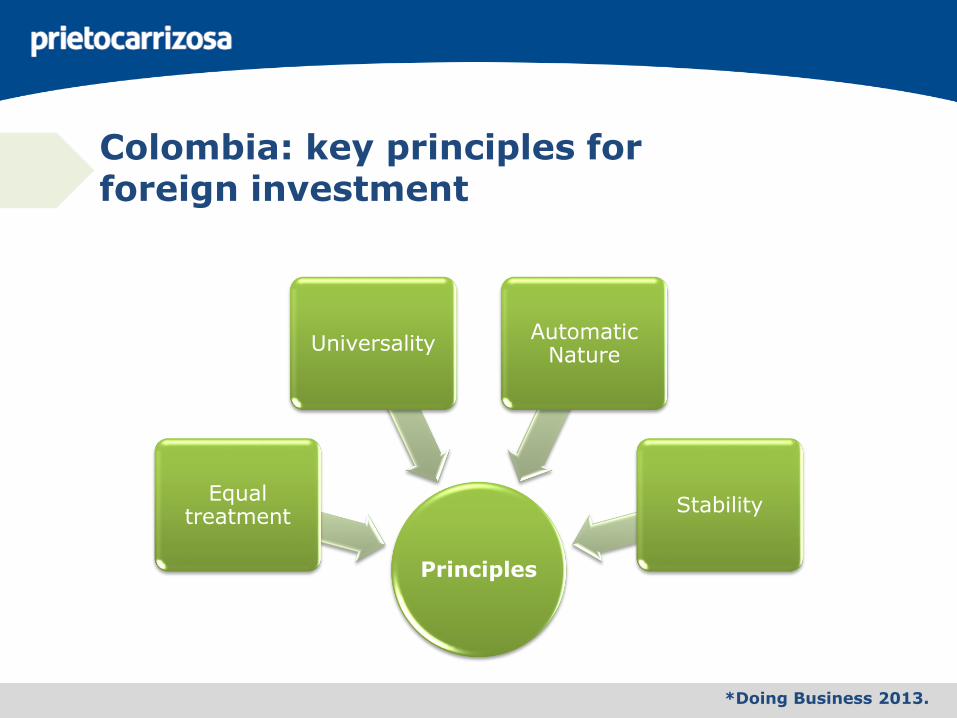
Colombia: key principles for foreign investment
Principles
Equal treatment
UniversalityAutomatic
Nature
Stability
*Doing Business 2013.
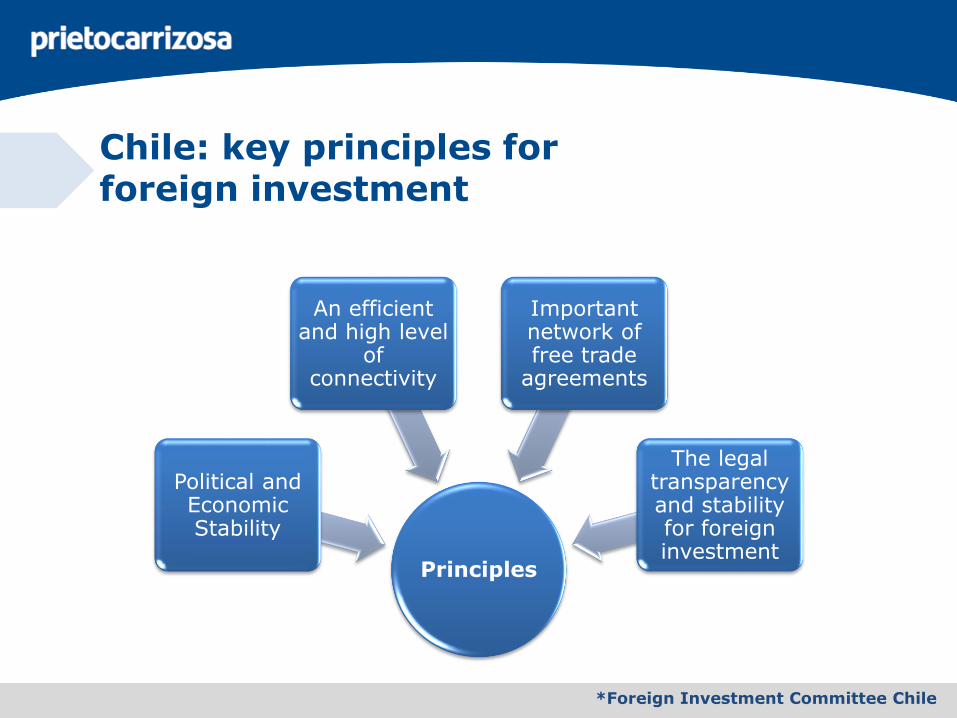
Chile: key principles for foreign investment
Principles
Political and Economic Stability
An efficient and high level
of connectivity
Important network of free trade
agreements
The legal transparency and stability for foreign investment
*Foreign Investment Committee Chile
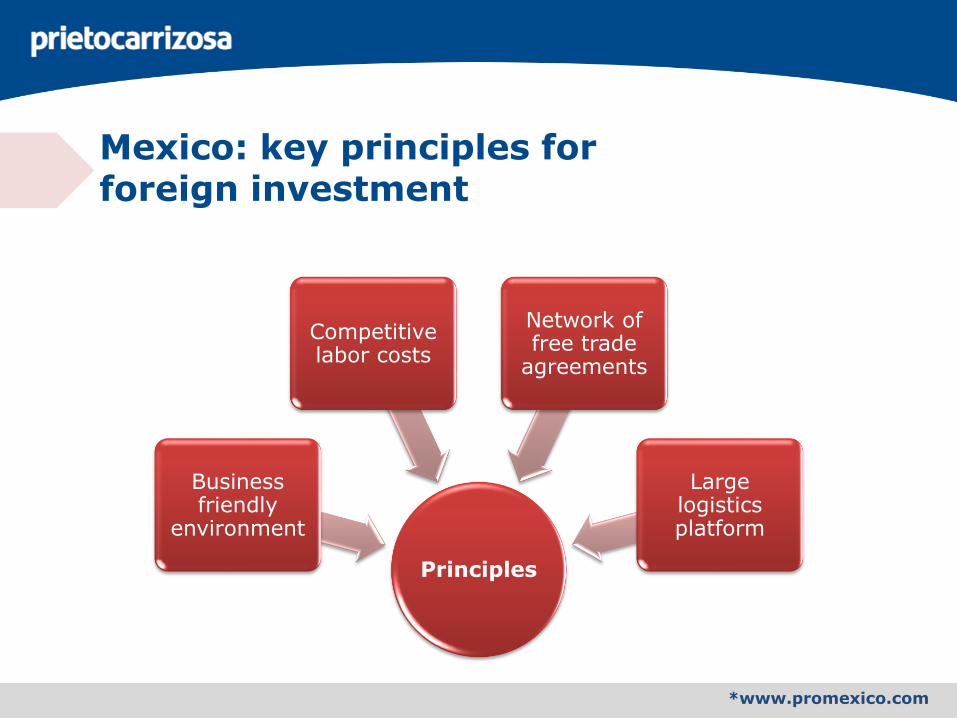
Mexico: key principles for foreign investment
Principles
Business friendly
environment
Competitive labor costs
Network of free trade
agreements
Large logistics platform
*www.promexico.com
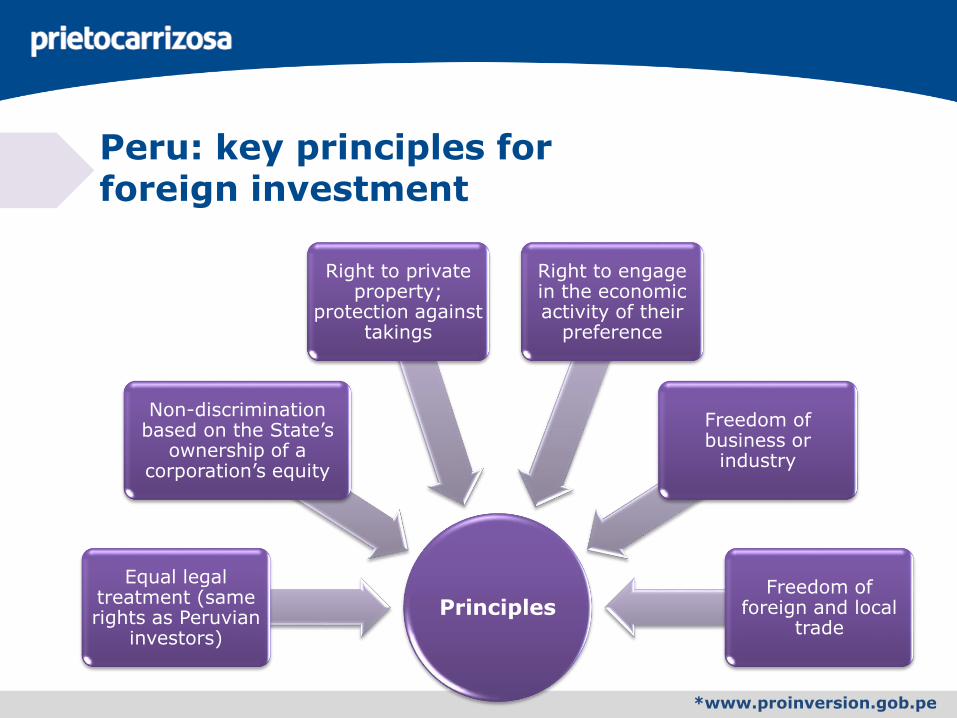
Peru: key principles for foreign investment
Principles
Equal legal treatment (same rights as Peruvian
investors)
Non-discrimination based on the State’s
ownership of a corporation’s equity
Right to private property;
protection against takings
Right to engage in the economic activity of their
preference
Freedom of business or
industry
Freedom of foreign and local
trade
*www.proinversion.gob.pe
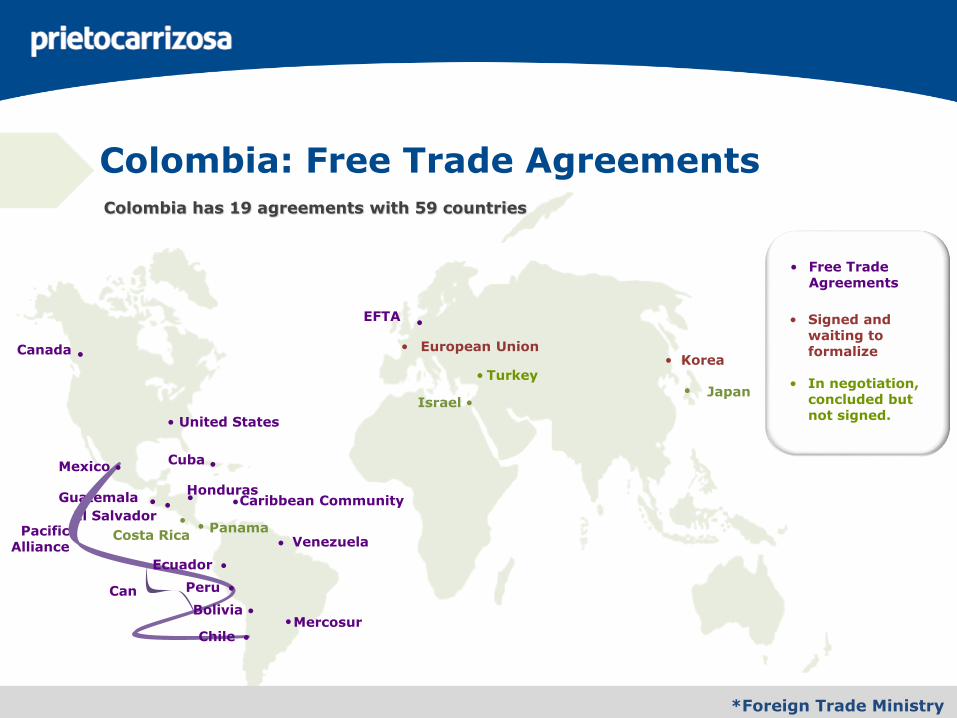
Colombia: Free Trade Agreements
Canada
United States
Mexico
Caribbean Community
• Free Trade Agreements
•
•
•
•EFTA
Korea
Japan•
•European Union•
Mercosur
Turkey•• In negotiation,
concluded but not signed.
Colombia has 19 agreements with 59 countries
Cuba •
Venezuela•
•
Guatemala •El Salvador
••Honduras
Peru
•
•
Panama••Costa Rica
Israel •
Pacific Alliance
• Signed and waiting toformalize
Can
*Foreign Trade Ministry
Chile •
Bolivia
•
•
Ecuador
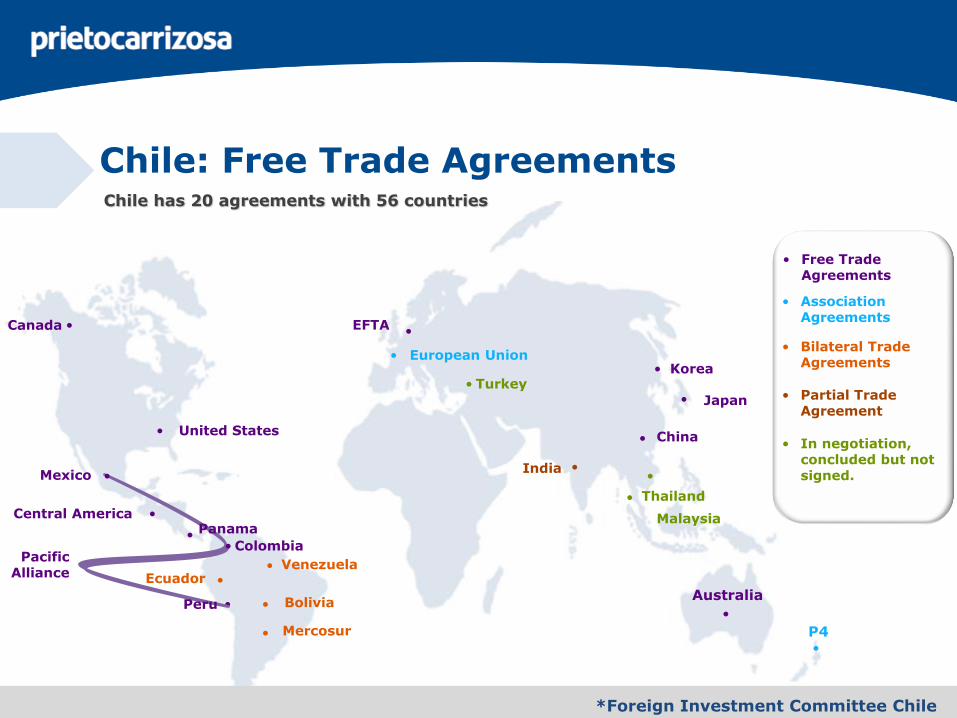
Chile: Free Trade Agreements
Canada
United States
Mexico
Central America
• Free Trade Agreements
•
•
•
•
•EFTA
Korea
Japan
China
•
•
•
•
European Union •
•
• Association Agreements
Colombia
Ecuador
Bolivia
Mercosur
•Venezuela
•
•
• Bilateral Trade Agreements
India •
• Partial Trade Agreement
Malaysia
Turkey•
• In negotiation, concluded but not signed.
Thailand
•
•
Chile has 20 agreements with 56 countries
•
Australia
P4
*Foreign Investment Committee Chile
Pacific Alliance
•Peru
•
•
Panama
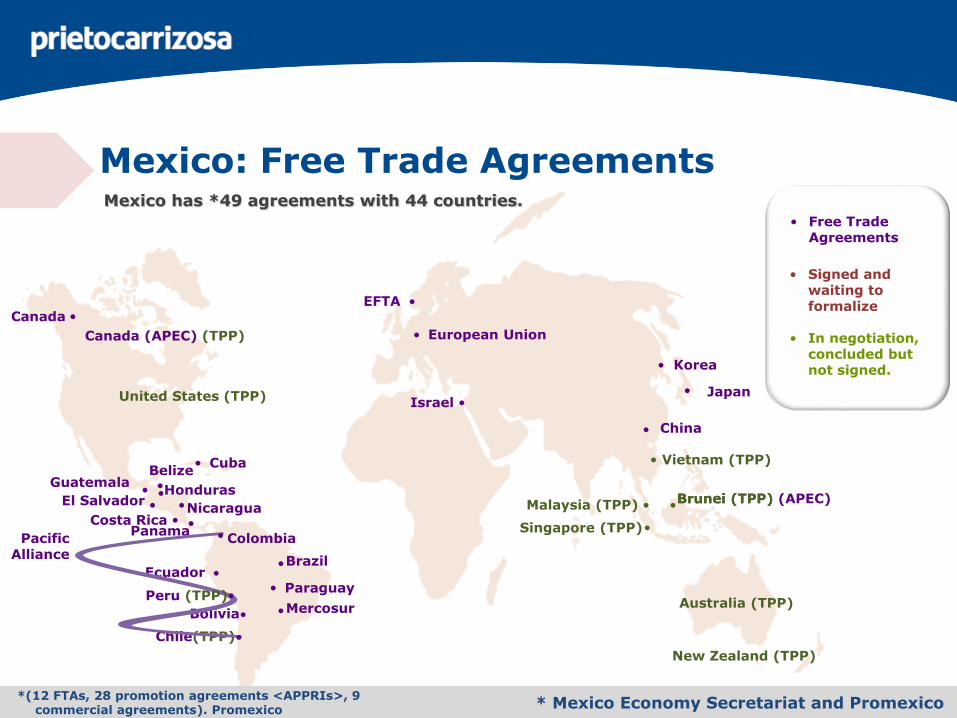
Mexico: Free Trade AgreementsMexico has *49 agreements with 44 countries.
* Mexico Economy Secretariat and Promexico
Mercosur•
Canada •
Bolivia•
Costa Rica •
Colombia
Chile(TPP)
Israel •Japan•
Brazil•
Paraguay•
Nicaragua•
Guatemala
El SalvadorHonduras
•• •
Panama•
•EFTA
Cuba•
•Belize
European Union •Canada (APEC) (TPP)
United States (TPP)
Singapore (TPP)
Australia (TPP)
Malaysia (TPP)
Vietnam (TPP)
New Zealand (TPP)
Brunei (TPP)•
•
•
Brunei (TPP) (APEC)•
Korea
China•
•
• Free Trade Agreements
• In negotiation, concluded but not signed.
• Signed and waiting toformalize
Ecuador •
Pacific Alliance
Peru (TPP) •
•
•
*(12 FTAs, 28 promotion agreements <APPRIs>, 9 commercial agreements). Promexico
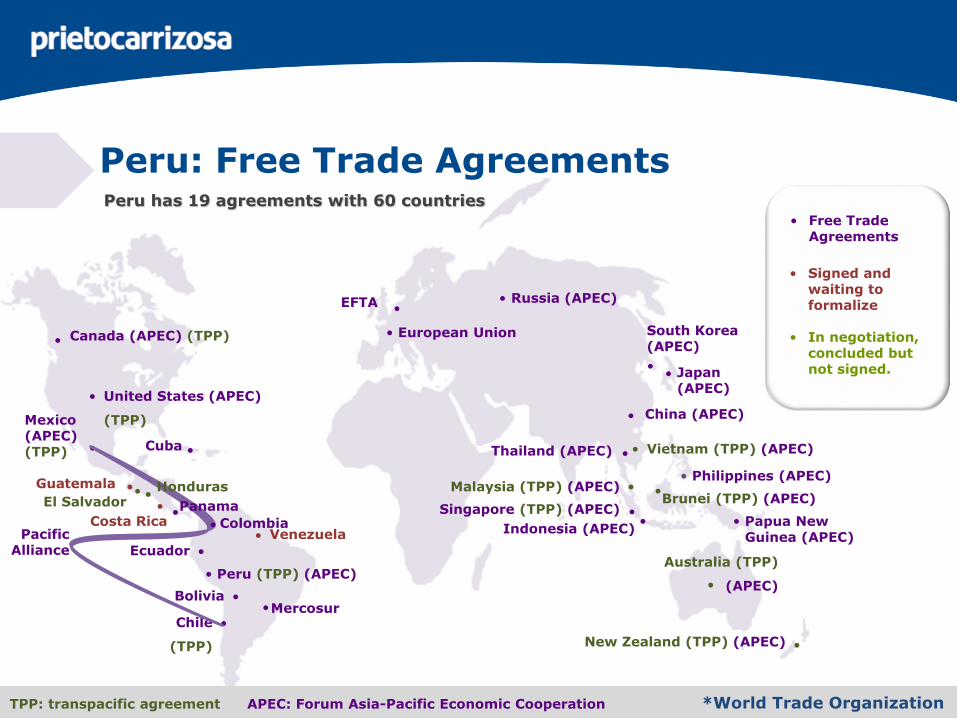
Peru: Free Trade Agreements
Canada (APEC) (TPP)
United States (APEC)
(TPP)Mexico(APEC) (TPP)
•
•
•
•EFTA
Japan (APEC)
European Union
Mercosur
Peru has 19 agreements with 60 countries
Cuba •
Venezuela•
•Chile
(TPP)
•
Peru (TPP) (APEC)•
Bolivia •
Ecuador •
•
•
China (APEC)•
•
••Costa Rica
Guatemala •
Thailand (APEC) •
Singapore (TPP) (APEC) •
South Korea (APEC)
•
•El Salvador
•
Australia (TPP)
(APEC)•
TPP: transpacific agreement
Malaysia (TPP) (APEC) •
Vietnam (TPP) (APEC)•
New Zealand (TPP) (APEC) •
Brunei (TPP) (APEC)•
Russia (APEC)•
*World Trade OrganizationAPEC: Forum Asia-Pacific Economic Cooperation
Indonesia (APEC)• • Papua New
Guinea (APEC)
• Philippines (APEC)
• Free Trade Agreements
• In negotiation, concluded but not signed.
• Signed and waiting toformalize
ColombiaPacific
Alliance
•
Honduras
Panama
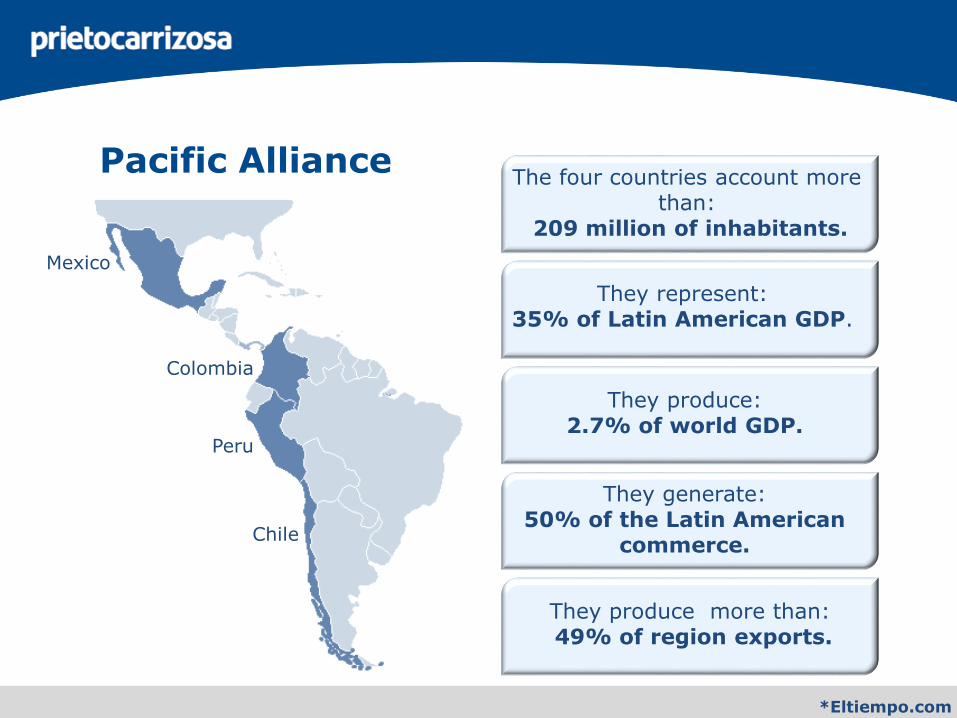
Pacific Alliance
*Eltiempo.com
Mexico
Colombia
Peru
Chile
The four countries account more than:
209 million of inhabitants.
They represent:35% of Latin American GDP.
They produce:2.7% of world GDP.
They generate:50% of the Latin American
commerce.
They produce more than:49% of region exports.
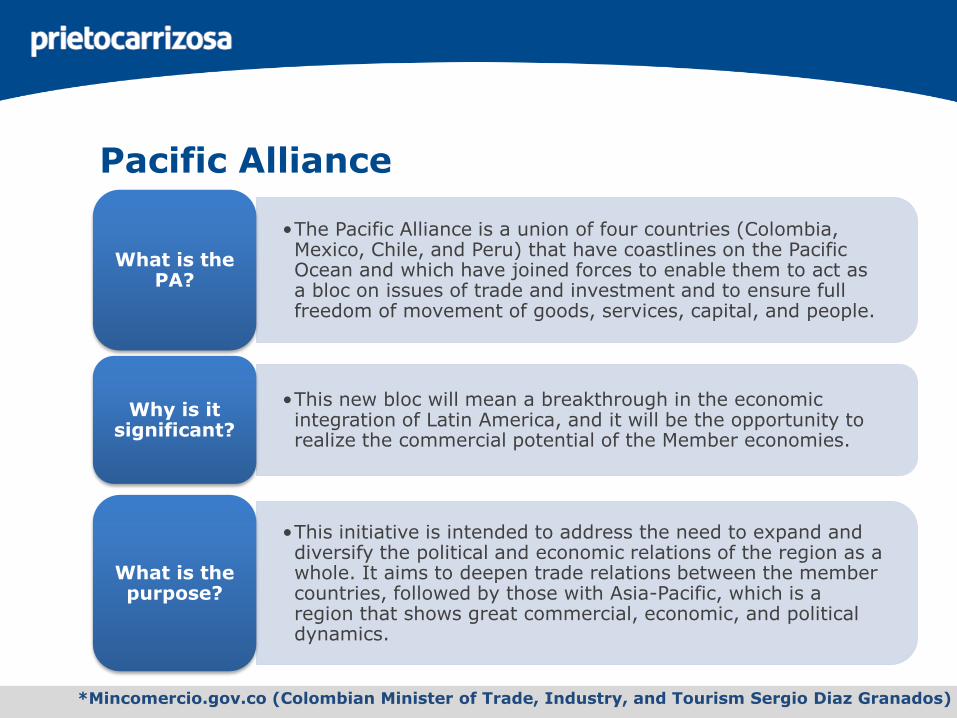
•The Pacific Alliance is a union of four countries (Colombia, Mexico, Chile, and Peru) that have coastlines on the Pacific Ocean and which have joined forces to enable them to act as a bloc on issues of trade and investment and to ensure full freedom of movement of goods, services, capital, and people.
What is thePA?
•This new bloc will mean a breakthrough in the economic integration of Latin America, and it will be the opportunity to realize the commercial potential of the Member economies.
Why is it significant?
•This initiative is intended to address the need to expand and diversify the political and economic relations of the region as a whole. It aims to deepen trade relations between the member countries, followed by those with Asia-Pacific, which is a region that shows great commercial, economic, and political dynamics.
What is the purpose?
*Mincomercio.gov.co (Colombian Minister of Trade, Industry, and Tourism Sergio Diaz Granados)
Pacific Alliance
*Mincomercio.gov.co (Colombian Minister of Trade, Industry, and Tourism Sergio Diaz Granados)
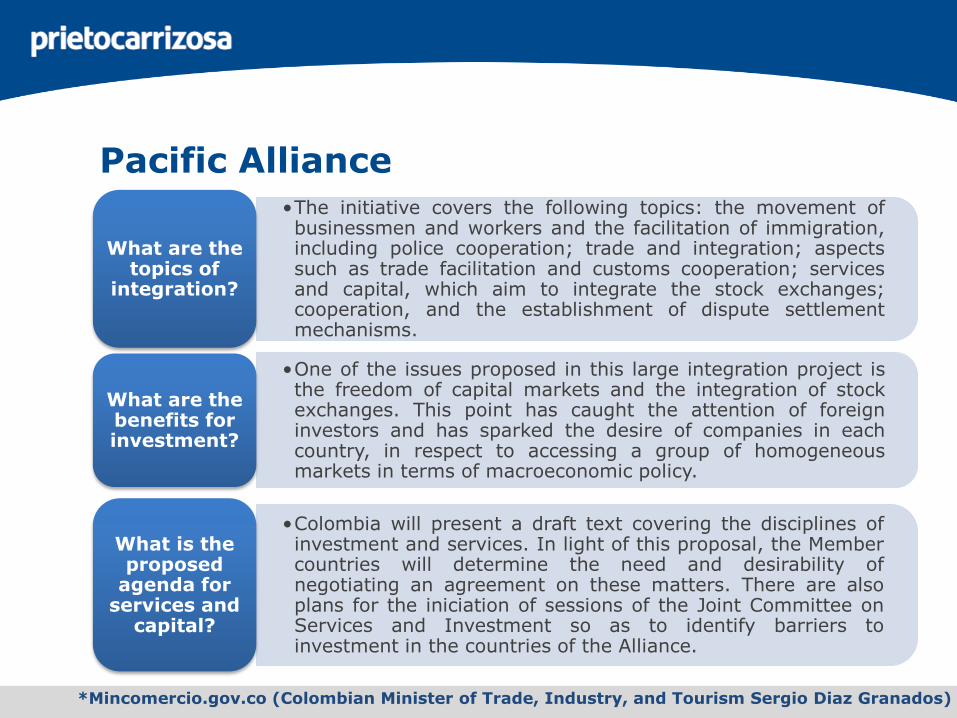
•The initiative covers the following topics: the movement ofbusinessmen and workers and the facilitation of immigration,including police cooperation; trade and integration; aspectssuch as trade facilitation and customs cooperation; servicesand capital, which aim to integrate the stock exchanges;cooperation, and the establishment of dispute settlementmechanisms.
What are the topics of
integration?
•One of the issues proposed in this large integration project isthe freedom of capital markets and the integration of stockexchanges. This point has caught the attention of foreigninvestors and has sparked the desire of companies in eachcountry, in respect to accessing a group of homogeneousmarkets in terms of macroeconomic policy.
What are the benefits for investment?
•Colombia will present a draft text covering the disciplines ofinvestment and services. In light of this proposal, the Membercountries will determine the need and desirability ofnegotiating an agreement on these matters. There are alsoplans for the iniciation of sessions of the Joint Committee onServices and Investment so as to identify barriers toinvestment in the countries of the Alliance.
What is the proposed
agenda for services and
capital?
Pacific Alliance
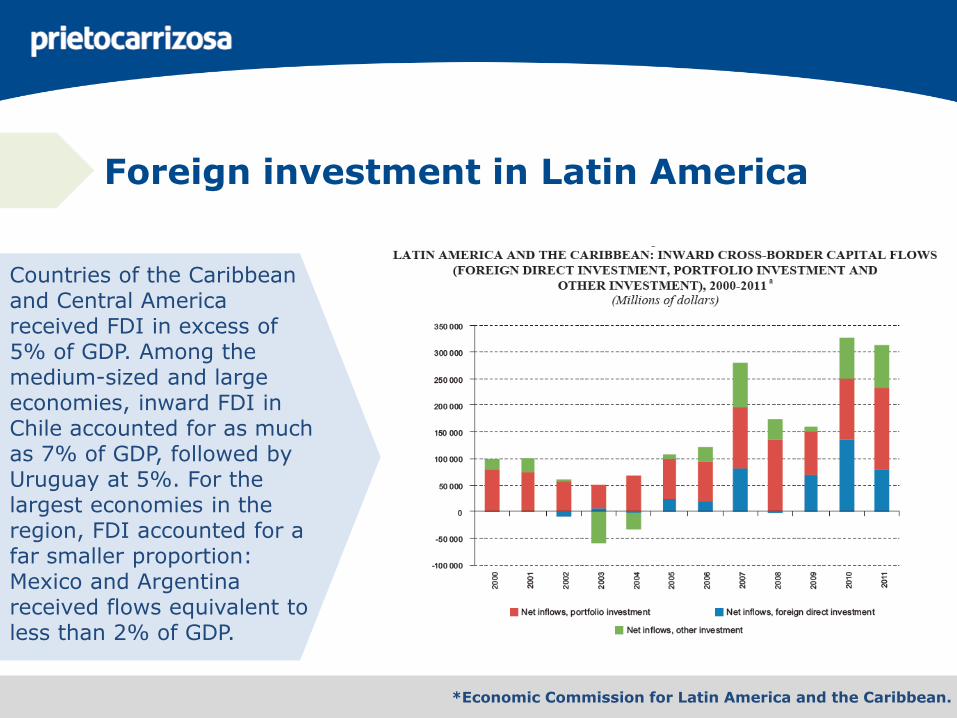
Foreign investment in Latin America
Countries of the Caribbean and Central America received FDI in excess of 5% of GDP. Among the medium-sized and large economies, inward FDI in Chile accounted for as much as 7% of GDP, followed by Uruguay at 5%. For the largest economies in the region, FDI accounted for a far smaller proportion: Mexico and Argentina received flows equivalent to less than 2% of GDP.
*Economic Commission for Latin America and the Caribbean.
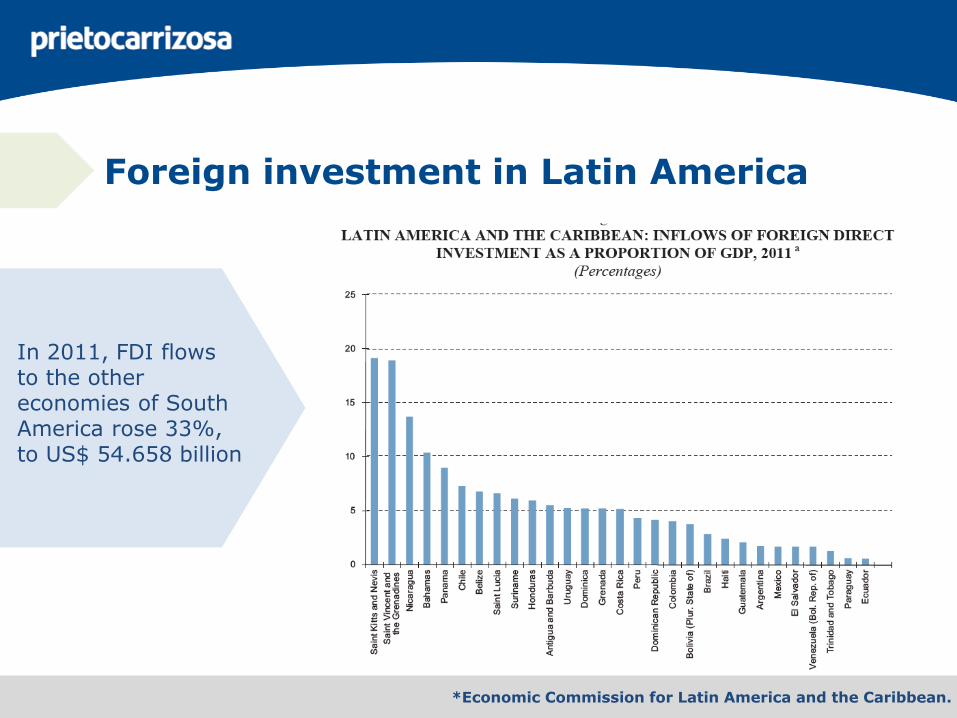
Foreign investment in Latin America
In 2011, FDI flows to the other economies of South America rose 33%, to US$ 54.658 billion
*Economic Commission for Latin America and the Caribbean.
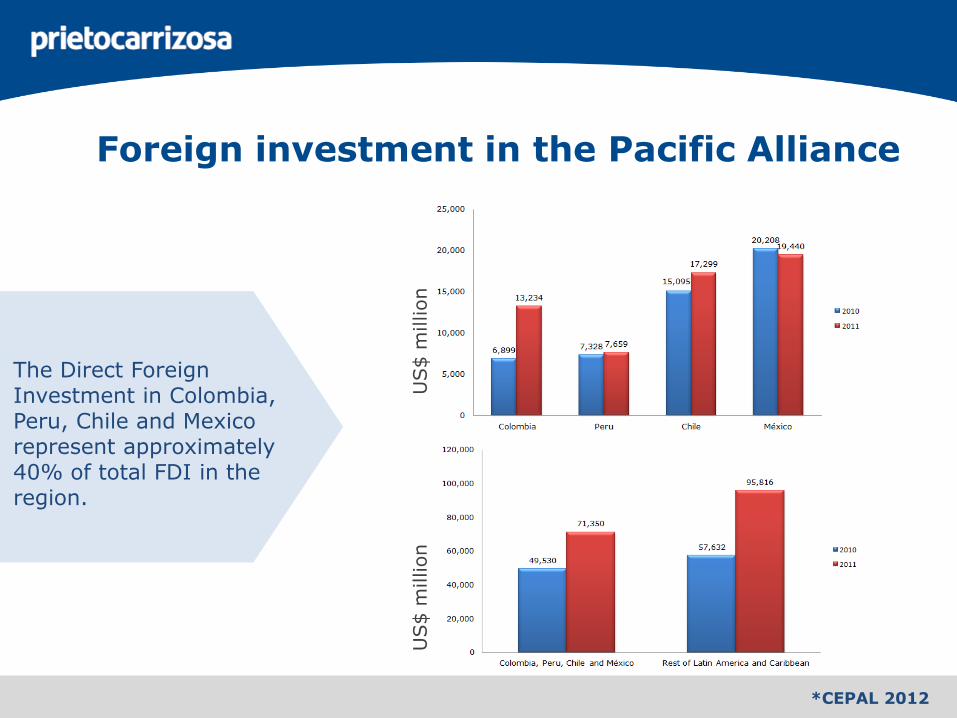
Foreign investment in the Pacific Alliance
*CEPAL 2012
US$
million
The Direct Foreign Investment in Colombia, Peru, Chile and Mexico represent approximately 40% of total FDI in the region.
US$
million
*CEPAL 2012 *¨Proinversion.gob.pe
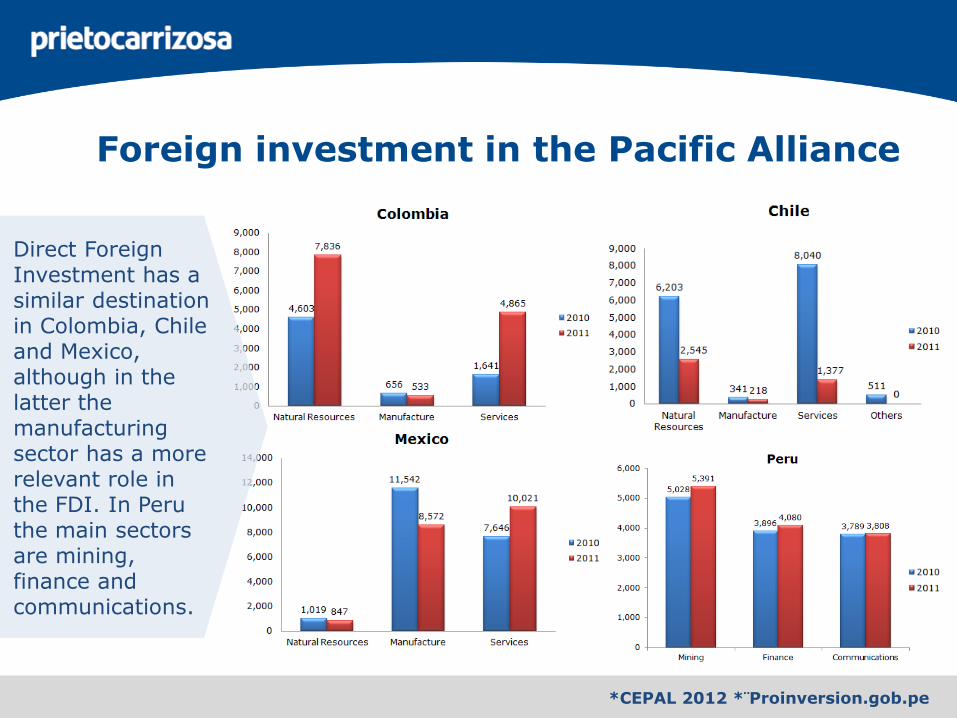
Foreign investment in the Pacific Alliance
Direct Foreign Investment has a similar destination in Colombia, Chile and Mexico, although in the latter the manufacturing sector has a more relevant role in the FDI. In Peru the main sectors are mining, finance and communications.
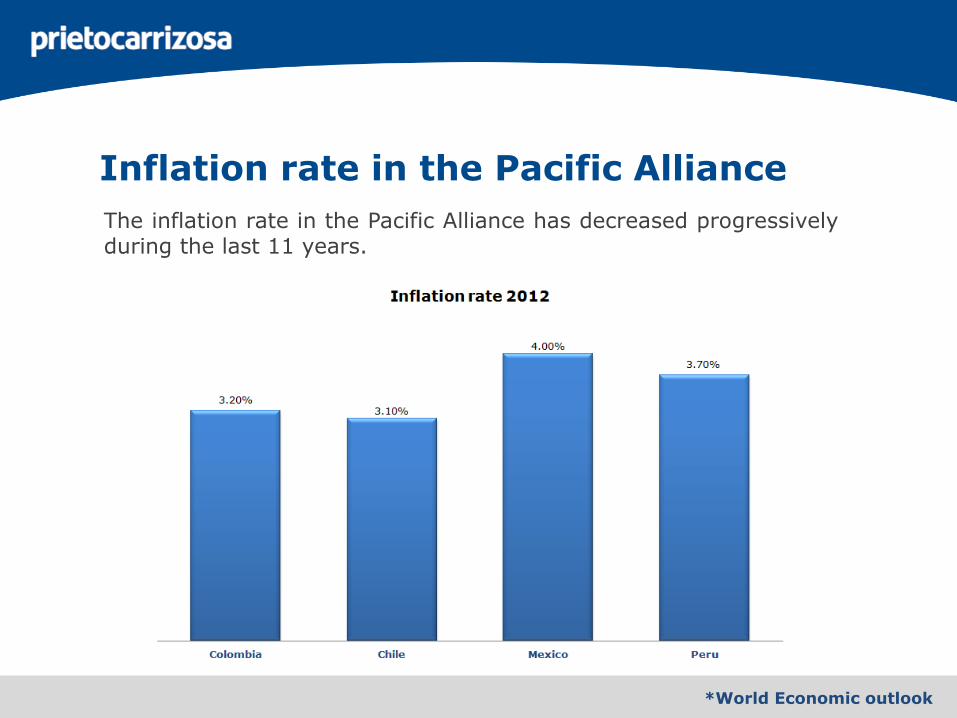
Inflation rate in the Pacific Alliance
The inflation rate in the Pacific Alliance has decreased progressivelyduring the last 11 years.
*World Economic outlook
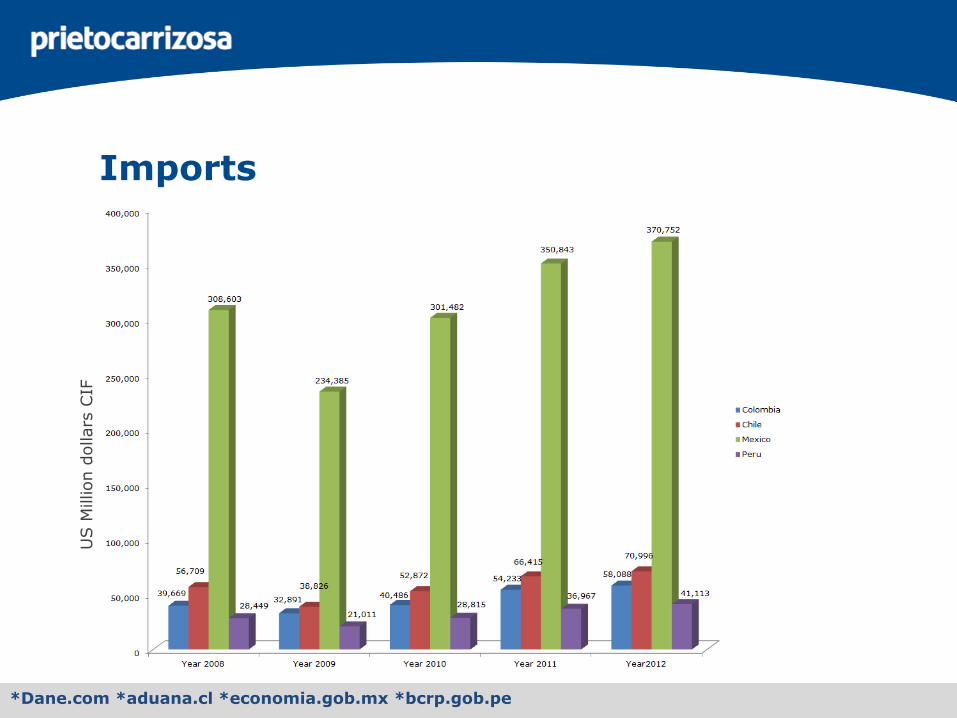
Imports
*Dane.com *aduana.cl *economia.gob.mx *bcrp.gob.pe
US M
illion d
ollars
CIF
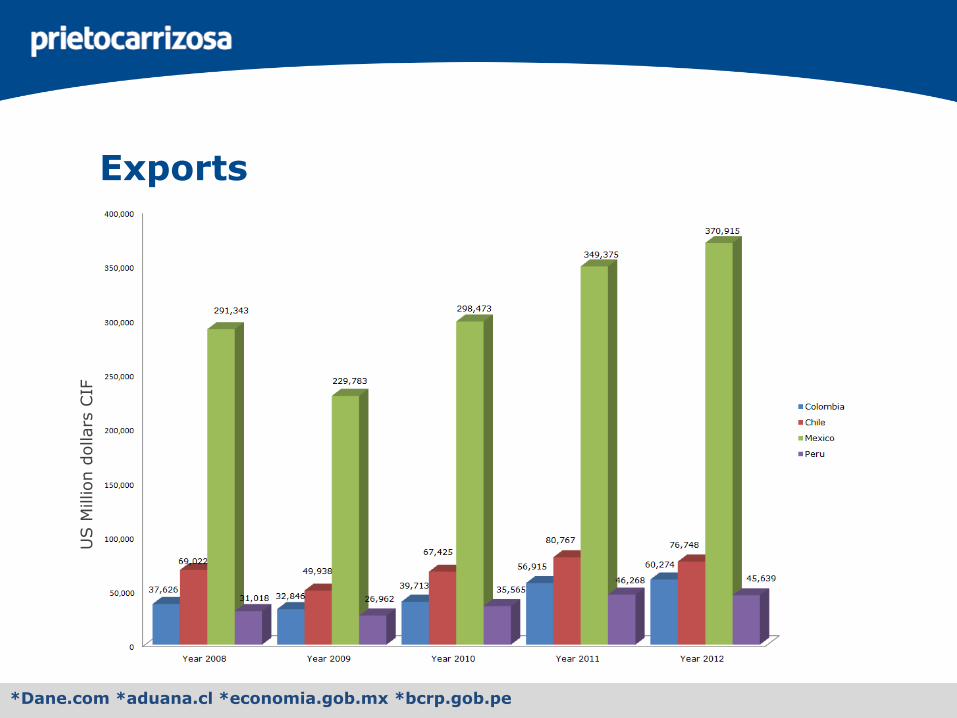
Exports
US M
illion d
ollars
CIF
*Dane.com *aduana.cl *economia.gob.mx *bcrp.gob.pe
*DANE REPORT. Second quarter of 2012. - *National Infrastructure Agency (ANI).
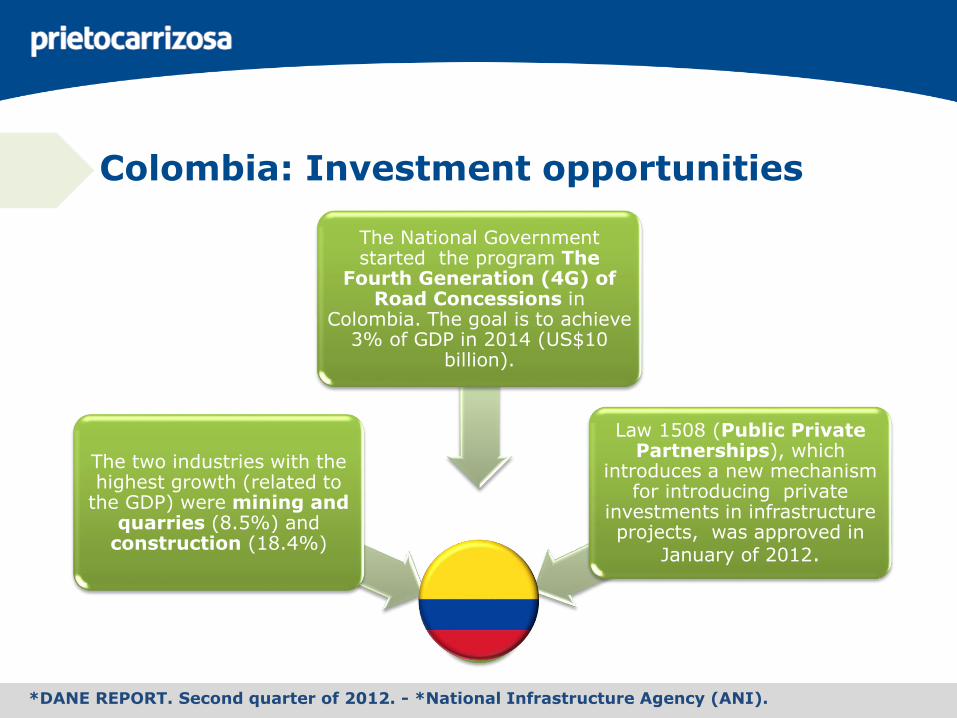
Colombia: Investment opportunities
The two industries with the highest growth (related to
the GDP) were mining and quarries (8.5%) and
construction (18.4%)
The National Government started the program The
Fourth Generation (4G) of Road Concessions in
Colombia. The goal is to achieve 3% of GDP in 2014 (US$10
billion).
Law 1508 (Public Private Partnerships), which
introduces a new mechanism for introducing private
investments in infrastructure projects, was approved in
January of 2012.
*National Planning Department (DNP).
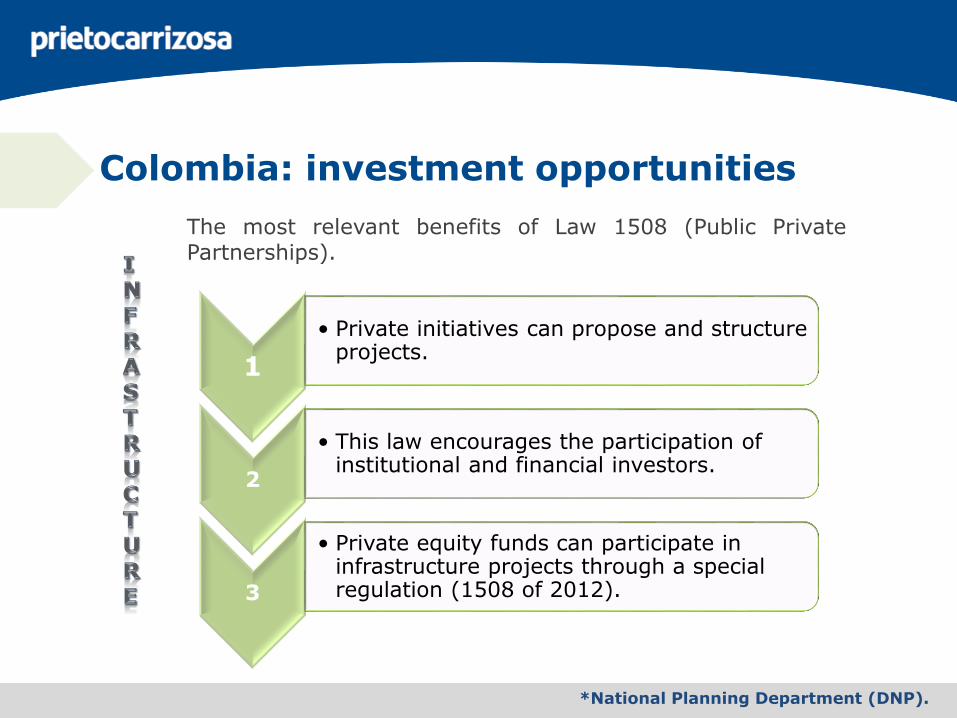
The most relevant benefits of Law 1508 (Public PrivatePartnerships).
1
• Private initiatives can propose and structure projects.
2
• This law encourages the participation of institutional and financial investors.
3
• Private equity funds can participate in infrastructure projects through a special regulation (1508 of 2012).
Colombia: investment opportunities
*National Planning Department (DNP).
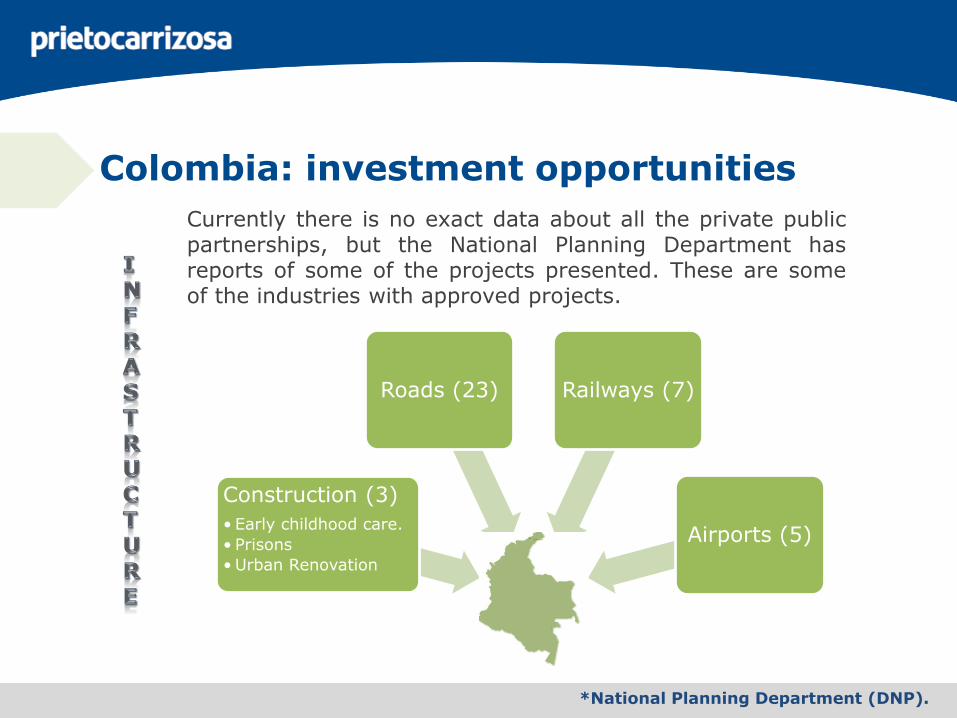
Currently there is no exact data about all the private publicpartnerships, but the National Planning Department hasreports of some of the projects presented. These are someof the industries with approved projects.
Construction (3)
• Early childhood care.
• Prisons
• Urban Renovation
Roads (23) Railways (7)
Airports (5)
Colombia: investment opportunities
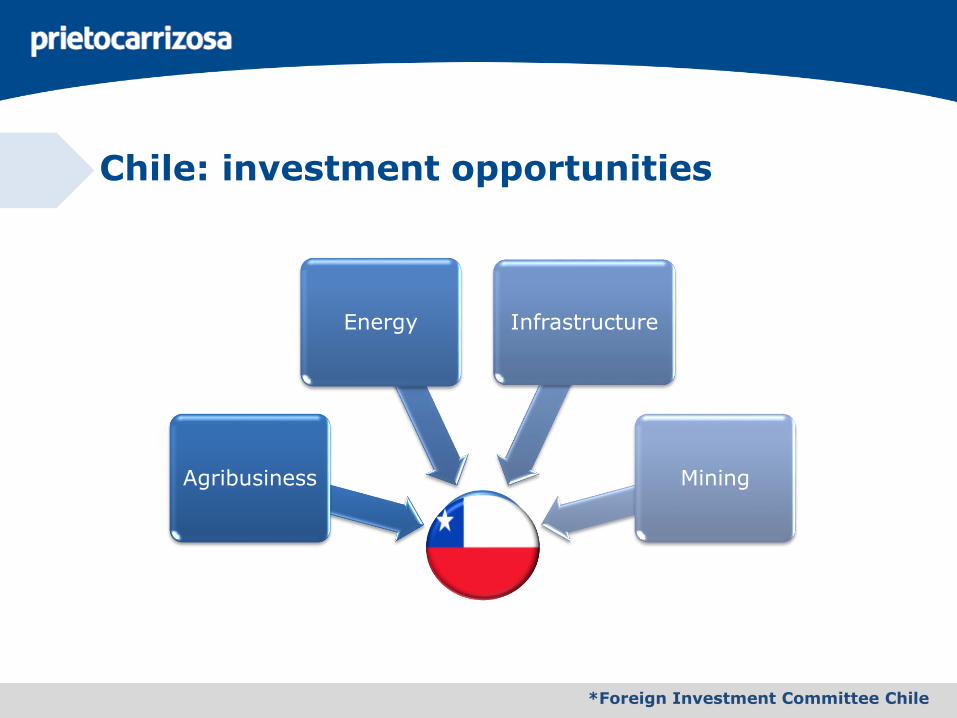
Agribusiness
Energy Infrastructure
Mining
Chile: investment opportunities
*Foreign Investment Committee Chile

Chile: investment opportunities
*Foreign Investment Committee Chile
Agribusiness is one of the country’s most important sectorsaccounting for 12% of Chile’s GDP and 24% of exports in 2010.
Chile is one of only fiveplaces in the world, witha Mediterranean climate.This type of climatefacilitates production offoods such as olive oil,wine, fruit andvegetables that are inline with an internationaltrend towards healthyeating.
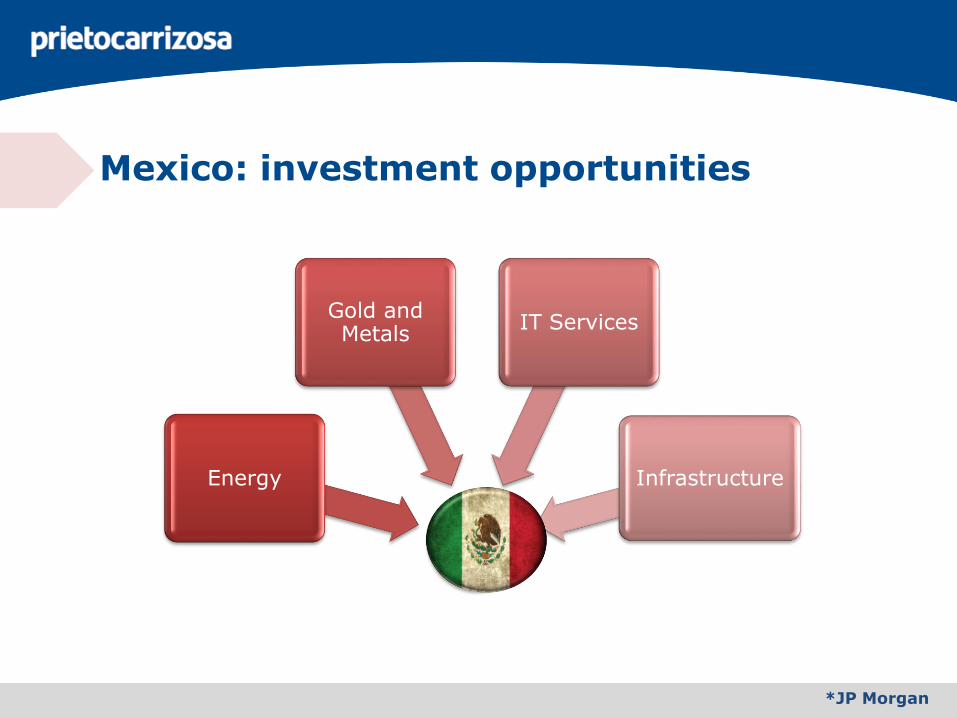
Energy
Gold and Metals
IT Services
Infrastructure
Mexico: investment opportunities
*JP Morgan
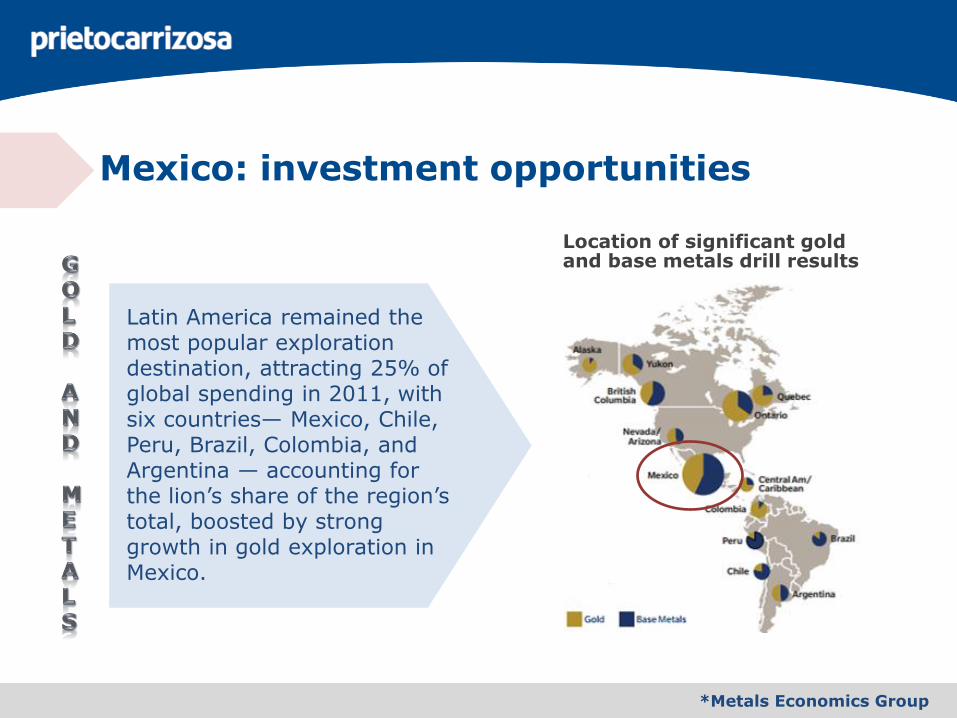
*Metals Economics Group
Mexico: investment opportunities
Location of significant gold and base metals drill results
Latin America remained the most popular exploration destination, attracting 25% of global spending in 2011, with six countries— Mexico, Chile, Peru, Brazil, Colombia, and Argentina — accounting for the lion’s share of the region’s total, boosted by strong growth in gold exploration in Mexico.
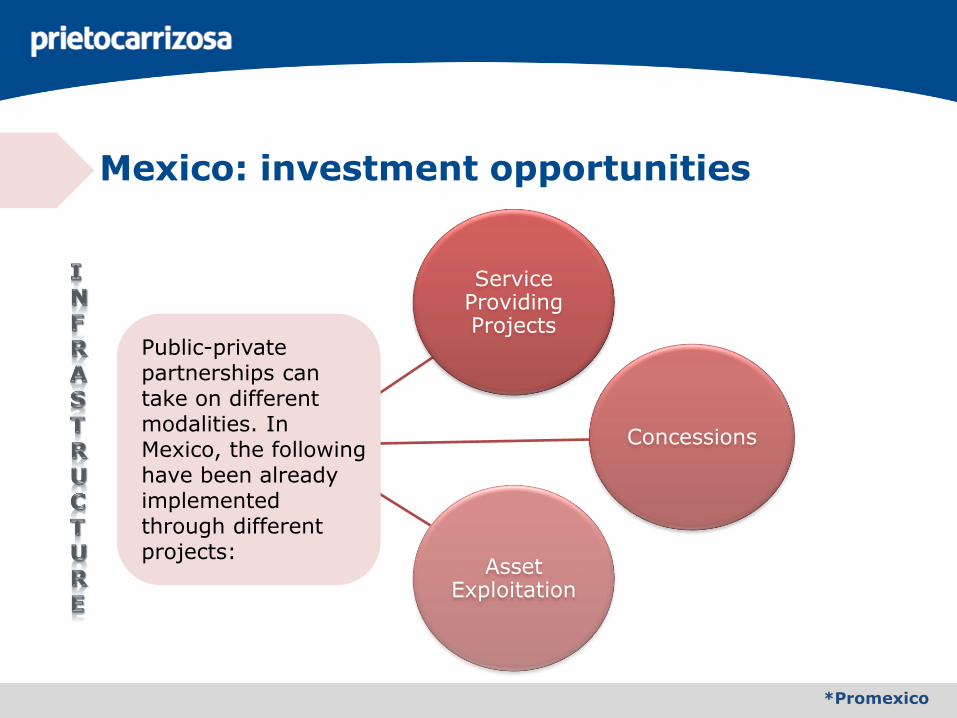
*Promexico
Mexico: investment opportunities
Service Providing Projects
Concessions
Asset Exploitation
Public-private partnerships can take on differentmodalities. In Mexico, the following have been alreadyimplemented through different projects:
Mining
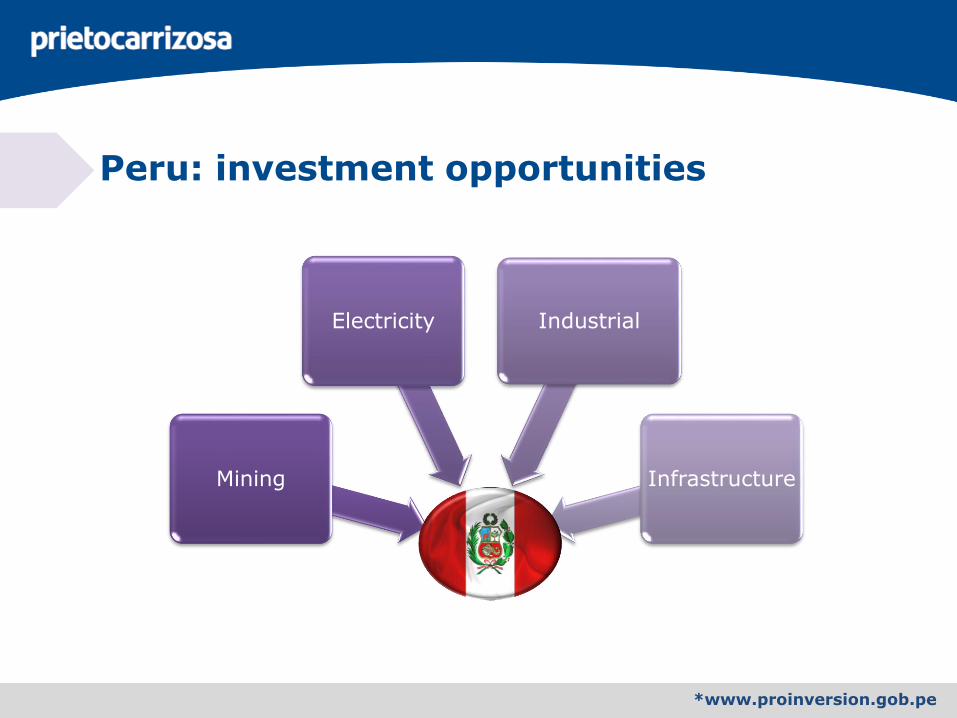
Electricity Industrial
Infrastructure
Peru: investment opportunities
*www.proinversion.gob.pe
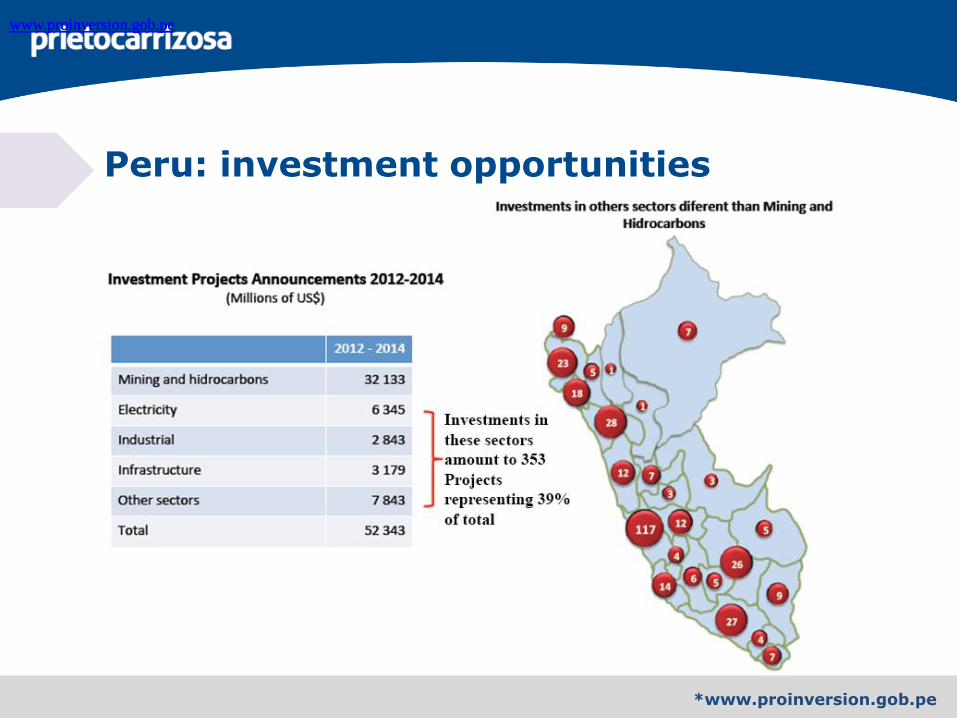
Peru: investment opportunities
www.proinversion.gob.pewww.proinversion.gob.pewww.proinversion.gob.pe
*www.proinversion.gob.pe
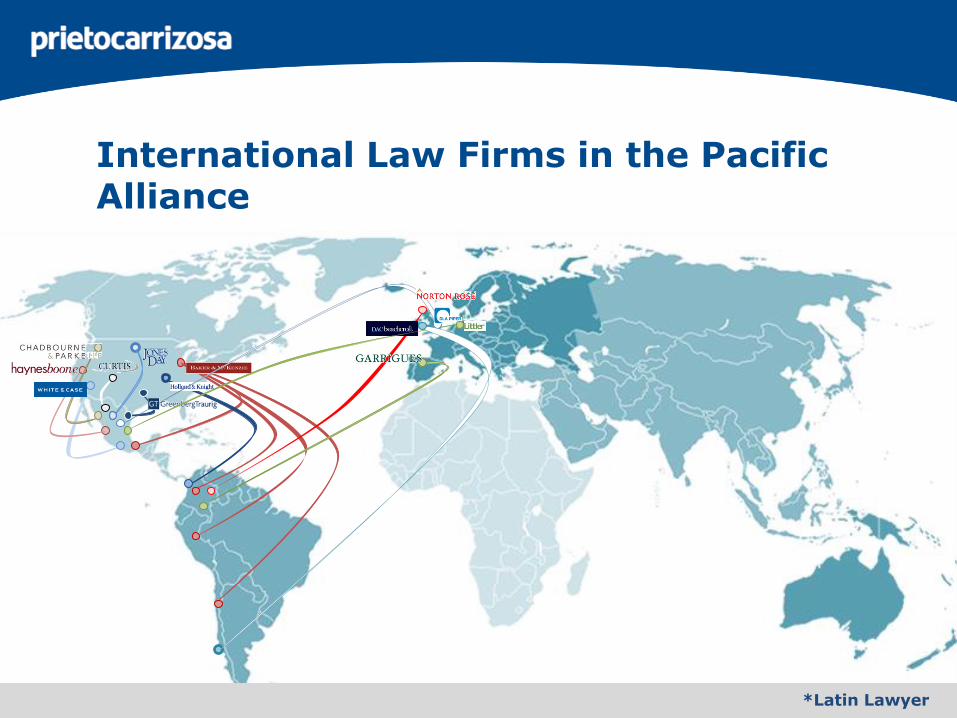
International Law Firms in the Pacific Alliance
*Latin Lawyer
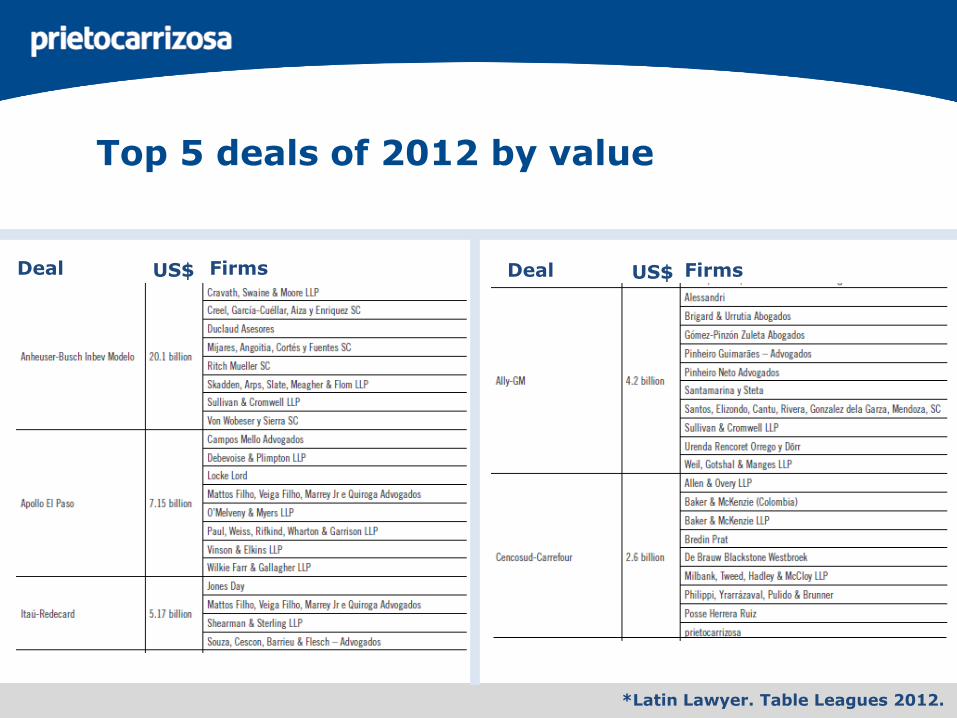
Top 5 deals of 2012 by value
*Latin Lawyer. Table Leagues 2012.
Deal US$ Firms Deal US$ Firms
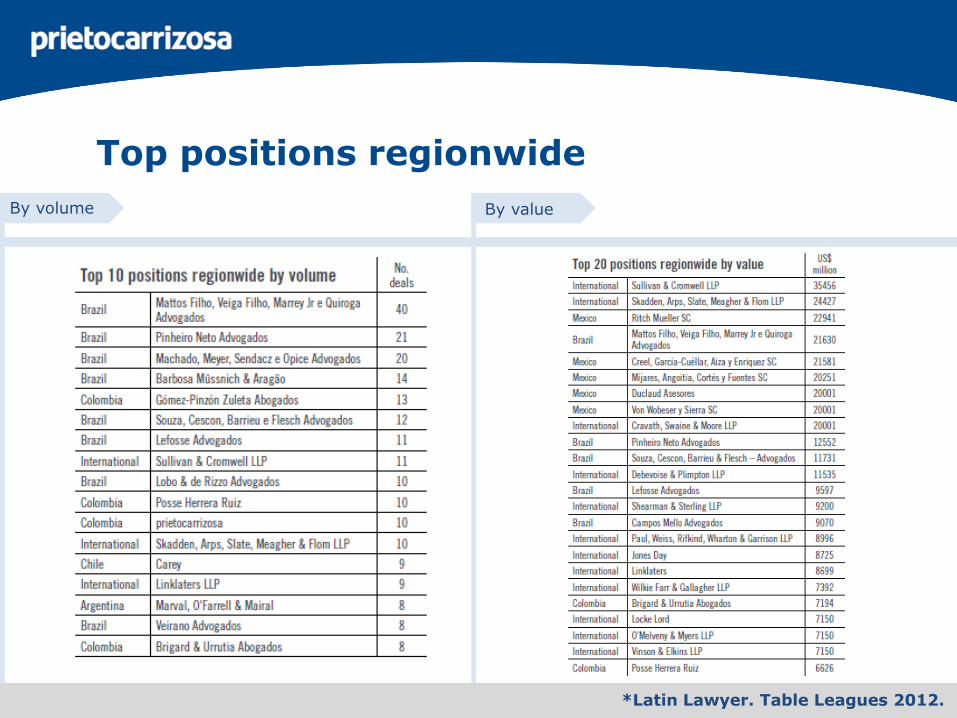
Top positions regionwide
*Latin Lawyer. Table Leagues 2012.
By volume By value
*Latin Lawyer. Table Leagues 2012.
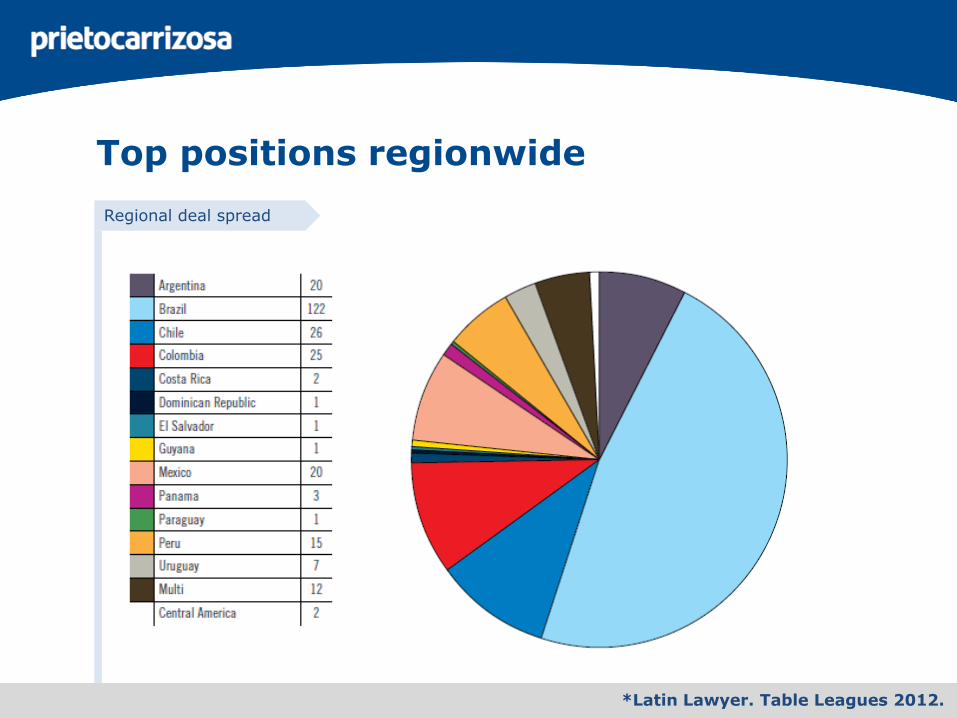
Top positions regionwide
Regional deal spread
*Latin Lawyer. Table Leagues 2012.
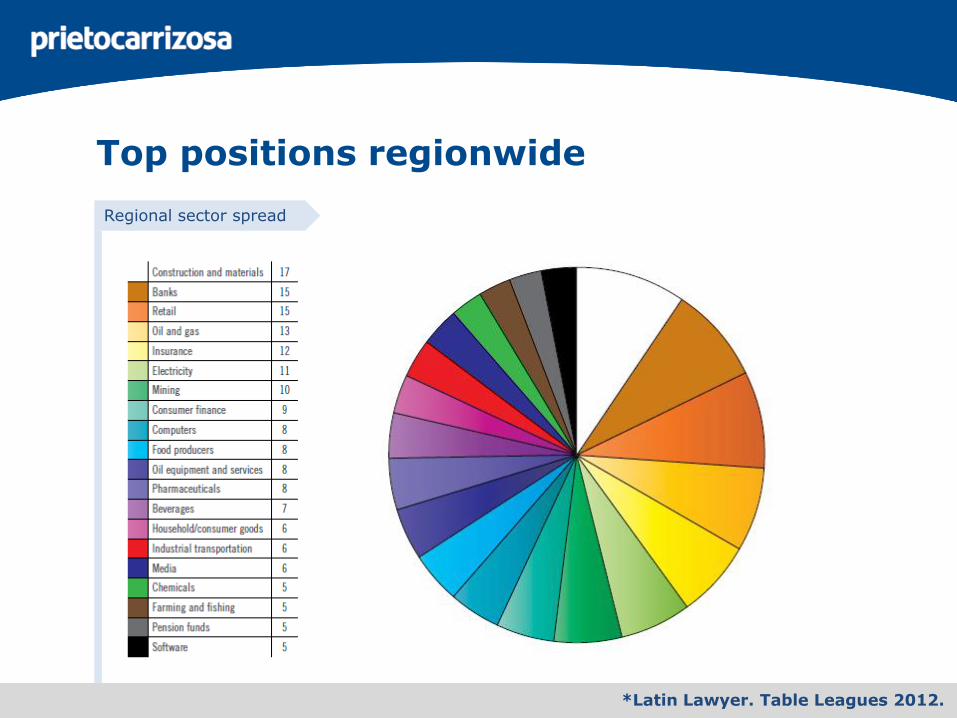
Top positions regionwide
Regional sector spread