why does a team outperform its run differential?
TRANSCRIPT
Why Does a Team Outperform its Run
Differential?Greg Ackerman
Syracuse University Sabermetrics Club

SU Sabermetrics Club
• SABR Student Group Affiliate• Justin Mattingly• Joey Weinberg• Colby Conetta• Ray Garzia• Mallory Miller• Zack Potter• Marcus Shelmidine• Brandon Love• Matt Tanenbaum• Bryan Kilmeade• Justin Moritz• Stephen Marciello• Kyle O’Connor• Willie Kniesner
• Michael Rotondo• Matt Russo• Sam Fortier• Matt Filippi• Isaac Nelson• Zack Albright• John Van Ermen• Colton Smith• Chris Karasinski• Zach Tornabene

Basic Premise
• Explain the Difference between Actual Win Percentage and Expected Win Percentage based on Run Differential (Expected Win Percentage based upon Pythagenpat formula from run differential) • X = ((runs scored + runs against)/games)^.285
• If achieve run differential to possibly put team in playoffs – do not want to squander it• If borderline run differential for playoffs – could be difference in attaining playoff spot
• Will focus on 3 key factors that may influence teams outperforming or underperforming their run differential• Performance of Bench• Relief Pitching• Pitching Depth
• Part II – Add managerial decisions to the model• Pinch Hitters Used• Defensive Substitutions• Relievers Used• Etc.

Charts
• Average of (Actual Win % - Expected Win %)• Standard Deviation of (Actual Win % - Expected Win %)
• Variables calculated from www.baseball-reference.com
• Team Examples of Difference in Actual Win % - Expected Win %• San Francisco Giants• St. Louis Cardinals• New York Yankees• Toronto Blue Jays• Colorado Rockies

Anaheim
Arizona
Atlanta
Baltimore
Boston
Chicago
ChicagoNL
Cincinnati
Cleveland
Colorado
Detroit
Florida
Houston
Kansas C
ity
Los A
ngeles
Milwauke
e
Minnesota
New York
New YorkNL
Oakland
Philadelphia
Pittsb
urgh
San Diego
San Francisco
Seattle
St. Louis
TampaTexa
s
Toronto
Wash
ington
-0.02
-0.015
-0.01
-0.005
0
0.005
0.01
0.015
0.02
0.025
Average of Actual Win% - Expected Win% - By Team - 2000-2013

Anaheim
Arizona
Atlanta
Baltimore
Boston
Chicago
ChicagoNL
Cincinnati
Cleveland
Colorado
Detroit
Florida
Houston
Kansas C
ity
Los A
ngeles
Milwauke
e
Minnesota
New York
New YorkNL
Oakland
Philadelphia
Pittsb
urgh
San Diego
San Francisco
Seattle
St. Louis
TampaTexa
s
Toronto
Wash
ington0
0.005
0.01
0.015
0.02
0.025
0.03
0.035
0.04
Standard Deviation of Actual Win% - Exp. Win% - By Team – 2000-2013

2000 2001 2002 2003 2004 2005 2006 2007 2008 2009 2010 2011 2012
-0.02
-0.01
0
0.01
0.02
0.03
0.04
0.05
San Francisco Giants - Difference in Actual and Expected Win Percentage
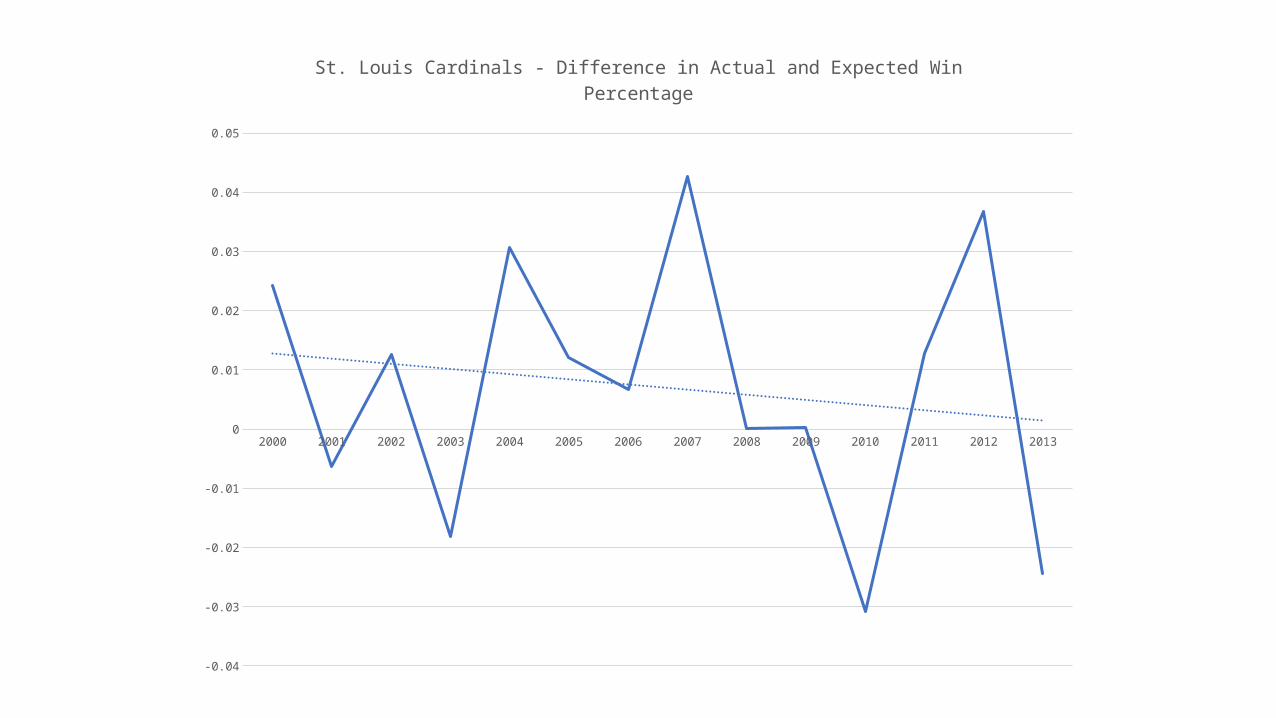
2000 2001 2002 2003 2004 2005 2006 2007 2008 2009 2010 2011 2012 2013
-0.04
-0.03
-0.02
-0.01
0
0.01
0.02
0.03
0.04
0.05
St. Louis Cardinals - Difference in Actual and Expected Win Percentage
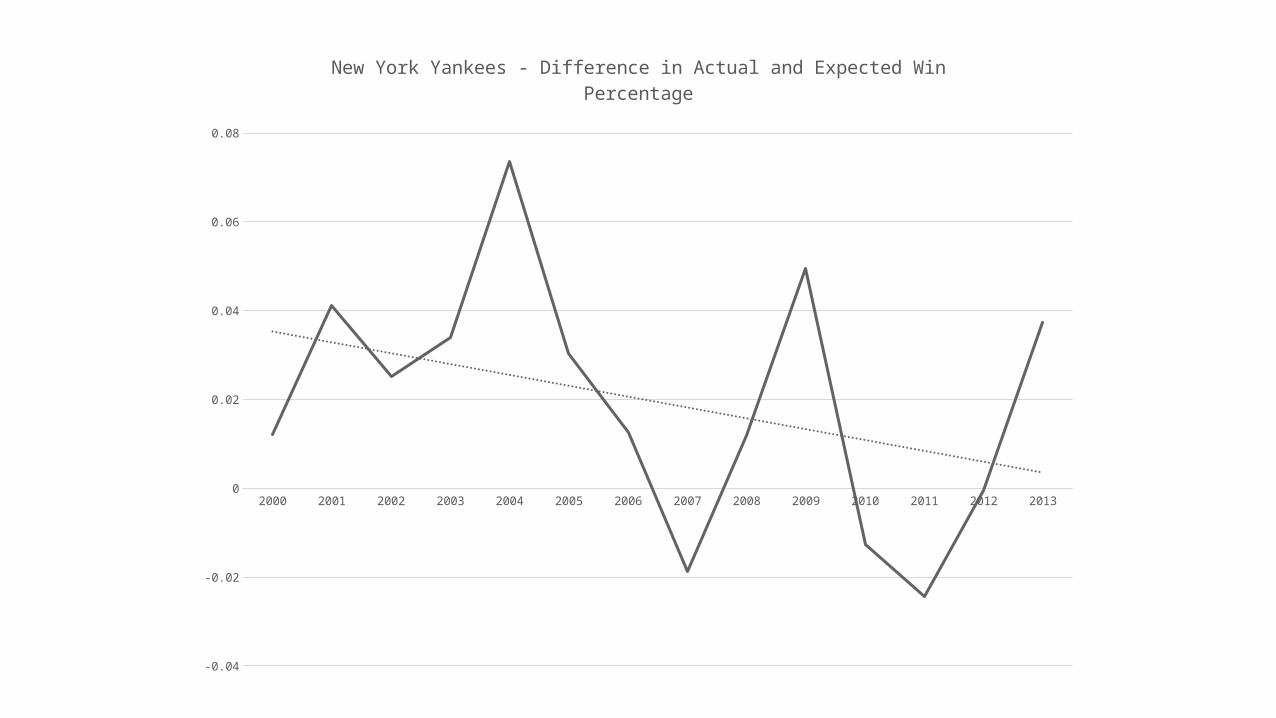
2000 2001 2002 2003 2004 2005 2006 2007 2008 2009 2010 2011 2012 2013
-0.04
-0.02
0
0.02
0.04
0.06
0.08
New York Yankees - Difference in Actual and Expected Win Percentage
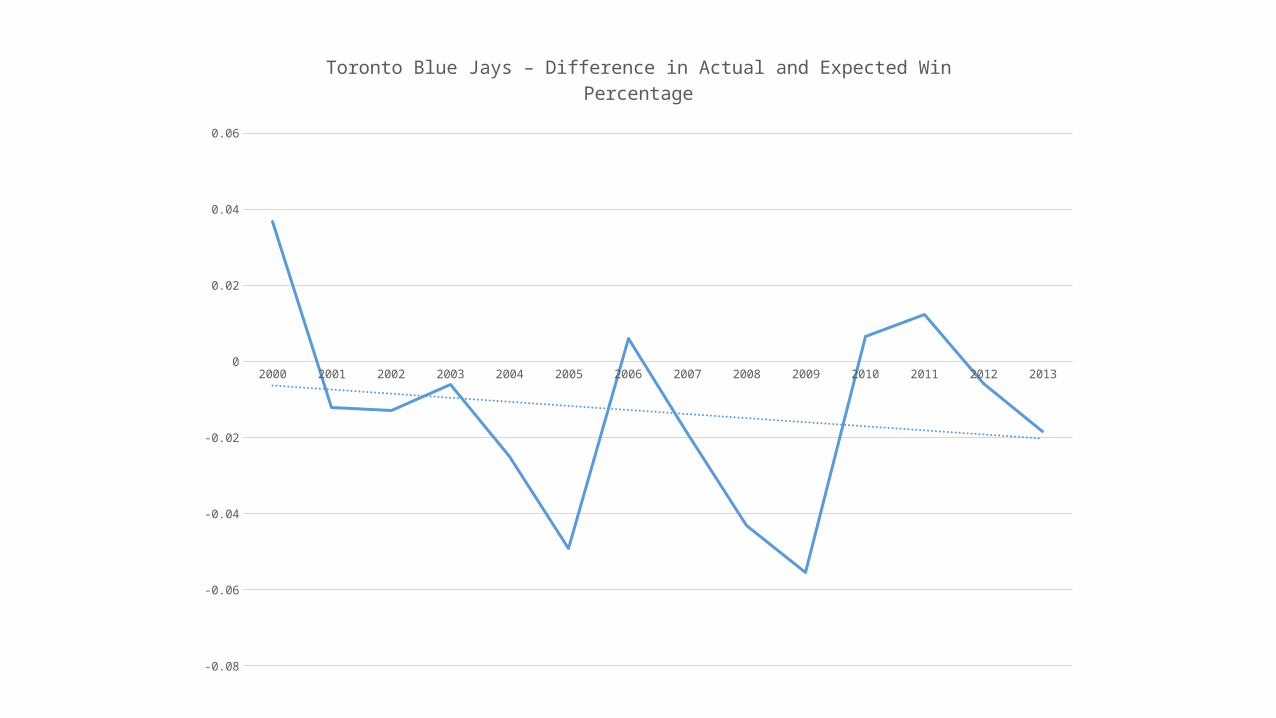
2000 2001 2002 2003 2004 2005 2006 2007 2008 2009 2010 2011 2012 2013
-0.08
-0.06
-0.04
-0.02
0
0.02
0.04
0.06
Toronto Blue Jays – Difference in Actual and Expected Win Percentage

2000 2001 2002 2003 2004 2005 2006 2007 2008 2009 2010 2011 2012 2013
-0.06
-0.05
-0.04
-0.03
-0.02
-0.01
0
0.01
0.02
0.03
Colorado Rockies - Difference in Actual and Expected Win Percentage

Measures of Bench (Hitters) Performance• OPS+ - On-Base Average plus Slugging Percentage – Adjusted for Park and League• HR – Home Runs• SB – Stolen Bases• CS – Caught Stealing
• Calculated from Baseball Reference – using only bench players listed for each team – weighted average based upon plate appearances of each player
• Ultimately, only included OPS+• Other variables did not add statistical value to the regression model beyond OPS+
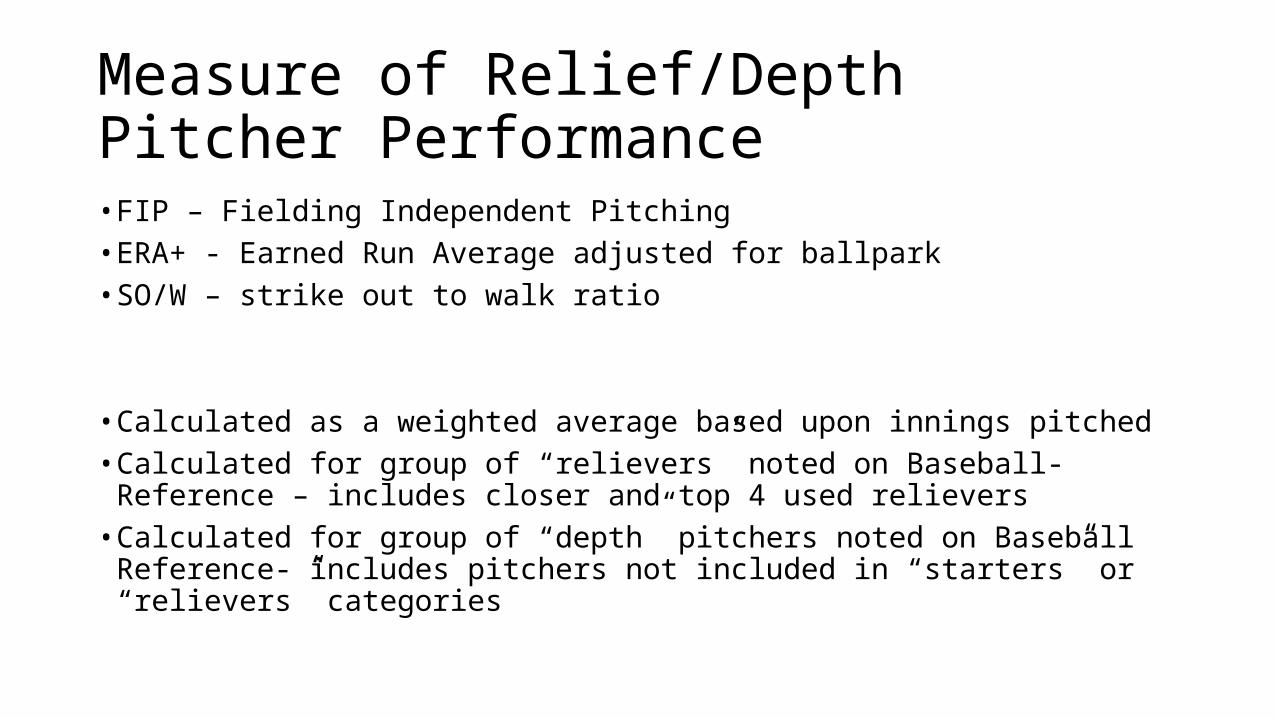
Measure of Relief/Depth Pitcher Performance• FIP – Fielding Independent Pitching• ERA+ - Earned Run Average adjusted for ballpark• SO/W – strike out to walk ratio
• Calculated as a weighted average based upon innings pitched• Calculated for group of “relievers” noted on Baseball-Reference – includes
closer and top 4 used relievers• Calculated for group of “depth” pitchers noted on Baseball Reference-
includes pitchers not included in “starters” or “relievers” categories

Regression Model I
• After different regression model incarnations – settled upon the following to illustrate results:
• (Actual – Expected Win %)i = α0 +β1 (Bench OPS+) + β2 (Relief variable) + β3 (Pitching Depth variable) + εi

Regression Results – (Actual Win% - Pyth Win%) on Bench and Relief Pitching Performance
I II III
Intercept 0.0206(1.4307) Intercept 0.0071
(0.5750) Intercept -0.0102(-1.0729)
OPS+ - Bench 0.00001(0.1104) OPS+ - Bench 0.00002
(0.1911) OPS+ - Bench 0.00002(0.1795)
FIP – Relief -0.0044**(-1.9130) ERA – Relief -0.0026
(-1.5358) KBB – Relief 0.0014(1.3735)
FIP – Depth -0.0009(-0.4956) ERA – Depth 0.0001
(0.0756) KBB – Depth 0.0007(0.7328)

Results
• Variables have expected signs for bench (hitter) performance, relief pitching, and pitching depth• Only statistically significant result is for relief pitching performance• Specifically – FIP
• FIP has a negative and significant impact on (Actual Win Percentage – Exp. Win Percentage)• As FIP increases – has negative impact on dependent variable
• More likely to underperform run differential• As FIP decreases – has positive impact on dependent variable
• More likely to outperform run differential
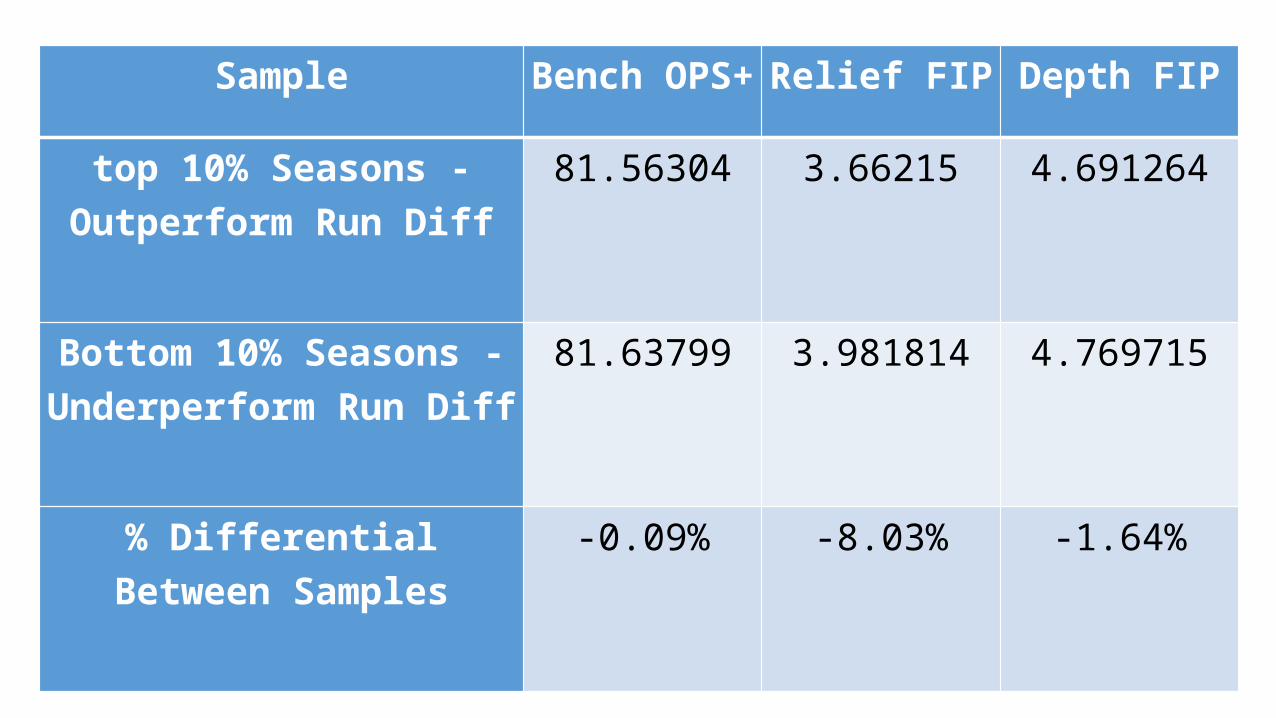
Sample Bench OPS+ Relief FIP Depth FIP
top 10% Seasons - Outperform Run Diff
81.56304 3.66215 4.691264
Bottom 10% Seasons - Underperform Run Diff
81.63799 3.981814 4.769715
% Differential Between Samples
-0.09% -8.03% -1.64%

Anaheim
Arizona
Atlanta
Baltimore
Boston
Chicago
ChicagoNL
Cincinnati
Cleveland
Colorado
Detroit
Florida
Houston
Kansas C
ity
Los A
ngeles
Milwauke
e
Minnesota
New York
New YorkNL
Oakland
Philadelphia
Pittsb
urgh
San Diego
San Francisco
Seattle
St. Louis
TampaTexa
s
Toronto
Wash
ington65
70
75
80
85
90
Average of Bench OPS+

Anaheim
Arizona
Atlanta
Baltimore
Boston
Chicago
ChicagoNL
Cincinnati
Cleveland
Colorado
Detroit
Florida
Houston
Kansas C
ity
Los A
ngeles
Milwauke
e
Minnesota
New York
New YorkNL
Oakland
Philadelphia
Pittsb
urgh
San Diego
San Francisco
Seattle
St. Louis
TampaTexa
s
Toronto
Wash
ington0
1
2
3
4
5
6
FIP - Relief and Pitching Depth
FIP-Relief FIP-Depth

Managerial Decisions
• For Next Step: Added Managerial Decisions to the Data Set
• To measure managerial decisions – used the Bill James Handbook
• Attempt to measure the impact of various managerial decisions on the ability to outperform (underperform) a team’s run differential

Managerial Decision Variables
• Pinch Hitters Used• Pinch Runners Used• Defensive Substitutions• Relief Pitchers: Innings Pitched• Stolen Bases Attempted• Sacrifices Attempted• Pitch Outs Ordered
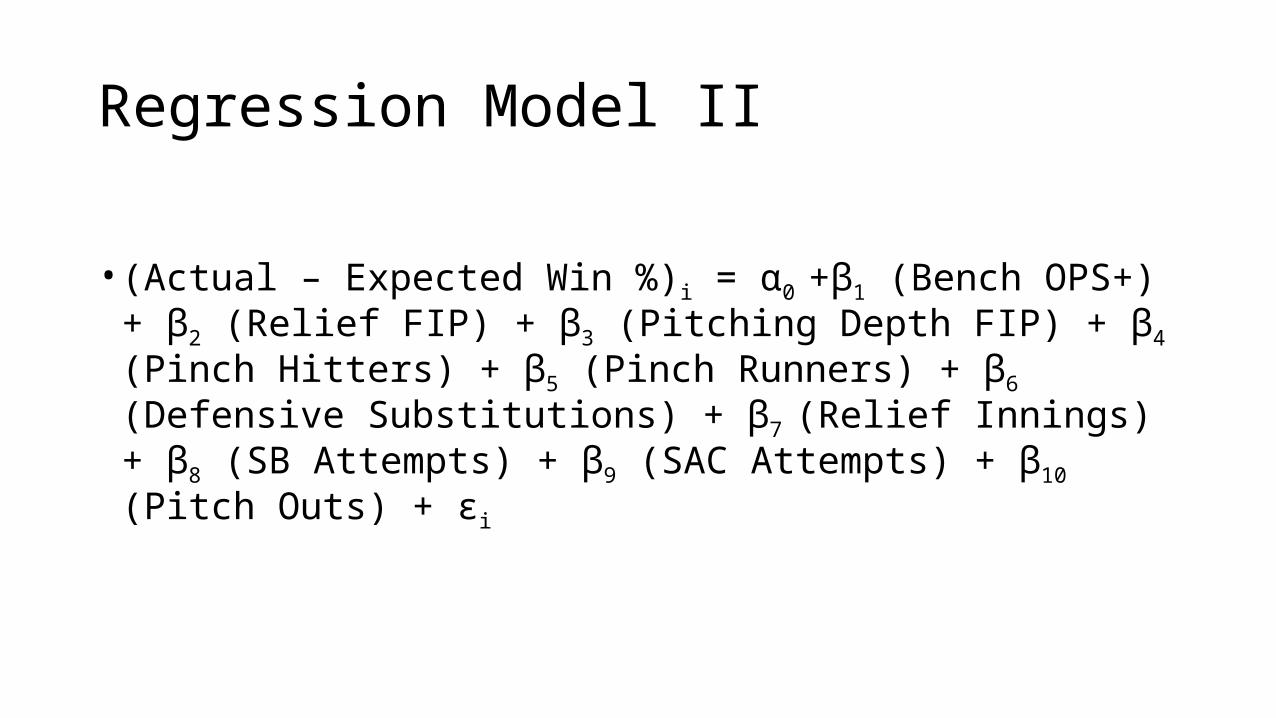
Regression Model II
• (Actual – Expected Win %)i = α0 +β1 (Bench OPS+) + β2 (Relief FIP) + β3 (Pitching Depth FIP) + β4 (Pinch Hitters) + β5 (Pinch Runners) + β6 (Defensive Substitutions) + β7 (Relief Innings) + β8 (SB Attempts) + β9 (SAC Attempts) + β10 (Pitch Outs) + εi
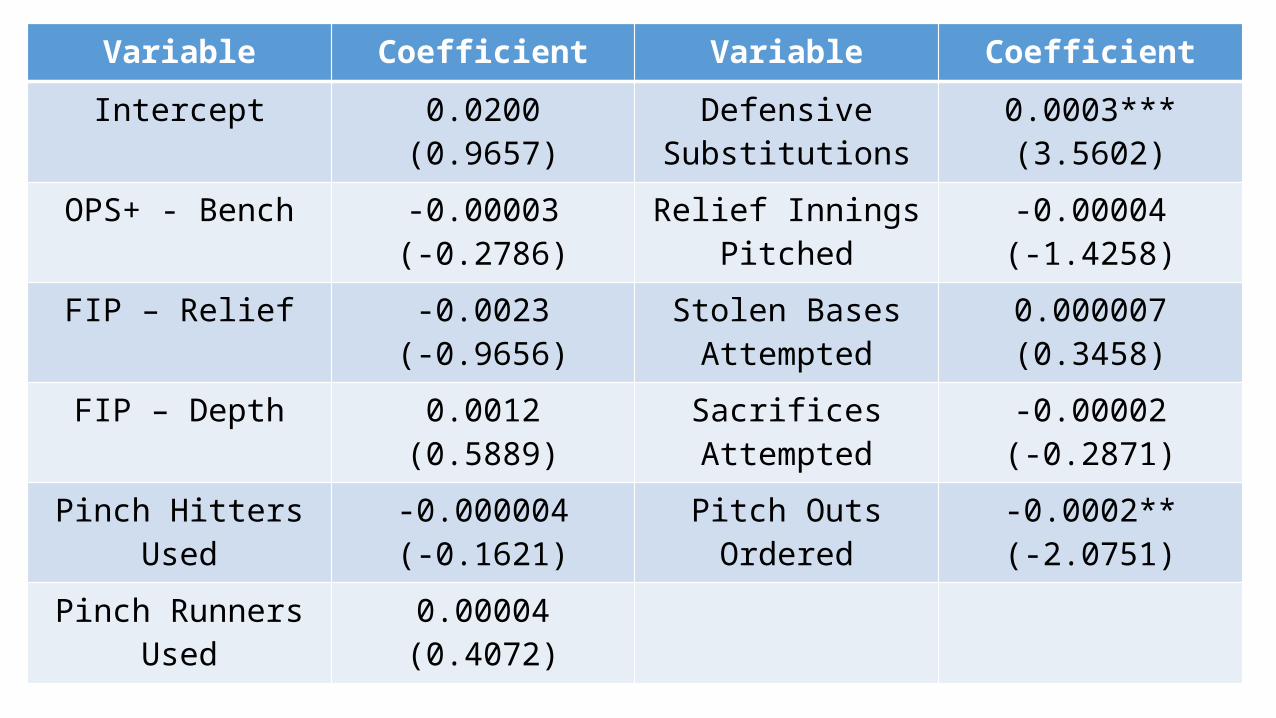
Variable Coefficient Variable Coefficient
Intercept 0.0200(0.9657)
Defensive Substitutions
0.0003***(3.5602)
OPS+ - Bench -0.00003(-0.2786)
Relief Innings Pitched -0.00004(-1.4258)
FIP – Relief -0.0023(-0.9656)
Stolen Bases Attempted
0.000007(0.3458)
FIP – Depth 0.0012(0.5889)
Sacrifices Attempted -0.00002(-0.2871)
Pinch Hitters Used -0.000004(-0.1621)
Pitch Outs Ordered -0.0002**(-2.0751)
Pinch Runners Used 0.00004(0.4072)
Results
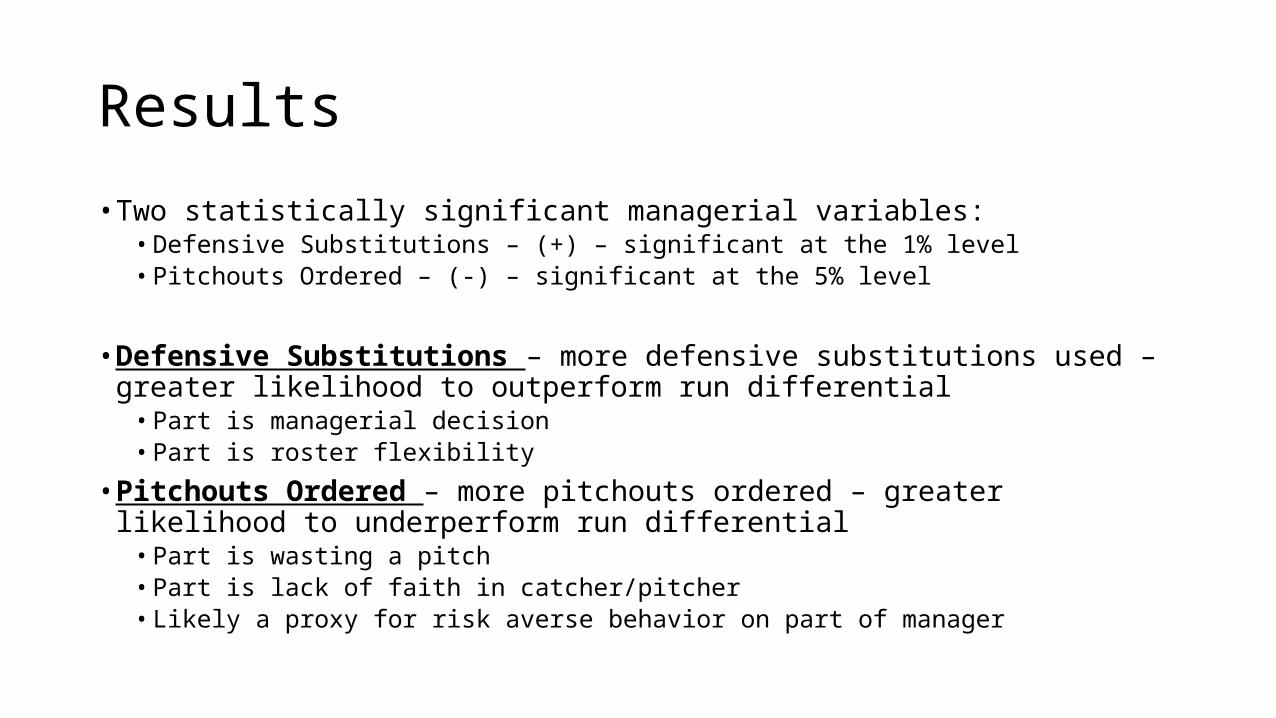
• Two statistically significant managerial variables:• Defensive Substitutions – (+) – significant at the 1% level• Pitchouts Ordered – (-) – significant at the 5% level
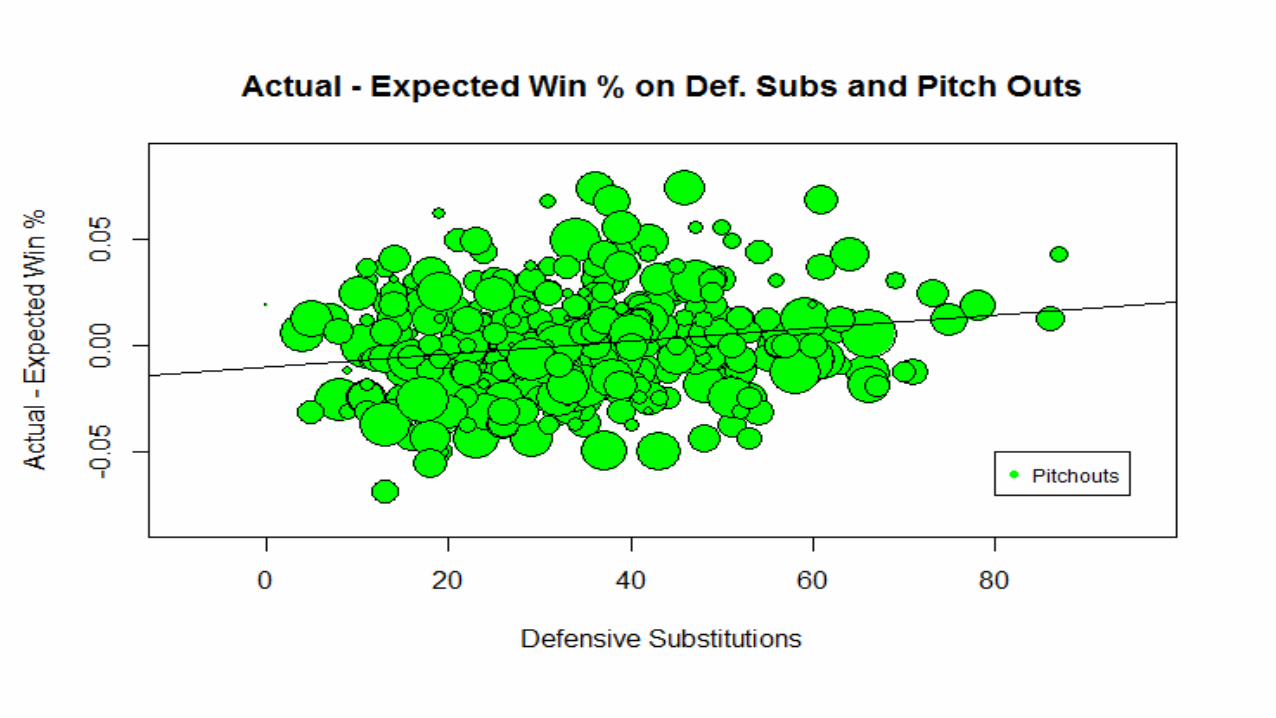
• Defensive Substitutions – more defensive substitutions used – greater likelihood to outperform run differential• Part is managerial decision• Part is roster flexibility
• Pitchouts Ordered – more pitchouts ordered – greater likelihood to underperform run differential• Part is wasting a pitch• Part is lack of faith in catcher/pitcher• Likely a proxy for risk averse behavior on part of manager
Results
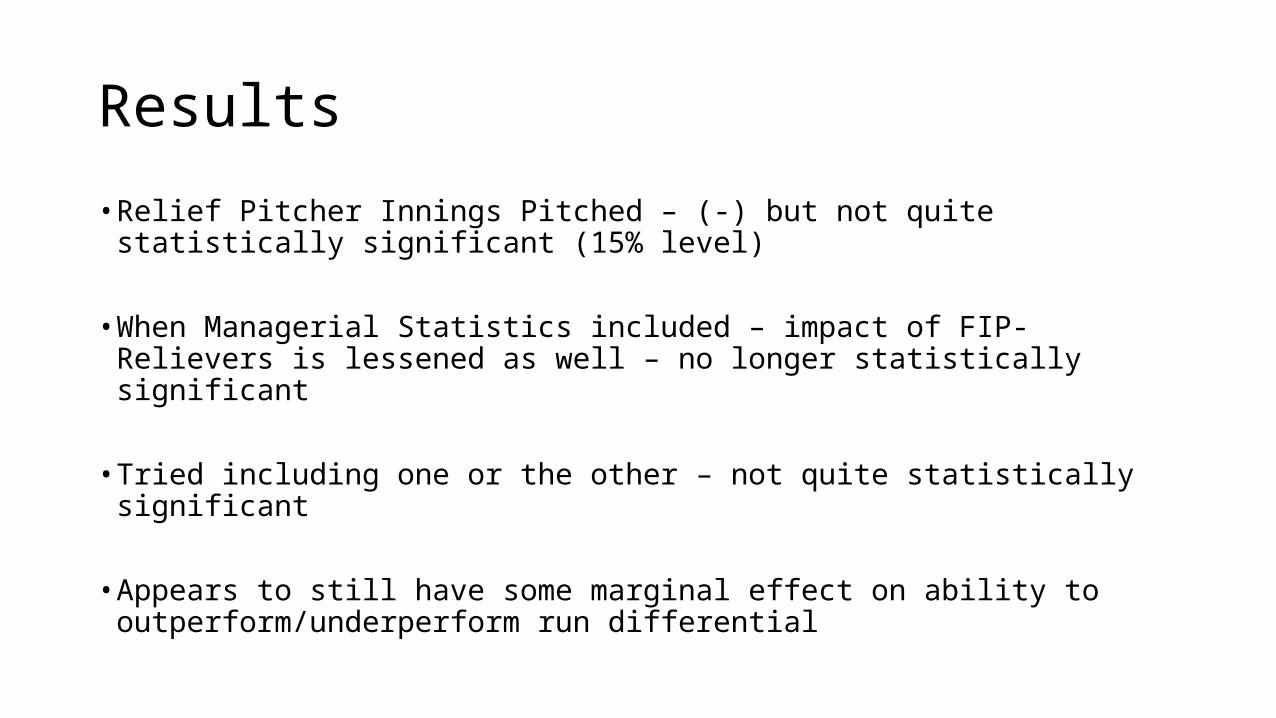
• Relief Pitcher Innings Pitched – (-) but not quite statistically significant (15% level)
• When Managerial Statistics included – impact of FIP-Relievers is lessened as well – no longer statistically significant
• Tried including one or the other – not quite statistically significant
• Appears to still have some marginal effect on ability to outperform/underperform run differential
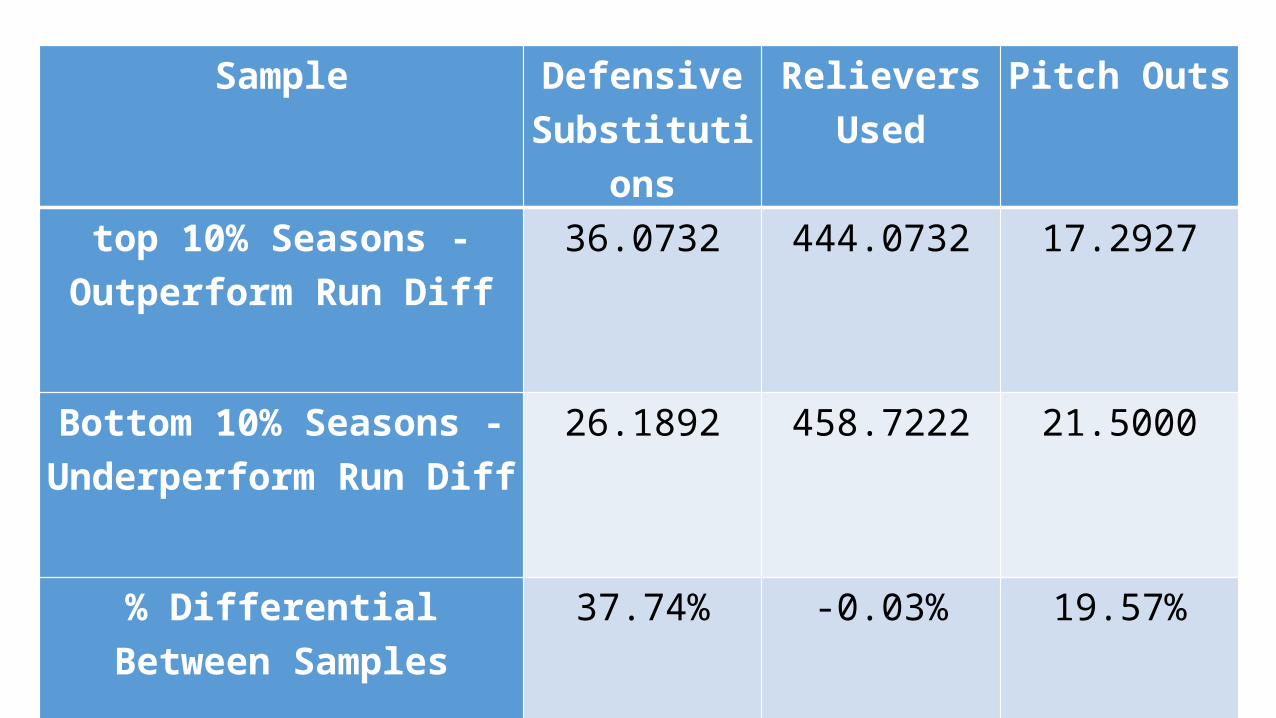
Sample Defensive Substitutions
Relievers Used
Pitch Outs
top 10% Seasons - Outperform Run Diff
36.0732 444.0732 17.2927
Bottom 10% Seasons - Underperform Run Diff
26.1892 458.7222 21.5000
% Differential Between Samples
37.74% -0.03% 19.57%

Anaheim
Arizona
Atlanta
Baltimore
Boston
Chicago
ChicagoNL
Cincinnati
Cleveland
Colorado
Detroit
Florida
Houston
Kansas C
ity
Los A
ngeles
Milwauke
e
Minnesota
New York
New YorkNL
Oakland
Philadelphia
Pittsb
urgh
San Diego
San Francisco
Seattle
St. Louis
TampaTexa
s
Toronto
Wash
ington0
5
10
15
20
25
30
35
40
45
50
Average of Defensive Substitutions Used

Anaheim
Arizona
Atlanta
Baltimore
Boston
Chicago
ChicagoNL
Cincinnati
Cleveland
Colorado
Detroit
Florida
Houston
Kansas C
ity
Los A
ngeles
Milwauke
e
Minnesota
New York
New YorkNL
Oakland
Philadelphia
Pittsb
urgh
San Diego
San Francisco
Seattle
St. Louis
TampaTexa
s
Toronto
Wash
ington0
5
10
15
20
25
30
35
40
Average of Pitchouts Ordered

Conclusions
• Aimed to determine why teams outperform/underperform run differential• Is it just luck? – or are there factors that contribute to its explanation?• Without Manager Data – it appears that Relief Pitcher Performance (measured by
FIP) plays an important role• Increase in FIP by Relievers – more likely to underperform• Decrease in FIP by Relievers – more likely to outperform
• With Manager Data• Defensive Substitutions – more defensive subs – more likely to outperform• Pitchouts – likely proxy for risk aversion (poor catching performance?) – more pitchouts –
more likely to underperform run differential
• Starting point of our research – hope to learn more in future – open to different variables/approaches to help determine answers