why do firms voluntarily have interim financial statements ...iri/papers/gpliu.pdf · 2 why do...
TRANSCRIPT

1
Why Do Firms Voluntarily Have Interim Financial Statements Reviewed by Auditors?
J. Efrim. Boritz School of Accountancy University of Waterloo
Waterloo, On N2L 3G1
Guoping Liu School of Business Management
Ryerson University Toronto, On M5B 2K3
August 01, 2006
2
Why Do Firms Voluntarily Have Interim Financial Statements Reviewed by Auditors?
Abstract This study investigates firm characteristics that are associated with firms’ voluntary decisions to have their quarterly financial statements reviewed by their auditor, utilizing a sample of Canadian public companies. We find that interim financial statements are more likely to be reviewed for firms with high complexity than for firms with low complexity. We also find that firms with high growth opportunities are less likely to be reviewed than those with low growth opportunities, presumably because they may be associated with higher information and litigation risks. However, we document mixed evidence that the likelihood of having interim financial statements reviewed increases in firms’ audit assurance and insurance needs.

3
Why Do Firms Voluntarily Have Interim Financial Statements Reviewed by Auditors?
Introduction
Reporting on interim financial statements originated in the US, where public
accounting firms required an interim review engagement as a condition for undertaking
the year-end audit. Subsequently, the US stock exchanges mandated the engagement
(Krishnan and Zhang, 2004). The reporting problems at Enron and other such scandals
triggered a review of the US interim review standard, resulting in a more focused
engagement, including some audit-oriented procedures. Currently, US SEC registrants
must have timely reviews of their interim financial information except for SEC
registrants that qualify as “foreign private issuers” that are not subject to these mandatory
review requirements.
The Canadian Securities Administrators’ (CSA) optional auditor review regime
results in companies being able to elect whether to have a review engagement on a
quarter by quarter basis. Canadian practices in this area differ from US standards where
US SEC registrants must have timely reviews performed. However, despite the absence
of a requirements to have a review performed, a number of Canadian public companies
have their interim financial statements reviewed.1 Public companies must disclose when
1 A review of SEDAR filings for 400 public companies (100 in each of four categories, as follows) found that 14% of TSX-SEC registrants, 31% of TSX-non-SEC companies, 66% of TSXV-SEC registrants and

4
there has been no review performed and they typically do this by a one line disclosure on
the cover of the financial statements that the financial statements were not reviewed by
the company’s auditor.2
The decision to have a review engagement is a joint decision of the client and
auditor (Krishnan and Zhang 2004). That is, the client may want a review done to reduce
information risk for potential investors but the auditor could recommend that the client not
include the review during a quarter, using the threat of higher fees to discourage the client
from asking for it. Alternatively, the client may not wish to have a review done in order
to avoid incurring the cost or to avoid questions about discretionary accruals or other
estimates made during the quarter but the auditor may use the threat of withdrawing from
the annual financial statement audit engagement to require the client to have a quarterly
review performed. Thus, a review would be performed when the benefits to the auditor and
to the client exceed the costs to both parties.
We investigate the reasons that companies and auditors jointly choose to have
quarterly reviews performed. Our paper is the first to gather data on voluntary quarterly
reviews, as contrasted with voluntary public reports on mandatory reviews as investigated
by Krishnan and Zhang (2004) and studies of review timeliness by Ettredge et al. (1994,
2000a, b).
68% of TSXV-non-SEC companies did not have reviews of their interim financial statements for Q1 of 2005. 2 This disclosure may not adequately distinguish entities that have had a review from those that have not. Because even reviewed financial statements carry the “unaudited” disclaimer, readers may not realize that an additional one-line disclosure, saying that the statements “were not reviewed by the auditor,” implies additional risk.
5
Interim Reporting Practices
While practices vary throughout the world, there is a general trend toward more
frequent disclosure of financial information and continuing disclosure of price-sensitive
information. In Japan, quarterly financial statements are being phased in over a three-year
period (2004-2007). In Europe, although supported by a vast majority of European
investment professionals,3 the introduction of mandatory US style quarterly reporting for
all 7,000 listed companies has been delayed in certain jurisdictions such as the UK, which
gives more weight to continuing disclosure requirements of price-sensitive information.
Instead, listed companies are able to issue general trading statements every quarter and
financial statements twice a year.4,5,6
In Canada, quarterly financial statements must be filed with securities regulators
within 45 days after the end of the quarter (60 days for venture exchange companies).
3 http://www.cfainstitute.org/pressroom/03releases/03quarterly_reporting.html, accessed September 8, 2005. 4 The European Commission’s proposal to have the EU’s 7,000 public companies adopt a quarterly reporting approach similar to that of the US met opposition from several countries such as the UK, the Netherlands and Denmark. Although the form of reporting adopted is different (i.e., companies may file quarterly “trading statements” with a general description of their financial position rather than full-blown financial statements), there is a clear move toward more frequent periodic reporting in addition to the requirements for continuing disclosure of price-sensitive information. 5 The UK Listing Authority requires, as part of the Listing Rules (Section 9.9), companies to prepare a half-yearly report. (www.fsa.gov.uk). Quarterly financial statements are not currently required. The half-yearly report does not require an OFR. All it requires is an explanatory statement including: (a) any significant information enabling investors to make an informed assessment of the trend of the group's activities and profit or loss; (b) information of any special factor that has influenced the group's activities and the profit or loss during the period in question; (c) enough information to enable a comparison to be made with the corresponding period of the preceding financial year; and (d) to the extent possible, a reference to the group's prospects in the current financial year. 6 The EU’s Transparency Directive, which has to be implemented by Member States from 2007, will require more comprehensive half-yearly reports, including an interim “management report” (more like an annual directors’ report than an OFR). This will also require “interim management statements,” providing: an explanation of material events and transactions that have taken place during the relevant period and their impact on the financial position of the issuer and its controlled undertakings; and a general description of the financial position and performance of the issuer and its controlled undertakings during the relevant period.

6
The typical process for interim reporting involves closing off, preparation of
subsidiary/divisional information, preparation of checklists and, where applicable, sub-
certification at divisional/subsidiary level, consolidation, review with disclosure
committee, preparation of package for audit committee/board, review with the audit
committee and, generally, the board. Many companies use checklists to document this
process and assist the business unit/subsidiary. Such checklists can run from 5-18 pages.
Once the quarterly financial package is available, auditors spend three to five days
reviewing it (if engaged to do so). Then, the financial package is brought to the audit
committee for its review and to the board for its approval. Some companies have the
audit committee and board meetings on the same day, while others have the board
meeting the next day so that any issues raised by the audit committee can be addressed
before the board meeting.
The amount of time taken to complete the quarterly reporting process varies
dramatically, even among large sophisticated organizations. Some companies complete
the process in as little as 15 days, while others use the whole 45 days allowed by the
securities regulators (60 days for venture companies).
Under current regulatory requirements (MI 52-109), a company’s CEO and CFO
each must certify that the filings do not contain any untrue statement of a material fact or
omit to state a material fact and that the financial statements, together with the MD&A,
present fairly the issuer’s financial condition, results of operations and cash flows. Under
7
MI 52-110, the audit committee7 must review the interim financial statements, MD&A
and earnings press release before the issuer publicly discloses this information.
Assurance Practices
Canadian securities regulators do not require auditors to conduct a review
engagement on interim financial statements. If a review is not performed, however, they
do require that this be disclosed in a notice accompanying the financial statements.8 Our
review of a sample of public company filings on SEDAR indicates that most TSX-listed
public companies have interim review engagements, although some SEC registrants that
qualify as foreign private issuers opt out of having such a review performed. Overall, we
found the following exception rates: 14% of TSX SEC registrants; 31% of non-SEC
TSX; 66% of non-TSX SEC registrants;9 and 68% of TSXV non-SEC registrants (68%).
It is noteworthy that the opt-out rate is so high for entities that could benefit from
having reviews performed. Such benefits include a more reliable quarterly financial
reporting process and more reliable quarterly financial statements, especially in terms of
the quality of estimates, accruals and earnings, which are key contributors to information
risk. In addition to benefits for the interim reports, there would be flow-through benefits
for the reliability of the annual financial statements and a potential reduction in the
7 While securities regulations permit the board to delegate approval of the interim financial statements and MD&A to the audit committee, some companies require both the board and audit committee to approve these documents. 8 This requirement came into effect in March 2004. Prior to that, it was impossible to distinguish which companies had a review and which ones did not. A review of a sample of interim financial statements for Q1 of 2003 indicated that virtually none of them reported that no review was performed. 9 These include both TSXV-listed and other Canadian companies that are not listed on a Canadian exchange but are listed solely on a US exchange or traded in the US over the counter.

8
frequency of both quarterly and annual financial statement restatements. For many
companies, the additional cost of having quarterly reviews could probably be offset by
potential cost reductions derived from improved financial reporting processes, better
distribution of audit effort and other efficiency gains.
CICA Handbook Section 7050 sets out requirements for a review of interim
financial statements that are very similar to the US standards. Section 7050 sets out the
procedures to be undertaken and provides for an oral or written report to the audit
committee. The work effort prescribed by Section 7050 suggests various procedures,
including some audit procedures associated with an annual audit (e.g., reading
shareholder and director minutes). When auditors conduct a review of interim financial
statements, they must also comply with CICA Handbook Section 7500, which includes a
requirement to read the MD&A to see whether any information is inconsistent with the
financial statements.
Some audit firms exceed the work effort required by the review standard, the
scope being determined by the audit committee and the audit firm. Common issues that
involve additional audit work at quarter ends include revenue recognition, legal claims
and other contingencies, inventory valuations, taxes, accounts receivable allowances,
derivatives, foreign exchange and consolidation issues. The nature and extent of the
additional procedures appears to vary significantly among the firms and, perhaps, among
clients of the same firm. In some cases, the additional work is restricted to enquiry-based
review procedures. In others, however, auditors execute some audit procedures at the
same time as they conduct the review engagement. These could include examination of

9
material transactions undertaken in the period or in respect of the initial application of
accounting policies. When audit procedures are undertaken, documentation is usually
segregated between that required for the review engagement and that prepared as a result
of the procedures conducted as part of the annual audit. When major transactions are
examined, this activity may occur within the reporting period, rather than at its
conclusion.
The time auditors spend at quarter ends varies according to the nature of the
assignment and the extent to which they are involved with the audit committee’s review.
When a client wants a formal report for its audit committee, additional time is required,
as is the case when an audit or additional review procedures are performed. The range
appears to be 2-10 days.
Enquiries that extend to assessing changes in internal control over disclosures
(ICOD) and internal control over financial reporting (ICOFR) could add one to six days
to an engagement (CICA Handbook paragraph 7050.35 requires enquiry about internal
control and changes in internal control). This large range reflects the need for firms to
call in their systems group when there are changes in the IT-based internal control
processes.
Form of reporting
In both Canada and US, the results of the auditor’s reviews are communicated
privately to audit committees. No public reports are issued except in unusual
circumstances. Those communications can be oral or written, although we understand

10
that most are written. Also, when an auditor performs extended procedures during an
interim period, the extent of the procedures and the findings of those procedures are not
required to be communicated to the audit committee.
Overall, auditors report whether, based on their review, they have become aware
of any material modification that needs to be made for the financial statements to be in
accordance with GAAP. This is in contrast to the negative assurance contemplated in the
general review engagement standards. A written report would normally conclude that the
auditor is not aware of any material modification that needs to be made for the interim
financial statements to be in accordance with GAAP. Before that, however, it would
explain that an interim review does not provide assurance that the auditor would become
aware of any or all significant matters that might be identified in an audit. To some, this
appears to be a convoluted, responsibility-avoiding message. Others counter that it is
designed to protect the auditor against litigation driven by unreasonable expectations. A
public report is not contemplated and is specifically precluded via restrictions on the use
of the auditor’s report.
Benefits of Voluntary Review of Interim Financial Statements
Interim financial statements are often not viewed as reliable, discrete, standalone
documents. There are good reasons for this, including seasonality factors that can
produce highly variable quarterly financial results, the lumpy structure of certain
revenues and costs that are received or paid in one quarter but apply to other quarters, and
uncertainties about costs that are not known until the fiscal year end. These factors result

11
in estimations of accruals and deferrals that can make interim financial statements
irrelevant or unreliable as standalone documents. Performing review engagements on
such documents might not appeal to decision makers.
An alternative view is that interim financial statements should be viewed as
discrete documents that should stand on their own (with interim MD&A), with controls
and audit procedures in place to tie down material transactions and events and prevent
shifting income from quarter to quarter through the abuse of accruals, deferrals and
estimates. About a third of the restatements reported by US public companies are
attributable to restatements of interim financial statements.10 Notorious “fourth quarter
adjustments” of accruals made during the previous three quarters can undermine the
credibility of the quarterly reports and the financial reporting system.
A 2004 study by the Huron Consulting Group11 of restatements due to errors
covering both interim and annual financial statements indicates that the overall frequency
of restatements is increasing, with “quarterly restatements” unrelated to annual
restatements being fairly stable but annual restatements rising dramatically. The
implication of this study is that quarterly reviews are not sufficiently rigorous to tie down
key financial statement results so that restatements are not necessary. The Huron
Consulting Group found that, over the five-year period ending in 2004, 75% of
restatements arose in smaller public companies (i.e., those with revenues of less than
10 Huron Consulting Group, 2004 Report on Financial Reporting Matters (February 28, 2005), www.huronconsultinggroup.com, 1-866-229-8700. 11 Huron Consulting Group, 2004 Report on Financial Reporting Matters.

12
$500 million, with more than half of these companies having revenues under $100
million).12
On the surface, it appears that smaller public companies often have limited
financial expertise in-house and should benefit from a review of their quarterly financial
statements as the auditor could keep in touch with the company’s accounting issues
throughout the year. Some commentators question the need for additional credibility in
the Venture exchange, however. A study carried out on behalf of the Ontario Securities
Commission by Charles River Associates suggests that, due to a form of “branding” of
stock exchanges, investors may compensate for the financial reporting risks associated
with venture exchange companies when making their investment and may suffer no harm
as a result of financial statement restatements that are not really representative of an
entity’s value.13
The quality of interim financial statements is a joint result of interim financial
reporting standards, the preparer’s financial expertise and integrity and the rigour of the
review process. Interim reviews of public company financial statements are based on
audit-based knowledge but require only enquiry, discussion and analysis. Such
procedures may not be sufficient to establish that material transactions, such as business
combinations, restructuring provisions, major contracts, lawsuits and other such material
events are accounted for properly in the quarter. That could result in fourth-quarter
adjustments, when more focused audit procedures are actually performed on those events
12 Huron Consulting Group, 2004 Report on Financial Reporting Matters. 13 Charles River Associates Canada Ltd., The Cost and Benefits of Management Reporting and Auditor Attestation on Internal Controls over Financial Reporting (April 2004).

13
and transactions. Such adjustments can cast doubt on the integrity of the financial
reporting system and the value of quarterly reports.14
The minimum review procedures under section 7050 might not add sufficient
value to the interim reporting of entities that currently are not having reviews done and
some securities regulators in Canada would like to see the work effort prescribed in the
current review engagement standard expanded. This is consistent with many companies’
existing practices. To avoid surprise fourth-quarter restatements, they often request that
auditors perform more than the minimum effort required by Section 7050. Since there are
no established standards for the extended procedures, however, the extent of the
additional procedures can vary from auditor to auditor and even from client to client for
the same auditor.
Research Question
Why do some firms voluntarily choose to have a review performed by their
auditor, while others do not? We hypothesize that firm complexity, economic prospects,
auditor pressure and cost would contribute to firms’ choices.
14 A study by Joshua Livnat and Christine Tan (“Restatements of Quarterly Earnings: Evidence on Earnings Quality and Market Reactions to the Originally Reported Earnings” Unpublished Manuscript Stern School of Business Administration, 2004) of restatements of quarterly earnings by US companies between 1988 and 2002 reports a quarterly restatement rate of 3.4%. (Note that companies with mergers and acquisitions, discontinued operations and fiscal-year changes were specifically excluded.) Quarterly restatements are typically smaller than annual restatements and are often not announced in press releases, becoming known only when a Form 8-K is filed with earnings that differ from those released in the quarterly earnings announcement. The restating companies are generally smaller. Most (62%) of the restatements are downward to correct previously overstated earnings. The most frequently restated components of earnings were cost of goods sold and tax expense. The fourth quarter had noticeably fewer restatements than the other quarters, presumably due to the auditor’s involvement in that quarter. (Note that, during most of the period of the study, auditors were not required to perform a “timely” quarterly review (i.e., at the end of the quarter the financial statements were issued), but could do it “in retrospect” as part of their annual/fourth quarter audit. This was changed starting March 15, 2000.)

14
(Hypothesis 1) Complexity of firms: Auditor review may provide information for
managers of firms with high complexity to better manage and control their business
operations. Moreover, the complexity of firms increases agency costs, thus enhancing
owners’ and creditors’ demand for auditor assurance (Simunic and Stein 1987; Abdel-
khalik 1993; Hay and Davis 2004). So, we predict that the demand for auditor review is
positively associated with the complexity of a firm.
(Hypothesis 2) Growth opportunities: Corporate governance research argues that the cost
of monitoring firms with high growth opportunities is relatively higher because outsiders
are ineffective in monitoring such firms (Gaver and Gaver 1993; Lehn, Patro and Zhao
2003; Yang, Linck and Netter 2004 ). Managers use accounting discretion for
opportunistic manipulation (i.e., opportunism) or communicating private inside
information (i.e., signalling). Since the information asymmetry between auditors and
clients is high for such firms, the value of audit review would be lower. So, we predict
that the demand for auditor review is negatively associated with the growth opportunities
of a firm.
(Hypothesis 3) Assurance and insurance needs: Auditing can provide not only assurance
services but also a type of insurance service (Doogar, Sougiannis and Xie 2003; Asthana,
Balsam and Krishnan 2003). We predict that the demand for auditor review is positively
associated with the assurance and insurance needs of a firm.

15
We consider leverage, auditor, US cross-listing and Venture exchange and industry as
control variables in the model.
Research Design
Model
We run the following logistic regression to test H1 to H3: Review = b0+b1Size+b2Invrec+b3MB+ b4Chgtac +b5FCF+b6ROA+ b7Lev +b8Auditor + b9Uslist + b10TSXV+Industry Dummies + error (1) where,
Review = 1 if the interim financial statements are reviewed by auditors and 0 otherwise;
Size = the log of total assets; Invrec = (inventory + receivables) / total assets; MB = the market value of equity / the book value of equity; Chgtac = change in total accruals for the latest two fiscal years prior to the interim
financial statements, where total accruals are calculated by (Income before extraordinary items – net cash flows from operating activities) / Total assets;
FCF = (Net cash from operating activity + interest paid + net cash flow from investing activity – capitalized interest )/Total assets;
ROA = Income before extraordinary items / Total assets; Lev = long-term debt / total assets; Auditor = 1 if the auditor is Big 4 and 0 otherwise; Uslist = 1 if the company’s shares are publicly traded in US and 0 otherwise; TSXV = 1 if the company is a TSE Venture company and 0 otherwise; Industry dummies = the dummies for two-digit SIC industries in which there are at
least 10 observations in the sample.
Following Knechel, Niemi and Sundgren (2005), we use firm size (Size) and the
ratio of inventory and receivables to total assets (Invrec) to proxy for complexity of a
firm.

16
Based on corporate governance research (e.g., Lehn, Patro and Zhao 2003; Yang,
Linck and Netter 2004), we use the ratio of market value of equity to book value of
equity (MB) to reflect the extent of growth opportunities.
Following DeAngelo (1986), we use the change in total accruals (Chgtac) to
reflect the extent of assurance needs for audit. Following Doogar, Sougiannis, and Xie
(2003), we use free cash flow (FCF) to reflect the extent of either insurance or assurance
value of audit.
We include the variables: ROA, Lev, Auditor, Uslist, and TSXV in the model to
control for the potential effects of firm performance, corporate financing policy, auditor
type, and listing status on companies’ incentives to have their interim financial statements
reviewed. We also add industry dummies in the model to control for industry effects.
Given that the demand for audit review is higher for firms with high complexity
(H1), we expect that both b1, the coefficient on firm size, and b2, the coefficient on the
ratio of inventory and receivables to total assets, would be positive and significant.
We also expect a negative and significant coefficient (b3) for the market-book
ratio as our H2 predicts that the demand for audit review is higher for firms with high
growth opportunities.
The coefficient on the change in total accruals, b4, would be positive and
significant and the coefficient on free cash flows, b5, would also be positive and
significant given that the demand for audit review is higher for firms with high audit
assurance and insurance value (H3).

17
Sample selection
The sample selection started with 400 randomly selected Canadian companies that
publicly filed their 2005 Q1 financial statements on SEDAR. We randomly select 100
companies from each of four segments or layers of Canadian public companies: (Layer1)
TSX-listed companies that are SEC registrants; (Layer2) TSX-listed companies that are
not SEC registrants; (Layer3) Canadian companies that are SEC registrants but are not
listed on the TSX; (Layer4) Other Canadian public companies that are not TSX
companies and are not SEC registrants. Next, we merged the sample of 400 companies
with the Canadian portion of Compustat North American, and generated a sample of 353
companies with data available on Compustat for the fiscal year of 2004. Since the audit
review of quarterly financial statements is mandatory for SEC 10-Q filers, we deleted 26
companies, reducing the sample to 327 companies. Finally, we deleted 61 companies
that had missing data in Compustat for the calculation of variables used in the analysis.
The final sample consists of 266 Canadian firms. We reviewed the interim
financial statements published on SEDAR to identify whether these firms’ 2005 Q1
financial statements had been reviewed by the company’s auditor.15 Table1, Panel A,
reports that 110 (41.4%) companies disclosed that their 2005 Q1 financial statements
were not reviewed by the company’s auditor, compared to 156 (58.6%) companies that
voluntarily had their 2005 Q1 financial statement reviewed by the company’s auditor.
15 Oral reporting as contemplated by Section 7050 can lead to vagueness as to whether or not a complete review in accordance with Section 7050 was conducted. This can lead to anomalies in situations where a company that has not had a formal Section 7050 review sends the interim financial statements to its auditor to read. In some such cases, companies may not include a notice in their interim filings to the effect that no review was performed because they believe that any auditor involvement with interim financial statements constitutes a review, taking comfort in the fact that the statement are marked “unaudited.”

18
Table 1, Panel B, shows that our sample consists of 75 (28.2%) TSX-listed/SEC registrants,
88 (33.1%) TSX-listed/non-SEC registrants firms, 22 (8.3%) non-TSX-listed/SEC registrants,
and 81 (30.4%) non-TSX-listed/non-SEC registrants firms. Table 1, Panel C, reports the
frequency and percent of the sample firms across each SIC industry division. Overall,
our sample includes firms from a variety of industries, including Manufacturing (35%),
Mining (29.3%), Services (11.3%), Transportation (9%), Finance, insurance, and real
estate (7.9%), among many others.
Analysis
Descriptive statistics and comparisons
Table 2, Panel A, presents descriptive statistics on continuous variables and their
comparisons between firms with audit review and firms without audit review. The mean
(median) log of total assets (Size) (million $ amount) is 5.21 (5.34) for reviewed firms
and 2.50 (2.56) firms not reviewed, respectively. T-test and Wilcoxon rank-sum test
show that reviewed firms are significantly larger than firms not reviewed (t=8.53,
z=7.64).
We find that the mean (median) free cash flows (FCF) is -0.16 (-0.06) for
reviewed firms and -0.34 (-0.17) for firms without audit review. The mean and median
FCF for reviewed firms are significantly greater than firms not reviewed (t=2.50,
z=2.82), suggesting that firms with audit review have less difficulty in generating cash
flows than firms without audit review.

19
Furthermore, the mean (median) of return on assets (ROA) is -0.13 (0.01) for
reviewed firms and -1.93 (-0.10) for firms not reviewed. The differences in mean
(median) ROA are also significant between reviewed and not reviewed firms (t=2.30,
z=4.53). Thus, reviewed firms seem to have better earnings performance than firms not
reviewed.
Table 2, Panel B, presents the frequency distributions of Big 4 auditors versus
non-Big 4 auditors, cross-listing firms versus non-cross listing firms, and TSX venture
firms versus non-TSX venture firms. Overall, 182 (68%) of our 266 sample firms have
Big 4 auditors, 97 (36%) firms are cross-listed in both Canadian and US stock markets,
and 103 (39%) firms are TSX Venture firms. We find that roughly 2/3 (68%) of our Big
4 client firms chose to purchase quarterly review of financials statements, whereas a
similar percentage of non-Big 4 clients (61%) chose not to do so. We also find that a
majority of cross-listed firms (69%) have auditor reviewed quarterly reports, although
non-US listed Canadian firms are not much different on whether to purchase quarterly
review (53% vs. 47%). Moreover, 76% of our TSX firms had their financial statements
reviewed by auditors, compared to only 31% of TSX Venture firms who made the same
decision.
In summary, we document that firms with audit review and those without audit
review are different in some characteristics using descriptive analysis. Next, we use
regression analysis to test our hypotheses.

20
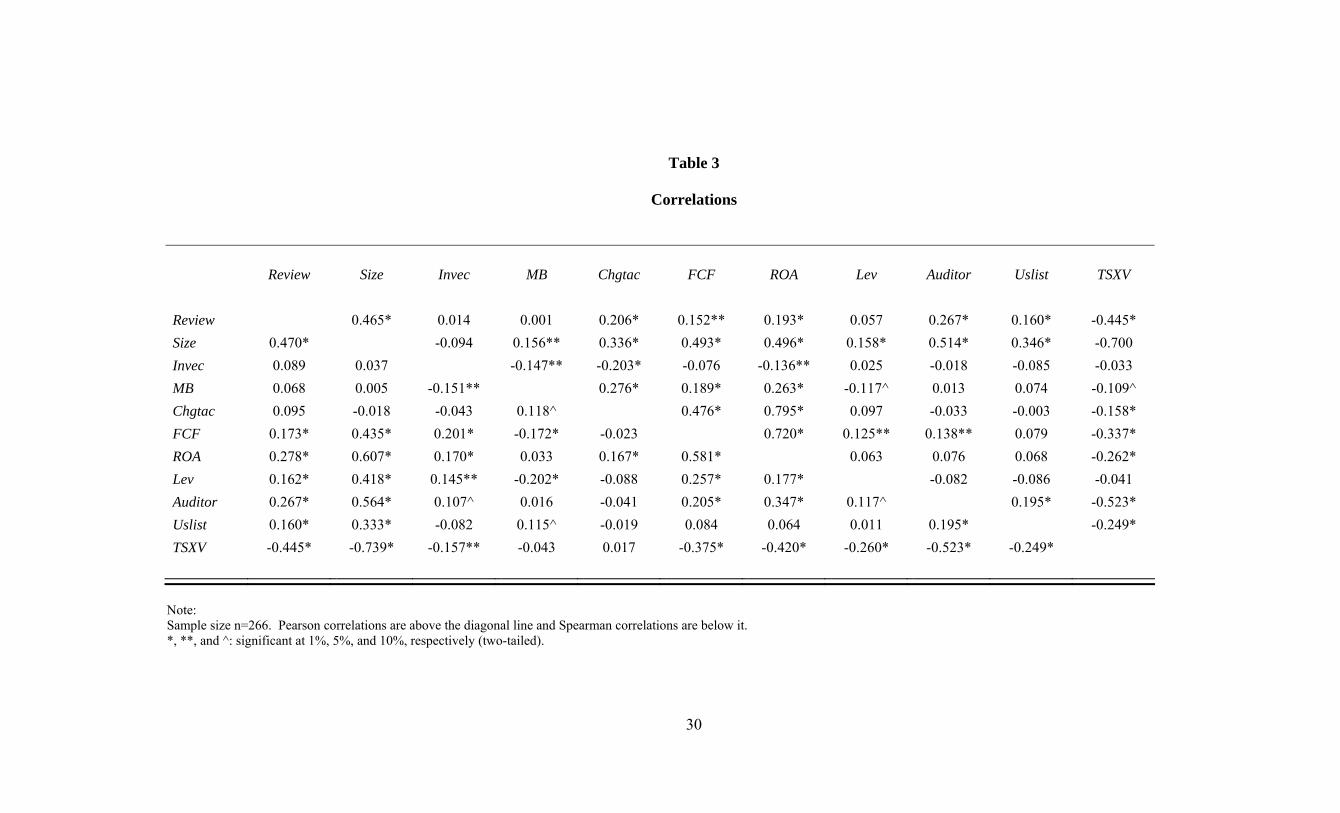
Correlations
Table 3 presents the correlations among all variables. We find that audit review
and firm size are significantly correlated using both parametric and nonparametric
correlation statistics (Pearson=0.465, Spearman=0.470).
Likewise, audit review is also significantly correlated with free cash flows
(Pearson=0.152, Spearman=0.173), return on assets (Pearson=0.193, Spearman=0.278),
auditor type (Pearson=0.267, Spearman=0.267), US listing (Pearson=0.160,
Spearman=0.160), and TSX venture status (Pearson=-0.445, Spearman=-0.445),
respectively. These findings are similar to the results in the descriptive analysis.
In addition, we find significant correlations between ROA and Chgtac
(Pearson=0.795, Spearman=0.167), and between ROA and FCF (Pearson=0.720,
Spearman=0.581), indicating that Chagtac and FCF are both highly correlated with ROA.
Thus, we will consider the multicollinearity issue for ROA in the following regression
analysis.
Regression analysis
We run logistic regressions to test the three hypotheses. Unlike the descriptive
analysis and the correlation analysis, the regression analysis controls for the potential
effects of various firm characteristics including industry dummies.
Table 4 presents results from the regression. First, we run a logistic regression
including ROA as a control variable (Specification 1). Column 3 and 4 in Table 4 report
the coefficients and Wald-statistics for Specification 1. We find that the coefficients on

21
firm size (Size) and the ratio of inventory and receivables to total assets ( Invrec) are 0.47
(Wald-statistics=15.85, p<0.01) and 1.02 (Wald-statistics=1.67, p<0.10) respectively.
This evidence is consistent with H1, suggesting that the demand for audit review is higher
for firms with high complexity than for firms with low complexity.
We also find that consistent with H2, the coefficient on the ratio of market value
to book value of equity (MB) is -0.05 and significant at 10% level (Wald-statistic=2.43).
Hence, the demand for audit review is higher for firms with high growth opportunities
than for firms with low growth opportunity when MB is used as a proxy for growth
opportunity.
Moreover, we document that the coefficient on the change in total accruals
(Chgtac) is 1.45 and significant at 1% level (Wald-statistic=6.39), consistent with the
conjecture (H3) that the demand for audit review is higher for firms with high audit
value. However, we find that the coefficient on free cash flows (FCF) is -0.74 and is
significant at 5% level (Wald-statistic=3.33), inconsistent with H3. Additionally, we also
find that the coefficient on TSX venture variable (TSXV) is -1.03 and significant at 1%
(Wald-statistic=5.60), suggesting that TSX venture firms are less likely to have their
interim financial statements reviewed by auditors.
By considering the potential multicollinearity effects due to the high correlations of
ROA with Chagtac and FCF respectively, we run the regression again after dropping
ROA from the model (Specification 2). Column 5 and 6 in Table 4 report the coefficients
and Wald-statistics for Specification 2. Our findings are consistent with those obtained
from Specification 1. Specifically, we document that the coefficients on Size and Invrec

22
are 0.46 and 1.01 respectively, and significant at 1% and 10% levels (Wald-
statistics=15.80 and 1.65, respectively). Similarly, we find a significant negative
coefficient on MB (b3=-0.05, Wald-statistic=2.50, p<0.10) that supports H2. Likewise,
we find mixed evidence on H3. The coefficients on Chgtac and FCF are 1.412 and -
0.798 respectively, and significant at 1 % and 5 % levels (Wald-statistics=6.19 and 4.63,
respectively). In addition, we also find that the coefficient on TSXV is -1.042 and
significant at 1% (Wald-statistic=5.71).
Concluding Remarks
Our study provides descriptive information about Canadian public companies that
voluntarily choose to have review engagements performed on their quarterly financial
statements. In addition, we provide evidence supporting our hypotheses that the
complexity of a firm and its growth opportunities affect the incentives of the firm to have
its interim financial statements reviewed by its auditors and for the auditors to perform
such a review.
Currently, Canadian regulators object to the absence of a published review
engagement report on the grounds that assurance engagements should communicate the
scope of work done and assurance provided. Some auditors agree that a written report
attached to the interim financial statements would be preferable; however, because it
tends to add rigour to the engagement, encouraging compliance with, and documentation
of, all suggested procedures, including management’s representations, it may add costs
and time to the review process. Discussions with preparers indicate that the full 45-day

23
period between the end of the quarter and the filing deadline is often required to complete
the pre-filing review process.
Some auditors fear that publicly reporting the results of reviews of interim financial
statements can lead to a new expectation gap, especially if managements and audit
committees believe that interim engagements with public reporting will result in lower
annual audit fees and will guarantee that no errors in the first three quarters will be
detected during the year-end audit. Thus some audit firms are concerned about litigation
risk if the interim review report becomes a public report. The concerns are based on the
limited nature of the work performed in a review and the difficulty of conveying the
nature of the review engagement to users removed from the entity’s management and
governance processes. They worry about the prospect of an expectation gap that could
lead to blaming the auditor for failing to identify accounting problems discovered after
the financial statements are filed. Regulators counter that the liability cap results in little
potential financial penalty for the auditor.
While currently there is no public reporting of interim reviews in the US, the
recently approved international standard requiring such reporting met with no opposition
from the major firms and professional associations such as the AICPA and CICA.16 The
International Auditing and Assurance Standards Board has approved a standard that
would require auditors to provide a written published report similar to the report to the
audit committee set out in Section 7050 of the CICA Handbook and the AICPA’s SAS
100. Evidence provided by Krishnan and Zhang (2004) for US public companies
16 http://www.ifac.org/IAASB/ProjectHistory.php?ProjID=0011.

24
indicates that currently very few choose to voluntarily provide review engagement
reports, presumably due to concerns about litigation risk. However, this is in the context
of mandatory review of quarterly financial statements. The proposed international
standards do not assume mandatory review requirements. They merely mandate public
reporting when a review engagement is performed. Thus, a natural extension to this
study, once new reporting requirements are in place, would be to determine their impact
on voluntary adoption of review engagements.
In addition, formal public reporting on quarterly financial statements could
introduce delays in reporting as auditors seek to mitigate any risks related to such
reporting. Presumably, delays could reflect on the quality of the companies’ financial
reporting processes. However, regardless of the reason, delays could be undesirable to
investors and analysts seeking timely reports and this could lead management to choose
to forego a review in the interest of preserving timely reporting. Thus, another extension
of this study could be to explain observed delays in reporting by companies that provide
voluntary reviews of quarterly financial statements compared with those that opt out.

25
References Abdel-khalik, A. R. 1993. Why do private companies demand auditing? A case for
organizational loss of control. Journal of Accounting, Auditing & Finance, 8(1): 31-52.
Asthana, S. C., S. Balsam, and J. Krishnan. 2003. Audit firm reputation and client stock
price reactions: Evidence from the Enron experience. Working paper, Temple University, Philadelphia, FA.
Charles River Associates Canada Ltd., The Cost and Benefits of Management Reporting
and Auditor Attestation on Internal Controls over Financial Reporting (April 2004). DeAngelo, L. 1986. Accounting numbers as market valuation substitute: A study of
management buyouts of public stockholders. The Accounting Review, 61(July): 400-420.
Doogar, R., T. Sougiannis, and H. Xie. 2003. The impairment of auditor credibility:
Stock market evidence from the Enron-Andersen saga. Working paper, University of Illinois at Urbana-Champaign.
Ettredge, M., D. Simon, D. Smith, and M. Stone. 1994. Why do companies purchase
timely quarterly reviews? Journal of Accounting and Economics, 18 (September): 131-156.
Ettredge, M., D. Simon, D. Smith, and M. Stone. 2000a. The effect of the external
accountant's review on the timing of adjustments to quarterly earnings. Journal of Accounting Research, 38 (Spring): 195-207.
Ettredge, M., D. Simon, D. Smith, and M. Stone. 2000b. Would switching to timely reviews
delay quarterly and annual earnings releases? Review of Quantitative Finance and Accounting, 14 (March): 111-130.
Gaver, J. J., and K. M. Gaver. 1993. Additional evidence on the association between
investment opportunity set and corporate financing, dividend, and compensation polices. Journal of Accounting & Economics, 16: 125-160.
Hay, D., and D. Davis. 2004. The voluntary choice of an auditor of any level of quality.
Auditing: A Journal of Practice and Theory, 23(2): 37-53. Huron Consulting Group, 2004 Report on Financial Reporting Matters (February 28,
2005), www.huronconsultinggroup.com, 1-866-229-8700.

26
Knechel, R., L. Niemi, and S. Sundgren. 2005. Attributes affecting auditor choice. Working paper (presented at 2005 AAA Annual Meeting), University of Florida.
Krishnan, J., and Y. Zhang. 2004. Auditor Litigation Risk and Corporate Disclosure of
Quarterly Review Report. Unpublished manuscript, Department of Accounting, Fox School of Business and Management, Temple University.
Lehn, K., S. Patro, and M. Zhao. 2003. Determinants of the size and structure of
corporate boards: 1935-2000. Working paper, University of Pittsburgh. Livnat, J., and C. Tan. 2004. Restatements of Quarterly Earnings: Evidence on Earnings
Quality and Market Reactions to the Originally Reported Earnings. Unpublished manuscript, Stern School of Business Administration.
Simunic, D. A., and M. T. Stein. 1987. Product Differentiation in Auditing: Auditor
Choice in the Market for Unseasoned New Issues. Vancouver, BC, CGA Research Foundation.
Yang, T., J. S. Linck, and J. M. Netter. 2004. A large sample study on board changes
and determinants of board structure. Working paper, University of Georgia.

27
Table 1
Sample Descriptions
Panel A: Frequencies and percents of firms whose 2005 Q1 financial statements were
reviewed or not reviewed by auditors Frequency Percent Audit Review Firms 156 58.6% Non-Audit Review Firms 110 41.4% Total 266 100.0% Panel B: Frequencies and percents of firms in each sample layer Frequency Percent Layer1: TSE-listed/SEC registrants 75 28.2% Layer2: TSE-listed/non-SEC registrants 88 33.1% Layer3: non-TSX-listed/SEC registrants 22 8.3% Layer4: non-TSX-listed/non-SEC registrants 81 30.4% Total 266 100.0% Panel C: Frequencies and percents of firms across SIC industry divisions Frequency Percent Manufacturing 93 35.0% Mining 78 29.3% Services 30 11.3% Transportation 24 9.0% Finance, insurance, and real estate 21 7.9% Wholesale trade 8 3.0% Retail trade 7 2.6% Public administration 3 1.1% Agriculture, forestry, and fishing 1 0.4% Construction 1 0.4% Total 266 100.0%

28
Table 2
Descriptive Statistics and Comparisons Panel A: Descriptive statistics and comparisons on continuous variables between firms with
and without audit review
Variable Group N Mean Median Std.
Deviation t score z score Size Reviewed 156 5.21 5.34 2.70 8.53* 7.64* Not reviewed 110 2.50 2.56 2.33 Invec Reviewed 156 0.21 0.14 0.21 0.22 1.45 Not reviewed 110 0.21 0.12 0.24 MB Reviewed 156 1.82 2.00 4.49 0.01 1.11 Not reviewed 110 1.81 1.55 7.49 Chgtac Reviewed 156 0.04 0.00 0.23 3.42* 1.55 Not reviewed 110 -0.35 0.01 1.39 FCF Reviewed 156 -0.16 -0.06 0.47 2.50** 2.82* Not reviewed 110 -0.34 -0.17 0.72 ROA Reviewed 156 -0.13 0.01 0.53 2.30** 4.53* Not reviewed 110 -1.93 -0.10 9.74 Lev Reviewed 156 0.17 0.11 0.22 0.92 2.63* Not reviewed 110 0.15 0.01 0.26

29
Table 2 (Continued) Panel B: Frequency distributions and chi-square tests on dummy variables between firms with
and without audit review Big 4 auditor Non-Big 4 auditor Total χ2
Reviewed 123(68%) 33(39%) 156(59%) 18.98* Non-reviewed 59(32%) 51(61%) 110(41%) Total 182(100%) 84(100%) 266(100%) US listed Non-US listed Total χ2
Reviewed 67(69%) 89(53%) 156(59%) 6.84* Non-reviewed 30(31%) 80(47%) 110(41%) Total 97(100%) 169(100%) 266(100%) TSX TSX venture Total χ2
Reviewed 124(76%) 32(31%) 156(59%) 52.71* Non-reviewed 39(24%) 71(69%) 110(41%) Total 163(100%) 103(100%) 266(100%)
Note: *, **: significant at 1% and 5%, respectively (two-tailed).
30
Table 3
Correlations
Review Size Invec MB Chgtac FCF ROA Lev Auditor Uslist TSXV Review 0.465* 0.014 0.001 0.206* 0.152** 0.193* 0.057 0.267* 0.160* -0.445* Size 0.470* -0.094 0.156** 0.336* 0.493* 0.496* 0.158* 0.514* 0.346* -0.700 Invec 0.089 0.037 -0.147** -0.203* -0.076 -0.136** 0.025 -0.018 -0.085 -0.033 MB 0.068 0.005 -0.151** 0.276* 0.189* 0.263* -0.117^ 0.013 0.074 -0.109^ Chgtac 0.095 -0.018 -0.043 0.118^ 0.476* 0.795* 0.097 -0.033 -0.003 -0.158* FCF 0.173* 0.435* 0.201* -0.172* -0.023 0.720* 0.125** 0.138** 0.079 -0.337* ROA 0.278* 0.607* 0.170* 0.033 0.167* 0.581* 0.063 0.076 0.068 -0.262* Lev 0.162* 0.418* 0.145** -0.202* -0.088 0.257* 0.177* -0.082 -0.086 -0.041 Auditor 0.267* 0.564* 0.107^ 0.016 -0.041 0.205* 0.347* 0.117^ 0.195* -0.523* Uslist 0.160* 0.333* -0.082 0.115^ -0.019 0.084 0.064 0.011 0.195* -0.249* TSXV -0.445* -0.739* -0.157** -0.043 0.017 -0.375* -0.420* -0.260* -0.523* -0.249*
Note: Sample size n=266. Pearson correlations are above the diagonal line and Spearman correlations are below it. *, **, and ^: significant at 1%, 5%, and 10%, respectively (two-tailed).

31
Table 4
Logistic Regressions
Specification 1 Specification 2
Variable Predicted sign Coefficient Wald-stat Coefficient Wald-stat Constant ? -1.55 4.69** -1.53 4.60
Size + 0.47 15.85* 0.46 15.80*
Invec + 1.02 1.67^ 1.01 1.65^
MB - -0.05 2.43^ -0.05 2.50^
Chgtac + 1.45 6.39* 1.41 6.19*
FCF + -0.74 3.33** -0.80 4.63**
ROA ? -0.06 0.21 n/a n/a
Lev ? -0.26 0.13 -0.24 0.11
Auditor ? -0.22 0.27 -0.21 0.26
Uslist ? -0.07 0.04 -0.06 0.03
TSXV ? -1.03 5.60* -1.04 5.71*
Industry dummies Included Included
N 266 266 -2 Log likelihood 266.78 266.87
Chi-square 93.98* 93.89*
Note: *, **, and ^: significant at 1%, 5%, and 10%, respectively (one-tailed).