who receives ipo allocations? an analysis of “regular ...finance/020601/news/fische paper.pdf ·...
TRANSCRIPT
Who Receives IPO Allocations? An Analysis of
“Regular” Investors
Ekkehart Boehmer New York Stock Exchange
[email protected] 212-656-5486
Raymond P. H. Fishe
University of Miami [email protected]
305-284-4397
Mailing address:
University of Miami School of Business Administration
Department of Finance P.O. Box 248094
Coral Gables, FL 33124 305-284-4397 office
305-284-4800 fax [email protected]
Revised: March 2003 Preliminary Draft - Not for distribution
This work began when Ekkehart Boehmer was a staff member and Pat Fishe was a Visiting Academic Scholar at the U.S. Securities and Exchange Commission (SEC). The Securities and Exchange Commission, as a matter of policy, disclaims responsibility for any private publication or statement by any of its employees. The views expressed herein are those of the authors and do not necessarily reflect the views of the Commission or the authors’ former colleagues upon the staff of the Commission. All errors are our own responsibility.

Abstract
We analyze 1.56 million account allocations in a sample of 265 initial public offerings (IPOs) to investigate the importance of on-going relationships between investors and underwriters. We find a sizable set of both institutional and retail investors who receive frequent allocations in IPOs. However, regular institutional investors receive more frequent allocations in hot IPOs compared to regular retail investors, suggesting that institutions provide more than just a dependable capital source to underwriters. We also develop measures of the reliance on regular investors in IPOs and find no relationship between these measures and underpricing of IPOs.
Keywords: Initial Public Offerings, Allocations, Regular Investors,
Underpricing
JEL classification: G12, G24
Who Receives IPO Allocations? An Analysis of “Regular” Investors
I. INTRODUCTION
Regular investors are thought to play an important role in the initial public offering (IPO) process.
A “regular” investor is one who receives repeat allocations from the same underwriter in many different
IPOs. The underwriter may depend on continuing relationships with regular investors to generate orders
in both hot and cold issues, thereby increasing the likelihood that an issue is successfully sold to the
public (Hanley and Wilhelm (1995)). Regular investors may also play a role of collecting and providing
pricing information to underwriters (Benveniste and Spindt (1989) and Sherman and Titman (2002)) and
of holding shares in inventory until investor sentiment in the market calls for their resale (Ljungqvist,
Nanda, and Singh (2002)).
Unfortunately, an analysis of the different roles played by regular investors is difficult because
underwriters do not make client and allocation information publicly available. Those researchers that do
gain access to such micro-allocation data typically obtain small samples from a single underwriter. For
example, Hanley and Wilhelm (1995), Cornelli and Goldreich (2001), and Jenkinson and Jones (2002)
examine institutional allocation data in 38, 39 and 27 offerings, respectively. Institutional customers are
found to receive the largest share of allocations in these studies. In Hanley and Wilhelm, institutions
receive approximately 70% of the total allocation in IPOs with positive initial returns and about 65% in
IPOs with negative initial returns. Institutions receive a larger share than retail investors in both cold and
hot offerings, which is also found by Aggarwal, Prabhala, and Puri (2002) using aggregate allocation
data. Because of their consistently larger share of allocations, many institutional investors are likely to be
regular investors.
The empirical studies by Cornelli and Goldreich (2001) and Jenkinson and Jones (2002) are the
first to have data identifying regular institutional investors in IPOs. They use the frequency of an

institution’s bidding in the offer process to measure the effects of such regular investors. They find that
underwriters favor more frequent institutional bidders with more favorable allocations.1 This is an
important result because bookbuilding theories that include a role for regular investors predict that these
investors will receive more favorable allocations.
Unfortunately, there is disagreement among bookbuilding theories as to whether institutions or
retail customers play the role of regular investors. In Benveniste and Spindt (1989) certain investors are
endowed with meaningful information on the value of the IPO. Usually, these investors are thought to be
institutions. For such informed investors, both underpricing and discretionary allocations are necessary to
induce truthful revelation. Benveniste and Spindt show that the promise of future participation in other
IPOs may be used to lower current IPO underpricing. In effect, the profits from future underpriced IPOs
reduce the underpricing needed to extract information about the current IPO. Thus, the Benveniste and
Spindt model predicts that underwriters will develop regular relationships with informed investors. Booth
and Chua (1996) and Sherman and Titman (2002), however, show that underpricing may just compensate
informed investors for information-acquisition costs when such investors are not initially endowed with
meaningful information. In which case, the underwriter and issuer may not gain from regular relations
with informed participants, as this may not reduce underpricing.
Sherman’s (2000) bookbuilding model restores a role for regular investors when information is
costly. What Sherman shows is that the promise of favorable allocations in future IPOs can still reduce
underpricing if this commitment is instead made to uninformed investors. Uninformed investors bear no
information-acquisition costs. Thus, in her model, underwriters develop regular relations with uninformed
participants who provide no valuable pricing information. This bookbuilding model suggests that regular
investors are likely to be drawn from the population of retail participants.
1 Cornelli and Goldreich (2002) also find that underwriters reward institutions that provide more information in their bids (e.g. price limits). However, Jenkinson and Jones (2002) follow the same steps in their analysis and cannot confirm that underwriters’ reward information provision.
-2-

In this study, we use a unique set of micro-allocation data to investigate the role played by regular
investors in IPOs. We use these data to identify the characteristics of regular investors and examine a
number of questions raised by bookbuilding theories. Who are the regular investors? Are they both
institutional and retail investors? If so, are regular institutional and regular retail investors treated
similarly? Do they both receive allocations in the better performing IPOs? Do regular investors help
reduce underpricing in IPOs? This last question addresses the basic motivation for a regular investor
clientele as developed by existing bookbuilding theories.
The database in this study provides allocation records for a sample of 265 IPOs and classifies
each recipient as either an institution or retail investor. Including all syndicate members, there are over
130 underwriters represented in the database and collectively they made about 1.56 million allocations for
2.4 billion shares, the majority of which are repeats to the same customer account. On average, each
investor account participates in 2.6 IPOs. Investor accounts that receive five or more allocations represent
about 50% of the database. Correspondingly, these accounts receive about 59% of the shares allocated.
We will focus on the top 40 underwriters in this study because many smaller underwriters made only a
few allocations. The top 40 underwriters account for 97.3% of all shares allocated, and average at least 70
account allocations per IPO, which provides sufficient size so that the underwriter can exercise discretion
to choose between regular and other investors.
We find that a large fraction of institutional customers may be regarded as regular investors, but
that there is also a substantial fraction of retail customers who are regular investors. Specifically, 31.8%
of all allocations to institutions were made to accounts that participated in 18 or more IPOs. The figure is
15.1% for retail accounts. Retail is important because the number of such regular retail accounts is about
1.6 times the corresponding number of institutional accounts. Thus, in addition to capital, retail customers
offer a more diverse ownership structure. Adjusting for the difference in number of accounts, we find that
average share allocations to regular institutional investors are about four times larger than to regular retail
investors and that average share allocations are fairly small, about 4,500 shares for regular institutional
investors and 1,100 shares for regular retail investors.
-3-

While regular retail investors are found to be important because of their numbers, we find that
underwriters favor regular institutional investors in the more profitable offerings. However, the preference
expressed is only in the allocation frequency, not in the allocation size. Underwriters substantially reduce
the shares allocated to regular institutional and retail investors in more profitable offerings. Average share
allocations to institutions that participate in very few IPOs are the same as those of regular institutional
investors in “hot” IPOs, and higher for infrequent retail investors versus regular retail investors. In
addition, we find that these average share allocations to regular institutional and retail investors are only
about one-third as high as average share allocations in IPOs with negative first-day returns. These
findings are in contrast to the observations by Cornelli and Goldreich (2002) and Jenkinson and Jones
(2002), who report that underwriters provide more favorable allocations to institutions that participate
more frequently in the IPO bidding process.
Our results are consistent with the view that institutions as a group may represent more informed
investors, which is often a maintained assumption in IPO studies. Because we find that the distribution of
allocations by underpricing favors regular institutional investors over regular retail investors, it becomes
likely that institutional investors are providing more to the IPO process than an on-going capital
commitment, which regular retail investors also provide. Information provided by institutions about
future company prospects and value may help explain this compensation bias. However, there are other
possible explanations for this bias. Specifically, institutions may make implicit or explicit after-market
commitments, offer services tied to on-going relations with the underwriter; or pay fees and commissions
from future transactions among other possibilities.2
2 Some of these possibilities are the subject of litigation consolidated in the U.S. District Court, Southern District of New York (“In Re: Initial Public Offering Securities Litigation,” 21 MC 92 (SAS)). The complaints alleged in this matter include that underwriters tied share allocations to after-market purchases and favored customers who subsequently paid higher brokerage commissions when they traded in the aftermarket. A discussion of these allegations is found in Judge Shira Scheindlin’s order on defendant’s motion to dismiss (February 19, 2003). The news media also provides information about these complaints. See “CSFB Employees May Face NASD Charges,” The Wall Street Journal, May 2, 2001, “Small Investment Fund That Got Big Chunks of IPOs is Investigated,” The Wall Street Journal, May 11, 2001, and “Betrayal on Wall Street,” Fortune, May 14, 2001.
-4-

We also examine the determinants of underwriters’ reliance on regular investors. We find that
underwriters rely more on regular investors in smaller size issues and when the underwriter’s reputation is
higher. Larger size issues may require underwriters to market the issue to a broader set of investors. The
reputation effect is consistent with the view that underwriters with higher reputation may enter into
implicit contracts with investors, as reputation acts as collateral in the relationship.
Our results also question the basic motivation in bookbuilding models for a regular investor
clientele. As noted, these models postulate that regular investors, either institutional or retail, help the
underwriter reduce IPO underpricing. Using a number of different measures of the reliance on regular
investors, we find no evidence that underpricing is reduced in IPOs that use more regular investors, either
in an absolute or relative sense. This result does not vitiate the bookbuilding approach, per se, but rather
suggests that a different motivation likely exists for developing a regular clientele of IPO investors. An
alternative explanation may readily fit into existing bookbuilding theories. We consider alternative
explanations after presenting our results.
The remainder of this analysis proceeds as follows. Section II describes the data and the
construction of our reliance measures. Section III contains the empirical results. We present our
conclusions in section IV.
II. DATA
A. Data Sources and Sample IPOs
The allocation data for this study was obtained from a financial institution(s) that chooses to
remain anonymous.3 The database provides records on the disposition of shares allocated to retail and
institutional accounts for 131 underwriters. These records identify the size of initial share allocations at
the account level. However, these records do not always provide a unique match between customer
3 Note that we did not examine IPO order “books”, e-mails, or interview buyside investors or syndicate desk personnel while preparing this study.
-5-

accounts and customers because many customers will have more than one brokerage or institutional
account.
When underwriters make their allocations, they direct shares to the appropriate customer account.
For some customers, this means that they receive their allocation in several different account numbers.
This is particularly a problem for institutions, such as mutual fund families, that may direct shares to
member funds with different account numbers. Conversations with industry representatives suggest that
multiple-account fund families represent only a relatively small fraction of the number of allocations,
although the shares allocated may be substantial. In addition, as long as these fund families continue to
distribute their allocations to approximately the same member funds in multiple IPOs, the database will
provide a consistent representation of regular investors, although our total count of such investors is likely
to be biased upwards.
Retail investors typically do not receive allocations in multiple accounts because they do not
receive large enough allocation sizes to make splitting across accounts meaningful. A different problem
appears in the retail data. Specifically, many allocations are in odd lots to infrequently appearing account
numbers. Underwriters have indicated that these allocations are likely to be for “family and friends”
accounts and for shares distributed to minors in trust or other specialized accounts. To limit the effects of
these accounts on our results, we filter out allocations that are less than 50 shares. This removes less than
1.4% of the total share allocations in the database.
A total of 287 IPOs are represented in the database. These offerings occurred between June 1999
and May 2000. We exclude foreign issuers, American depositary receipts, real estate investment trusts,
closed-end funds (including unit trusts), unit offerings, mutual-to-stock conversions, limited partnerships,
and issues priced less than $5. This gives a sample of 265 offerings. For these offerings we have
approximately 1.56 million account allocations. Of these, 597,798 are unique customer and underwriter
combinations. Thus, each account participates in an average of about 2.6 offerings. We limit our analysis
to the top 40 underwriters in terms of allocation counts. These underwriters average at least 70 account
-6-

allocations per IPO, which provides enough allocations to exercise discretion between regular and other
investors. These 40 underwriters allocated 97.3% of all shares in our sample of IPOs.
These IPOs were issued during a “hot” cycle in the U.S. IPO market (Ritter and Welch (2002)).
Although this hot market is an unusual period, there is no reason to believe that regular investors are
treated differently during this period. In particular, Hanley and Wilhelm (1995) find evidence that regular
investors are likely to receive allocations in both hot and cold markets. Also, underwriters in our sample
made allocations in 50 IPOs that had negative or zero first day returns, which is about the same number as
found by Aggarwal, Prabhala, and Puri (2002) in a sample from 1997-98.4 The sample is therefore not
limited to IPOs with large underpricing, so underwriters had to deal with allocations in weaker issues.
In addition, Ljungqvist and Wilhelm (2002) examine the pricing of IPOs during the hot cycle
covered by these data. They report that changes in pre-IPO ownership structure and sales by insiders were
key components in the unusual pricing of IPOs during 1999 and 2000. Changes in these factors appeared
to reduce incentives to limit underpricing by corporate officials and underwriters. After controlling for
these firm-specific factors, they conclude that there appears to be little unusual about this period. Unless
there is a link between firm ownership characteristics and allocation strategies, and none has been
established, allocation data from this period are likely to be representative of other IPO samples. Even so,
it may be prudent to view these results as representative of a more active IPO cycle.
We also augment the allocation database with stock-price information from the Center for
Research on Security Prices (CRSP), issue information from the Securities Data Corporation (SDC)
Global New Issues database, trading volume data from Bloomberg, and information from the 424B
filings. Where possible, we compare the different data sources to eliminate errors in the SDC variables
and in the CRSP volume data. All issues are firm-commitment IPOs primarily sold in the U.S.
4 Aggarwal, Prabhala, and Puri (2002) find 48 IPOs with zero or negative first day returns in a sample of 174 IPOs. Their rate of cold IPOs is higher than that reported here, but this may be due to limits on the number of underwriters in their sample.
-7-

B. Regular Investor and Offering Indices
The focus of this study is on regular customers, but who are they? To give this term meaning, we
measure how frequently a given customer participates in the allocations of a given underwriter. This
participation rate measure is defined as follows:
j
kijk
ij N
DC
∑==
265
1 (1)
where Dijk = 1 if the ith investor account with the jth underwriter receives an allocation in the kth IPO and
zero otherwise, and Nj is the total number of IPOs in which the jth underwriter makes allocations. This
measure is scaled to be a percentage in the analysis below. Thus, for a given investor account with a given
underwriter, C represents the percent of IPOs in which the account received an allocation. ij
This measure focuses on a count of participation by investors, not on the shares received.
Although there is no objective guide for this choice, the concept of a regular customer implies that they
are available and given preference by underwriters in repeated IPOs. A share-based measure may reflect
this concept, too, and we use share weights below to summarize across customers and underwriters, but at
the customer level we focus on counts as the indicator of whether an investor is a regular customer.
We develop both absolute and relative reliance measures to determine an underwriter’s
dependence on regular customers. The absolute reliance measure computes the average of the Cij across
customers in a given IPO. A share-weighted version of this measure is also computed for comparison.
The relative reliance measure uses the average participation rate across an underwriter’s
customers in an IPO compared the same underwriter’s average across all IPOs. For the kth offering and the
jth underwriter, the relative reliance measure is as follows:
-8-

jT
iijk
T
iijijk
jk SD
CDR
j
j
/
1
1
∑
∑
=
== (2)
where j
T
iijj TCS
j
/1∑=
= is the average investor allocation frequency across all customers (Tj) of the jth
underwriter.
The interpretation of the relative reliance measure is straightforward. Suppose =jS 5%, so that
the average investor account receives allocations in 5% of the jth underwriter’s offerings. If in the kth
offering
∑
∑
=
=j
j
T
iijk
T
iijijk
D
CD
1
1 = 10%, so that on average allocations are being made to more frequent investors in
this offering, then the relative reliance measure is = 2, which implies that this offering is twice as
dependent on more frequent investors than an offering that randomly chose from this underwriters
investor account pool. If underwriters allocate randomly among the T
jkR
j investor accounts, = 1. ][ jkRE
Almost by definition, the relative reliance measure will exceed unity in nearly every IPO. This is
because underwriters do not draw randomly from the investor pool, but instead use certain investors more
frequently. Because more frequent investors have higher participation rates than the average, > 1 is
expected for each offering.
jkR
5 However, this measure is still useful because it is monotone with the
underwriter’s use of regular investors; that is, if the underwriter draws more heavily on regular investors
to complete its allocation, then will increase relative to an offering with fewer regular investors. jkR
5 Whether the relative reliance measure is greater or less than one depends on the relationship between the ratio of the average Cij for all investors and excluded investors, and the ratio of the number of included investors to total investors. Generally, the relative reliance measure will be greater than one with the number of investors much larger than the number of offerings by a given underwriter.
-9-

To summarize the dependence of a given IPO on regular customers, we compute simple and
share-weighted averages of the absolute and relative reliance measures across all underwriters in the
offering. If an offering has many underwriters and each follows similar allocation strategies, the simple
average may be the best summary measure. In offerings with very different syndicate takedowns or
underwriter strategies, a share-weighted measure may provide the best estimate of the dependence of the
offering on regular investors. These measures are also computed separately for institutional and retail
customers to determine if either investor category offers different services to underwriters.
III. EMPIRICAL RESULTS
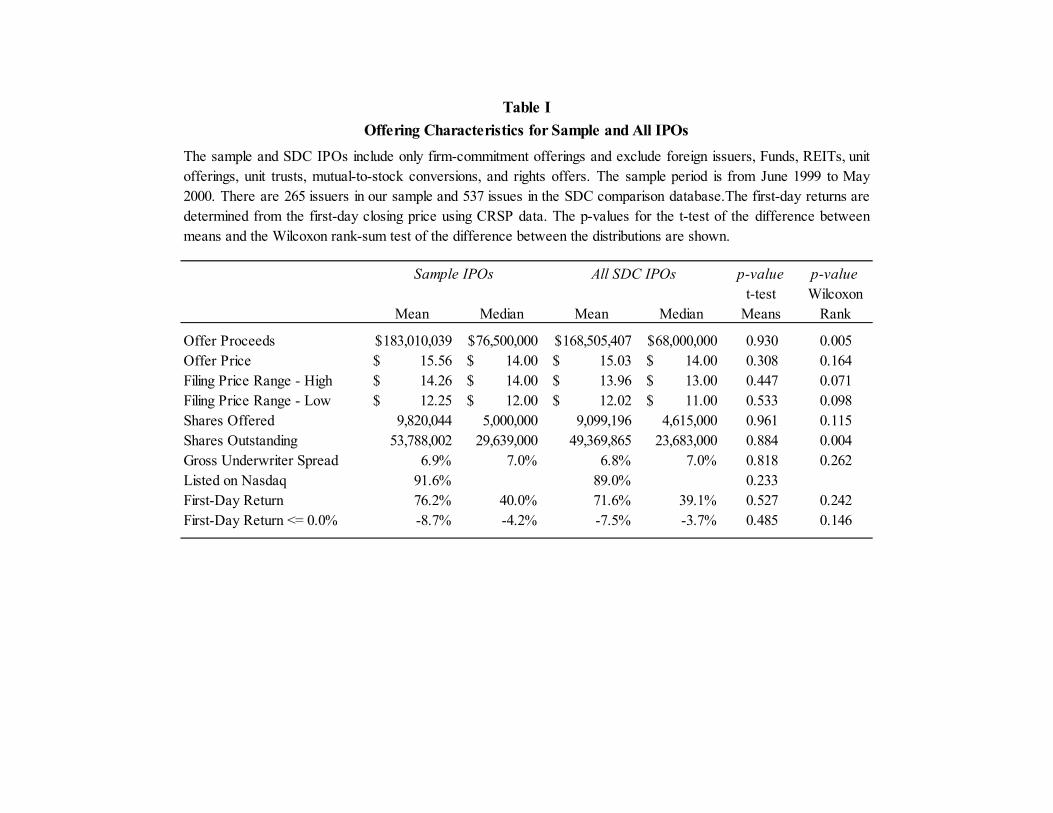
A. Offering Characteristics
Table I compares offering characteristics of our sample to those of all IPOs available in the SDC
dataset during the same time period (applying the same filters as for our samples). Mean and median
proceeds and shares outstanding are larger for our sample by about 9% compared to all IPOs. The average
and median number of shares sold, offer price, high and low initial filing ranges, and gross underwriting
spread are not significantly different in our sample from all SDC offerings. Our sample IPOs are
commonly listed on the Nasdaq, which is also found for all SDC IPOs during this time period. On
average, IPOs in our sample experienced a first-day return of 76.2% while all SDC IPOs on average
experienced a first-day return of 71.6%. The median first-day returns are 40% and 39.1%, respectively. In
addition, about 20% of our sample and approximately the same fraction of SDC offerings had negative or
zero initial returns. We find no statistically significant differences between our sample returns and returns
in all SDC offerings. Thus, our sample of tracked issues appears to be representative of other offers
during this period.
Although we match other offers in this period quite well, we do recognize that it was an unusual
market period overall. The average underpricing in our 12-month sample is the highest average over the
-10-

last twenty years.6 As noted above, there is no obvious reason to think that underwriters treated regular
investors differently, but as noted above it still may be prudent to judge our results as most applicable to a
very active or hot IPO cycle.
B. Allocations to Regular Investors
Table II shows the distribution of account allocations in quintile ranges based on institutional or
retail designations and average share allocations. The division of the data into allocation quintiles is
somewhat coarse because those accounts receiving only one allocation represent 22.8% of the sample.
With this reservation, we find that nearly 39% of the sample receive allocations is nine or more IPOs.
This increases to 55.6% for institutions and decreases to 34% for retail investors. A chi-square test shows
that the distribution of allocations is not independent of whether an account is institutional or retail (p-
value < 0.001). Thus, institutions receive more frequent allocations. What is surprising is that there are a
large absolute percentage of retail investors in the higher allocation count quintiles. In terms of numbers,
the top two quintiles contain twice the number of retail as institutional accounts. These results suggest
that underwriters value regular investors from both institutional and retail categories.
Table II also shows average size of allocations in each quintile for institutional and retail
investors. The pattern for institutions shows that average shares allocated decreases as allocation
frequency increases. Institutions participating in only one offering receive an average of 6,792 shares
versus 4,536 shares for institutions participating in greater than 18 offerings. These averages are
statistically different (t-test = 7.92). The overall univariate results suggest that institutions participating in
more frequent offerings receive smaller allotments than institutions participating in less frequent
6 See Table 1 in Ritter and Welch (2002) for a summary of average first-day returns during the Internet IPO period and early years.
-11-

offerings. This appears to differ from Cornelli and Goldreich (2001) and Jenkinson and Jones (2002), who
find that proportional allocations increase with the frequency of bidding.7
The pattern across quintiles for retail accounts shows a “u-shaped” behavior. The average
allocation in the first quintile is 681 shares, which is not statistically different from the average in the fifth
quintile of 676 shares (t-test = 0.098). However, significant differences are observed versus the other
quintiles. Thus, underwriters appear to treat retail allocations differently than institutional allocations for
the highest quintile set of regular investors.
The behavior of retail allocations across quintiles is partly explained by the larger number of
retail accounts. The retail-to-institutional ratio shows that there is 7.1 times more retail than institutional
accounts in the first quintile. This ratio decreases to 1.6 times in the fifth quintile. To adjust for this
variation, we scale the average retail allocation by the retail-to-institutional ratio. This approximates what
underwriters would allocate if they gave the same number of retail shares to the corresponding number of
institutional accounts. The resulting allocations are shown under the “adjusted retail allocation” column in
Table II. Now the retail allocation pattern across quintiles is generally similar to the decreasing pattern
observed for institutions, except that the decrease in average allocations is larger for retail.
To better understand the nature of allocations across these IPOs, we have graphed the frequency
distribution of participation rates (Cij) by institutional and retail categories in Figure 1.8 This figure shows
that participation rates are skewed for both institutional and retail investors, with retail having a higher
peak at lower rates. Approximately 15% of institutional accounts and 10% of retail accounts have
participation rates of 10% or higher. These accounts receive a significantly higher share of total
allocations. The 10% or higher retail accounts receive 37.1% of all retail shares and the similarly situated
7 Cornelli and Goldreich (2001) and Jenkinson and Jones (2002) use a normalized rationing measure to evaluate allocations. This measure equals the percentage allocation divided by the percentage bid for each institution. As we do not observe bids, our findings cannot be directly compared, but regular institutional investors are likely to submit higher bids. This is implied by the rationing results in Table III in Jenkinson and Jones. If these regular institutions are rewarded with more favorable allocations, then they receive share allotments closer to their bid. As such, a quintile ranking of normalized rationing is expected to show higher average allocations in the higher quintiles.
-12-
institutional accounts receive 48.6% of all institutional shares. In this light, regular investors appear
important to the successful sale of these offerings.9
C. Returns to Regular Investors
Regular investors are likely compensated for their behavior. Given that IPOs are underpriced on
average (Loughran and Ritter (2001)), a regular investor is in a position to realize a return equal to the
average underpricing percentage. Of course, the ability to do this depends on the size of each allocation
and on the offerings they participate in. If underwriters direct better offerings to regular investors, as the
institutional analysis in Hanley and Wilhelm (1995) and Aggarwal, Prabhala, and Puri (2002) suggests,
then these investors may earn more than the average underpricing percentage. In which case, all other
investors are expected to do worse than the average.
Table III provides a summary of IPO initial returns and average share allocations across
participation rates (Cij) for both institutional and retail investors. Participation rates are divided into three
regions: less than or equal to 3%, between 3% and 12%, and greater than or equal to 12%. These cut-offs
approximately divide the entire allocation data into thirds, with the average participation rate in a category
shown below each heading. Returns are divided into quartiles with the quartile averages show in the
average return column. For this discussion, we will assume that the regular investor accounts are those in
the highest participation rate category (≥ 12% rate).
Panel A in Table III shows the distribution of allocation counts. For institutional accounts, the
distribution of allocations is greatest in the high participation rate group and the highest return quartile,
which contains 18.9% of all institutional allocations. If these data were randomly distributed, then each
8 The participation rates in Figure 1 count an account only once, while the allocation counts in Tables II and III count all allocations including repeats. Thus, the participation rate distribution does not correspond to the allocation count fractions in either table.
9 Note that many of these offerings during this “hot” market cycle were over-subscribed. It may then be asserted that underwriters depended less on regular investors in our sample data. In which case, they are substantially more important than suggested by these allocation fractions.
-13-

cell would contain approximately 8.3% of institutional allocations. A chi-squared test (p-value < 0.001)
rejects the hypothesis that the data are randomly distributed across cells. Nearly 31% of the institutional
allocations to regular accounts are in cells for the top two return quartiles. At this aggregate level, the
allocation distribution for institutions shows that regular institutional accounts are favored with
allocations in better performing IPOs.
The retail allocation distribution tells a different story. The highest allocation cell is for the
second quartile of returns and the lowest participation rate accounts. In fact, retail allocations are most
common in the first two quartiles of returns across all participation rates. These two quartiles contain
approximately 60% of all retail allocations. Thus, the retail allocation bias in weak offerings found in
Aggarwal, Prabhala, and Puri’s (2002) aggregate participation results is present in these data, too.
Panel B in Table III shows the average shares allocated across participation rates and return
quartiles. These results generally confirm the findings in Table II for institutional accounts. Specifically,
average allocations decease as participation rates increases (i.e., across columns). This panel also shows
that average share allocations vary inversely with returns (i.e., across rows). Higher participation rate
institutions receive smaller allocations, which are smaller still in higher return offerings. Again, this
differs from Cornelli and Goldreich (2001) and Jenkinson and Jones (2002), who find that underwriters
reward more frequent participants with more favorable allocations. Also, note that average share
allocations do not vary significantly across participation rates in the highest return quartiles. Thus, while
regular institutional accounts are rewarded with more frequent participation in more underpriced
offerings, they receive smaller allocations on which to realize these gains.
The behavior of average share allocations to retail investors is similar to that of institutional
investors. The difference is that average share allocations follow the “u-shaped” pattern across
participation rates observed in Table II, with the highest participation rate accounts receiving a smaller
average allocation than the lowest participation rate accounts. The similarity is that average share
allocations generally decrease as initial IPO returns increase. Thus, these investors are accepting larger
-14-

allocations in the poorer performing IPOs (≤ 0% returns). In short, underwriters are placing fewer really
valuable shares with more frequent retail investors.
Do regular retail investors earn the same reward as regular institutional investors? If all regular
investors provide is capital to complete the offering, we would expect both regular institutional and retail
investors to receive proportionate compensation. That is, the distribution of high participation retail
accounts should equal the distribution of high participation (≥ 12% rate) institutional accounts across
return quartiles. Table III allows this calculation. The results show that the fourth quartile of returns
contains 37.1% percent of the high participation institutional accounts but only 27.1% of the high
participation retail accounts. The top two return quartiles contain 60.2% of the high participation
institutions and only 44.7% of the high participation retail accounts. These percentages and the returns
distributions are statistically different from each other. Thus, regular investors who are institutions receive
a greater proportion of allocations in the better performing IPOs than regular investors who are retail
clients.
The reason regular institutional investors receive better rewards may be that institutions provide
more than just capital to an IPO. Benveniste and Spindt (1989), Booth and Chua (1996), and Sherman and
Titman (2002) present models in which investors are paid for information collection and revelation
through underpricing. Regular investors may specialize in these information collection roles. In particular,
institutional investors may collect and report such information to underwriters. If so, regular institutional
investors would earn a return on their information investment and the capital provided to the IPO. Regular
retail investors may only earn a return on the ready capital access they provide. To adjust for these
different payments, underwriters may vary the participation rate and share allocations of regular investors
in better performing IPOs.
However, information provision is not the only possibility that may explain these results. The
recent IPO litigation suggests other possibilities, such as tie-in arrangements in which institutions agree to
additional aftermarket purchases or payments of unusually high commissions. Without additional data, we
-15-

cannot sort out which of many explanations is the most likely reason for underwriters providing higher
rewards to regular institutional investors versus regular retail investors.
D. Underwriter-Specific Effects
The allocation data in Tables II and III are summarized across all offerings and underwriters.
Table IV presents a different view of these data. In this table, allocations and counts are shown for each
underwriter separately to investigate whether underwriter-specific characteristics are affecting our
conclusions, particularly with regard to the relative size of average allocations for regular investors. Table
IV provides information on the relative number of investor accounts, percent of accounts that are
institutional, the average number of repeat allocations, average share allocations for accounts that
participated in 3% or less, and 12% or more, of an underwriter’s offerings. The relative number of
accounts is scaled to the underwriter (No. 2) that had the largest number of accounts. The actual count is
omitted and the order of underwriters is randomized to preserve the anonymity of these underwriters.
The relative measure of investor accounts shows significant variation across underwriters. The
primary reason for this is that some underwriters are focused on retail, while others focus on institutional
customers. This may be seen in the “percent institutional accounts” column. There are only a few
underwriters with a balanced mix of both retail and institutional customers. In addition, there is a sizable
difference in number of accounts between underwriters in the top ten and the thirtieth or fortieth
underwriter. Interestingly, the smaller underwriters have a larger percentage of their customer base in the
retail category, which also contributes to the observed variation.
The number of repeat accounts varies to a smaller degree across underwriters. The overall
average account receives 2.6 allocations in this sample. Institutional accounts receive more allocations, an
average of 3.1 per account, versus retail accounts, which average 2.3 per account. The medians (not
shown) are 1.0 for the overall sample, 2.0 for institutions, and 1.0 for retail accounts. Generally, these
repeat data show that underwriters favor institutions with more frequent allocations compared to retail,
-16-

but there is also a sizable set of repeat retail accounts as shown by a comparison of the mean and median
account frequencies.
Table IV also shows the average shares allocated per account for institutional and retail categories
based on participation rates. The two categories, 3% or less and 12% or more, contain approximately
2/3rds of all allocations. Consistent with Tables II and III, these data show that institutions receive higher
average allocations. We find that average allocation sizes are significantly higher for institutions for 26 of
the 30 underwriters where we can make this comparison in the 3% or less participation category, and
higher for 25 out of 31 underwriters in the 12% or greater participation category. However, the average
size of these allocations shows more variation that suggested by Table III, which indicates that
underwriters are making quite different choices about allocation sizes to their customers, both regular and
infrequent customers.
Consistent with the previous results, allocation sizes are higher for low participation investors
versus high participation investors. There are only 6 underwriters that report greater average retail or
average institutional allocations for the high participation group. The majority of these cases are not
statistically significant as reported in the last two columns in Table IV. Interestingly, about one-third of
the underwriters that have testable data show no statistical difference in allocation sizes between
participation rate categories. This is important because the results in Cornelli and Goldreich (2001) and
Jenkinson and Jones (2002) are each based on a single underwriter. While these two underwriters increase
allocation sizes for higher participation investors, this result may not generalize to a larger sample of
underwriters.
E. Determinants of Reliance on Regular Investors
Are there factors unique to the issue or participating underwriters that affect the reliance on
regular customers? We use regression analysis with data on issue characteristics and SEC filings to
examine this question. The independent variables used in this analysis are whether the offerings is listed
-17-

on the Nasdaq, log of dollar proceeds, days in registration, offer price relative to the mid-point of the
initial filing range (in percent), total count of Lead underwriters accounts, a measure of the reputation of
the Lead underwriter, and percent of the offering allocated to institutions.
The Nasdaq dummy variable is primarily designed to capture differences in size and distribution
requirements between exchange and Nasdaq listings. As Nasdaq requires a smaller number of
shareholders for listing than the exchanges, we expect this variable to have a negative effect on reliance
on regular investors.
The capital provided by investors is the total dollar proceeds from the sale of an IPO. The greater
the capital requirements, the less likely a given set of investors will be willing to provide the entire
capital. Underwriters may then either lower the capital requirements by lowering the offer price or shares
sold, although the latter is less common, or seek to market shares to more investors. In this light, we
expect that larger dollar offerings will rely less on regular investors than smaller offerings.
The days in registration and offer price relative to initial filing range variables capture
information effects during the offering process. The longer an IPO spends in registration, then the more
likely that the initial prospectus or offering requirements have changed, which may make the underwriter
more dependent on regular investors for the offering’s success. Similarly, if the offer price increases
relative to the midpoint of the initial filing range, underwriters may have collected information from the
bookbuilding process that causes them to reward regular investors with more favorable allocations as
suggested by Hanley (1993).
The total count of the lead underwriters investors population is a control variable used to capture
variation across offerings in the size of the investor set available to an offering. The more investors
available, then the more likely there are regular investors in a given offering, as underwriters make more
frequent allocations to these investors.
The reputation of the Lead underwriter is measured using the approach suggested by Megginson
and Weiss (1991) and also used by Hanley and Wilhelm (1995). Megginson and Weiss find that the
market share of an underwriter, defined as dollar amount underwritten relative to total capital raised
-18-

during the sample period, is highly correlated with the reputation measure suggested by Carter and
Manaster (1990). We expect that underwriters with better reputations are more likely to develop a regular
investor clientele, because they have collateral in their reputation to make implicit future commitments to
investors.
The percent of the offering allocated to institutions is also a control variable designed to
differentiate between the relative size of regular institutional and retail investor populations. If
underwriters have a larger relative population of regular institutional investors, then this variable is a
proxy for the difference that creates in our reliance measures. When we estimate the determinants of
reliance using institutional or retail allocations only, we exclude this variable.
We use two measures of reliance on regular investors in this analysis. First, the absolute reliance
measure uses the numerator in equation (2) to define an underwriter’s dependence on regular investors in
each IPO. For equal-weighted measures, the numerator in equation (2) is averaged across underwriters
participating in an IPO to give an absolute reliance measure for that IPO. For share-weighted measures,
the numerator is computed using shares allocated as weights instead of the Dijk’s. This measure is
averaged across participating underwriters in a given IPO using an underwriter’s relative share allocations
in that IPO as weights. The second measure is the relative reliance measure as shown in equation (2). This
measure is also computed with equal- and share-weighted sums. Both the absolute and relative reliance
measures are computed for all investors, and for institutions and retail customers, separately.
Table V reports the results of our analysis on the determinants of reliance on regular investors
using absolute and relative reliance measures. Panel A in the table shows results using absolute reliance
measures and panel B shows the results for relative reliance measures. The findings in these two panels
are quite similar. A listing on the Nasdaq does not affect the reliance on regular investors. Although the
distribution requires are substantially different, Nasdaq requires 400 and the NYSE requires 2,000 round-
lot shareholders, these and other listing differences do not meaningfully affect the use of regular
investors.
-19-

In contrast, the size of issue proceeds is consistently predictive of whether an offering relies on
regular investors. As expected, the greater the proceeds, the less the offering depends on regular investors.
The need to market larger offerings beyond the set of regular investors is a possible explanation for this
finding. This finding is consistent with the results in Torstila (2001), who reports that selling concessions
increase with issue size, suggesting that more resources are needed to market larger issues.
Underwriter reputation is also a consistently significant variable affecting reliance on regular
investors. The higher the Lead underwriter’s reputation, the more an offering depends on regular investors
for capital. This finding supports the view an underwriter may use its reputation as implicit collateral for
future commitments to regular investors.
The offer price relative to filing range midpoint variable is consistently significant for the
absolute reliance measures, but not significant with the relative reliance measures. We would expect that
if this variable was capturing bookbuilding obligations to investors that provide information, there would
no switch in its significance. These results suggest that this variable may serve another purpose, one that
is not important when the reliance on regular investors is measured relative to an average reliance across
all investors.
Among the remaining variables, the number of days in registration is never predictive of the
reliance on regular investors, but the count of the Lead’s customers and the fraction of the IPO allocated
to institutions appear as significant control variables.
In addition, these results do not change materially when the reliance measures are defined
separately for institutions and retail investors, and the equal or share-weighted methods make little
difference in the statistical significance of our estimates.
As a check on the robustness of these reliance measures, we also examine allocation shares to
investors by IPO. Using two cutoffs for the Cij’s, 12% and 20%, we define the frequency of participation
of regular investors in each offering and then compute the allocation shares to investors in these
categories. We use both count- and share-based numbers to compute these allocation shares. The count
based allocation share finds the total number of investors in an IPO greater than or equal to the cutoff rate.
-20-

This number divided by the total number of investors in the IPO gives the allocation share based on
counts. The share-based number sums the shares allocated to investors above the cutoff participation rate.
This sum divided by the total shares allocated in the IPO gives the allocation share based on shares
issued.
Table VI reports the results for allocation shares using a log odds ratio regression model. In the
log odds ratio model, the allocation share to regular investors in an IPO is assumed to follow a logistic
distribution:
k
k
X
X
k eef '
'
1 β
β
+= (3)
The log odds ratio model estimates the relationship kk
k Xf
f')
1β=
−log( using GLS regression
corrected for heteroskedasticity. The estimates of β in this model are consistent estimates of the
determinants for the regular investor frequency in equation (3).
The results in Tables V and VI are very consistent with each other. The same variables are
significant in these regressions and the signs have not changed. This consistency applies to both equal-
and share-weighted approaches to the definition of allocation shares. Thus, our findings on the
determinants of reliance on regular investors appears robust to different approaches to classifying regular
investors.
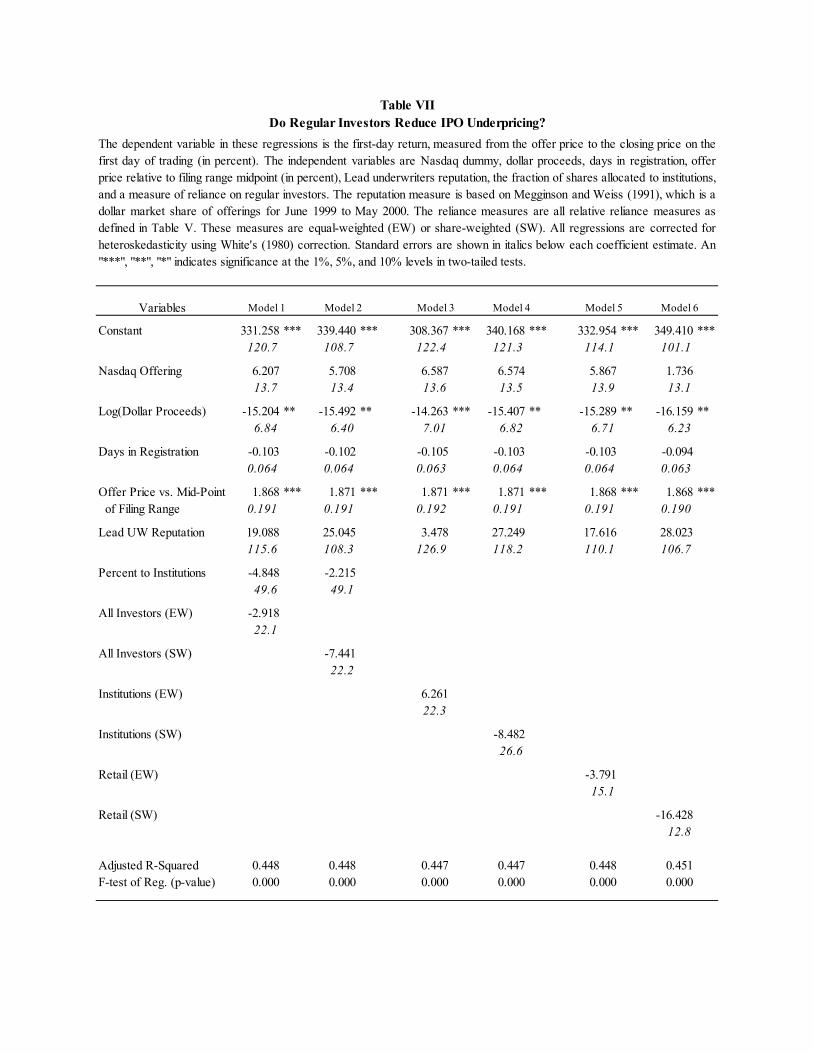
F. Do Regular Investors Reduce Underpricing?
An essential proposition in certain bookbuilding models is that reliance on regular investors,
either informed or uninformed depending on the model, helps to reduce underpricing in IPOs. Our
-21-
analysis has produced several measures of the reliance on regular investors in the sample IPOs. In this
section, we test whether these measures are inversely related to underpricing in the sample IPOs.
Table VII provides estimates of the determinants of underpricing using variables that are
commonly incorporated in underpricing regressions (e.g., Hanley and Wilhelm (1995), Aggarwal,
Prabhala, and Puri (2002)). In addition, we have included a different measure of relative reliance on
regular investors in each of the models. These same equations were also estimated using absolute
reliance, log-odds ratios, and allocation shares as alternatives to the relative reliance measures shown in
the table. In each case, the conclusions are the same as found in Table VII.10 Specifically, we find no
significant relationship between reliance on regular investors and initial IPO underpricing. Thus,
bookbuilding approaches that depend on future obligations to regular investors to reduce underpricing do
not receive support in this analysis.
IV. CONCLUSIONS
In this study, we use a unique database of 1.56 million account allocations in 265 IPOs to
examine the characteristics and role of regular investors in IPOs. We find that both retail and institutional
clients appear as regular investors. Regular institutional clients are favored with more frequent allocations
in hot IPOs than regular retail clients, but in both cases the average shares allocated decreases as initial
return increases. We offer evidence consistent with the view that regular retail clients provide a source of
capital, but that institutional clients provide both capital and something extra to the underwriter or issuer.
The “something extra” may be information about the IPO, a relationship that has greater value than the
regular retail relationship, or possibly an implicit or explicit agreement that leads the underwriter to favor
regular institutional investors.
We also examined the determinants of reliance on regular investors using several different
measures of reliance. These results were uniformly consistent in identifying issue proceeds and Lead
10 These additional regressions are omitted to conserve space, but are available on request.
-22-

underwriter reputation as important determinants of the use of regular investors in an IPO. We also
included these reliance measures in underpricing regressions. These findings did not support the theory
presented in certain bookbuilding models that reliance on regular investors helps reduce underpricing.
-23-

REFERENCES
Aggarwal, Reena, 2002, Allocation of Initial Public Offerings and Flipping Activity, Journal of Financial
Economics, forthcoming.
Aggarwal, Reena, N. Prabhala, and Manju Puri, 2002, Institutional Allocation in Initial Public Offerings:
Empirical Evidence, Journal of Finance 57, 1421-1442.
Benveniste, Lawrence M, and Walid Y. Busaba, 1997, Bookbuilding vs. Fixed Price: An Analysis of
Competing Strategies for Marketing IPOs, Journal of Financial and Quantitative Analysis 32,
383-403.
Benveniste, Lawrence M. and P.A. Spindt, 1989, How Investment Bankers Determine the Offer Price and
Allocation of Initial Public Offerings, Journal of Financial Economics 24, 343-362.
Benveniste, Lawrence M., and William J. Wilhelm, 1990, A Comparative Analysis of IPO Proceeds
under Alternative Regulatory Environments, Journal of Financial Economics 28, 173-208.
Booth, James R. and Lena Chua, 1996, Ownership Dispersion, Costly Information, and IPO
Underpricing, Journal of Financial Economics 41, 291-310.
Carter, Richard B. and Steven Manaster, 1990, Initial Public Offerings and Underwriter Reputation,
Journal of Finance 45, 1045-1068.
Carter, Richard B., Frederick H. Dark, and Alan K. Singh, 1998, Underwriter Reputation, Initial Returns,
and the Long-Run Performance of IPO stocks, Journal of Finance 53, 285-311.
Cornelli, Francesca and David Goldreich, 2001, Bookbuilding and Strategic Allocation, Journal of
Finance 56, 2337-2369.
Cornelli, Francesca and David Goldreich, 2002, Bookbuilding: How Informative is the Order Book?,
forthcoming in The Journal of Finance.
Hanley, Kathleen Weiss, 1993, The Underpricing of Initial Public Offerings and the Partial Adjustment
Phenomenon, Journal of Financial Economics 34, 231-250.
-24-

Hanley, Kathleen Weiss and William J. Wilhelm, Jr., 1995, Evidence on the Strategic Allocation of Initial
Public Offerings, Journal of Financial Economics 37, 239-257.
Jenkinson, Tim, and Howard Jones, 2002, Bids and Allocations in IPO Bookbuilding, working paper,
Said Business School, Oxford University.
Keloharju, Matti, and Sami Torstila, 2002, The Distribution of Information Among Institutional and
Retail Investors in IPOs, European Financial Management Journal, forthcoming.
Lee, Philip J., Stephen L. Taylor, and Terry S. Walter, 1999, IPO Underpricing Explanations:
Implications from Investor Application and Allocation Schedules, Journal of Financial and
Quantitative Analysis 34, 425-444.
Ljungqvist, Alexander, and William J. Wilhelm, 2002, IPO Allocations: Discriminatory or
Discretionary?, Journal of Financial Economics 65, 167-202.
Ljungqvist, Alexander, and William J. Wilhelm, 2002, IPO Pricing in the Dot-com Bubble, Working
Paper, Stern School of Business, New York University.
Ljungqvist, Alexander, Nanda, Vikram, and Rajdeep Singh, 2002, Hot Markets, Investor Sentiment, and
IPO Pricing, working paper, NYU Stern School of Business.
Loughran, Tim, and Jay R. Ritter, 1995, The New Issues Puzzle, Journal of Finance 50, 23-51.
Megginson, William L. and Kathleen A, Weiss, 1991, Venture Capitalist Certification in Initial Public
Offerings, Journal of Finance 46, 879-903.
Ritter, Jay R., and Ivo Welch, 2002, A Review of IPO Activity, Pricing, and Allocations, Journal of
Finance 57, 1795-1829.
Sherman, Ann E., 2000, IPOs and Long-Term Relationships: An Advantage of Book Building, Review of
Financial Studies 13, 697-714.
Sherman, Ann E. and Sheridan Titman, 2002, Building the IPO Order Book: Underpricing and
Participation Limits With Costly Information, Journal of Financial Economics 65, 3-30.
Torstila, Sami, 2001, The Distribution of Fees Within the IPO Syndicate, Financial Management 30, 25-
44.
-25-

White, Halbert, 1980, A Heteroscedasticity-consistent Covariance Matrix Estimator and a Direct Test for
Heteroscedasticity, Econometrica 48, 817-838.
-26-
p-value p-value
Mean Median Mean Mediant-test
MeansWilcoxon
Rank
Offer Proceeds 183,010,039$ 76,500,000$ 168,505,407$ 68,000,000$ 0.930 0.005Offer Price 15.56$ 14.00$ 15.03$ 14.00$ 0.308 0.164Filing Price Range - High 14.26$ 14.00$ 13.96$ 13.00$ 0.447 0.071Filing Price Range - Low 12.25$ 12.00$ 12.02$ 11.00$ 0.533 0.098Shares Offered 9,820,044 5,000,000 9,099,196 4,615,000 0.961 0.115Shares Outstanding 53,788,002 29,639,000 49,369,865 23,683,000 0.884 0.004Gross Underwriter Spread 6.9% 7.0% 6.8% 7.0% 0.818 0.262Listed on Nasdaq 91.6% 89.0% 0.233First-Day Return 76.2% 40.0% 71.6% 39.1% 0.527 0.242First-Day Return <= 0.0% -8.7% -4.2% -7.5% -3.7% 0.485 0.146
Sample IPOs All SDC IPOs
The sample and SDC IPOs include only firm-commitment offerings and exclude foreign issuers, Funds, REITs, unitofferings, unit trusts, mutual-to-stock conversions, and rights offers. The sample period is from June 1999 to May2000. There are 265 issuers in our sample and 537 issues in the SDC comparison database.The first-day returns aredetermined from the first-day closing price using CRSP data. The p-values for the t-test of the difference betweenmeans and the Wilcoxon rank-sum test of the difference between the distributions are shown.
Table IOffering Characteristics for Sample and All IPOs
IPO AllocationsQuintile Range
Sample Frequency
Institutional Investors
Retail Investors
Average Institutional Allocation
Average Retail
Allocation
Retail-to-Institutional
Ratio
Adjusted Retail
Allocation
X = 1 22.8% 12.4% 25.7% 6,792 681 7.1 4,865 X = 2 or 3 17.0% 13.3% 18.1% 6,596 279 4.5 1,257
X = 4, 5, …, 8 21.4% 18.6% 22.2% 5,049 327 4.0 1,300 X = 9, 10, …, 18 20.0% 23.8% 18.9% 4,326 341 2.7 903
X > 18 18.8% 31.8% 15.1% 4,536 676 1.6 1,102
The distribution of investor accounts is divided into quintiles based on the number of allocations (X) to the entiresample of 265 IPOs. The percent of institutional and retail investors is shown by quintile. The average shareallocations by institutional and retail accounts is shown by allocation quintile range. The retail-to-institution ratioequals the count of retail accounts divided by the count of institutional accounts in each quintile. The adjustedretail allocation equals the average retail allocation multiplied by the retail-to-institutional ratio. The adjusted retailallocation estimates the size of average retail allocations if the same number of retail shares were allocated tothe corresponding number of institutional accounts.
Distribution of Investor Accounts by Number of AllocationsTable II
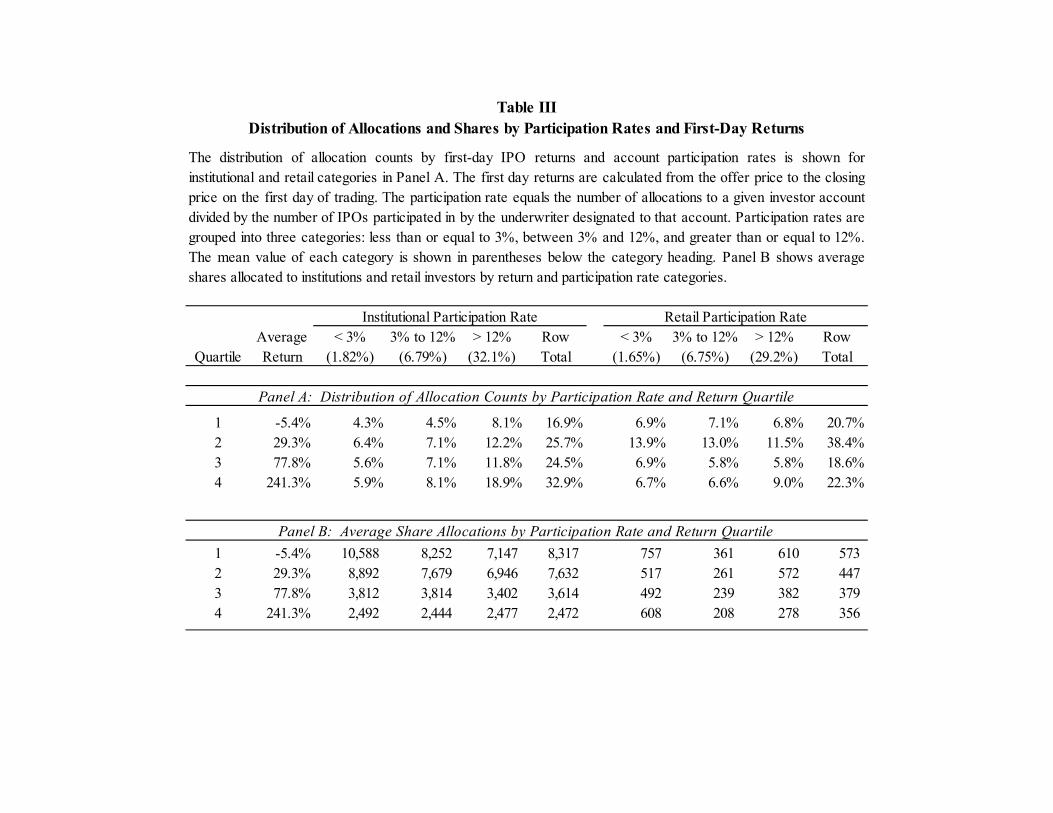
QuartileAverageReturn
< 3%(1.82%)
3% to 12%(6.79%)
> 12%(32.1%)
RowTotal
< 3%(1.65%)
3% to 12%(6.75%)
> 12%(29.2%)
RowTotal
1 -5.4% 4.3% 4.5% 8.1% 16.9% 6.9% 7.1% 6.8% 20.7%2 29.3% 6.4% 7.1% 12.2% 25.7% 13.9% 13.0% 11.5% 38.4%3 77.8% 5.6% 7.1% 11.8% 24.5% 6.9% 5.8% 5.8% 18.6%4 241.3% 5.9% 8.1% 18.9% 32.9% 6.7% 6.6% 9.0% 22.3%
1 -5.4% 10,588 8,252 7,147 8,317 757 361 610 573 2 29.3% 8,892 7,679 6,946 7,632 517 261 572 447 3 77.8% 3,812 3,814 3,402 3,614 492 239 382 379 4 241.3% 2,492 2,444 2,477 2,472 608 208 278 356
Table IIIDistribution of Allocations and Shares by Participation Rates and First-Day Returns
Panel A: Distribution of Allocation Counts by Participation Rate and Return Quartile
Institutional Participation Rate Retail Participation Rate
Panel B: Average Share Allocations by Participation Rate and Return Quartile
The distribution of allocation counts by first-day IPO returns and account participation rates is shown forinstitutional and retail categories in Panel A. The first day returns are calculated from the offer price to the closingprice on the first day of trading. The participation rate equals the number of allocations to a given investor accountdivided by the number of IPOs participated in by the underwriter designated to that account. Participation rates aregrouped into three categories: less than or equal to 3%, between 3% and 12%, and greater than or equal to 12%.The mean value of each category is shown in parentheses below the category heading. Panel B shows averageshares allocated to institutions and retail investors by return and participation rate categories.
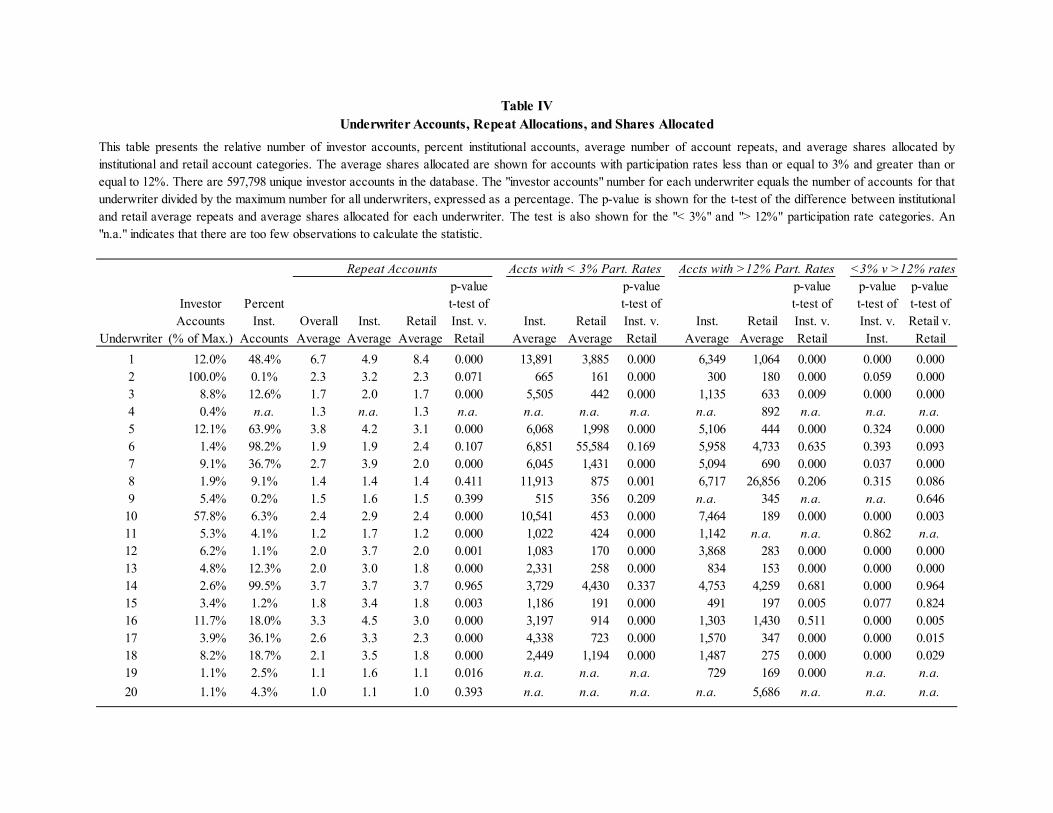
Underwriter
Investor Accounts
(% of Max.)
Percent Inst.
AccountsOverall
AverageInst.
AverageRetail
Average
p-valuet-test of Inst. v. Retail
Inst. Average
Retail Average
p-valuet-test of Inst. v. Retail
Inst. Average
Retail Average
p-valuet-test of Inst. v. Retail
p-valuet-test of Inst. v. Inst.
p-valuet-test of Retail v.
Retail1 12.0% 48.4% 6.7 4.9 8.4 0.000 13,891 3,885 0.000 6,349 1,064 0.000 0.000 0.0002 100.0% 0.1% 2.3 3.2 2.3 0.071 665 161 0.000 300 180 0.000 0.059 0.0003 8.8% 12.6% 1.7 2.0 1.7 0.000 5,505 442 0.000 1,135 633 0.009 0.000 0.0004 0.4% n.a. 1.3 n.a. 1.3 n.a. n.a. n.a. n.a. n.a. 892 n.a. n.a. n.a.5 12.1% 63.9% 3.8 4.2 3.1 0.000 6,068 1,998 0.000 5,106 444 0.000 0.324 0.0006 1.4% 98.2% 1.9 1.9 2.4 0.107 6,851 55,584 0.169 5,958 4,733 0.635 0.393 0.0937 9.1% 36.7% 2.7 3.9 2.0 0.000 6,045 1,431 0.000 5,094 690 0.000 0.037 0.0008 1.9% 9.1% 1.4 1.4 1.4 0.411 11,913 875 0.001 6,717 26,856 0.206 0.315 0.0869 5.4% 0.2% 1.5 1.6 1.5 0.399 515 356 0.209 n.a. 345 n.a. n.a. 0.646
10 57.8% 6.3% 2.4 2.9 2.4 0.000 10,541 453 0.000 7,464 189 0.000 0.000 0.00311 5.3% 4.1% 1.2 1.7 1.2 0.000 1,022 424 0.000 1,142 n.a. n.a. 0.862 n.a.12 6.2% 1.1% 2.0 3.7 2.0 0.001 1,083 170 0.000 3,868 283 0.000 0.000 0.00013 4.8% 12.3% 2.0 3.0 1.8 0.000 2,331 258 0.000 834 153 0.000 0.000 0.00014 2.6% 99.5% 3.7 3.7 3.7 0.965 3,729 4,430 0.337 4,753 4,259 0.681 0.000 0.96415 3.4% 1.2% 1.8 3.4 1.8 0.003 1,186 191 0.000 491 197 0.005 0.077 0.82416 11.7% 18.0% 3.3 4.5 3.0 0.000 3,197 914 0.000 1,303 1,430 0.511 0.000 0.00517 3.9% 36.1% 2.6 3.3 2.3 0.000 4,338 723 0.000 1,570 347 0.000 0.000 0.01518 8.2% 18.7% 2.1 3.5 1.8 0.000 2,449 1,194 0.000 1,487 275 0.000 0.000 0.02919 1.1% 2.5% 1.1 1.6 1.1 0.016 n.a. n.a. n.a. 729 169 0.000 n.a. n.a.20 1.1% 4.3% 1.0 1.1 1.0 0.393 n.a. n.a. n.a. n.a. 5,686 n.a. n.a. n.a.
Repeat Accounts Accts with < 3% Part. Rates
Table IV
<3% v >12% rates
This table presents the relative number of investor accounts, percent institutional accounts, average number of account repeats, and average shares allocated byinstitutional and retail account categories. The average shares allocated are shown for accounts with participation rates less than or equal to 3% and greater than orequal to 12%. There are 597,798 unique investor accounts in the database. The "investor accounts" number for each underwriter equals the number of accounts for thatunderwriter divided by the maximum number for all underwriters, expressed as a percentage. The p-value is shown for the t-test of the difference between institutionaland retail average repeats and average shares allocated for each underwriter. The test is also shown for the "< 3%" and "> 12%" participation rate categories. An"n.a." indicates that there are too few observations to calculate the statistic.
Underwriter Accounts, Repeat Allocations, and Shares Allocated
Accts with >12% Part. Rates
Underwriter
Investor Accounts
(% of Max.)
Percent Inst.
AccountsOverall
AverageInst.
AverageRetail
Average
p-valuet-test of Inst. v. Retail
Inst. Average
Retail Average
p-valuet-test of Inst. v. Retail
Inst. Average
Retail Average
p-valuet-test of Inst. v. Retail
p-valuet-test of Inst. v. Inst.
p-valuet-test of Retail v.
Retail21 1.1% 3.8% 1.3 1.9 1.3 0.013 n.a. n.a. n.a. 902 2,090 0.426 n.a. n.a.22 17.1% 26.5% 3.4 5.3 2.8 0.000 3,804 740 0.000 2,308 351 0.000 0.000 0.00023 9.2% 55.2% 4.2 5.9 2.1 0.000 5,031 1,689 0.000 4,471 1,511 0.000 0.152 0.48424 0.9% 6.2% 1.7 3.8 1.6 0.000 305 183 0.000 216 158 0.073 0.027 0.20525 14.7% 0.0% 1.6 n.a. 1.6 n.a. n.a. 99 n.a. n.a. n.a. n.a. n.a. n.a.26 3.4% 98.0% 2.4 2.4 1.5 0.007 9,389 69,330 0.197 1,281 n.a. n.a. 0.000 n.a.27 3.4% 25.1% 2.4 2.2 2.5 0.006 6,035 887 0.000 757 312 0.000 0.000 0.04528 27.7% 14.4% 2.9 4.8 2.6 0.000 4,837 533 0.000 4,733 384 0.000 0.780 0.11729 15.5% 5.4% 2.6 7.7 2.3 0.000 1,746 470 0.000 340 292 0.000 0.000 0.00030 2.6% 62.0% 2.3 2.6 1.7 0.000 n.a. n.a. n.a. 5,343 1,285 0.000 n.a. n.a.31 0.5% 14.4% 1.2 1.2 1.2 0.932 n.a. n.a. n.a. 1,612 196 0.095 n.a. n.a.32 1.5% 2.0% 1.5 1.4 1.5 0.176 702 232 0.023 n.a. 262 n.a. n.a. 0.22433 2.5% 2.6% 1.5 1.7 1.5 0.369 716 404 0.000 240 145 0.098 0.000 0.00034 1.9% 38.6% 4.1 4.0 4.2 0.362 1,005 740 0.000 1,145 534 0.000 0.016 0.00035 2.7% 2.7% 1.7 1.9 1.7 0.375 1,423 470 0.002 2,552 393 0.010 0.180 0.00136 0.7% n.a. 1.1 n.a. 1.1 n.a. n.a. n.a. n.a. n.a. 127 n.a. n.a. n.a.37 0.9% 8.5% 1.9 1.9 1.9 0.988 n.a. n.a. n.a. 841 317 0.000 n.a. n.a.38 3.9% 31.2% 1.9 2.3 1.8 0.000 6,776 1,787 0.000 2,129 997 0.000 0.000 0.00139 3.7% n.a. 3.2 n.a. 3.2 n.a. n.a. n.a. n.a. n.a. 167 n.a. n.a. n.a.40 0.6% 50.6% 6.8 7.0 6.5 0.330 11,811 4,511 0.000 12,163 1,871 0.000 0.815 0.009
Repeat Accounts Accts with < 3% Part. Rates Accts with >12% Part. Rates
Table IV (continued)
<3% v >12% rates
Variables
Constant 52.13 *** 48.28 *** 57.43 *** 45.31 *** 27.71 *** 23.08 ***9.03 12.11 12.36 12.22 6.56 8.56
Nasdaq Offering -1.450 -1.556 2.179 1.774 -3.159 ** -4.250 **1.350 1.945 1.751 1.871 1.085 1.707
Log(Dollar Proceeds) -3.070 *** -2.823 *** -2.848 *** -2.142 *** -1.429 *** -1.120 **0.520 0.634 0.636 0.630 0.384 0.458
Days in Registration -0.001 -0.001 0.003 -0.001 0.001 0.0050.007 0.006 0.006 0.006 0.006 0.006
Offer Price vs. Mid-Point 0.035 *** 0.049 *** 0.017 *** 0.047 *** 0.029 *** 0.033 *** of Filing Range 0.008 0.009 0.012 0.011 0.007 0.008
Investor Count for Lead 0.063 *** 0.068 *** 0.075 *** 0.075 *** 0.045 *** 0.048 *** Underwriter (1,000s) 0.008 0.010 0.011 0.011 0.005 0.007
Lead UW Reputation 121.83 *** 104.40 *** 110.52 *** 102.29 *** 95.79 *** 97.83 ***4.67 5.24 6.11 5.85 4.75 5.71
Percent to Institutions 13.89 *** 14.71 ***2.95 3.62
Adjusted R-Squared 0.565 0.476 0.410 0.414 0.636 0.589F-test of Reg. (p-value) 0.000 0.000 0.000 0.000 0.000 0.000
Share Weighted
Equal Weighted
Panel A: Absolute Reliance Measures
Equal Weighted
Share Weighted
Share Weighted
Equal Weighted
Table VDeterminants of Reliance on Regular Investors in IPOs
All Investors Institutional Investors Retail Investors
This table examines how absolute and relative reliance measures are affected by Nasdaq listings, dollar proceeds,days in registration, offer price relative to filing range midpoint (in percent), number of accounts of the Leadunderwriter, Lead underwriters reputation, and the fraction of shares allocated to institutions. The reputation measureis based on the dollar market share of offerings for June 1999 to May 2000. The absolute reliance measure averagesaccount participation rates over all accounts for a given underwriter and IPO, and then averages over underwriters inthat IPO. The relative reliance measure is the ratio of the absolute measure for a given underwriter and IPO to theaverage reliance measure across all offerings by that underwriter, then averaged across all underwriters in an IPO.Results are shown for both equal- and share-weighted reliance measures, and for institutions and retail accounts,separately. White's (1980) method is used to correct for heteroskedasticity. Standard errors are shown in italics. An"***", "**", "*" indicates significance at the 1%, 5%, and 10% levels in two-tailed tests.
Variables
Constant 2.865 *** 2.353 *** 2.814 *** 2.164 *** 2.591 *** 1.625 **0.335 0.456 0.334 0.295 0.499 0.724
Nasdaq Offering -0.060 -0.082 0.053 0.057 -0.139 * -0.282 **0.049 0.695 0.051 0.050 0.076 0.124
Log(Dollar Proceeds) -0.131 *** -0.101 *** -0.119 *** -0.074 *** -0.118 *** -0.082 ***0.016 0.018 0.017 0.015 0.025 0.031
Days in Registration 0.0001 0.0002 0.0003 0.0001 0.0003 0.00060.0002 0.0002 0.0002 0.0001 0.0004 0.0004
Offer Price vs. Mid-Point -0.0003 0.0002 -0.0014 0.0000 0.0000 0.0000 of Filing Range 0.0002 0.0003 0.0003 0.0002 0.0004 0.0005
Investor Count for Lead 0.002 *** 0.002 *** 0.003 *** 0.002 *** 0.002 *** 0.000 *** Underwriter (1,000s) 0.000 0.000 0.000 0.000 0.000 0.000
Lead UW Reputation 1.693 *** 1.623 *** 2.284 *** 1.690 *** 0.842 ** 0.858 ***0.154 0.180 0.193 0.153 0.268 0.306
Percent to Institutions 0.450 *** 0.564 ***0.121 0.178
Adjusted R-Squared 0.423 0.293 0.422 0.359 0.118 0.198F-test of Reg. (p-value) 0.000 0.000 0.000 0.000 0.000 0.000
Panel B: Relative Reliance Measures
Table V (continued)
Retail Investors
Equal Weighted
Share Weighted
Equal Weighted
Share Weighted
Equal Weighted
Share Weighted
All Investors Institutional Investors
Variables
Constant 1.218 -0.915 4.494 ** 2.7341.622 1.253 2.206 2.243
Nasdaq Offering -0.335 -0.138 -0.188 -0.2530.239 0.205 0.355 0.356
Log(Dollar Proceeds) -0.263 *** -0.235 *** -0.425 *** -0.363 ***0.071 0.067 0.100 0.109
Days in Registration 0.000 0.000 0.000 0.0000.001 0.001 0.001 0.001
Offer Price vs. Mid-Point 0.005 *** 0.005 *** 0.008 *** 0.009 *** of Filing Range 0.001 0.001 0.001 0.002
Investor Count for Lead 0.007 *** 0.008 *** 0.008 *** 0.008 *** Underwriter (1,000s) 0.001 0.001 0.001 0.002
Lead UW Reputation 10.219 *** 12.136 *** 12.118 *** 13.175 ***0.701 0.683 0.944 0.916
Percent to Institutions 2.842 *** 3.570 *** 2.374 *** 2.164 ***0.715 0.527 0.905 0.829
Adjusted R-Squared 0.483 0.503 0.386 0.356F-test of Reg. (p-value) 0.000 0.000 0.000 0.000
ParticipationRate >= 20%
ParticipationRate >= 12%
ParticipationRate >= 20%
ParticipationRate >= 12%
Table VIProbability Model of Allocation Shares for Regular Investors in IPOs
Count-Based Allocation Share Share-Based Allocation Share
Allocation shares in an IPO are defined for regular investors using count and share-based measures. Thecount-based measure equals the number of allocations to regular investors divided by the total number ofallocations. The share-based measure equals the shares allocated to regular investors divided by total sharesallocated. Regular investors are defined using 12% and 20% participation rate (Cij) cutoffs. Allocationshares are assumed to follow a logistic distribution. A log odds ratio transformation creates a linear model,which is estimated by GLS regression. The regression is corrected for heteroskedasticity using White's(1980) method. The independent variables in this table are the same as in Table V. Standard errors areshown in italics below each coefficient estimate. An "***", "**", "*" indicates significance at the 1%, 5%,and 10% levels in two-tailed tests.
Variables
Constant 331.258 *** 339.440 *** 308.367 *** 340.168 *** 332.954 *** 349.410 ***120.7 108.7 122.4 121.3 114.1 101.1
Nasdaq Offering 6.207 5.708 6.587 6.574 5.867 1.73613.7 13.4 13.6 13.5 13.9 13.1
Log(Dollar Proceeds) -15.204 ** -15.492 ** -14.263 *** -15.407 ** -15.289 ** -16.159 **6.84 6.40 7.01 6.82 6.71 6.23
Days in Registration -0.103 -0.102 -0.105 -0.103 -0.103 -0.0940.064 0.064 0.063 0.064 0.064 0.063
Offer Price vs. Mid-Point 1.868 *** 1.871 *** 1.871 *** 1.871 *** 1.868 *** 1.868 *** of Filing Range 0.191 0.191 0.192 0.191 0.191 0.190
Lead UW Reputation 19.088 25.045 3.478 27.249 17.616 28.023115.6 108.3 126.9 118.2 110.1 106.7
Percent to Institutions -4.848 -2.21549.6 49.1
All Investors (EW) -2.91822.1
All Investors (SW) -7.44122.2
Institutions (EW) 6.26122.3
Institutions (SW) -8.48226.6
Retail (EW) -3.79115.1
Retail (SW) -16.42812.8
Adjusted R-Squared 0.448 0.448 0.447 0.447 0.448 0.451F-test of Reg. (p-value) 0.000 0.000 0.000 0.000 0.000 0.000
Table VIIDo Regular Investors Reduce IPO Underpricing?
The dependent variable in these regressions is the first-day return, measured from the offer price to the closing price on thefirst day of trading (in percent). The independent variables are Nasdaq dummy, dollar proceeds, days in registration, offerprice relative to filing range midpoint (in percent), Lead underwriters reputation, the fraction of shares allocated to institutions,and a measure of reliance on regular investors. The reputation measure is based on Megginson and Weiss (1991), which is adollar market share of offerings for June 1999 to May 2000. The reliance measures are all relative reliance measures asdefined in Table V. These measures are equal-weighted (EW) or share-weighted (SW). All regressions are corrected forheteroskedasticity using White's (1980) correction. Standard errors are shown in italics below each coefficient estimate. An"***", "**", "*" indicates significance at the 1%, 5%, and 10% levels in two-tailed tests.
Model 5 Model 6Model 4Model 3Model 2Model 1
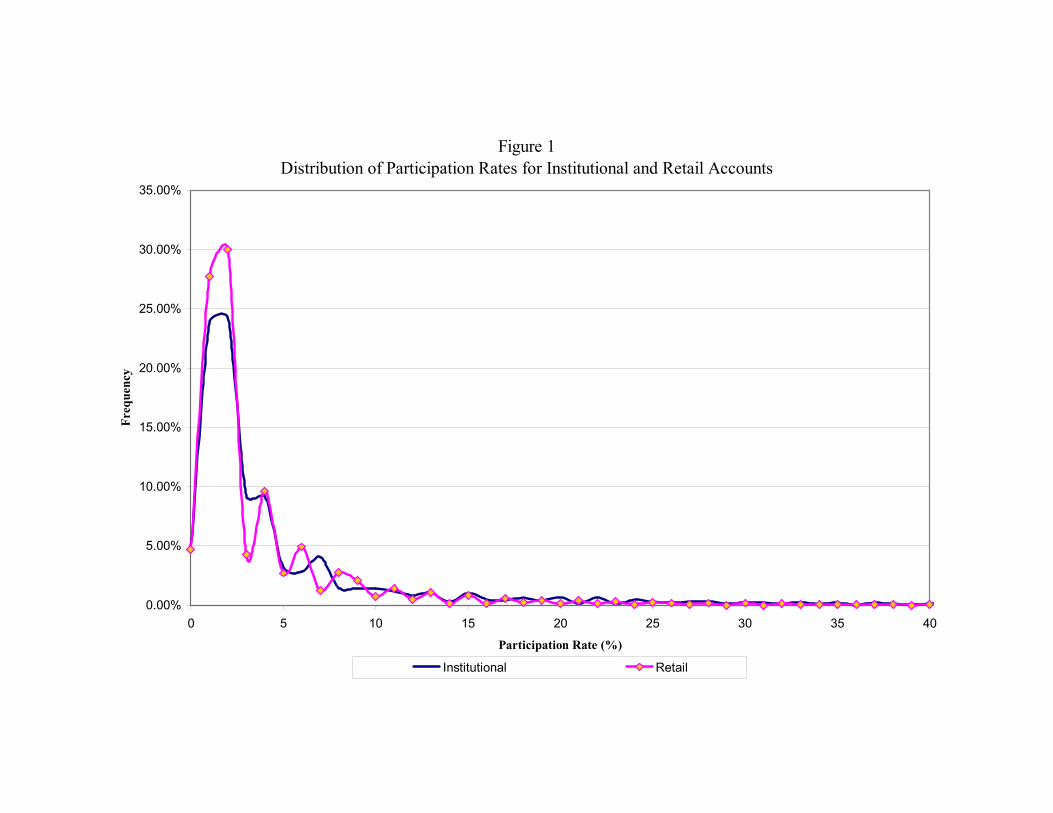
Figure 1Distribution of Participation Rates for Institutional and Retail Accounts
0.00%
5.00%
10.00%
15.00%
20.00%
25.00%
30.00%
35.00%
0 5 10 15 20 25 30 35 40
Participation Rate (%)
Freq
uenc
y
Institutional Retail