white advantage in teacher assignment
TRANSCRIPT
VERSION: August 2021
EdWorkingPaper No. 21-455
White Advantage in Teacher Assignment
Using detailed classroom-level data for North Carolina, we build on previous research to examine racial gaps
in access to high-quality teachers. We calculate the exposure of White, Black and Hispanic students to teachers
with various characteristics in 4th grade, 7th grade math and English, and 10th grade math and English. We
find that across the state White students enjoy sizable advantages over both Black and Hispanic students in the
form of higher exposure to teachers with strong credentials and lower exposure to teachers with weak
credentials. Remarkably, we also find this pattern of White advantage in most individual counties, with the
largest White advantage occurring in the largest counties by enrollment. A decomposition of the White
advantages shows that the bulk of them can be attributed to differences across counties and differences
between schools within counties. Only in 10th grade are differences across classrooms within schools
important in explaining the White advantage.
Suggested citation: Clotfelter, Charles T., Helen F. Ladd, and Calen R. Clifton. (2021). White Advantage in Teacher Assignment.
(EdWorkingPaper: 21-455). Retrieved from Annenberg Institute at Brown University: https://doi.org/10.26300/cwhs-bw50
Charles T. Clotfelter
Duke University
Helen F. Ladd
Duke University
Calen R. Clifton
Duke University

1
6/10/21
WHITE ADVANTAGE IN TEACHER ASSIGNMENT1
Charles T. Clotfelter, Helen F. Ladd, and Calen R. Clifton
Duke University
Abstract
Using detailed classroom-level data for North Carolina, we build on previous
research to examine racial gaps in access to high-quality teachers. We calculate the
exposure of White, Black and Hispanic students to teachers with various characteristics in
4th grade, 7th grade math and English, and 10th grade math and English. We find that across
the state White students enjoy sizable advantages over both Black and Hispanic students in
the form of higher exposure to teachers with strong credentials and lower exposure to
teachers with weak credentials. Remarkably, we also find this pattern of White advantage
in most individual counties, with the largest White advantage occurring in the largest
counties by enrollment. A decomposition of the White advantages shows that the bulk of
them can be attributed to differences across counties and differences between schools
within counties. Only in 10th grade are differences across classrooms within schools
important in explaining the White advantage.
1 We are grateful to Dan Goldhaber for helpful comments and to CALDER and Duke University for financial support. The views expressed here are those of the authors and do not necessarily represent those of any institution.
2
WHITE ADVANTAGE IN TEACHER ASSIGNMENT
At a moment when systemic discrimination has burst into the national conversation,
we examine racial and ethnic disparities in the provision of an essential government
service: K-12 public education. In this article, we build upon previous research, particularly
Goldhaber, Quince and Theobald’s (2018) study of teacher assignments. As those authors
acknowledge, recognition of systematic disparities in exposure to high quality teachers is
by no means new.2 What is new is the unprecedented attention now being paid to systemic
inequalities instigated or tolerated by government itself. Our aim here is to build on the
existing evidence of systemic disparities using more detailed and more recent data from
North Carolina.
Background
In their 2018 study, Goldhaber et al. present a sweeping “descriptive history” of
teacher quality gaps in the states of Washington and North Carolina over a period spanning
nearly two decades. Dividing students alternatively by broad racial category and economic
status and differentiating teachers using three different measures, the authors conclude
that teacher quality gaps are “pervasive” and by no means a new feature of public schools.
In a second study, covering just North Carolina, Bastian (2021) measured differences in
students’ exposure to teachers with various characteristics. The study aggregated data for
2 See, for example, Lankford, Loeb and Wyckoff (2002); Clotfelter, Ladd, and Vigdor (2005); Sass, Hannaway, Xu, Figlio and Feng (2010); Kalogrides and Loeb (2013); Isenberg et al (2013); and Goldhaber, Lavery and Theobald (2015).
3
all “core content” classes in grades K to 12 in traditional public schools, finding sizable
differences by race and economic status.3
In the present paper, we use detailed classroom-level data for 2017 to amplify the
findings of Goldhaber et al. and Bastian in four ways. First, we take advantage of North
Carolina’s diversity to make separate calculations for White-Black gaps and White-Hispanic
gaps. The historical context surrounding discrimination against Black students in North
Carolina’s schools differs starkly from that related to the state’s much shorter history of
Hispanic students and provides a compelling reason to examine the two groups separately.
We confine our analysis to just these three racial groups because they constitute the bulk of
all students in the state. Second, we extend the grade coverage of Goldhaber et al. (2018)
and provide more detail than the Bastian (2021) analysis. Whereas the bulk of Goldhaber
et al (2018) covered just grades 3-5, our analysis covers grades in elementary, middle, and
high schools. We also use more recent data that allows us to associate students with their
classroom teacher rather than the teacher who proctored their end-of-grade exam. While
Bastian (2021) uses information spanning all K-12 grades, we look separately at five
grade/subject sets of courses. Third, we supplement statewide results with evidence on
teacher quality gaps in individual counties to assess the prevalence of disparities across the
state. Fourth, we decompose the racial gaps in exposure to experienced teachers into
portions attributable to differences, respectively, across counties, between schools within
counties, and between classrooms within schools. We calculate this decomposition for
3 Teacher characteristics included inexperience, National Board certification, and measures of prior performance. Among other findings were that 10.4% of low-income Black students were taught by novice teachers, compared to 5.4% for white higher-income students.
4
various grade levels to enrich the more limited decompositions reported in Goldhaber et al.
(2018, Table 2).
Data and Method
To determine the characteristics of teachers assigned to students by race and
ethnicity, we assembled administrative data at the classroom level for a variety of grades
and subjects. Specifically, we examine five sets of classes across the state in all public
schools, including charter schools: 4th grade, 7th grade English, 7th grade math, 10th grade
English, and 10th grade math. In selecting which courses to use to identify classes, we
allowed for variation across school districts and schools in curricular configurations. 4 For
each classroom section, we matched the teacher with separate data on teachers’ licensure,
experience, certification, and teacher test information. We also have for each section the
racial and ethnic composition of students, where students are classified according to their
self-identified membership in one of three racial/ethnic groups: non-Hispanic Black or
African American; Hispanic or Latino/Latina/Latinx; and non-Hispanic White. For these
categories we use the familiar shortened terms of Black, Hispanic, and White, respectively.
Students in other ethnic groups are not considered in the study. 5
To gauge teacher quality, we defined six dichotomous measures, three indicating
strong teacher credentials and three indicating weak credentials. The indicators of strong
credentials were: experienced (five or more years of teaching experience), high teaching
test score (a score on the Praxis test in the top quartile of all teachers in the sample), and
4 See Appendix A for a description of our method.
5 We exclude them because of their very small shares relative to the three main groups of interest for this study: Black, White and Hispanic.
5
National Board Certification.6 The indicators of weak credentials were: inexperienced (two
or fewer years teaching experience), low teaching test score (a score on the Praxis test in
the bottom quartile of all teachers in the sample), and not certified in the area of teaching.
Our aim is to determine whether and by how much schools are systematically
favoring White students over Black and Hispanic students. To do this, we compare, for each
of our six indicators of teacher quality, the exposure of White, Black, and Hispanic students
to teachers possessing these characteristics. “Exposure” is measured simply by the share of
students who had a teacher with a given characteristic. For simplicity, we summarize our
findings in terms of “White advantage” which is based on the assumption that positive
differences for strong credentials are comparable to negative differences for weak ones. To
illustrate for one category of weak credentials, we report below that 11% of White 7th
graders across the state in 2017 had inexperienced math teachers (two years of teaching or
less), whereas the corresponding proportions for Black and Hispanic 7th graders were 18%
and 16%, respectively. Given those different exposure rates to inexperienced teachers, we
say that White 7th grade math students had an advantage over their Black and Hispanic
peers.
Findings
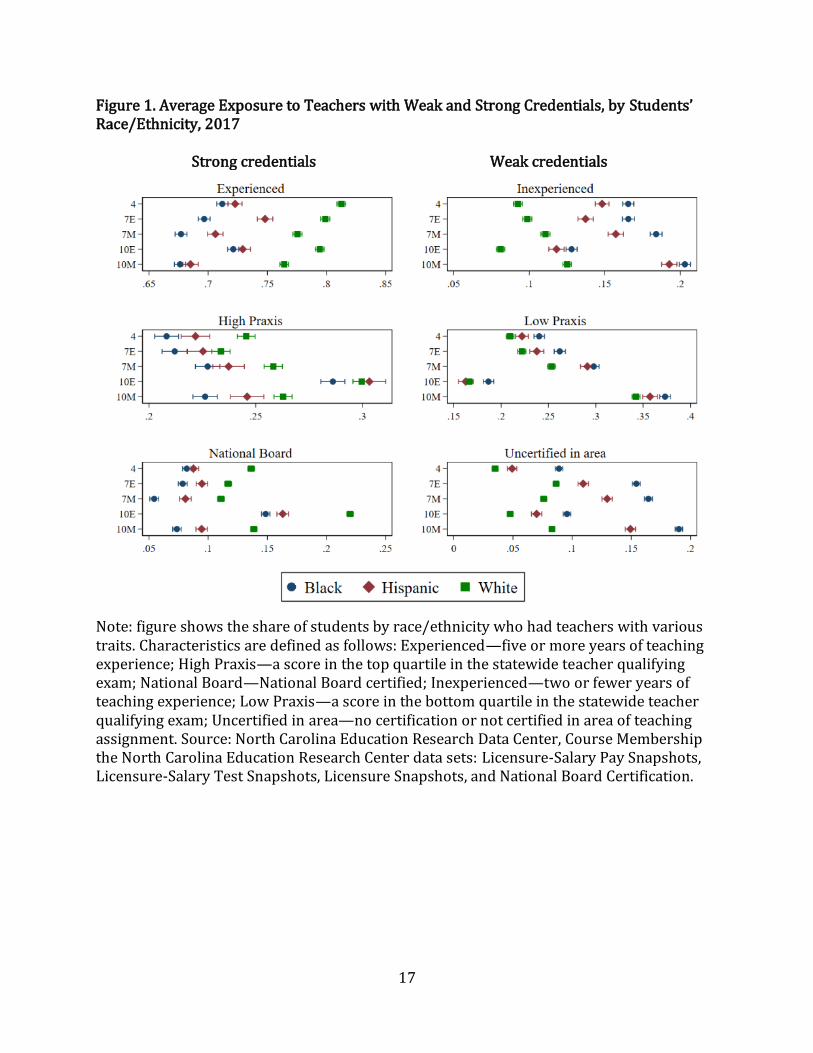
Our statewide findings are summarized in Figure 1, which shows the average
exposure rates of students to teachers possessing both weak and strong credentials, along
with the corresponding confidence intervals. For each of our six measures and each of the
6 Uncertified in field includes teachers without any license or certified but not in their assigned teaching area. Information on teachers is based on the North Carolina Education Research Center data sets: Licensure-Salary Pay Snapshots, Licensure-Salary Test Snapshots, Licensure Snapshots, and National Board Certification. Standardization of Praxis scores was performed for the year in which a teacher took the test. The indicators of strong and weak teacher quality that we use here have often been associated, respectively, with high or low student achievement. See, e.g., Clotfelter, Ladd and Vigdor (2006).
6
five grade/subject levels, the three indicators show the average statewide exposure rates
for White, Black, and Hispanic students. For example, the first panel shows that 78% of
White students in 7th grade math had teachers with five or more years of experience,
compared to only 68% of Black students and 71% of Hispanic students in that grade. The
panel also shows that White students at the other four grade/subject levels similarly had
the highest exposure rates to experienced teachers. Indeed, the figure makes very clear that
White students enjoyed an advantage at almost every grade/subject level and measure of
teacher credentials in that they had higher exposure rates to teachers with strong
credentials and lower exposure rates to teachers with weak ones. Black students, by
contrast, were most likely to have teachers with weak credentials and least likely to have
teachers possessing strong credentials. In most cases, the exposure rates of Hispanic
students were somewhere in between in those of the White and Black students. This figure
is a striking illustration of the advantage typically enjoyed by White students in the state’s
public schools in terms of their assigned teachers.
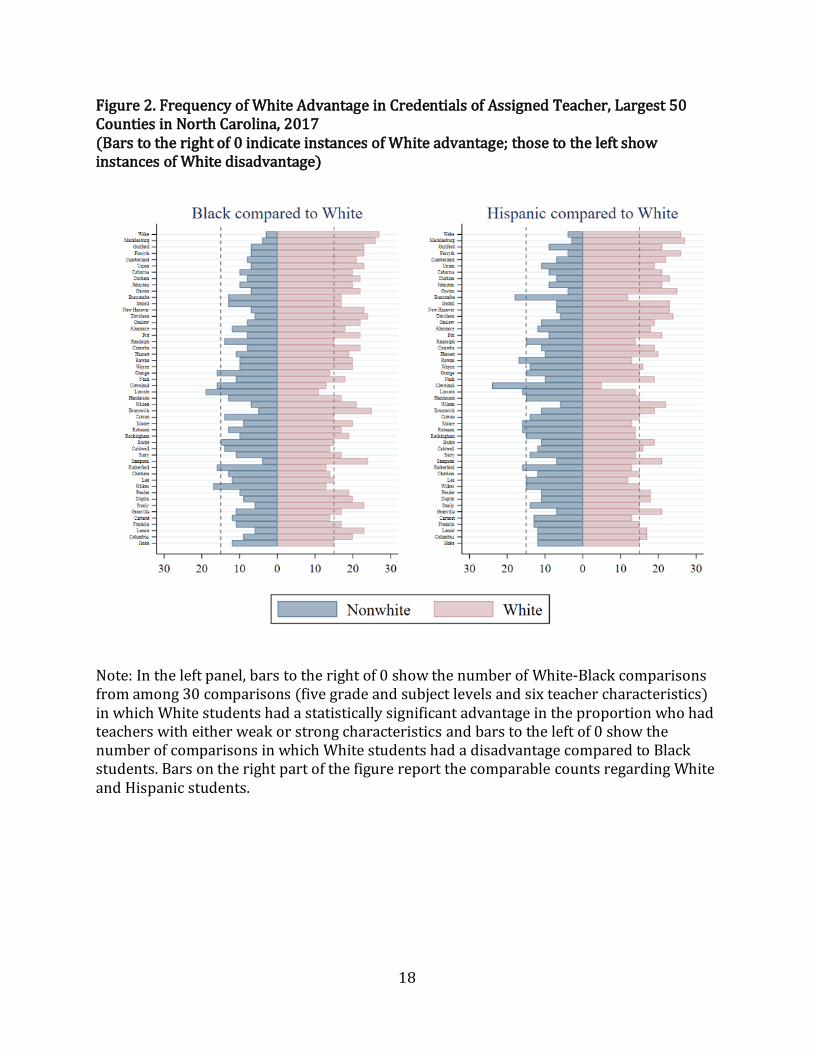
To see whether these statewide racial disparities are widespread or simply due to
differences in just a few communities, we performed similar comparisons for each of the 50
largest counties.7 For each county, we calculated the average exposure rate by race for
every one of the 30 possible comparisons (five grade/subject levels by six measures of
teacher credentials). We then counted the number of comparisons in which White students
had an advantage (higher exposure to strong ones or lower exposure to weak credentials)
over Black or Hispanic students. Analogously we counted the number of comparisons for
7 Size was measured by the total enrollment of White, Black, and Hispanic public school students in the county.
7
which either Black or Hispanic students were at an advantage. These county-by-county
calculations are reported in Figure 2, which shows the number of comparisons for which
White students had an advantage and the number for which either Black or Hispanic
students had an advantage. For the relatively few comparisons in which White students
had the same exposure rate as the comparison group of students, no advantage is recorded
either way.8
To illustrate the figure’s construction, consider the state’s largest county, Wake,
home to the capital city of Raleigh. Out of our 30 comparisons, White students held an
advantage over Black students in 27 and were at a disadvantage in only three.9 With
respect to Hispanic students, White students in Wake had an advantage in 26 of the 30
comparisons, while the reverse was the case in just four.10 As the Figure makes clear, Wake
County had one of the most one-sided showings of White advantage in the state.
Surveying the White-Black comparisons across all of the 50 largest counties reveals
that White students had an advantage in more comparisons than did Black students in 43
of these 50 counties, while White students were at a net disadvantage in just five (the
remaining two counties being equal), a one-sided outcome that is simply astounding. In
8 The most common reason for equal exposure rates for different racial groups is that either all or none of the teachers in a county in a certain grade/subject possessed a given characteristic, thus guaranteeing that all students would have the same exposure rate, 100% for that grade/subject to teachers with that characteristic. 9 In Wake County, Black students in 7th grade math and 10th grade English were more likely than White students to be assigned experienced teachers, and in 10th grade English classes they were less likely to have teachers who had low Praxis scores. In all other 27 comparisons, White students in Wake County had the advantage compared to Black students, based on our indicators of teacher quality. 10 The four comparison for which Wake County Hispanic students enjoyed an advantage of their White peers were these: in 7th grade math they were more likely than White students to have an experienced teacher and less likely to have a teacher not certified in math; in 10th grade English they were more likely to have a National Board certified teacher; and in 10th grade English they were less likely to have a teacher with a low Praxis score. In the remaining 26 comparisons, White students were more likely than Hispanic students to have teachers with indicators of high quality and less likely to have teachers with indicators of weak credentials.
8
the comparison between White and Hispanic students, the pattern of White advantage was
only slightly less one-sided, but it was nonetheless stark. Among the largest 50 counties,
White students had an advantage relative to Hispanic students in 35 counties and were at a
disadvantage in 10, with five counties showing an equal number of instances of White and
Hispanic advantage.
As suggested by Figure 2, the White advantage in teacher assignments tends to be
greatest in the counties with the most students. Descriptive regressions (not reported
here) show that the White advantage was not only greater in the larger counties but it also
tended to be higher in districts characterized by more racial/ethnic segregation of students
across classrooms. We defer to the next section, the policy implications of the statewide
patterns. The key point here is that it was common in North Carolina’s public schools for
White students to enjoy an advantage over both Black and Hispanic students in their
exposure to experienced, able, and strongly-credentialed teachers—a resource that is
acknowledged to be one of the potent instruments provided by government for building
human capital and promoting equal opportunity.
Linking the sources of disparities to policy remedies
The statewide disparities could be attributable to racial differences of three types.
One possibility is that the disparities result in part from differences between counties. That
would be the case, for example, if White students were more likely than students of color to
live in counties able to attract unusually large shares of high quality teachers, perhaps
because of the counties’ strong economies or their above-average teacher salaries. A
second possible contributor to the statewide advantage for White students is racial
differences between schools within counties in the exposure to strong teachers, a
9
possibility that could come about only in the presence of racially segregated schools within
counties. Prior research suggests that schools enrolling higher proportions of White
students appear to be more attractive to high quality teachers than schools attended by
higher proportions of students of color, many of whom may be low performing or
economically disadvantaged.11 A third possible contributor to the statewide teacher
quality gaps is differences across classrooms within schools, an outcome that would
require that students be distributed unevenly by race across a school’s classrooms. For
example, White students may be more likely than students of color to be enrolled in
advanced classes taught by highly qualified teachers or, even with no difference in the rigor
of classes, to find their way into classrooms known to be taught by the stronger teachers.
To reduce racial gaps in exposure to strong teachers, education policy makers at
both the state and local school levels would need to radically rethink their policies. For
example, to the extent that the gaps reflect salary differences across counties, state level
policy makers would need to revamp their policies regarding teacher salaries and related
funding and support services. The state of North Carolina has a statewide uniform salary
schedule, which by itself should help to minimize salary differences across counties.
However, local districts are allowed to supplement the state salaries with local funds.
Except to the extent that these supplements simply compensate teachers for differences
across counties in the cost of living, they typically add to other attractions of urban areas,
noted above, to give wealthier counties a decided edge in attracting and retaining good
teachers. The equity challenge for state policy makers is to determine how far to go in
11 See, for example, Clotfelter, Ladd and Vigdor (2011) for evidence from North Carolina and references to prior research on this question.
10
modifying state funding and teacher support policies, including, for example, attention to
housing opportunities for teachers in rural areas, to make all counties equally attractive to
quality teachers.
The second source of disparities, namely those between schools within counties,
requires action at the county level (which in most cases correspond to school districts in
North Carolina). The most obvious policy change, but not the easiest to implement, would
be for district policy makers to reduce the degree to which their schools are racially
segregated. That would require redrawing school attendance zones or pursuing policies to
reduce residential segregation. Another policy option would be to take steps to reduce the
tendency for experienced teachers to cluster in certain schools.12 Such a change would
probably mean eliminating the fairly standard practice of giving preference to experienced
teachers who wish to move from one school to another. Districts might also try boosting
salaries for experienced teachers willing to teach in schools serving large proportions of
disadvantaged students. As documented by Clotfelter et al. (2011), however, the pay
differential required to induce teachers with strong qualifications to remain in such schools
is likely to be prohibitively high. That is because, compared to less qualified teachers,
teachers with strong qualifications tend to be both more averse to teaching in such schools
and less responsive to salary differentials.
Turning to the third possible source of disparities, differences within schools, the
policy options are well known and vigorously debated. Numerous studies have clearly
12 To reflect this clustering, we calculated dissimilarity indices between experienced teachers (those with five or more years of experience) and all other teachers. The calculated indices suggest a high degree of clustering: 0.67 in 4th grade, 0.66 in 7th grade English, 0.67 in 7th grade math, 0.51 in 10th grade English, and 0.48 in 10th grade math.
11
shown the connection between academic tracking and other practices of grouping students
into classrooms and various forms of within-school segregation (see, for example,
Mickelson 2001; Lucas and Berends 2007; Kalogrides and Loeb 2013; Clotfelter, Ladd,
Clifton and Turaeva, 2021).
In deciding which public policies might be effective in reducing racial disparities of
the sort we have identified, it would be useful to know the extent to which the statewide
disparities at each grade level are attributable to differences across counties, across schools
within countries or across classrooms within schools. To this end, we describe here a
method for decomposing the statewide gaps at each grade and subject level into the three
sources. Although it would be possible to do so for each of our six teacher characteristics,
we decompose the racial teacher quality gaps here for a single measure – teachers with
more than five years of experience. The greater is the contribution to statewide quality
gaps of county level differences, the stronger is the argument for state level policies to
reduce them. In contrast, significant contributions of differences across schools within
countries or across classrooms within schools, imply the need for local or school-level
policy responses.
To decompose the overall racial gaps in the selected measure of teacher quality,
having five or more years of teaching experience, we begin by calculating the following four
actual or hypothetical statewide exposure rates of students separately for each of the three
student groups (where g refers to Whites, Blacks or Hispanics) and also separately for each
of our five grade/subject categories:
Eg = actual exposure rate of group g students to experienced teachers
Eg* = hypothetical exposure rate if there were no disparities within schools
12
Eg** = hypothetical exposure rate if there were no disparities across schools within
counties
E = student-weighted proportion of teachers who are experienced
The difference between a group’s actual exposure rate (Eg) and the statewide
proportion of experienced teachers (E) may then be divided into three pieces, where (Eg_
Eg*) is the portion due to disparities within schools; (Eg*- Eg**) is the portion due to
disparities between schools within counties, and (Eg**- E) is the portion due to disparities
across counties.
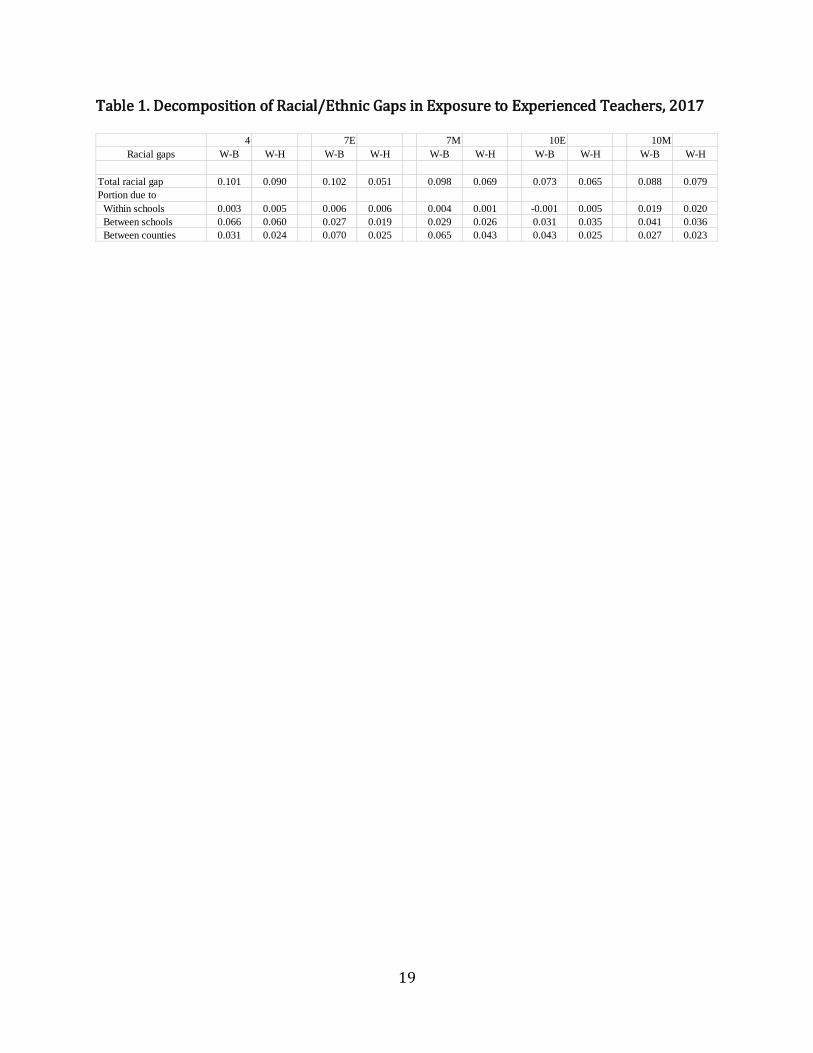
Table 1 illustrates this decomposition for each of the 10 subject/grade categories
for experienced teachers. (See Appendix B for a more detailed explanation of the
decomposition method.) Each of the entries in the row labeled “Total racial gap”
corresponds to the gaps in exposure to experienced teachers that are visible in Figure 1
above. For example, consider the White-Black entry for 7th grade math. Consistent with
Figure 1, the 0.098 W-B racial gap corresponds to the difference between the 0.776
exposure rate for Whites and the 0.677 exposure rate for Blacks. Similarly the 0.069 White-
Hispanic racial gaps corresponds to the difference between the 0.776 exposure rate for
Whites and the 0.706 exposure rate for Hispanics. The bottom three lines of the table show
the portions of the racial gaps that are due to the three mechanisms. For example, for
grade 7 math, the table shows that only 0.4 percentage points of the White-Black gap can
be attributed to differences across classrooms within schools, 2.9 points to differences
between schools within counties and 6.5 points to differences across counties. Although
the gaps in exposure between White and Hispanic students are somewhat smaller, the
relative contributions of the three sources are similar.
Based on the 10 grade/subject categories shown in the table, we draw the following
conclusions. First, our calculations suggest that differences across classrooms within
13
schools make at most a limited contribution to the overall magnitude of teacher quality
differentials, a finding that it is consistent with the findings for grades 3-5 reported in the
working paper form (CALDER 2016) of Goldhaber et al. (2018). The only grade/subject for
which we find that within-school disparities explain an appreciable amount of overall
disparities in exposure to experienced teachers is 10th grade math.13 The limited
contribution of within-school differences implies that efforts by school principals to
redistribute their teachers and students across classrooms within their schools will do
little, in most cases, to reduce the teacher quality advantage for White students.
Second, the contributions of the other components differ by grade and subject. The
table shows that the largest contributor (about 2/3) to the White advantage in grade 4 is
differences across schools within counties. Because this pattern undoubtedly reflects
significant segregation of students by race and ethnicity across elementary schools within
North Carolina counties (which, in most cases, are also school districts), it implies that the
main way to reduce the White advantage at this level would be for local counties to take
actions to minimize the racial and ethnic segregation of their elementary schools. For
reasons we cited earlier, efforts to supplement that strategy with salary differentials to
offset the aversion of high quality teachers to schools with high proportions of
disadvantaged students is likely to be very costly.
In contrast, the largest contributor to the White advantage in grade 7 for both math
and reading is differences between counties. This pattern most likely reflects not only
differences in the racial compositions of individual counties, but also differences in other
13 The importance of within school teacher quality gaps for 10th grade math parallels our findings related to classroom level segregation (Clotfelter, Ladd, Clifton, and Turaeva, 2021).
14
factors that affect their ability to attract and retain high quality teachers. This being the
case, the responsibility for reducing the overall White advantage would lie, at least in part,
with state policy makers who would face the challenge of designing a teacher salary and
funding system that would be effective in equalizing the quality of teachers across
counties.
The picture is more mixed at the 10th grade level, where between-school and
between-county factors both contribute significantly to the White advantage in 10th grade
reading and all three factors contribute to the White advantage in 10th grade math. These
patterns imply that a combination of state level and local level policies would be needed to
reduce the White advantage of students in grade 10 reading, while the White advantage in
grade 10 math would also require attention to how students and teachers are distributed
among classrooms within schools.
Public policy and the inequity agenda
Our finding of pervasive and substantial racial gaps in students’ exposure to
strong and weak teachers indicate a clear teacher-quality advantage for White students in
North Carolina. We find gaps between White and Black students and between White and
Hispanic students; we find gaps in 4th grade and in both math and English courses in 7th
and 10th grades. Moreover, we find gaps in many different counties. The two main sources
of these gaps, judging from one of our indicators of teacher quality, are differences across
counties and differences between schools within counties. To a limited extent, quality gaps
are also due to differences in classroom assignments within schools. For states such as
North Carolina to address these gaps, policy makers will have to confront patterns of racial
and ethnic segregation head on and develop policy instruments to counter their effects.
15
The persistence of such gaps suggests, however, that achieving equity on this front has not
been a high priori for policy makers.
References
Bastian, Kevin C. 2021. “Access to a Well-Credentialed, Effective, and Diverse Teacher Workforce in North Carolina.” Education Policy Initiative at Carolina. https://www.belkfoundation.org/wp-content/uploads/2021/02/EPIC_Equity-Brief_final-1.pdf, 4-30-21. Clotfelter, Charles. T., Helen F. Ladd, and Jacob L. Vigdor. 2005. “Who Teaches Whom? Race and the Distribution of Novice Teachers.” Economics of Education Review 24, 377-392. __________. 2006. “Teacher-Student Matching and the Assessment of Teacher Effectiveness,” Journal of Human Resources 41 (Fall 2006), 778-820.
__________. 2011. "Teacher Mobility, School Segregation, and Pay-Based Policies to Level the
Playing Field," Education Finance and Policy 6 (Summer), 399-438.
Clotfelter, Charles T., Helen F. Ladd, Calen R. Clifton, and Mavzuna Turaeva. 2021. “School Segregation at the Classroom Level in a Southern ‘New Destination’ State,” Race and Social Problems. 13 (January), 131-160. Goldhaber, Dan, Vanessa Quince, and Roddy Theobald. 2018. “Has it Always Been This Way? Tracing the Evolution of Teacher Quality Gaps in U.S. Public Schools,” American Educational Research Journal 55 (February), 171-201. Goldhaber, D., Lavery, L., and Theobald, R. (2015). “Uneven Playing Field? Assessing the Teacher Quality Gap Between Advantaged and Disadvantaged Students.” Educational Researcher, 44(5), 293–307. Grissom, Jason A. and Christopher Redding. 2016. “Discretion and Disproportionality: Explaining the Underrepresentation of High-Achieving Students of Color in Gifted Programs,” AERA Open 2 (January-March), 1-25. Hollingshead, August B. 1949. Elmtown’s Youth: The Impact of Social Classes on Adolescents. New York: John Wiley and Sons. Isenberg, E., Max, J., Gleason, P., Johnson, M., Deutsch, J., and Hansen, M. (2016). Do Low-Income Students Have Equal Access to Effective Teachers? Evidence from 26 Districts (NCEE 2017-4007). Washington, DC: Institute of Education Sciences.
16
Isenberg, E., Max, J., Gleason, P., Potamites, L., Santillano, R., Hock, H., and Hansen, M. (2013). Access to effective teaching for disadvantaged students (NCEE 2014- 4001). Washington, DC: Institute of Education Sciences. Kalogrides, D., and Loeb, S. (2013). Different Teachers, Different Peers: The Magnitude of Student Sorting Within Schools. Educational Researcher, 42(6), 304–316. Kalogrides, D., Loeb, S., and Be´teille, T. (2013). “Systematic Sorting: Teacher Characteristics and Class Assignments.” Sociology of Education, 86(2), 103–123. Lankford, H., Loeb, S., and Wyckoff, J. (2002). “Teacher Sorting and the Plight of Urban Schools: A Descriptive Analysis.” Educational Evaluation and Policy Analysis, 24(1), 37–62. Lucas, Samuel R., and Mark Berends. 2007. “Race and Track Location in U.S. Public Schools.” Research in Social Stratification and Mobility 25, 169–187. Mickelson, R. A. (2001). “Subverting Swann: First- and Second-Generation Segregation in Charlotte, North Carolina. American Educational Research Journal,” 38(2), 215–252. Sass, T. R., Hannaway, J., Xu, Z., Figlio, D. N., and Feng, L. (2010). “Value Added of Teachers in High-Poverty Schools and Lower Poverty Schools.” Journal of Urban Economics, 72(2), 104–122. Useem, Elizabeth. 1992. “Middle Schools and Math Groups: Parents’ Involvement in Children’s’ Placement.” Sociology of Education 65: 263-279.
17
Figure 1. Average Exposure to Teachers with Weak and Strong Credentials, by Students’ Race/Ethnicity, 2017 Strong credentials Weak credentials
Note: figure shows the share of students by race/ethnicity who had teachers with various traits. Characteristics are defined as follows: Experienced—five or more years of teaching experience; High Praxis—a score in the top quartile in the statewide teacher qualifying exam; National Board—National Board certified; Inexperienced—two or fewer years of teaching experience; Low Praxis—a score in the bottom quartile in the statewide teacher qualifying exam; Uncertified in area—no certification or not certified in area of teaching assignment. Source: North Carolina Education Research Data Center, Course Membership the North Carolina Education Research Center data sets: Licensure-Salary Pay Snapshots, Licensure-Salary Test Snapshots, Licensure Snapshots, and National Board Certification.
18
Figure 2. Frequency of White Advantage in Credentials of Assigned Teacher, Largest 50 Counties in North Carolina, 2017 (Bars to the right of 0 indicate instances of White advantage; those to the left show instances of White disadvantage)
Note: In the left panel, bars to the right of 0 show the number of White-Black comparisons from among 30 comparisons (five grade and subject levels and six teacher characteristics) in which White students had a statistically significant advantage in the proportion who had teachers with either weak or strong characteristics and bars to the left of 0 show the number of comparisons in which White students had a disadvantage compared to Black students. Bars on the right part of the figure report the comparable counts regarding White and Hispanic students.
19
Table 1. Decomposition of Racial/Ethnic Gaps in Exposure to Experienced Teachers, 2017
4 7E 7M 10E 10M
Racial gaps W-B W-H W-B W-H W-B W-H W-B W-H W-B W-H
Total racial gap 0.101 0.090 0.102 0.051 0.098 0.069 0.073 0.065 0.088 0.079
Portion due to
Within schools 0.003 0.005 0.006 0.006 0.004 0.001 -0.001 0.005 0.019 0.020
Between schools 0.066 0.060 0.027 0.019 0.029 0.026 0.031 0.035 0.041 0.036
Between counties 0.031 0.024 0.070 0.025 0.065 0.043 0.043 0.025 0.027 0.023