which observations from the complete blood cell count predict mortality for hospitalized patients?
TRANSCRIPT
Which Observations from the Complete Blood CellCount Predict Mortality for Hospitalized Patients?
Abel N Kho, MD, MS
Siu Hui, PhD
Joe G. Kesterson, BS
Clement J. McDonald, MD
From the Regenstrief Institute, Inc.
BACKGROUND: Information on the prognostic utility of the admission complete
blood count (CBC) and differential count is lacking.
OBJECTIVE: To identify independent predictors of mortality from the varied num-
ber and morphology of cells in the complete blood count defined as a hemogram,
automated five cell differential count and manual differential count.
DESIGN: Retrospective cohort study and chart review.
SETTING: Wishard Memorial Hospital, a large urban primary care hospital.
PATIENTS: A total of 46,522 adult inpatients admitted over 10 years to Wishard
Memorial Hospital—from January 1993 through December 2002.w
INTERVENTION: None.
MEASUREMENTS: Thirty-day mortality measured from day of admission as deter-
mined by electronic medical records and Indiana State death records.
RESULTS: Controlling for age and sex, the multivariable regression model identified
3 strong independent predictors of 30-day mortality—nucleated red blood cells
(NRBCs), burr cells, and absolute lymphocytosis— each of which was associated
with a 3-fold increase in the risk of death within 30 days. The presence of nucleated
RBCs was associated with a 30-day mortality rate of 25.5% across a range of
diagnoses, excluding patients with sickle-cell disease and obstetric patients, for
whom NRBCs were not associated with increased mortality. Having burr cells was
associated with a mortality rate of 27.3% and was found most commonly in
patients with renal or liver failure. Absolute lymphocytosis predicted poor outcome
in patients with trauma and CNS injury.
CONCLUSIONS: Among patients admitted to Wishard Memorial Hospital, the presence of
nucleated RBCs, burr cells, or absolute lymphocytosis at admission was each indepen-
dently associated with a 3-fold increase in risk of death within 30 days of admission.
Journal of Hospital Medicine 2007;2:5–12. © 2007 Society of Hospital Medicine.
KEYWORDS: diagnostic decision making, laboratory testing, electronic medicalrecord.
The complete blood count (CBC) bundles the automated hemo-gram, an automated differential count of 5 types of cells, and a
reflex manual differential count (when required by protocol) andis one of the most frequently ordered laboratory tests on admis-sion to the hospital. In practice, it is a routine ingredient of allhospital admission orders—physicians order a hemogram eitheralone or as part of a complete blood count for 98% of our medical/surgical admissions, and the same is true at most institutions.1 Weknow that the white blood cell count and hematocrit from theautomated hemogram predict disease severity and mortalityrisk.2–5 For example, elevated WBC counts predict a worse prog-nosis in patients with cancer or coronary artery disease,6,7 andanemia predicts increased risk of death of patients with heart
O R I G I N A L R E S E A R C H
© 2007 Society of Hospital MedicineDOI 10.1002/jhm.143Published online in Wiley InterScience (www.interscience.wiley.com).
5
failure.8,9 Further, these two tests provide directmanagement guidance in common circumstances,for example, bleeding and infection.
The CBC describes the number and morphol-ogy of more than 40 cell types, from acanthocytosisto vacuolated white blood cells. Disagreement ex-ists about the clinical significance of many of theseobservations.10 –13 And only a few components ofthe manual differential, for example, nucleated redblood cells (NRBCs) and lymphocytosis, have beenquantitatively evaluated to determine their prog-nostic significance.14 –17 But these two observationshave not been examined to determine their inde-pendent contributions to predictions of mortalitywhen taken in conjunction with their accompany-ing CBC observations. Which of the numerous celltypes and cell counts in the commonly orderedCBC, indicate that a patient is at high risk of death?In this article we report an inpatient study that usedunivariate and multivariate analyses of admissionCBCs to predict 30-day mortality in order to answerthat question.
METHODSPatients and ProtocolThe institutional review board of Indiana Univer-sity, Purdue University, Indianapolis, approved thisstudy. We included in the study all adult patients(those at least 18 years old) admitted to WishardHospital between January 1, 1993, and December31, 2002, except for prisoners (for IRB reasons) andobstetric patients (because their 30-day mortality isvery close to zero— 0.07% at our institution).Wishard Hospital is a large urban hospital thatserves a diverse but predominantly inner-city pop-ulation in Indianapolis. If a patient was admittedmore than once during the 10 years of observation,we included only the first admission in the analysisin order to assure statistical independence of theobservations. We extracted data from the Regen-strief Medical Record System (RMRS), a compre-hensive medical records system that has demo-graphic data, vital signs, diagnoses, results ofclinical tests, and pharmacy information on all in-patient, emergency department, and outpatient en-counter sites.18
We obtained the admission and discharge ICD9and DRG codes to assess the disease patterns asso-ciated with individual CBC abnormalities. We ob-tained these codes from routine hospital caseabstractions performed by Wishard Hospital’s med-ical records department using NCoder� and
Quadramed. Patients assigned DRG codes 370-384were identified as obstetric and therefore excluded.Using the ICD9 and CPT codes according to theCharlson algorithm, we calculated a Charlson Co-morbidity Index value19 for each patient as amarker of coexisting conditions.
OutcomesThe primary outcome was 30-day mortalitycounted from the date of admission. We used in-formation from the hospital record (inpatientdeaths) and the Indiana state death tapes to deter-mine the dates of death of all patients. Patientswere matched to the Indiana death tapes by analgorithm using name, social security number, dateof birth, and sex.20
Hemogram and Differential Count Test MethodsThe hemogram, differential counts, and bloodsmear exam results included in this study all camefrom Wishard Hospital’s laboratory. During thisstudy, the hospital used only 2 cell counters, theCoulter STK-S and the Gen-S automated blood an-alyzer (Beckman Coulter, Brea, California), to pro-duce hemogram and automated blood differentialcounts. Both instruments provided automated dif-ferential counts of 5 cell types: neutrophils, lym-phocytes, monocytes, basophils, and eosinophils.The latter machine also produced platelet countsand reticulocyte counts, but during the study pe-riod these counts were not routinely reported tophysicians unless ordered specifically, so we didnot include them in the analyses. The laboratoryreflexively performed 100-cell manual differentialcounts and blood smear exams when abnormalitiesas defined by College of American Pathologists(CAP) criteria were observed in the automated mea-sures. Both automated blood analyzers used thesame automated CAP criteria to decide when to adda manual differential count and blood smear anal-ysis, and these criteria were constant throughoutthe study. This protocol predicts manual differen-tial abnormalities with high sensitivity, missing lessthan 1% of important findings in a manual differ-ential.21 When the CAP criteria did not require amanual differential count and blood smear exam,we assumed that those counts unique to a manualcount, for example, blast cell count, were zero andthat there were no abnormalities in blood smearmorphology.
Laboratories may report white blood cells asabsolute counts (eg, number of cells/mm3) and/or
6 Journal of Hospital Medicine Vol 2 / No 1 / Jan/Feb 2007
as percentages. We converted all counts reported aspercentages to absolute numbers (eg, WBC count� 1000 � cell type percent/100). For absolutecounts that have both high and low ranges, such aswhite blood cell (WBC) count, we constructed twobinary variables. WBC-low was 1 when the WBCwas below the lower limit of normal; otherwise itwas 0. WBC-high was 1 if the WBC was above theupper limit of normal; otherwise it was 0. For con-tinuous variables such as NRBCs or blasts whereany presence on the manual differential count isabnormal, we constructed binary variables with 0indicating absence of the cell type and 1 indicatinga cell count was at least 1.
Measurements of many cell types in the manualdifferential count and smear assessment (eg, burrcells) are reported in qualitative terms such as “oc-casional,” “few,” “increased,” or “present,” if ob-served, or “none seen,” “unremarkable,” or “nomention,” if not observed. We dichotomized allsuch results as present or absent for analysis pur-poses.
Statistical AnalysisFor all the original variables, we plotted cell countsagainst 30-day mortality to graphically show thisunivariate association. To screen the effects of these45 binary CBC variables univariately, we used eachas the sole independent variable in a logistic regres-sion model with 30-day mortality as the dependentvariable.
The simultaneous effects of the 45 CBC mea-sures on mortality were investigated using multiplelogistic regression models, always controlling forpatient age (in years, as a continuous variable) andsex (as a dichotomous variable). Two approacheswere taken to handle the large number of predictorsin the model. First, we formed subgroups of predic-tors based on clinical judgment (eg, the subgroup of“bands,” Dohle bodies, and toxic granules associ-ated with infections) and ran logistic regressions ofeach subgroup to choose the significant predictorsof these subgroups to fit them into an overall pre-diction model of 30-day mortality. The results wereverified using a second approach that did not de-pend on subjective judgment. Both backward andforward stepwise variable selection procedureswere used to choose the subset of significant pre-dictors (P � .005) of 30-day mortality in logisticregression, again controlling for age and sex. To besure that the predictive power of the models wasnot decreased by converting continuous variables
into categorical variables, we also ran models thatincluded the continuous variables as potential pre-dictors. We used the c statistic as a measure of thegoodness-of-fit of the models. We included theCharlson Index and the 10 most common admis-sion diagnoses in our model to control for comor-bidities and prime reason for admission, respec-tively.
We performed the analysis using SAS software,version 8.02 (SAS Institute, Inc., Cary, NC).
Chart ReviewFor each independent predictor of 30-day mortalitythat was both statistically significant and had a veryhigh relative risk (�2.5), one author (A.K.) took arandom sample of 100-200 patients with positivevalues for this predictor and reviewed the dictateddischarge summaries in order to asses the clinicalcorrelates of these findings.
RESULTSDuring the 10 years from January 1993 throughDecember 2002, physicians admitted 46,522 uniqueeligible patients to Wishard Memorial Hospital.Each patient averaged 2 admissions during thestudy period, for a total of 94,582 admissions. Theoverall 30-day mortality of these admissions was3.4%. Automated hemograms (white blood cellcount, hemoglobin, red cell count, and red bloodcell indices) were performed on blood samplesfrom 45,709 of these patients (98%) within one dayof admission. Seventy-seven percent (35,692) had acomplete blood count that included an automateddifferential count plus a reflex manual count andsmear when required by the CAP protocol, as wellas an automated hemogram. The patients with anadmission CBC with differential count had a 30-daymortality rate of 4%, slightly higher than that ofpatients who had only a hemogram. The patients’mean Charlson score for the CBC with differentialcount was 0.83, which was lower than the nationalaverage, which is closer to 1.22 Table 1 shows thedemographics of this study population.
Predictors of 30-Day MortalityWe examined the univariate effect of age, sex, andthe 45 CBC variables (Table 2) on 30-day mortality.Most of these variables showed a significant (P� .0001) effect on mortality. Only a few abnormal-ities, for example, a low WBC (� 5000/�L), baso-philia (�200/�L), and eosinophilia (�450/�L), were
Mortality Predictors from the CBC / Kho et al. 7
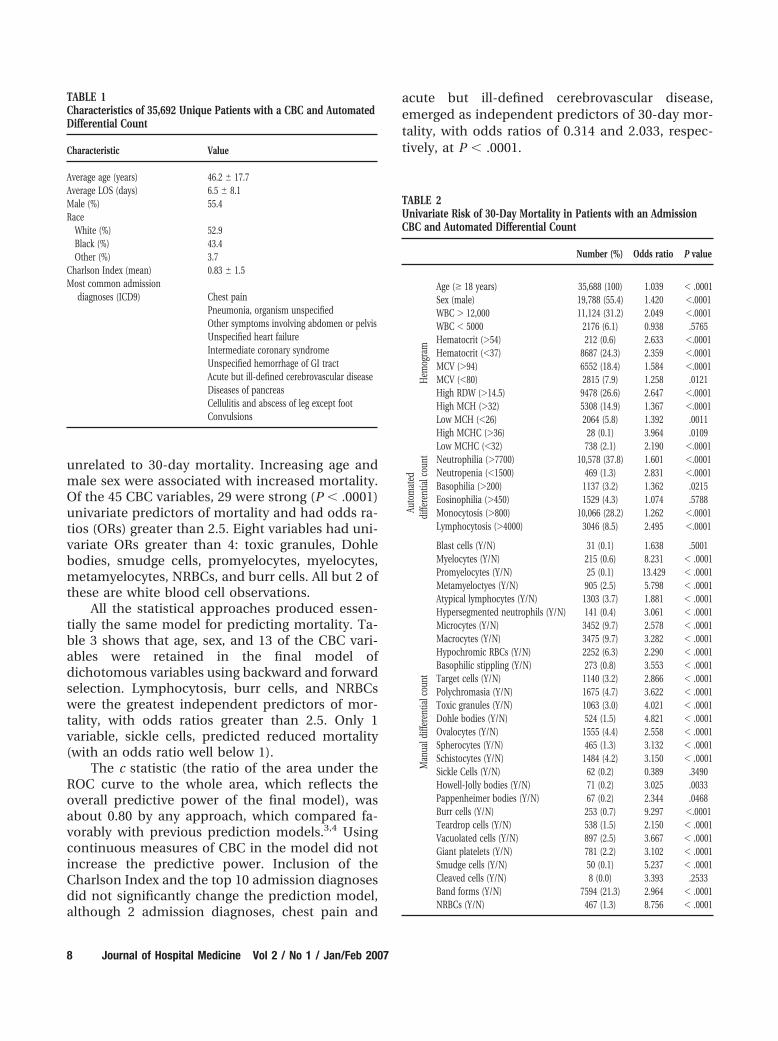
unrelated to 30-day mortality. Increasing age andmale sex were associated with increased mortality.Of the 45 CBC variables, 29 were strong (P � .0001)univariate predictors of mortality and had odds ra-tios (ORs) greater than 2.5. Eight variables had uni-variate ORs greater than 4: toxic granules, Dohlebodies, smudge cells, promyelocytes, myelocytes,metamyelocytes, NRBCs, and burr cells. All but 2 ofthese are white blood cell observations.
All the statistical approaches produced essen-tially the same model for predicting mortality. Ta-ble 3 shows that age, sex, and 13 of the CBC vari-ables were retained in the final model ofdichotomous variables using backward and forwardselection. Lymphocytosis, burr cells, and NRBCswere the greatest independent predictors of mor-tality, with odds ratios greater than 2.5. Only 1variable, sickle cells, predicted reduced mortality(with an odds ratio well below 1).
The c statistic (the ratio of the area under theROC curve to the whole area, which reflects theoverall predictive power of the final model), wasabout 0.80 by any approach, which compared fa-vorably with previous prediction models.3,4 Usingcontinuous measures of CBC in the model did notincrease the predictive power. Inclusion of theCharlson Index and the top 10 admission diagnosesdid not significantly change the prediction model,although 2 admission diagnoses, chest pain and
acute but ill-defined cerebrovascular disease,emerged as independent predictors of 30-day mor-tality, with odds ratios of 0.314 and 2.033, respec-tively, at P � .0001.
TABLE 2Univariate Risk of 30-Day Mortality in Patients with an AdmissionCBC and Automated Differential Count
Number (%) Odds ratio P value
Hem
ogra
m
Age (� 18 years) 35,688 (100) 1.039 � .0001Sex (male) 19,788 (55.4) 1.420 �.0001WBC � 12,000 11,124 (31.2) 2.049 �.0001WBC � 5000 2176 (6.1) 0.938 .5765Hematocrit (�54) 212 (0.6) 2.633 �.0001Hematocrit (�37) 8687 (24.3) 2.359 �.0001MCV (�94) 6552 (18.4) 1.584 �.0001MCV (�80) 2815 (7.9) 1.258 .0121High RDW (�14.5) 9478 (26.6) 2.647 �.0001High MCH (�32) 5308 (14.9) 1.367 �.0001Low MCH (�26) 2064 (5.8) 1.392 .0011High MCHC (�36) 28 (0.1) 3.964 .0109Low MCHC (�32) 738 (2.1) 2.190 �.0001
Auto
mat
eddi
ffere
ntia
lcou
nt Neutrophilia (�7700) 10,578 (37.8) 1.601 �.0001Neutropenia (�1500) 469 (1.3) 2.831 �.0001Basophilia (�200) 1137 (3.2) 1.362 .0215Eosinophilia (�450) 1529 (4.3) 1.074 .5788Monocytosis (�800) 10,066 (28.2) 1.262 �.0001Lymphocytosis (�4000) 3046 (8.5) 2.495 �.0001
Man
uald
iffer
entia
lcou
nt
Blast cells (Y/N) 31 (0.1) 1.638 .5001Myelocytes (Y/N) 215 (0.6) 8.231 � .0001Promyelocytes (Y/N) 25 (0.1) 13.429 � .0001Metamyeloctyes (Y/N) 905 (2.5) 5.798 � .0001Atypical lymphocytes (Y/N) 1303 (3.7) 1.881 � .0001Hypersegmented neutrophils (Y/N) 141 (0.4) 3.061 � .0001Microcytes (Y/N) 3452 (9.7) 2.578 � .0001Macrocytes (Y/N) 3475 (9.7) 3.282 � .0001Hypochromic RBCs (Y/N) 2252 (6.3) 2.290 � .0001Basophilic stippling (Y/N) 273 (0.8) 3.553 � .0001Target cells (Y/N) 1140 (3.2) 2.866 � .0001Polychromasia (Y/N) 1675 (4.7) 3.622 � .0001Toxic granules (Y/N) 1063 (3.0) 4.021 � .0001Dohle bodies (Y/N) 524 (1.5) 4.821 � .0001Ovalocytes (Y/N) 1555 (4.4) 2.558 � .0001Spherocytes (Y/N) 465 (1.3) 3.132 � .0001Schistocytes (Y/N) 1484 (4.2) 3.150 � .0001Sickle Cells (Y/N) 62 (0.2) 0.389 .3490Howell-Jolly bodies (Y/N) 71 (0.2) 3.025 .0033Pappenheimer bodies (Y/N) 67 (0.2) 2.344 .0468Burr cells (Y/N) 253 (0.7) 9.297 �.0001Teardrop cells (Y/N) 538 (1.5) 2.150 � .0001Vacuolated cells (Y/N) 897 (2.5) 3.667 � .0001Giant platelets (Y/N) 781 (2.2) 3.102 � .0001Smudge cells (Y/N) 50 (0.1) 5.237 � .0001Cleaved cells (Y/N) 8 (0.0) 3.393 .2533Band forms (Y/N) 7594 (21.3) 2.964 � .0001NRBCs (Y/N) 467 (1.3) 8.756 � .0001
TABLE 1Characteristics of 35,692 Unique Patients with a CBC and AutomatedDifferential Count
Characteristic Value
Average age (years) 46.2 � 17.7Average LOS (days) 6.5 � 8.1Male (%) 55.4Race
White (%) 52.9Black (%) 43.4Other (%) 3.7
Charlson Index (mean) 0.83 � 1.5Most common admission
diagnoses (ICD9) Chest painPneumonia, organism unspecifiedOther symptoms involving abdomen or pelvisUnspecified heart failureIntermediate coronary syndromeUnspecified hemorrhage of GI tractAcute but ill-defined cerebrovascular diseaseDiseases of pancreasCellulitis and abscess of leg except footConvulsions
8 Journal of Hospital Medicine Vol 2 / No 1 / Jan/Feb 2007
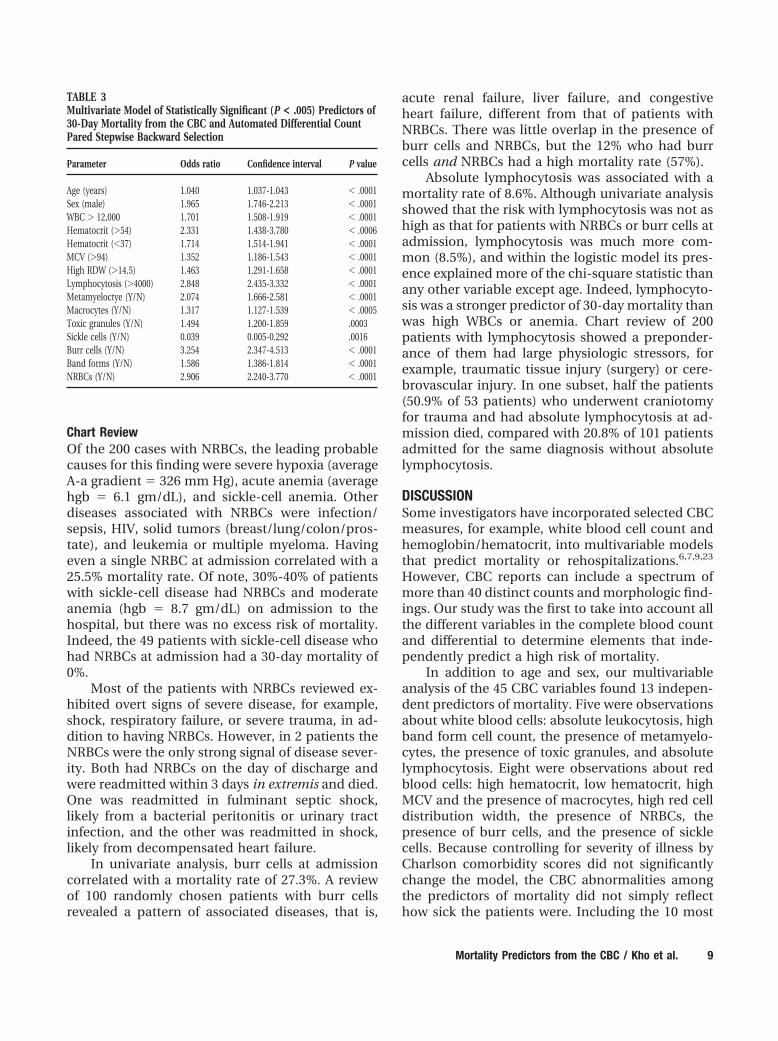
Chart ReviewOf the 200 cases with NRBCs, the leading probablecauses for this finding were severe hypoxia (averageA-a gradient � 326 mm Hg), acute anemia (averagehgb � 6.1 gm/dL), and sickle-cell anemia. Otherdiseases associated with NRBCs were infection/sepsis, HIV, solid tumors (breast/lung/colon/pros-tate), and leukemia or multiple myeloma. Havingeven a single NRBC at admission correlated with a25.5% mortality rate. Of note, 30%-40% of patientswith sickle-cell disease had NRBCs and moderateanemia (hgb � 8.7 gm/dL) on admission to thehospital, but there was no excess risk of mortality.Indeed, the 49 patients with sickle-cell disease whohad NRBCs at admission had a 30-day mortality of0%.
Most of the patients with NRBCs reviewed ex-hibited overt signs of severe disease, for example,shock, respiratory failure, or severe trauma, in ad-dition to having NRBCs. However, in 2 patients theNRBCs were the only strong signal of disease sever-ity. Both had NRBCs on the day of discharge andwere readmitted within 3 days in extremis and died.One was readmitted in fulminant septic shock,likely from a bacterial peritonitis or urinary tractinfection, and the other was readmitted in shock,likely from decompensated heart failure.
In univariate analysis, burr cells at admissioncorrelated with a mortality rate of 27.3%. A reviewof 100 randomly chosen patients with burr cellsrevealed a pattern of associated diseases, that is,
acute renal failure, liver failure, and congestiveheart failure, different from that of patients withNRBCs. There was little overlap in the presence ofburr cells and NRBCs, but the 12% who had burrcells and NRBCs had a high mortality rate (57%).
Absolute lymphocytosis was associated with amortality rate of 8.6%. Although univariate analysisshowed that the risk with lymphocytosis was not ashigh as that for patients with NRBCs or burr cells atadmission, lymphocytosis was much more com-mon (8.5%), and within the logistic model its pres-ence explained more of the chi-square statistic thanany other variable except age. Indeed, lymphocyto-sis was a stronger predictor of 30-day mortality thanwas high WBCs or anemia. Chart review of 200patients with lymphocytosis showed a preponder-ance of them had large physiologic stressors, forexample, traumatic tissue injury (surgery) or cere-brovascular injury. In one subset, half the patients(50.9% of 53 patients) who underwent craniotomyfor trauma and had absolute lymphocytosis at ad-mission died, compared with 20.8% of 101 patientsadmitted for the same diagnosis without absolutelymphocytosis.
DISCUSSIONSome investigators have incorporated selected CBCmeasures, for example, white blood cell count andhemoglobin/hematocrit, into multivariable modelsthat predict mortality or rehospitalizations.6,7,9,23
However, CBC reports can include a spectrum ofmore than 40 distinct counts and morphologic find-ings. Our study was the first to take into account allthe different variables in the complete blood countand differential to determine elements that inde-pendently predict a high risk of mortality.
In addition to age and sex, our multivariableanalysis of the 45 CBC variables found 13 indepen-dent predictors of mortality. Five were observationsabout white blood cells: absolute leukocytosis, highband form cell count, the presence of metamyelo-cytes, the presence of toxic granules, and absolutelymphocytosis. Eight were observations about redblood cells: high hematocrit, low hematocrit, highMCV and the presence of macrocytes, high red celldistribution width, the presence of NRBCs, thepresence of burr cells, and the presence of sicklecells. Because controlling for severity of illness byCharlson comorbidity scores did not significantlychange the model, the CBC abnormalities amongthe predictors of mortality did not simply reflecthow sick the patients were. Including the 10 most
TABLE 3Multivariate Model of Statistically Significant (P < .005) Predictors of30-Day Mortality from the CBC and Automated Differential CountPared Stepwise Backward Selection
Parameter Odds ratio Confidence interval P value
Age (years) 1.040 1.037-1.043 � .0001Sex (male) 1.965 1.746-2.213 � .0001WBC � 12,000 1.701 1.508-1.919 � .0001Hematocrit (�54) 2.331 1.438-3.780 � .0006Hematocrit (�37) 1.714 1.514-1.941 � .0001MCV (�94) 1.352 1.186-1.543 � .0001High RDW (�14.5) 1.463 1.291-1.658 � .0001Lymphocytosis (�4000) 2.848 2.435-3.332 � .0001Metamyeloctye (Y/N) 2.074 1.666-2.581 � .0001Macrocytes (Y/N) 1.317 1.127-1.539 � .0005Toxic granules (Y/N) 1.494 1.200-1.859 .0003Sickle cells (Y/N) 0.039 0.005-0.292 .0016Burr cells (Y/N) 3.254 2.347-4.513 � .0001Band forms (Y/N) 1.586 1.386-1.814 � .0001NRBCs (Y/N) 2.906 2.240-3.770 � .0001
Mortality Predictors from the CBC / Kho et al. 9
common admission diagnoses did not significantlyattenuate our reported odds ratios, suggesting theCBC predictors did not merely reflect the primaryreason for admission. Interestingly, however, ad-mission for chest pain did correlate with a greatlyreduced risk of 30-day mortality, which may reflectthe low threshold that physicians have for admit-ting patients with this complaint. Admission foracute but ill-defined cerebrovascular disease inde-pendently predicted a 2-fold increased risk of 30-day mortality.
What is the message to physicians from thisanalysis? Physicians commonly order CBCs andmay rely on quick heuristics to sift through themyriad findings in CBC reports. Our analysis fo-cuses physician attention on high-impact findingsin the CBC. We assume that physicians alreadyconsider low hematocrit, high hematocrit (a sign offluid loss and/or chronic hypoxia), high WBCcount, high band cell count, and the presence ofmetamyeloctes (left shift) as important prognosticindicators. These abnormal findings are routinelymentioned at morning report and in a physician’snotes.
Physicians, however, may not appreciate theimportance of other CBC findings that our analysisfound are predictive of mortality. Macrocytosis anda high RDW count (indicating an abnormally widedistribution of red blood cell size) have not previ-ously been reported as predictors of mortality. Andalthough other studies have suggested that bandsare not predictors of mortality,11 our study foundthey were an important prognostic indicator, withan OR �1.59, approaching those of leukocytosisand anemia.
The most impressive predictors of mortalitywere burr cells, NRBCs, and absolute lymphocyto-sis. The multivariate ORs of these 3, ranging from2.8 to 3.2, were the highest of any CBC finding. Inunivariate analysis, the first 2 were associated withmortality rates 8 to 10 times higher than that of theaverage admitted patient. There are anecdotal re-ports in the literature of burr cells being associatedwith ominous prognoses24-26 and more robust sta-tistical analyses showing NRBCs to be associatedwith increased mortality.14 Lymphocytosis has alsobeen reported as a mortality risk in patients withtrauma and emergency medical conditions.15,16
Our analysis has shown that, indeed, all 3 of thesefindings are strong independent predictors of mor-tality.
The presence of sickle cells was also a strong
predictor, but of decreased mortality. Patients withsickle cells in their smear had a risk of death onethird that of patients without sickle cells. This doesnot indicate a protective effect. Rather, patientswith sickle-cell disease typically are young and ad-mitted for pain control and other non-life-threat-ening conditions. The presence of NRBCs in pa-tients with sickle-cell disease appears to be intrinsicto the disease itself and did not have the sameimplications for mortality as it did for other patientsin our study.
The overall logistic model including age, sex,and admission CBC variables had a respectable cstatistic for predicting 30-day mortality of 0.80. Thiscompares well with findings in other multivariablemodels. For example, the APACHE II score used topredict the mortality of hospitalized critical carepatients has a c statistic that ranges from 0.78 to0.86.3,27,28 The APACHE score uses the worst valuefrom the first 2 days after admission for some of itspredictors so it cannot provide as early a warning asthe admission CBC, and it requires collection ofsignificantly more data. The inclusion of more CBCfindings in the APACHE model might increase itspredictive accuracy.
Our multivariate analysis was based on a verylarge number of patient samples using data col-lected through routine clinical care. However, ourstudy has a number of limitations. The analysis wasdone at only a single institution, and the exactlogistic regression model may not apply to otherinstitutions that have different case mixes and lab-oratory procedures. Our institution’s reported 30-day mortality rate of 3.4% was lower than the 4.6%-11.9% reported in studies of patients admitted togeneral ward services,29 –31 but this may be ac-counted for by the lower-than-average Charlsoncomorbidity scores in our study population. Ourrisk adjustment by Charlson comorbidity scoresmay not be as precise as a risk adjustment tailoredfor our particular institution.32 Our 30-day mortal-ity rate was calculated using state death tapes,which means we would have missed patients whodied outside the state, although we believe thisrarely happens. We developed predictive equationson the basis of 30-day mortality, so we cannot com-ment on whether the CBC elements predict mortal-ity beyond 30 days. We analyzed most variables aseither high or low or as present or absent. Increas-ing degrees of abnormality may further increase thepredictive power of some variables. Finally, theCBC is only one of many tests and clinical findings;
10 Journal of Hospital Medicine Vol 2 / No 1 / Jan/Feb 2007
it may be that some of these other variables woulddisplace some CBC variables and/or improve theoverall predictive power at the time the admissionlaboratory tests were performed. In this initialstudy, we have described the prognostic implica-tion of the CBC across a wide range of diagnoses.Future work will focus on the predictive power ofcommonly gathered variables in more specific con-ditions (eg, low white blood cell count in sepsis).
Physicians generally have an intuitive ability toidentify patients who are seriously ill and at highrisk of dying33 and adjust their diagnostic and ther-apeutic efforts accordingly. Our analysis highlightsthe value that certain observations in the CBC, no-tably burr cells, NRBCs, and absolute lymphocyto-sis, add to physicians’ assessments of mortality risk.Even after adjustment for age, sex, comorbidities,common admission diagnoses, and other variablesin the CBC, the presence of these findings predicteda 3-fold increase in 30-day mortality. Identifying the“red flags” within this ubiquitously performed testcan make the difference in premature discharge orinappropriate triage of patients. Busy physicianscan choose from a wide selection of ever-improvingdiagnostic tests, yet the workhorse CBC can serve asa simple and early identifier of patients with a poorprognosis.
Address for correspondence and reprint requests: Abel N Kho, NorthwesternUniversity, General Internal Medicine, 676 N. St. Clair, Suite 200, Chicago, IL60611; Fax: (312) 695-4307; E-mail: [email protected]
Received 5 December 2005; revision received 20 September 2006; accepted5 October 2006.
REFERENCES1. Shapiro MF, Greenfield SG. The complete blood count and
leukocyte differential count. Ann Intern Med. 1987;106:65-74.
2. Chang R, Wong GY. Prognostic significance of marked leu-kocytosis in hospitalized patients. J Gen Intern Med. 1991;6:199-203.
3. Knaus WA, Wagner DP, Draper EA, et al. The APACHE IIIprognostic system. Risk prediction of hospital mortality forcritically ill hospitalized adults. Chest. 1991;100:1619-1636.
4. Knaus WA, Draper EA, Wagner DP, Zimmerman JE. APACHEII: a severity of disease classification system. Crit Care Med.1985;13:818-829.
5. Fine MJ, Auble TE, Yealy DM, et al. A prediction rule toidentify low-risk patients with community-acquired pneu-monia. N Engl J Med. 1997;336:243-250.
6. Grimm R, Neaton J, Ludwig W. Prognostic importance of thewhite blood cell count for coronary, cancer, and all-causemortality. JAMA. 1985;254:1932-1937.
7. Labry LD, Campion E, Glynn R, Vokonas P. White blood cellcount as a predictor of mortality: results over 18 years fromthe Normative Aging Study. J Clin Epidemiol. 1990;43:153-157.
8. Frumin AM, Mendell TH, Mintz SS, Novack P, Faulk AT.Nucleated red blood cells in congestive heart failure. Circu-lation. 1959;20:367-370.
9. Mozaffarian D, Nye R, Levy WC. Anemia predicts mortalityin severe heart failure: the prospective randomized amlo-dipine survival evaluation (PRAISE). J Am Coll Cardiol. 2003;41:1933-1939.
10. Ardron MJ, Westengard JC, Dutcher TF. Band neutrophilcounts are unnecessary for the diagnosis of infection inpatients with normal total leukocyte counts. Am J ClinPathol. 1994;102:646-649.
11. Brigden M, Page N. The lack of clinical utility of white bloodcell differential counts and blood morphology in elderlyindividuals with normal hematology profiles. Arch PatholLab Med. 1990;114:394-398.
12. Wenz B, Gennis P, Canova C, Burns ER. The clinical utility ofthe leucocyte differential in emergency medicine. Am J ClinPathol. 1986;86:298-303.
13. Wile MJ, Homer LD, Gaehler S, Phillips S, Millan J. Manualdifferential cell counts help predict bacterial infection. Am JClin Pathol. 2001;115:644-649.
14. Schwartz SO, Stansbury F. Significance of nucleated redblood cells in peripheral blood; analysis of 1,496 cases.JAMA. 1954;154:1339-1340.
15. Stachon A, Sondermann N, Imohl M, Krieg M. Nucleated redblood cells indicate high risk of in-hospital mortality. J LabClin Med. 2002;140:407-412.
16. Teggatz JR, Parkin J, Peterson L. Transient atypical lympho-cytosis in patients with emergency medical conditions. ArchPathol Lab Med. 1987;111:712-714.
17. Pinkerton PH, McLellan BA, Quantz MC, Robinson JB. Acutelymphocytosis after trauma— early recognition of the high-risk patient? J Trauma. 1989;29:749-751.
18. McDonald CJ, Overhage JM, Tierney WM, et al. The Regen-strief Medical Record System: a quarter century experience.Int J Med Inf. 1999;54:225-253.
19. Charlson M, Szatrowski TP, Peterson J, Gold J. Validation ofa combined comorbidity index. J Clin Epidemiol. 1994;47:1245-1251.
20. Grannis S, Overhage JM, McDonald CJ. Real world perfor-mance of approximate string comparators for use in patientmatching. Medinfo. 2004;11(Pt1):43-47.
21. Picard F, Gicquel C, Marnet L, Guesnu M, Levy JP. Prelim-inary evaluation of the new hematology analyzer COULTERGEN-S in a university hospital. Clin Chem Lab Med. 1999;37:681-686.
22. Rosenthal GE, Kaboli PJ, Barnett MJ. Differences in length ofstay in veterans health administration and other unitedstates hospitals: is the gap closing? Med Care. 2003;41:882-894.
23. Kosiborod M, Smith G, Radford M, Foody J, Krumholz H.The Prognostic importance of anemia in patients with heartfailure. Am J Med. 2003;114:112-119.
24. Schwartz SO, Motto SA. The diagnostic significance of“burr” red blood cells. Am J Med Sci. 1949;218:563.
25. Aherne WA. The “burr” red cell and azotemia. J Clin Pathol.1957;10:252-257.
Mortality Predictors from the CBC / Kho et al. 11
26. Bell RE. The origin of ‘burr’ erythrocytes. Br J Haematol.1963;9:552-555.
27. de Keizer NF, Bonsel GJ, Goldfad C, Rowan KM. Theadded value that increasing levels of diagnostic informa-tion provide in prognostic models to estimate hospitalmortality for adult intensive care patients. Intern CareMed. 2000;26:577-584.
28. Harrell F, Califf R, Pryor D, Lee K, Rosati R. Evaluating theyield of medical tests. JAMA. 1982;247:2543-2546.
29. Meltzer D, Manning WG, Morrison J, et al. Effects of physi-cian experience on costs and outcomes on an academicgeneral medical service: results of a trial of hospitalists. AnnIntern Med. 2002;137:866-874.
30. Kearns PJ, Wang CC, Morris WJ, et al. Hospital care by
hospital-based and clinic-based faculty. a prospective, con-trolled trial. Arch Intern Med. 2001;161:235-241.
31. Auerbach AD, Wachter RM, Katz P, Showstack J, Baron RB,Goldman L. Implementation of a voluntary hospitalist ser-vice at a community teaching hospital: improved clinicalefficiency and patient outcomes. Ann Intern Med. 2002;137:859-865.
32. Rosenthal GE, Harper DL, Quinn LM, Cooper GS. Severity-adjusted mortality and length of stay in teaching and non-teaching hospitals: results of a regional study. JAMA. 1997;278:485-490.
33. McClish DK, Powell SH. How well can physicians estimatemortality in a medical intensive care unit? Med Decis Mak.1989;9:125-132.
12 Journal of Hospital Medicine Vol 2 / No 1 / Jan/Feb 2007