where people die (1974--2030): past trends, future projections and implications for care
TRANSCRIPT
http://pmj.sagepub.com/Palliative Medicine
http://pmj.sagepub.com/content/22/1/33The online version of this article can be found at:
DOI: 10.1177/0269216307084606
2008 22: 33Palliat MedBarbara Gomes and Irene J. Higginson
2030): past trends, future projections and implications for care−−Where people die (1974
Published by:
http://www.sagepublications.com
can be found at:Palliative MedicineAdditional services and information for
http://pmj.sagepub.com/cgi/alertsEmail Alerts:
http://pmj.sagepub.com/subscriptionsSubscriptions:
http://www.sagepub.com/journalsReprints.navReprints:
http://www.sagepub.com/journalsPermissions.navPermissions:
http://pmj.sagepub.com/content/22/1/33.refs.htmlCitations:
What is This?
- Jan 23, 2008Version of Record >>
at UNIV OF VIRGINIA on November 6, 2013pmj.sagepub.comDownloaded from at UNIV OF VIRGINIA on November 6, 2013pmj.sagepub.comDownloaded from at UNIV OF VIRGINIA on November 6, 2013pmj.sagepub.comDownloaded from at UNIV OF VIRGINIA on November 6, 2013pmj.sagepub.comDownloaded from at UNIV OF VIRGINIA on November 6, 2013pmj.sagepub.comDownloaded from at UNIV OF VIRGINIA on November 6, 2013pmj.sagepub.comDownloaded from at UNIV OF VIRGINIA on November 6, 2013pmj.sagepub.comDownloaded from at UNIV OF VIRGINIA on November 6, 2013pmj.sagepub.comDownloaded from at UNIV OF VIRGINIA on November 6, 2013pmj.sagepub.comDownloaded from at UNIV OF VIRGINIA on November 6, 2013pmj.sagepub.comDownloaded from
Palliative Medicine 2008; 22: 33–41
Introduction
Each year 58 million people die around the world, 53% aged60 and over.1 Global numbers of deaths in the world areexpected to rise to 74 million per year by 2030, with a dra-matic shift to older ages and towards chronic diseases.2 Themajority of deaths in many developed countries take place inhospitals against people’s wishes.3,4 This led the WHO todevelop international recommendations on planning caretowards the end of life, which is responsive to patient choicefor place of care and death.5,6 In countries such as the US,Australia and Canada more people are now dying athome.7–9 In others such as Italy and Japan a trend towardshospitalization persists.10,11
By 2030, similar to many other ageing nations, 22% of thepopulation in England and Wales is expected to be aged 65 years or older.12 Where will all these people die? Will theNational Health Service (NHS) be able to provide adequatecare towards the end of life for all in need? And where? In
this paper we analyse national trends in place of death from1974 to 2003, and project future numbers and proportions ofdeaths by place up to 2030, accounting for ageing to exam-ine the implications for care.
Methods
DesignSecondary analysis of routine data
SettingEngland and Wales
Data sourcesAggregated data on population and all deaths for Englandand Wales between 1974 and 2003 were provided free ofcharge by the Office for National Statistics (ONS) in a seriesof published tables (data from 1998 onwards available athttp://www.statistics.gov.uk). Forecasts for future popula-tions and deaths until 2030 were extracted from the 2004based population projections by the Government Actuary’sDepartment (GAD). The methods used for GAD forecastsare described in detail elsewhere.12 They extrapolate trends from a number of components of population change
Address for correspondence: Barbara Gomes, PhD ResearchTraining Fellow, BSc, MSc, Cicely Saunders International/Department of Palliative Care, Policy and Rehabilitation, King’sCollege London, Weston Education Centre, 10 Cutcombe Road,London SE5 9RJ, UK. E-mail: [email protected]
© 2008 SAGE Publications, Los Angeles, London, New Delhi and Singapore 10.1177/0269216307084606
Where people die (1974–2030): past trends, futureprojections and implications for careBarbara Gomes and Irene J Higginson Cicely Saunders International/Department of Palliative Care, Policy and Rehabilitation, King’s College London, London
Background: Ageing nations have growing needs for end of life care, but these have neverbeen projected in detail. We analysed past trends in place of death (1974–2003) and pro-jected likely trends to 2030 in England and Wales and from these need for care. Methods:
Mortality trends and forecasts were obtained from official statistics. Future scenarios weremodelled using recent five-year trends in age and gender specific home death proportionsto estimate numbers of deaths by place to 2030, accounting for future changes in the ageand gender distribution of deaths. Results: Annual numbers of deaths fell by 8% from1974 to 2003, but are expected to rise by 17% from 2012 to 2030. People will die increas-ingly at older ages, with the percentage of deaths among those aged 85 and expected torise from 32% in 2003 to 44% in 2030. Home death proportions fell from 31% to 18%overall, and at an even higher rate for people aged 65 and over, women and noncancerdeaths. If recent trends continue, numbers of home deaths could reduce by 42% andfewer than 1 in 10 will die at home in 2030. Annual numbers of institutional deaths (cur-rently 440 936) will be 530 409 by 2030 (20% increase). Conclusions: In England andWales home deaths have been decreasing. The projections underline the urgent need forplanning care to accommodate a large increase of ageing and deaths. Either inpatient facil-ities must increase substantially, or many more people will need community end of lifecare from 2012 onwards. Palliative Medicine 2008; 22: 33–41
Key words: aged; forecasting; health services need and demand; mortality; palliative care; trends
34 B Gomes and IJ Higginson
including baseline population, birth rate, death rate and netmigration and rely on several explicit underlying assump-tions about average completed family size, expectancy of lifebased on mortality, and net migration.13,14
Classification of place of deathPlace of death is currently classified by the ONS in six maincategories – 1) at home, 2) psychiatric hospitals, 3) hospices,4) hospitals and communal establishments for the care of thesick (divided into NHS and non-NHS and in this paperreferred to as hospitals and nursing homes), 5) other com-munal establishments and 6) other private homes or otherplaces (called elsewhere). Although there were changes inthis classification over the years, the category of home deathremained stable.15 For the purpose of this analysis, the cate-gory of NHS hospitals and communal establishments for thecare of the sick was shortened to NHS hospitals (note how-ever, that it included 87 NHS managed nursing homes in2003) and all deaths occurring in places other than homewere called institutional deaths.
Analysis
Trends. Death statistics for England and Wales wereanalysed from 1974 to 2003 (total population, number ofdeaths, death rate and gender and age distribution of deaths).Trends in home deaths were examined by gender and agegroup. A comparison between cancer and noncancer deathswas undertaken because of the considerable end of life careavailable for cancer patients.16 Detailed trends for place ofdeath over the last five years (1999–2003) were tabulated.Chi-square tests for trend were used to test the statistical sig-nificance of trends over the years.
We calculated percent annual changes in home death pro-portions and standardized home death proportions. The lat-ter would enable comparisons of home death proportions atdifferent times, which are unaffected by changes in the ageand gender distribution of deaths. The home death propor-tions were standardized by age and gender according to the distribution in 1974, as the initial year of the availabledata. A breakdown of deaths into seven standard age groupswas used in all calculations (up to 4, 5–14, 15–44, 45–64,65–74, 75–84, 85 and over years). We also calculated theabsolute difference between the observed and estimatednumbers of home deaths in 2003, if the age distribution wasas in 1974.
Projections. Simple linear models were used to predictfuture trends in place of death. We projected forward therecent trend in age and gender specific proportions of homedeaths (1999–2003), assuming this continues in the future.Average percent annual changes in age and gender specifichome death proportions were applied to the age and gender
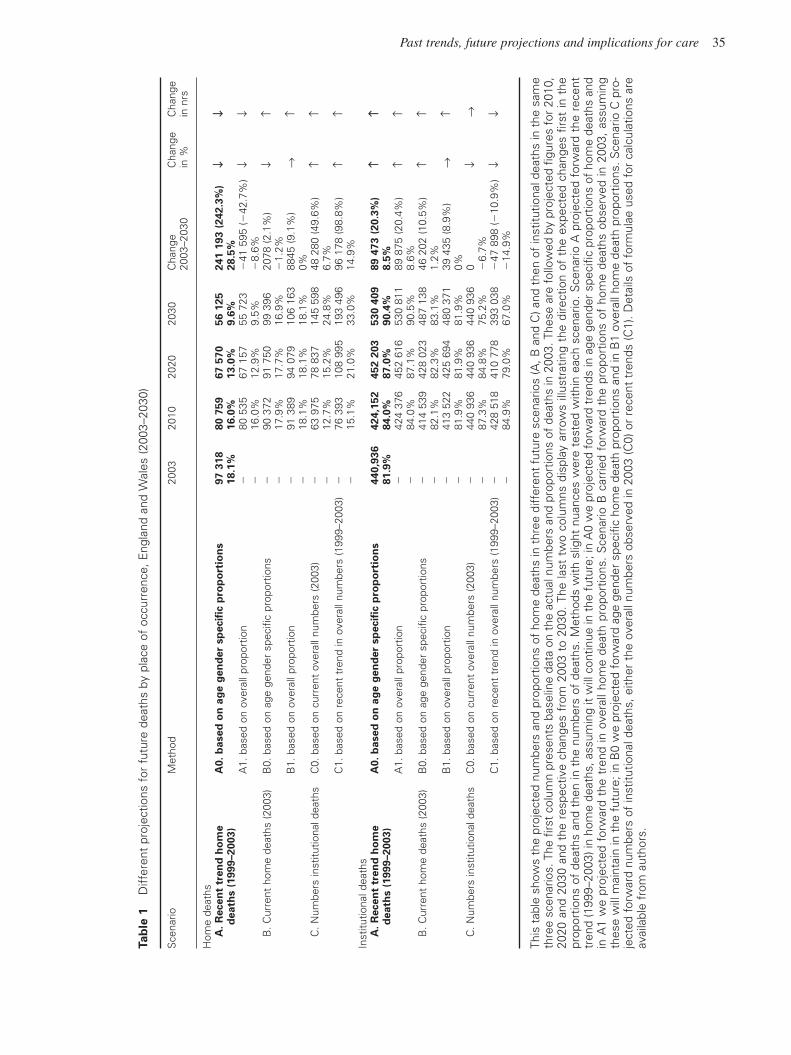
distribution of deaths in future years until 2030, using dataextracted from GAD mortality forecasts. Other scenarioswere modelled based on alternative assumptions (Table 1).Namely, an alternative projection was made projecting forward the recent trend in overall numbers of institutionaldeaths (including NHS hospitals and non-NHS settings). The underlying assumption for this projection method was that absolute numbers of institutional deaths may reflectthe capacity of inpatient services. This was based on the factthat the availability of inpatient beds is one of the strongestpredictors of place of death in the literature.17 We comparedthe projections with special attention to changes in absolutenumbers of deaths by place, useful for health planning purposes. Implications for care were discussed. Analysis ofpast trends and projections were based on place of death datauntil 2003. More recent figures were subsequently obtainedfrom ONS for 2004 and compared with our projections.Percentage differences between actual figures and the pro-jected 2004 figures were calculated for both numbers andproportions of home deaths for the different scenarios.
Results
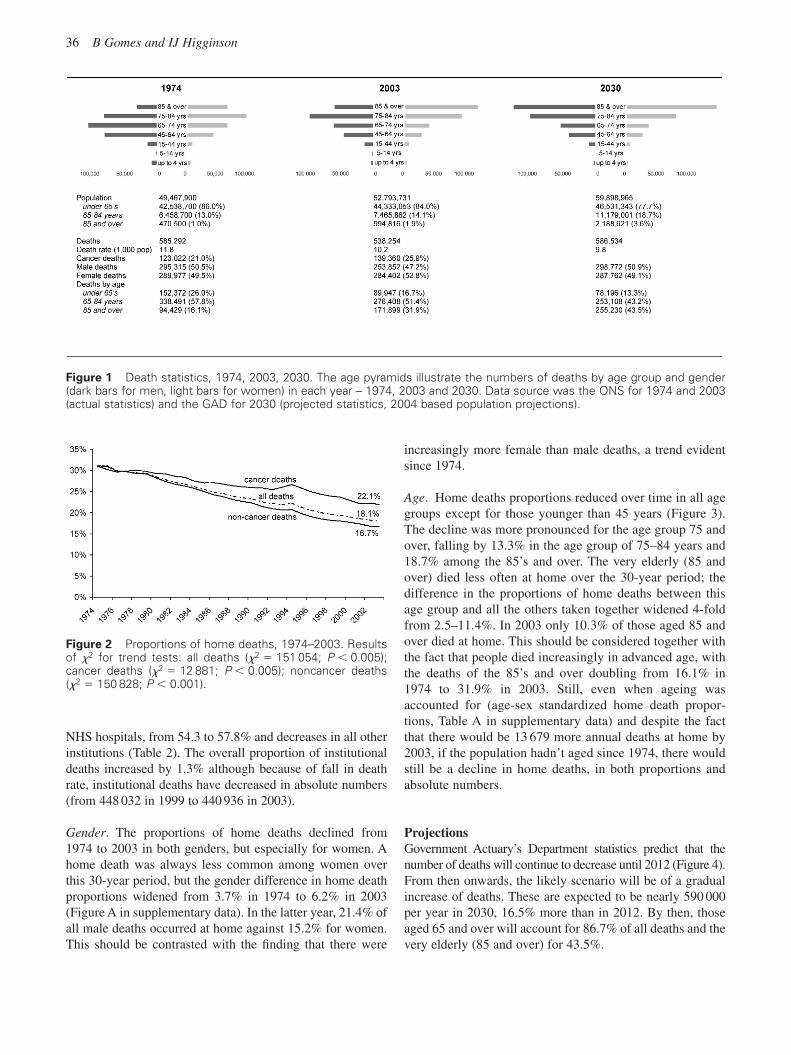
Past trendsBetween 1974 and 2003 a total of 17 055 579 people died inEngland and Wales, with an annual average of 568 519deaths. During this time period the population grew 6.7%,yet the number of deaths fell by 8.0%. Consequently, thedeath rate (per 1000 population) declined from 11.8 in 1974to 10.2 in 2003. Deaths due to cancer increased from 21.0%to 25.9% of all deaths. The number of people dying at theage of 85 and over doubled from 1974 to 2003 (Figure 1).
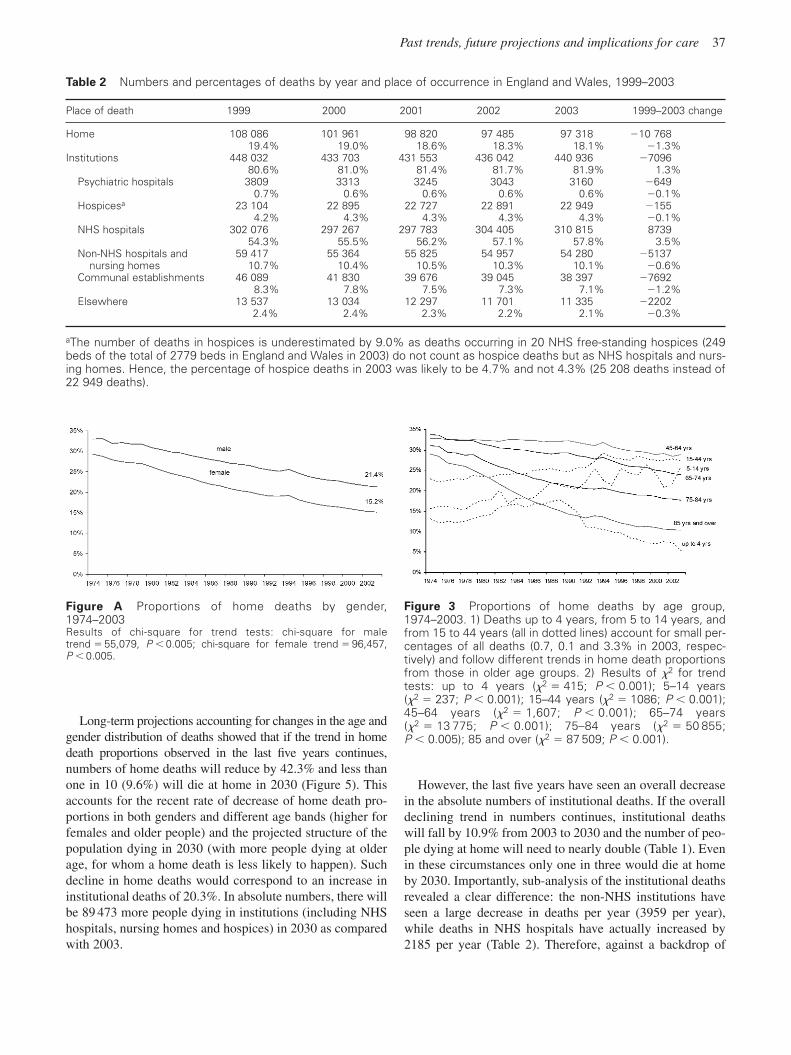
Between 1974 and 2003, 4 150 252 persons died in theirhomes (24.3%), with an annual average of 138 342 homedeaths. Home deaths fell from 31.1% in 1974 to 18.1% in2003. This fall was more pronounced in noncancer deaths. In1974 similar proportions of noncancer and cancer deathsoccurred at home (31.2 and 31.0%, respectively), but thesefell to 22.1% for cancer and 16.7% for noncancer deaths in2003 (Figure 2).
Overall, home death proportions declined slowly, butsteadily, with an average percent annual change of �0.5%and yearly fluctuations of no more than 1.0%. Yet, there weretwo periods in which the reduction appeared to have stopped:1977–1978 and 1993–1994. In these years there were smallincreases in home death proportions, especially in1993–1994. Although greater for cancer (0.6% increases in1993 and 1994), a rise was also seen for noncancer homedeaths (0.1% in 1994). However, in both cases the rise wasnot sustained for more than two years. From 1995 onwardsthe decline slowed, except for 2000 and 2001. During the lastfive years (1999–2003), the proportions of home deaths fellby 1.3% alongside a 3.5% rise in the proportions of deaths in
Past trends, future projections and implications for care 35
Tab
le 1
Diff
eren
t pr
ojec
tions
for
fut
ure
deat
hs b
y pl
ace
of o
ccur
renc
e, E
ngla
nd a
nd W
ales
(200
3–20
30)
Sce
nario
Met
hod
2003
2010
2020
2030
Cha
nge
Cha
nge
Cha
nge
2003
–203
0in
%in
nrs
Hom
e de
aths
A.
Recen
t tr
en
d h
om
e
A0.
based
on
ag
e g
en
der
sp
ecifi
c p
rop
ort
ion
s97 3
18
80 7
59
67 5
70
56 1
25
241 1
93 (
242.3
%)
↓↓↓↓
death
s (
1999–2003)
18.1
%16.0
%13.0
%9.6
%28.5
%A
1. b
ased
on
over
all p
ropo
rtio
n�
80 5
3567
157
55 7
23�
41 5
95 (�
42.7
%)
↓↓
�16
.0%
12.9
%9.
5%�
8.6%
B. C
urre
nt h
ome
deat
hs (2
003)
B0.
bas
ed o
n ag
e ge
nder
spe
cific
pro
port
ions
�90
372
91 7
5099
396
2078
(2.1
%)
↓↑
�17
.9%
17.7
%16
.9%
�1.
2%B
1. b
ased
on
over
all p
ropo
rtio
n�
91 3
8994
079
106
163
8845
(9.1
%)
→↑
�18
.1%
18.1
%18
.1%
0%C
. Num
bers
inst
itutio
nal d
eath
sC
0. b
ased
on
curr
ent
over
all n
umbe
rs (2
003)
�
63 9
7578
837
145
598
48 2
80 (4
9.6%
)↑
↑�
12.7
%15
.2%
24.8
%6.
7%C
1. b
ased
on
rece
nt t
rend
in o
vera
ll nu
mbe
rs (1
999–
2003
)�
76 3
9310
8 99
519
3 49
696
178
(98.
8%)
↑↑
�15
.1%
21.0
%33
.0%
14.9
%In
stitu
tiona
l dea
ths
A.
Recen
t tr
en
d h
om
e
A0.
based
on
ag
e g
en
der
sp
ecifi
c p
rop
ort
ion
s440,9
36
424,1
52
452 2
03
530 4
09
89 4
73 (
20.3
%)
↑↑↑↑
death
s (
1999–2003)
81.9
%84.0
%87.0
%90.4
%8.5
%A
1. b
ased
on
over
all p
ropo
rtio
n�
424
376
452
616
530
811
89 8
75 (2
0.4%
)↑
↑�
84.0
%87
.1%
90.5
%8.
6%B
. Cur
rent
hom
e de
aths
(200
3)B
0. b
ased
on
age
gend
er s
peci
fic p
ropo
rtio
ns�
414
539
428
023
487
138
46 2
02 (1
0.5%
)↑
↑�
82.1
%82
.3%
83.1
%1.
2%B
1. b
ased
on
over
all p
ropo
rtio
n�
413
522
425
694
480
371
39 4
35 (8
.9%
)→
↑�
81.9
%81
.9%
81.9
%0%
C. N
umbe
rs in
stitu
tiona
l dea
ths
C0.
bas
ed o
n cu
rren
t ov
eral
l num
bers
(200
3)�
440
936
440
936
440
936
0↓
→�
87.3
%84
.8%
75.2
%�
6.7%
C1.
bas
ed o
n re
cent
tre
nd in
ove
rall
num
bers
(199
9–20
03)
�42
8 51
841
0 77
839
3 03
8�
47 8
98 (�
10.9
%)
↓↓
�84
.9%
79.0
%67
.0%
�14
.9%
This
tab
le s
how
s th
e pr
ojec
ted
num
bers
and
pro
port
ions
of
hom
e de
aths
in t
hree
diff
eren
t fu
ture
sce
nario
s (A
, B a
nd C
) and
the
n of
inst
itutio
nal d
eath
s in
the
sam
eth
ree
scen
ario
s. T
he fi
rst
colu
mn
pres
ents
bas
elin
e da
ta o
n th
e ac
tual
num
bers
and
pro
port
ions
of
deat
hs in
200
3. T
hese
are
fol
low
ed b
y pr
ojec
ted
figur
es f
or 2
010,
2020
and
203
0 an
d th
e re
spec
tive
chan
ges
from
200
3 to
203
0. T
he la
st t
wo
colu
mns
dis
play
arr
ows
illus
trat
ing
the
dire
ctio
n of
the
exp
ecte
d ch
ange
s fir
st in
the
prop
ortio
ns o
f de
aths
and
the
n in
the
num
bers
of
deat
hs. M
etho
ds w
ith s
light
nua
nces
wer
e te
sted
with
in e
ach
scen
ario
. Sce
nario
A p
roje
cted
for
war
d th
e re
cent
tren
d (1
999–
2003
) in
hom
e de
aths
, ass
umin
g it
will
con
tinue
in t
he f
utur
e; in
A0
we
proj
ecte
d fo
rwar
d tr
ends
in a
ge g
ende
r sp
ecifi
c pr
opor
tions
of
hom
e de
aths
and
in A
1 w
e pr
ojec
ted
forw
ard
the
tren
d in
ove
rall
hom
e de
ath
prop
ortio
ns.
Sce
nario
B c
arrie
d fo
rwar
d th
e pr
opor
tions
of
hom
e de
aths
obs
erve
d in
200
3, a
ssum
ing
thes
e w
ill m
aint
ain
in t
he f
utur
e; in
B0
we
proj
ecte
d fo
rwar
d ag
e ge
nder
spe
cific
hom
e de
ath
prop
ortio
ns a
nd in
B1
over
all h
ome
deat
h pr
opor
tions
. Sce
nario
C p
ro-
ject
ed f
orw
ard
num
bers
of
inst
itutio
nal d
eath
s, e
ither
the
ove
rall
num
bers
obs
erve
d in
200
3 (C
0) o
r re
cent
tre
nds
(C1)
. Det
ails
of
form
ulae
use
d fo
r ca
lcul
atio
ns a
reav
aila
ble
from
aut
hors
.
36 B Gomes and IJ Higginson
NHS hospitals, from 54.3 to 57.8% and decreases in all otherinstitutions (Table 2). The overall proportion of institutionaldeaths increased by 1.3% although because of fall in deathrate, institutional deaths have decreased in absolute numbers(from 448 032 in 1999 to 440 936 in 2003).
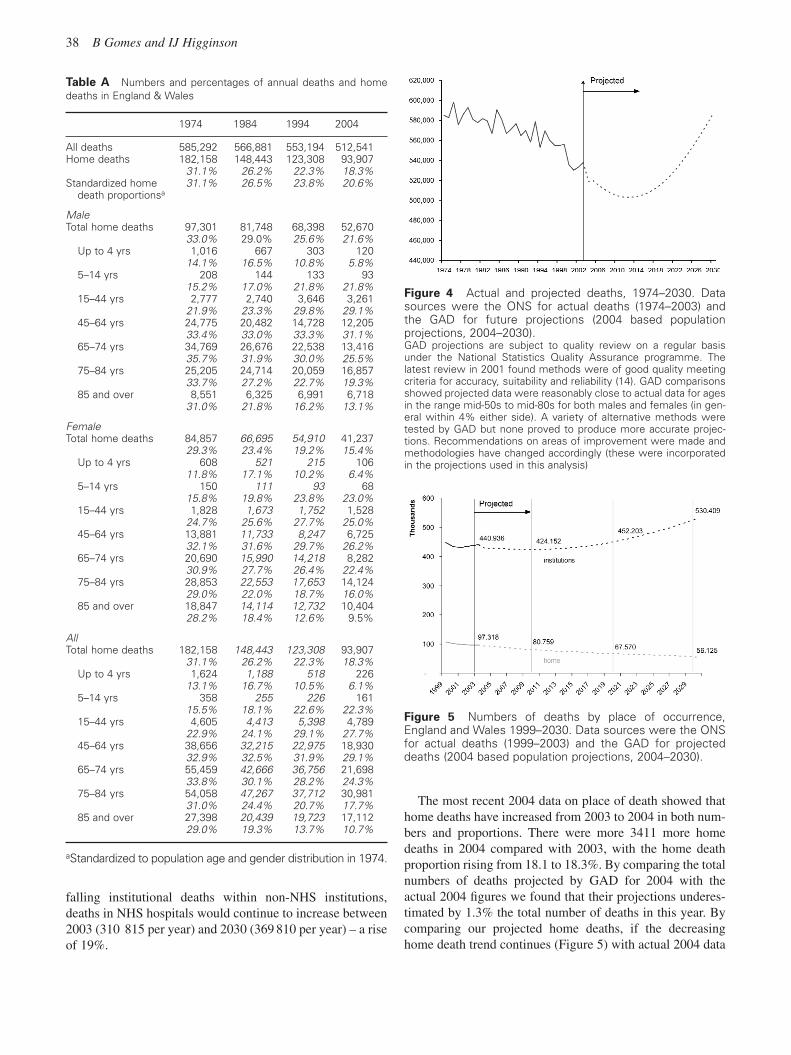
Gender. The proportions of home deaths declined from1974 to 2003 in both genders, but especially for women. Ahome death was always less common among women overthis 30-year period, but the gender difference in home deathproportions widened from 3.7% in 1974 to 6.2% in 2003(Figure A in supplementary data). In the latter year, 21.4% ofall male deaths occurred at home against 15.2% for women.This should be contrasted with the finding that there were
increasingly more female than male deaths, a trend evidentsince 1974.
Age. Home deaths proportions reduced over time in all agegroups except for those younger than 45 years (Figure 3).The decline was more pronounced for the age group 75 andover, falling by 13.3% in the age group of 75–84 years and18.7% among the 85’s and over. The very elderly (85 andover) died less often at home over the 30-year period; thedifference in the proportions of home deaths between thisage group and all the others taken together widened 4-foldfrom 2.5–11.4%. In 2003 only 10.3% of those aged 85 andover died at home. This should be considered together withthe fact that people died increasingly in advanced age, withthe deaths of the 85’s and over doubling from 16.1% in1974 to 31.9% in 2003. Still, even when ageing wasaccounted for (age-sex standardized home death propor-tions, Table A in supplementary data) and despite the factthat there would be 13 679 more annual deaths at home by2003, if the population hadn’t aged since 1974, there wouldstill be a decline in home deaths, in both proportions andabsolute numbers.
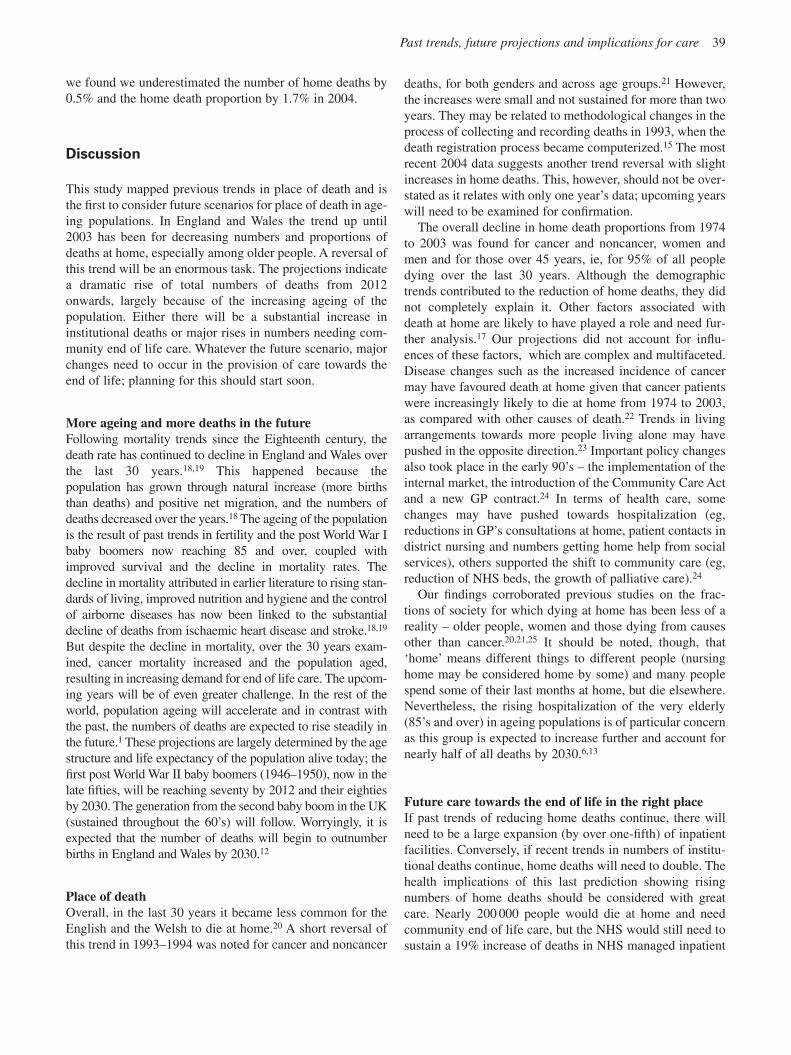
ProjectionsGovernment Actuary’s Department statistics predict that thenumber of deaths will continue to decrease until 2012 (Figure 4).From then onwards, the likely scenario will be of a gradualincrease of deaths. These are expected to be nearly 590 000per year in 2030, 16.5% more than in 2012. By then, thoseaged 65 and over will account for 86.7% of all deaths and thevery elderly (85 and over) for 43.5%.
Figure 1 Death statistics, 1974, 2003, 2030. The age pyramids illustrate the numbers of deaths by age group and gender(dark bars for men, light bars for women) in each year – 1974, 2003 and 2030. Data source was the ONS for 1974 and 2003(actual statistics) and the GAD for 2030 (projected statistics, 2004 based population projections).
Figure 2 Proportions of home deaths, 1974–2003. Resultsof �2 for trend tests: all deaths (�2 � 151 054; P � 0.005);cancer deaths (�2 � 12 881; P � 0.005); noncancer deaths(�2 � 150 828; P � 0.001).
Past trends, future projections and implications for care 37
Long-term projections accounting for changes in the age andgender distribution of deaths showed that if the trend in homedeath proportions observed in the last five years continues,numbers of home deaths will reduce by 42.3% and less thanone in 10 (9.6%) will die at home in 2030 (Figure 5). Thisaccounts for the recent rate of decrease of home death pro-portions in both genders and different age bands (higher forfemales and older people) and the projected structure of thepopulation dying in 2030 (with more people dying at olderage, for whom a home death is less likely to happen). Suchdecline in home deaths would correspond to an increase ininstitutional deaths of 20.3%. In absolute numbers, there willbe 89 473 more people dying in institutions (including NHShospitals, nursing homes and hospices) in 2030 as comparedwith 2003.
However, the last five years have seen an overall decreasein the absolute numbers of institutional deaths. If the overalldeclining trend in numbers continues, institutional deathswill fall by 10.9% from 2003 to 2030 and the number of peo-ple dying at home will need to nearly double (Table 1). Evenin these circumstances only one in three would die at homeby 2030. Importantly, sub-analysis of the institutional deathsrevealed a clear difference: the non-NHS institutions haveseen a large decrease in deaths per year (3959 per year),while deaths in NHS hospitals have actually increased by2185 per year (Table 2). Therefore, against a backdrop of
Figure A Proportions of home deaths by gender,1974–2003Results of chi-square for trend tests: chi-square for maletrend � 55,079, P � 0.005; chi-square for female trend � 96,457,P � 0.005.
Figure 3 Proportions of home deaths by age group,1974–2003. 1) Deaths up to 4 years, from 5 to 14 years, andfrom 15 to 44 years (all in dotted lines) account for small per-centages of all deaths (0.7, 0.1 and 3.3% in 2003, respec-tively) and follow different trends in home death proportionsfrom those in older age groups. 2) Results of �2 for trendtests: up to 4 years (�2 � 415; P � 0.001); 5–14 years(�2 � 237; P � 0.001); 15–44 years (�2 � 1086; P � 0.001);45–64 years (�2 � 1,607; P � 0.001); 65–74 years(�2 � 13 775; P � 0.001); 75–84 years (�2 � 50 855;P � 0.005); 85 and over (�2 � 87 509; P � 0.001).
Table 2 Numbers and percentages of deaths by year and place of occurrence in England and Wales, 1999–2003
Place of death 1999 2000 2001 2002 2003 1999–2003 change
Home 108 086 101 961 98 820 97 485 97 318 �10 76819.4% 19.0% 18.6% 18.3% 18.1% �1.3%
Institutions 448 032 433 703 431 553 436 042 440 936 �709680.6% 81.0% 81.4% 81.7% 81.9% 1.3%
Psychiatric hospitals 3809 3313 3245 3043 3160 �6490.7% 0.6% 0.6% 0.6% 0.6% �0.1%
Hospicesa 23 104 22 895 22 727 22 891 22 949 �1554.2% 4.3% 4.3% 4.3% 4.3% �0.1%
NHS hospitals 302 076 297 267 297 783 304 405 310 815 873954.3% 55.5% 56.2% 57.1% 57.8% 3.5%
Non-NHS hospitals and 59 417 55 364 55 825 54 957 54 280 �5137nursing homes 10.7% 10.4% 10.5% 10.3% 10.1% �0.6%
Communal establishments 46 089 41 830 39 676 39 045 38 397 �76928.3% 7.8% 7.5% 7.3% 7.1% �1.2%
Elsewhere 13 537 13 034 12 297 11 701 11 335 �22022.4% 2.4% 2.3% 2.2% 2.1% �0.3%
aThe number of deaths in hospices is underestimated by 9.0% as deaths occurring in 20 NHS free-standing hospices (249beds of the total of 2779 beds in England and Wales in 2003) do not count as hospice deaths but as NHS hospitals and nurs-ing homes. Hence, the percentage of hospice deaths in 2003 was likely to be 4.7% and not 4.3% (25 208 deaths instead of22 949 deaths).
38 B Gomes and IJ Higginson
falling institutional deaths within non-NHS institutions,deaths in NHS hospitals would continue to increase between2003 (310 815 per year) and 2030 (369 810 per year) – a riseof 19%.
The most recent 2004 data on place of death showed thathome deaths have increased from 2003 to 2004 in both num-bers and proportions. There were more 3411 more homedeaths in 2004 compared with 2003, with the home deathproportion rising from 18.1 to 18.3%. By comparing the totalnumbers of deaths projected by GAD for 2004 with theactual 2004 figures we found that their projections underes-timated by 1.3% the total number of deaths in this year. Bycomparing our projected home deaths, if the decreasinghome death trend continues (Figure 5) with actual 2004 data
Figure 5 Numbers of deaths by place of occurrence,England and Wales 1999–2030. Data sources were the ONSfor actual deaths (1999–2003) and the GAD for projecteddeaths (2004 based population projections, 2004–2030).
Figure 4 Actual and projected deaths, 1974–2030. Datasources were the ONS for actual deaths (1974–2003) andthe GAD for future projections (2004 based population projections, 2004–2030).GAD projections are subject to quality review on a regular basisunder the National Statistics Quality Assurance programme. The latest review in 2001 found methods were of good quality meetingcriteria for accuracy, suitability and reliability (14). GAD comparisonsshowed projected data were reasonably close to actual data for agesin the range mid-50s to mid-80s for both males and females (in gen-eral within 4% either side). A variety of alternative methods weretested by GAD but none proved to produce more accurate projec-tions. Recommendations on areas of improvement were made andmethodologies have changed accordingly (these were incorporatedin the projections used in this analysis)
Table A Numbers and percentages of annual deaths and homedeaths in England & Wales
1974 1984 1994 2004
All deaths 585,292 566,881 553,194 512,541Home deaths 182,158 148,443 123,308 93,907
31.1% 26.2% 22.3% 18.3%Standardized home 31.1% 26.5% 23.8% 20.6%
death proportionsa
Male Total home deaths 97,301 81,748 68,398 52,670
33.0% 29.0% 25.6% 21.6%Up to 4 yrs 1,016 667 303 120
14.1% 16.5% 10.8% 5.8%5–14 yrs 208 144 133 93
15.2% 17.0% 21.8% 21.8%15–44 yrs 2,777 2,740 3,646 3,261
21.9% 23.3% 29.8% 29.1%45–64 yrs 24,775 20,482 14,728 12,205
33.4% 33.0% 33.3% 31.1%65–74 yrs 34,769 26,676 22,538 13,416
35.7% 31.9% 30.0% 25.5%75–84 yrs 25,205 24,714 20,059 16,857
33.7% 27.2% 22.7% 19.3%85 and over 8,551 6,325 6,991 6,718
31.0% 21.8% 16.2% 13.1%
Female Total home deaths 84,857 66,695 54,910 41,237
29.3% 23.4% 19.2% 15.4%Up to 4 yrs 608 521 215 106
11.8% 17.1% 10.2% 6.4%5–14 yrs 150 111 93 68
15.8% 19.8% 23.8% 23.0%15–44 yrs 1,828 1,673 1,752 1,528
24.7% 25.6% 27.7% 25.0%45–64 yrs 13,881 11,733 8,247 6,725
32.1% 31.6% 29.7% 26.2%65–74 yrs 20,690 15,990 14,218 8,282
30.9% 27.7% 26.4% 22.4%75–84 yrs 28,853 22,553 17,653 14,124
29.0% 22.0% 18.7% 16.0%85 and over 18,847 14,114 12,732 10,404
28.2% 18.4% 12.6% 9.5%
All Total home deaths 182,158 148,443 123,308 93,907
31.1% 26.2% 22.3% 18.3%Up to 4 yrs 1,624 1,188 518 226
13.1% 16.7% 10.5% 6.1%5–14 yrs 358 255 226 161
15.5% 18.1% 22.6% 22.3%15–44 yrs 4,605 4,413 5,398 4,789
22.9% 24.1% 29.1% 27.7%45–64 yrs 38,656 32,215 22,975 18,930
32.9% 32.5% 31.9% 29.1%65–74 yrs 55,459 42,666 36,756 21,698
33.8% 30.1% 28.2% 24.3%75–84 yrs 54,058 47,267 37,712 30,981
31.0% 24.4% 20.7% 17.7%85 and over 27,398 20,439 19,723 17,112
29.0% 19.3% 13.7% 10.7%
aStandardized to population age and gender distribution in 1974.
Past trends, future projections and implications for care 39
we found we underestimated the number of home deaths by0.5% and the home death proportion by 1.7% in 2004.
Discussion
This study mapped previous trends in place of death and isthe first to consider future scenarios for place of death in age-ing populations. In England and Wales the trend up until2003 has been for decreasing numbers and proportions ofdeaths at home, especially among older people. A reversal ofthis trend will be an enormous task. The projections indicatea dramatic rise of total numbers of deaths from 2012onwards, largely because of the increasing ageing of thepopulation. Either there will be a substantial increase ininstitutional deaths or major rises in numbers needing com-munity end of life care. Whatever the future scenario, majorchanges need to occur in the provision of care towards theend of life; planning for this should start soon.
More ageing and more deaths in the futureFollowing mortality trends since the Eighteenth century, thedeath rate has continued to decline in England and Wales overthe last 30 years.18,19 This happened because the population has grown through natural increase (more birthsthan deaths) and positive net migration, and the numbers ofdeaths decreased over the years.18 The ageing of the populationis the result of past trends in fertility and the post World War Ibaby boomers now reaching 85 and over, coupled withimproved survival and the decline in mortality rates. Thedecline in mortality attributed in earlier literature to rising stan-dards of living, improved nutrition and hygiene and the controlof airborne diseases has now been linked to the substantialdecline of deaths from ischaemic heart disease and stroke.18,19
But despite the decline in mortality, over the 30 years exam-ined, cancer mortality increased and the population aged,resulting in increasing demand for end of life care. The upcom-ing years will be of even greater challenge. In the rest of theworld, population ageing will accelerate and in contrast withthe past, the numbers of deaths are expected to rise steadily inthe future.1 These projections are largely determined by the agestructure and life expectancy of the population alive today; thefirst post World War II baby boomers (1946–1950), now in thelate fifties, will be reaching seventy by 2012 and their eightiesby 2030. The generation from the second baby boom in the UK(sustained throughout the 60’s) will follow. Worryingly, it isexpected that the number of deaths will begin to outnumberbirths in England and Wales by 2030.12
Place of deathOverall, in the last 30 years it became less common for theEnglish and the Welsh to die at home.20 A short reversal ofthis trend in 1993–1994 was noted for cancer and noncancer
deaths, for both genders and across age groups.21 However,the increases were small and not sustained for more than twoyears. They may be related to methodological changes in theprocess of collecting and recording deaths in 1993, when thedeath registration process became computerized.15 The mostrecent 2004 data suggests another trend reversal with slightincreases in home deaths. This, however, should not be over-stated as it relates with only one year’s data; upcoming yearswill need to be examined for confirmation.
The overall decline in home death proportions from 1974to 2003 was found for cancer and noncancer, women andmen and for those over 45 years, ie, for 95% of all peopledying over the last 30 years. Although the demographictrends contributed to the reduction of home deaths, they didnot completely explain it. Other factors associated withdeath at home are likely to have played a role and need fur-ther analysis.17 Our projections did not account for influ-ences of these factors, which are complex and multifaceted.Disease changes such as the increased incidence of cancermay have favoured death at home given that cancer patientswere increasingly likely to die at home from 1974 to 2003,as compared with other causes of death.22 Trends in livingarrangements towards more people living alone may havepushed in the opposite direction.23 Important policy changesalso took place in the early 90’s – the implementation of theinternal market, the introduction of the Community Care Actand a new GP contract.24 In terms of health care, somechanges may have pushed towards hospitalization (eg,reductions in GP’s consultations at home, patient contacts indistrict nursing and numbers getting home help from socialservices), others supported the shift to community care (eg,reduction of NHS beds, the growth of palliative care).24
Our findings corroborated previous studies on the frac-tions of society for which dying at home has been less of areality – older people, women and those dying from causesother than cancer.20,21,25 It should be noted, though, that‘home’ means different things to different people (nursinghome may be considered home by some) and many peoplespend some of their last months at home, but die elsewhere.Nevertheless, the rising hospitalization of the very elderly(85’s and over) in ageing populations is of particular concernas this group is expected to increase further and account fornearly half of all deaths by 2030.6,13
Future care towards the end of life in the right placeIf past trends of reducing home deaths continue, there willneed to be a large expansion (by over one-fifth) of inpatientfacilities. Conversely, if recent trends in numbers of institu-tional deaths continue, home deaths will need to double. Thehealth implications of this last prediction showing risingnumbers of home deaths should be considered with greatcare. Nearly 200 000 people would die at home and needcommunity end of life care, but the NHS would still need tosustain a 19% increase of deaths in NHS managed inpatient
40 B Gomes and IJ Higginson
facilities, unless alternative settings such as hospices and pri-vate nursing homes took over and deaths in such placesincreased substantially (which has not been the case in thelast five years). There would still be an issue for the NHS insupporting care for people in these facilities.
Note that whatever the scenario, death at home is stillunlikely to become reality for the majority of people. If thepast trend away from home continues, less than one in tenwill exercise the wish to remain at home. At best, if the num-bers dying at home double, one in three will die at home by2030, which will still leave a large gap between preferencesand reality. The current UK policy push towards homedeaths and the National End of Life Care Initiative/Strategymay be responsible for the slight increase of home deaths in2004, but there may be other reasons. It is important to ascer-tain whether this increase sustains over time. It will be pos-sible to measure and monitor the impact of these policymeasures at a national level, by comparing future actual ver-sus projected figures for place of death.
The need for long-term projectionsIt is time to look at future end of life care needs and place ofdeath not just in the next couple of years, but also in thelonger term. Our projections should not be regarded as deterministic figures for the future, but possible scenarios ofwhat may happen under different circumstances. Note, forexample, that some of the methods were based on projectingnumbers of institutional deaths rather than proportions and ifthe same was applied across all places of death (home andinstitutions), the total would not sum to the projected total ofdeaths. Nevertheless, given the strong relationship betweeninstitutional deaths and inpatient capacity, projections basedon absolute numbers are appropriate and important.17
In our analysis, institutional deaths include hospitals butalso residential and nursing homes; the latter are an increas-ingly important locus of care and death for older people.Separate projections for home, hospital, hospice and carehome deaths as well as for localities within the country areinstrumental for palliative care providers interested in project-ing their future demands. However, caution is recommendedbecause these categories for place of death and geographicalareas are more specific and less stable over time than the onesused in our analysis (home versus institutional deaths withinonly one geographical level of analysis, ie, England andWales). Health Authorities, local cancer networks, regionalteams and palliative care services are advised not to readilytransfer findings to their context nor implement change basedon national data. There are wide regional variations in demog-raphy, geography, inequities and health care access and provi-sion including bed capacity, which are likely to influence placeof death at an ‘area level’.21,26 Where reliable and directlycomparable data exist for a well-defined population group andarea, services should undertake local projections applying ouror similar methods (details of formulae used for calculationsavailable from authors) when planning future services.
Although long-term projections are usually less accuratethan short-term,27 they enable to anticipate and plan withgreater care. The increase in absolute number of deaths isexpected to start by 2012 and the ageing of the population islikely to influence future trends in place of death, making itharder to reverse the trend or even maintain the current homedeath proportion. It is therefore, possible to define a timelineof five years until 2012 for important goals to be achieved.Expansion of palliative care services will need to happenacross the board to accommodate the increase in numbers ofdeaths – in NHS settings, in hospices, in nursing and residen-tial homes and in community settings. There are major debatesto be had regarding whether this is the responsibility of theNHS, voluntary sectors, private sector or a combination.Inpatient expansion is often regarded as costly, especiallywhen hospitals in the UK are striving to reduce beds. But someforms of inpatient facilities will be needed, to provide alterna-tives for people who cannot or do not wish to remain at home.In addition and in response to the wishes of the majority toremain at home, expansion should occur in terms of home-based services and improvements at the interface betweeninpatient and community care, to facilitate a move towardshome. Achievements for the next five years include a rigorousevaluation of the cost-effectiveness of providing end of lifecare at home, for which there is still very little evidence andstaff training, which needs to be considered in advance as thepractitioners of the 2020 and 2030’s are the current medicaland nursing students. Having in mind future demands, elderly,palliative and community care should become priorities.
Conclusions
The projections underline the urgent need for planning struc-tures and resources to accommodate a substantial increase ofageing and deaths in England and Wales. Either inpatientfacilities must increase substantially, or many more peoplewill need community care towards the end of life from 2012onwards. The next five years will be crucial for the develop-ment of incremental plans to expand structures of care at theright place, able to meet the increase in demand, the futureneeds of older people and ensure quality end of life care athome, in hospitals, nursing homes and hospices.
AcknowledgementsWe thank our funders, Cicely Saunders International, AnitaBrock and Laura Stanage from ONS for supply of past dataand clarifications, Mita Saha and Adrian Gallop from GAD for supply of population projections and advice onprojection methods, Dr Massimo Constantini, Dr ElizabethDavies, Dr Sue Hall, Dr Fliss Murtagh, Sam Hart and anony-mous reviewers for their comments in an earlier draft.
Competing interestsThe authors declare they have no competing interests.
Past trends, future projections and implications for care 41
Authors contributionsBG and IJH conceived the idea for the study, IJH obtainedfunding. BG and IJH developed the methods. BG obtainedand extracted the data. Both authors conducted the analysis,interpreted the data, wrote the report and gave final approvalof the version to be published.
References
1 World Health Organization. Preventing chronic diseases: avital investment: Geneva: WHO global report, 2005.
2 Mathers CD, Loncar D. Updated projections of global mor-tality and burden of disease, 2002–2030: data sources, meth-ods and results. Geneva: World Health Organization, 2005.
3 Gomes B, Higginson I. Home or hospital: choices at the endof life. J R Soc Med 2004; 97(9): 413–4.
4 Higginson I, Sen-Gupta GJA. Place of care in advanced cancer: a qualitative systematic literature review of patientpreferences. J Palliat Med 2000; 3: 287–300.
5 World Health Organization. Palliative care: the solid facts.World Health Organization, Geneva: 2004.
6 World Health Organization. Palliative care for older people.World Health Organization, Geneva: 2004.
7 Flory J, Yinong YX, Gurol I, Levinsky N, Ash A, Emanuel E.Place of death: U.S. trends since 1980. Health Aff 2004;23(3): 194–200.
8 Hunt R, Bonett A, Roder D. Trends in the terminal care ofcancer patients: South Australia, 1981–1990. A NZ J Med1993; 23(3): 245–51.
9 Wilson DM, Smith SL, Anderson MC, Northcott HC,Fainsinger RL, Stingl MJ et al. Twentieth-century social andhealth-care influences on location of death in Canada. CanJ Nurs Res 2002; 34(3): 141–61.
10 Costantini M, Morasso G, Montella M, Borgia P, Cecioni R,Beccaro M et al. Diagnosis and prognosis disclosure amongcancer patients. Results from an Italian mortality follow-back survey. Ann Oncol 2006; 17(5): 853–9.
11 Yang L, Sakamoto N, Marui E. A study of home deathsfrom 1951 to 2002. BMC Palliat Care 2006; 5: 2.
12 Shaw C. 2004 based national population projections for the UK and constituent countries. Population Trends 2006;123: 9–20.
13 Khaw KT. How many, how old, how soon? BMJ 1999;319(7221): 1350–2.
14 Government Actuary’s Department. National populationprojections: Review of methodology for projecting mortality.National Statistics Quality Review Series 8. 2001. London,Government Actuary’s Department. Ref Type: Generic.
15 Office for National Statistics. Mortality Statistics. London:Office for National Statistics; 2007. Report No.: DH1 36.
16 The Hospice Information Service. Hospice and PalliativeCare Facts and Figures 2005. London: St Christopher’sHospice and Help the Hospices; 2005.
17 Gomes B, Higginson IJ. Factors influencing death at homein terminally ill patients with cancer: systematic review.BMJ 2006; 332(7540): 515–21.
18 Griffiths C, Brock A. Twentieth century mortality trends in England and Wales. Health Stat Quarterly 2003; 18: 5–17.
19 McKeown T, Record RG, Turner RD. An interpretation ofthe decline of mortality in England & Wales during theTwentieth century. Population Studies 2007; 29(3): 391–422.
20 Cartwright A. Changes in life and care in the year beforedeath 1969–1987. J Public Health Med 1991; 13(2): 81–7.
21 Higginson IJ, Astin P, Dolan S. Where do cancer patientsdie? Ten-year trends in the place of death of cancer patientsin England. Palliat Med 1998; 12(5): 353–63.
22 Office for National Statistics. Cancer registrations statistics2004: Registrations of cancer diagnosed in 2004, England,2006. Report No.: MB1 35.
23 Grundy E, Mayer D, Young H, Sloggett A. Living arrange-ments and place of death of older people with cancer inEngland and Wales: a record linkage study. Br J Cancer2004 31; 91(5): 907–12.
24 Gomes B. Developing and testing a model of place of deathin a macro-analysis of the trends in home deaths, Englandand Wales 1974–2034. MSc Thesis. London: King’s CollegeLondon, Department Palliative Care, Policy andRehabilitation, 2006.
25 Lock A, Higginson IJ. Patterns and predictors of place ofcancer death for the oldest old. BMC Palliati Care 2005; 5: 6.
26 Higginson IJ, Jarman B, Astin P, Dolan S. Do social factorsaffect where patients die: an analysis of 10 years of cancerdeaths in England. J Public Health Med 1999; 21(1): 22–8.
27 Moller B, Fekjaer H, Hakulinen T, Sigvaldason H, StormHH, Talback M et al. Prediction of cancer incidence in theNordic countries: empirical comparison of differentapproaches. Stat Med 2003 15; 22(17): 2751–66.